invasive mangrove removal and recovery: food …
TRANSCRIPT
INVASIVE MANGROVE REMOVAL AND RECOVERY: FOOD WEB EFFECTS ACROSS A CHRONOSEQUENCE
A THESIS SUBMITTED TO THE GRADUATE DIVISION OF THE UNIVERSITY OF HAWAI‘I AT M!NOA IN PARTIAL FULFILLMENT OF THE REQUIREMENTS
FOR THE DEGREE OF
MASTER OF SCIENCE
IN
ZOOLOGY (MARINE BIOLOGY)
DECEMBER 2012
By Margaret C. Siple
Thesis Committee:
Megan Donahue, Chairperson Craig Smith
Florence Thomas
Keywords: invasive species, food webs, Rhizophora mangle

ii!
DEDICATION
This work is dedicated to Christine Whitney, who has always enriched my life and
supported my career.

iii!
ACKNOWLEDGMENTS
Above all, I thank my advisor Dr. Megan Donahue for her ebullient, expert, and
thoughtful guidance throughout my graduate career. She has truly given me wings. I also
thank my committee members, Dr. Craig Smith and Dr. Florence Thomas for sharing
their ecological wisdom.
Hi‘ilei Kawelo and the staff of Paepae o He‘eia have allowed me to do research in
an extremely important cultural site, and I am so grateful for that opportunity. I thank
Hi‘ilei for sharing her knowledge on fishponds, helping me develop research ideas, and
teaching me fishing techniques. Hi‘ilei and Keli‘i Kotubetey were very helpful with
planning and documenting mangrove removals in the fishpond. Peleke Flores patiently
hosted me at the pond on some very early mornings.
The physical data in this project was collected by the Ruttenberg lab at UH,
through NOAA-Seagrant Project # R/EL-42 and # R/AQ-84. I would like to thank Dr.
Kathleen Ruttenberg and her graduate students for introducing me to the hydrology of the
fishpond, and for advising me on experimental design. Dr. Rebecca Briggs and Kim
Falinski were indispensable. I thank Dr. Brian Glazer and his lab members for their
chemical expertise: Jenny Murphy and Heather Mills provided very valuable input.
I would also like to thank the dedicated interns of the Laulima A ‘Ike Pono
(LAIP) program from 2010-2012, who helped with a huge portion of the field and lab
work associated with this project. Dr. Judy Lemus provided me with the opportunity to
work with LAIP. Sherril Leon Soon has been a wonderful font of scientific insight,
support, and friendship throughout my experience in Hawai‘i and at the fishpond. Field
volunteers are too many to name, but I would particularly like to thank Kirsten Fujitani,
Martin Guo, Leila Hufana, and Daniel Lum for their help in the field, and Kaleolani
Hurley for help in the lab. Lisa Hinano Rey collected the initial field cores for old
removal sites, and sorted infauna. Thanks to Dr. Amanda Demopoulos for the use of her
type specimens and for sharing her expertise on Hawaiian mangroves.
Mario Williamson in the UH machine shop helped build field equipment, and the
Smith Lab provided other project supplies. Dr. Atsuko Fukunaga taught me how to

iv!
identify infauna and guided me through the jungle of multivariate statistics, and she was
incredibly helpful and patient.
My fellow graduate students in the Biology and Oceanography departments
provided untold moral and intellectual support, as well as helpful feedback on talks and
papers. I would like to thank the members of the Donahue Lab, Nyssa Silbiger and Jamie
Sziklay, for their help with experimental design, framing papers and presentations, and
for making the lab a warm and knowledgeable place. I thank Erik Franklin for his help
with statistics and programming, and for providing sage advice and exciting ecological
discussion.
This project was supported by an NSF Graduate Research Fellowship, grants from
The Margaret and Charles Edmondson Grants in Aid of Funding, the PADI Foundation,
and the Western Society of Naturalists, all to MS. LAIP interns were supported through
an NSF-OEDG grant to Dr. Lemus.
I would like to thank maestro Henry Miyamura and my fellow members of the
O‘ahu Civic Orchestra and the UH Symphony for sharing the gift of music with me. I am
incredibly grateful for my friends and family. My sister Ashley, called upon routinely
during my thesis research, has guided me through academic and sartorial crises alike. My
brother Paul kept me hard working and lighthearted, and continues to do so. We all have
our parents to thank for their love and support, and for raising us to take great joy in our
education and great satisfaction in our accomplishments.

v!
ABSTRACT
Red mangrove (Rhizophora mangle) was introduced to Hawai‘i in 1902 and has
since overgrown many coastal areas in Hawai‘i, transforming nearshore sandy habitat
into heavily vegetated areas with low water velocity, high sedimentation rates, and anoxic
sediments. Mangrove forests provide habitat for exotic species, including burrowing
predators, which can exert top-down effects on benthic communities. Removal of
mangrove overstory is a popular management technique; here we use infauna community
structure, crab catch data, and a cage experiment performed over a chronosequence of
removals from 2007-2010 to show that overstory removal causes gradual changes in
community composition, that community shifts are concurrent with a slow decomposition
of sedimentary mangrove biomass (k = 5.6 ! 10-4 ± 0.9 ! 10-4 d-1), and that burrowing
predators do not have significant effects on the infaunal community where R. mangle is
intact or where it has been removed. Changes over time after removal include an increase
in total infaunal abundance, a decrease in sub-surface deposit feeders, and an increase in
suspension-feeding worms. Burrowing crab densities are uniform across mangrove and
removal sites, and do not affect infaunal communities as they do in native mangroves.
These results show that recovery from invasion and removal occurs gradually and is not
governed by top-down effects.

vi!
TABLE OF CONTENTS
Acknowledgments........................................................................................................ iii
Abstract ..........................................................................................................................v
List of Tables ............................................................................................................. viii
List of Figures .............................................................................................................. ix
Introduction....................................................................................................................1
Methods..........................................................................................................................5
Study Site.............................................................................................................................5
Physical Data .......................................................................................................................6
Grain Size ............................................................................................................................7
Decomposition Rate ............................................................................................................7
Chronosequence...................................................................................................................7
Caging Experiment ..............................................................................................................9
Predator Community..........................................................................................................11
Results..........................................................................................................................11
Physical Environment........................................................................................................11
Mangrove Decomposition Rate .........................................................................................12
Whole-Community Patterns Across Removal Chronosequence ......................................12
Trophic, Domicile, and Mobility Guilds Across Chronosequence ...................................12
Cage Effects.......................................................................................................................13
Discussion ....................................................................................................................14
Mangrove and removal areas host distinct infaunal communities ....................................15
Community recovery and mangrove decomposition are slow in Hawaiian mangroves ...17
Top-down processes do not regulate infaunal communities in Hawaiian mangroves or
mangrove removals............................................................................................................20
Appendix 1: Supplementary Table ..............................................................................46
Table S1. Mean counts and carapace width for crabs collected ........................................46
Appendix 2: Supplementary Figures ...........................................................................47

vii!
Figure S1. SMB data from 2011 with exponential model fit for decomposition .............47
Figure S2. Community measures along the chronosequence ...........................................48
Figure S3. Individual taxon abundance over chronosequence (Sites)...............................49
Figure S4. Individual taxon abundance over chronosequence (Days since removal) .......50
Figure S5. Individual taxon abundance vs. Site in September ..........................................51
Figure S6. Individual taxon abundance vs. Days since removal in September.................52
Figure S7. Abundance of feeding guilds vs. days since removal .....................................53
Figure S8. Abundance of domicile guilds vs. days since removal ...................................54
Figure S9. Abundance of mobility guilds vs. days since removal ...................................55
Figure S10. Community measures by cage type in September .........................................56
Figure S11. Changes in abundance of five dominant taxa over the experiment ...............57
Figure S12. Abundance of taxa by cage type in September ..............................................58
Figure S13. Carapace widths of taxa caught at each site...................................................59
References....................................................................................................................60

viii!
LIST OF TABLES
TABLE PAGE
1. Chronosequence sites, days between removal and infauna cores, and corresponding
long-term monitoring site for physical data.................................................................23
2. Sampling schedule ...................................................................................................24
3. Feeding and domicile groups used in this study ......................................................25
4. Grain size .................................................................................................................26
5. SIMPER results for all removal vs. all mangrove sites in chronosequence ............27
6. Infaunal abundance for each taxon at each site in chronosequence.........................28
7. Carapace width to biomass conversion factors for crab species..............................30
8. Biomass of crabs caught during the study ...............................................................31

ix!
LIST OF FIGURES
FIGURE PAGE
1. Map of He‘eia fishpond showing study sites...........................................................32
2. Physical variables monitored during this study .......................................................33
3. Grain size .................................................................................................................34
4. Sedimentary mangrove biomass measured in 2012 vs. days since removal............35
5. Log(x+1)-transformed total abundance vs. days since removal ..............................36
6. MDS plot of all chronosequence sites in May ........................................................37
7. Components of infauna at each site by feeding guild ..............................................38
8. Log(x+1)-transformed abundance of suspension feeders and omnivores vs. days
since removal ...............................................................................................................39
9. Total infauna by domicile guild over chronosequence ............................................40
10. Total infauna by mobility guild over chronosequence ..........................................41
11. MDS plot of all experimental mangrove and removal sites in May ......................42
12. MDS plot of all experimental mangrove and removal sites in September ............43
13. Crab catch per unit effort (CPUE) at experimental sites in May and September ..44
14. Crab biomass caught per day at each site and sampling period.............................45
1!
INTRODUCTION
Red mangrove (Rhizophora mangle) was introduced to Moloka‘i in 1902 and to
He‘eia Marsh on O‘ahu in 1922 to control runoff from upstream agriculture (McCaughey
1917). While other species of mangrove have been introduced to Hawai‘i, R. mangle is
the most successful, occupying coastal habitats throughout the main Hawaiian islands,
including historical estuarine fishpond sites developed for aquaculture by native
Hawaiians as early as 1000 C.E. (Allen 1992; Allen 1998; Kirch 2007). In their native
range, mangroves are ecosystem engineers, strongly modifying their environment and
providing important ecosystem services, including protecting of the shoreline from heavy
storm surges, acting as a sink for heavy metal pollutants (Clark et al. 1998; Harbison
1986), stabilizing sediments (Posey 1987), subsidizing coastal habitats through litterfall
(Twilley et al. 1986), and serving as nursery grounds for some fisheries (Mumby et al.
2004; Robertson and Duke 1987). In their introduced range, these potential ecosystem
services must be weighed against impacts on native ecosystems: In Hawai‘i, mangroves
create habitats dramatically distinct from that of the few native coastal macrophytes
(Allen 1998).
Hawaiian mangrove sediments host a higher diversity of infauna (>500 !m) than
adjacent sandflats, despite lower porewater oxygen (O2) concentrations in mangrove
sediments (Demopoulos and Smith 2010). However, this higher diversity includes many
alien species, which are more abundant in mangroves than in adjacent sandflats at the
same tidal height (Demopoulos and Smith 2010). The difference in diversity and relative
abundance of exotics may be a result of enhanced productivity due to litterfall subsidy or
increased microhabitat heterogeneity (bottom-up effects). It may also be due to trophic
effects from changes in habitat use by mobile predators (top-down effects). R. mangle
produces more propagules and contributes more litterfall in Hawai‘i than in its native
range (Cox and Allen 1999; Demopoulos 2004), potentially because of lower rates of
predation on flowers and developing fruits (Allen 1998). Despite R. mangle’s extensive
contribution of litterfall subsidies to coastal marshes in Hawai‘i (Cox and Allen 1999), a
comparison of R. mangle food webs in Hawai‘i and a site in its native range (Puerto
2!
Rico) demonstrates that in Hawai‘i, much of this productivity is not consumed by benthic
invertebrates (Demopoulos et al. 2007). Mangrove detrital inputs are high in tannins and
relatively low in nutritional value (Robertson et al. 1992), and native communities in
invaded areas may be unable to use mangrove detritus efficiently (Demopoulos and
Smith 2010); instead, stable isotope evidence indicates that R. mangle primarily
subsidizes bacterial foodwebs (Demopoulos et al. 2007). The high detrital output and
undigested mangrove leaf detritus may increase sediment anoxia and negatively impact
infaunal assemblages (Demopoulos 2004).
Removal has been a popular tool for the control of alien pest species in Hawai‘i
(e.g., Scowcroft and Conrad 1992; Stone et al. 1992), including R. mangle (Chimner et al.
2006; Rauzon and Drigot 2002). The most common method of mangrove removal is to
cut the prop roots below the high tide mark, flooding the roots with saltwater, haul away
the overstory, and leave the flooded prop roots to decompose. While this method is
favored because it does not require bulldozing and reduces the potential for dramatic
resuspension of organic material and fine sediment following root removal, the time
course of recovery following removal is not well resolved. Extensive removal has only
been employed at a few locations on O‘ahu (K!ne‘ohe Bay and Pearl Harbor), making
long-term recovery difficult to measure.
After removal, substantial mangrove biomass remains in and above the sediment.
Decomposition occurs slowly, even in the presence of increased nutrient concentrations
(Alongi 2009). Mangroves cope with short periods of anoxia by photosynthesizing above
water and transporting gas directly into the submerged roots. Some of this O2 diffuses out
of the roots and into the surrounding sediment (Alongi 2009). Disruption of gas transport
via overstory removal may result in more anoxic sediments following removal: Fine roots
that normally provide O2 to associated aerobic bacteria die and decompose, causing soil
anoxia and a shift in dominance to anaerobic bacteria (Alongi 2009). Usually, aerobic
respiration and anaerobic sulfate reduction are the main decomposition pathways in
mangrove sediments, with slow anaerobic processes governing much of the metabolism
that occurs below the first few millimeters (Alongi 2009). Mangrove roots decompose
more slowly than other mangrove material (Middleton and McKee 2001), so the below-
ground community is likely to sustain the longest-term impacts.

3!
A study on mangrove deforestation in a native mangrove forest showed a
community shift as well as higher fish abundance in areas where some overstory had
been removed (Sonneratia alba and Rhizophora mucronata mixed forest; Huxham et al.
2004). Only one study to date has examined post-removal community dynamics in a
system where mangrove is invasive by comparing two sites: a two-year removal in Pearl
Harbor and a six-year removal in K!ne‘ohe Bay (Sweetman et al. 2010). The roots of
deforested mangrove remain above the sediment surface for years, and changes in
bacterial and macrofaunal carbon consumption in invaded sediments persisted even six
years after mangrove removal (Sweetman et al. 2010). Removal increased total carbon
(C)-uptake, decreased overall organic loading, and enhanced macrofaunal abundance in
mangrove sediments compared to living mangrove (Sweetman et al. 2010). Sweetman et
al. (2010) found that while macrofauna dominated short-term C processing in sediments
of an existing mangrove forest and sediments from a two-year removal site (in Pearl
Harbor), bacteria dominate C processing six years following removal (in K!ne‘ohe Bay).
This shift in carbon processing structure is likely to influence decomposition rates. In the
same study, Sweetman et al. (2010) found that infaunal communities differed between
mangrove and removal sites: sub-surface deposit feeders (mostly tubificid oligochaetes)
dominated macrofaunal abundance and biomass in mangroves, whereas suspension
feeding spionid polychaetes were dominant in abundance and biomass at both removal
sites.
Changes in infaunal community structure may be due to changes in sediment
chemistry (decreased O2 penetration depth, high sulfide concentrations), changes in the
lability of organic matter (decreased sedimentary mangrove biomass, decay of tannins
produced by mangrove materials), or top-down effects of a changing predator
community. In mangroves, the physiochemical and biological processes that control
infaunal abundance and community composition are interdependent: Biogeochemistry is
strongly influenced by burrowing organisms, which change soil texture and porosity,
redistribute water, and introduce O2 into the sediments (Alongi 2009). In native
mangroves, 0.3 to 3% of water volume moving through a mangrove forest moves through
burrows (Alongi 2009). Following 5-10 mm of oxidized surface sediment, mangrove
soils are either sub- or anoxic. Deeper in the sediment, buildup of free sulfides is
4!
prevented by O2 translocation to roots, and, at least where mangroves are native, by active
mixing by bioturbators such as sesarmid and grapsid crabs, and small fish (Alongi 2009).
In Belizean mangrove forests, the processes that speed decomposition usually also
involve consumption of leaf material by epifauna (Middleton and McKee 2001).
Burrows can enhance bacterial activity and algal production in mangrove sediments,
altering nutrient availability (Mchenga et al. 2007). Because they can influence
physicochemical processes in mangrove sediments in addition to preying on infauna,
burrowing predators constitute an important link between top-down and bottom-up
forcing mechanisms for mangrove infauna.
Mangrove-associated predators may exert trophic effects on infaunal assemblages
that are within the “grazing shadow” of mangrove forest. While mangroves have been
characterized as nursery habitat for many species (Laegdsgaard and Johnson 2001; Macia
et al. 2003), vegetation can attract predators by providing habitat for benthic invertebrates
(Nagelkerken and van der Velde 2004; Sheaves and Molony 2000). Smaller fish forage
more frequently in mangrove than on adjacent mudflats (Laegdsgaard and Johnson 2001)
and zoobenthivores are attracted to mangrove mainly for food (Verweij et al. 2006).
Therefore, despite the popular notion that mangroves are primarily used as refugia from
larger predators (e.g., Parrish 1989), infauna in mangrove habitats may experience
enhanced predation (Huxham et al. 2004). Some zoobenthivores forage actively in native
mangrove, and predation rates on shrimp among mangrove prop roots can be as high as
on sand flats (Primavera 1997). Predation rates on invertebrates in mangroves can depend
on the feeding strategy of the predator (Primavera 1997) or the size of the prey (Acosta
and Butler 1997). Experimental exclusion of predatory crabs in native mangrove forests
in Thailand led to higher species diversity, richness and biomass in the benthic infaunal
community (Kon et al. 2009).
In Hawai‘i, the complex structure created by R. mangle provides habitat for alien
predators that forage on infaunal communities. These predators include opportunistic
portunid crabs such as Samoan crab (Scylla serrata) and the blue pincher crab (Thalamita
crenata) (Demopoulos et al. 2008; Demopoulos and Smith 2010). Epifaunal assemblages
(including predators) are more diverse in mangroves than adjacent sandflats
(Demopoulos and Smith 2010), and many crab and fish species present in Hawaiian

5!
mangroves are known to feed on infauna (e.g., Cannicci et al. 1996; Hernaman et al.
2009). In Hawai‘i, it is unclear whether the higher diversity found in mangrove infauna
may be due to decreased predation pressure by mangrove-associated predators. Currently,
only one unpublished study has examined communities of mobile epifauna in Hawaiian
mangroves (Nakahara 2007): in this study, mangroves on Moloka‘i supported higher
overall abundances and higher species richness among macrofauna (> 5 mm) than
uninvaded sandflats. Mangroves also hosted higher abundances of introduced mantis
shrimp (Gonodactylaceus falcatus), mollies (Poecilia sp.) and Samoan crab (Scylla
serrata) than sandflats. The study also found smaller portunid crabs (T. crenata and
Portunus sanguinolentus) inside mangroves than outside, suggesting that juveniles of
these species use mangroves as habitat. S. serrata and T. crenata forage actively in
mangrove habitats (Cannicci et al. 1996; Hill 1979) and are likely to influence benthic
community structure through predation and burrowing. Habitat utilization by predatory
and burrowing epifauna may shift with mangrove removal, thereby changing predation
and bioturbation rates in removal areas.
Taking advantage of ongoing mangrove removal in He‘eia fishpond, this paper
investigates the time course of shifts in community structure following removal and
evaluates the effects of mangrove-associated burrowing predators in mangrove and
mangrove removal areas. In this thesis, I evaluated three questions: 1) How does
mangrove removal affect infaunal and epifaunal communities? 2) What is the rate of
mangrove decomposition and related community shifts? 3) Do burrowing predators
modify infaunal community composition in existing or removed mangroves?
METHODS
Study Site
This study took place at Loko I‘a o He‘eia, an 88-acre fishpond located in
K!ne‘ohe Bay, O‘ahu (21˚26’10.74” N, 157˚48’28.05” W). He‘eia fishpond is a shallow
reef flat surrounded by a permeable rock wall, which was surrounded by mangrove as
recently as 2005. It is subject to freshwater input containing a significant amount of land-

6!
derived nutrients from He‘eia Stream and the rock wall allows exchange between pond
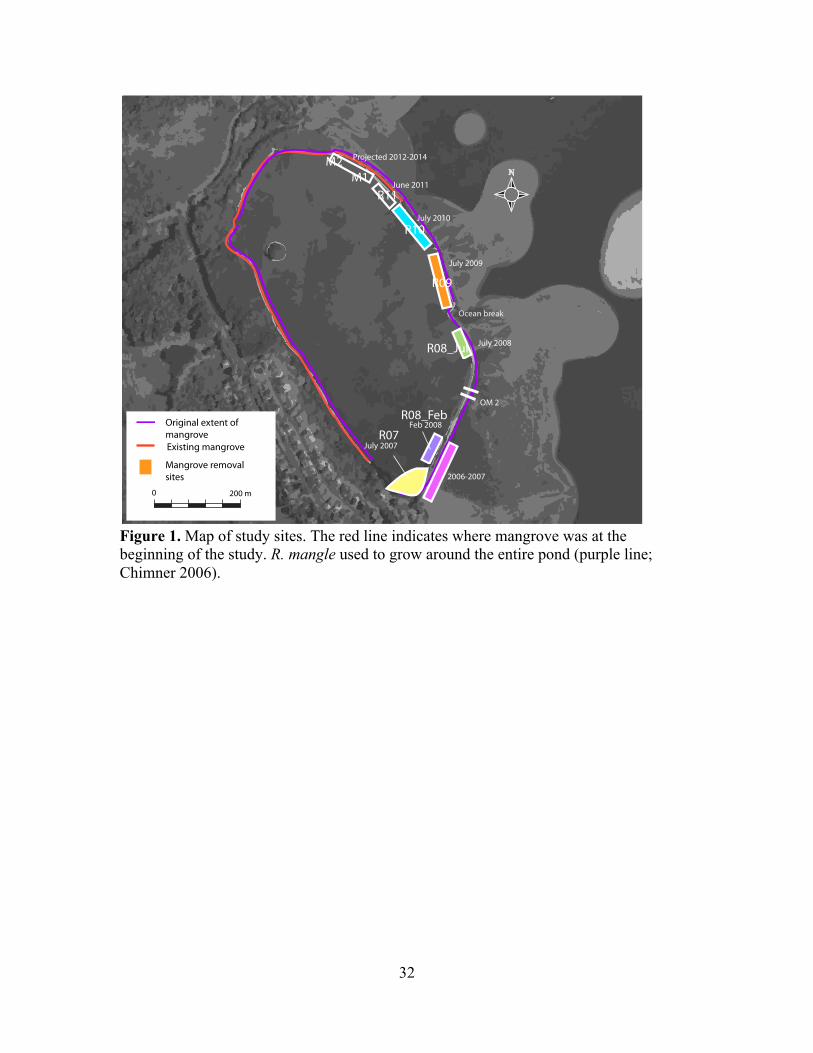
and ocean water, which is tidally dominated (Young 2011) (Figure 1). The pond is
shallow (average depth 0.413 m; 4 m maximum depth) with a soft bottom dominated by
muddy sediments near stream inputs and sand/coral rubble near the seawall
(Vasconcellos 2007).
After mangroves were introduced to He‘eia in 1922, they formed a continuous
stand around the mouth of He‘eia stream. In the 1960’s, R. mangle expanded past the
stream to grow along the wall and was still colonizing the fishpond wall as recently as
1991 (Chimner et al. 2006). By the time removal began in 2005, invasive mangrove
(predominantly R. mangle) had overgrown the entire sea wall of the pond. Since removal
began in 2005, 50-75 m sections of mangrove have been removed each summer,
beginning at the south end of the pond (Figure 1). The non-profit group that manages the
fishpond, Paepae o He‘eia (POH) removed another 75-m section of mangrove beginning
in early 2011. The sequential nature of this removal provides an opportunity to study a
chronosequence of mangrove removal from 2007 – 2011. Sampling sites were chosen at
the center of each removal section, for a total of eight sites along the chronosequence:
Two sites with fresh mangrove and six sites with mangroves removed between 2007 and
summer 2011 (Table 1).
Physical Data
Salinity, pH, dissolved oxygen (DO), chlorophyll a concentration, and temperature at
each site were provided by an ongoing monitoring project on the physical oceanography
of the fishpond (McCoy 2011). These parameters were measured monthly using a pre-
calibrated portable YSI® 6660. Measurements were taken midway between high and low
tide and averaged over the bottom 25 cm of the water column at each monitoring site.
Because monitoring sites were not located exactly at sampling sites used in this project,
physical environmental variables for mangrove sampling sites were taken from proximal
monitoring locations (Table 1). Data collected monthly between 4/28/11 and 8/25/11
were used to determine how much environmental conditions fluctuated between the
beginning and end of the study. Physical variables measured over the course of the
7!
experiment were compared among sites using non-parametric analysis of variance
(Kruskal-Wallis tests).
Grain size
Cores used for grain size and were taken at the same sites in 2012, sectioned at 5 cm as
before, and frozen until analysis. In the lab, core subsamples were sieved through 2 mm,
500 !m, and 53 !m meshes. Sediment fractions retained on each sieve were dried at 60˚C
for 2-5 days, weighed, and percent rubble (> 2 mm), sand (53 !m < x < 2 mm) and
silt/clay (<53 !m) calculated.
Decomposition Rate
Cores for sedimentary mangrove biomass (SMB) were collected in May 2012. SMB was
measured from 5-cm sections (6.5 cm inner diameter) of mangrove rhizome. Roots, bark
and leaf material were rinsed with fresh water on a 250 !m sieve, picked out under a
dissecting microscope at 60x magnification, and dried at 60˚C to constant weight (1-3
days) before weighing. A smaller set of cores was taken in 2011 but was not used for this
analysis.
To estimate decomposition rate for submerged sedimentary mangrove biomass
following removal, mangrove biomass from cores along the chronosequence was fit to an
exponential decay model:
!
SMB = aeb"DSR . The decay constant, b, was calculated in a
linear regression of the natural logarithm of mangrove dry mass, SMB, on time elapsed
since removal (DSR), as in previous root decomposition studies (Poret et al. 2007;
Twilley et al. 1997).
Chronosequence
Infaunal cores (6.5 cm i.d.) were taken between May 10th – 16th, 2011. Sampling
times for infauna and crabs are given in Table 2. These cores also provided the initial
time point for the experiment described below. Cores were sectioned at 5 cm, sieved with
a 500 !m mesh size, preserved in 10% formalin with Rose Bengal dye (0.05 g/L), rinsed
gently with flowing tap water, then sorted in the lab to the lowest taxon possible under
60! magnification and stored in ethanol.
8!
To analyze the infaunal community cores, total abundance, richness (S),
normalized taxon richness (d = (S-1)/ln N; N = number of individuals in one core),
Shannon-Weiner diversity (H’; log base e), and Shannon evenness (eH’/S) were
determined for all cores and compared along the chronosequence using generalized linear
models (GLMs).
Prior to multivariate analysis, taxa containing fewer than 15 total individuals
(across all cores) were removed from the dataset. All abundances are given as number of
individuals per square meter, in order to allow comparison with other studies.
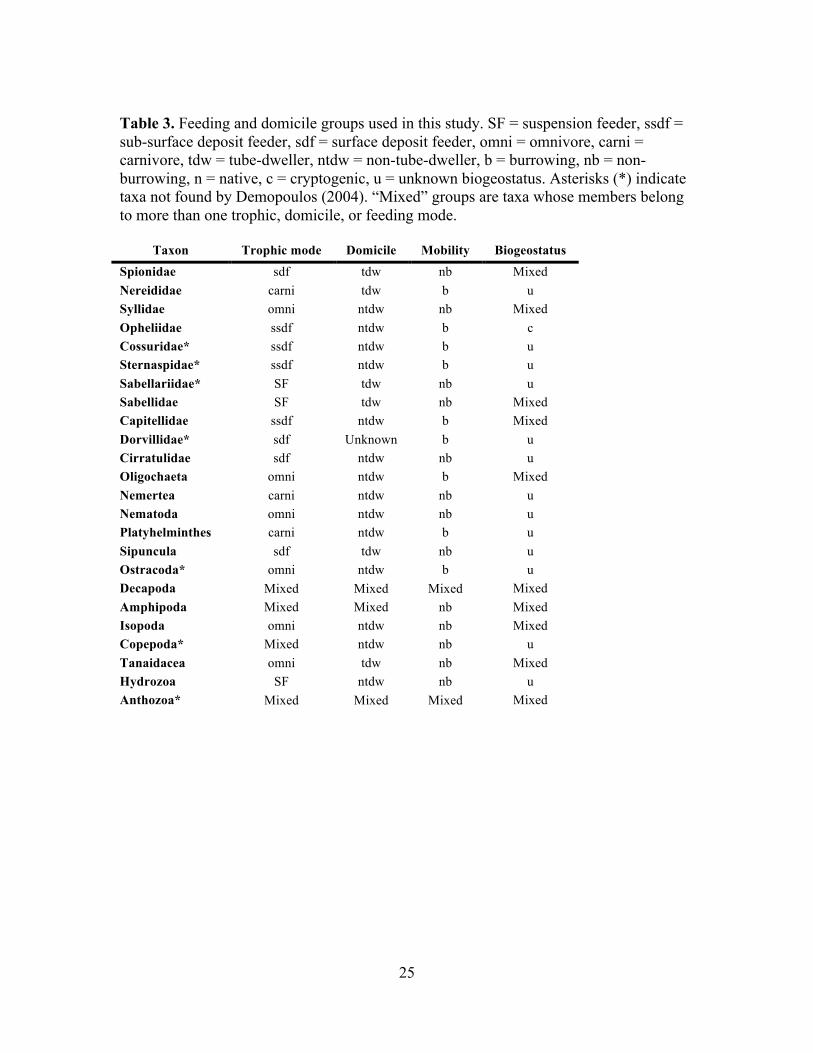
Taxa were assigned to trophic, domicile, and feeding guilds according to Barnes
(1980), Fauchald and Jumars (1979), and Sheridan (1997). Since macrofauna were not
identified to the species level in this study, taxa were assigned to a guild only if all the
species in that taxon were classified as belonging to that guild in the literature and in a
previous study in Hawaiian mangroves performed near the study site (Demopoulos
2004). Taxa containing species with different classifications for feeding or domicile guild
or mobility were analyzed as “mixed” groups (Table 3). For example, tubificid
oligochaetes are sometimes classified as subsurface feeders, while enchytraeid
oligochaetes consume detritus—this has led to oligochaetes being classified as surface
deposit feeders (Sheridan 1997) or sub-surface deposit feeders (e.g. Sacco et al. 1994).
Here, we classify oligochaetes as omnivorous (Barnes 1980; Demopoulos 2004).
Amphipod taxa found previously in K!ne‘ohe Bay include members of multiple feeding
groups: the genus Corophium spp. are considered suspension feeders, though other
amphipods are surface deposit feeders (e.g. Neomicrodeutopus sp.) or omnivorous (e.g.
Eropisa spp. and Eriopisella spp.) (Demopoulos 2004). Here, because amphipods were
not identified below the order level, they are referred to as a mixed group.
For taxa and trophic guilds that showed distinguishable patterns across the
chronosequence, relationships between mangrove removal age and abundance were
determined by linear regressions on log(x+1)-transformed abundances.

9!
Caging Experiment
Using a caging experiment, I tested the effect of burrowers and predators on the infaunal
community and the time course of trophic shifts. Burrowing predators were excluded
using wire mesh exclosures (36 ! 36 ! 30 cm, 1.27 cm mesh) with aluminum flashing
below the sediment surface to prevent burrowers from digging underneath the cage. Each
set of exclosures included a full predator exclusion cage; a cage control with 26 ! 26 cm
openings on each side; and a demarcated open control with no cage. Three to four
replicates of each exclosure type were placed at 5 sites around the perimeter of the
fishpond: two sites at the edge of mangrove that remained intact throughout the study,
one site where mangrove was removed during the present study, and two sites where
mangrove was removed 1-2 years prior to the present study (Figure 1). Three replicates
of each treatment were deployed at the most northern and the most southern sites (M2
and R07, respectively) and four replicates were deployed at each of the other three sites.
Infaunal cores were taken in May (10th – 16th) and September (September 24th –
29th) of 2011, which corresponds to 1 month before and 3 months after mangrove was
removed around site R11 on June 16th – 18th, 2011. Initial cores were taken the day after
exclosures were set out, so no treatment effects were expected in the first set of cores.
Cores were processed as described in the chronosequence section.
Statistical analyses were performed in R (Team 2012) and Primer-E! software
(Clarke 1993). To test for changes in infaunal community composition across sites,
treatments and over the course of the experiment, I used permutational analysis of
variance (PERMANOVA; Anderson 2001a) based on modified Gower similarity with log
(base 2) transformation (Anderson et al. 2006). In this study, community richness is
relatively low, but abundance varies significantly between sampling sites, and differences
in total abundance can be obscured when commonly employed dissimilarity measures are
used (Clarke et al. 2006). Here, modified Gower similarity with log transformation
counts a twofold change in abundance as equivalent to a species-addition in the
community (Anderson et al. 2006). Permutation tests allow comparisons in an ANOVA-
style framework but without the stringent distributional requirements of traditional
ANOVA. Additionally, PERMANOVA is a powerful tool for analyzing both uni- and
10!
multivariate community measures, so it was used here for univariate tests instead of
conventional non-parametric univariate tests (Anderson 2001a; McArdle and Anderson
2001). To visualize community differences identified by multivariate tests, I used non-
metric multidimensional scaling (MDS) plots.
To analyze the effect of predator exclusion at experimental sites (M2, M1, R11,
R10, R09), I analyzed the abundance of all taxonomic groups in two different ways using
PERMANOVA. First, using both September and May cores and secondly, using data
from September cores only. The model formula used for the first PERMANOVA was:
Infauna ~ Site + CageTrt + Month + Site*CageTrt + Site*Month +
CageTrt*Month + Block(Site*CageTrt) + Site*CageTrt*Month
Since the experimental design involved repeated measures (cores taken in each
cage at each time point), cages were treated as blocks. The Block(Site*CageTrt)*Month
term is excluded because there is only a single sample per cage at each time point. The
residual error term therefore represents the variation within a cage treatment at each site.
The model structure for the second analysis was:
Infauna ~ Site + CageTrt + Site*CageTrt
This model was applied to September core data.
Significant multivariate patterns were examined further with univariate
PERMANOVA tests on the five dominant taxonomic groups (Oligochaeta, Amphipoda,
Sabellidae, Opheliidae, and Nematoda) using Euclidean distance matrices and 3999
permutations (Anderson 2001b). This analysis is identical to an ANOVA structure but
allows for non-normality: It produces the same sum of squares and F-ratios but uses
permutations to obtain p-values (Anderson 2005).
11!
Predator Community
To quantify burrowing predators at each site, two trapping methods were employed: For
large (>12 cm carapace width) crabs, large (~1 m diameter), equally baited crab traps
were set at each of the five experimental sites, left overnight and checked the following
morning. Large traps were set 3-4 times per sampling period. For smaller crabs that tend
to forage during the day (Thalamita crenata, Podophthalmus vigil, Portunus
sanguinolentus; < 12 cm carapace width), crab nets were used to survey during the day
for three or more consecutive days. All traps were baited with skin and bones from two
milkfish (‘awa; Chanos chanos) per trap (~ 1 kg total). Crabs caught in all traps were
identified, sexed, and measured for carapace length and width. Biomass was calculated
from carapace width using available species- and sex-specific parameters for the equation
!
W = aLb (Langer 1952), where W is total weight and L is carapace width (Mohapatra et
al. 2010; Roongrati and Iaitim 1994; Songrak et al. 2010; Sukumaran and Neelakantan
1997). Conversion factors for each species are given in Table 7. Scylla serrata was
removed from statistical comparisons unless otherwise noted, because of its low catch
rate (seven individuals captured across the course of the experiment).
To test for differences in the predator community between sites and over the
course of the experiment, crab biomass and carapace width was analyzed using Kruskall-
Wallis tests, because neither biomass nor carapace width were normally distributed. Crab
species density was approximated using catch per unit trapping effort (CPUE; number
caught per trap per day). CPUE was compared among sites for each time point using
Kruskal-Wallis tests.
RESULTS
Physical Environment
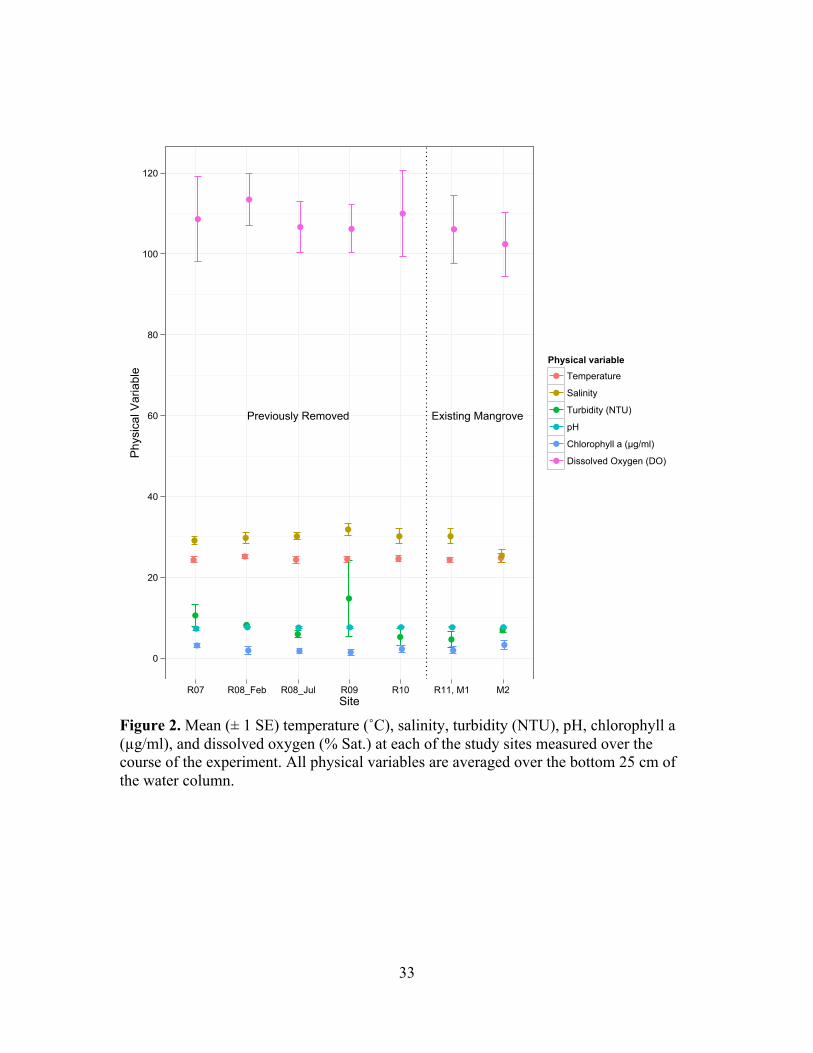
The pond contains a natural gradient from fresh, turbid, productive water on the west side
near the existing mangroves to more saline, less turbid waters on the east side near the
sea wall. All the study sites are along the east side and are similar in mean temperature,
salinity, DO, pH, turbidity and chlorophyll a concentration in the bottom 25 cm of the
water column (Figure 2; Kruskal Wallis tests; df = 6, p = 0.981, 0.217, 0.979, 0.966,
12!
0.217, 0.597 respectively). There are no systematic differences in salinity, temperature,
DO, pH, or chlorophyll a concentration across the chronosequence (Figure 2).
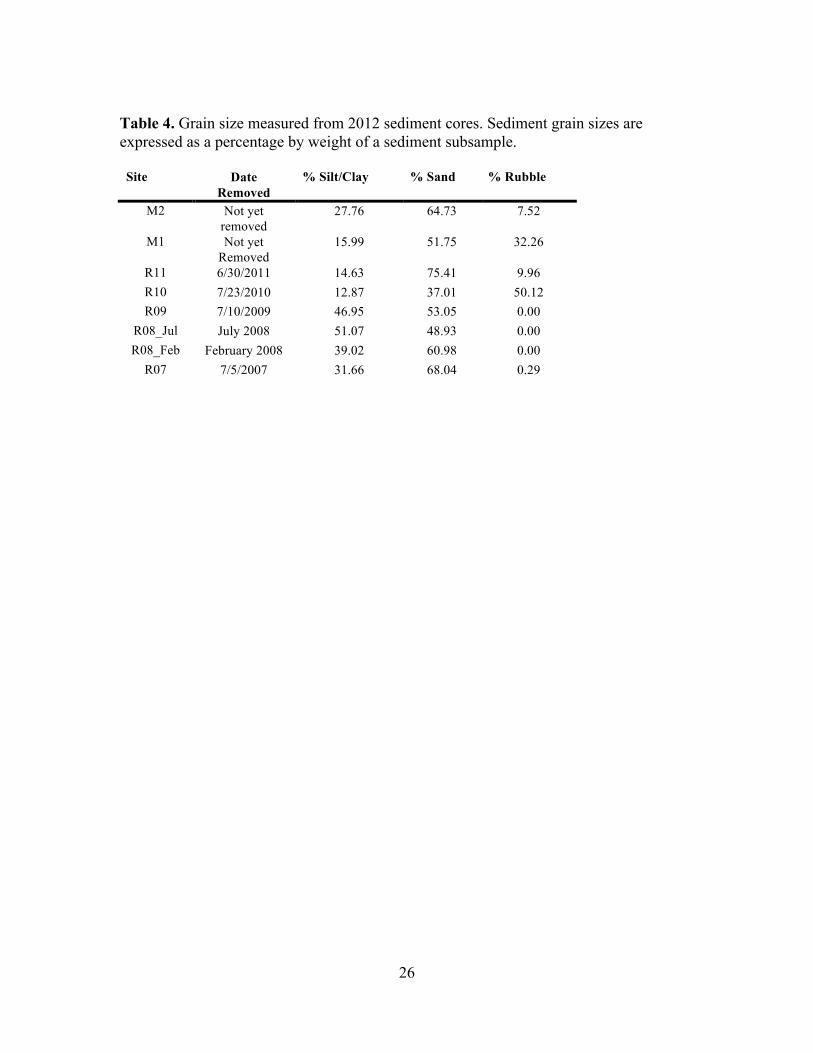
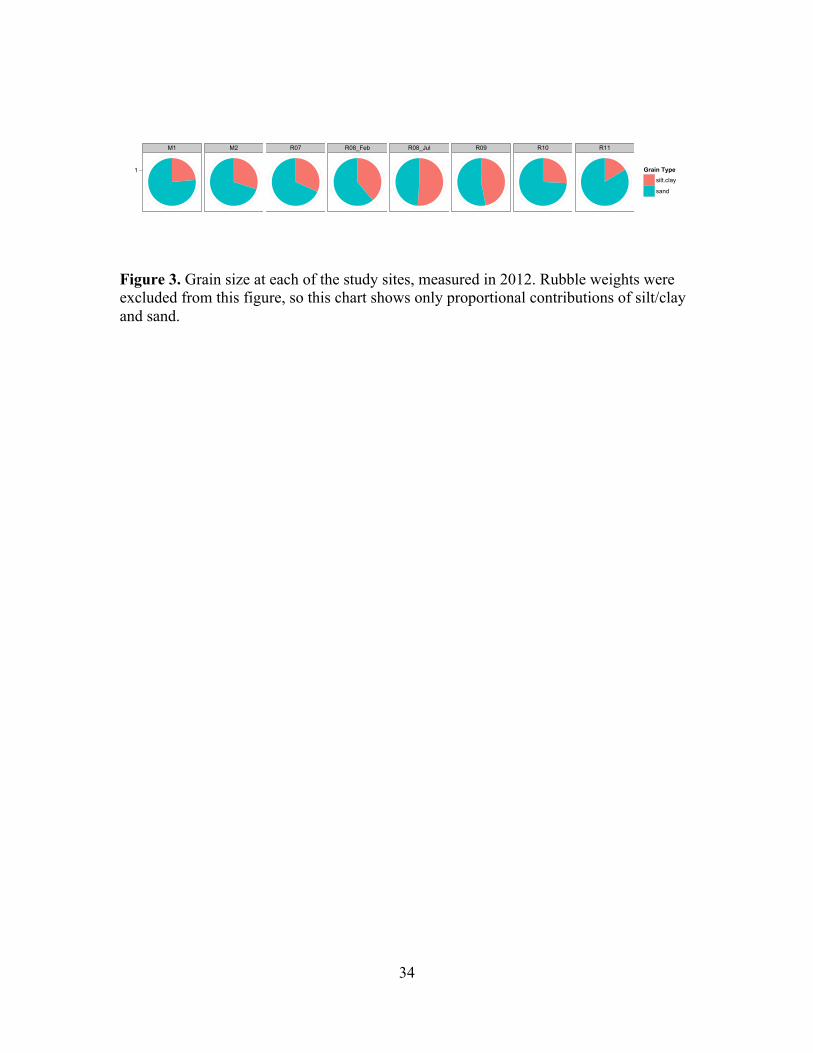
Grain sizes are given in Table 4 and proportions of sand and silt/clay are shown in
Figure 3. There are no systematic differences in grain size composition along the
chronosequence.
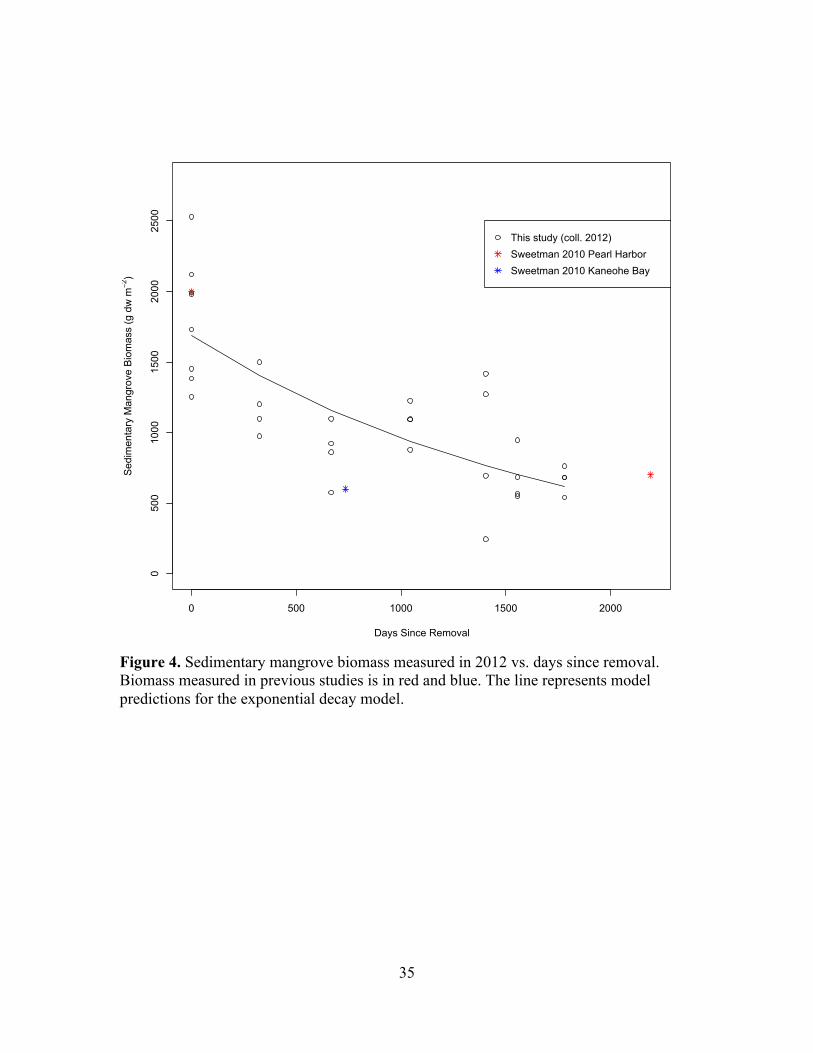
Mangrove Decomposition Rate
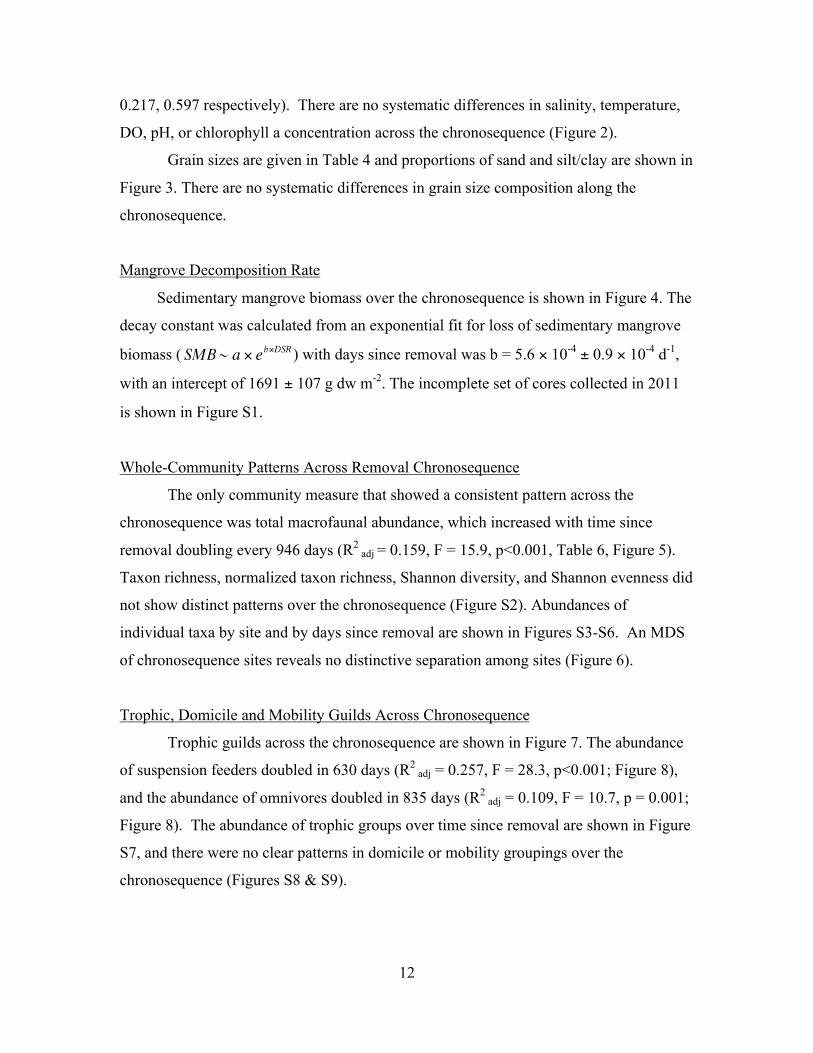
Sedimentary mangrove biomass over the chronosequence is shown in Figure 4. The
decay constant was calculated from an exponential fit for loss of sedimentary mangrove
biomass ( ) with days since removal was b = 5.6 ! 10-4 ± 0.9 ! 10-4 d-1,
with an intercept of 1691 ± 107 g dw m-2. The incomplete set of cores collected in 2011
is shown in Figure S1.
Whole-Community Patterns Across Removal Chronosequence
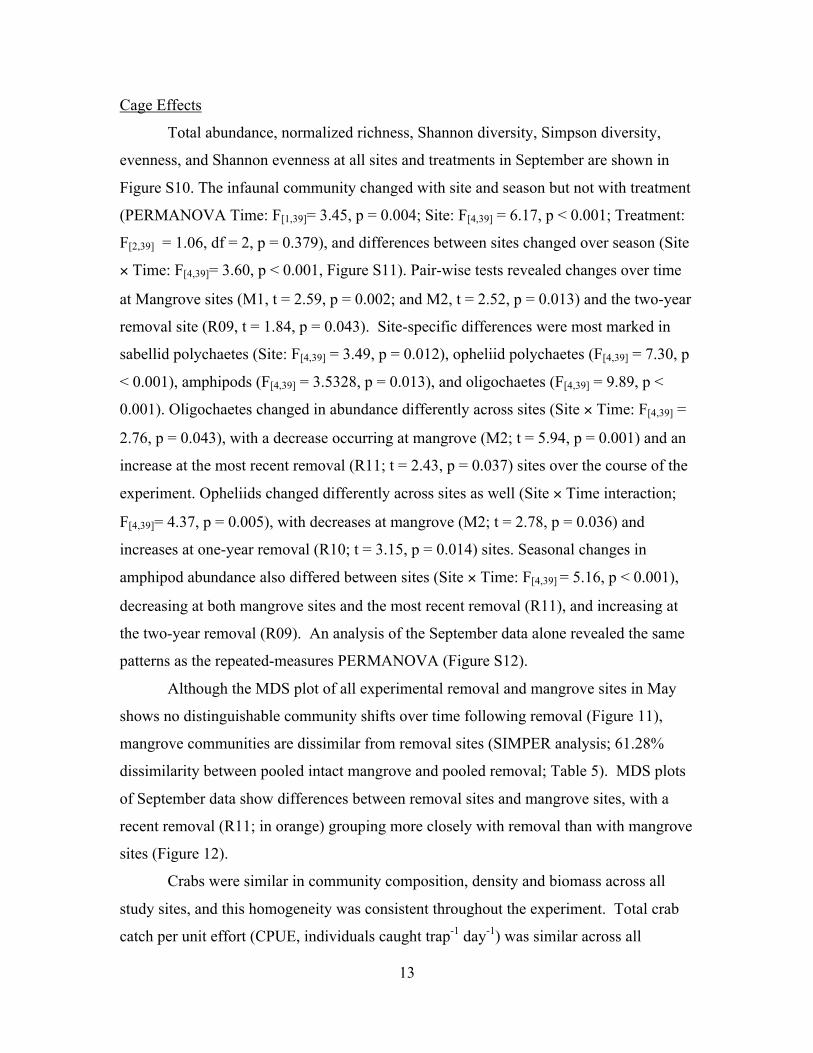
The only community measure that showed a consistent pattern across the
chronosequence was total macrofaunal abundance, which increased with time since
removal doubling every 946 days (R2 adj = 0.159, F = 15.9, p<0.001, Table 6, Figure 5).
Taxon richness, normalized taxon richness, Shannon diversity, and Shannon evenness did
not show distinct patterns over the chronosequence (Figure S2). Abundances of
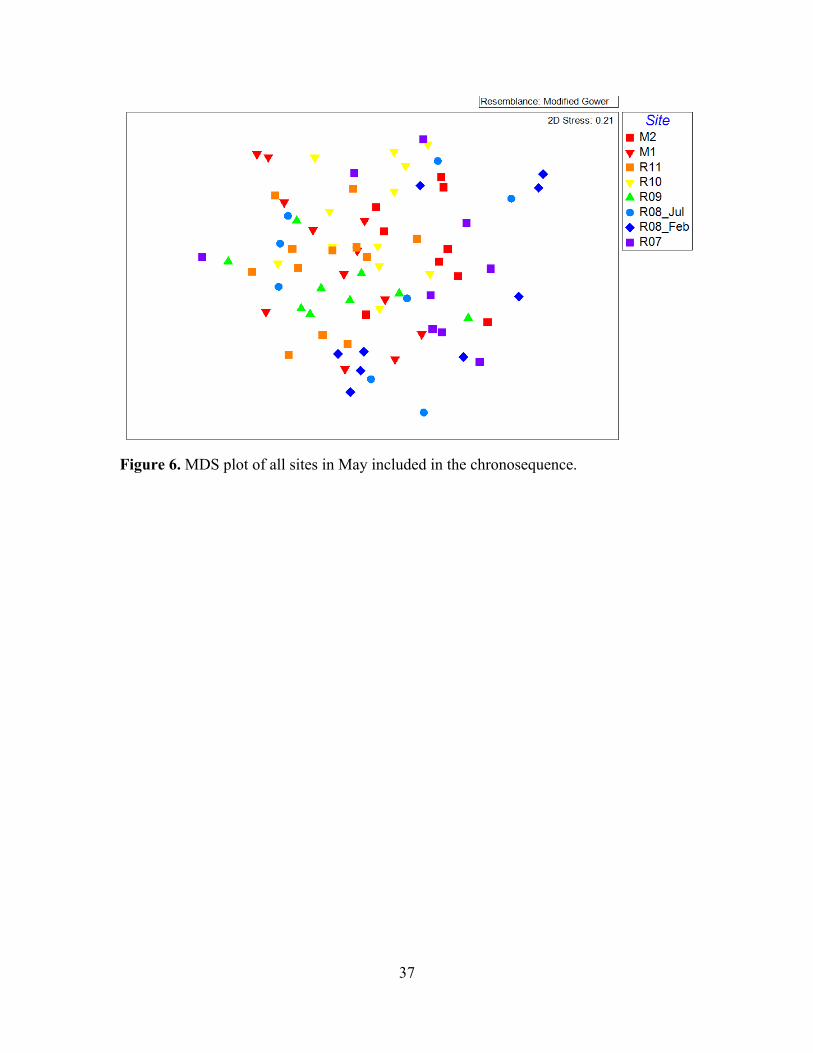
individual taxa by site and by days since removal are shown in Figures S3-S6. An MDS
of chronosequence sites reveals no distinctive separation among sites (Figure 6).
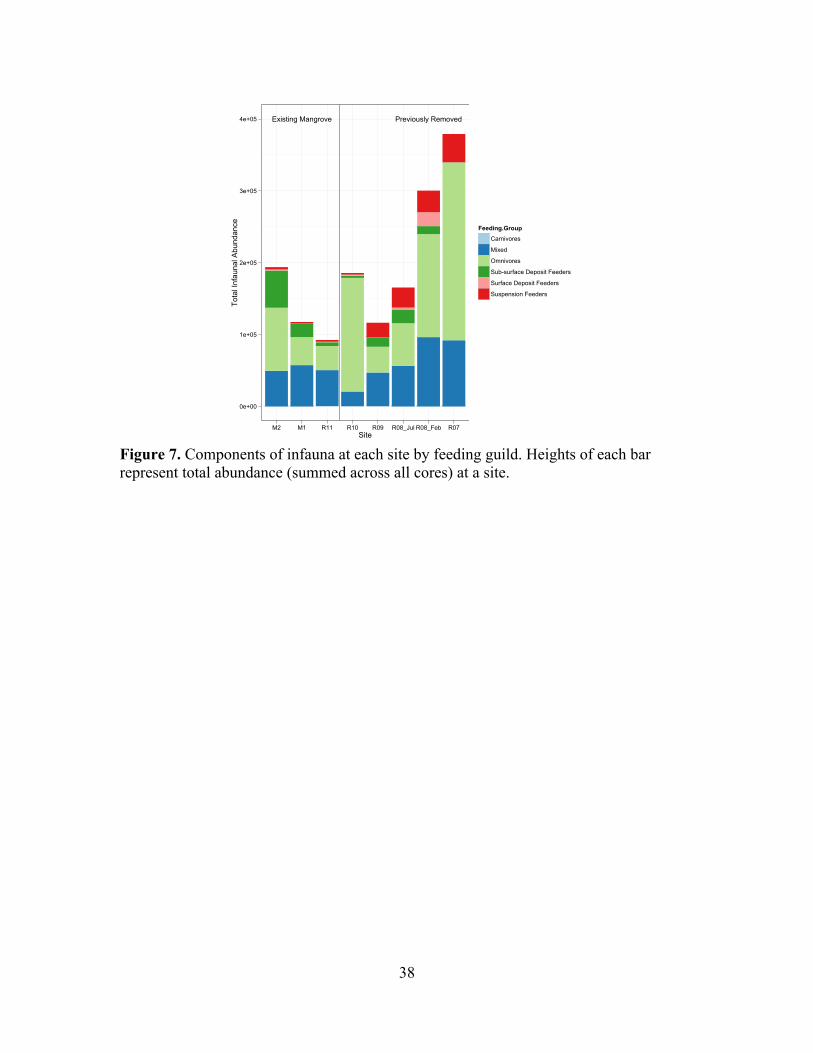
Trophic, Domicile and Mobility Guilds Across Chronosequence
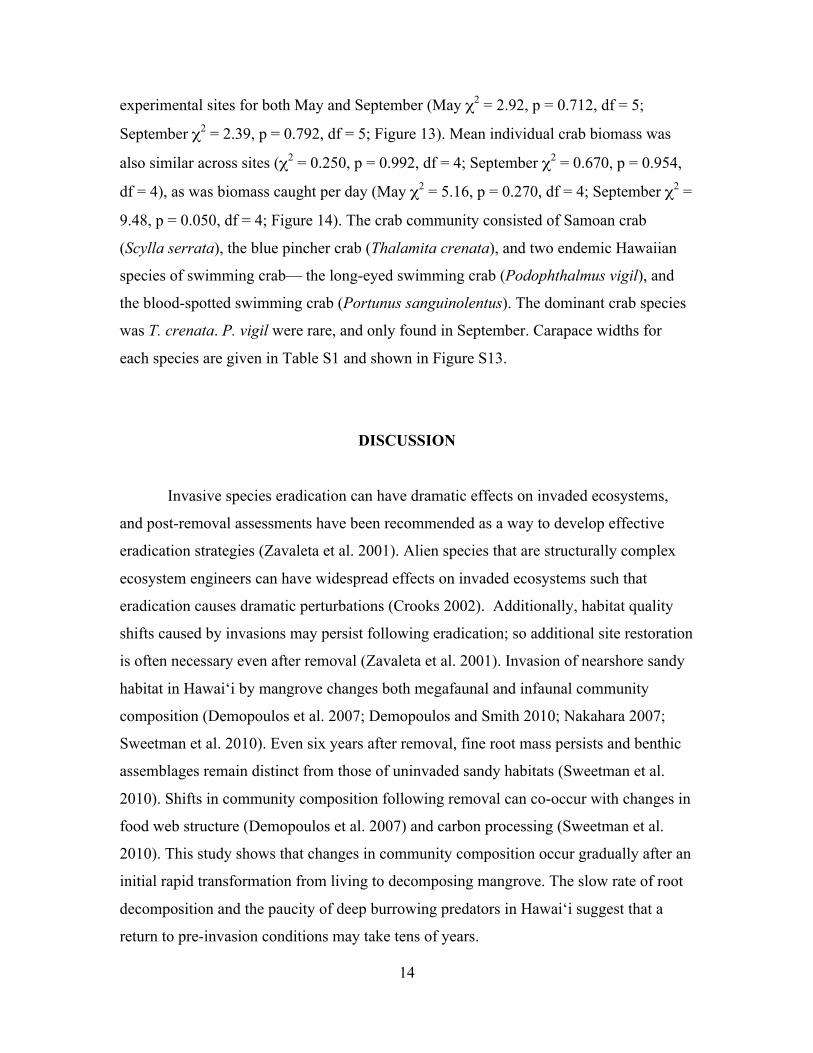
Trophic guilds across the chronosequence are shown in Figure 7. The abundance
of suspension feeders doubled in 630 days (R2 adj = 0.257, F = 28.3, p<0.001; Figure 8),
and the abundance of omnivores doubled in 835 days (R2 adj = 0.109, F = 10.7, p = 0.001;
Figure 8). The abundance of trophic groups over time since removal are shown in Figure
S7, and there were no clear patterns in domicile or mobility groupings over the
chronosequence (Figures S8 & S9).
13!
Cage Effects
Total abundance, normalized richness, Shannon diversity, Simpson diversity,
evenness, and Shannon evenness at all sites and treatments in September are shown in
Figure S10. The infaunal community changed with site and season but not with treatment
(PERMANOVA Time: F[1,39]= 3.45, p = 0.004; Site: F[4,39] = 6.17, p < 0.001; Treatment:
F[2,39] = 1.06, df = 2, p = 0.379), and differences between sites changed over season (Site
! Time: F[4,39]= 3.60, p < 0.001, Figure S11). Pair-wise tests revealed changes over time
at Mangrove sites (M1, t = 2.59, p = 0.002; and M2, t = 2.52, p = 0.013) and the two-year
removal site (R09, t = 1.84, p = 0.043). Site-specific differences were most marked in
sabellid polychaetes (Site: F[4,39] = 3.49, p = 0.012), opheliid polychaetes (F[4,39] = 7.30, p
< 0.001), amphipods (F[4,39] = 3.5328, p = 0.013), and oligochaetes (F[4,39] = 9.89, p <
0.001). Oligochaetes changed in abundance differently across sites (Site ! Time: F[4,39] =
2.76, p = 0.043), with a decrease occurring at mangrove (M2; t = 5.94, p = 0.001) and an
increase at the most recent removal (R11; t = 2.43, p = 0.037) sites over the course of the
experiment. Opheliids changed differently across sites as well (Site ! Time interaction;
F[4,39]= 4.37, p = 0.005), with decreases at mangrove (M2; t = 2.78, p = 0.036) and
increases at one-year removal (R10; t = 3.15, p = 0.014) sites. Seasonal changes in
amphipod abundance also differed between sites (Site ! Time: F[4,39] = 5.16, p < 0.001),
decreasing at both mangrove sites and the most recent removal (R11), and increasing at
the two-year removal (R09). An analysis of the September data alone revealed the same
patterns as the repeated-measures PERMANOVA (Figure S12).
Although the MDS plot of all experimental removal and mangrove sites in May
shows no distinguishable community shifts over time following removal (Figure 11),
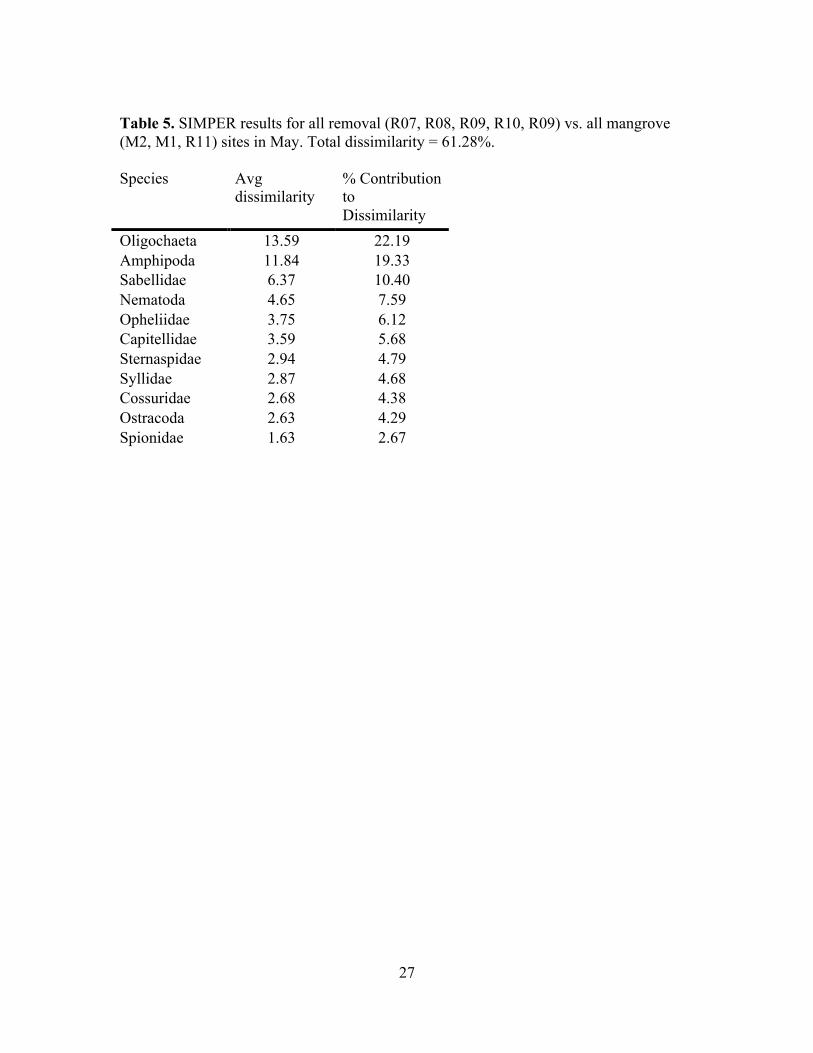
mangrove communities are dissimilar from removal sites (SIMPER analysis; 61.28%
dissimilarity between pooled intact mangrove and pooled removal; Table 5). MDS plots
of September data show differences between removal sites and mangrove sites, with a
recent removal (R11; in orange) grouping more closely with removal than with mangrove
sites (Figure 12).
Crabs were similar in community composition, density and biomass across all
study sites, and this homogeneity was consistent throughout the experiment. Total crab
catch per unit effort (CPUE, individuals caught trap-1 day-1) was similar across all
14!
experimental sites for both May and September (May !2 = 2.92, p = 0.712, df = 5;
September !2 = 2.39, p = 0.792, df = 5; Figure 13). Mean individual crab biomass was
also similar across sites (!2 = 0.250, p = 0.992, df = 4; September !2 = 0.670, p = 0.954,
df = 4), as was biomass caught per day (May !2 = 5.16, p = 0.270, df = 4; September !2 =
9.48, p = 0.050, df = 4; Figure 14). The crab community consisted of Samoan crab
(Scylla serrata), the blue pincher crab (Thalamita crenata), and two endemic Hawaiian
species of swimming crab— the long-eyed swimming crab (Podophthalmus vigil), and
the blood-spotted swimming crab (Portunus sanguinolentus). The dominant crab species
was T. crenata. P. vigil were rare, and only found in September. Carapace widths for
each species are given in Table S1 and shown in Figure S13.
DISCUSSION
Invasive species eradication can have dramatic effects on invaded ecosystems,
and post-removal assessments have been recommended as a way to develop effective
eradication strategies (Zavaleta et al. 2001). Alien species that are structurally complex
ecosystem engineers can have widespread effects on invaded ecosystems such that
eradication causes dramatic perturbations (Crooks 2002). Additionally, habitat quality
shifts caused by invasions may persist following eradication; so additional site restoration
is often necessary even after removal (Zavaleta et al. 2001). Invasion of nearshore sandy
habitat in Hawai‘i by mangrove changes both megafaunal and infaunal community
composition (Demopoulos et al. 2007; Demopoulos and Smith 2010; Nakahara 2007;
Sweetman et al. 2010). Even six years after removal, fine root mass persists and benthic
assemblages remain distinct from those of uninvaded sandy habitats (Sweetman et al.
2010). Shifts in community composition following removal can co-occur with changes in
food web structure (Demopoulos et al. 2007) and carbon processing (Sweetman et al.
2010). This study shows that changes in community composition occur gradually after an
initial rapid transformation from living to decomposing mangrove. The slow rate of root
decomposition and the paucity of deep burrowing predators in Hawai‘i suggest that a
return to pre-invasion conditions may take tens of years.
15!
Mangrove and removal areas host distinct infaunal communities
There are distinct differences in community composition, including differences in
total abundance (Figure 5), between mangrove and removal sites (Figure 6, 11 & 12), and
many of these differences are consistent with previous studies on O‘ahu. Consistent with
previous studies, I found higher abundances at removal sites than mangroves; however,
total abundances differed between this study and previous work. Total abundances found
at the northernmost mangrove site in this study are similar to those found by Sweetman et
al. (2010) in Pearl Harbor (M2 in this study; 21,885 ± 2,682 ind m-2, compared to 21,597
± 12,731), but other mangrove sites in this study (M1 and R11, in May) had substantially
lower total abundances than those found for other mangrove forests on O‘ahu. Though a
consistent increase in total infaunal abundance with increasing removal age was found
here, total abundances here were more similar to a six-year removal in K!ne‘ohe Bay
than a two-year removal in Pearl Harbor, suggesting that total abundances may be
dependent on location. Differences between the total abundances found here and in
previous work may indicate that removal response varies spatially within the main
Hawaiian Islands.
Patterns in total abundance found between bare and mangrove sediments in
Hawai‘i agree with abundance patterns in native mangroves. In studies comparing mud
flats to mangrove habitats in R. mangle’s native range, mangroves host a higher infaunal
density than adjacent mudflats (Sheridan 1997). The same pattern is found in Hawai‘i on
Moloka‘i: densities are higher in mangroves than on adjacent sandflats at the same tidal
height (Demopoulos and Smith 2010). The pattern is different for mudflats where
mangrove overstory has been removed. Sweetman et al. found higher abundances (about
an 8-fold increase) in a new removal (2 years old) than in an intact mangrove forest at the
same location. Here, abundances increased 1.5-fold in the first two years following
removal (Table 6).
Relative differences in community composition in this study are comparable to
previous work. The overall differences between bare and removal sites were due
primarily to oligochaetes and amphipods (Table 5), which were dominant at every site,

16!
regardless of removal status. Relative abundances of less dominant groups were similar
to those found by Sweetman et al.: The mangrove community was dominated primarily
by oliogochaetes (41% of abundance) and amphipods (34%), and secondarily by sub-
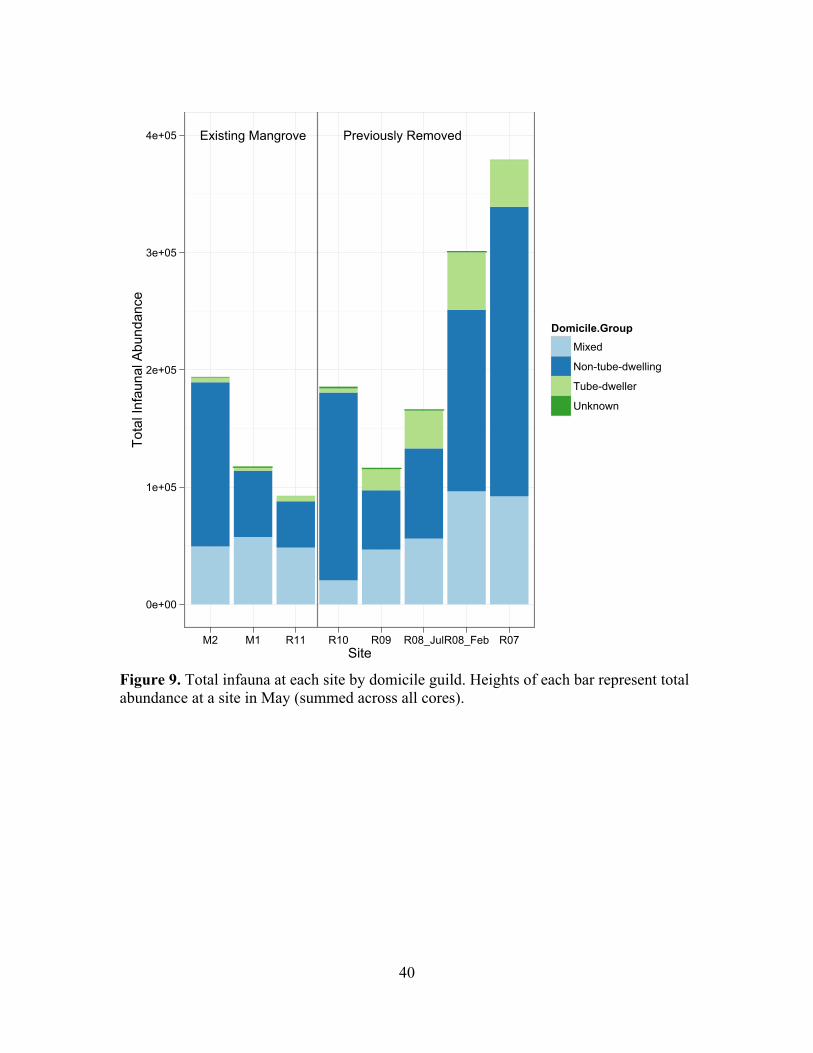
surface deposit feeders (21%). The maximum abundance of sub-surface deposit feeders
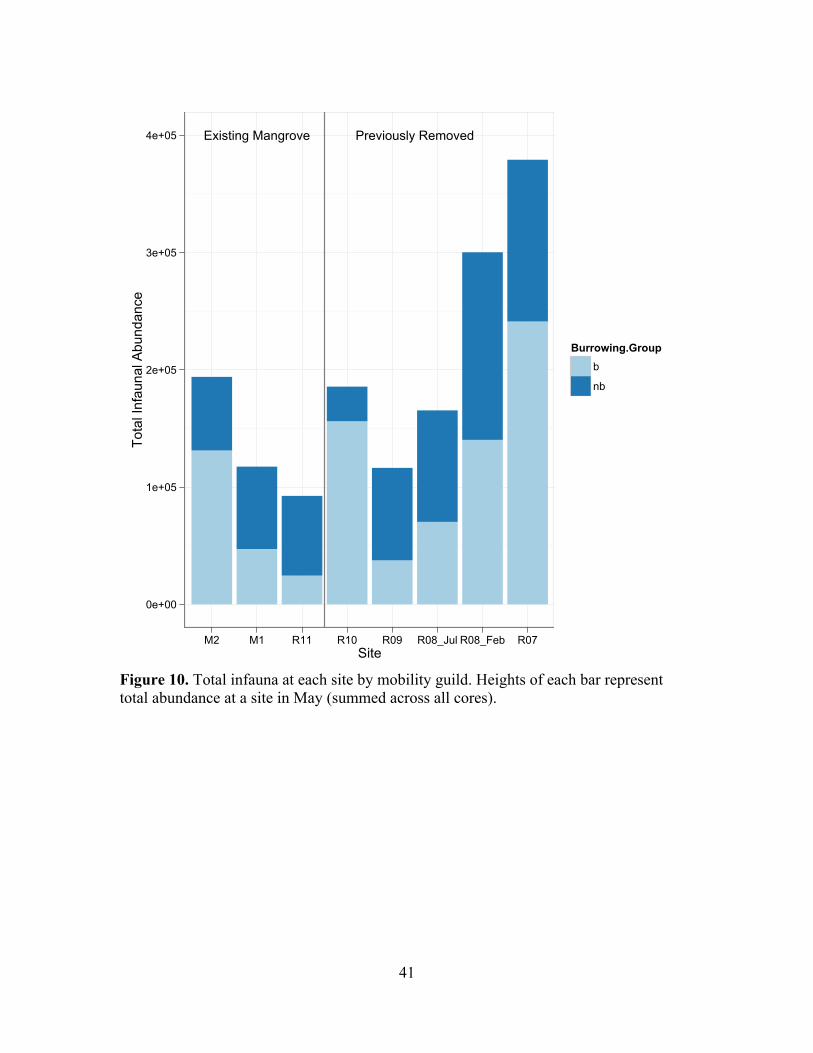
decreased as mangrove removals aged (Figure 9 & 10). Removal and pre-invasion areas
in K!ne‘ohe Bay have shown a higher abundance of suspension and surface-feeding
macrofauna (e.g., corophiids, sabellids, and spionids) in previous studies, ostensibly
because of a lack of leaf litter deposits at the surface (Sweetman et al. 2010). Sweetman
et al. (2010) also found sub-surface deposit feeders to be numerically dominant at intact
mangrove sites. This pattern has been attributed to decreased particle size, high
sedimentation, and high levels of organic enrichment in mangroves as opposed to sand or
mud flats (Ellis et al. 2004), and is consistent with previous studies of native and invasive
mangrove forests (Demopoulos and Smith 2010).
Other trophic guilds show consistent patterns in abundance across mangrove and
removal areas: Suspension feeders had the highest relative abundances at removal sites,
with abundances increasing with removal age (Figure 8). After oligochaetes and
amphipods, suspension feeding sabellid polychaetes contributed the most to %
dissimilarity between all mangrove and all removal sites (22 and 19% respectively; Table
5). In Hawai‘i, suspension feeding sabellid worms were dominant at sandy controls in a
study by Sweetman et al. (2010), and sandflat communities have higher abundances of
suspension and surface deposit feeders, according to previous studies (Ellis et al. 2004).
Shifts in suspension feeder abundance are partly due to changes in water velocity
(LaBarbera 1984), which is much lower in mangrove habitats because of prop-root
structure. Lower densities of suspension feeders in native mangroves than sand or
mudflats have been attributed to low flow rates and high levels of sedimentation (Ellis et
al. 2004). Turbidity is actually higher at the oldest removal site than in the mangrove, but
so is chlorophyll a concentration (Figure 2), so the increase in turbidity is likely to be due
to more primary productivity instead of higher sedimentation rates.
17!
Community recovery and mangrove decomposition is slow in Hawaiian mangroves
Changes in community structure were mirrored by changes in benthic habitat and
remaining belowground mangrove biomass. The decay constant calculated from this
chronosequence of mangrove removal (k = 5.6 ! 10-4 ± 0.9 ! 10-4 d-1) is only 0.5% of the
lowest rate calculated for the same species in its native range (Figure 4). In native
mangrove forests, root decomposition constants have varied between k = 1.2–1.8 ! 10-3 d-
1 and 2.3-2.8 ! 10-3 d-1 in a mixed forest that included R. mangle (Poret et al. 2007).
Roots of native R. mangle in Belize have decay constants of 0.108 and 0.092 d-1
(Middleton and McKee 2001). In Hawai‘i, cores taken from six-year (Pearl Harbor) and
two-year (K!ne‘ohe Bay) removals estimated a daily mass loss between 3–7 ! 10-4 d-1 for
mangrove roots in Hawai‘i (Sweetman et al. 2010), but these were made only with two
time points (existing mangrove and 2 year removal at one site, and existing mangrove
and 6 year removal at another). Previous studies have found no significant effect of
mangrove species on root decomposition, finding instead that root size, tidal height, and
nutrient concentrations are more important in determining decay rates (Middleton and
McKee 2001; Poret et al. 2007). Since this constant was calculated using mangrove roots
from the edge of the fine root mat in decomposing mangrove, where roots are constantly
submerged, and mangrove roots with less water movement and less frequent tidal
inundation decompose more slowly (Poret et al. 2007), this decomposition rate is likely
to be an overestimate of the overall rate for mangrove roots in Hawai‘i. Loss of mangrove
biomass may be slow because its decomposition is primarily bacterial: Hawaiian
mangroves lack coevolved macrofauna, which are responsible for much of the leaf and
root decomposition in native mangroves (e.g., (Nordhaus and Wolff 2007). Macrofauna
in Hawai‘i do not consume mangrove-derived carbon (Demopoulos et al. 2007), and
bacteria dominate short-term C processing in six-year removals (Sweetman et al. 2010).
The rate at which mangrove organic matter decomposes is highly dependent on the
presence of mangrove-consuming macrofauna, and rates are much lower where bacteria
are solely responsible for organic carbon consumption (Kristensen et al. 2008; Middleton
and McKee 2001). Mangrove decomposition state is affected by the macrofaunal and
bacterial communities present, but the decomposition state of the mangrove in turn

18!
affects faunal densities: previous work indicates that meiofaunal densities are higher on
more decomposed R. mangle leaves, and laboratory experiments have shown that larger
detritivores prefer conditioned (decomposed or excreted by crabs) mangrove material to
fresh mangrove detritus (Giddins et al. 1986; Lee 1989; Torres-Pratts and Schizas 2007).
Because of the important role of macrofauna in processing of mangrove-derived carbon,
it is both expected that the faunal community will change with removal and important to
evaluate the temporal community response in order to assess the recovery of the benthic
habitat.
This study shows that infaunal density increased gradually after removal, with
older sites containing higher abundances of infauna than more recent removals (Figure
5). The four-year removal in this study had abundances very similar to a six-year
removal in K!ne‘ohe Bay sampled by Sweetman et al. (42,154 ind m-2 at site R07; 46,610
ind m-2 at KBR). This suggests either that the density stabilized after four years, or that
different recovery times can be expected for different sites within the main Hawaiian
Islands. There may also be environmental differences between sites that are driving
infaunal abundance more than time since removal.
The rate of change in community composition was more dramatic at first,
followed by a slow change over time. In the first year following removal, macrofaunal
abundance increased, then decreased again and slowly increased between one and four
years after removal (Table 6). This increase in abundance was accompanied by a decrease
in sub-surface deposit feeders, which persisted over time (Figure S7). A rapid shift to
“post-removal” conditions is also apparent from the MDS plot of all sites in September
(Figure 12): The removal site, which had only been removed 3 months before the
collection of September cores, already appeared similar to the 2-4 year removal sites.
Rapid initial shifts in community structure and total abundance agree with differences in
short- vs. long-term changes in C-processing in removal sites found by Sweetman et al.
(2010).
Macrofaunal community structure of benthic environments has been used in the
past to characterize ecosystem health (Brown et al. 2000; Kremen 1992). If suspension
feeder abundance is an indicator of lower sedimentation rates and a return to high-flow,
unvegetated habitat, the long-term increase in suspension feeders following removal may
19!
be evidence of recovery in the benthic community. At the four-year removal site in this
study, sabellids were still at about half the abundance of sandy controls in K!ne‘ohe Bay
surveyed by Sweetman et al., suggesting that they were still in the process of returning to
a pre-invasion state.
The abundance of omnivores, composed primarily of oligochaetes, increased in
abundance with time since removal. In a previous food web study in Hawaiian
mangroves, tubificid oligochaetes had stable isotope values matching a diet of mangrove
leaves (Demopoulos 2004), so it is possible that the oligochaete community is more able
to process mangrove material than other taxa, and therefore responded positively to root
decomposition.
Sediment chemistry at the one-year removal (R10) and intact mangrove (M1)
showed distinct differences in O2 penetration depth, with far shallower O2 penetration
depth and higher sulfide concentrations further up in the sediment column than at the
mangrove sites (Mills 2012). This may have been the result of the cessation of diffusion
of O2 into the sediments by mangrove roots following overstory removal. The main
source of porewater O2 following the death of the mangrove roots at that site might be the
burrows of larger bioturbators such as crabs and gobies. If burrowers are the only source
of introduced dissolved O2, their absence may reduce mixing and increase sediment
anoxia.
Food web structure and function is determined by a combination of productivity
and trophic structure (Leibold et al. 1997). Decomposition may make mangrove material
more labile and available to consumers. When mangroves decompose, total amounts of
tannins and phenolic compounds inside the tissues decrease, potentially rendering
mangrove roots and leaves more bioavailable (Lin et al. 2007). An increase in microbial
production would not necessarily increase macrofaunal biomass, but a decrease in
predation pressure or an increase in burrowing along the chronosequence might be
responsible for the observed changes in abundance.

20!
Top-down processes do not regulate infaunal communities in Hawaiian mangroves or
mangrove removals
Burrowing crabs can greatly affect infaunal community composition because they
change sediment chemistry by creating burrows (Alongi 2009) and turn over mangrove
litter (Nerot et al. 2009; Werry and Lee 2005). The species that create extensive burrows
and facilitate mangrove litter breakdown in native mangroves are absent from Hawaiian
mangroves. Instead, mangroves on O‘ahu contain a diversity of introduced species,
including the molly Poecilia sp., introduced mantis shrimp Gonodactylaceus falcatus and
the Samoan or mangrove crab Scylla serrata (Nakahara 2007). The epifaunal community
at my study site was dominated by the blue swimming crab Thalamita crenata, S.
serrata, and two patchily distributed native crabs, Podophthalmus vigil and Portunus
sanguinolentus (Table 8). Removal did not affect abundances: before and after the cage
experiment, CPUE (density and biomass) was not significantly different between any
sites for any crab species, regardless of removal age (Figure 13 & 14). S. serrata were not
restricted to mangrove habitat and were instead caught across all sites (Figure S13). The
species to which much of the bioturbation in native mangroves is attributed (Uca spp. and
members of the family Sesarmidae) are absent from Hawaiian mangroves (Demopoulos
2004; Nakahara 2007), potentially replaced by species with less extensive burrowing
activities. Though there is not a lot of published data on the domicile habits of T. crenata
and S. serrata, they inhabit shallow burrows (Williams 1994), and total burrow density is
much lower in mangroves on O‘ahu than in several other native mangroves (Demopoulos
2004; Kristensen 2008), so they are unlikely to have the extensive impacts on sediment
chemistry and infaunal densities that ocypodid and grapsid crabs do.
The non-significant treatment effect given by PERMANOVA indicates that
burrowing predators did not exert top-down effects on total abundance, abundance of
numerically dominant fauna, diversity, or species richness inside or outside the
mangrove. Previous caging experiments have demonstrated negative effects of epifauna
(snails, as well as sesarmid, grapsid, ocypodid and hermit crabs) on meiofaunal
(Schrijvers et al. 1995) and macrofaunal abundance (Kon et al. 2009; Schrijvers et al.
1998). Cage treatment replicates at each site were equal or higher in this study (n = 3-4)

21!
than in previous studies (n = 2, Schrijvers 1995-1998; n = 4, Kon et al. 2009) that found
significant effects of predators on macrobenthos, so the inability of this analysis to detect
a predator effect on total abundance is not due to insufficient sample size relative to
previous studies. Additionally, a power analysis of log(x+1)-transformed total
abundances from this study shows that a doubling of sample size would be necessary to
detect a difference between cage treatments in mangrove sites at an alpha-level of 0.05.
Additional cage replicates at the removal sites would not substantially increase the
power. Cage experiments performed on native mangroves (Rhizophora apiculata) in
Thailand, found higher species richness, abundance, and biomass inside mangrove forest,
and many of these differences were significant in both wet and dry seasons (Kon et al.
2009). Top-down impacts on the infaunal community, though important in native
mangroves, were not present here in intact mangrove or removal sites. The Site ! Time
interaction shows that the infaunal community at different sites changed differently over
the course of the experiment. Despite the different result of seasonal effects infaunal
community shifts, the result that interactions are the same across sites holds. The fact that
seasonal and spatial differences were responsible for more variation than predation or
burrowing demonstrates that burrowing crabs are not as important in mediating bottom-
up and top-down interactions in the introduced range of mangrove as they are in native
mangrove forests.
The absence of a burrowing predator effect on Hawaiian mangroves or removals
may be due to differences in crab community structure. In native mangrove forests,
mangrove crabs (mainly Uca spp. and Sesarmidae spp.) are community dominants and
highly active: the majority of the benthic biomass is composed of mangrove crabs, and
they behave as “shredders” which cut up leaves and create more available surface area for
microbes to colonize. Water flow through their burrows can be as high as 10 mm s-1 and
replace up to 40% of the burrow volume during a tidal cycle (Hollins et al. 2009; Wolff et
al. 2000). This flow is thought to be an efficient vector for transporting O2 and nutrients
into mangrove sediments. Burrowing fauna in native mangrove have a strong positive
effect on meiofaunal abundances, with higher abundances near burrows than far away
(Dittmann 1996). The most abundant crab found here, T. crenata, inhabits burrows which
are not as deep or extensive as sesarmid burrows (Gillikin 2000). Even if similar

22!
processes occur in Hawaiian mangroves, burrows may be shallower and play a less
important role in turnover of organic matter and other “bottom up” processes.
Post-removal assessment of this management strategy indicates that removal is
returning some community characteristics to a pre-invasion state (high abundances of
suspension feeding polychaetes, lower belowground mangrove biomass). The uniform
distribution of burrowing crabs across sites, slow rates of change in infaunal
communities, lack of top-down control on infaunal communities, and slow decomposition
rate of sedimentary mangrove biomass found here suggest that changes in community
structure will continue to occur slowly, and more likely as a result of bottom-up than top-
down processes.
23!
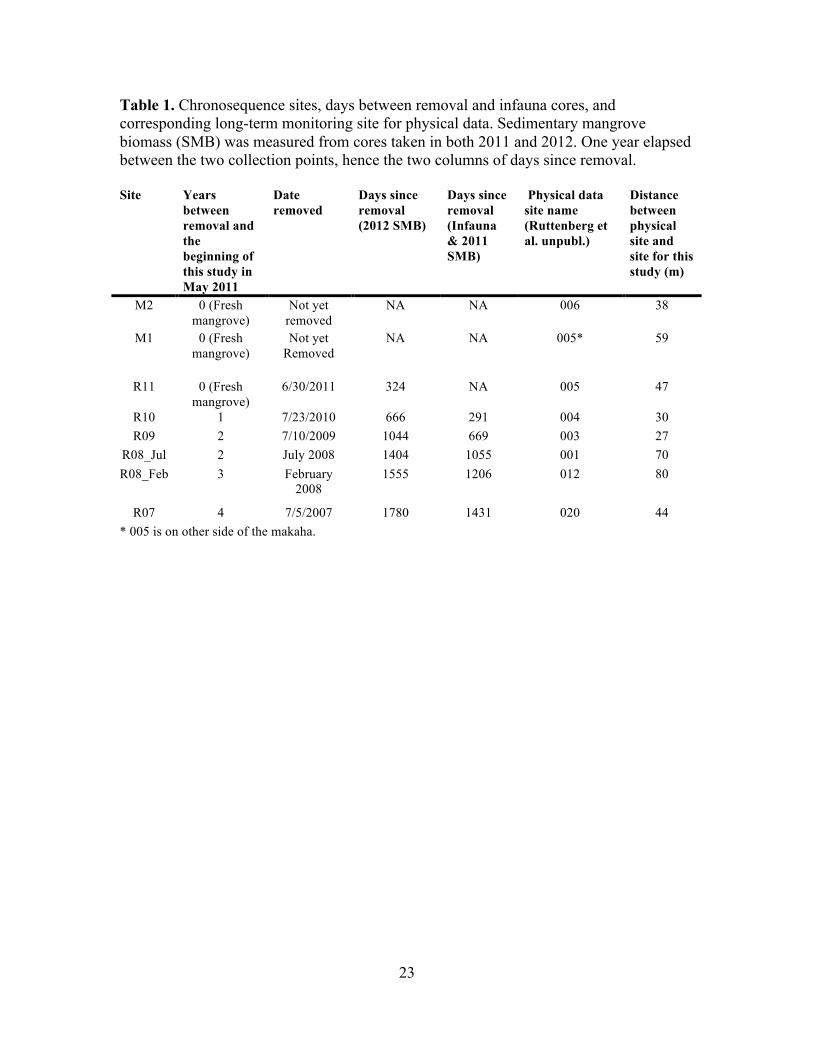
Table 1. Chronosequence sites, days between removal and infauna cores, and corresponding long-term monitoring site for physical data. Sedimentary mangrove biomass (SMB) was measured from cores taken in both 2011 and 2012. One year elapsed between the two collection points, hence the two columns of days since removal. Site Years
between removal and the beginning of this study in May 2011
Date removed
Days since removal (2012 SMB)
Days since removal (Infauna & 2011 SMB)
Physical data site name (Ruttenberg et al. unpubl.)
Distance between physical site and site for this study (m)
M2 0 (Fresh mangrove)
Not yet removed
NA NA 006 38
M1 0 (Fresh mangrove)
Not yet Removed
NA NA 005* 59
R11 0 (Fresh mangrove)
6/30/2011 324 NA 005 47
R10 1 7/23/2010 666 291 004 30 R09 2 7/10/2009 1044 669 003 27
R08_Jul 2 July 2008 1404 1055 001 70 R08_Feb 3 February
2008 1555 1206 012 80
R07 4 7/5/2007 1780 1431 020 44 * 005 is on other side of the makaha.
24!
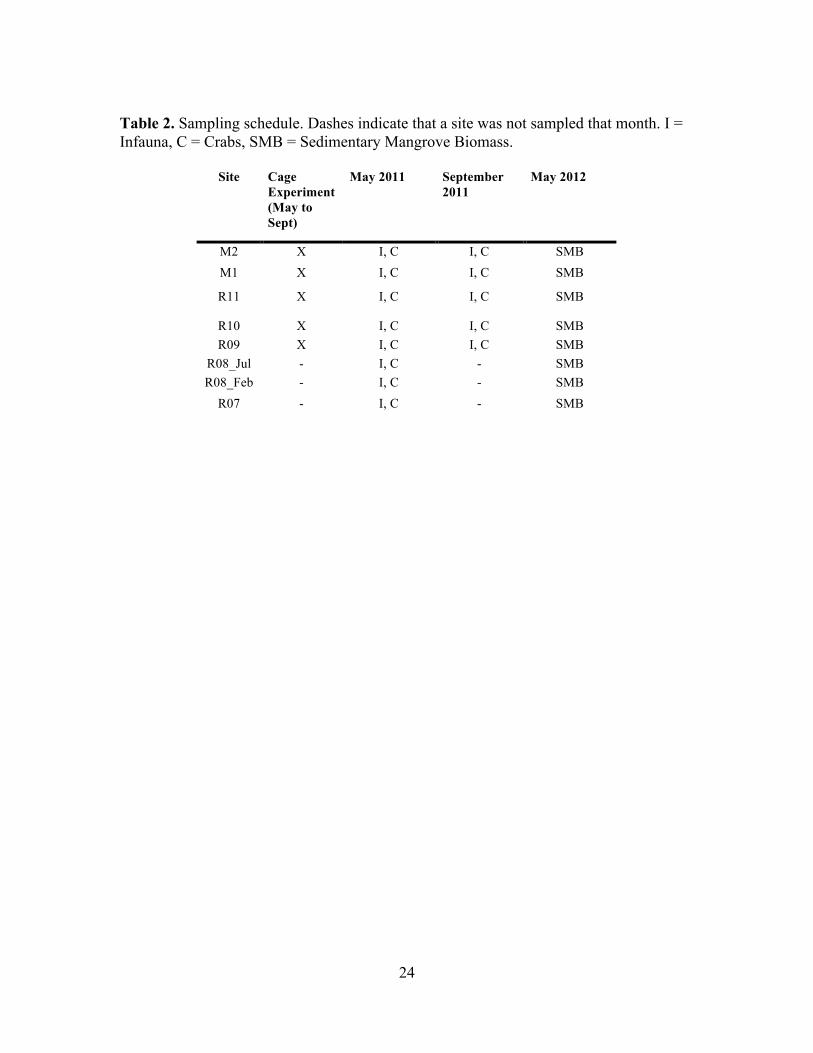
Table 2. Sampling schedule. Dashes indicate that a site was not sampled that month. I = Infauna, C = Crabs, SMB = Sedimentary Mangrove Biomass.
Site Cage Experiment (May to Sept)
May 2011 September 2011
May 2012
M2 X I, C I, C SMB
M1 X I, C I, C! SMB!R11 X I, C I, C! SMB!R10 X I, C I, C! SMB!R09 X I, C I, C! SMB!
R08_Jul - I, C - SMB!R08_Feb - I, C - SMB!
R07 - I, C - SMB!
25!
Table 3. Feeding and domicile groups used in this study. SF = suspension feeder, ssdf = sub-surface deposit feeder, sdf = surface deposit feeder, omni = omnivore, carni = carnivore, tdw = tube-dweller, ntdw = non-tube-dweller, b = burrowing, nb = non-burrowing, n = native, c = cryptogenic, u = unknown biogeostatus. Asterisks (*) indicate taxa not found by Demopoulos (2004). “Mixed” groups are taxa whose members belong to more than one trophic, domicile, or feeding mode.
Taxon Trophic mode Domicile Mobility Biogeostatus Spionidae sdf tdw nb Mixed Nereididae carni tdw b u Syllidae omni ntdw nb Mixed Opheliidae ssdf ntdw b c Cossuridae* ssdf ntdw b u Sternaspidae* ssdf ntdw b u Sabellariidae* SF tdw nb u Sabellidae SF tdw nb Mixed Capitellidae ssdf ntdw b Mixed Dorvillidae* sdf Unknown b u Cirratulidae sdf ntdw nb u Oligochaeta omni ntdw b Mixed Nemertea carni ntdw nb u Nematoda omni ntdw nb u Platyhelminthes carni ntdw b u Sipuncula sdf tdw nb u Ostracoda* omni ntdw b u Decapoda Mixed Mixed Mixed Mixed Amphipoda Mixed Mixed nb Mixed Isopoda omni ntdw nb Mixed Copepoda* Mixed ntdw nb u Tanaidacea omni tdw nb Mixed Hydrozoa SF ntdw nb u Anthozoa* Mixed Mixed Mixed Mixed
26!
Table 4. Grain size measured from 2012 sediment cores. Sediment grain sizes are expressed as a percentage by weight of a sediment subsample. Site Date
Removed % Silt/Clay % Sand % Rubble
M2 Not yet removed
27.76 64.73 7.52
M1 Not yet Removed
15.99 51.75 32.26
R11 6/30/2011 14.63 75.41 9.96 R10 7/23/2010 12.87 37.01 50.12 R09 7/10/2009 46.95 53.05 0.00
R08_Jul July 2008 51.07 48.93 0.00 R08_Feb February 2008 39.02 60.98 0.00
R07 7/5/2007 31.66 68.04 0.29
27!
Table 5. SIMPER results for all removal (R07, R08, R09, R10, R09) vs. all mangrove (M2, M1, R11) sites in May. Total dissimilarity = 61.28%. Species Avg
dissimilarity % Contribution to Dissimilarity
Oligochaeta 13.59 22.19 Amphipoda 11.84 19.33 Sabellidae 6.37 10.40 Nematoda 4.65 7.59 Opheliidae 3.75 6.12 Capitellidae 3.59 5.68 Sternaspidae 2.94 4.79 Syllidae 2.87 4.68 Cossuridae 2.68 4.38 Ostracoda 2.63 4.29 Spionidae 1.63 2.67

28!
Table 6. Infaunal Abundance for each taxon at each site in May. Abundances for each taxon are in units of individuals m-2, for 5 cm depth.
Site/Taxon R07 R08_Feb R08_Jul R09 R10 R11 M1 M2 Spionidae 33.67 ± 33.67 2121.21 ±
1148.37 265.15 ± 165.15 0 25.25 ± 25.25 25.25 ± 25.25 25.25 ± 25.25 67.34 ± 67.34
Nereididae 0 0 0 0 0 50.51 ± 50.51 0 0
Syllidae 134.68 ± 73.38 404.04 ± 231.44 189.39 ± 79.71 808.08 ± 733.63 277.78 ± 108.48 378.79 ± 124.41 404.04 ± 218.56 0
Opheliidae 0 336.70 ± 233.88 1439.39 ± 657.33 1077.44 ± 339.22
151.52 ± 58.98 454.55 ± 352.88 505.05 ± 342.54 269.36 ± 106.47
Cossuridae 0 0 75.76 ± 75.76 168.35 ± 134.68 0 0 0 3333.33 ± 1127.07
Sternaspidae 0 0 0 33.67 ± 33.67 0 0 1515.15 ± 468.86
202.02 ± 202.02
Sabellariidae 0 0 0 0 0 0 0 0
Sabellidae 4343.43 ± 1798.43
3333.33 ± 1679.63
3484.85 ± 1931.02
2121.21 ± 968.85
252.53 ± 110.86 277.78 ± 164.54 151.52 ± 69.78 370.37 ± 110.39
Capitellidae 67.34 ± 44.54 909.09 ± 505.05 871.21 ± 609.94 168.35 ± 134.68 151.52 ± 102.15 126.26 ± 101.87 151.52 ± 102.15 1952.86 ± 529.97
Dorvillidae 33.67 ± 33.67 0 0 0 176.77 ± 58.48 25.25 ± 25.25 0 67.34 ± 44.54
Cirratulidae 0 33.67 ± 33.67 75.76 ± 75.76 0 0 25.25 ± 25.25 0 33.67 ± 33.67
Oligochaeta 19831.65 ± 4886.51
11851.85 ± 4066.03
6401.52 ± 2387.05
2727.27 ± 1367.37
16868.69 ± 6777.33
2045.45 ± 856.39
3055.56 ± 967.99
8720.54 ± 1158.07
Nemertea 0 0 0 33.67 ± 33.67 25.25 ± 25.25 0 0 0
Nematoda 538.72 ± 206.87 1178.45 ± 503.65
492.42 ± 235.68 437.71 ± 220.79 328.28 ± 168.71 1161.62 ± 505.74
631.31 ± 215.76 1010.10 ± 422.56
Platyhelminthes 0 0 0 0 0 0 0 0
Ostracoda 6868.69 ± 4915.62
2491.58 ± 164.13
0 0 0 25.25 ± 25.25 25.25 ± 25.25 33.67 ± 33.67
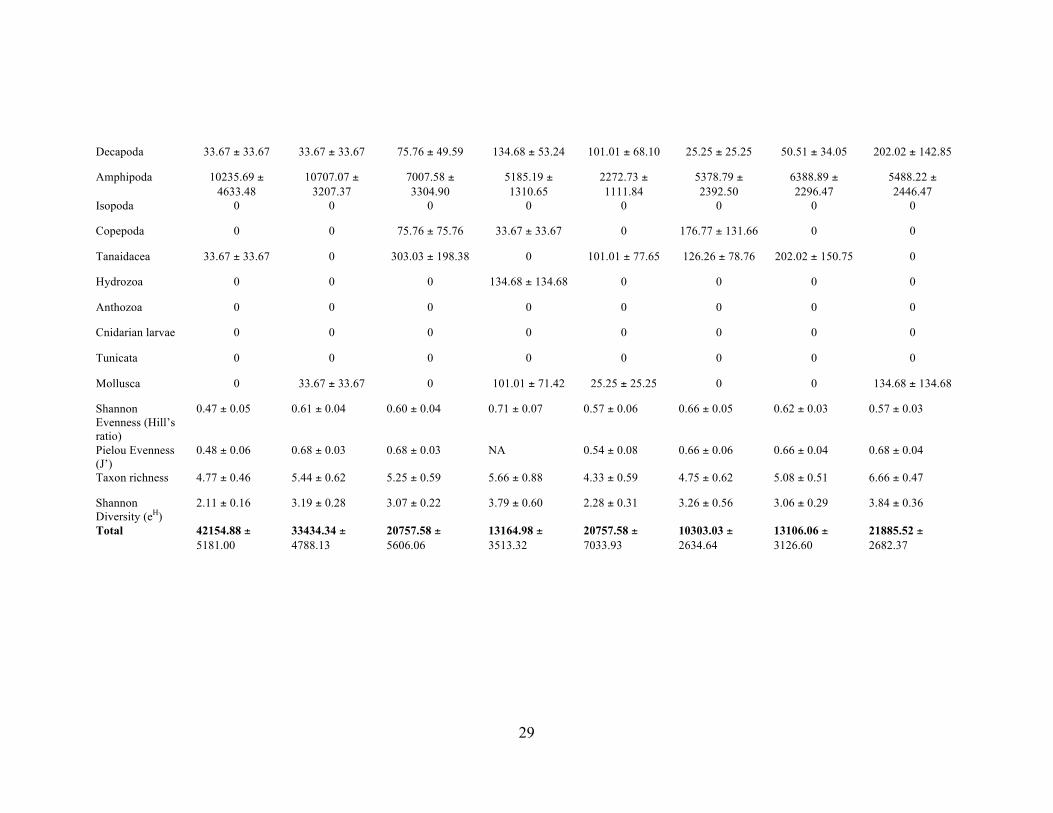
29!
Decapoda 33.67 ± 33.67 33.67 ± 33.67 75.76 ± 49.59 134.68 ± 53.24 101.01 ± 68.10 25.25 ± 25.25 50.51 ± 34.05 202.02 ± 142.85
Amphipoda 10235.69 ± 4633.48
10707.07 ± 3207.37
7007.58 ± 3304.90
5185.19 ± 1310.65
2272.73 ± 1111.84
5378.79 ± 2392.50
6388.89 ± 2296.47
5488.22 ± 2446.47
Isopoda 0 0 0 0 0 0 0 0
Copepoda 0 0 75.76 ± 75.76 33.67 ± 33.67 0 176.77 ± 131.66 0 0
Tanaidacea 33.67 ± 33.67 0 303.03 ± 198.38 0 101.01 ± 77.65 126.26 ± 78.76 202.02 ± 150.75 0
Hydrozoa 0 0 0 134.68 ± 134.68 0 0 0 0
Anthozoa 0 0 0 0 0 0 0 0
Cnidarian larvae 0 0 0 0 0 0 0 0
Tunicata 0 0 0 0 0 0 0 0
Mollusca 0 33.67 ± 33.67 0 101.01 ± 71.42 25.25 ± 25.25 0 0 134.68 ± 134.68
Shannon Evenness (Hill’s ratio)
0.47 ± 0.05 0.61 ± 0.04 0.60 ± 0.04 0.71 ± 0.07 0.57 ± 0.06 0.66 ± 0.05 0.62 ± 0.03 0.57 ± 0.03
Pielou Evenness (J’)
0.48 ± 0.06 0.68 ± 0.03 0.68 ± 0.03 NA 0.54 ± 0.08 0.66 ± 0.06 0.66 ± 0.04 0.68 ± 0.04
Taxon richness 4.77 ± 0.46 5.44 ± 0.62 5.25 ± 0.59 5.66 ± 0.88 4.33 ± 0.59 4.75 ± 0.62 5.08 ± 0.51 6.66 ± 0.47
Shannon Diversity (eH)
2.11 ± 0.16 3.19 ± 0.28 3.07 ± 0.22 3.79 ± 0.60 2.28 ± 0.31 3.26 ± 0.56 3.06 ± 0.29 3.84 ± 0.36
Total 42154.88 ± 5181.00
33434.34 ± 4788.13
20757.58 ± 5606.06
13164.98 ± 3513.32
20757.58 ± 7033.93
10303.03 ± 2634.64
13106.06 ± 3126.60
21885.52 ± 2682.37
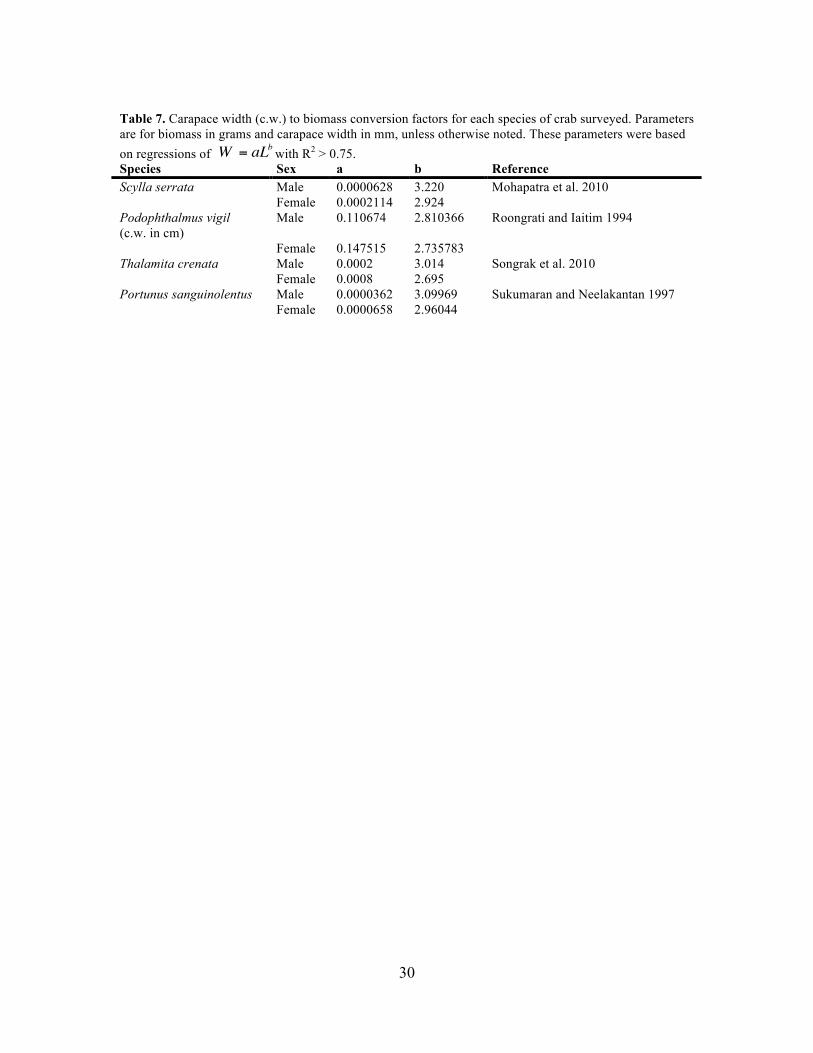
30!
Table 7. Carapace width (c.w.) to biomass conversion factors for each species of crab surveyed. Parameters are for biomass in grams and carapace width in mm, unless otherwise noted. These parameters were based on regressions of with R2 > 0.75. Species Sex a b Reference Scylla serrata Male 0.0000628 3.220 Mohapatra et al. 2010 Female 0.0002114 2.924 Podophthalmus vigil (c.w. in cm)
Male 0.110674 2.810366 Roongrati and Iaitim 1994
Female 0.147515 2.735783 Thalamita crenata Male 0.0002 3.014 Songrak et al. 2010 Female 0.0008 2.695 Portunus sanguinolentus Male 0.0000362 3.09969 Sukumaran and Neelakantan 1997 Female 0.0000658 2.96044

31!
Table 8. Biomass of crabs caught at each study site during the sampling months.
Time Site Species N Biomass (g)
St dev
St error
95% CI
May M1 Scylla serrata 1 1611.67 - - - M1 Thalamita crenata 11 36.32 13.08 3.94 8.79 M2 T. crenata 13 37.33 14.70 4.08 8.88
R09 Portunus
sanguinolentus 1 129.20 - - - R09 T. crenata 17 40.42 16.29 3.95 8.38 R10 T. crenata 14 35.88 13.90 3.71 8.02 R11 T. crenata 10 42.16 15.84 5.01 11.33 September M1 P. sanguinolentus 1 200.09 - - - M1 Podophthalmus vigil 2 82.15 2.95 2.09 26.53 M1 T. crenata 14 44.11 13.17 3.52 7.60 M2 P. sanguinolentus 2 94.53 17.89 12.65 160.71 M2 P. vigil 8 72.85 22.13 7.83 18.50 M2 S. serrata 1 709.30 - - - M2 T. crenata 34 47.76 16.78 2.88 5.85 R09 P. vigil 1 53.86 - - - R09 T. crenata 8 35.13 12.12 4.28 10.13 R10 P. vigil 1 59.09 - - - R10 S. serrata 1 2527.69 - - - R10 T. crenata 13 39.52 21.15 5.87 12.78
R11 S. serrata 2 899.98 828.0
4 585.51 7439.6
5 R11 T. crenata 18 43.52 16.64 3.92 8.28
32!
!Figure 1. Map of study sites. The red line indicates where mangrove was at the beginning of the study. R. mangle used to grow around the entire pond (purple line; Chimner 2006).
R07
Ocean break
OM 2
July 2008
2006-2007
Projected 2012-2014
June 2011
July 2010
July 2009
July 2007
Feb 2008
Existing mangrove
Mangrove removal sites
M2M1
R09
R10
R11
R08_Jul
R08_FebOriginal extent of mangrove
0 200 m
33!
!Figure 2. Mean (± 1 SE) temperature (˚C), salinity, turbidity (NTU), pH, chlorophyll a (!g/ml), and dissolved oxygen (% Sat.) at each of the study sites measured over the course of the experiment. All physical variables are averaged over the bottom 25 cm of the water column. !!!
0
20
40
60
80
100
120
Previously Removed Existing Mangrove
R07 R08_Feb R08_Jul R09 R10 R11, M1 M2Site
Phy
sica
l Var
iabl
e
Physical variableTemperature
Salinity
Turbidity (NTU)
pH
Chlorophyll a (!g/ml)
Dissolved Oxygen (DO)
34!
!Figure 3. Grain size at each of the study sites, measured in 2012. Rubble weights were excluded from this figure, so this chart shows only proportional contributions of silt/clay and sand.
M1 M2 R07 R08_Feb R08_Jul R09 R10 R11
1 Grain Typesilt.clay
sand
35!
Figure 4. Sedimentary mangrove biomass measured in 2012 vs. days since removal. Biomass measured in previous studies is in red and blue. The line represents model predictions for the exponential decay model.
0 500 1000 1500 2000
0500
1000
1500
2000
2500
Days Since Removal
Sed
imen
tary
Man
grov
e B
iom
ass
(g d
w m
!2)
This study (coll. 2012)
Sweetman 2010 Pearl HarborSweetman 2010 Kaneohe Bay

36!
!!!Figure 5. Log(total infaunal abundance/core + 1) vs. days since removal, with linear regression in green. The model for this regression is
!
log(A +1) = 7.32 "10#4 (DSR) + 3.491, where A is abundance and DSR is days since removal.
0 200 400 600 800 1000 1200 1400
23
45
Days Since Removal
log(
Abu
ndan
ce (i
nd./c
ore)
+1)
Total Abundance
Linear regression
37!
!Figure 6. MDS plot of all sites in May included in the chronosequence.
38!
!Figure 7. Components of infauna at each site by feeding guild. Heights of each bar represent total abundance (summed across all cores) at a site. !!
0e+00
1e+05
2e+05
3e+05
4e+05 Previously RemovedExisting Mangrove
M2 M1 R11 R10 R09 R08_Jul R08_Feb R07Site
Tota
l Inf
auna
l Abu
ndan
ce Feeding.Group
Carnivores
Mixed
Omnivores
Sub-surface Deposit Feeders
Surface Deposit Feeders
Suspension Feeders

39!
!Figure 8. Linear regressions for suspension feeders and ominvores, with linear regression models in green. The equation for suspension feeder population growth is
!
log(SF +1) =1.09 "10#3(DSR) + 0.398 and the equation for omnivore abundance is
!
log(OMNI +1) = 8.295 "10#4 (DSR) + 2.498 .
0 200 400 600 800 1200
01
23
4
Suspension Feeder Abundance
Days Since Removal (DSR)
log(
Abu
ndan
ce (i
nd/c
ore)
+1)
0 200 400 600 800 1200
01
23
45
Omnivore Abundance
DSR
log(
Abu
ndan
ce (i
nd/c
ore)
+1)
40!
Figure 9. Total infauna at each site by domicile guild. Heights of each bar represent total abundance at a site in May (summed across all cores).
0e+00
1e+05
2e+05
3e+05
4e+05 Previously RemovedExisting Mangrove
M2 M1 R11 R10 R09 R08_JulR08_Feb R07Site
Tota
l Inf
auna
l Abu
ndan
ce
Domicile.Group
Mixed
Non-tube-dwelling
Tube-dweller
Unknown
41!
!Figure 10. Total infauna at each site by mobility guild. Heights of each bar represent total abundance at a site in May (summed across all cores).
0e+00
1e+05
2e+05
3e+05
4e+05 Previously RemovedExisting Mangrove
M2 M1 R11 R10 R09 R08_Jul R08_Feb R07Site
Tota
l Inf
auna
l Abu
ndan
ce
Burrowing.Group
b
nb

42!
!
!Figure 11. MDS plot showing all experimental mangrove and removal sites in May. Red sites are intact mangrove.
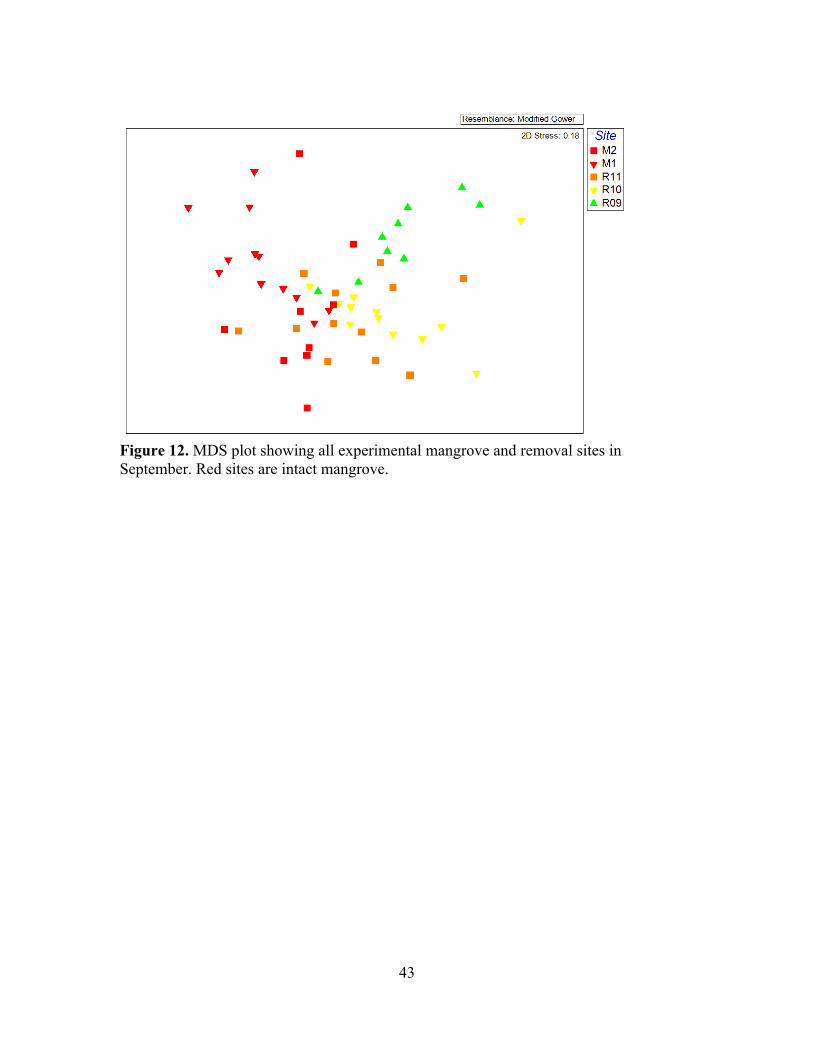
43!
!
!Figure 12. MDS plot showing all experimental mangrove and removal sites in September. Red sites are intact mangrove.

44!
!Figure 13. Crab catch per unit effort (CPUE) (±1 SE) at each of the cage experiment sites in May and September. Average densities are higher at the removal sites but not significantly so.
0
2
4
6
M1 M2 R09 R10 R11Site
CP
UE
(# c
augh
t/tra
p/da
y)
TimeMAY
SEPT
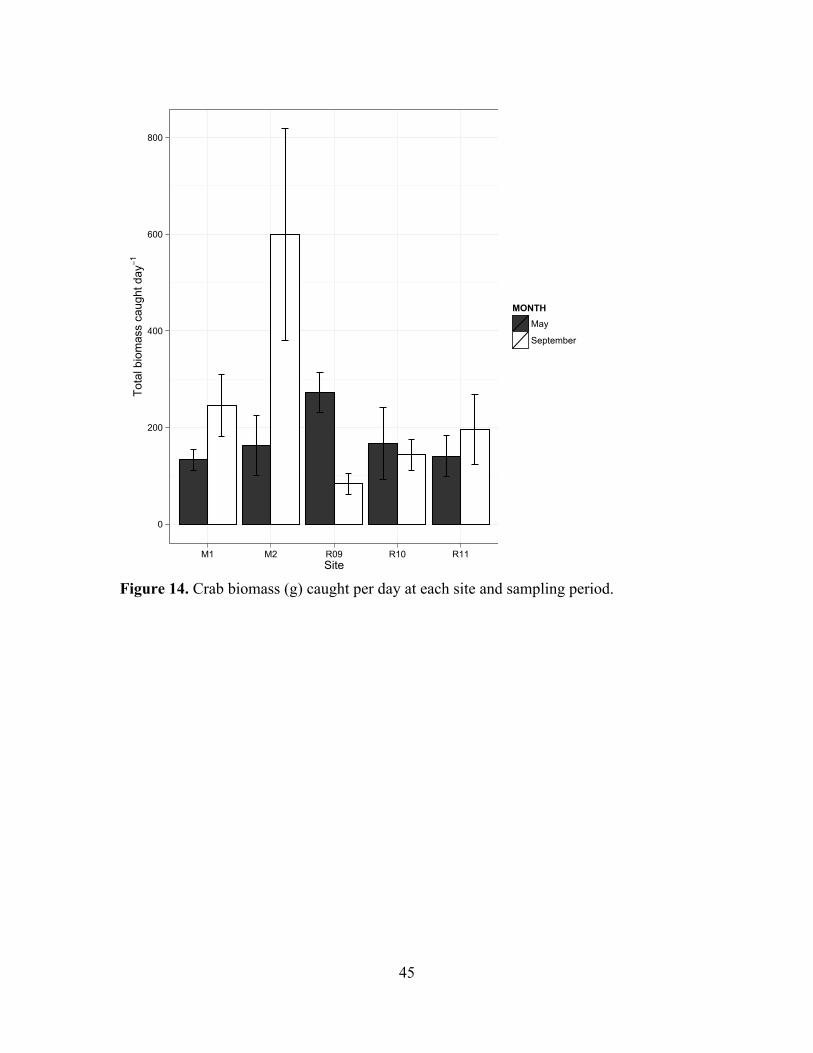
45!
!Figure 14. Crab biomass (g) caught per day at each site and sampling period.
!
0
200
400
600
800
M1 M2 R09 R10 R11Site
Tota
l bio
mas
s ca
ught
day
!1
MONTHMay
September
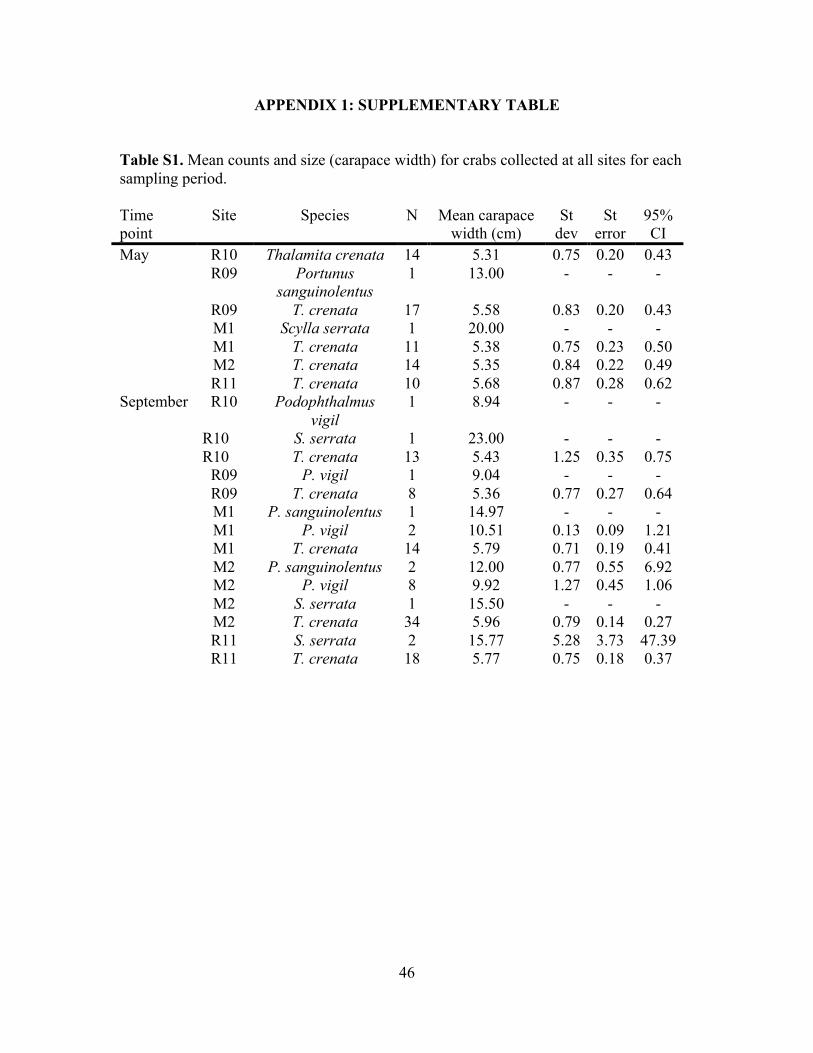
46!
APPENDIX 1: SUPPLEMENTARY TABLE Table S1. Mean counts and size (carapace width) for crabs collected at all sites for each sampling period. Time point
Site Species N Mean carapace width (cm)
St dev
St error
95% CI
May R10 Thalamita crenata 14 5.31 0.75 0.20 0.43 R09 Portunus
sanguinolentus 1 13.00 - - -
R09 T. crenata 17 5.58 0.83 0.20 0.43 M1 Scylla serrata 1 20.00 - - - M1 T. crenata 11 5.38 0.75 0.23 0.50 M2 T. crenata 14 5.35 0.84 0.22 0.49 R11 T. crenata 10 5.68 0.87 0.28 0.62 September R10 Podophthalmus
vigil 1 8.94 - - -
R10! S. serrata 1 23.00 - - - R10! T. crenata 13 5.43 1.25 0.35 0.75 R09 P. vigil 1 9.04 - - - R09 T. crenata 8 5.36 0.77 0.27 0.64 M1 P. sanguinolentus 1 14.97 - - - M1 P. vigil 2 10.51 0.13 0.09 1.21 M1 T. crenata 14 5.79 0.71 0.19 0.41 M2 P. sanguinolentus 2 12.00 0.77 0.55 6.92 M2 P. vigil 8 9.92 1.27 0.45 1.06 M2 S. serrata 1 15.50 - - - M2 T. crenata 34 5.96 0.79 0.14 0.27 R11 S. serrata 2 15.77 5.28 3.73 47.39 R11 T. crenata 18 5.77 0.75 0.18 0.37
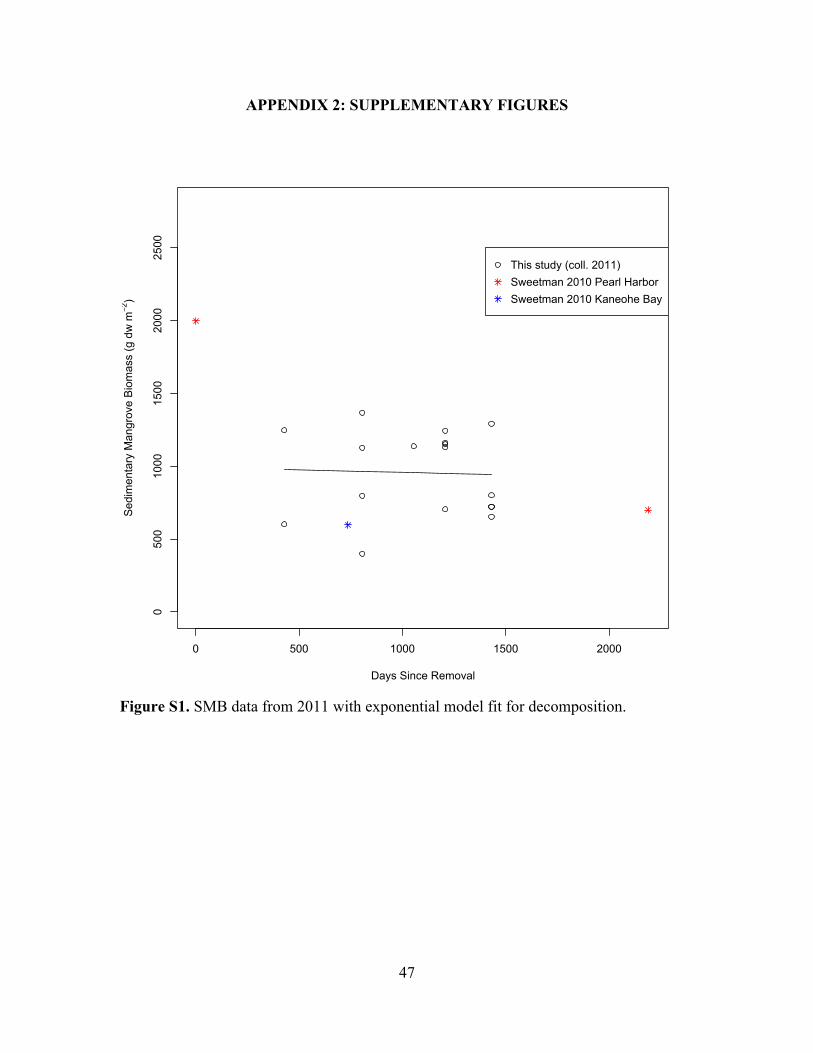
47!
APPENDIX 2: SUPPLEMENTARY FIGURES !
!Figure S1. SMB data from 2011 with exponential model fit for decomposition. !!
0 500 1000 1500 2000
0500
1000
1500
2000
2500
Days Since Removal
Sed
imen
tary
Man
grov
e B
iom
ass
(g d
w m
!2)
This study (coll. 2011)Sweetman 2010 Pearl HarborSweetman 2010 Kaneohe Bay
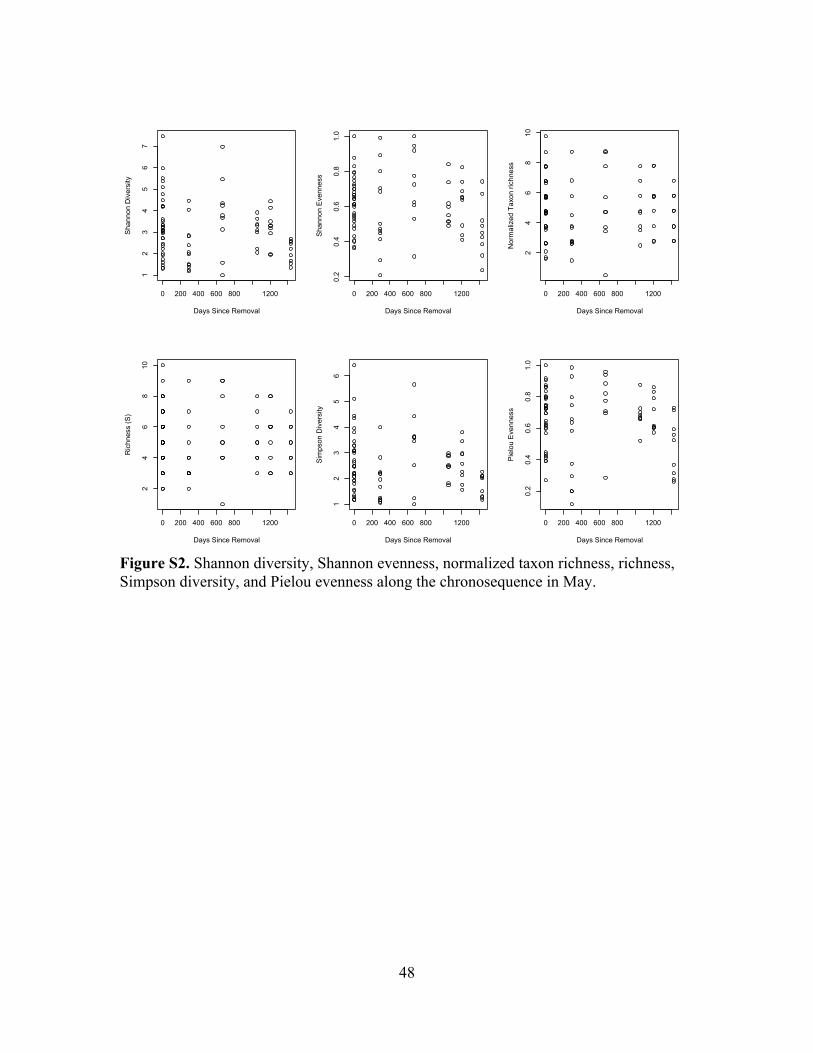
48!
!Figure S2. Shannon diversity, Shannon evenness, normalized taxon richness, richness, Simpson diversity, and Pielou evenness along the chronosequence in May. !!!!
0 200 400 600 800 1200
12
34
56
7
Days Since Removal
Sha
nnon
Div
ersi
ty
0 200 400 600 800 1200
0.2
0.4
0.6
0.8
1.0
Days Since RemovalS
hann
on E
venn
ess
0 200 400 600 800 1200
24
68
10
Days Since Removal
Nor
mal
ized
Tax
on ri
chne
ss
0 200 400 600 800 1200
24
68
10
Days Since Removal
Ric
hnes
s (S
)
0 200 400 600 800 1200
12
34
56
Days Since Removal
Sim
pson
Div
ersi
ty
0 200 400 600 800 12000.2
0.4
0.6
0.8
1.0
Days Since Removal
Pie
lou
Eve
nnes
s
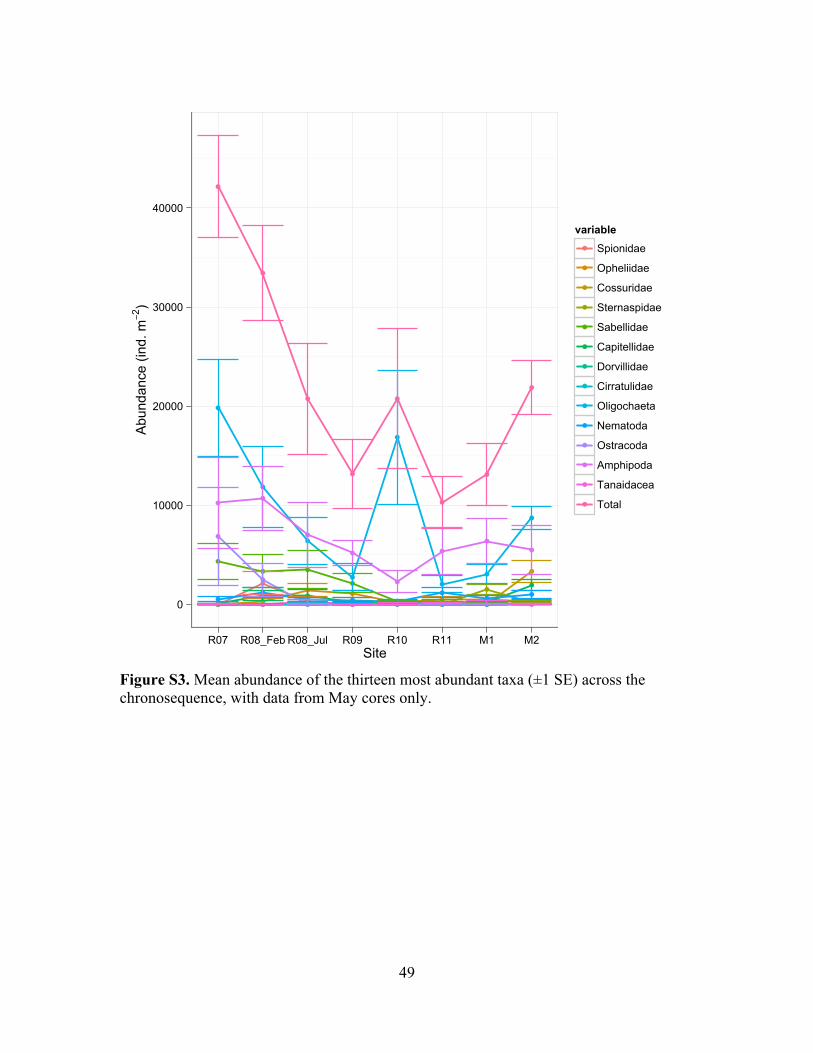
49!
!Figure S3. Mean abundance of the thirteen most abundant taxa (±1 SE) across the chronosequence, with data from May cores only.
0
10000
20000
30000
40000
R07 R08_FebR08_Jul R09 R10 R11 M1 M2Site
Abu
ndan
ce (i
nd. m
!2)
variableSpionidae
Opheliidae
Cossuridae
Sternaspidae
Sabellidae
Capitellidae
Dorvillidae
Cirratulidae
Oligochaeta
Nematoda
Ostracoda
Amphipoda
Tanaidacea
Total
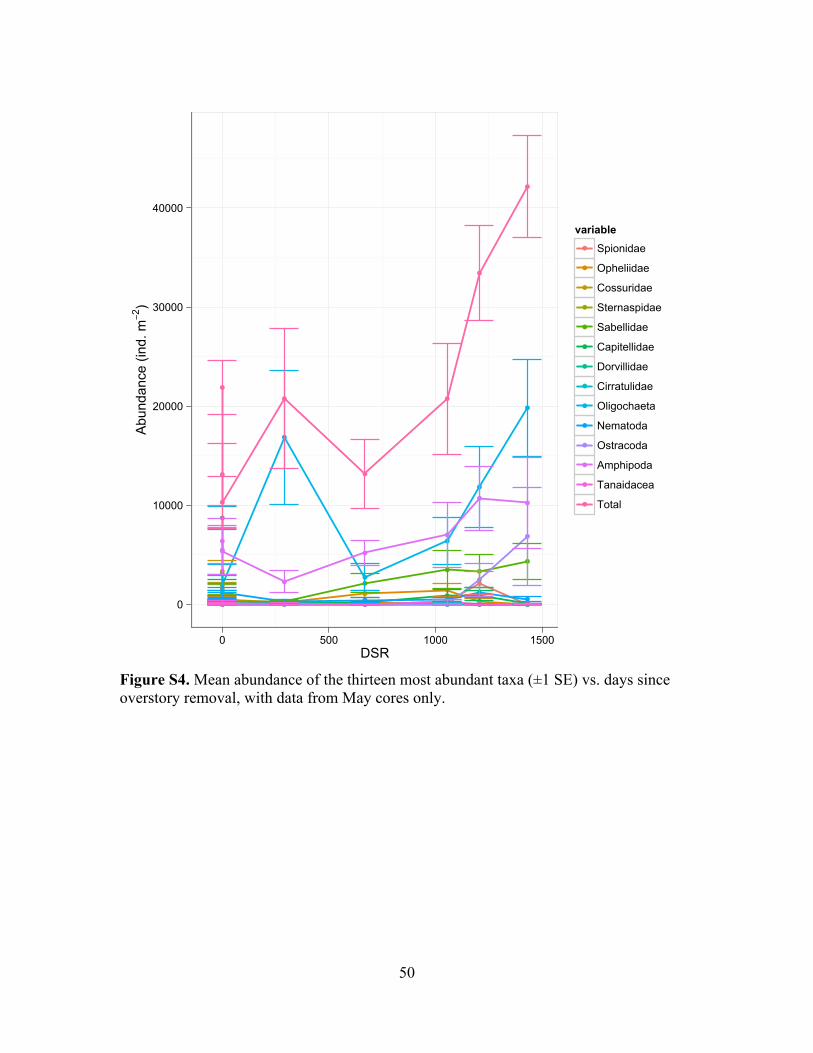
50!
!Figure S4. Mean abundance of the thirteen most abundant taxa (±1 SE) vs. days since overstory removal, with data from May cores only. !
0
10000
20000
30000
40000
0 500 1000 1500DSR
Abu
ndan
ce (i
nd. m
!2)
variableSpionidae
Opheliidae
Cossuridae
Sternaspidae
Sabellidae
Capitellidae
Dorvillidae
Cirratulidae
Oligochaeta
Nematoda
Ostracoda
Amphipoda
Tanaidacea
Total
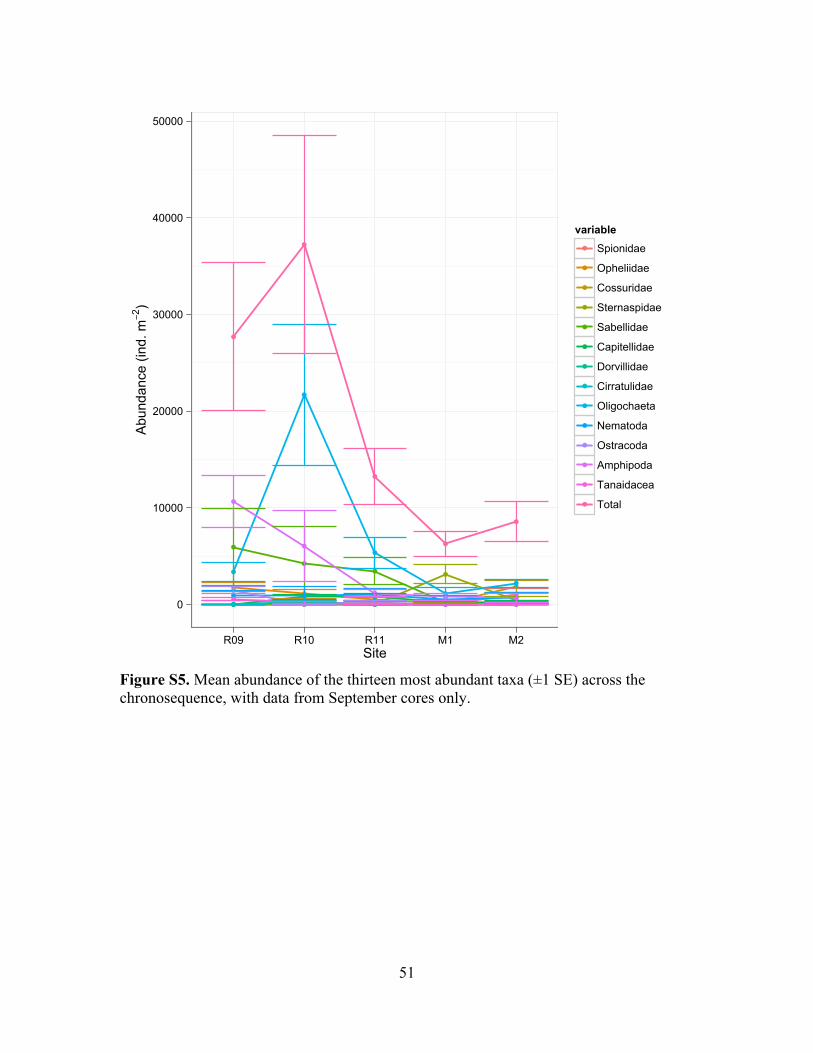
51!
!Figure S5. Mean abundance of the thirteen most abundant taxa (±1 SE) across the chronosequence, with data from September cores only. !!
0
10000
20000
30000
40000
50000
R09 R10 R11 M1 M2Site
Abu
ndan
ce (i
nd. m
!2)
variableSpionidae
Opheliidae
Cossuridae
Sternaspidae
Sabellidae
Capitellidae
Dorvillidae
Cirratulidae
Oligochaeta
Nematoda
Ostracoda
Amphipoda
Tanaidacea
Total

52!
!Figure S6. Mean abundance of the thirteen most abundant taxa (±1 SE) vs. days since removal, with data from September cores only. !!
0
10000
20000
30000
40000
50000
0 200 400 600 800DSR
Abu
ndan
ce (i
nd. m
!2)
variableSpionidae
Opheliidae
Cossuridae
Sternaspidae
Sabellidae
Capitellidae
Dorvillidae
Cirratulidae
Oligochaeta
Nematoda
Ostracoda
Amphipoda
Tanaidacea
Total
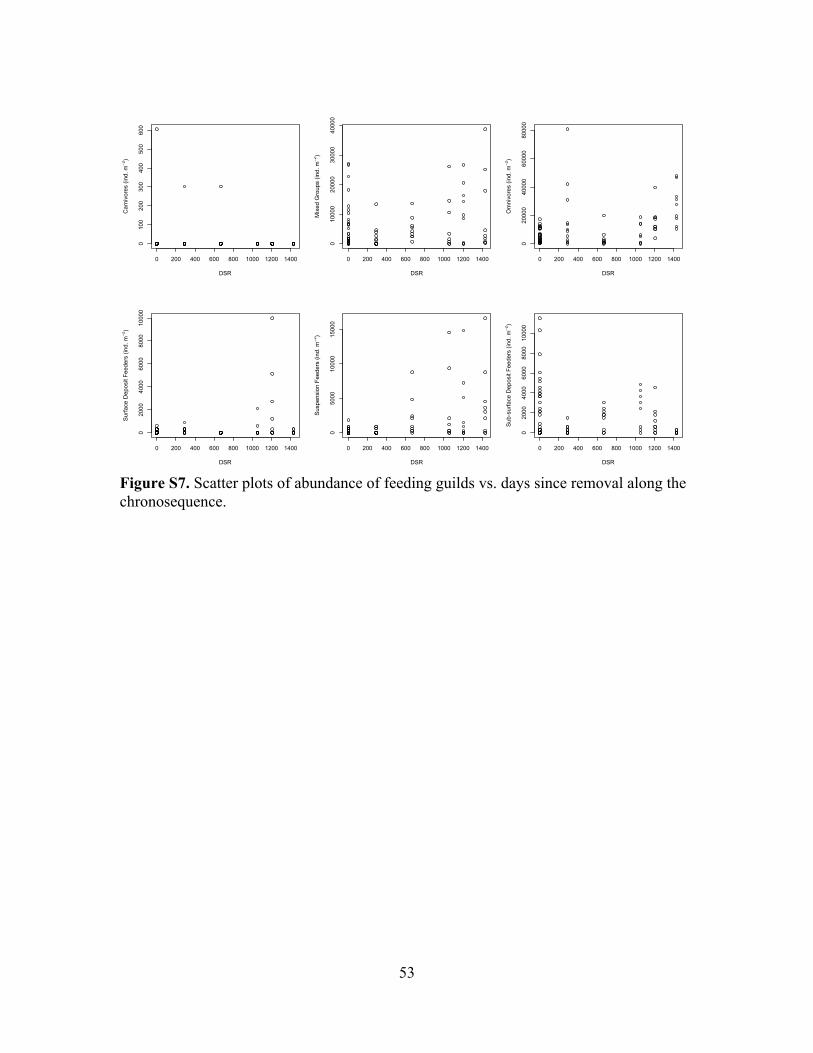
53!
Figure S7. Scatter plots of abundance of feeding guilds vs. days since removal along the chronosequence.
0 200 400 600 800 1000 1200 1400
0100
200
300
400
500
600
DSR
Car
nivo
res
(ind.
m!2)
0 200 400 600 800 1000 1200 1400
010000
20000
30000
40000
DSR
Mix
ed G
roup
s (in
d. m
!2)
0 200 400 600 800 1000 1200 1400
020000
40000
60000
80000
DSR
Om
nivo
res
(ind.
m!2)
0 200 400 600 800 1000 1200 1400
02000
4000
6000
8000
10000
DSR
Sur
face
Dep
osit
Feed
ers
(ind.
m!2)
0 200 400 600 800 1000 1200 1400
05000
10000
15000
DSR
Sus
pens
ion
Feed
ers
(ind.
m!2)
0 200 400 600 800 1000 1200 1400
02000
4000
6000
8000
10000
DSR
Sub
-sur
face
Dep
osit
Feed
ers
(ind.
m!2)
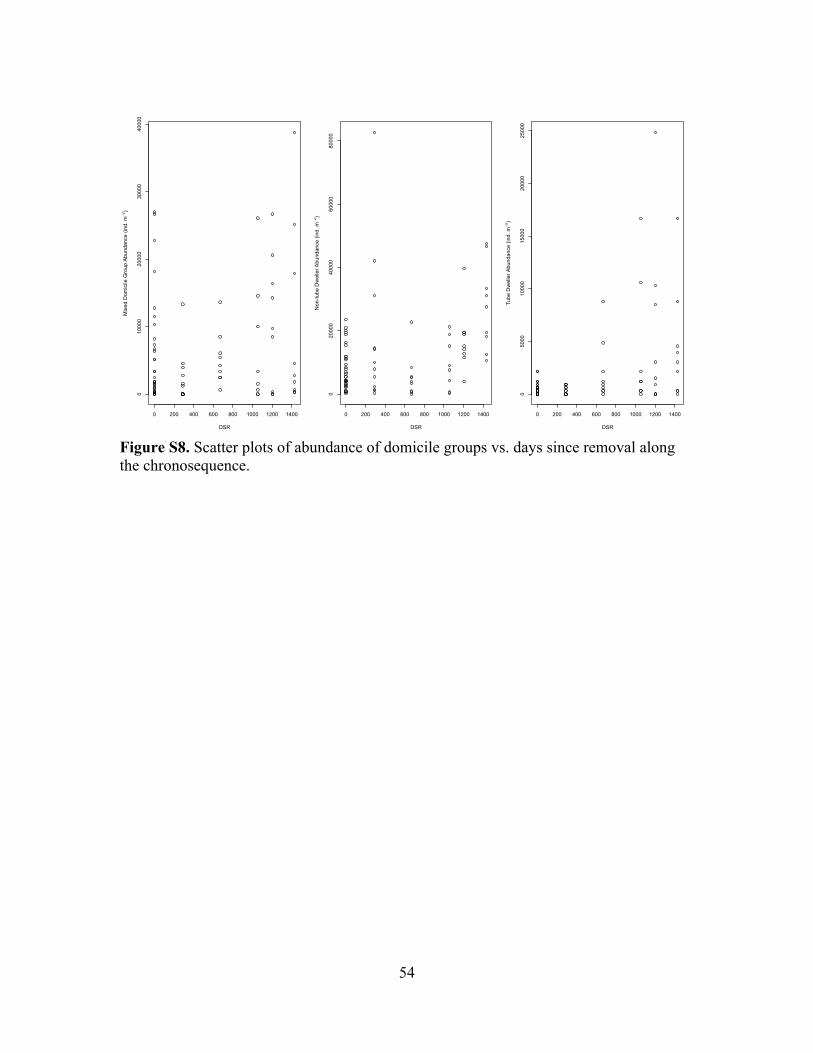
54!
!Figure S8. Scatter plots of abundance of domicile groups vs. days since removal along the chronosequence. !!
0 200 400 600 800 1000 1200 1400
010000
20000
30000
40000
DSR
Mix
ed D
omic
ile G
roup
Abu
ndan
ce (i
nd. m
!2)
0 200 400 600 800 1000 1200 1400
020000
40000
60000
80000
DSR
Non
-tube
Dw
elle
r Abu
ndan
ce (i
nd. m
!2)
0 200 400 600 800 1000 1200 1400
05000
10000
15000
20000
25000
DSR
Tube
Dw
elle
r Abu
ndan
ce (i
nd. m
!2)

55!
!Figure S9. Scatter plots of abundance of burrowers and non-burrows vs. days since removal along the chronosequence. !!
0 200 400 600 800 1000 1400
020000
40000
60000
80000
DSR
Bur
row
er A
bund
ance
(ind
. m!2)
0 200 400 600 800 1000 1400
010000
20000
30000
40000
DSR
Non
-bur
row
er A
bund
ance
(ind
. m!2)
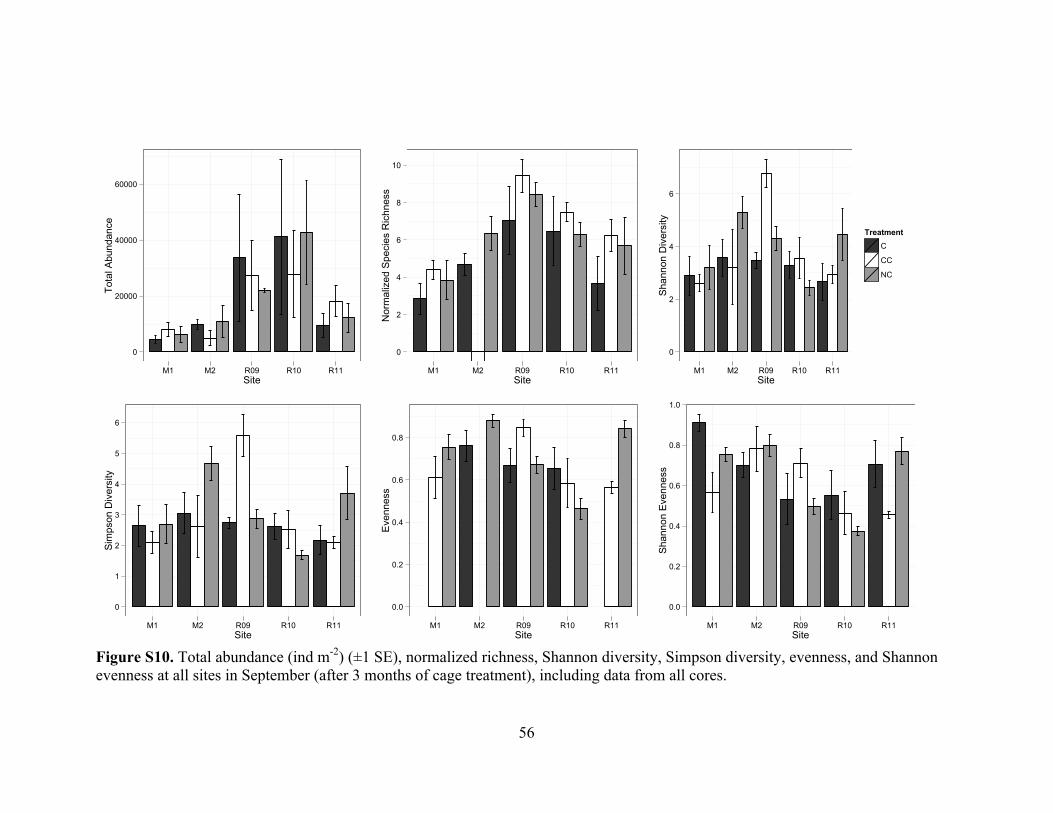
56!
!
Figure S10. Total abundance (ind m-2) (±1 SE), normalized richness, Shannon diversity, Simpson diversity, evenness, and Shannon evenness at all sites in September (after 3 months of cage treatment), including data from all cores.
0
20000
40000
60000
M1 M2 R09 R10 R11Site
Tota
l Abu
ndan
ce
0
2
4
6
8
10
M1 M2 R09 R10 R11Site
Nor
mal
ized
Spe
cies
Ric
hnes
s
0
2
4
6
M1 M2 R09 R10 R11Site
Sha
nnon
Div
ersi
ty
TreatmentC
CC
NC
0
1
2
3
4
5
6
M1 M2 R09 R10 R11Site
Sim
pson
Div
ersi
ty
0.0
0.2
0.4
0.6
0.8
M1 M2 R09 R10 R11Site
Evenness
0.0
0.2
0.4
0.6
0.8
1.0
M1 M2 R09 R10 R11Site
Sha
nnon
Eve
nnes
s
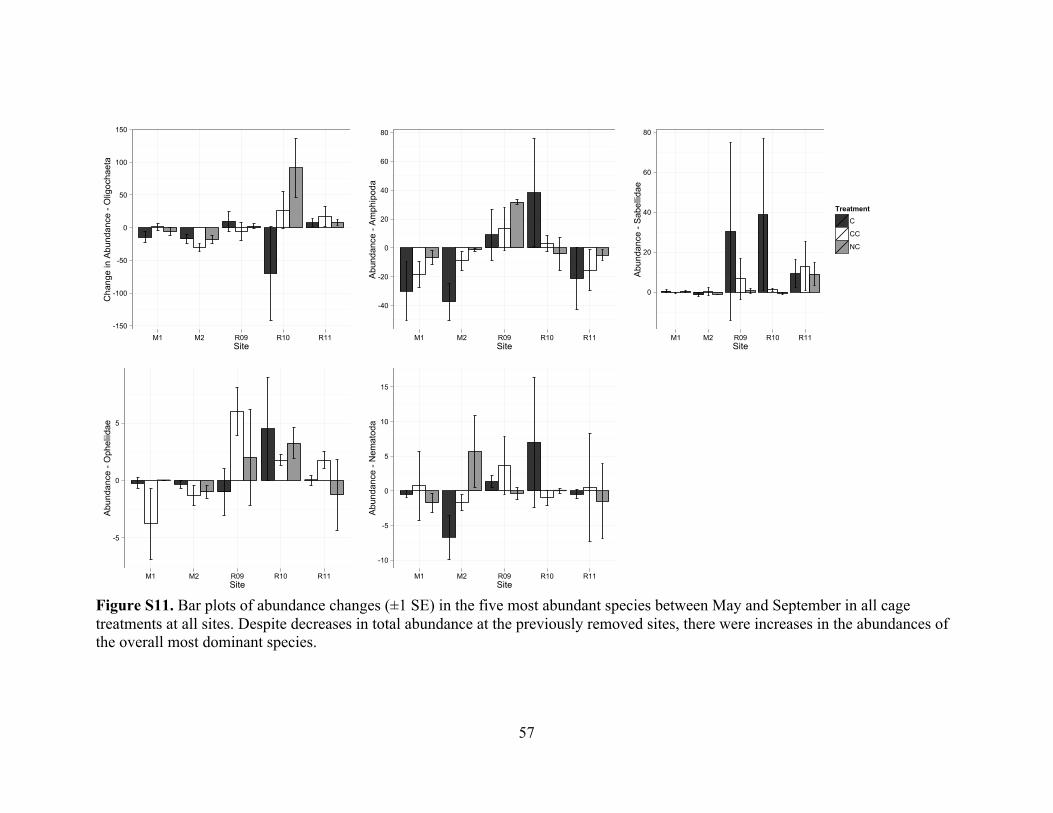
57!
Figure S11. Bar plots of abundance changes (±1 SE) in the five most abundant species between May and September in all cage treatments at all sites. Despite decreases in total abundance at the previously removed sites, there were increases in the abundances of the overall most dominant species.
-150
-100
-50
0
50
100
150
M1 M2 R09 R10 R11Site
Cha
nge
in A
bund
ance
- O
ligoc
haet
a
-40
-20
0
20
40
60
80
M1 M2 R09 R10 R11Site
Abu
ndan
ce -
Am
phip
oda
0
20
40
60
80
M1 M2 R09 R10 R11Site
Abu
ndan
ce -
Sab
ellid
ae
TreatmentC
CC
NC
-5
0
5
M1 M2 R09 R10 R11Site
Abu
ndan
ce -
Oph
eliid
ae
-10
-5
0
5
10
15
M1 M2 R09 R10 R11Site
Abu
ndan
ce -
Nem
atod
a
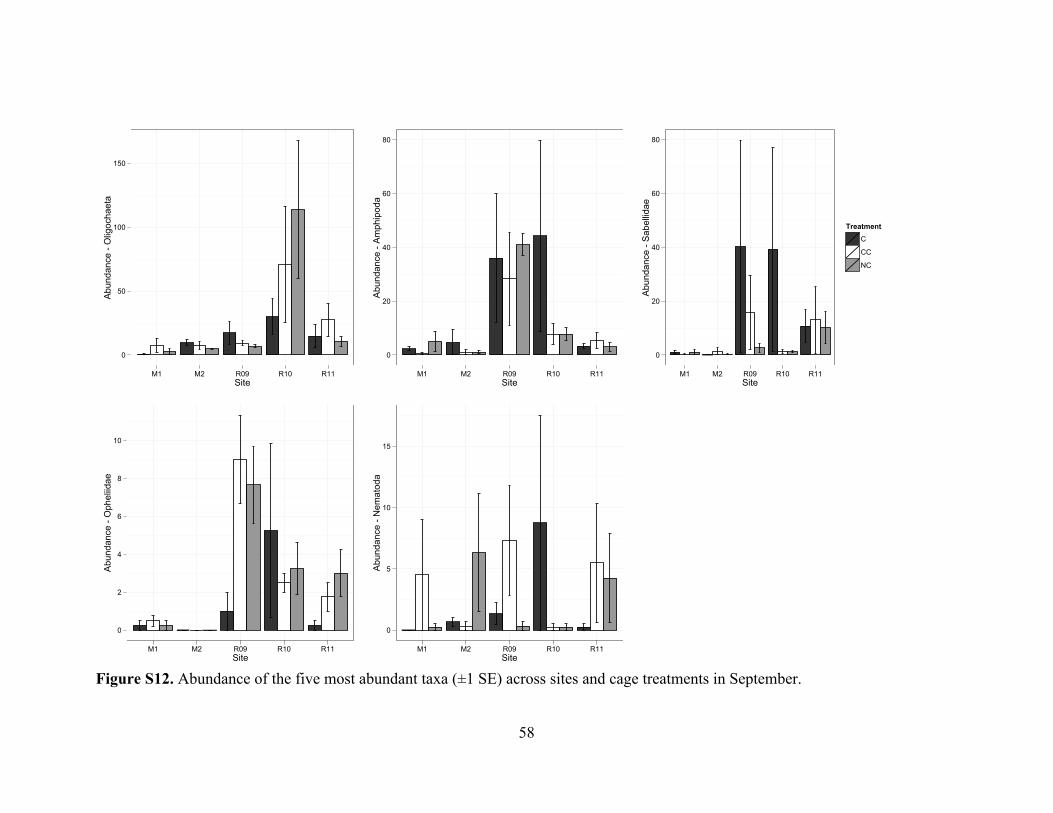
58!
Figure S12. Abundance of the five most abundant taxa (±1 SE) across sites and cage treatments in September.
0
50
100
150
M1 M2 R09 R10 R11Site
Abu
ndan
ce -
Olig
ocha
eta
0
20
40
60
80
M1 M2 R09 R10 R11Site
Abu
ndan
ce -
Am
phip
oda
0
20
40
60
80
M1 M2 R09 R10 R11Site
Abu
ndan
ce -
Sab
ellid
ae
TreatmentC
CC
NC
0
2
4
6
8
10
M1 M2 R09 R10 R11Site
Abu
ndan
ce -
Oph
eliid
ae
0
5
10
15
M1 M2 R09 R10 R11Site
Abu
ndan
ce -
Nem
atod
a
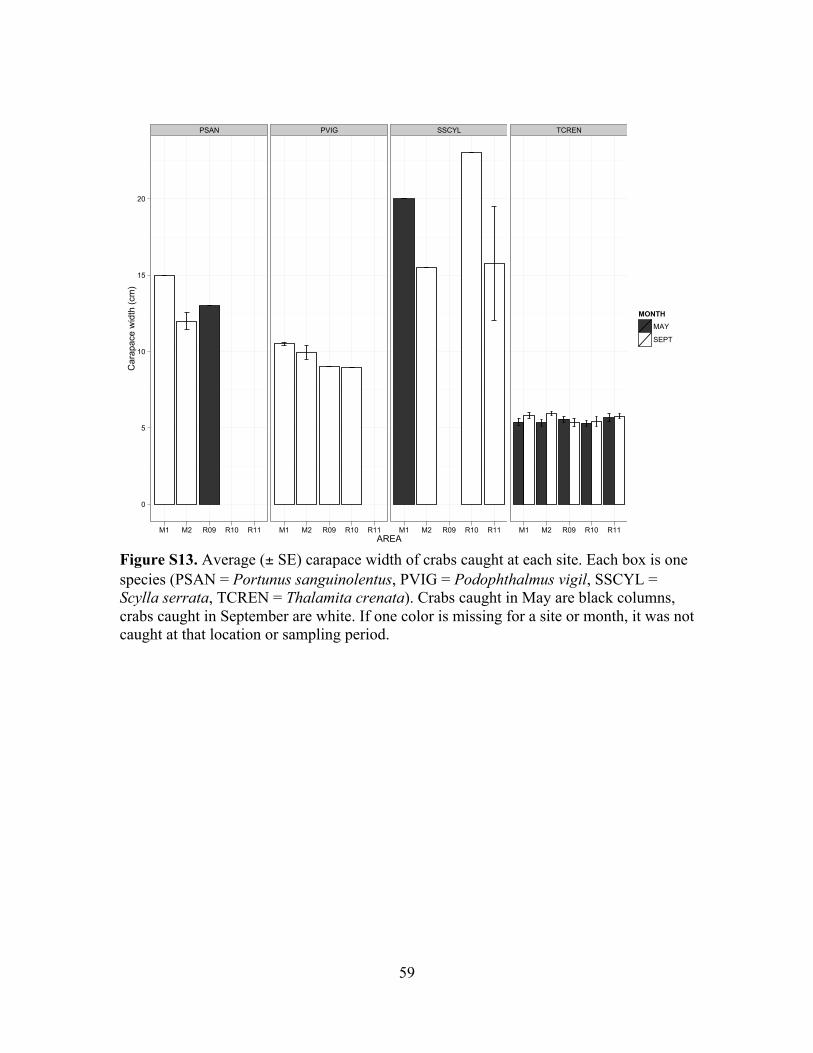
59!
!Figure S13. Average (± SE) carapace width of crabs caught at each site. Each box is one species (PSAN = Portunus sanguinolentus, PVIG = Podophthalmus vigil, SSCYL = Scylla serrata, TCREN = Thalamita crenata). Crabs caught in May are black columns, crabs caught in September are white. If one color is missing for a site or month, it was not caught at that location or sampling period. !
PSAN PVIG SSCYL TCREN
0
5
10
15
20
M1 M2 R09 R10 R11 M1 M2 R09 R10 R11 M1 M2 R09 R10 R11 M1 M2 R09 R10 R11AREA
Car
apac
e w
idth
(cm
)
MONTHMAY
SEPT

!
! 60!
REFERENCES
Acosta CA, Butler MJ (1997) Role of mangrove habitat as a nursery for juvenile spiny lobster, Panulirus argus, in Belize. Marine and Freshwater Research 48:721-727
Allen J (1992) Farming in Hawai‘i from Colonization to Contact. New Zealand Journal of Archaeology 14:45-66
Allen JA (1998) Mangroves as Alien Species: The Case of Hawai‘i. Global Ecology and Biogeographical Letters 7:61-71
Alongi DM (2009) The Energetics of Mangrove Forests. Springer, Brienigsville, PA Anderson MJ (2001a) A new method for non-parametric multivariate analysis of
variance. Austral Ecology 26:32-46 Anderson MJ (2001b) Permutation tests for univariate or multivariate analysis of
variance and regression. Canadian Journal of Fisheries and Aquatic Sciences 58:626-639
Anderson MJ (2005) PERMANOVA: a FORTRAN computer program for permutational multivariate analysis of variance. Department of Statistics, University of Auckland, New Zealand
Anderson MJ, Ellingsen KE, McArdle BH (2006) Multivariate dispersion as a measure of beta diversity. Ecology Letters 9:683-693
Barnes RD (1980) Invertebrate Zoology, Philadelphia Brown SS, Gaston GR, Rakocinski CF, Heard RW (2000) Effects of sediment
contaminants and environmental gradients on macrobenthic community trophic structure in Gulf of Mexico estuaries. Estuaries 23:411-424
Cannicci S, Dahdouh-Guebas F, Anyona D, Vannini M (1996) Natural diet and feeding habits of Thalamita crenata (Decapoda: Portunidae). Journal of Crustacean Biology 16:678-683
Chimner RA, Fry B, Kaneshiro MY, Cormier N (2006) Current extent and historical expansion of introduced mangroves on O'ahu, Hawai‘i. Pacific Science 60:377-383
Clark MW, McConchie D, Lewis DW, Saenger P (1998) Redox stratification and heavy metal partitioning in Avicennia-dominated mangrove sediments: a geochemical model. Chemical Geology 149:147-171
Clarke KR (1993) Nonparametric multivariate analyses of changes in community structure. Australian Journal of Ecology 18:117-143
Clarke KR, Somerfield PJ, Chapman MG (2006) On resemblance measures for ecological studies, including taxonomic dissimilarities and a zero-adjusted Bray-Curtis coefficient for denuded assemblages. Journal of Experimental Marine Biology and Ecology 330:55-80
Cox EF, Allen JA (1999) Stand structure and productivity of the introduced Rhizophora mangle in Hawai‘i. Estuaries 22:276-284
Crooks JA (2002) Characterizing ecosystem-level consequences of biological invasions: the role of ecosystem engineers. Oikos 97:153-166
Demopoulos A (2004) Aliens in paradise : a comparative assessment of introduced and native mangrove benthic community composition, food-web structure, and litter-fall production, vol. Ph. D. University of Hawai‘i at M!noa

!
! 61!
Demopoulos AWJ, Cormier N, Ewel KC, Fry B (2008) Use of multiple chemical tracers to define habitat use of indo-pacific mangrove crab, Scylla serrata (Decapoda : Portunidae). Estuaries and Coasts 31:371-381
Demopoulos AWJ, Fry B, Smith CR (2007) Food web structure in exotic and native mangroves: a Hawai‘i-Puerto Rico comparison. Oecologia 153:675-686
Demopoulos AWJ, Smith CR (2010) Invasive mangroves alter macrofaunal community structure and facilitate opportunistic exotics. Marine Ecology-Progress Series 404:51-67
Dittmann S (1996) Effects of macrobenthic burrows on infaunal communities in tropical tidal flats. Marine Ecology-Progress Series 134:119-130
Ellis J, Nicholls P, Craggs R, Hofstra D, Hewitt J (2004) Effects of terrigenous sedimentation on mangrove physiology and associated macrobenthic communities. Marine Ecology-Progress Series 270:71-82
Fauchald K, Jumars PA (1979) The diet of worms: a study of polychaete feeding guilds. Oceanography and Marine Biology: Annual Review (SAUS) 17:193-284
Giddins RL, Lucas JS, Neilson MJ, Richards GN (1986) Feeding ecology of the mangrove crab Neosarmatium smithi (Crustacea, Decapoda, Sesarmidae). Marine Ecology-Progress Series 33:147-155
Gillikin DP (2000) Factors controlling the distribution of Kenyan brachyuran mangrove crabs: Salinity tolerance and ecophysiology of two Kenyan Neosarmatium species, vol. M.Sc. Free University of Brussels, Brussels, Belgium
Harbison P (1986) Mangrove muds - a sink and a source for trace-metals. Marine Pollution Bulletin 17:246-250
Hernaman V, Probert PK, Robbins WD (2009) Trophic ecology of coral reef gobies: interspecific, ontogenetic, and seasonal comparison of diet and feeding intensity. Marine Biology 156:317-330
Hill BJ (1979) Aspects of feeding strategy of the predatory crab Scylla serrata. Marine Biology 55:209-214
Hollins SE, Heron SF, Ridd PV (2009) Methods for monitoring tidal flushing in large animal burrows in tropical mangrove swamps. Estuarine Coastal and Shelf Science 82:615-620
Huxham M, Kimani E, Augley J (2004) Mangrove fish: a comparison of community structure between forested and cleared habitats. Estuarine Coastal and Shelf Science 60:637-647
Kirch PV (2007) Hawai‘i as a model system for human ecodynamics. American Anthropologist 109:8-26
Kon K, Kurokura H, Tongnunui P (2009) Do mangrove root structures function to shelter benthic macrofauna from predators? Journal of Experimental Marine Biology and Ecology 370:1-8
Kremen C (1992) Assessing the indicator properties of species assemblages for natural areas monitoring. Ecological Applications 2:203-217
Kristensen E, Bouillon S, Dittmar T, Marchand C (2008) Organic carbon dynamics in mangrove ecosystems: A review. Aquatic Botany 89:201-219
LaBarbera M (1984) Feeding currents and particle capture mechanisms in suspension feeding animals. American Zoologist 24:71-84
!
! 62!
Laegdsgaard P, Johnson C (2001) Why do juvenile fish utilise mangrove habitats? Journal of Experimental Marine Biology and Ecology 257:229-253
Langer KF (1952) Ichthology. John Wiley Sons, New York Lee SY (1989) The importance of Sesarminae crabs, Chiromanthes spp. and inundation
frequency on mangrove (Kandelia candel (L) Druce leaf litter turnover in a Hong Kong tidal shrimp pond. Journal of Experimental Marine Biology and Ecology 131:23-43
Leibold MA, Chase JM, Shurin JB, Downing AL (1997) Species turnover and the regulation of trophic structure. Annual Review of Ecology and Systematics 28:467-494
Lin YM, Liu JW, Xiang P, Lin P, Ding ZH, Sternberg LDL (2007) Tannins and nitrogen dynamics in mangrove leaves at different age and decay stages (Jiulong River Estuary, China). Hydrobiologia 583:285-295
Macia A, Abrantes KGS, Paula J (2003) Thorn fish Terapon jarbua (Forskal) predation on juvenile white shrimp Penaeus indicus H. Milne Edwards and brown shrimp Metapenaeus monoceros (Fabricius): the effect of turbidity, prey density, substrate type and pneumatophore density. Journal of Experimental Marine Biology and Ecology 291:29-56
McArdle BH, Anderson MJ (2001) Fitting multivariate models to community data: A comment on distance-based redundancy analysis. Ecology 82:290-297
McCaughey V (1917) The mangrove in the Hawaiian Islands. Hawaiian Forester Agriculture 14:361-366
McCoy D (2011) Improving sample collection and time series analysis of environmental data in He‘eia Fishpond, O‘ahu, Hawai‘i, from 2007 to 2011 Global Environmental Science, vol. Bachelor of Science. University of Hawai‘i at M!noa
Mchenga ISS, Mfilinge PL, Tsuchiya M (2007) Bioturbation activity by the grapsid crab Helice formosensis and its effects on mangrove sedimentary organic matter. Estuarine Coastal and Shelf Science 73:316-324
Middleton BA, McKee KL (2001) Degradation of mangrove tissues and implications for peat formation in Belizean island forests. Journal of Ecology 89:818-828
Mills H (2012). Personal communication to Siple, MC. Mohapatra A, Mohanty RK, Mohanty SK, Dey SK (2010) Carapace width and weight
relationships, condition factor, relative condition factor and gonado-somatic index (GSI) of mud crabs (Scylla spp.) from Chilika Lagoon, India. Indian Journal of Marine Sciences 39:120-127
Mumby PJ et al. (2004) Mangroves enhance the biomass of coral reef fish communities in the Caribbean. Nature 427:533-536
Nagelkerken I, van der Velde G (2004) Relative importance of interlinked mangroves and seagrass beds as feeding habitats for juvenile reef fish on a Caribbean island. Marine Ecology-Progress Series 274:153-159
Nakahara B (2007) Utilization of mangrove habitat by megafauna along the Southern coast of Moloka‘i, Hawai‘i Oceanography, vol. Masters. University of Hawai‘i at M!noa, Honolulu
Nerot C, Meziane T, Provost-Govrich A, Rybarczyk H, Lee SY (2009) Role of grapsid crabs, Parasesarma erythrodactyla, in entry of mangrove leaves into an estuarine food web: a mesocosm study. Marine Biology 156:2343-2352
!
! 63!
Nordhaus I, Wolff M (2007) Feeding ecology of the mangrove crab Ucides cordatus (Ocypodidae): food choice, food quality and assimilation efficiency. Marine Biology 151:1665-1681
Parrish JD (1989) Fish communities of interacting shallow-water habitats in tropical oceanic regions. Marine Ecology-Progress Series 58:143-160
Poret N, Twilley RR, Rivera-Monroy VH, Coronado-Molina C (2007) Belowground decomposition of mangrove roots in Florida Coastal Everglades. Estuaries and Coasts 30:491-496
Posey MH (1987) Influence of relative mobilities on the composition of benthic communities. Marine Ecology-Progress Series 39:99-104
Primavera JH (1997) Fish predation on mangrove-associated penaeids - The role of structures and substrate. Journal of Experimental Marine Biology and Ecology 215:205-216
Rauzon MJ, Drigot C (2002) Red mangrove eradication and pickleweed control in a Hawaiian wetland, waterbird responses, and lessons learned. In: Veitch CR, Clout MN (eds) IUCN Species Survival Commission No. 27. IUCN – World Conservation Union, Gland, Switzerland
Robertson A, Alongi D, Boto K (1992) Food Chains and Carbon Fluxes. In: AI R, DM A (eds) Tropical mangrove ecosystems. American Geophysical Union, Washington, DC, pp 293-326
Robertson AI, Duke NC (1987) Mangroves as nursery sites - comparisons of the abundance and species composition of fish and crustaceans in mangroves and other nearshore habitats in tropical Australia. Marine Biology 96:193-205
Roongrati M, Iaitim W (1994) Some biological aspects of long-eyed swimming crab (Podophthalmus vigil) along the eastern coast of the Gulf of Thailand. Eastern Marine Fisheries Development Center, Rayong
Sacco JN, Seneca ED, Wentworth TR (1994) Infaunal community development of artificially established salt marshes in North Carolina. Estuaries 17:489-500
Schrijvers J, Camargo MG, Pratiwi R, Vincx M (1998) The infaunal macrobenthos under east African Ceriops tagal mangroves impacted by epibenthos. Journal of Experimental Marine Biology and Ecology 222:175-193
Schrijvers J, Okondo J, Steyaert M, Vincx M (1995) Influence of epibenthos on meiobenthos of the Ceriops tagal mangrove sediment at Gazi Bay, Kenya. Marine Ecology-Progress Series 128:247-259
Scowcroft PG, Conrad CE (1992) Alien and native plant response to release from feral sheep browsing on Mauna Kea. In: Stone CP, Smith CW, Tunnison JT (eds) Alien Plant Invasions in Native Ecosystems of Hawai‘i: Management and Research. University of Hawai‘i Press, Honolulu, HI, pp 625-665
Sheaves M, Molony B (2000) Short-circuit in the mangrove food chain. Marine Ecology-Progress Series 199:97-109
Sheridan P (1997) Benthos of adjacent mangrove, seagrass and non-vegetated habitats in Rookery Bay, Florida, USA. Estuarine Coastal and Shelf Science 44:455-469
Songrak A, Koedprang W, Wangpittaya A (2010) Fishery Biology of Spiny Rock Crab (Thalamita crenata Latreille, 1829) in Sikao Bay, Trang Province, Thailand
Stone CP, Cuddihy LW, Tunison JT (1992) Responses of Hawaiian ecosystems to removal of feral pigs and goats. In: Stone CP, Smith CW, Tunison JT (eds) Alien
!
! 64!
Plant Invasions in Native Ecosystems of Hawai‘i: Management and Research University of Hawai‘i Press, Honolulu, HI, pp 666-704
Sukumaran KK, Neelakantan B (1997) Length-weight relationship in two marine portunid crabs, Portunus (Portunus) sanguinolentus (Herbst) and Portunus (Portunus) pelagicus (Linnaeus) from the Karnataka coast. Indian Journal of Marine Sciences 26:39-42
Sweetman AK et al. (2010) Impacts of exotic mangrove forests and mangrove deforestation on carbon remineralization and ecosystem functioning in marine sediments. Biogeosciences 7:2129-2145
Team RDC (2012) R: A language and environment for statistical computing. R Foundation for Statistical Computing, 2.15.10 edn, Vienna, Austria
Torres-Pratts H, Schizas NV (2007) Meiofaunal colonization of decaying leaves of the red mangrove Rhizophora mangle, in southwestern Puerto Rico. Caribbean Journal of Science 43:127-137
Twilley RR, Lugo AE, Pattersonzucca C (1986) Litter production and turnover in basin mangrove forests in southwest Florida. Ecology 67:670-683
Twilley RR, Pozo M, Garcia VH, RiveraMonroy VH, Bodero RZA (1997) Litter dynamics in riverine mangrove forests in the Guayas River estuary, Ecuador. Oecologia 111:109-122
Vasconcellos S (2007) Distribution and Characteristics of a Photosynthetic Benthic Microbial Community in a Marine Coastal Pond
Verweij MC, Nagelkerken I, de Graaff D, Peeters M, Bakker EJ, van der Velde G (2006) Structure, food and shade attract juvenile coral reef fish to mangrove and seagrass habitats: a field experiment. Marine Ecology-Progress Series 306:257-268
Werry J, Lee SY (2005) Grapsid crabs mediate link between mangrove litter production and estuarine planktonic food chains. Marine Ecology-Progress Series 293:165-176
Williams DG (1994) Marine habitats of the Cocos (Keeling) Islands. Atoll Research Bulletin 0:1-10
Wolff M, Koch V, Isaac V (2000) A trophic flow model of the Caete Mangrove Estuary (North Brazil) with considerations for the sustainable use of its resources. Estuarine Coastal and Shelf Science 50:789-803
Young CW (2011) Perturbation of nutrient inventories and phytoplankton community composition during storm events in a tropical coastal system: He‘eia Fishpond, O‘ahu, Hawai‘i Oceanography, vol. M.S. University of Hawai‘i at M!noa, p 400
Zavaleta ES, Hobbs RJ, Mooney HA (2001) Viewing invasive species removal in a whole-ecosystem context. Trends in Ecology & Evolution 16:454-459
!