invasive pressure monitoring
TRANSCRIPT
C -1- -/~ Care Third Edition. edited by Joseph M . C ivetta ,
n ICfl • . b Hobert w. Taylor. and Hobert H: K1r y.. _ Lippint<Jtt-Haven Publishers . Pluladelplua, PA © 1991 .
CHAPTER 56
Invasive Pressure Monitoring Reed M. Gardner
Invasive pressure monitoring, now routinely performed at the patient's bedside, incorporates more advanced technology than was formerly used in heart cardiac catheterization laboratories. The monitoring enables the clinician to have a better understanding of the relationship between the pressure and blood flow in the patient's cardiovascular system. However, every measuring system can produce false information. Constant vigilance and understanding of such systems is the best prescription for ensuring acquisition of highquality pressure monitoring information.
Arterial blood pressure can be measured by both invasive and noninvasive means. However, central venous pressure, pulmonary artery (PA), and pulmonary artery occlusion pressure (PAOP) currently can be measured only by invasive means.
Continuous and accurate assessment of blood pressures can only be made invasive ly. Having continuous pressure data available permits timely detection of dangerous hemodynamic events and provides the information necessary to initiate and titrate patient therapy. Nevertheless, invasive pressure monitoring provides valuable information only when correct techniques are used to obtain accurate data.
This chapter covers the technical aspects of invasive monitoring. Details about catheter insertion techniques are presented in Chapter 57. Complications associated with pressure physiologic measurements , clinical understanding, and managing patient-related problems also are discussed in other chapters of this book.
EQUIPMENT • The components used for invasive pressure monitoring are shown in Figure 56-1.1.2 This diagram illustrates an arte rial site, but a similar setup is appropriate for PA pressure mea-
surement. The components known as the "plumbing system" (see Fig. 56-1 , points 1 through 6) must be kept sterile because they come in direct contact with the patient's blood. Usually, these components are disposable. The other components (see Fig. 56-1, points 7 through 10) in the system are used for processing and displaying pressure waveforms and for obtaining derived hemodynamic parameters.
CATHETER
Arterial and PA catheters provide access to the patient's blood vessels for pressure monitoring and provide a site for withdrawing blood samples for blood gas analysis and other tests.
STOPCOCK NO. 1
Stopcock no. 1 is used as a site for withdrawing blood for analysis. When filling the plumbing system with fluid, precautions must be taken to be sure that all central switching cavities of the stopcock are fluid filled. All entrapped air bubbles must be removed. Stopcocks are particularly vulne rable sources of patient contamination. Therefore, stopcocks should be handled with extreme care; ports not in active use should be covered with sterile caps, and the open ports should never be touched.
PRESSURE TUBING
The catheter and stopcock are normally attached to the continuous flush device and pressure transducer by nonelasti c pressure tubing. To optimize the dynamic response of the plumbing system, avoid long lengths of tubing.
839

840 Section V. Monitoring: Practical Applications
3. PRESSURE TUBING
--------.:...--..... /
9. OSCILLOSCOPE 2 . STOPCOCK #1
6 . CONTINUOUS FLUSH DEVICE
I I I I I I I I \
FIGURE 56-1. Components used to monitor blood pressure directly are nearly the same, independent of whether the catheter is in an artery (radial, brachial, or femoral) or in the pulmonary artery. The size of the transducer and plumbing components were enlarged for the illustration . (Adapted from Gardner RM, Hollingsworth KW: Optimizing ECG and pressure monitoring. Crit Care Med 1986;14:651.)
STOPCOCK NO. 2
If the transducer is patient mounted when measuring arte rial pressures, stopcock no. 2 may not be necessary.
CONTINUOUS FLUSH DEVICE
The continuous Hush device is used to fill the pressure monitoring system with fluid and he lps prevent blood from clotting in the catheter by continuously Hushing fluid through the system at a rate of from 1 to 3 mUhour.
PRESSURE TRANSDUCER
Most pressure transduce rs currently used for monitoring are miniature, rugged, disposable devices.3
-7 Because of their
miniature size, they can be patient mounted. All currently available disposable pressure transducers are res istive devices that convert the movement of their sensing diaphragm into an elect1ical signaJ.H Standards for blood pressure transducers have been developed by the Association for the Advancement of Medical Instrumentation (AAMI) and adopted by the American National Standards Institute (ANSI) J -> Because of such standardization, transduce rs from diffe rent vendors can be used inte rchangeably with any modern moni-
tor.9 In fact , errors of less than ::+::3% typically result from the use of such transducers without calibration.9
·10
AMPLIFIER SYSTEM
Output voltage from the transducer required to drive an oscilloscope or strip recorder is furnished by an amplifier system inserted between the transducer and display. Transducer excitation is provided either from a direct current or alternating current source, with voltages ranging from of from 4 to 8 V. Most amplifier systems include low-pass filters that filter out unwanted high-frequency signals. Pressure amplifier frequency response should be "Aat''-from 0 to 50 Hz-to avoid pressure waveform distortion .1
·2
OSCILLOSCOPE DISPLAY
Pressure waveform s are best visualized on a calibrated asci lloscope.
PROCESSOR/ DIGITAL DISPLAY
Digital displays provide a simple method for presenting quantitative data front the pressure wave form. The-'· are found on most mode rn pressure monit01ing equipment . Sys-

tolic, diastolic:. and mean pressure are derived from the pressure waveforms .
RECORDER
St1ip cha1t recorde rs often ar~ used to ?o~um~nt dynamic response characteristics, resp1 ratory vanatwns m PA pressures, and aberrant rhythms and pressure waveforms .
EQUIPMENT SETUP • ZEROING THE TRANSDUCER
The accuracy of blood pre~sure requir_es the establishment of an accurate reference pomt from wluch all measurements .1re made. The patient's midaxillary line (right heart level) ;s the reference point most commonly used. The "zeroing" process is used t? compensate for o~fse t caused by hydrostatic pressure differences or offset m the p_r~ssur~ transducer, amplifier, oscilloscope, recorder, or digital displays. Zeroing is accomplished by opening an appropriate stopcock to atmosphere and aligning the resulting air-fluid interface with the midaxillary refe rence point_I.l.l l Figure 56-2 shows two methods that can be used to zero the transducer. u
Once the system is zeroed, the appropriate stopcock can be switched to allow the patient's waveform to be displayed. Because PA and PAOP are especially susceptible to improper zeroing, the zero should be verified with each measurement. Although disposable transducers have stable zero characteristics,'-'" it is wise to zero transducers before each right heart measurement and reestablish the zero at least once per day for arterial pressures.
CALIBRATION
The sensitivity of the AAM VANS I disposable blood pressure transducer is fixed at 5.0 1-L VN/mm Hg and calibrated by the manufacturers to within ::!::3%.5 When using transducers that meet the AAMVANSI standard and modern monitors
A
Chapter .56_ lnwsir;e Pressure 1\Jonitoring 841
that interconnect with standardized transducers, there is no need to "calibrate" the transducer or monitming system.9
Based on current data, fixed calibration pressure monitoring systems should be purchased and maintained and fixed calibration disposable pressure transducers should be used.
If pressure transducer or monitor calibration errors are suspected in the clinical situation, the following steps are recommended: the pressure transducer should be replaced and "tested" in the laboratory situation; if the monitor module is suspect, it should be tested with a high-accuracy pressure transducer "simulator" and, if faulty, replaced and repaired.
CHECKING AND OPTIMIZING DYNAMIC RESPONSE CHARACTERISTICS
B
Catheter-tubing-transducer plumbing setups used in the ICU are underdamped second-order dynamic systems. u ·13-
15
Characteristics of second-order systems are described mathematically by a second-order differential equation with characte ristics dete rmined by three mechanical parameters: elasticity, mass, and friction . These same parameters apply to a catheter-tubing- transducer system where the natural frequency (Fn in Hz) and damping coefficient zeta m determine the dynamic characteiistics of the plumbing system.
Dynamic response characteristics of catheter-tubingtransducer systems are expressed by two inte rrelated techniques. One specifies a band\vidth (frequency) and requires that the system's frequency response be flat up to a given frequency so that a specified number of harmonics-usually 10----of the original pulse wave can be reproduced without distortion (Fig .. 56-3)_ The second specifies the Fn and ~ . 1 3
The resulting plot ofFn and~ is shown in Figure 56-4. 13 If the characte ristics of the plumbing system fall in the adequate or optimal area of the graph, the pressure waveforms will be adequately reproduced_ If this point falls in any of the remaining three areas, the re will be pressure waveform distortion.
Catheter-tubing- transducer plumbing systems assembled under optimal conditions are usually underdamped. although a few fall into the unacceptable area. Methods
FIGURE 56-2. Two methods of ze roing a pressure transducer. Notice the placl' at \\'hich the water-air interface occurs should always be at the mid-axillatY line " ·he n zeroing. (A) The stopcock near the cathe te r is placed at the mid- <Lxilhuy line . (B) The stopcock is placed near the transducE' r at the mtdaxilhuy line _ (Adapted from Gardner RM . Holl ings\\'orth K\V: Optimizing ECC and pn·ssure ntomtonng. Crit Care Mer! 1986;14:651. )

. 842 Section V. Monitori.ng: Practical Applications
8
15 2D Z5 10
~OlD
FIGURE 56-3. Family of frequency versus amplitude ratio plots for five different damping coefficients (zeta, 0 and two different natural frequencies of 10 and 20 Hz. A damping coefficient of 0.1 occurs if the system is very underdamped, whereas a damping coefficient of 2.0 occurs when a system is overdamped. The ideal or "flat" frequency versus amplitude response is shown (dashed line) . Notice that the response of the system with a 10-Hz natural frequency can be brought closer to the ideal "flat" response if the damping coefficient is between 0.5 and 0.7. However, by increasing the natural frequency to 20 Hz, the range of damping coefficients can be widened still ftllther and gives nearly the same "flat" frequency response.
for optimizing the p lumbing system components have been outlined.1.13
-15 In the clinical setting, there are dramatic dif
ferences between each monitoring system setup; the refore, it is mandatory to test the adequacy of each pressure monitoring system. This can be done easily using the fast-Hush technique. A fast-Hush is produced by opening the valve of the continuous Rush device (e.g., by quickly releasing the fast-Hush valve on the continuous Rush system). The rapid
1.2
1. 1
• 9
. 8 .. ~
. 7 ~
. !5 i
. 5 ..
. 3
• 2
.I
0 0 5 10 15 20 25 30 35 •o
F RECUENCY CHZ>
closure generates a square wave from which the Fn and ~ of the plumbing system can be measured.
Once the fast-Hus h test has been executed two or three times, the dynamic response characteristics (Fn and Z) can be quickly and easily determined.1. 13 Fn can be estimated by measuring the period of each full oscillation on a strip chart recorder (Fig. 56-SA) after a fast-Hush, and calculating the frequency from the period. To determine the ~. any nvo successive peak amplitudes are measured and an amplitude ratio obtained by dividing the measured height of the lower peak by that of the amplitude of the larger peak (see Fig. 56-SB). This ratio is then converted to the ~·
Once the Fn and the ~ have been determined, the data can be plotted on the graph in Figure 56-4 to ascertain the adequacy of dynamic response. Some bedside monitors and recorders may compromise the fast-Hush technique with their built-in low-pass fi lters . These filters should be expanded to at least 50 Hz.
Several factors lead to poor dynamic responses: air bubbles in the system, usually caused by a poor initial Huid fi lling of the plumbing system; pressure tubing that is too long, too elastic, or has a diamete r that is too small; and pressure transducers that are too elastic. The best way to enhance the system's dynamics is to maximize its Fn.
CLINICAL VERSUS LA BORA TORY MEASUREMENT OF DYNAMIC RESPONSE
Several investigators have studied the dynamic response characteristics of catheter-transducer systems.U.JJ-J' Some inves tigators have evaluated the dynamics of pressure monitoring systems by evaluating only one element in the system. However, recent studies have examined the complete pressure monitoring plumbing system. 1
·5·1'
The results of these studies show that the simpler the mechanical plum bing setup of a pressure monitoring system, the higher its fidelity." The more complex the plumbing
50
0
~ w 0 ::;) l-
it ~ < . I
.2
. 3 ..
. 5
. 6
. 7
. 8
. 9
F IGURE 56-4 . Plot sl tows the range of damping coe fficient (~) and natural frequencies outlining the regions that indicate the t\1Je distortion of the pressure waw· (see Fig . .56-.'5 for examples) .
HR • D2 dP/ c!t • 1400 mmHQ/MC ORIGINAl WAIIEfOR1ol
zoo Fn • 3.5 Hz ZETA • 1.04 zoo
A 8
100 100
a
Fn • 15Hz ZETA • 0.15 Fli•1SHz ZETA • 0 .60 zoo zoo
c 0
100 100
Ill • 24 Hz ZETA • 0 . 15 zoo
E
100
svste m, that is, the greate r the number of components with in the system, the greate r the susceptibility of that system to have degraded dynamic pe rformance. Lack of tubing or shorter lengths of tubing minimize the chances of air bubble entrapment. Chances For setup e rror also were minimized \\ith simpler p lumbing systems.
The dynamic response characteristics of a syste m that us<'s cathe te rs or e last ic tubing or systems with air bubbles in them are known to have large volume d isplacement (Vd ). S\·s te ms that use long, narrow cathe te rs (such as the P A catheter) or have long le ngths of small-diameter pressure
1.2
1. 1
. 9
... . 8 z "' u • 7 ... ... "' • 6 a u
"' . 5 ~ 0. X < a . 4
. 3
.2
.I
0 0 5
0 ~
10 I S
A ~ ARTERIAL 2" 20GA + 12" L • ARTERIAL 2" 20GA + 72" P - 7FR PUI...M ARTERY NO lUBE
- ,ul AIR AT TRANSDUCER
0
20 2S 30 3S 40
FRECUENCY CHZ)
Chapter .'i6. llll.:as it-c Press/lrl' Monito rin g 843
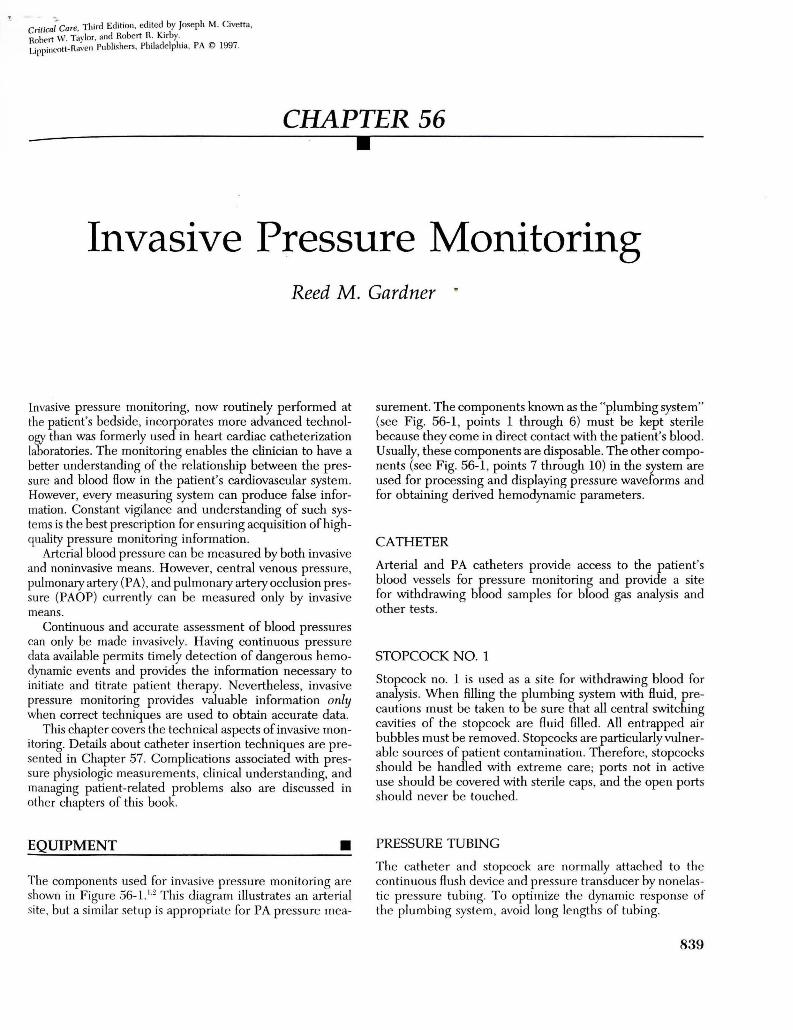
F IGURE 56-5. Arterial pressure waveforms recorded with diffe rent pressure monitoring systems. Patient heart rate is 92 with a maximum rate of change of pressure with time (dP/dt) of 1400 mm Hg!second. (A) The original patient waveform is shown as it might be recorded with a catheter-tipped press ure transducer. The systolic pressu re is 118 mm Hg; dias tolic, 5.5 mm Hg; and mean pressure, 81 mm Hg. (B) The same patient's arterial press ure waveform recorded with an "overdamped" plumbing system. ~ is l.04 and natural frequency (Fn ) is :3 .5 Hz. Notice the "fast-Hush" signal (upper left) returns slowly to the patient waveform. Systolic pressure is underestimated at 106 mm Hg, diastolic pressure is overestimated at 59 mm Hg, but mean pressure is unchanged at S l mm Hg. (C ) An "underdamped" condition is shown with a low damping coefficient of 0.15 and a natu ral frequency of 1.5 Hz. After the fast-flush, the pressure waveform oscillates rapidly and returns to the original waveform shape quickly. Systolic pressure is overes timated at 128 mm Hg, dias tolic is nearly the same as the original at .54 mm Hg, and the mean pressu re is unchanged at 81 mm Hg. (D ) Same as in C, but a damping device has been inseried and adjusted.1 The waveform is optimally damped with a damping coefficient of 0.60 and a natural frequency of 15 Hz. (E) An "underdamped" condition is shown but with high natural frequency of 24 Hz. Notice the pressure waveform is on ly slightly distorted and that the pressures are close to the true pressu res .
4S
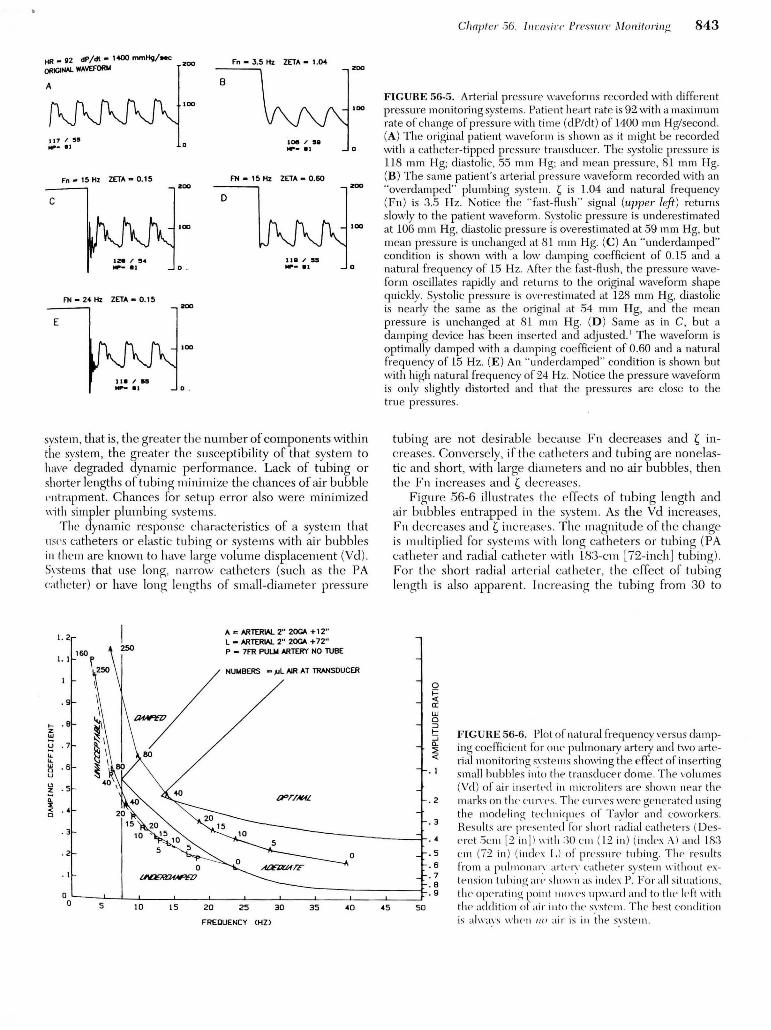
tubing are not desirable because Fn decreases and ~ increases. Conversely, if th e cathete rs and tubing are none lastic and short, with large diame te rs and no air bubbles, then the Fn increases and ~ decreases.
Figure .56-6 ill ustrates the effects of tubing le ngth and air bubbles e ntrapped in the system . As the Vd increases, Fn dec re ase s and ~ incre ases. The magn itude of the change is multiplied for syste ms with lo ng catheters or tubing (PA cathe te r and radial cath e te r with un-cm [72-inch] tubing). For the short rad ia l arterial catheter, the effect of tubing le ngth is also apparen t. increasing the tubing from 30 to
0 i= <( a: UJ 0 ::J 1-::J Cl. :::; <(
.I
. 2
. 3
• 4
. s
. 6
. 7 • B . 9
so
FIGURE 56-6. Plot of natural frequency ve rsus damping coefficient for one pu lmonary artery and two arterial monitoring s,·s tems showing the e ffect of inserting small bubbles into th t> transducer dome. The volumes (\'d ) of air inse rtl'd in microliters are sho\\'n near the marks on the CUIY<>S. The cn1Yes were generated using the modeling tt'clmicp1es of Taylor and CO\\'o rkers. Results are pn·sented for short radial cathete rs (Desere t .5cm [1 in ll " ·ith :30 Clll ( l2 in ) (index ;\ ) and l/'>:3 em (71 in ) (inde.s L ) of pressure tubing. Tllf' results from a pulnHHlaiY alil'n· cathete r syste 111 " ·ithoul extension tuhint; <liT shown <L~ index P. For all situations . the opt' rat ing' point n1oq·s np\\·anl and to tl1 e le ft "ith the addition of air into the s\·s telll . The bes t condition is al\\·;1\ ·s \\'h(' n 11 11 air is in .the svs telll.

.. . 844 Section V. Monitoring: P·ractical Applications
183 em ( 12 to 72 inches) with no air bubbles in the system reduces the Fn from 39 to 23Hz. For a PA catheter system without pressure tubing, the effect of increasing air bubble size (Vd) on the system is shown. In every case, the operating point moves upward and to the left. Despite what is taught in some centers, adding air to the transduce r to "damp" the pressure waveform is not a good idea.
The use of extension tubing for PA lines was found to be especially dettimental to the system's response. The adverse effects of long tubing are compounded because of the long length of the PA catheter. The use of extension tubing, which affords greater freedom of mobility from the transducer to the catheter, seems to be contraindicated.
This same study found that each clinical cathetertubing- transducer system must have its dynamic response verified at frequent intervals. 17 There can be vast differences in fidelity of systems between the ideal laboratory setting and the clinical setting where the system is subject to changes over time, human assembly e rror, repeated blood sample withdrawal, and air entrapment. The fast-flush method of determining the dynamic response characteristics is a simple, rapid, and safe testing modality that can be easily incorporated clinically. I.Z.IJ.I5 By performing the fast-flush testing on each clinical system, one can verifY the adequacy of dynamic response and optimize it if necessary. If the fastflush testing produces dynamic response characteristics that are inadequate, the user can take the opportunity to troubleshoot the system (i.e ., remove excessive tubing length or purge air bubbles until acceptable dynamic characteristics are obtained).
SELECTING BLOOD PRESSURE TRANSDUCERS
The objective of the recently published AAMVANSI blood pressure transducer standards was to provide labeling and performance requirements , testing methods, and terminology to ensure that health care profess ionals are supplied with safe, accurate, disposable blood pressure transducers that can be used interchangeably with any monitor.5·
7·9 Fortu
nately, all of the current disposable transducers meet these new standards.
COMPLICATIONS OF INVASIVE PRESSURE MONITORING • The three most important risks associated >vith vascular cannulation and direct blood pressure monitoring are air embolism , th rombosis, and infection .
AIR EMBOLISM
Air embolism is the introduction of air into the circulatory system. Air insufflation can occur in a variety of ways int~ either the venous or arterial portion of the circulation . \'enous ai r embolism may reduce or stop the Aow of blood through the heart or may cause neurologic complications. The exact amount of venous air that is fatal to adults is unknown but is estimated to be beh-veen 300 and 1600 rnL."
The rate of air injection into the venous circulation is of primary importance. Death appears to be caused by the right ventricle compressing air rather than pumping blood.
The complication from art e rial air embolism is different. Air entering the left side of the heart passes quickly into the aorta. Then, depending on the position of the patient, the air may flow into the coronary arte1ies, cerebral arteries, or both. 18 Air entering these vessels then obstructs the blood flow to areas supplied by these vessels. In dogs, small amounts of air-between 0.05 and 1.0 mL--injected into the coronary circulation have been fatal. 18 Air embolism is b(O!st prevented by using continuous flush systems and keeping the plumbing systems closed. 18-20
THROMBOSIS
Thrombosis can be caused by an invasive catheters, yet is an infrequent complication of arterial or PA catheterization . Embolization of clots formed on a catheter can be flushed retrograde into the central circulation from radial arterial cannulation sites. To minimize thrombus formation, continuous flush systems have been developed to keep catheters patent and prevent the need to use syringes to flush cathete rs.19·21 PA catheters have had heparin bonding added to their surface to minimize thrombus form ation.22 There has been considerable discussion about the use of heparin in the flush solution and its effects on minimizing clot formation in the catheter tip .23
·24 Reports conflict regarding the need
to heparinize the flush solution . 23·1~ In my expe rience , over the last 4 years , heparin was not used in the flush solution for arterial cathete rs . Since heparin was eliminated , there has not been an increased rate of thrombus formation or loss of catheter function. If heparin is used in the flush solution, clinicians must be aware that a discard volume of 5 times the dead space of the cathete r and tubing must be withdrawn to minimize e ffects on coagulation studies.2
"
INFECTION
Although invasive pressure monitoring provides valuable monito1ing information, such syste ms also can result in bacteremia from contamination of cathete rs, stopcocks, pressure transduce rs, and flush solutions."fi-:>'> Most of the reported cases of pressure transducer- related infections were traced to "reusable" devices . Thus, use of totally disposable assemblies is recommended and monitoring systems should be manipulated as little as possible ."'>
SIGNAL AMPLIFICATION, PROCESSING, AND DISPLAY • Once the pressure signal has bt'en transmitted to the transduce r, the bedside monitor ope rates on that signal. Most monitors display the heart rate and systolic, diastolic, and mean pressure with a digital di splay. Evaluation of hedsidt' monitors has found that applying the sante pressure wan·forrns to each of three monitors gave diffe rent results.·1h In addition , it was f(HIIId that none of the tnonitors recognized

and rejected the following artifact conditions: (l) zeroing the transducer, (2) fast-flushing the system, and (3) drawing blood from the patient. These conditions occur several times daily during nonnal patient ca.re ~~d result in false alarms and erroneous trend data loggmg.
To eliminate these problems, new algorithms are being developed for bedside pressure monitors . Preliminary testing has shown that these enhanced algorithms produce dramatic improvements in the bedside monitor's ability to evaluate pressure waveforms in the clinical se tting.38
REFERENCES • 1. Gardner RM, Hollingsworth KV\1: Optimizing ECG and pres
sure monitoring. C1it Care Med 1986;14:651 2. Gardner RM: Hemodynamic monitoring: from catheter to dis
play. Acute Care 1986;12:3 3. Gardner RM, Kutik M: American National Standard for Blood
Pressure Transducers: General. Arlington, VA, Association for the Advancement of Medical Instrumentation (AAMI), and American National Standards Institute (ANSI), 1986
4. Gardner RM, Kutik M: American National Standard for Interchageability and Perfonnance of Resistive B1idge Type Blood Pressure Transducers. Arlington, VA, Association for the Advancement of Medical Instrumentation (AAMI), and American National Standards Institute (ANSI), 1986
5. Cooper T , Paulsen A W: Ame1ican National Standard for Blood Pressure Transducers. Arlington, VA, Association for the Advancement of Medical Instrumentation (AAMI), and American National Standards Institute (ANSI), 1994
6. Disposable pressure transducers . Health Devices 1984;13:268 , . Disposable pressure transducers: evaluation. Health Devices
1988;17:75 8. Gardner RM , Hujcs M: Fundamentals of physiologic monitor
ing. In: Susan C. Osguthorpe (ed ). Concepts of Physiological Monitoring/Hemodynamic Pressure tHonito·ring Systems: Physiological Monitoring . AACN Clinical Issues in C1itical Care Nursing. Philadelphia, JB Lippincott, 1993: ll
9. Gardner RM : Accuracy and reliability of disposable pressure transduce rs coupled with modem pressure monitors. Crit Care Med 1996 (May, in press)
10. Bailey RH, Bauer JH , Yanos J: Accuracy of disposable pressure transducers used in the critical care setting. Crit Care Med 1995;23: 187
11. Geddes LA: The significance of a reference in the direct measurement of blood pressure . Med Instrum 1986;20:331
1:2. Ahrens T: How often is it necessary to zero-balance a disposable transducer used for intravascular and intracardiac pressure readings? Crit Care Nurse 1994;14:98
13. Gardner RM: Direct blood pressure measurement: dynamic response requirements. Anesthesiology 1981;54:227
14. Kleinman B: Understanding natural frequency and damping and how they relate to the measurement of blood pressure. J Clin Manit 1989;5:137
15. Kleinman B, Powell S, Kumar P, et al: The fast Rush does measure the dynamic response of the entire blood pressure monitoring system. Anesthesiology 1992;77: 1215
16. Tavlor BC, Ellis OM, Drew JM : Quantification and simulation of Auid-filled catheter/transducers syste ms. Med Instrum 19H6;20: 123
17. C:ihhs NC, Gardner RM: Dynamics of invasive pressure moni-
Chapter 56. ln vasiw Pressure Monitoring 845
toting systems: clinical and laboratmy evaluation. Heart Lung 1988;17:43
18. Toll MO: Direct blood-pressure measurements: risks, technology evolution and some cun·ent problems. Med Biol Eng Comput 1984;22:2
19. Gardner RM, Bond EL, Clark JS : Safety and efficacy of continuous Rush systems for arterial and pulmonary artery catheters. Ann Thome Su·rg 1977;23:534
20. Disposable blood pressure transducers: calibration methods. Health Devices 1993;22:97
21. Gardner RM , Warner HR. Toronto AF, et a!: Catheter Rush system for continuous monitoring of central arterial pulse waveform . J Appl Physiol 1970;29:911
22. Hoar PF, Wilson RM, Mangano DT, et a!: Heparin bonding reduces thrombogenicity of pulmonary-artery catheters. N Eng! J Med 1981;305:993
23. Hook ML, Reuling J, Luettgen ML, et a!: Comparison of patency of arterial lines maintained with heparinized and nonheparinized infusions. Heart Lung 1987;16:693
24. Clifton CD, Branson P, Kelly HJ, eta!: Comparison of normal saline and heparin solution for maintenance of arterial catheter patency. Heart Lung 1991;20:115
25. Reihnardt ACR, Tonneson AS, Goodnough SKC: Minimum discard volume from arte rial cathete rs to obtain coagulation studies free of heparin effect. Heart Lung 1987;16:699
26. Weinstein RA, Stam \VE, Kramer L, eta! : Pressure monitoring devices : overlooked source of nosocomial infection. JAMA 1976;236:936
27. Hekker TA, van Ove rhagen W, Schneider AJ: Pressure transducers : an ove rlooked source of sepsis in the intensive care unit. Intensive Care Med 1990;16:511
28. Thomas F. Burke JP, Parker J, eta!: The risk of infection related to radial vs. femoral sites for arterial catheterization .Crit Care Med 1983;11:807
29. Somme rs MS, Baas LS: Nosocomial infections related to four methods of hemodynamic monitoring. Heart Ltmg 1987;16:13
30. Simmons BP: Centers for Disease Control: guidelines for prevention of infections related to intravascular pressure-monitoring systems. Infect Control 1982;3:68
31. Luskin RL, \\'einstein RA, Nathan C, et a!: Extended use of disposable pressure transducers : a bacteriologic evaluation . JAMA 1986;255:916
32. Maki DC, Botticelli JT, LeRoy ML, et a!: Prospective study of replacing administration sets for intravenous the rapy at 48 vs 72 hour intervals: 72 hours is safe and cost effective. JAMA 1987;258:1777
33. O 'Malley MK, Rhame FS, Cerra FB, et a!: Value of routine pressure monitoring system changes after 72 hours of continuous use. C1it Care M.ed 1994;22: 1424
34. Menne! LA, Maki DC: Epidemic bloodstream infections from hemodynamic pressure monitoring: signs of the times. Infect Control Hasp Epidemiol 1989; 10:47
35. Mermel LA, Maki DC: Infectious complications ofSwan-Canz pulmonary-artety cathete rs : pathogenesis, epidemiology, prevention , and manage ment. State of the art . Am J Resp Crit Care Med 1994; 149:1020
36. Maloy L, Gardner RM : Monitoring systemic arterial blood pressure: st rip recording ve rsus digital display. Heart Lung 1986; 15:627
:37. Gardner RM , Manis SM , Oehle r P: Monitoring direct blood press ure: algorithm enhancements. IEEE Comp11t Cardiol 1986: 1:3:607
38. Ellis DM: Interpretation of beat-to-beat blood pressure values in th e presence of w·nti latorv changes . J Clin Monit 19S.'5; I :6.5