inventor ceosinventor ceos - fmaconferences.org · inventor ceosinventor ceos ... we find that...
TRANSCRIPT

1
Inventor CEOsInventor CEOsInventor CEOsInventor CEOs
Emdad Islam and Jason Zein
August 1, 2017
AbstractAbstractAbstractAbstract
We show that high-tech firms led by Inventor CEOs are associated with both a greater
quantity and quality of innovation outputs. We utilize exogenous CEO turnovers and
R&D tax credit shocks to address the endogenous matching of firms with CEOs and find
that this relationship continues to hold. We rule out several alternative explanations for
our results, such as CEO overconfidence, the presence of founder CEOs, firm lifecycle
effects and CEO industry expertise. We show that one channel through which Inventor
CEOs generate superior innovation outcomes is through being able to better evaluate
innovative products and investment opportunities.
JEL Classification: JEL Classification: JEL Classification: JEL Classification: G32, G34, J24, l26, O31, O32
Key words: Key words: Key words: Key words: Inventor CEOs, Innovation, R&D, Human Capital, Founder-CEO

2
InInInInventor ventor ventor ventor CEOsCEOsCEOsCEOs
“Innovation has nothing to do with how many R&D dollars you have. When Apple “Innovation has nothing to do with how many R&D dollars you have. When Apple “Innovation has nothing to do with how many R&D dollars you have. When Apple “Innovation has nothing to do with how many R&D dollars you have. When Apple
came up with the Mac, IBM was spending at least 100 times more on R&Dcame up with the Mac, IBM was spending at least 100 times more on R&Dcame up with the Mac, IBM was spending at least 100 times more on R&Dcame up with the Mac, IBM was spending at least 100 times more on R&D. It’s . It’s . It’s . It’s
not about money. It’s about the people you have, how you’re led, and how much not about money. It’s about the people you have, how you’re led, and how much not about money. It’s about the people you have, how you’re led, and how much not about money. It’s about the people you have, how you’re led, and how much
you get it.” you get it.” you get it.” you get it.” - Steve Jobs, former CEO, Apple Inc.
1111 IntroIntroIntroIntroductionductionductionduction
We examine whether firms led by CEOs with first-hand experience in innovation
(Inventor CEOs), possess superior innovation outcomes relative to firms where CEOs
lack such experience. The economics, management and psychology literature concur that
certain skills can be only be acquired and refined through “learning by doing” (see Arrow
(1962), Alchian (1963) and Irwin and Klenow (1994)). More recently, several studies
have shown that first-hand experience matters in explaining individual decision-making
in a variety of contexts. For instance, Kempf, Manconi and Spalt (2016) find that when
fund managers have “on the job” industry experience they are better able to select stocks
in the industry where this experience lies. First-hand experience is also shown to affect
the ability to evaluate innovation. For example Celikyurt, Sevilir and Shivdasani (2012)
show that directors with experience as venture capitalists assist their firms to become
more innovative.1 Given that CEOs are the central decision maker in a firm, we argue
that their firsthand experience as an inventor should matter a great deal in enhancing
their ability to select and evaluate innovative investment projects.
We test this conjecture by collecting data on a CEO’s individual patenting history as
an inventor, to measure the degree to which they have been previously exposed to first-
1 The academic profession also provides a suitable analogy for why first-hand experience matters in evaluating
innovation. The profession relies on journal editors and referees for expert judgement on the importance of a paper’s
scholarly contribution (or innovation). Editors and referees are entrusted with this task because they themselves
have firsthand experience at producing high quality and impactful research. Thus, the implicit assumption made by
the profession is that those with firsthand top-tier research experience should also be those that are most capable of
identifying innovative top-tier research done by others.
3
hand technical innovation. Our sample consists of all the high-tech firms in S&P 1500
for a long panel of 17 years (1992-2008) and exploits the richness of the US Patent
Inventor Database from Li et al. (2014) (henceforth PID) to identify CEOs in our panel
that have been awarded at least one patent in their own name. We choose to focus on
the U.S. high-tech sector for two reasons. First, this sector accounted for virtually the
entire U.S. R&D boom, especially young firms in these industries (Brown, Fazzari and
Petersen (2009)). Second, Hambrick et al. (1992) show that firms in high-technology
industries tend to employ top managers with strong technical backgrounds. This
increases the liklhood of observing inventor CEOs, and creates more balance in the
sample between inventor and non-inventor CEOs.
We find that firms led by these Inventor CEOs are associated with more
successful innovation, both in terms of quality and in terms of the disruptive impact of
the patents that are developed. Since we also control for R&D investments in our
empirical models, we interpret the findings to also reflect the innovation efficiency of
these firms. We also show that Inventor CEOs are more likely to be associated with
patents that have received the highest number of citations in any particular industry in
a given application year, suggesting that they are also able to spur ground-breaking and
disruptive innovations. Given the critical dependence of long-term economic growth on
innovation (Solow (1957)) and the spill over effect of technological innovation (Griliches
(1992), Jaffe (1996), Bloom, Schankerman and Van Reenen (2013), Irwin and Klenow
(1994), the findings of this study have important implications for the economy at large.
It is plausible that highly innovative firms or firms with higher innovation
potential hire Inventor CEOs. For example, Datta and Guthrie (1994) show that firms
with greater R&D intensity are more likely to select new CEOs that have technical
backgrounds. Thus, the relationship that we find could be plagued by endogenous
matching of Inventor CEOs to highly innovative firms, thereby impeding causal inference.
We employ two approaches to address this problem. First, we use exogenous CEO

4
turnovers to identify relationship between Inventor CEOs and innovation. We show that
following exogenous departures of Inventor CEOs, their firms experience an economically
sizable and statistically significant reduction in corporate innovation outputs, thereby
implying that the relationship between Inventor CEOs and corporate innovation is
causal.
Second, we utilize staggered changes in R&D tax credit across U.S. states over
time to conduct a quasi-natural experiment to examine the differential response of
Inventor CEO led firms to a shock in incentives to innovate. In this setting, because
CEOs are already matched with their firms prior to the shock, a firm’s response to the
shock cannot arise from endogenous CEO matching. We find that Inventor CEOs
respond more positively to this plausibly exogenous source of variation in the incentive
to innovate. These results are based on the use of two distinct control groups. First, we
compare the change in innovation outcomes over the pre-shock and post-shock periods
for Inventor CEOs (treated firms) and non-Inventor CEOs (control firms) from the same
state. We show a positive difference-in-difference in favour of Inventor CEOs. We find
that this difference cannot be explained by a greater level of R&D expenditure in
response to the tax credit shock.
However, the superior innovation outcomes experienced by firms led by
innovative CEOs may be driven by unobservable firm level characteristics that are
correlated with having an Inventor CEO. To address this, our second control group,
comprises of Inventor CEOs from other states that didn’t experience a tax shock. By
keeping both firm and CEO type constant, this test overcomes any concerns regarding
the endogeneity of Inventor CEO assignment. Our results show Inventor CEOs continue
to achieve superior innovation outcomes relative to this control sample.
To further address the concern that firm-types hiring inventor CEOs are
inherently more innovative, we use a propensity score matched sample of firms to ensure
that Inventor-CEO led firms are compared with appropriate counterfactuals. We

5
continue to find a strong and economically meaningful positive effect of Inventor CEOs
on corporate innovation when we compare firms with Inventor CEOs with
counterfactuals from the exact same industry and similar propensity scores constructed
using an extensive set of covariates.
We also attempt to rule out a number of alternative explanations for our story.
First, it is plausible that many of these inventor-CEOs are also founder-CEOs and it is
in fact a founder effect that is driving our results. After including a Founder-CEO
dummy in our specifications, we continue to find very similar coefficients on the Inventor
CEO coefficient. In an unreported test, we find positive and significant coefficient on
Founder-CEOs when we do not control for Inventor CEOs suggesting that the Founder-
CEO effect on innovation is indeed fully explained by Inventor CEOs.
Second, it is also possible that Inventor CEOs may also be overconfident CEOs
which have previously been documented in the literature to have a significant positive
effect on corporate innovation (Hirshleifer, Low and Teoh (2012)). Since it is plausible
that our measure of Inventor CEOs may pick up the overconfident CEO effect, we run
our baseline tests including an overconfidence dummy. The coefficient on Inventor CEOs
retains its economic and statistical significance.
Third, the Inventor CEO proxy may simply just be picking up the difference
between specialist and generalist CEOs. Specifically, it may be that Inventor CEOs
possess specific industry expertise and it is this that drives our results, rather than a
CEO’s first-hand innovation experience. To address this possibility, we use the General
Ability Index as constructed by Custodio, Ferreira and Matos (2017) as an additional
CEO characteristic in our empirical specifications. We find that after controlling for
specialist CEOs, having first hand innovation experience continues to have a positive
incremental effect on corporate innovation outcomes.
Our results also survive an extensive set of robustness tests where we control for
CEO incentive measures (e.g. CEOs’ ownership, Equity based pay, CEO Delta, CEO
6
Vega), CEO human capital (e.g., CEOs acquiring technical education, Finance
Education, PhD in STEM among others), and internal and external corporate
governance (e.g. board size, board independence, and institutional holdings). Our results
are also robust to alternative econometric and fixed effects specifications.
It is possible that Inventor CEO firms’ superior innovation output, is a result of
over-investment in innovation. Here, while the CEO maybe technically adept, he/she
lacks the ability to evaluate the commercial potential of their innovation and thus harms
outside shareholder value. Thus, we also investigate whether the superior innovation
outputs and efficiency of firms run by Inventor CEOs translate into higher firm
valuations for these firms. We document a higher positive correlation between Inventor
CEOs and market value relative to firms with non-inventor CEOs.
Finally, we investigate the channels through which Inventors CEOs promote
greater innovation at their firms. We focus on testing whether firms led by Inventor
CEOs possess a superior ability to identify and evaluate innovative investment
opportunities and products. We do this in two ways. First, we study the corporate
acquisition behaviour of Inventor CEOs, given that this is one of the largest (and most
observable) investment decisions made by a firm. If Inventor CEOs possess unique skills
in evaluating innovation intensive investment opportunities, then they should exploit
these skills by focusing on targets with a high degree of innovation-related information
asymmetry. In line with this prediction we find that Inventor CEOs tend to target
private firms and firms with larger patent portfolios. We also show that when Inventor
CEOs acquire such targets, their firms attract significantly higher acquirer
announcements returns relative to firms that are led by non-inventor CEOs.
Second, we study the stock price reaction to new product announcements made
by Inventor CEO led firms. We show that stock market reacts more positively to the
new product announcements made by Inventor CEOs. This incremental value creation
suggests that the greater level of patenting observed for firms led by inventor CEOs
7
reflects the protection of valuable proprietary assets that translate into superior products
and thus increase value for shareholders. It also supports the notion that Inventor CEOs
possess superior skills in choosing to invest in products whose innovativeness appears to
be recognised with higher market returns.
The superior ability of Inventor CEO to select and evaluate investment projects may
not be the only channel through which their inventor experience matters. An Inventor
CEO may spur innovation in various other ways that we can not directly observe and
test in our study. First, an Inventor CEO may possess personal traits that naturally pre-
dispose them to innovative activity. For example, they may be more ‘open to new
experiences’ and thus willing to take more risks or have a higher tolerance for failure.
Inventor CEOs may naturally possess a more innovation centric leadership style (e.g.,
Bass and Avolio (1997), Jung, Chow and Wu (2003), Tierny, Farmer and Graen (1999),
Amabile (1996), Yukl (2001)). Acemoglu, Akcigit and Celik (2014) show that such
personal characteristics can have a significant impact on corporate innovation. Second,
given this predisposition of inventor CEOs, then they may also be more likely to invest
firm resources into innovative projects, relative to their non-inventor counterparts. It is
possible that such personal characteristics that are unique to Inventor CEOs can also
explain our results.
Our paper makes several contributions to the literature. Firstly, we contribute to
the corporate innovation literature, by uncovering a new CEO characteristic which can
positively affect corporate innovation. This builds on recent work such as Custodio et
al. (2017) and Sunder et al. (2016) who show that generalist CEOs and sensation seeking
CEOs, positively affect corporate innovation. Our finding that Inventor CEOs appear to
be more capable of facilitating innovation in their firms, adds to the understanding of
why some firms are more innovative than others (Acemoglu et al. (2014)).
Secondly, we uncover a new observable CEO trait that has a meaningful economic
link with an important firm outcome. Bertrand and Schoar (2003) show that “manager
8
fixed effects” can be, in part, attributed to observable individual characteristics such as
education (MBA graduation) and year of birth (cohort effects). Using assessments of
CEO candidates of companies for Private Equity transactions, Kaplan, Klebanov and
Sorensen (2012) also show that there are substantial variations in general managerial
talent and that performance is strongly related to a general talent factor. One could
argue that this first-hand innovation experience of Inventor CEOs reflects a measure of
CEO abilities that was previously undocumented by researchers. More importantly, we
show that this particular dimension of CEO ability has a critical relationship with
corporate innovation.
Finally, our findings complement existing studies on how heterogeneity in CEO
characteristics influences firm outcomes. These studies broadly suggest that CEOs
having particular career experience can affect firm-level policies and thus firm outcomes.
Daellenbach et al. (1999) find that higher R&D spending is associated with top
management teams and CEOs’ having technical work experience. Custodio and Metzger
(2013, 2014) show that a CEO’s specific expertise affects acquisition returns as well as
corporate policies and firm value. Dittmar and Duchin (2015) show that CEOs with
distress experience use less debt, save more cash and invest less than other CEOs. Bernile
et al. (2017) show a non-monotonic relation between CEO’s early-life exposure to fatal
disasters and corporate risk taking.
2222 Data & SampleData & SampleData & SampleData & Sample
2.12.12.12.1 Firm level innovation Data:Firm level innovation Data:Firm level innovation Data:Firm level innovation Data:
9
Since a significant majority of innovation inputs comes from high-tech industries, our
sample focuses only on publicly traded firms in high-tech industries in the S&P 1500
from 1992-2008 for which we have reliable data on CEO characteristics from ExecuComp.
Brown et al. (2009, Pg. 154) report that high-tech industries accounted for more than
two-thirds of aggregate R&D spending in recent years. High-tech industries are defined
following Loughran and Ritter (2004)2. We exclude regulated financial firms and utilities
in our sample as they have negligible R&D investments.
For a firm to be included in our sample, we first require that it is present in the
Kogan, Papanikolaou, Seru amd Stoffman (2016) (henceforth KPSS) Patent data. The
KPSS patent data set provides data for all patents that are granted by U.S. Patent and
Trademark Office (USPTO) over 1926-2010. The dataset provides information on the
number of patents, the number of citations received by each patent, etc., on each patent
filed with the U.S. Patent and Trademark Office (USPTO). We follow the innovation
literature and date the patents by the year of their application (Hall, Grilches and
Hausman (1986)). This also ensures that anomalies caused by the time lag between the
applications and the grant date of a patent are taken care of. We restrict the sample to
patents applications up to 2008 considering that patents applied for after 2008 may not
appear in the dataset because of the time lag in granting patents.
We use the KPSS (2016) patent data instead of the NBER patent data since the
KPSS patent data enable us to identify comprehensive patent portfolios of the firms that
filed application up to 2008 when we restrict our sample. The NBER patent data would
enable us to keep patents applied for only up to 2004. We use PERMNO of the assignee
of KPSS patent data to merge the patent data with Compustat and CRSP. In the
2 Specifically, it includes industries such as computer hardware (SIC codes 3571, 3572, 3575, 3577,
3578); communications equipment (3661, 3663, 3669); electronics (3671, 3672, 3674, 3675, 3677, 3678,
3679); navigation equipment (3812); measuring and controlling devices (3823, 3825, 3826, 3827, 3829);
medical instruments (3841, 3845); telephone equipment (4812, 4813); communications services (4899); and
software (7371, 7372, 7373, 7374, 7375, 7378, 7379).
10
baseline OLS based specifications, we assign zero to firm-years observations without any
patenting activity.
2.22.22.22.2 IdentifyingIdentifyingIdentifyingIdentifying Inventor CEOsInventor CEOsInventor CEOsInventor CEOs
A major challenge in identifying the effect of CEOs having patenting experience on
corporate innovation is construction a credible dataset of Inventor CEOs. We use the
US Patent Inventor Database from Li et al. (2014) (henceforth PID) to identify CEOs
in our panel who have been awarded at least one patent. We describe the matching of
the PID dataset to Execucomp in detail in the Appendix.
The majority of our financial data is from Compustat’s fundamentals annual data
and ExecuComp. CEO-specific data are collected from ExecuComp and Risk Metrics.
The final KPSS Patent-Compustat-CRSP-ExecuComp-Inventor CEOs merged file leaves
us with 4621 firm-year observations for 543 unique high-tech firms. Table II describes
the distribution of Inventor and non-Inventor CEOs.
2.32.32.32.3 MeasurMeasurMeasurMeasuringinginging of Innovatiof Innovatiof Innovatiof Innovativeveveve ActivityActivityActivityActivity
Following the extant literature (e.g., Hirshleifer et al. (2012)), we use number of
patents applied for (and subsequently granted) as a proxy for quantity of innovations.
To distinguish major technological breakthroughs from incremental technological
improvements, we also use the number of citations received by these patents to measure
quality of innovation.3
We also construct a number of additional variables that capture the efficiency of
innovation activities. Specifically, we construct log of citations scaled by Patents
3 Studies employing these two variables to measure innovation performance include among others
Hirshleifer et al. (2012), Seru (2014), Tian and Wang (2014), He and Tian (2013), Hsu, Tian and Xu
(2014) Fang, Tian and Tice (2014), Chemannur and Tian (2013), Bereskin and Hsu (2013), Kang, Liu,
Low and Zhang (2014), Atanassov (2013)

11
(average citations) as this is expected to measures the average quality of the innovation.
Additionally, to distinguish ‘disruptive’ innovation form mere technological
improvement, we also construct a variable labelled, “Radical innovation”, a dummy
variable equals 1 if the patent has accumulated the maximum number of citations among
all patents applied in a given year and in a given industry. A similar variable is used in
Acemoglu et al. (2014) to distinguish incremental innovation from radical or disruptive
innovation. Specifically, they measure the fraction the patents of a company that are at
the 99th percentile of the overall citations distribution relative to those that are at the
median number of citations.
2.42.42.42.4 Identifying Identifying Identifying Identifying FounderFounderFounderFounder CEOCEOCEOCEOssss
Since no major dataset has compiled systematic data on founder-CEOs, we hand-
collect all relevant information on founders of all the firms in the sample. Specifically,
we collect the data related to names and number of founders of each firm, founding year,
etc., from several sources including 10-K filings of the firms with the SEC available
in Electronic Data-Gathering, Analysis, and Retrieval (EDGAR), the Funding Universe
website, company websites, and other Internet resources including Wikipedia, Forbes
pages, Bloomberg’s Business Week website, among others. ‘Founder-Dummy’ in a given
year is a dummy variable that equals one if any sources explicitly mention that the
current CEO is one of the original founders of the firm or was a main executive at the
time the company was founded (see, Adams et al. (2009) and Fahlenbrach (2009)).
2.52.52.52.5 Control variablesControl variablesControl variablesControl variables
In the baseline specifications, following the innovation literature, we control for
standard covariates that are important determinants of corporate innovation activities.
Our firm-level controls are Firm size defined as the natural log of book value of total

12
assets of the firm.4 Provision of sufficient access to innovation inputs (R&D expenditure)
is necessary but not sufficient condition for innovation success. Since it is plausible that
inventor CEOs could invest more in R&D to achieve above-average innovation success,
we control for R&D scaled by assets to shed light on the efficiency aspect of innovation.
We believe it is important to distinguish the association of innovation with
Inventor CEOs from its association with firm age and thus we control for firm age in all
our specifications since firms’ life cycle may affect corporate innovation. We also control
for other strategic investments such as capital expenditure scaled by assets. Since market
value is highly correlated with number of citations of patents, we also control for Log
(Tobin’s Q). The capital structure of R&D intensive firms customarily exhibits
considerably less leverage than other firms (Hall (2002)) since debt financing could lead
to ex post changes in managerial behavior. To account for differences in financial risk
between innovative and non-innovative firms, we control for a firms’ Book Leverage in
our baseline specifications.
One could argue that CEO tenure could also potentially impact innovation, since
firm specific CEO experience might lead to more efficient innovation, leading us to find
a spurious correlation between Inventor CEOs and corporate innovation. We, therefore,
control for CEO tenure in our baseline regressions. One might also argue that
differences in CEO specific human capital may be systematically different for the
inventor CEOs and thus impact corporate innovation differently. As such, we control
for CEO specific human capital using proxies used in the literature. Specifically, we
follow Malmendier and Tate (2008), Galasso and Simcoe (2011), to identify CEOs with
MBA5 or technical education. To control for CEOs’ expertise in the fields relevant for
4 Chemmanur and Tian (2013) and Sapra et al. (2014), among others, use natural log of assets to measure firm
size. Hirshleifer et al. (2012) and Kang et al. (2014), among others, use natural log of sales to measure firm size. Our
results are robust using alternative measurements of firm size. 5 We also consider CEOs’ acquiring Finance Education following Sunder et al. (2016) defined as an indicator
equal to one if CEO received a degree in accounting, finance, business (including MBA), or economics or zero
otherwise. We get similar results.

13
innovation, we follow Sunder et al. (2016) and create a separate indicator for CEOs who
hold PhDs in STEM (Science, Technology, Engineering, and Mathematics).
In robustness tests, we also control for CEO age (Acemoglu et al. (2014)), CEO
Ownership (Kim and Lu (2011)), CEOs extrinsic incentives such as log (1+Delta) and
log (1+Vega) (Sunder et al. (2016), Benabou and Tirole (2003)), Founder-CEO status
(Lee, Kim and Bae (2016)), CEO overconfidence (Hirshleifer et al. (2012), Galasso and
Simcoe (2011)), and show that our findings are not driven by these factors.
Later in the analysis, we use natural log of Tobin’s Q, log (Tobin’s Q) to measure the
market valuation of the firms. Tobin’s Q is estimated as firm’s market value to the book
value where market value is calculated as the book value of assets minus the book value
of equity plus the market value of equity.
2.62.62.62.6 Summary StatisticsSummary StatisticsSummary StatisticsSummary Statistics
We report the distribution of Inventor CEOs by year (Panel A) and by Fama-French
Industry (12) group (Panel B) in Table 1. We identify 150 unique Inventor CEOs in 134
unique firms. The percentage of Inventor CEOs ranges from 13.5% in 1993 to 23.2% in
2005. Many of the Inventor CEOs are in the Medical Equipment industry group followed
by Electronic Equipment industry group. In panel C of Table 1, we report the cumulative
number of patents Inventor CEOs have been granted as of 2008. A total of 48 Inventor
CEOs have been awarded a single patent grant, 19 have been awarded 2, while the rest
have been awarded more than 2 patents. We provide a list of Inventor CEOs with more
than 50 patent grants in Panel D of Table 1. The maximum number of patents that a
CEO has been awarded as a patentee in our sample is 222 by Steve Jobs of Apple Inc.
We provide descriptive statistics for the major variable used in this study in
Table 2. We classify the sample based on the Inventor CEOs variable, our main variable
of interest, and report the means, medians and standard deviations for the select
variables. We also compare the sample means and medians between the groups (Inventor

14
CEOs and Non-Inventor CEOs) and indicate the statistical significance by conducting
t-tests and Wilcoxon-Mann-Whitney tests. We find that a firm with an Inventor CEOs,
on average, has 11.34 (25%) more patents and 112.56 (15.78%) more citations counts
per firm-year observations compared to those of a firm run by Non-Inventor CEOs.
Importantly, average citations per patent are very high for Inventor CEOs run firms
compared to those of non-Inventor CEOs run firms (1.59 compared to 1.184) and
statistically highly significant at 1% level. Inventor CEOs, on average, have more
strategic investments. Specifically, Inventor CEOs run firms, on average, spend 1.56 %
more in R&D/assets compared to that of non-Inventor CEOs run firm and given the
sample mean of 8.72%, this translates to approximately 14% more inputs to innovation.
This suggests that Inventor CEOs provide the necessary access to resources for spurring
innovation. However, to ensure that this incremental spending on R&D is not driving
our results, we control for R&D in all our specifications of innovations. R&D is only an
input to the innovation process and Inventor CEOs may overspend on R&D, presumably,
because of their natural inclination towards such projects.
Regarding other control variables, Inventor CEO-run firms are, on average,
younger in age, use lower level of leverage and have higher market value. In terms of
CEO characteristics, Inventor CEOs have, on average, longer tenure and higher stock
ownership. We do not find any statistically significant differences in CEO age and CEO
equity-based pay for both the groups. Though there is statistically significant difference
in extrinsic incentives based on the Delta measure, median difference using Vega based
measure is not statistically significant.
3333 Baseline reBaseline reBaseline reBaseline resultssultssultssults
3.13.13.13.1 Effect of Inventor Effect of Inventor Effect of Inventor Effect of Inventor CEOs on firm level innovation outputs CEOs on firm level innovation outputs CEOs on firm level innovation outputs CEOs on firm level innovation outputs
To examine the effect of Inventor CEOs on corporate innovation, we estimating the
following empirical baseline OLS regressions:
15
Innovationi,t+n = α + βInventor − CEOi,t + γZi,t + Industryj + Yeart + εi,t (1)
Where i indexes firm and t indexes time and n indexes periods (1,2 years). Innovation
measure includes Patents i,t+n, Citations i,t+n, Avg Citations i,t+n, defined as log (1+# of
patents), log (1+# of Citations), and log (1+ #of Citations/patents) respectively. Since
the innovation process requires significant time to produce patentable innovation, we
examine the effect of Inventor CEOs on corporate innovation in subsequent periods (at
t+1 and t+2). Z is a vector of firm and CEO level control variables (described in previous
section) that have been found in the innovation literature to impact the innovation
outputs.
Presumably, the innovation performance of high-tech firms in S&P 1500 would
in part be driven by common unobserved year effects. As such, we incorporate year-fixed
effects in our models. Following Zhou (2001), to estimate the real effects of Inventor
CEOs on corporate innovation, which changes little over time but varies substantially
across firms, we do not use firm-fixed effects in our specifications since inclusion of firm
fixed effects absorbs any effect of Inventor CEOs. However, we expect differences in
variability to be more systematically related to industry; thus, we use industry-fixed
effects. Following Petersen (2009), we cluster standard errors at the firm level.
Table 3 reports the baseline findings. In columns 1 through 6, the coefficients of
Inventor CEOs are both positive and significant. Specifically, we find that Inventor
CEOs run firms are associated with approximately 27.64% more patents compared to
non-Inventor CEOs run firms (column 1)6. In addition, these Inventor CEOs run firms
are also associated with approximately a 27.64% higher citation count (column 3). This
suggests that Inventor CEOs run firms file patents that are of higher quality. Further,
these firms are also associated with approximately 25.34% more average citations
6 The mean value of Patents (t+1) is 1.7553. Therefore, the economic magnitude is calculated as
� �������(� + 1)⁄ / or 0.485/1.7553 or 27.64%. Similarly, we calculate such magnitude for Citations (t+1) and Average
Citations (t+1).
16
(column 5) underscoring their impactful innovation. Since innovation can materialize
over long periods of time, we also run the regressions using two-year ahead forward
looking innovation measures (yeart+2). We continue to find consistent association of
Inventor CEOs with corporate innovation.
The sign and magnitude of other control variables are broadly consistent with
literature. For example, the coefficient on R&D/Total Assets is positive and significant
in all the regressions. Larger firms (Firm size) are associated with higher quantity and
quality of innovations. Firm leverage is negatively associated with corporate innovation
consistent with literature (Hall (2002)). We also find positive coefficient on Tobin’s Q
consistent with the literature (Lerner (1994)).
4444 Identification StrategiesIdentification StrategiesIdentification StrategiesIdentification Strategies
4.14.14.14.1 Exogenous CEO turnoversExogenous CEO turnoversExogenous CEO turnoversExogenous CEO turnovers
As mentioned earlier, it is likely that highly innovative firms or firms with higher
innovation potential may hire Inventor CEOs who would ideally suit such organizational
settings. Inventor CEOs may also wish to join more innovative firms to exploit their
potential. Thus, the relationship that we find could be plagued by endogenous matching
of Inventor CEOs to highly innovative firms. Claiming causality thus hinges on
identifying a source of exogenous variation in CEOs that potentially breaks this
endogenous matching link. To tackle this endogeneity issue, ideally one would like to
have a natural experiment where one can randomly assign Inventor CEOs to firms and
observe the outcome of interest. Unfortunately, this is not feasible. Another alternative
could be to observe changes in CEO position caused by sudden death and study how
that affect corporate innovation. However, limited observations on sudden CEO deaths,
for the panel under study, renders such tests infeasible again. Alternatively, one could
study all CEO turnovers, in general, and study the effect of such incidents on corporate
innovation as in Galasso and Simcoe (2011) and Sunder et al. (2016). However, as

17
documented in the literature, many CEO transitions are also highly endogenous since it
is possible that CEO turnovers are related to the variable of interest.
To overcome this probable endogenous matching of Inventor CEOs by innovative
firms and provide causal evidence, we rely on data in Eisfeldt and Kuhnen (2013) that
classifies CEO turnovers during the period 1992-2006 as exogenous, forced and
unclassified turnovers. 7 They identify a CEO turnover as exogenous if the CEO
departures were announced at least six months before the succession, or caused by a
well-specified health problem. A similar approach (age based natural retirements as
exogenous cases of managerial changes) is followed in Denis and Denis (1995) and
Weisbach (1995). As argued in the literature (e.g., Fee, Hadlock and Pierce (2013)), we
do not use forced CEO turnovers and unclassified CEO turnovers since these events are
highly endogenous (e.g., Weisbach (1988), Warner, Watts and Wruck (1988), Fee and
Hadlock (2000)) that hinder causal interpretation.
Methodologically, we follow CEO switching analysis as in Galasso and Simcoe
(2011), however, deviate in terms of event selection. Galasso and Simcoe (2011) use 28
cases of CEO switching, regardless of CEO change type (endogenous or plausibly
exogenous). To deal with the endogeneity of CEO transitions, we conduct analysis on a
matched sample of only exogenous CEO turnovers. For “exogenous CEO turnover”
involving Inventor CEOs (our treated firms), we find corresponding matched firm-year
observations of exogenous CEO turnover events where a non-Inventor CEOs was
replaced by another non-Inventor CEOs (counterfactual or control firms). More
importantly, we also require that the matched event should be from the same 2 digit
SIC and within certain range of firm size8. When we merge the Eisfeldt and Kuhnen
(2013) data with our sample, we find 372 events of CEO changes of which 77 are
exogenous CEO turnovers. Of these 77 exogenous CEO turnovers, 15 CEO turnovers
7 https://sites.google.com/site/andrealeisfeldt/ . 8 We use within 15% of focal firm size to consider a probable match.
18
involve a transition from ‘Inventor CEOs’ to non-Inventor CEOs. From the remaining
exogenous CEO turnovers, we find the corresponding matches following the matching
criteria described above. Notably, we do not include those exogenous turnover events
where an Inventor CEOs was replaced by another Inventor CEOs or a non-Inventor
CEOs was replaced by an Inventor CEOs to conduct a cleaner test. We retain data for
firm-year observations from 3 years before exogenous CEO turnover and 3 years after
such exogenous turnover events for both the treated and the control firms.
We employ firm fixed effects specification in this matched sample of CEO
turnover analysis since we have variations (by construction) in our main explanatory
variable-Inventor CEOs. Specifically, we estimate the following regression
#$$%&'()%$*,++, = - + . /01'(12 3)04 25446 + 7 89%:1$%5; (50$%&10 +
< /01('21 3)04 25446 ∗ 89%:1$%5; /50$%&10 + >1'0+ + ?)04* + @*,+ (2)
Treated firm dummy is a dummy variable that takes the value 1 ( both in pre and
post exogenous turnover events) if the firm has experienced a CEO transition of Inventor
CEOs to non-Inventor CEOs or 0 otherwise for control firms (that is 0 if transition is
from non-inventor to non-Inventor CEOs). Exogenous turnover is a dummy variable
taking the value 1 in periods following such exogenous turnover and 0 for pre-exogenous
turnover. The coefficient on interaction term (Treated firm X Exogenous turnover) is of
particular interest. If there is any causal effect of Inventor CEOs on corporate innovation,
we would expect a negative coefficient on this interaction terms since the exogenous
change of Inventor CEOs to non-Inventor CEOs should cause a decline in innovation
efficiency. One more confounding factor that we should consider is unobservable time
invariant firm-level characteristics that could simultaneously determine changes in CEO
position and corporate innovation outcome. We take this into account by employing
firm-fixed effects with and without other potentially important firm and CEO
19
characteristics that we observe such as Firm size, R&D to Assets, CAPEX to Asset, log
(Tobin’s Q) and Founder-CEO status.
We report the results of the regressions in Table 4. In column 1, we find that the
interaction term is negative and significant implying that corporate innovations of firms
experiencing a transition from Inventor CEOs to non-Inventor CEOs decline significantly
compared to those of firms where non-Inventor CEOs were replaced by other non-
Inventor CEOs. We show that, post-exogenous CEO turnover, corporate innovation
increases for firms in general. However, for firms run by Inventor CEOs, we show an
economically sizable and statistically significant reduction in corporate innovation post
exogenous CEO turnover, thereby implying that the relationship between Inventor
CEOs and corporate innovation is causal with causation running from Inventor CEOs
to innovation.
4.24.24.24.2 QuasiQuasiQuasiQuasi----natural experiment: Shock basenatural experiment: Shock basenatural experiment: Shock basenatural experiment: Shock based causal inferenced causal inferenced causal inferenced causal inference
In this section we design a quasi-natural experiment using the staggered changes
of R&D tax credits across U.S. states and over time to examine whether the Inventor
CEOs responded differently to changes in incentives to innovate. This strategy enables
us to find plausibly exogenous sources of variation in incentives to innovate. Since we
have data on firms’ innovation outcomes, we can relate these changes in incentives to
innovation to changes in innovation outcomes.
More importantly, the staggered nature of the changes in R&D tax credit (shocks)
allows us to create appropriate counterfactual firms. We use two counterfactuals to
conduct two tests. First, we could also construct a set of non-Inventor CEOs (control
firms) from the states that have induced R&D tax credit shocks and compare their
responses against those of Inventor CEOs (treated firms) from the same shock inducing
states both in pre and post shock periods. This is methodologically similar to Almeida,

20
Kim and Kim (2015) which use Asian financial crisis of 1997 as a shock to study
differential responses of Chaebol (treated firms) and Non-Chaebol firm (Control firms).
In our context, since both Inventor CEOs (treated firms) and non-Inventor CEOs
(Control firms) are exposed to the same shock, this would enable us to provide causal
evidence since such shocks are plausibly exogenous. More importantly, we create the
sample of control firms by matching them with treated firms using pre-shock firm level
covariates and industry of operation. We report the results in Panel A of Table 5. We
show that the pre-treatment difference between the groups widens in the post-treatment
period in favour of the Inventor CEOs. More importantly, the difference-in-differences
is positive and significant which suggest that Inventor CEOs have a superior response
to such innovation enhancing incentives in ways that provides their firms with
competitive advantages.
However, the response of the Inventor CEOs to the shock can be driven by
unobservable firm characteristics that are correlated with having an Inventor CEO. To
address this, we use our second set of counterfactual firms which comprise of Inventor
CEOs from states that did not experience R&D tax credit shock. Within this group, any
difference will not be driven by unobservable heterogeneity. Since we are comparing
Inventor CEOs from states (e.g., California, Illinois) that experienced such shock
(treated group) to Inventor CEOs from other states (e.g., New York, Massachusetts)
that did not experience such a shock (control group), we can tease out whether Inventor
CEOs proactively take advantage of the change in the tax environment. This would
highlight their innovation-spurring ability as opposed to innovative firms who are just
matched with Inventor CEOs, since for both groups CEO assignment has already
occurred in pre-shock period.
Methodologically, this test is similar to Card and Kruger (1994) which compare
the impact of increase in minimum wage in New Jersey (law enacting states) to that of
eastern Pennsylvania (state that did not enact such law). In addition, following Card

21
and Krueger (1994), we match the control firms with treated firms on important pre-
shock dimensions. Specifically, we match the control firms based pre-treatment R&D
intensity, pre-treatment firm size and Industry of operation. Since we compare changes
in key outcomes from pre-shock period to post-shock period, our methodology
“differences out” unobserved time-invariant heterogeneity. We provide the difference-in-
difference Matching Estimator (DID-ME) in Panel B of Table 5.
In the pre-shock period, there is no statistically significant difference in innovation
outcomes (patents (t+1)) of Inventor CEOs run firms from shock inducing states
(treated firms) and Inventor CEOs run firms from states that did not induce such shocks
(control firms). In the post shock periods, we find statistically significant positive
difference in favor of the treated groups. More importantly, difference-in-differences is
positive and significant suggesting that Inventor CEOs from states that experienced such
shock outperformed the control group. This evidence underscores the innovation spurring
ability of the Inventor CEOs as opposed to endogenous matching based explanations.
4.34.34.34.3 Propensity score matched samplePropensity score matched samplePropensity score matched samplePropensity score matched sample
Though we control for observable firm and CEO characteristics in our baseline
specification, linear controls may not be sufficient since Inventor CEOs run firms may
differ systematically from non-Inventor CEOs run firms. In this section we provide
evidence on effect Inventor CEOs on corporate innovation using propensity score
matching (PSM) technique. Specifically, we estimate propensity scores using all the
control variables of baseline specification along with industry and year-fixed effects.
After estimating the propensity scores, we match each treated firm-years to
counterfactuals or control firm-year observations that (1) are from the exact same 2 digit
SIC industry, (2) have estimated propensity scores that differ from treated firms
propensity score by no more than 10% ( Caliper 0.10). Each Inventor CEOs firm-year
observation is matched to either one or two of its nearest neighbours.
22
The PSM procedure yields a more balanced sample of firm-year observations
where the firm characteristics are similar. We report the results of regressions for this
balanced sample in Table 6. In columns 1 through 4 (columns 5 through 8), we use one
(two) matches per treated firm. We continue to find positive effect of Inventor CEOs on
corporate innovation. Since this propensity score matched sample controls for observable
differences between Inventor CEOs run firms and non-Inventor CEOs run firms, this
PSM based analysis instils confidence in our interpretation by reducing the potential for
endogeneity induced by selection bias.
5555 Robustness Robustness Robustness Robustness AnalyAnalyAnalyAnalysissississis
We have so far established a positive causal relation between Inventor CEOs and
corporate innovation outputs. In this section, we analyse the robustness of this finding.
5.15.15.15.1 FounderFounderFounderFounder----CEO effectCEO effectCEO effectCEO effect
One could also argue that many of the Inventor CEOs could be Founder-CEOs. The
correlation coefficient between these two is substantial but not very high (0.28). Lee et
al. (2016) find strong association between Founder-CEO and corporate innovation
though causality could not be confirmed. We reconsider our baseline results controlling
for Founder-CEO dummy. We report the results in Table 7. Once again, controlling for
Founder-CEO in our regressions does not alter the coefficients on Inventor CEOs
significantly. Again, we split the full sample into Founder-CEO sample and Non-founder-
CEO sample to see if the Inventor CEOs effect varies depending on their founder-CEO
status. We show that Inventor CEOs effect remains in both the samples. Among the
Founder-CEOs, inventor-founder-CEOs (founders who have patent in their names) are
associated with higher innovation quantity and quality compared to those of non-
inventor founder-CEOs (founders who do not have patents in their names). We find
similar effect of Inventor CEOs in the non-founder CEOs sample. We report the results
23
in columns 1 through 6 in Table A 2 in the Appendix. We also employ a sub-sample
analysis where we remove non-Inventor CEOs from the sample and consider how
inventor founder-CEOs are different from professional Inventor CEOs in terms of their
effect on corporate innovation. Although the coefficient on inventor Founder-CEO is
positive, it is not significant. We report the results in column 7 through 9 in Table-A 2
in the Appendix.
5.25.25.25.2 OverOverOverOver----confident CEO effectconfident CEO effectconfident CEO effectconfident CEO effectssss
We consider the arguments in Hirshleifer et al.(2012) and Galasso and Simcoe
(2011) which show that CEO-Overconfidence influence firms’ innovation activity.
Following Malmendier and Tate (2005) and Hirshleifer et al. (2012), we construct CEO
overconfidence measure based on CEOs’ option-exercise behavior. We classify CEOs as
overconfident if she chooses to hold vested options that are at least 67% in the money.
We report the results in Table 7. We continue to find positive effect of Inventor CEOs
on corporate innovation of similar magnitude.
5.35.35.35.3 GenGenGenGeneeeeralist CEO ralist CEO ralist CEO ralist CEO effecteffecteffecteffectssss
We consider the possibility that Inventor CEO proxy is picking up the specialist
ability of the CEOs. Custodio et al. (2017) show that CEOs’ general ability is innovation
spurring. We collect the data from Custodio et al. (2017) and show in Table 7 (columns
7 through 9) that the Inventor CEO effect that we document is robust and is not driven
by the CEOs general ability measure.
5.45.45.45.4 CEO CEO CEO CEO RRRRecent patenting expeecent patenting expeecent patenting expeecent patenting experience and corporate Innovationrience and corporate Innovationrience and corporate Innovationrience and corporate Innovation
Inventor CEOs’ presumably have persistent traits that influence corporate culture
of innovation. However, one might argue that CEOs who have been awarded patent
grants very recently would arguably be more influential in inspiring corporate innovation

24
and acting as a “charismatic role model’. That is, the positive effect of Inventor CEOs
on corporate innovation may be more pronounced if they have recently gained such
experience or have been awarded patent grants on a frequent basis. This phenomenon
also suggests that CEOs have direct involvement in corporate innovation. If a positive
effect of Inventor CEOs on corporate innovation truly exists, one would expect that
innovation-active CEOs would have a stronger effect on innovation.
To test this conjecture, we define ‘Innovation-active CEO’ as a dummy variable
taking the value 1 if CEOs have been awarded a patent within 2 years of each firm-year
and 0 otherwise. Defined in this way, Innovation-active CEO reflects the degree of CEOs’
involvement in the corporate innovation in recent times. For example, a CEO who has
been awarded a patent grant in 1985 would not be considered an Innovation-active CEO
in 1992. However, a CEO-patentee with a patent grant in 1994 would be considered an
Innovation-active CEO in year 1992 through 1996 (within 2 years of focal firm-year).9
We assign 1 to last two years before the patenting year since innovation normally takes
long time to materialize and therefore we assume CEO must have been active innovator
in the last two years as well. Again, if she has not been awarded a patent beyond 1994,
then the dummy variable would take the value 0 in 1997. Though this construction of
Innovation-active CEO does not treat the CEO innovativeness as a persistent trait
beyond two years from the year of innovation, we would end up with a lower bound for
coefficient estimate of Inventor CEOs since we classify CEOs who have patenting
experience in distant past in the comparison group. Since we classify a group of the
Inventor CEOs who are not active innovators in recent years in the comparison group,
this classification would actually works against us in finding a strong positive effect of
Inventor CEOs on corporate innovation. We report the results of the regressions in Table
8. We find that the coefficient on Innovation-active-CEO is even larger with higher
9 We also try within 3 years of focal firm-year and find qualitatively similar results.

25
statistical significance. This suggests that CEOs’ direct involvement in the innovation
process in recent past exerts a greater influence on corporate innovation.
5.55.55.55.5 Alternative dependent variablesAlternative dependent variablesAlternative dependent variablesAlternative dependent variables----RadicalRadicalRadicalRadical innovationinnovationinnovationinnovation
In motivating their study on openness to disruption and creative innovation,
Acemoglu et al. (2014) provide two examples of radical innovation: 1) “systems and
methods for selective electrosurgical treatment of body structures” by the ArthroCare
Corporation which garnered 50 citations ( compared to median citations of four within
field of drugs and medical innovation) and 2) “method and system for placing a purchase
order via a communications network” by Amazon which garnered citations 263 citations
( compared to median citations of five within the technology class) within five years
(2088 citation as of date)10. Interestingly, both firms are also among the firms run by
Inventor CEOs in our sample. In case of Arthrocare Corporation, CEO Michael A. Baker
is an active innovator awarded with as many as 12 patents. In the second example,
Jeffrey P. Bezos himself is one of the four co-patentees of this radical innovation and
thus an Inventor CEOs as per our definition.
In this section we test whether Inventor CEOs, on average, are associated with
radical or break-through innovations. We define radical innovation as those patents in
industry-year pairs that have been cited the maximum number of times thereby
indicative of being very highly influential and radical in nature. Specifically, ‘Radical
Innovation’ is dummy variable taking the value one if the firm has filed the patent that
accumulated the maximum number of citation in the industry-year pair. This
construction of innovation measure is similar to ‘tail innovations’ as in Acemoglu et al.
(2014) who define tail innovation using overall citations distributions (specifically,
patents cited at the 99th percentile of the citations distribution). We report the results
of the regressions in Table 9. In columns 1 through 3, we report the results from the
10 https://www.google.com.au/patents/US5960411
26
probit model. In the last column, we report the results form OLS specification. Overall,
we show that Inventor CEOs run firms are associated with higher probability of filing
patents that are radical in nature. Therefore, Inventor CEOs are associated with
innovations that cause the most fundamental “creative destruction” (Acemoglu et al.
(2014)).
5.65.65.65.6 Alternative econometric specificationAlternative econometric specificationAlternative econometric specificationAlternative econometric specificationssss
In the innovation literature, the use of OLS specifications (e.g., Hirshleifer et al.
(2012), He and Tian (2013)) and Poisson specifications (Galasso and Simcoe (2011),
Aghion et al. (2013)) are common. Aghion et al. (2013) also use Poisson model, where
mean equals the variance but also consider alternative such as Negative Binomial
regressions in the context of corporate innovation. They adopt the log-link formulation
considering the count based nature of patent data. Sunder et al. (2016) mention about
formal tests rejecting the assumption that residuals in OLS specification follow log-
normal distribution. Since all our models use firm level clustering, allowing the standard
errors to have arbitrary heteroskedasticity and autocorrelation as in Aghion et al. (2013),
the exact functional form of the error distribution is not so important. Nevertheless, to
ensure that our results are not driven by our choice of modelling technique, we also run
Poisson regressions and Negative Binomial Regressions and report the results in Table
A 3 in appendix. We find even stronger coefficients on Inventor CEOs dummy (both
economically and statistically).
5.75.75.75.7 Alternative Alternative Alternative Alternative FFFFixed effects estimationixed effects estimationixed effects estimationixed effects estimation
In the baseline specification, we use year fixed effects and industry fixed effects
to control for systematic variation in innovation activities across year and industries.
One could argue that unobserved time-varying industry shocks could affect corporate
innovation activity. Therefore, instead of year fixed effects and industry fixed effects, we

27
employ industry-year interacted joint fixed effects to rule out such possibility. We report
the results in Table A 4 in the appendix. We show that controlling for time-varying
changes in industry condition do not drive our results.
5.85.85.85.8 CEOCEOCEOCEO----tenure tenure tenure tenure BBBBased ased ased ased AAAAnalysis nalysis nalysis nalysis
Again, reverse causality concerns may plague our interpretation of the results
since it is possible that the relation between the presence of an Inventor CEOs and
corporate innovation is spurious. However, endogenous matching and Inventor CEOs
having a causal effect on innovation are not mutually exclusive interpretations. The fact
that Inventor CEOs are more capable of spurring corporate innovation, may well explain
why a firm would want to match with such a CEO. To provide more insights into
whether the effect of Inventor CEOs on innovation is causal or arises due to matching,
we closely follow Hirshleifer et al. (2012). While the traits that characterise Inventor
CEOs’ are presumably persistent, a firm’s growth and innovation opportunities are time-
variant, driven by changes in competitive environment. Thus, if Inventor CEOs are hired
only because firms anticipates higher innovation opportunities in the near future, then
the matching effects would be stronger when such Inventor CEOs are newly hired.
Conversely, we would expect significantly higher coefficient estimates in the sample
where the matching effects are less important if the causal effect of Inventor CEOs on
innovation truly exists. To test this conjecture, we split the sample based on CEO-tenure
being less than four years (more than four years) where matching is presumably more
important (less important).11 We report the results in Table 10. We show that effect of
Inventor CEOs on corporate innovations is stronger in the sample where matching is
less of a concern thereby suggesting a causal effect of Inventor CEOs on corporate
innovations.
11 We also try with sample-split based on CEO tenure less (more) than three years and find consistent evidence.
The results are reported in Appendix. (Table A 5).

28
5.95.95.95.9 ControllingControllingControllingControlling for for for for InternalInternalInternalInternal and and and and ExternalExternalExternalExternal Corporate governance Corporate governance Corporate governance Corporate governance
One could also argue that some important aspects of corporate governance of the
firms may jointly determine corporate innovation and the presence of an Inventor CEOs
in the firm. Aghion et al. (2013) show that external corporate governance by institutional
investors may enhance corporate innovations by reducing CEOs’ career concern. Kim
and Lu (2011) also show relationship of R&D investments with CEO ownership in the
context of strength of corporate governance. Therefore, we control for institutional
holdings and CEO ownership in the firms to control for this possibility. In addition, a
board that is co-opted by a CEO may be more supportive of CEOs’ decisions. Coles,
Daniel and Naveen (2014) show ‘co-option’, the fraction of the board comprised of
directors appointed after the CEO assumed office, is positively associated with increase
in investment and reduction in turn-over performance sensitivity. Therefore, to make
sure that our results are not driven by such joint determination by co-opted board, we
include ‘co-option’ in our specification and show the results in Table A 6 in the appendix.
This reduces the sample size due to data requirements. We use the data used in Coles
et al. (2014) on co-option to conduct this robustness check. In columns 1 through 3, we
run the regression including these variables separately and all of them together in column
4 along with the baseline control variables. We continue to find consistent and even
stronger positive effect of Inventor CEOs on corporate innovation. Notably, the
coefficient of institutional holdings is negative and significant in column 1, but negative
and insignificant in column 4. This is consistent with Sunder et al. (2016), Hirshleifer et
al. (2012), Lee et al. (2016) which also find negative coefficient on Institutional holdings.
Again using average Citations as dependent variable in column 6, we find positive and
significant coefficient on Institutional holdings which is consistent with Aghion et al.
(2013).

29
5.105.105.105.10 Controlling for CEO extrinsic Controlling for CEO extrinsic Controlling for CEO extrinsic Controlling for CEO extrinsic IIIIncentivencentivencentivencentivessss for for for for IIIInnovationnnovationnnovationnnovation
Manso (2011) argues that commitment to long-term compensation plans is important
to encourage innovation. In the context of managerial compensation, Manso (2011)
argues that optimal innovation-motivating incentive scheme can be implemented via a
combination of stock options with long-vested periods, option repricing, golden
parachute and managerial entrenchment. Empirically, Hirshleifer et al. (2012), Galasso
and Simcoe (2011) and Sunder et al. (2016), control for CEO extrinsic motivation
proxied by CEO Delta and CEO Vega in the context of corporate innovation. Coles et
al. (2006) and Sunder et al. (2016) find a positive association between CEO Vega and
R&D spending. To ensure that our findings are not driven by omission of these aspects
of CEOs’ extrinsic motivation, we control for CEOs’ Delta and CEO Vega in our
specification and report the results in Table A 7 in the Appendix. Inclusion of these
variables makes our findings even stronger (economically and statistically). While the
coefficient on CEO Delta is not statistically significant, we find that CEO Vega measure
is positively associated with the Average Citations variable (columns 5 and 6). This is
consistent Lee et al. (2016) and Sunder et al. (2016).
5.115.115.115.11 VVVValualualualueeee Creation by Inventor CEOsCreation by Inventor CEOsCreation by Inventor CEOsCreation by Inventor CEOs
While we have provided evidence suggesting a causal relation between Inventor
CEOs and corporate innovation, this needs to be value enhancing for all firms. In this
section we test whether Inventor CEOs indeed generate greater market value for
shareholders.
We use Tobin’s Q as the dependent variable to measure market valuation and
report the results in Table 11. We find that Inventor CEOs are associated with higher
market valuation and the magnitude is both economically and statistically significant.
The results hold even after controlling for relevant CEO characteristics such as CEO

30
tenure, CEO ownership, CEO-Founder status and other relevant firm relevant firm level
characteristics. This suggests that Inventor CEOs indeed create value for the
shareholders they serve in addition to playing an important economic function by
spurring high impact innovation.
6666 Channels through which Inventor CEOs facilitate Channels through which Inventor CEOs facilitate Channels through which Inventor CEOs facilitate Channels through which Inventor CEOs facilitate
innovationinnovationinnovationinnovation
6.16.16.16.1 The Acquisition Behaviour of Inventor CEOsThe Acquisition Behaviour of Inventor CEOsThe Acquisition Behaviour of Inventor CEOsThe Acquisition Behaviour of Inventor CEOs
While we conjecture that Inventor CEOs can spur greater innovation at their
firms for various reasons, our evidence thus far does not nail down any specific channels
through which this occurs. In this section, we focus on whether the investment decisions
of Inventor CEOs reflect a superior ability to identify and evaluate innovation-intensive
investment opportunities. To do this we focus on acquisitions made by firms in our
sample. Acquisitions are among the largest investment decisions made by firms and
importantly, possess many observable characteristics that make it possible to identify
differences between the acquisition behaviour of Inventor versus non-Inventor CEOs.
We expect that Inventor CEOs have a greater ability to evaluate the innovative
potential of investment projects because of their own first-hand knowledge of the
innovation process. In the context of the M&A market, this advantage has several
testable empirical implications. First, we expect that Inventor CEOs should exploit their
information advantage to acquire other innovation-intensive firms. Second, their
advantage should be most valuable when it is hard to value the innovation intensive
assets of the target, and third such acquisitions by Inventor CEOs should create more
value for shareholders relative to similar acquisitions conducted by non-inventor CEOs.
We test these predictions by assembling a set of acquisitions made by our sample
firms from the SDC database from 1992-2008. In deal selection, we follow Masulis, Wang
and Xie (2007). Specifically, we require the following criteria:
31
1. The Acquisition is complete.
2. The acquirer controls less than 50% of the shares prior to the announcement
and owns 100% of the target’s share after the transaction.
3. The deal value is more than $ 1 million and at least 1% of the acquirer’s
market value of equity measured on the 11th trading day prior to the
announcement date.
4. The Acquirer has annual financial statement information available from
Compustat and stock return data from CRSP.
Our first empirical test focuses on whether Inventor CEOs target firms with
greater patent intensity. To test this, we employ logistic regression where the dependent
variable is an indicator variable which takes the value 1 if the target in a M&A deal is
a firm that has received patent grants in the past. The results in Table 12, column 1
show that the Inventor CEO dummy is positive and statistically significant and thus
suggest that Inventor CEOs are more likely to select innovative firms as targets. An
alternative interpretation of this results, is that Inventor CEOs may also be better able
to integrate the technologies of both the acquirer and target. In column 2, we also control
for other deal specific characteristics and find similar results.
Next, we examine whether Inventor CEOs have a greater propensity to acquire
private targets. Presumably private targets should have greater information asymmetry
and thus inventor CEOs should have a greater advantage in making value accretive
acquisition decisions with respect to these firms. We test this in columns 3 and 4 of
Table 12 where the dependent variable is an indicator that takes the value 1 if the target
in a M&A deal is a private firm. The results in suggest that indeed Inventor CEOs have
a greater propensity to acquire private firms.
An inventor CEO’s decision to acquire private innovative targets can be risky for
shareholders given the information asymmetry surrounding such deals. Thus, our final
test seeks to determine whether such deals are perceived to be value enhancing. In
32
particular, we explore whether the innovation-specific experience of a CEO impact the
market’s perception of a quality of a deal. To test this implication, we calculate 5-day
cumulative abnormal returns (CARs) during the window encompassed by event days (-
2, +2), where event day 0 is the announcement day of acquisition (Masulis et al. (2007)).
We also control for other determinants of acquirers returns following the M&A
literature. Specifically, we control for host of firm level characteristics such as firm size
(Moeller, Schlingemann, and Stulz (2004), leverage (Garvey and Hanka (1999)), Cash
to assets ratio (Jensen (1986)), Tobin’s Q (Lang, Stulz, and Walking (1991); Servaes
(1991); and Moeller et al. (2004)) among other control variables. We also control for our
baseline CEO characteristics. In addition, we control for deal-specific characteristics
such as public target indicator and private target Indicator (Fuller, Netter, and
Stegemoller (2002), relative deal size (Asquith, Brunner, and Mullins (1983); Moeller et
al. (2004)), diversifying deal indicator (Morck, Shleifer, and Vishny (1990)). Controlling
for a host of factors that can affect acquisition announcement returns, we find that
acquiring firm led by an Inventor CEO experience significantly higher announcement
returns. The coefficient estimates in column 1 of Table 13 suggest that Inventor CEOs
increase firm value by about 0.8% from M&A deal announcements.
Inventor CEOs’ advantage in valuing the innovation intensive assets of the target
should be most valuable when the information asymmetry is high. Specifically, when the
target firms are private and /or have patent portfolios, market should weigh in the first-
hand innovation experience of the Inventor CEOs more positively. To test this
hypothesis, we conduct two separate tests. First, we split the sample into private targets
and non-private targets. Second, we split the sample based on whether the target is a
private firm that also has received patents in the past. We present the results of these
tests in columns 2 and 3 (Private vs. non-private split) and in columns 4 and 5 (Private
and innovative targets vs. non-private and non-innovative targets) of Table 13. The
results indicate that the magnitude of this effect is around 1.4 percentage points, on an
33
average, when the target firms are private. More importantly, we find even more strong
market response of about 3 percentage points for Inventor CEOs when the targets are
private and innovative firms. The economic magnitude of this effect is quite significant
given that on average the announcement returns to an acquisition on a target firm is
about 0.17%, in our sample.
6.26.26.26.2 Market reactions toMarket reactions toMarket reactions toMarket reactions to major product announcementmajor product announcementmajor product announcementmajor product announcementssss
In this section, we provide additional evidence on incremental value creation using
abnormal positive stock market reactions from major product announcements. Since
Inventor CEOs cause higher innovation productivity, it is more likely that such
innovation success would translate to introduction of breakthrough products. Chaney
and Devinney (1992) provide direct evidence on firms’ earning significant excess return
on announcing new products or services. They also show that truly new product or
innovations are shown to outperform the simple reformulation of existing products. Since
we document that Inventor CEOs run firms generate radical innovation or breakthrough
innovations, the likelihood of introducing truly new products by Inventor CEOs run
firms would be high. As such, Inventor CEOs run firm are more likely to generate
incremental value from positive abnormal announcement returns from announcements
of such breakthrough products. We test this conjecture by collecting data on new
product announcement returns from Mukherjee, Singh and Zaldokas (2016)12 and present
the results in Table 14.
Mukherjee et al. (2016) combine textual analysis with event studies on stock
market returns to construct the new product announcement returns. They implement
event study methodology by fitting a market model over (-246,-30) period, and then
estimate cumulative abnormal returns over the three (-1, 1) day period around a firm
12 https://sites.google.com/site/abhiroopmukherjee/

34
corporate press release related to product announcement. Specifically, in column 1 we
show that Inventor CEOs run firms enjoy approximately 20 basis point higher
announcement returns over the year and this is both economically and statistically
significant. In column 2, we run regression using the log of number of new product
announcements with cumulative returns above the 75 percentile as dependent variable.
A positive coefficient (large and statistically significant) confirms our conjecture that
Inventor CEOs indeed are associated with more breakthrough product announcements.
Thus, this test provides direct evidence on incremental value creation by the Inventor
CEOs.
7777 ConclusionConclusionConclusionConclusion
In this paper we argue that Inventor CEOs are more capable of fostering
innovation within an organization and that this has significant impact on corporate
innovation. We identify Inventor CEOs as those who have patents in their own names
and hence possess demonstrated ability and first-hand experience in innovation. We
argue that inventor CEOs with a superior ability to select and evaluate innovative
investment opportunities and can foster a corporate culture where innovation can thrive.
We show that Inventor CEOs provide their firms with a competitive advantage through
greater, more efficient and more impactful innovation, in industries where innovation is
the name of the game.
We use exogenous CEO turnover and staggered changes in state level R&D tax
credits as identification strategies to infer causality. The evidence is suggestive of causal
relationship between Inventor CEOs and corporate innovation with causality running
from Inventor CEOs to innovation. Exploring the channels through which Inventor
CEOs spur greater innovation at their firms, we find evidence consistent with the notion
that they possess a superior ability to identify innovative investment opportunities and
products. We contribute to the understanding on the effect of CEO characteristics on
firms’ outcome by offering a new identifiable CEO characteristic that is measurable,
35
independently verified under rigorous scrutiny of patent examiners of a USPTO and is
meaningfully related to an important firm outcome.
ReferenceReferenceReferenceReferencessss
Acemoglu, D., Akcigit, U., & Celik, M. A. (2014). Young, restless and creative:
Openness to disruption and creative innovations (No. w19894). National
Bureau of Economic Research.
Adams, R., Almeida, H., & Ferreira, D. (2009). Understanding the relationship
between founder–CEOs and firm performance. Journal of empirical
Finance, 16(1), 136-150.
Adams, R. B., H. Almeida, and D. Ferreira. 2005. Powerful CEOs and their impact
on corporate performance. Review of Financial Studies 18:1403–32.
Aghion, P., Van Reenen, J., & Zingales, L. (2013). Innovation and institutional
ownership. The American Economic Review, 103(1), 277-304.

36
Alchian, A. (1963). Reliability of progress curves in airframe production.
Econometrica: Journal of the Econometric Society, 679-693.
Almeida, H., KIM, C. S., & Kim, H. B. (2015). Internal capital markets in business
groups: Evidence from the Asian financial crisis. The Journal of Finance, 70(6),
2539-2586.
Amabile, T. M. (1996). Creativity in context: Update to the social psychology of
creativity. Boulder, CO: Westview Press.
Arrow, Kenneth J. "The Economic Implications of Learning by Doing." Rev. Econ.
Studies 29 (June 1962): 155-73
Asquith, Paul, Robert F. Bruner, and David W. Mullins, Jr., 1983, The gains to
bidding firms from merger, Journal of Financial Economics 11, 121–139
Atanassov, J., 2013. Do hostile takeovers stifle innovation? Evidence from
antitakeover legislation and corporate patenting. Journal of Finance 68,
1097–1131.
Bass, B. M., & Avolio, B. J. (1997). Full range leadership development: Manual for
the Multifactor Leadership Questionnaire (pp. 43-44). Palo Alto, CA: Mind
Garden.
Benabou, R., Tirole, J., 2003. Intrinsic and extrinsic motivation. Review of
Economic Studies 70, 489–520
Bennedsen, M., F. Pérez-González, and D. Wolfenzon. 2007. Do CEOs matter?
Working Paper, Columbia University.
Bereskin, F., & Hsu, P. H. (2013). New dogs new tricks: CEO turnover, CEO-related
factors, and innovation performance. Working paper series. SSRN.
Bertrand, M. and A. Schoar (2003). Managing with Style: The effect of Managers
on Firm Policies. Quarterly Journal of Economics, 118(4), 1169-1208.
Bloom, N., Schankerman, M., & Van Reenen, J. (2013). Identifying technology
spillovers and product market rivalry. Econometrica, 81(4), 1347-1393.
Brown, J.R., Fazzari, S.M. and Peterse, B.C (2009). Financing Innovation and
Growth: Cash Flow,External Equity, and the 1990s R&D Boom. The Journal of
Finance, 64 (1).
Buckler, S. A., & Zien, K. A. (1996). The spirituality of innovation: learning from
stories. Journal of Product Innovation Management, 13(5), 391-405.
Bushee, B. J. (1998). Investors on Myopic R&D Investment Behavior. The
accounting review.
Campbell, T. S., & Marino, A. M. (1994). Myopic investment decisions and
competitive labor markets. International Economic Review, 855-875.
Card, D. & Krueger, A.B., 1993. Minimum wages and employment: A case study
of the fast food industry in New Jersey and Pennsylvania. The American
Economic Review, Vol. 84, No. 4. (Sep., 1994), pp. 772-793
Celikyurt, U., Sevilir, M., & Shivdasani, A. (2012). Venture capitalists on boards of
mature public firms. The Review of Financial Studies, 27(1), 56-101.
37
Chaney, P.K. & Devinney. T. M. (1992), New product announcement and stock
price performances. Journal of Business Finance & Accounting, 19(5),677- 695.
Chemmanur, T. J., & Tian, X. (2013, March). Do anti-takeover provisions spur
corporate innovation?. In AFA 2012 Chicago Meetings Paper.
Custódio, C., & Metzger, D. (2013). How do CEOs matter? The effect of industry
expertise on acquisition returns. Review of Financial Studies, 26(8), 2008-
2047.
Custódio, C., & Metzger, D. (2014). Financial expert CEOs: CEO׳ s work
experience and firm׳ s financial policies. Journal of Financial
Economics, 114(1), 125-154.
Custodio, C., Ferreira, M. A., & Matos, P. P. (2017). Do general managerial skills
spur innovation? Management Science (forthcoming)
Coles, J. L., Daniel, N. D., & Naveen, L. (2006). Managerial incentives and risk-
taking. Journal of Financial Economics, 79(2), 431-468.
Coles, J. L., Daniel, N. D., & Naveen, L. (2014). Co-opted boards. Review of
Financial Studies, 27(6), 1751-1796.
Daellenbach, U. S., McCarthy, A. M., & Schoenecker, T. S. (1999). Commitment to
innovation: The impact of top management team characteristics. R&D
Management, 29(3), 199-208.
Datta, D. K., & Guthrie, J. P. (1994). Executive succession: Organizational
antecedents of CEO characteristics. Strategic Management Journal, 15(7),
569-577.
Denis, D. J., and D. K. Denis. 1995. Performance changes following top
management dismissals. Journal of Finance 50:1029–57.
Dittmar, A., & Duchin, R. (2015). Looking in the rearview mirror: the effect of
managers' professional experience on corporate financial policy. The Review of
Financial Studies, 29(3), 565-602.
Eisfeldt, A. L., & Kuhnen, C. M. (2013). CEO turnover in a competitive assignment
framework. Journal of Financial Economics, 109(2), 351-372.
Fahlenbrach, R. (2009). Founder-CEOs, investment decisions, and stock market
performance. Journal of financial and Quantitative Analysis, 44(02), 439-466.
Fang, V., Tian, X., Tice, S., 2014. Does stock liquidity enhance or impede firm
innovation? Journal of Finance 69, 2085–2125.
Farson, Richard, and Ralph Keyes, 2002, Whoever Makes the Most Mistakes
Wins: The Paradox of Innovation (The Free Press, New York, NY).
Fee, C. E., & Hadlock, C. J. (2000). Management Turnover and Product Market
Competition: Empirical Evidence from the US Newspaper Industry. The
Journal of Business, 73(2), 205-243.
Fee, C., Hadlock, C., Pierce, J., 2013. Managers with and without style: Evidence
using exogenous variation. Review of Financial Studies 26, 567–601.

38
Fuller, Kathleen, Jeffry Netter, and Mike Stegemoller, 2002, What do returns to
acquiring firms tell us? Evidence from firms that make many acquisitions, Journal
of Finance 57, 1763–1794.
Galasso, A., Simcoe, T., 2011. CEO overconfidence and innovation. Management
Science 57, 1469–1484.
Garvey, Gerald T., and Gordon Hanka, 1999, Capital structure and corporate
control: The effect of state antitakeover laws on firm leverage, Journal of Finance 54,
519–546
Bernile, G., Bhagwat, V., & Rau, P. R. (2017). What Doesn't Kill You Will Only
Make You More Risk‐Loving: Early‐Life Disasters and CEO Behavior. The Journal
of Finance, 72(1), 167-206.
Graham, J. R., Harvey, C. R., & Rajgopal, S. (2005). The economic implications of
corporate financial reporting. Journal of Accounting and Economics, 40(1), 3-
73.
Griliches, Z. (1992). Introduction to" output measurement in the service sectors".
In Output measurement in the service sectors (pp. 1-22). University of Chicago
Press.
Hall, B. H., Griliches, Z., & Hausman, J. A. (1986). Patents and R&D: Is there a
lag?. International Economic Review 27, 265–283.
Hall, B. H., Jaffe, A., & Trajtenberg, M. (2005). Market value and patent
citations. RAND Journal of Economics, 16-38.
Hall, Bronwyn H., 2002, The financing of research and development, Oxford
Review of Economic Policy 18, 35–51.
Hambrick, D. C., Black, S., & Fredrickson, J. W. (1992). Executive leadership of the
high technology firm: What is special about it. Advances in Global High-
technology Management, 2, 3-18.
Handy Charles (1994). The age of Paradox. Boston, MA: Harvard business School
press.1994.
He, J. J., & Tian, X. (2013). The dark side of analyst coverage: The case of
innovation. Journal of Financial Economics, 109(3), 856-878.
Hirshleifer, D., & Thakor, A. V. (1992). Managerial conservatism, project choice,
and debt. Review of Financial Studies, 5(3), 437-470.
Hirshleifer, D., Low, A., & Teoh, S. H. (2012). Are overconfident CEOs better
innovators? The Journal of Finance, 67(4), 1457-1498.
Holmstrom, B., 1989. Agency costs and innovation. Journal of Economic Behavior
and Organization 12, 305–327.
Hsu, P. H., Tian, X., & Xu, Y. (2014). Financial development and innovation: Cross-
country evidence. Journal of Financial Economics, 112(1), 116-135.
Irwin, D. A., & Klenow, P. J. (1994). Learning-by-doing spillovers in the
semiconductor industry. Journal of political Economy, 102(6), 1200-1227.

39
Jaffe, Adam B., 1996, Economic Analysis of Research Spillovers—Implications for
the Advanced Technology Program (Washington, DC): Advanced Technology
Program, National Institute of Standards and Technology, U.S. Department of
Commerce.
Jensen, Michael C., 1986, Agency costs of free cash flow, corporate finance, and
takeovers, American Economic Review 76, 323–329.
Jung, D. I., Chow, C., & Wu, A. (2003). The role of transformational leadership in
enhancing organizational innovation: Hypotheses and some preliminary
findings. The Leadership Quarterly, 14(4), 525-544.
Kang, J. K., Liu, W. L., Low, A., & Zhang, L. (2014). Friendly boards and
innovation. FIRN Research paper.
Kaplan, S. N., M. M. Klebanov, and M. Sorensen (2012). Which CEO
Characteristics and Abilities Matter? Journal of Finance, 67(3), 973-1007.
Kempf, E., Manconi, A., & Spalt, O. G. (2016). Learning by doing: The value of
experience and the origins of skill for mutual fund managers.
Kim, E. H., & Lu, Y. (2011). CEO ownership, external governance, and risk-
taking. Journal of Financial Economics, 102(2), 272-292.
Kogan, L., Papanikolaou, D., Seru, A., Stoffman, N., 2016. Technological
innovation, resource allocation, and growth. Quarterly Journal of Economics,
forthcoming.
Lang, Larry H. P., Rene M. Stulz, and Ralph A. Walkling, 1991, A test of the free
cash flow hypothesis: The case of bidder returns. Journal of Financial Economics 29,
315–336
Li, G. C., Lai, R., D’Amour, A., Doolin, D. M., Sun, Y., Torvik, V. I., ... & Fleming,
L. (2014). Disambiguation and co-authorship networks of the US patent
inventor database (1975–2010). Research Policy, 43(6), 941-955.
Lee, J. M., Kim, J., & Bae, J. (2016). Founder CEOS and Innovation:
Evidence from S&P 500 Firms. Available at SSRN 2733456.
Lerner, J. (1994). The importance of patent scope: an empirical analysis. The
RAND Journal of Economics, 319-333.
Loughran T, Ritter J. 2004. Why has IPO underpricing changed over time?
Financial Management 33(3): 5–37.
Malmendier, U., Tate, G., 2005. CEO overconfidence and corporate investment.
Journal of Finance 6, 2661–2700.
Malmendier, U., Tate, G., 2008. Who makes acquisitions? CEO overconfidence and
the market’s reaction. Journal of Financial Economics 89, 20–43.
Manso, G., 2011. Motivating innovation. Journal of Finance 66, 1823–1860.
Masulis, R. W., Wang, C., & Xie, F. (2007). Corporate governance and acquirer
returns. The Journal of Finance, 62(4), 1851-1889.
Moeller, Sara B., Frederik P. Schlingemann, and Rene M. Stulz, 2004, Firm size
and the gains from ´ acquisitions, Journal of Financial Economics 73, 201–228
40
Morck, Randall, Andrei Shleifer, and Robert W. Vishny, 1990, Do managerial
incentives drive bad acquisitions? Journal of Finance 45, 31–48.
Mukherjee, A., Singh, M. and Zaldokas, A., 2016. Do Corporate Taxes Hinder
Innovation” Journal of Financial Economics, forthcoming.
Narayanan, M. P., 1985, Managerial incentives for short-term results, Journal of
Finance 15, 1469–1484.
Petersen, M. 2009. Estimating standard errors in finance panel data sets:
Comparing approaches. Review of Financial Studies 22:435–80.
Pérez-González, F. (2006). Inherited control and firm performance. The American
Economic review, 96(5), 1559-1588.
Porter, Michael. 1992. “Capital Disadvantage: America’s Failing Capital
Investment System.” Harvard Business Review 70 (5): 65–82
Rotemberg, J. J., and G. Saloner 2000. Visionaries, managers, and strategic
direction. RAND Journal of Economics 31:693–716
Sapra, H., Subramanian, A., & Subramanian, K. V. (2014). Corporate governance
and innovation: Theory and evidence. Journal of Financial and Quantitative
Analysis, 49(04), 957-1003.
Scherer, F. M. (1988). New perspectives on economic growth and technological
innovation. Brookings Institution Press.
Scherer, F. M., & Harhoff, D. (2000). Technology policy for a world of skew-
distributed outcomes. Research Policy, 29(4), 559-566.
Seru, A. (2014). Firm boundaries matter: Evidence from conglomerates and R&D
activity. Journal of Financial Economics, 111(2), 381-405.
Servaes, Henri, 1991, Tobin’s q and the gains from takeover, Journal of Finance 46,
409–419.
Solow, R. M. (1957). Technical change and the aggregate production
function. The Review of Economics and Statistics, 312-320.
Sunder, J., Sunder, S. V., & Zhang, J. (2016). Pilot CEOs and Corporate
Innovation. Forthcoming, Journal of Financial Economics.
Sutton, Robert, 2002, Weird Ideas that Work: 11 1/2 Practices for Promoting,
Managing, and Sustaining Innovation (The Free Press, New York, NY).
Tian, X., & Wang, T. Y. (2014). Tolerance for failure and corporate
innovation. Review of Financial Studies, 27(1), 211-255.
Tierney, P., Farmer, S. M., & Graen, G. B. (1999). An examination of leadership
and employee creativity: The relevance of traits and relationships. Personnel
psychology, 52(3), 591-620.
Warner, J., R. L.Watts, and K. H.Wruck. 1988. Stock prices and top management
changes. Journal of Financial Economics 20:461–92.
Weisbach, M. S. 1988. Outside directors and CEO turnover. Journal of Financial
Economics 20:431–60.
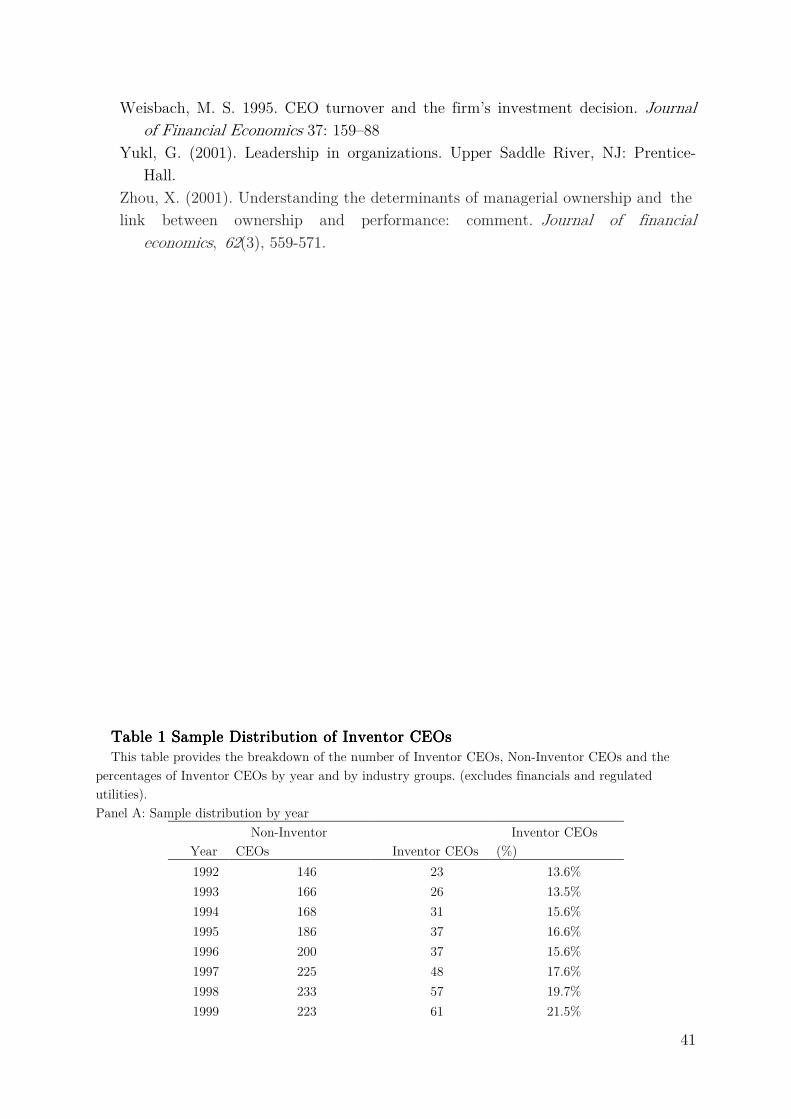
41
Weisbach, M. S. 1995. CEO turnover and the firm’s investment decision. Journal
of Financial Economics 37: 159–88
Yukl, G. (2001). Leadership in organizations. Upper Saddle River, NJ: Prentice-
Hall.
Zhou, X. (2001). Understanding the determinants of managerial ownership and the
link between ownership and performance: comment. Journal of financial
economics, 62(3), 559-571.
Table 1 Table 1 Table 1 Table 1 Sample Distribution of Inventor CEOs Sample Distribution of Inventor CEOs Sample Distribution of Inventor CEOs Sample Distribution of Inventor CEOs This table provides the breakdown of the number of Inventor CEOs, Non-Inventor CEOs and the
percentages of Inventor CEOs by year and by industry groups. (excludes financials and regulated
utilities).
Panel A: Sample distribution by year
Year
Non-Inventor
CEOs Inventor CEOs
Inventor CEOs
(%)
1992 146 23 13.6%
1993 166 26 13.5%
1994 168 31 15.6%
1995 186 37 16.6%
1996 200 37 15.6%
1997 225 48 17.6%
1998 233 57 19.7%
1999 223 61 21.5%

42
2000 236 60 20.3%
2001 251 58 18.8%
2002 261 57 17.9%
2003 255 64 20.1%
2004 239 61 20.3%
2005 208 63 23.2%
2006 231 55 19.2%
2007 266 66 19.9%
2008 262 61 18.9%
Total 3,756 865 18.7%
Panel B: Sample distribution of Inventor CEOs by Fama-French 12 Industry groups
Industry
#of Non Inventor
CEOs
# of Inventor
CEOs
Inventor CEOs
(%)
Medical Equipment 250 132 34.6%
Communication 325 19 5.5%
Business Services 970 106 9.9%
Computers 597 121 16.9%
Electronic Equipment 1,204 395 24.7%
Measuring and Control 410 92 18.3%
Total 3,756 865 18.7%
Panel C: Distribution by cumulative number of patents granted to Inventor CEOs
Cumulative # of Patents up to 2008 # of CEOs
1 48
2 19
>2 83
Total 150
Panel D: List of Inventor CEOs with more than 50 patent awards
CEO Name Company Name
Steve Jobs Apple Inc.
Jerome Swartz Symbol Technologies
Eli Harari Sandisk Corp
Donald R. Scifres SDL inc.
Balu Balakrishnan Power Integrations Inc.
Stephen P. A. Fodor Affymetrix Inc.
John C. C. Fan Kopin Corp
Navdeep S. Sooch Silicon Laboratories Inc
Fred P. Lampropoulos Merit Medical Systems Inc
John O. Ryan Rovi Corp
Samuel H. Maslak Acuson Corp
George A. Lopez ICU medical Inc.
43
Table 2 Table 2 Table 2 Table 2 Summary StatisticsSummary StatisticsSummary StatisticsSummary Statistics This table presents summary statistics for select variables used in this study. T-test (Wilcoxon-Mann-Whitney tests) are conducted to test for differences
between the means and (medians) for firm-year observations with and without Inventor CEOs. Variable definitions are provided in Appendix. *,**,*** denote
significance level at the 10%, 5%, and 1% level, respectively.
Variables Non-Inventor CEOs Inventor CEOs
N Mean Median
Std.
Dev N Mean Median
Std.
Dev
Dependent variables No of Patents 3756 45.18 2.00 169.84 865 56.53* 8.00*** 170.98
No of Citations 3756 600.39 8.00 2640.12 865 712.97* 57.00*** 2455.31
Patents (t+1) 3756 1.63 1.10 1.83 865 2.31*** 2.08*** 1.77
Patents (t+2) 3586 1.58 0.69 1.85 835 2.16*** 1.95*** 1.84
Citation(t+1) 3756 2.55 1.61 2.80 865 3.54*** 3.58*** 2.70
Citations (t+1) 3559 2.39 1.10 2.78 808 3.19*** 3.07*** 2.74
Avg. Citations(t+1) 3756 1.18 0.57 1.35 865 1.60*** 1.51*** 1.32
Avg. Citations(t+2) 3559 1.07 0.34 1.30 835 1.38*** 1.19*** 1.28
Other variables Overconfident CEO (67) 3328 0.31 0.00 0.46 808 0.36*** 0.00*** 0.48
CEO Age 3634 53.15 53.00 7.74 845 53.10 53.00 8.46
Firm Size 3756 6.62 6.39 1.69 865 6.29*** 6.02*** 1.64
RD/Assets 3756 0.08 0.07 0.08 865 0.10*** 0.09*** 0.07
CAPEX 3756 0.05 0.04 0.05 865 0.06*** 0.04** 0.05
Firm Age 3756 2.48 2.56 0.88 865 2.37*** 2.48*** 0.79
Leverage 3756 0.13 0.04 0.17 865 0.10*** 0.01*** 0.15
Tobin's Q 3756 0.79 0.69 0.59 865 0.90*** 0.82*** 0.63
CEO Tenure 3756 7.82 6.00 6.92 865 12.03*** 10.00*** 8.85
Volatility 3355 1.00 0.95 0.43 826 0.98 0.93 0.46
Founder-CEO 3756 0.21 0.00 0.41 865 0.54*** 1.00*** 0.50
Board size 2545 8.14 8.00 2.32 600 7.63*** 7.00*** 2.03
Co-option 1915 0.48 0.45 0.31 442 0.61*** 0.67*** 0.35
44
Institutional Holdings
(%) 2824 0.79 0.85 0.21 740 0.74*** 0.80*** 0.24
CEO ownership 3517 0.02 0.00 0.06 799 0.05*** 0.01*** 0.09
CEO Equity-based pay 2951 0.44 0.49 0.33 672 0.46 0.53 0.35
Delta 3474 943.46 212.75 5726.46 775 7742.07*** 307.82*** 47081.80
Vega 3620 125.04 44.85 311.53 811 147.00* 45.76 423.05
45
Table 3: Table 3: Table 3: Table 3: Inventor CEOs and Innovation outputsInventor CEOs and Innovation outputsInventor CEOs and Innovation outputsInventor CEOs and Innovation outputs The table presents results of regressing innovation outputs on Inventor CEO. Inventor CEO is equal to one if the CEO has at least one patent issued in her own
name from US Patent and Trademark office (USPTO). Tobin's Q is defined as (book value of assets-book value of equity +market value of equity) /book value of
assets. Firm Size is the natural log of book value of Asset of the firm. Firm-age is the Log of firm age where firm age is the number of years since the inception of
the firms. CAPEX is Capital expenditure scaled by Asset. Missing values are coded with zero. R&D/Asset is Research and development expenditures scaled by
total assets. Missing values are coded with zero. Leverage is defined as (long-term debt+ Short-term debt) /Total assets. CEO-Tenure is the CEO tenure in years.
PhD (STEM) is an indicator variable equal to one for CEOs with PhD in Science, Technology, Engineering and Mathematics and zero otherwise. Technical
Education is an indicator variable equal to one for CEOs with undergraduate or graduate degrees in engineering, physics, operation research, chemistry, mathematics,
biology, pharmacy, or other applied science and zero otherwise. MBA is an indicator variable equal to one if the CEO received MBA degree or zero otherwise. No
school information is an indicator equal to one if we cannot identify the CEOs’ undergraduate school and zero otherwise. All regressions include year and industry
(based on two digit SIC code) fixed effects. Columns 1 and 2 present regressions of Patents defined as log (1+# of patents) as dependent variables. Columns 3 and
4 present regressions of Citations defined as log (1+# of Citations) as dependent variables. Columns 5 and 6 present regressions of Avg. Citations defined as log(1+
average Citations) as dependent variables where average citations is Citations scaled by patents. Standard errors are clustered at the firm level. t- ratios are
reported in parentheses. *, **, and *** denote significance at the 10%, 5%, and 1% level, respectively.
(1) (2) (3) (4) (5) (6)
Variables Patents(t+1) Patents(t+2) Citations(t+1) Citations(t+2) Avg.
Citations(t+1)
Avg.
Citations(t+2)
Inventor CEO Inventor CEO Inventor CEO Inventor CEO 0.485*** 0.407*** 0.741*** 0.602*** 0.319*** 0.251***
(4.153) (3.469) (4.425) (3.647) (4.271) (3.603)
Firm-size 0.677*** 0.637*** 0.836*** 0.769*** 0.197*** 0.168***
(16.027) (15.925) (15.887) (15.577) (9.460) (8.813)
RD/Assets 4.266*** 3.744*** 5.841*** 5.054*** 2.180*** 1.792***
(6.752) (5.895) (6.317) (5.499) (5.106) (4.469)
CAPEX 2.998*** 2.938*** 3.936*** 4.006*** 0.602 0.805
(3.078) (3.026) (2.942) (3.068) (1.105) (1.567)
Firm-Age 0.107* 0.079 0.046 0.024 -0.069* -0.069*
(1.734) (1.313) (0.541) (0.284) (-1.867) (-1.943)
Leverage -0.742*** -0.761*** -0.983*** -1.002*** -0.297 -0.289
(-2.954) (-2.943) (-2.638) (-2.625) (-1.621) (-1.599)
Log(Tobin's Q) 0.242*** 0.252*** 0.357*** 0.322*** 0.130*** 0.084**

46
(3.488) (3.611) (3.654) (3.316) (2.959) (2.065)
CEO Tenure -0.008 -0.007 -0.008 -0.007 -0.000 0.000
(-1.553) (-1.346) (-1.119) (-0.923) (-0.027) (0.072)
PhD (STEM) 0.178 0.166 0.110 0.096 -0.037 -0.032
(1.295) (1.133) (0.549) (0.468) (-0.399) (-0.372)
Technical Education 0.023 0.040 0.148 0.149 0.131** 0.119*
(0.223) (0.386) (1.024) (1.039) (2.050) (1.940)
MBA -0.011 0.003 0.007 0.017 0.024 0.031
(-0.116) (0.033) (0.050) (0.123) (0.351) (0.475)
No school information -0.122 -0.153 -0.201 -0.250 -0.062 -0.088
(-0.895) (-1.120) (-0.928) (-1.166) (-0.539) (-0.809)
Constant -2.607*** -2.132*** -1.340*** -0.590 1.123*** 1.445***
(-7.969) (-6.764) (-3.198) (-1.421) (5.513) (7.181)
Observations 4,621 4,394 4,621 4,394 4,621 4,394
Adjusted R-squared 0.561 0.554 0.540 0.549 0.457 0.490
Industry-Fixed effects Y Y Y Y Y Y
Year fixed effects Y Y Y Y Y Y
47
Table 4: Identification strategy (1) Table 4: Identification strategy (1) Table 4: Identification strategy (1) Table 4: Identification strategy (1) ----Exogenous CEO turnover and firm level patenting Exogenous CEO turnover and firm level patenting Exogenous CEO turnover and firm level patenting Exogenous CEO turnover and firm level patenting The table presents results of regressing innovation outputs in the context of exogenous CEO Turnovers. Inventor CEO Dummy is equal to one if the CEO has
at least one patent issued in her own name from US Patent and Trademark office (USPTO). Exogenous CEO turnover is as defined in Eisfeldt and Kuhnen (2013).
Treated firm is a dummy variable taking the value 1 if exogenous CEO turnover involves a transition from Inventor CEO to Non-Inventor CEO and 0 Otherwise.
Tobin's Q is defined as (book value of assets-book value of equity +market value of equity) /book value of assets. Firm Size is the natural log of book value of
Asset of the firm. CAPEX is Capital expenditure scaled by Asset. Missing values are coded with zero. Founder CEO is equal to one if the CEO is a founder of the
firm or CEO since the founding year of the firm. All regressions include year and Firm (based on unique GVKEY) fixed effects. Patents (t+1) defined as log (1+#
of patents) is the dependent variable. Standard errors are clustered at the firm level. t- ratios are reported in parentheses. *, **, and *** denote significance at
the 10%, 5%, and 1% level, respectively.
(1) (2) (3)
Variables Patents(t+1) Patents(t+1) Patents(t+1))
Exogenous CEO turnover * Treated Firm dummy (a*b) -0.620*** -0.561*** -0.539***
(-3.052) (-3.745) (-3.255)
Exogenous CEO turnover: b 0.290 0.263** 0.265**
(1.303) (2.480) (2.489)
Firm-Size 0.198
(1.018)
RD/Assets -1.955
(-0.650)
CAPEX 1.179
(0.970)
Log(Tobin's Q) 0.255***
(2.987)
Founder-CEO 0.072
(0.597)
Treated firm dummy: a 0.358
(0.599) Constant 4.128*** 3.046*** 1.766
(7.626) (4.771) (1.095)
Observations 239 239 239
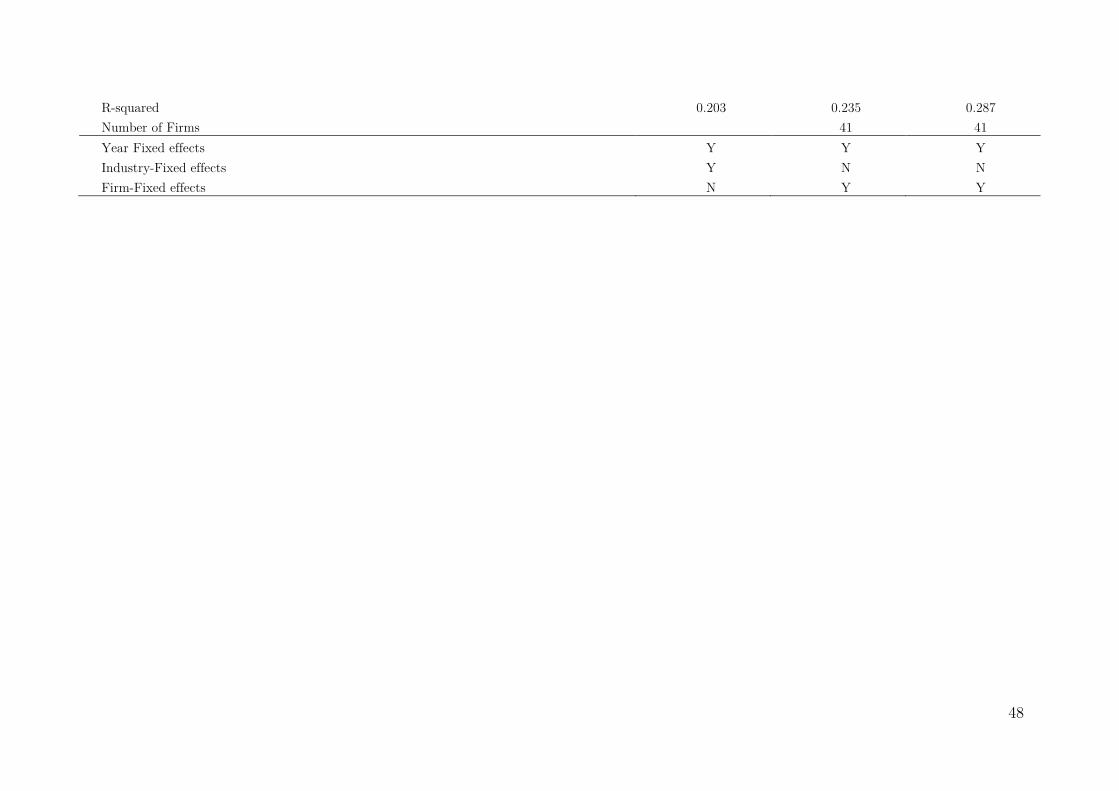
48
R-squared 0.203 0.235 0.287
Number of Firms 41 41
Year Fixed effects Y Y Y
Industry-Fixed effects Y N N
Firm-Fixed effects N Y Y

49
Table 5: Identification Strategy (2) Table 5: Identification Strategy (2) Table 5: Identification Strategy (2) Table 5: Identification Strategy (2) ---- Quasi Natural experimentQuasi Natural experimentQuasi Natural experimentQuasi Natural experiment This table presents the changes in Patent (t+1) before and after the R&D tax credit shocks with the results of difference-in-difference tests for Inventor-CEOs
and Non-Inventors CEOs. Panel A compares the Inventor CEO run firms from states that experienced R&D tax credit shocks (treated firms) and the Inventor
CEO run firms from states that did NOT experienced R&D tax credit shocks (control firms). Panel B compares the Inventor CEOs run firms (Treated firms) and
the Non-Inventor CEOs run firms (Control firms) from the same states that experienced R&D tax credit shocks. ***,**, and * indicates statistical significance at
the 1%, 5%, and 10% levels, respectively.
Panel A. Inventor CEOs vs. NonPanel A. Inventor CEOs vs. NonPanel A. Inventor CEOs vs. NonPanel A. Inventor CEOs vs. Non----Inventor CEOs in states with R&D Tax credit shocksInventor CEOs in states with R&D Tax credit shocksInventor CEOs in states with R&D Tax credit shocksInventor CEOs in states with R&D Tax credit shocks
Patents (t+1) before and after the R&D Tax credit shock ( Inventor CEOs vs Non-Inventor CEOs)
Before After After-Before
Treated firms 2.982 3.669 0.687*
(1.87)
Control Firms 2.061 2.19 0.129
(0.85)
Difference (Treated-Control) 0.921*** 1.479*** 0.558***0.558***0.558***0.558***
(t-statistics) (3.95) (6.35) (1.70)(1.70)(1.70)(1.70)
Matching Estimator (ATT) 0.348*
(1.73)
Panel B. Inventor CEOs in states with R&D Tax credit shocks vs. Inventor CEOs in states without R&D Tax credit shocksPanel B. Inventor CEOs in states with R&D Tax credit shocks vs. Inventor CEOs in states without R&D Tax credit shocksPanel B. Inventor CEOs in states with R&D Tax credit shocks vs. Inventor CEOs in states without R&D Tax credit shocksPanel B. Inventor CEOs in states with R&D Tax credit shocks vs. Inventor CEOs in states without R&D Tax credit shocks
Patents (t+1) before and after the R&D Tax credit shock ( Inventor CEOs vs Inventor CEOs)
Before After After-Before
Treated firms 2.459 3.939 1.48**
(2.306)
Control Firms 2.606 2.560 -0.046**
(2.567)
Difference (Treated-Control) -0.146 1.379** 1.525*1.525*1.525*1.525*
(t-statistics) (-0.24) (2.567) (1.86)(1.86)(1.86)(1.86)
Matching Estimator (ATT) 1.010***
(3.44)
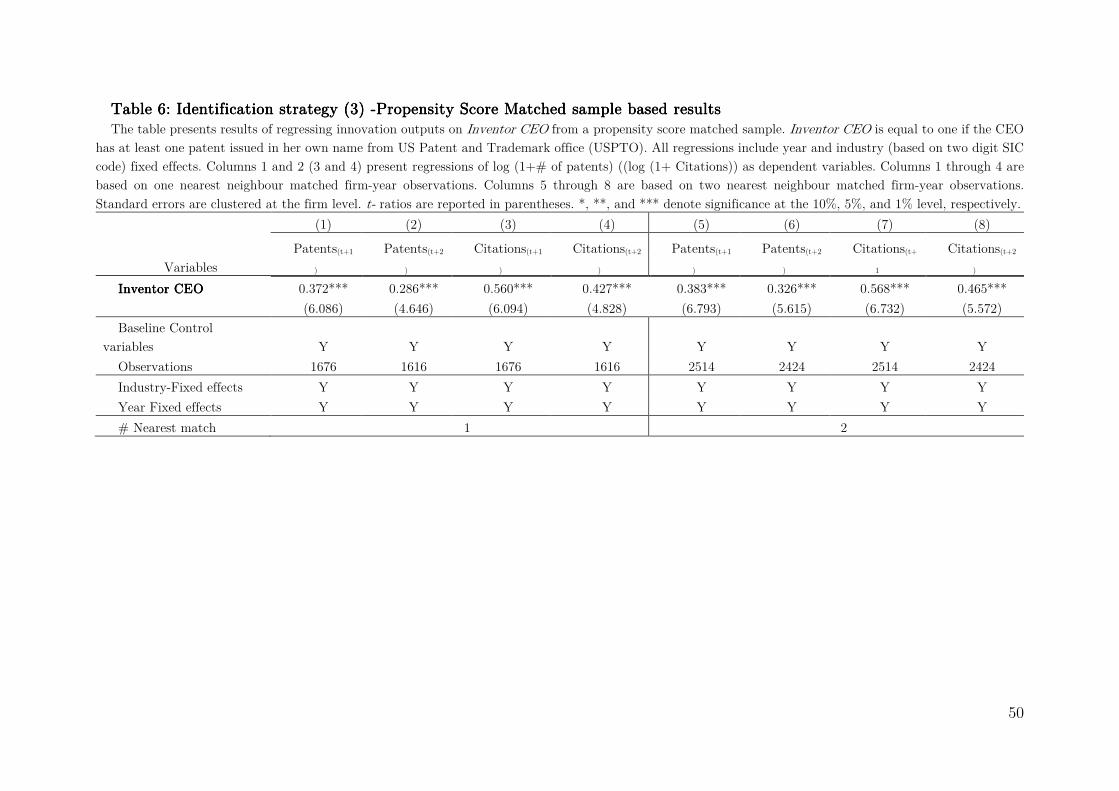
50
Table 6: Identification strategy (3) Table 6: Identification strategy (3) Table 6: Identification strategy (3) Table 6: Identification strategy (3) ----Propensity Score Matched sample based resultsPropensity Score Matched sample based resultsPropensity Score Matched sample based resultsPropensity Score Matched sample based results The table presents results of regressing innovation outputs on Inventor CEO from a propensity score matched sample. Inventor CEO is equal to one if the CEO
has at least one patent issued in her own name from US Patent and Trademark office (USPTO). All regressions include year and industry (based on two digit SIC
code) fixed effects. Columns 1 and 2 (3 and 4) present regressions of log (1+# of patents) ((log (1+ Citations)) as dependent variables. Columns 1 through 4 are
based on one nearest neighbour matched firm-year observations. Columns 5 through 8 are based on two nearest neighbour matched firm-year observations.
Standard errors are clustered at the firm level. t- ratios are reported in parentheses. *, **, and *** denote significance at the 10%, 5%, and 1% level, respectively.
(1) (2) (3) (4) (5) (6) (7) (8)
Patents(t+1
)
Patents(t+2
)
Citations(t+1
)
Citations(t+2
)
Patents(t+1
)
Patents(t+2
)
Citations(t+
1
Citations(t+2
) Variables
Inventor CEO Inventor CEO Inventor CEO Inventor CEO 0.372*** 0.286*** 0.560*** 0.427*** 0.383*** 0.326*** 0.568*** 0.465***
(6.086) (4.646) (6.094) (4.828) (6.793) (5.615) (6.732) (5.572)
Baseline Control
variables Y Y Y Y Y Y Y Y
Observations 1676 1616 1676 1616 2514 2424 2514 2424
Industry-Fixed effects Y Y Y Y Y Y Y Y
Year Fixed effects Y Y Y Y Y Y Y Y
# Nearest match 1 2
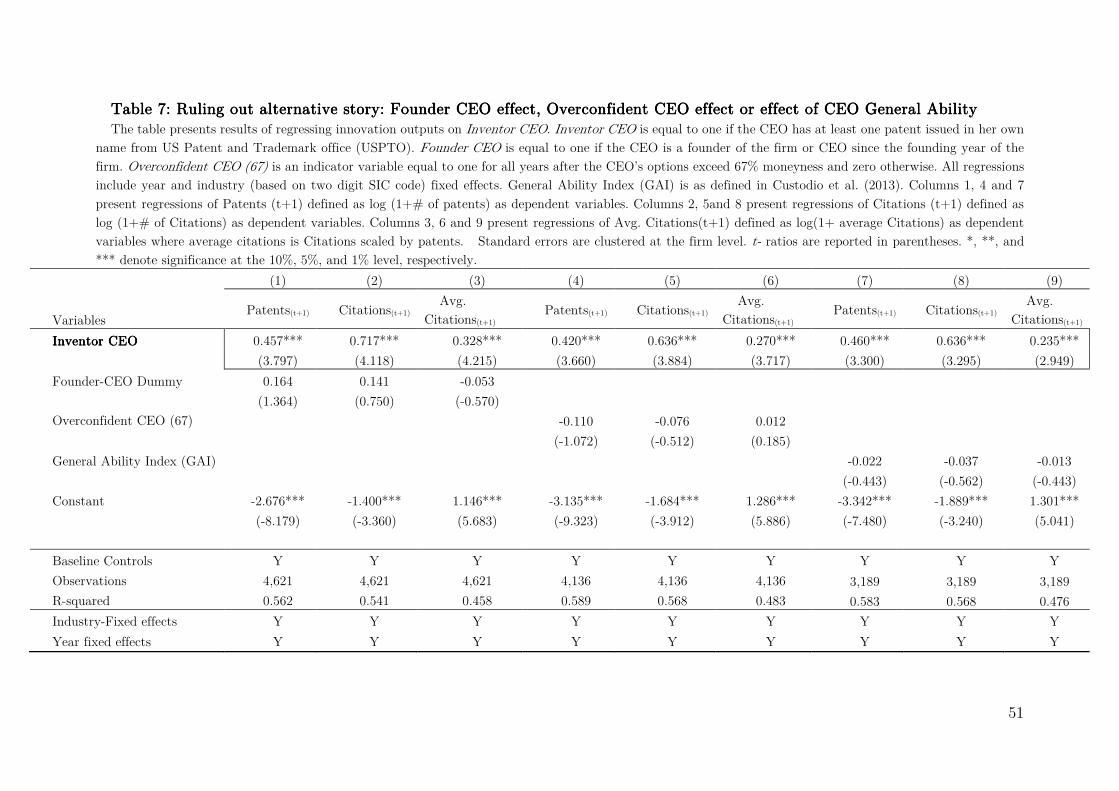
51
Table 7: Ruling out alternative story: Founder CEO effect, Overconfident CEO effect or effect of CEO General Ability Table 7: Ruling out alternative story: Founder CEO effect, Overconfident CEO effect or effect of CEO General Ability Table 7: Ruling out alternative story: Founder CEO effect, Overconfident CEO effect or effect of CEO General Ability Table 7: Ruling out alternative story: Founder CEO effect, Overconfident CEO effect or effect of CEO General Ability The table presents results of regressing innovation outputs on Inventor CEO. Inventor CEO is equal to one if the CEO has at least one patent issued in her own
name from US Patent and Trademark office (USPTO). Founder CEO is equal to one if the CEO is a founder of the firm or CEO since the founding year of the
firm. Overconfident CEO (67) is an indicator variable equal to one for all years after the CEO’s options exceed 67% moneyness and zero otherwise. All regressions
include year and industry (based on two digit SIC code) fixed effects. General Ability Index (GAI) is as defined in Custodio et al. (2013). Columns 1, 4 and 7
present regressions of Patents (t+1) defined as log (1+# of patents) as dependent variables. Columns 2, 5and 8 present regressions of Citations (t+1) defined as
log (1+# of Citations) as dependent variables. Columns 3, 6 and 9 present regressions of Avg. Citations(t+1) defined as log(1+ average Citations) as dependent
variables where average citations is Citations scaled by patents. Standard errors are clustered at the firm level. t- ratios are reported in parentheses. *, **, and
*** denote significance at the 10%, 5%, and 1% level, respectively.
(1) (2) (3) (4) (5) (6) (7) (8) (9)
Variables Patents(t+1) Citations(t+1)
Avg.
Citations(t+1) Patents(t+1) Citations(t+1)
Avg.
Citations(t+1) Patents(t+1) Citations(t+1)
Avg.
Citations(t+1)
Inventor CEOInventor CEOInventor CEOInventor CEO 0.457*** 0.717*** 0.328*** 0.420*** 0.636*** 0.270*** 0.460*** 0.636*** 0.235***
(3.797) (4.118) (4.215) (3.660) (3.884) (3.717) (3.300) (3.295) (2.949)
Founder-CEO Dummy 0.164 0.141 -0.053
(1.364) (0.750) (-0.570) Overconfident CEO (67) -0.110 -0.076 0.012
(-1.072) (-0.512) (0.185) General Ability Index (GAI) -0.022 -0.037 -0.013
(-0.443) (-0.562) (-0.443)
Constant -2.676*** -1.400*** 1.146*** -3.135*** -1.684*** 1.286*** -3.342*** -1.889*** 1.301***
(-8.179) (-3.360) (5.683) (-9.323) (-3.912) (5.886) (-7.480) (-3.240) (5.041)
Baseline Controls Y Y Y Y Y Y Y Y Y
Observations 4,621 4,621 4,621 4,136 4,136 4,136 3,189 3,189 3,189
R-squared 0.562 0.541 0.458 0.589 0.568 0.483 0.583 0.568 0.476
Industry-Fixed effects Y Y Y Y Y Y Y Y Y
Year fixed effects Y Y Y Y Y Y Y Y Y

52
Table 8: Innovation active CEO and Corporate InnovationTable 8: Innovation active CEO and Corporate InnovationTable 8: Innovation active CEO and Corporate InnovationTable 8: Innovation active CEO and Corporate Innovation The table presents results of regressing innovation outputs on Innovation Active-CEO. Innovation
Active-CEO is equal to one if the CEO has at least one patent issued in her own name within 2 years of
focal firm year from US Patent and Trademark office (USPTO). Tobin's Q is defined as (book value of
assets-book value of equity +market value of equity) /book value of assets. Firm Size is the natural log
of book value of Asset of the firm. Log (Firm-age) is the Log of firm age where firm age is the number of
years since the inception of the firms. CAPEX is Capital expenditure scaled by Asset. Missing values are
coded with zero. R&D/Asset is Research and development expenditures scaled by total assets. Missing
values are coded with zero. Leverage is defined as (long-term debt+ Short-term debt) /Total assets. CEO-
Tenure is the CEO tenure in years. PhD (STEM) is an indicator variable equal to one for CEOs with
PhD in Science, Technology, Engineering and Mathematics and zero otherwise. Technical Education is an
indicator variable equal to one for CEOs with undergraduate or graduate degrees in engineering, physics,
operation research, chemistry, mathematics, biology, pharmacy, or other applied science and zero
otherwise. MBA is an indicator variable equal to one if the CEO received MBA degree or zero otherwise.
No school information is an indicator equal to one if we cannot identify the CEOs’ undergraduate school
and zero otherwise. All regressions include year and industry (based on two digit SIC code) fixed effects.
Columns 1 and 2 present regressions of Patents defined as log (1+# of patents) as dependent variables.
Columns 3 and 4 present regressions of Citations defined as log (1+# of Citations) as dependent variables.
Columns 5 and 6 present regressions of Avg. Citations defined as log(1+ average Citations) as dependent
variables where average citations is Citations scaled by patents. Standard errors are clustered at the firm
level. t- ratios are reported in parentheses. *, **, and *** denote significance at the 10%, 5%, and 1%
level, respectively.
(1) (2) (3) (4) (5) (6)
Variables Patents(
t+1)
Patents(
t+2)
Citations
(t+1)
Citations
(t+2)
Avg.
Citations(
t+1)
Avg.
Citations(
t+2)
Innovation active Innovation active Innovation active Innovation active
CEO CEO CEO CEO
0.865**
*
0.797**
* 1.450*** 1.291***
0.620*
**
0.528*
**
(7.271) (6.518) (7.915) (7.216) (6.788) (6.355)
Firm-size 0.684**
*
0.644**
* 0.849*** 0.781***
0.202*
**
0.173*
**
(16.277) (16.169) (16.373) (16.026) (9.942) (9.247)
RD/Assets 4.317**
*
3.778**
* 5.910*** 5.096***
2.210*
**
1.810*
**
(6.932) (6.018) (6.508) (5.614) (5.249) (4.557)
CAPEX 2.865**
*
2.808**
* 3.692*** 3.778*** 0.498 0.713
(2.964) (2.928) (2.763) (2.921) (0.904) (1.387)
Firm-Age 0.112* 0.084 0.056 0.033 -0.065* -0.065*
(1.828) (1.407) (0.667) (0.403)
(-
1.763)
(-
1.848)
Leverage -
0.708***
-
0.725*** -0.921** -0.940** -0.270 -0.264
(-2.842) (-2.824) (-2.503) (-2.484)
(-
1.485)
(-
1.465)
Log(Tobin's Q) 0.226**
*
0.237**
* 0.328*** 0.296***
0.117*
** 0.074*
(3.246) (3.393) (3.375) (3.062) (2.705) (1.822)
CEO Tenure -0.009* -0.008 -0.010 -0.009 -0.001 -0.001
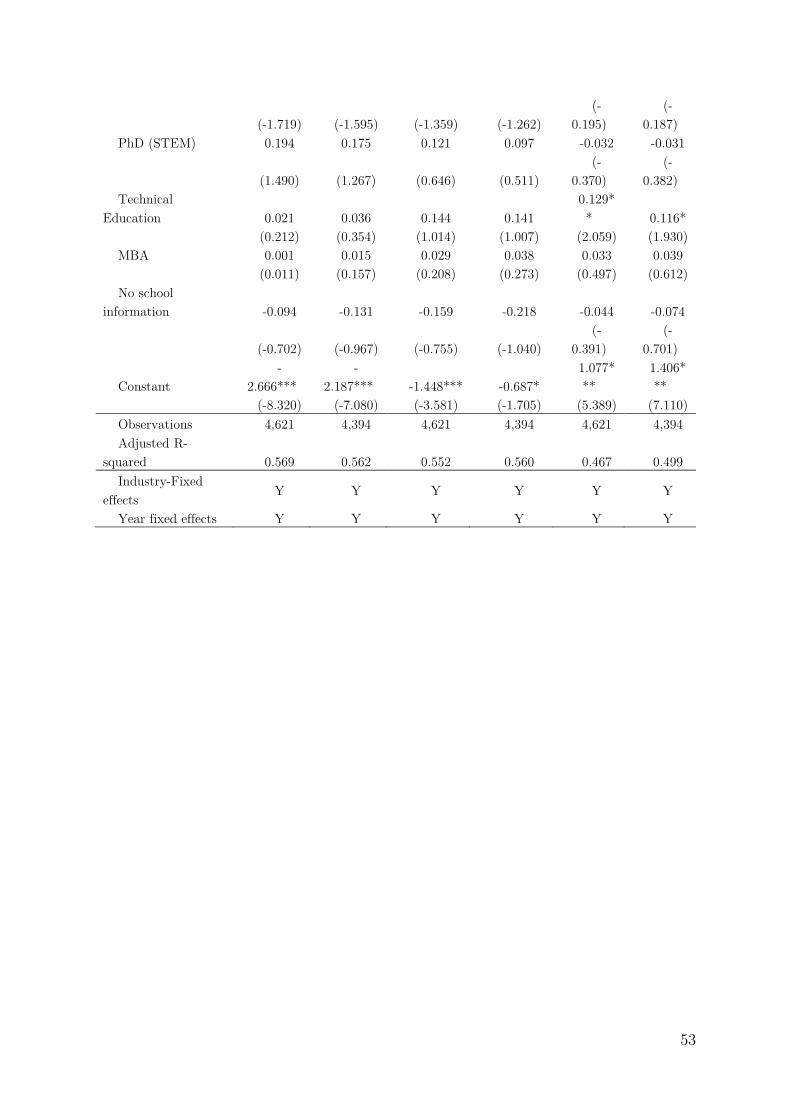
53
(-1.719) (-1.595) (-1.359) (-1.262)
(-
0.195)
(-
0.187)
PhD (STEM) 0.194 0.175 0.121 0.097 -0.032 -0.031
(1.490) (1.267) (0.646) (0.511)
(-
0.370)
(-
0.382)
Technical
Education 0.021 0.036 0.144 0.141
0.129*
* 0.116*
(0.212) (0.354) (1.014) (1.007) (2.059) (1.930)
MBA 0.001 0.015 0.029 0.038 0.033 0.039
(0.011) (0.157) (0.208) (0.273) (0.497) (0.612)
No school
information -0.094 -0.131 -0.159 -0.218 -0.044 -0.074
(-0.702) (-0.967) (-0.755) (-1.040)
(-
0.391)
(-
0.701)
Constant
-
2.666***
-
2.187*** -1.448*** -0.687*
1.077*
**
1.406*
**
(-8.320) (-7.080) (-3.581) (-1.705) (5.389) (7.110)
Observations 4,621 4,394 4,621 4,394 4,621 4,394
Adjusted R-
squared 0.569 0.562 0.552 0.560 0.467 0.499
Industry-Fixed
effects Y Y Y Y Y Y
Year fixed effects Y Y Y Y Y Y
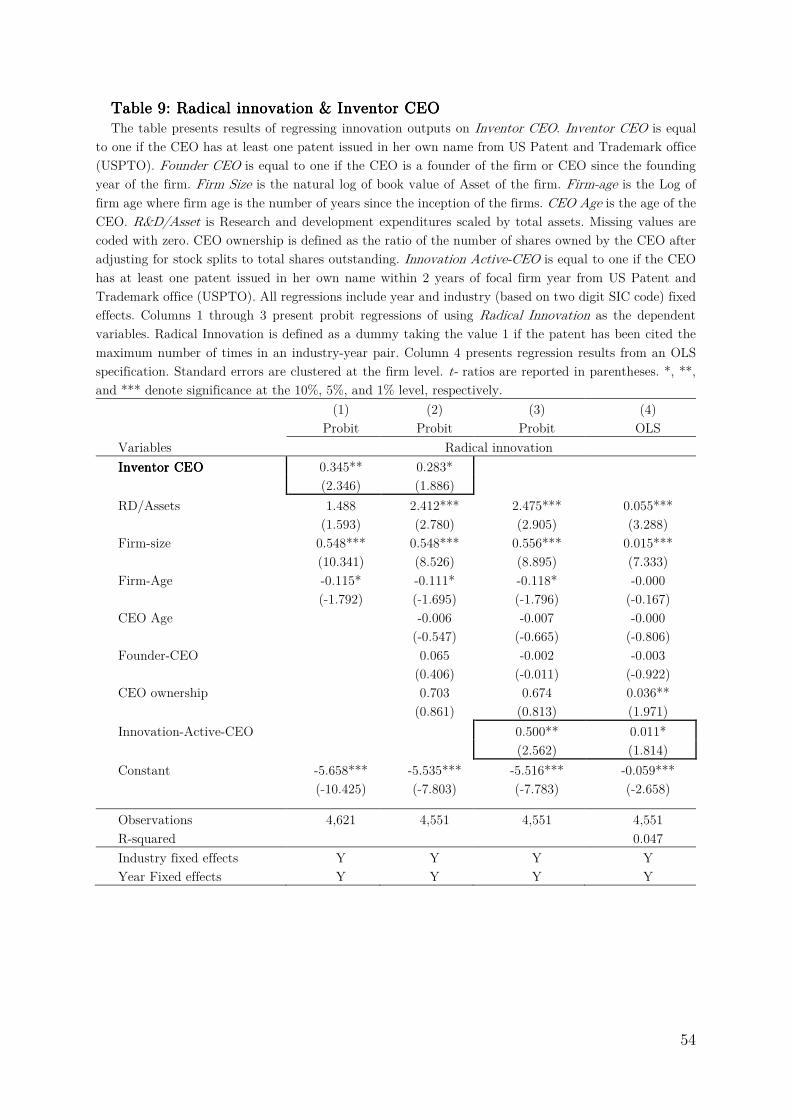
54
Table 9: Radical innovation & Inventor CEO Table 9: Radical innovation & Inventor CEO Table 9: Radical innovation & Inventor CEO Table 9: Radical innovation & Inventor CEO The table presents results of regressing innovation outputs on Inventor CEO. Inventor CEO is equal
to one if the CEO has at least one patent issued in her own name from US Patent and Trademark office
(USPTO). Founder CEO is equal to one if the CEO is a founder of the firm or CEO since the founding
year of the firm. Firm Size is the natural log of book value of Asset of the firm. Firm-age is the Log of
firm age where firm age is the number of years since the inception of the firms. CEO Age is the age of the
CEO. R&D/Asset is Research and development expenditures scaled by total assets. Missing values are
coded with zero. CEO ownership is defined as the ratio of the number of shares owned by the CEO after
adjusting for stock splits to total shares outstanding. Innovation Active-CEO is equal to one if the CEO
has at least one patent issued in her own name within 2 years of focal firm year from US Patent and
Trademark office (USPTO). All regressions include year and industry (based on two digit SIC code) fixed
effects. Columns 1 through 3 present probit regressions of using Radical Innovation as the dependent
variables. Radical Innovation is defined as a dummy taking the value 1 if the patent has been cited the
maximum number of times in an industry-year pair. Column 4 presents regression results from an OLS
specification. Standard errors are clustered at the firm level. t- ratios are reported in parentheses. *, **,
and *** denote significance at the 10%, 5%, and 1% level, respectively.
(1) (2) (3) (4)
Probit Probit Probit OLS
Variables Radical innovation
Inventor CEOInventor CEOInventor CEOInventor CEO 0.345** 0.283*
(2.346) (1.886) RD/Assets 1.488 2.412*** 2.475*** 0.055***
(1.593) (2.780) (2.905) (3.288)
Firm-size 0.548*** 0.548*** 0.556*** 0.015***
(10.341) (8.526) (8.895) (7.333)
Firm-Age -0.115* -0.111* -0.118* -0.000
(-1.792) (-1.695) (-1.796) (-0.167)
CEO Age -0.006 -0.007 -0.000
(-0.547) (-0.665) (-0.806)
Founder-CEO 0.065 -0.002 -0.003
(0.406) (-0.011) (-0.922)
CEO ownership 0.703 0.674 0.036**
(0.861) (0.813) (1.971)
Innovation-Active-CEO 0.500** 0.011*
(2.562) (1.814)
Constant -5.658*** -5.535*** -5.516*** -0.059***
(-10.425) (-7.803) (-7.783) (-2.658) Observations 4,621 4,551 4,551 4,551
R-squared 0.047
Industry fixed effects Y Y Y Y
Year Fixed effects Y Y Y Y
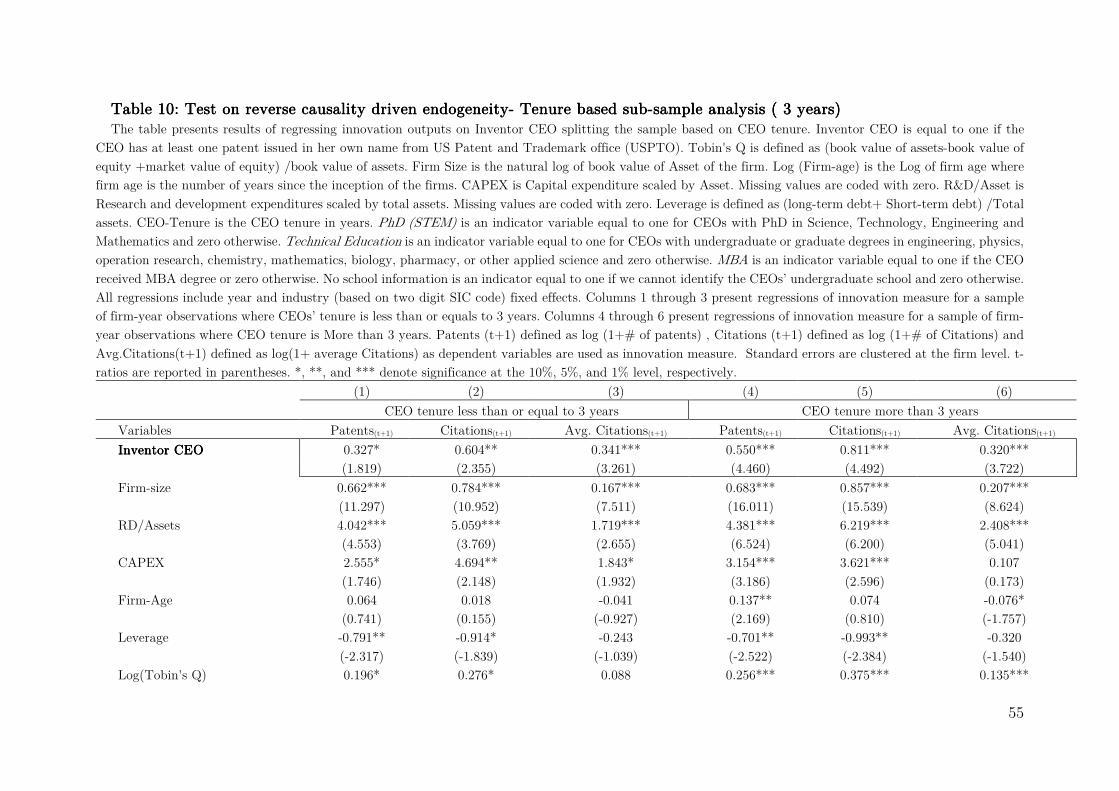
55
Table 10: Test on reverse causality driven endogeneityTable 10: Test on reverse causality driven endogeneityTable 10: Test on reverse causality driven endogeneityTable 10: Test on reverse causality driven endogeneity---- Tenure based subTenure based subTenure based subTenure based sub----sample analysis ( 3 years)sample analysis ( 3 years)sample analysis ( 3 years)sample analysis ( 3 years) The table presents results of regressing innovation outputs on Inventor CEO splitting the sample based on CEO tenure. Inventor CEO is equal to one if the
CEO has at least one patent issued in her own name from US Patent and Trademark office (USPTO). Tobin's Q is defined as (book value of assets-book value of
equity +market value of equity) /book value of assets. Firm Size is the natural log of book value of Asset of the firm. Log (Firm-age) is the Log of firm age where
firm age is the number of years since the inception of the firms. CAPEX is Capital expenditure scaled by Asset. Missing values are coded with zero. R&D/Asset is
Research and development expenditures scaled by total assets. Missing values are coded with zero. Leverage is defined as (long-term debt+ Short-term debt) /Total
assets. CEO-Tenure is the CEO tenure in years. PhD (STEM) is an indicator variable equal to one for CEOs with PhD in Science, Technology, Engineering and
Mathematics and zero otherwise. Technical Education is an indicator variable equal to one for CEOs with undergraduate or graduate degrees in engineering, physics,
operation research, chemistry, mathematics, biology, pharmacy, or other applied science and zero otherwise. MBA is an indicator variable equal to one if the CEO
received MBA degree or zero otherwise. No school information is an indicator equal to one if we cannot identify the CEOs’ undergraduate school and zero otherwise.
All regressions include year and industry (based on two digit SIC code) fixed effects. Columns 1 through 3 present regressions of innovation measure for a sample
of firm-year observations where CEOs’ tenure is less than or equals to 3 years. Columns 4 through 6 present regressions of innovation measure for a sample of firm-
year observations where CEO tenure is More than 3 years. Patents (t+1) defined as log (1+# of patents) , Citations (t+1) defined as log (1+# of Citations) and
Avg.Citations(t+1) defined as log(1+ average Citations) as dependent variables are used as innovation measure. Standard errors are clustered at the firm level. t-
ratios are reported in parentheses. *, **, and *** denote significance at the 10%, 5%, and 1% level, respectively.
(1) (2) (3) (4) (5) (6)
CEO tenure less than or equal to 3 years CEO tenure more than 3 years
Variables Patents(t+1) Citations(t+1) Avg. Citations(t+1) Patents(t+1) Citations(t+1) Avg. Citations(t+1)
Inventor CEOInventor CEOInventor CEOInventor CEO 0.327* 0.604** 0.341*** 0.550*** 0.811*** 0.320***
(1.819) (2.355) (3.261) (4.460) (4.492) (3.722)
Firm-size 0.662*** 0.784*** 0.167*** 0.683*** 0.857*** 0.207***
(11.297) (10.952) (7.511) (16.011) (15.539) (8.624)
RD/Assets 4.042*** 5.059*** 1.719*** 4.381*** 6.219*** 2.408***
(4.553) (3.769) (2.655) (6.524) (6.200) (5.041)
CAPEX 2.555* 4.694** 1.843* 3.154*** 3.621*** 0.107
(1.746) (2.148) (1.932) (3.186) (2.596) (0.173)
Firm-Age 0.064 0.018 -0.041 0.137** 0.074 -0.076*
(0.741) (0.155) (-0.927) (2.169) (0.810) (-1.757)
Leverage -0.791** -0.914* -0.243 -0.701** -0.993** -0.320
(-2.317) (-1.839) (-1.039) (-2.522) (-2.384) (-1.540)
Log(Tobin's Q) 0.196* 0.276* 0.088 0.256*** 0.375*** 0.135***
56
(1.827) (1.776) (1.268) (3.557) (3.581) (2.703)
CEO Tenure 0.004 0.046 0.021 -0.012* -0.015* -0.003
(0.122) (0.786) (0.613) (-1.871) (-1.722) (-0.815)
PhD (STEM) 0.453*** 0.375 -0.089 0.106 0.042 -0.024
(2.858) (1.582) (-0.770) (0.645) (0.178) (-0.230)
Technical Education 0.071 0.171 0.083 -0.015 0.111 0.143*
(0.577) (0.957) (1.033) (-0.131) (0.659) (1.892)
MBA 0.152 0.328* 0.116 -0.073 -0.120 -0.016
(1.331) (1.876) (1.385) (-0.678) (-0.745) (-0.209)
No school information -0.043 -0.258 -0.220 -0.147 -0.165 0.006
(-0.233) (-0.908) (-1.458) (-0.956) (-0.656) (0.047)
Constant -2.620*** -1.406** 1.054*** -2.595*** -1.316*** 1.161***
(-5.807) (-2.397) (3.837) (-7.479) (-2.699) (4.654)
Observations 1,278 1,278 1,278 3,343 3,343 3,343
R-squared 0.559 0.519 0.435 0.567 0.554 0.471
Industry-Fixed effects Y Y Y Y Y Y
Year fixed effects Y Y Y Y Y Y

57
Table 11 : Market value creation and Inventor CEOsTable 11 : Market value creation and Inventor CEOsTable 11 : Market value creation and Inventor CEOsTable 11 : Market value creation and Inventor CEOs The table presents results of regressing Log (Tobin’s Q) on Inventor CEO. Inventor CEO is equal to one if the CEO has at least one patent issued in her own
name from US Patent and Trademark office (USPTO). Tobin's Q is defined as (book value of assets-book value of equity +market value of equity) /book value of
assets. Firm Size is the natural log of book value of Asset of the firm. Firm-age is the Log of firm age where firm age is the number of years since the inception of
the firms. Volatility is the volatility of stock returns. CEO ownership is defined as the ratio of the number of shares owned by the CEO after adjusting for stock
splits to total shares outstanding. CEO-Tenure is CEO tenure in years. Founder CEO is equal to one if the CEO is a founder of the firm or CEO since the founding
year of the firm. All regressions include year and industry (based on two digit SIC code) fixed effects. Standard errors are clustered at the firm level. t- ratios are
reported in parentheses. *, **, and *** denote significance at the 10%, 5%, and 1% level, respectively.
(1) (2) (3) (4)
Variables Log(Tobin's Q) Log(Tobin's Q) Log(Tobin's Q) Log(Tobin's Q)
Inventor CEOInventor CEOInventor CEOInventor CEO 0.125*** 0.101** 0.104** 0.092*
(2.668) (2.156) (2.086) (1.800)
Firm-size 0.040 0.051 0.051
(1.215) (1.554) (1.537)
Firm-Age -0.193*** -0.180*** -0.174***
(-7.381) (-6.479) (-6.251)
Volatility -0.190** -0.171** -0.169**
(-2.577) (-2.176) (-2.157)
Log (Net PPE) -0.027 -0.034 -0.034
(-0.951) (-1.204) (-1.194)
CEO Tenure -0.000 -0.002
(-0.057) (-0.758)
CEO ownership 0.556* 0.480
(1.807) (1.516)
Founder-Dummy 0.061
(1.164)
Constant 0.603*** 0.983*** 0.946*** 0.927***
(8.213) (6.776) (6.039) (5.855)
Observations 4,621 4,098 3,732 3,732

58
R-squared 0.169 0.196 0.199 0.200
Industry Fixed effects Y Y Y Y
Year Fixed effects Y Y Y Y

59
Table 12: LogitTable 12: LogitTable 12: LogitTable 12: Logit regression analysis of selection of target firms in M&A by Inventor CEOs regression analysis of selection of target firms in M&A by Inventor CEOs regression analysis of selection of target firms in M&A by Inventor CEOs regression analysis of selection of target firms in M&A by Inventor CEOs The table presents results from employing logit regressions to study target selection in M&A by the Inventor-CEOs. Private Target Indicator is a variable that
equals one if the target in M&A deal is a private firm. Innovative Target Indicator is a variable that equals one if the target has received patent in the past.
Inventor CEO is equal to one if the CEO has at least one patent issued in her own name from US Patent and Trademark office (USPTO). Tobin's Q is defined as
(book value of assets-book value of equity +market value of equity) /book value of assets. Firm Size is the natural log of book value of Asset of the firm. CAPEX
is Capital expenditure scaled by Asset. Missing values are coded with zero. R&D/Asset is Research and development expenditures scaled by total assets. Missing
values are coded with zero. Leverage is defined as (long-term debt+ Short-term debt) /Total assets. CEO-Tenure is the CEO tenure in years. PhD (STEM) is an
indicator variable equal to one for CEOs with PhD in Science, Technology, Engineering and Mathematics and zero otherwise. Technical Education is an indicator
variable equal to one for CEOs with undergraduate or graduate degrees in engineering, physics, operation research, chemistry, mathematics, biology, pharmacy, or
other applied science and zero otherwise. MBA is an indicator variable equal to one if the CEO received MBA degree or zero otherwise. No school information is
an indicator equal to one if we cannot identify the CEOs’ undergraduate school and zero otherwise. Cash/Assets is cash scaled by Total Assets. Diversifying deal
indicator is variable that equals one if the target and Acquirer differ in their Fama-French-12 industries (FF12) classification. Relative Deal Size is the ratio of the
deal value and the market capitalization of the bidder. Public Target Indicator is a variable that equals one if the target in M&A deal is a Public firm. All
regressions include year and industry (based on two digit SIC code) fixed effects. Standard errors are clustered at the firm level. t- ratios are reported in parentheses.
*, **, and *** denote significance at the 10%, 5%, and 1% level, respectively.
Variables
(1) (2) (3) (4)
Innovative Target Indicator Private Target Indicator
Inventor CEOInventor CEOInventor CEOInventor CEO 0.378** 0.391** 0.227*** 0.185***
(2.376) (2.371) (3.768) (2.911)
Firm-size 0.247*** 0.219*** -0.213*** -0.293***
(7.195) (6.558) (-3.168) (-3.467)
RD/Assets 2.125** 1.902 0.736 1.465
(2.177) (1.616) (0.307) (0.627)
CAPEX 0.577 1.120 1.806 0.013
(0.338) (0.672) (0.604) (0.005)
Log(Tobin's Q) -0.293** -0.314** 0.233* 0.415***
(-2.140) (-2.137) (1.901) (3.555)
Leverage -0.485 -0.560 0.109 0.143
(-0.927) (-1.018) (0.450) (0.652)
CEO Tenure -0.013 -0.015 -0.033 -0.022
(-0.836) (-0.960) (-0.771) (-0.522)

60
CEO Tenure Squared 0.001 0.001 0.000 -0.000
(1.576) (1.432) (0.116) (-0.144)
PhD (STEM) 0.176 0.189 0.405* 0.388
(0.764) (0.826) (1.723) (1.569)
MBA 0.406*** 0.359** 0.055 0.075
(2.899) (2.529) (0.560) (0.592)
Technical Education 0.408*** 0.394*** -0.059 -0.112
(3.068) (2.816) (-0.682) (-1.095)
No school information 0.521* 0.471 0.166 0.029
(1.785) (1.416) (0.439) (0.094)
Cash/Assets -0.768 -0.729 1.117*** 1.055**
(-1.462) (-1.353) (3.360) (2.375)
Diversifying Deal Indicator -0.083 -0.080
(-0.465) (-0.393)
Relative Deal Size 0.343** -1.202***
(2.195) (-3.318)
Public target Indicator 0.487***
(4.184) Private target Indicator -0.329***
(-3.364) Constant -2.526*** -2.216*** 1.409 2.012*
(-7.276) (-6.597) (1.452) (1.753)
Observations 1,781 1,758 1,781 1,758
Industry-Fixed effects Y Y Y Y
Year Fixed effects Y Y Y Y
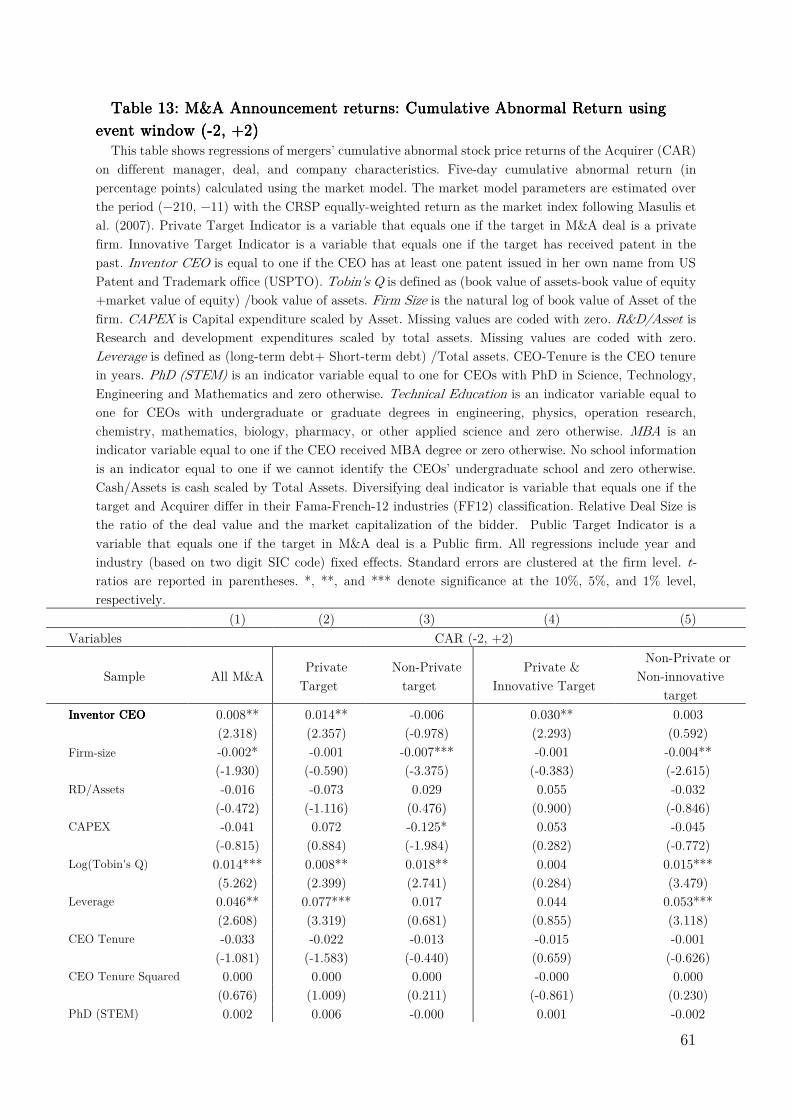
61
Table 13: M&A Announcement returns: Cumulative Abnormal Return using Table 13: M&A Announcement returns: Cumulative Abnormal Return using Table 13: M&A Announcement returns: Cumulative Abnormal Return using Table 13: M&A Announcement returns: Cumulative Abnormal Return using
eveeveeveevent window (nt window (nt window (nt window (----2, +2)2, +2)2, +2)2, +2) This table shows regressions of mergers’ cumulative abnormal stock price returns of the Acquirer (CAR)
on different manager, deal, and company characteristics. Five-day cumulative abnormal return (in
percentage points) calculated using the market model. The market model parameters are estimated over
the period (−210, −11) with the CRSP equally-weighted return as the market index following Masulis et
al. (2007). Private Target Indicator is a variable that equals one if the target in M&A deal is a private
firm. Innovative Target Indicator is a variable that equals one if the target has received patent in the
past. Inventor CEO is equal to one if the CEO has at least one patent issued in her own name from US
Patent and Trademark office (USPTO). Tobin's Q is defined as (book value of assets-book value of equity
+market value of equity) /book value of assets. Firm Size is the natural log of book value of Asset of the
firm. CAPEX is Capital expenditure scaled by Asset. Missing values are coded with zero. R&D/Asset is
Research and development expenditures scaled by total assets. Missing values are coded with zero.
Leverage is defined as (long-term debt+ Short-term debt) /Total assets. CEO-Tenure is the CEO tenure
in years. PhD (STEM) is an indicator variable equal to one for CEOs with PhD in Science, Technology,
Engineering and Mathematics and zero otherwise. Technical Education is an indicator variable equal to
one for CEOs with undergraduate or graduate degrees in engineering, physics, operation research,
chemistry, mathematics, biology, pharmacy, or other applied science and zero otherwise. MBA is an
indicator variable equal to one if the CEO received MBA degree or zero otherwise. No school information
is an indicator equal to one if we cannot identify the CEOs’ undergraduate school and zero otherwise.
Cash/Assets is cash scaled by Total Assets. Diversifying deal indicator is variable that equals one if the
target and Acquirer differ in their Fama-French-12 industries (FF12) classification. Relative Deal Size is
the ratio of the deal value and the market capitalization of the bidder. Public Target Indicator is a
variable that equals one if the target in M&A deal is a Public firm. All regressions include year and
industry (based on two digit SIC code) fixed effects. Standard errors are clustered at the firm level. t-
ratios are reported in parentheses. *, **, and *** denote significance at the 10%, 5%, and 1% level,
respectively.
(1) (2) (3) (4) (5)
Variables CAR (-2, +2)
Sample All M&A Private
Target
Non-Private
target
Private &
Innovative Target
Non-Private or
Non-innovative
target
Inventor CEOInventor CEOInventor CEOInventor CEO 0.008** 0.014** -0.006 0.030** 0.003
(2.318) (2.357) (-0.978) (2.293) (0.592)
Firm-size -0.002* -0.001 -0.007*** -0.001 -0.004**
(-1.930) (-0.590) (-3.375) (-0.383) (-2.615)
RD/Assets -0.016 -0.073 0.029 0.055 -0.032
(-0.472) (-1.116) (0.476) (0.900) (-0.846)
CAPEX -0.041 0.072 -0.125* 0.053 -0.045
(-0.815) (0.884) (-1.984) (0.282) (-0.772)
Log(Tobin's Q) 0.014*** 0.008** 0.018** 0.004 0.015***
(5.262) (2.399) (2.741) (0.284) (3.479)
Leverage 0.046** 0.077*** 0.017 0.044 0.053***
(2.608) (3.319) (0.681) (0.855) (3.118)
CEO Tenure -0.033 -0.022 -0.013 -0.015 -0.001
(-1.081) (-1.583) (-0.440) (0.659) (-0.626)
CEO Tenure Squared 0.000 0.000 0.000 -0.000 0.000
(0.676) (1.009) (0.211) (-0.861) (0.230)
PhD (STEM) 0.002 0.006 -0.000 0.001 -0.002
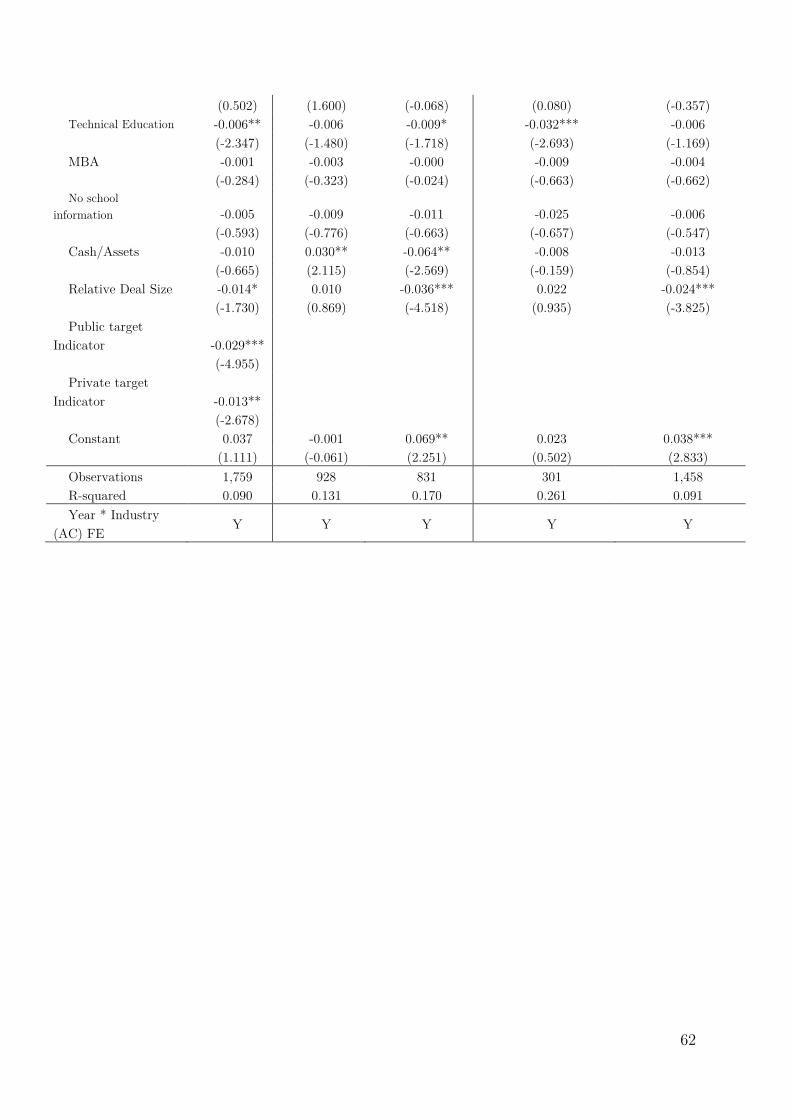
62
(0.502) (1.600) (-0.068) (0.080) (-0.357)
Technical Education -0.006** -0.006 -0.009* -0.032*** -0.006
(-2.347) (-1.480) (-1.718) (-2.693) (-1.169)
MBA -0.001 -0.003 -0.000 -0.009 -0.004
(-0.284) (-0.323) (-0.024) (-0.663) (-0.662)
No school
information -0.005 -0.009 -0.011 -0.025 -0.006
(-0.593) (-0.776) (-0.663) (-0.657) (-0.547)
Cash/Assets -0.010 0.030** -0.064** -0.008 -0.013
(-0.665) (2.115) (-2.569) (-0.159) (-0.854)
Relative Deal Size -0.014* 0.010 -0.036*** 0.022 -0.024***
(-1.730) (0.869) (-4.518) (0.935) (-3.825)
Public target
Indicator -0.029***
(-4.955) Private target
Indicator -0.013**
(-2.678) Constant 0.037 -0.001 0.069** 0.023 0.038***
(1.111) (-0.061) (2.251) (0.502) (2.833)
Observations 1,759 928 831 301 1,458
R-squared 0.090 0.131 0.170 0.261 0.091
Year * Industry
(AC) FE Y Y Y Y Y

63
Table 14: Incremental Value creatiTable 14: Incremental Value creatiTable 14: Incremental Value creatiTable 14: Incremental Value creation from new product announcementon from new product announcementon from new product announcementon from new product announcement The table presents results of incremental value creation from new product announcement by the
Inventor-CEOs. Inventor CEO is equal to one if the CEO has at least one patent issued in her own name
from US Patent and Trademark office (USPTO). Innovation Active-CEO is equal to one if the CEO has
at least one patent issued in her own name within 2 years of focal firm year from US Patent and Trademark
office (USPTO). New Product announcement return is defined as the sum of all positive cumulative
abnormal returns over the year in basis points and Major New Product Announcement is the number of
announcements with cumulative abnormal returns above the 75th percentile following Mukherjee et al.
(2016). Tobin's Q is defined as (book value of assets-book value of equity +market value of equity) /book
value of assets. Firm Size is the natural log of book value of Asset of the firm. Firm-age is the Log of firm
age where firm age is the number of years since the inception of the firms. Volatility is the volatility of
stock return. CAPEX is Capital expenditure scaled by Asset. Missing values are coded with zero.
R&D/Asset is Research and development expenditures scaled by total assets. Missing values are coded
with zero. Leverage is defined as (long-term debt+ Short-term debt) /Total assets. CEO-Tenure is the
CEO tenure in years. PhD (STEM) is an indicator variable equal to one for CEOs with PhD in Science,
Technology, Engineering and Mathematics and zero otherwise. Technical Education is an indicator
variable equal to one for CEOs with undergraduate or graduate degrees in engineering, physics, operation
research, chemistry, mathematics, biology, pharmacy, or other applied science and zero otherwise. MBA
is an indicator variable equal to one if the CEO received MBA degree or zero otherwise. No school
information is an indicator equal to one if we cannot identify the CEOs’ undergraduate school and zero
otherwise. All regressions include year and industry (based on two digit SIC code) fixed effects. Standard
errors are clustered at the firm level. t- ratios are reported in parentheses. *, **, and *** denote significance
at the 10%, 5%, and 1% level, respectively.
(1) (2) (3) (4)
Variables New Product
announcement return
Log(1+# Major New
Product Announcement)
New Product
announcement return
Log(1+# Major New
Product Announcement)
Inventor CEOInventor CEOInventor CEOInventor CEO 0.198** 0.295***
(2.352) (2.887) Firm-size 0.132*** 0.289*** 0.132*** 0.290***
(4.817) (8.168) (4.585) (7.889)
Firm-Age -0.020 -0.051 -0.019 -0.047
(-0.915) (-1.136) (-0.854) (-1.062)
Volatility 0.001 0.026 0.004 0.032
(0.065) (0.620) (0.229) (0.730)
RD/Assets 0.802*** 2.307*** 0.766*** 2.248***
(4.058) (4.581) (3.990) (4.558)
CAPEX -0.074 0.257 -0.115 0.170
(-0.163) (0.326) (-0.256) (0.219)
Leverage -0.446*** -0.927*** -0.447*** -0.927***
(-3.473) (-4.215) (-3.319) (-4.179)
Log(Tobin's Q) 0.061* 0.110** 0.057 0.103**
(1.696) (2.268) (1.513) (2.064)
CEO Tenure 0.000 0.000 0.001 0.001
(0.116) (0.034) (0.391) (0.172)
PhD (STEM) -0.059 -0.015 -0.032 0.020
(-0.819) (-0.133) (-0.530) (0.193)
Technical Education 0.027 0.013 0.024 0.007
(0.739) (0.194) (0.630) (0.111)
MBA 0.013 0.083 0.006 0.074
(0.412) (1.381) (0.188) (1.226)
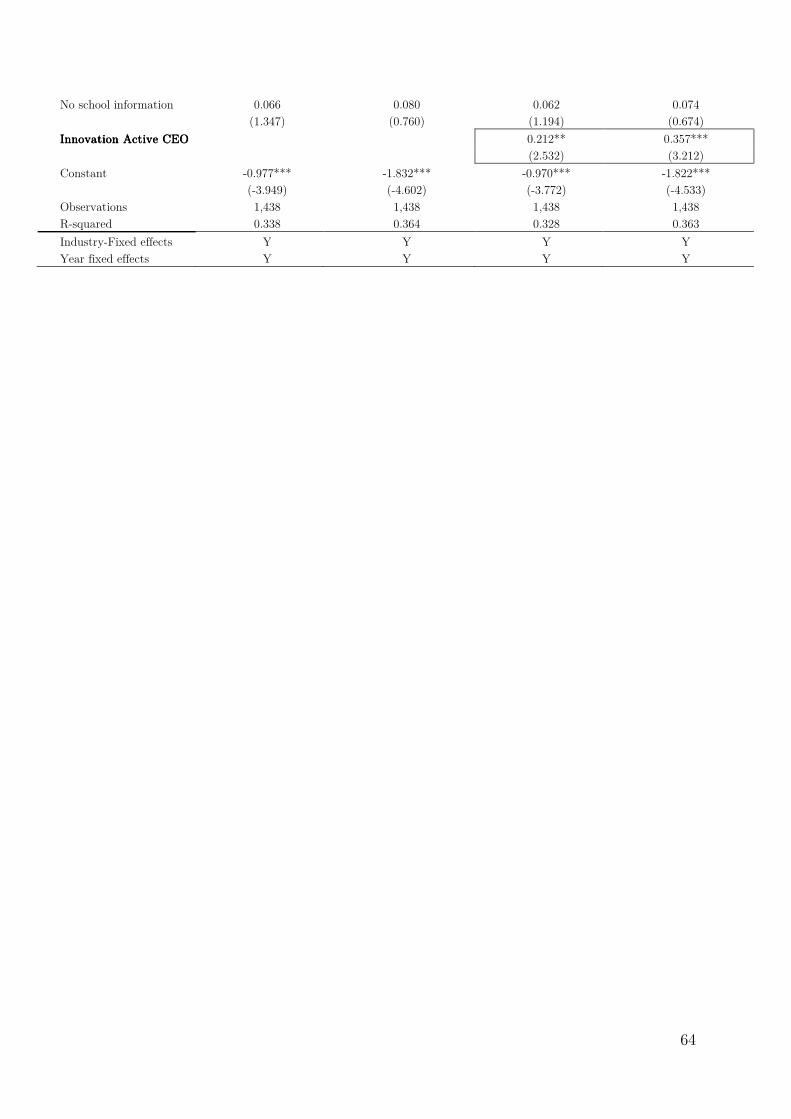
64
No school information 0.066 0.080 0.062 0.074
(1.347) (0.760) (1.194) (0.674)
Innovation Active CEOInnovation Active CEOInnovation Active CEOInnovation Active CEO 0.212** 0.357***
(2.532) (3.212)
Constant -0.977*** -1.832*** -0.970*** -1.822***
(-3.949) (-4.602) (-3.772) (-4.533)
Observations 1,438 1,438 1,438 1,438
R-squared 0.338 0.364 0.328 0.363
Industry-Fixed effects Y Y Y Y
Year fixed effects Y Y Y Y
65
AppendixAppendixAppendixAppendix Inventor CEO DatasetInventor CEO DatasetInventor CEO DatasetInventor CEO Dataset
In this section, we describe the process of Inventor CEO dummy construction by
matching the US Patent Inventor Database (PID) from Li et al. (2014) to ExecuComp
list of CEOs in our sample of High-tech firms during 1992-2008. PID contains
information (name, Country, State, City etc.) on each of the patentee of more than 8
million inventor-patents instances for patents filed since 1901 through 2010 at USPTO.
It also contains data on patent Assignees. More importantly, it contains unique inventor
ID and unique assignee ID for all these patents.
Step 1:
We use regular expression to standardize the names of the CEOs in ExecuComp
dataset to generate a list of unique CEO names with first, middle and last names. The
names of Inventor in PID are already in Standardized form. In PID, ‘Full name’ defined
as having both first and last name present is available for 99.99% of records.
Step 2:
We then match unique CEO names (Last names, Middle names and First names) in
ExecuComp to Patentee names (Last names, Middle names and First names) in PID
and generate a list of probable matches. We retain information on Unique Inventor ID
in this list which we use later to recover all the patents that belong to a particular
patentee from PID.
Step 3:
Since we have Company names and Assignee names from this matching process, we
identify instances where we find matches for both CEO names and Company names
from ExecuComp to Patentee names and Assignee names in PID, respectively. If we find
matches in both individual name category (CEO name and Patentee name) and
organizational name category (Company name and Assignee), we code them as 1 for
Inventor CEO Indicator variable.
66
Step 4:
Next, we identify rest of the instances in this list where we CEO names and Patentee
names are matched; however Company names and Assignee names do not match from
this list. For example, we find match for Gilberto F. Amelio who was a CEO for National
Semiconductor Corp (1992-1995) and Apple Inc. (1996-1997) in our sample. However,
this list shows ‘Fairchild Camera And Instrument Corporation’ as the Assignee for all
patents applied from 1973 through 1977 by this patentee.
Step 5:
Since we collect biographies for all the CEOs in our sample (various sources including
Funding Universe website, Notable Names Data Base (NNDB), company websites, and
other Internet resources including Wikipedia, Forbes pages, Bloomberg’s Business Week
website, LinkedIn pages, Crunchbase.com, among others), for matches in step 4, we
track their career history and confirm whether they have worked for these Assignee
companies/organizations in the past. Therefore, in step 3 and step 5, we identify inventor
CEOs (regardless of the focal firms in our sample) who have patenting history in USPTO.
To continue with the previous example of Gilberto F. Amelio, we track his career history
and find that he had worked for Fairchild Camera and Instrument Corporation during
1971-1983.13 The detailed executive profile also mentions that he holds several patents.14
13 (https://www.bloomberg.com/profiles/people/1409980-gilbert-f-amelio) 14 http://www.bloomberg.com/research/stocks/people/person.asp?personId=72492&privcapId=30820843

67
Table A 1: Variable definitionTable A 1: Variable definitionTable A 1: Variable definitionTable A 1: Variable definition Patents (t+1) Log(1+# of patents) at t+1
Patents (t+2) Log(1+# of patents) at t+2
Citation(t+1) Log(1+# of Citations) at t+1
Citations (t+2) Log(1+# of Citations) at t+2
Radical Innovation Patents that have cited the maximum number of times in an industry-year pair
Firm Size Log(Total Assets)
RD/Assets The ratio of research and development expenditures over total assets, expressed as a percentage. Missing values are set to zero
CAPEX The ratio of Capital Expenditure over total assets, expressed as a percentage. Missing values are set to zero
Firm Age Natural logarithm of the number of years since the firm’s inception
Leverage Sum of Short term debt and Long-term debt scaled by Total Assets
Tobin's Q
The market value of assets divided by the book value of assets where the market value of assets equals the book value of assets plus the
market value of common equity less the sum of the book value of common equity and balance sheet deferred taxes
CEO Tenure CEO tenure in years
Volatility Volatility of stock return
Founder-CEO Founder CEO is equal to one if the CEO is a founder of the firm or CEO since the founding year of the firm
Overconfident CEO (67)
Overconfident CEO (67) is an indicator variable equal to one for all years after the CEO’s options exceed 67% moneyness and zero
otherwise.
Board size Number of directors in the Corporate Board
Co-option Co-option is the fraction of directors those are appointed after CEO assumed office as defined in Coles et al. (2014).
Institutional Holdings (%) Percentage of shares held by financial institutions
CEO ownership
CEO ownership is defined as the ratio of the number of shares owned by the CEO after adjusting for stock splits to total shares
outstanding.
CEO Equity-based pay CEO equity-based pay is the value of annual option pay divided by the sum of salary, bonus and annual option pay
Delta Dollar change in CEO stock and option portfolio for a 1% change in stock price.
Vega Dollar change in CEO option holdings for a 1% change in stock return volatility.
PhD STEM
PhD (STEM) is an indicator variable equal to one for CEOs with PhD in Science, Technology, Engineering and Mathematics and zero
otherwise.
Technical Education
Technical Education is an indicator variable equal to one for CEOs with undergraduate or graduate degrees in engineering, physics,
operation research, chemistry, mathematics, biology, pharmacy, or other applied science and zero otherwise.
MBA MBA is an indicator variable equal to one if the CEO received MBA degree or zero otherwise.
No School Information No school information is an indicator equal to one if we cannot identify the CEOs’ undergraduate school and zero otherwise.
New Product announcement
return
New Product announcement return is defined as the sum of all positive cumulative abnormal returns over the year ( Mukherjee et al.
(2016))

68
Major New Product
Announcement is the number of announcements with cumulative abnormal returns above the 75 percentile ( Mukherjee et al. (2016))