inventory analysis for product wheel operations analysi… · 3 product wheels purpose process...
TRANSCRIPT
Copyright © 2008 E. I. du Pont de Nemours and Company
All rights reserved.
Inventory Analysis for Product Wheel Operations
Bennett Foster
DuPont Operations Center of Competency
Supply Chain Analytics (O.R.) Group
July 26th, 2012
2
Acknowledgements – DuPont Colleagues
Pete King
Alev Kaya
Cris Leyson
3
Product Wheels
Purpose
Process
Product
Review of product wheels, safety stock calculations, and replenishment lead time “risk” considerations
To understand how inventory is calculated and impacts cost when running product wheels.
Basic understanding of inventory and inventory cost calculations when running product wheels
4
Product Wheels and Inventory
The Basics
Managing Principles
Safety stock calculations
Safety stock versus product wheel length
Inventory calculations for supply chain networks
Contents
5
Product Wheel: The Basics
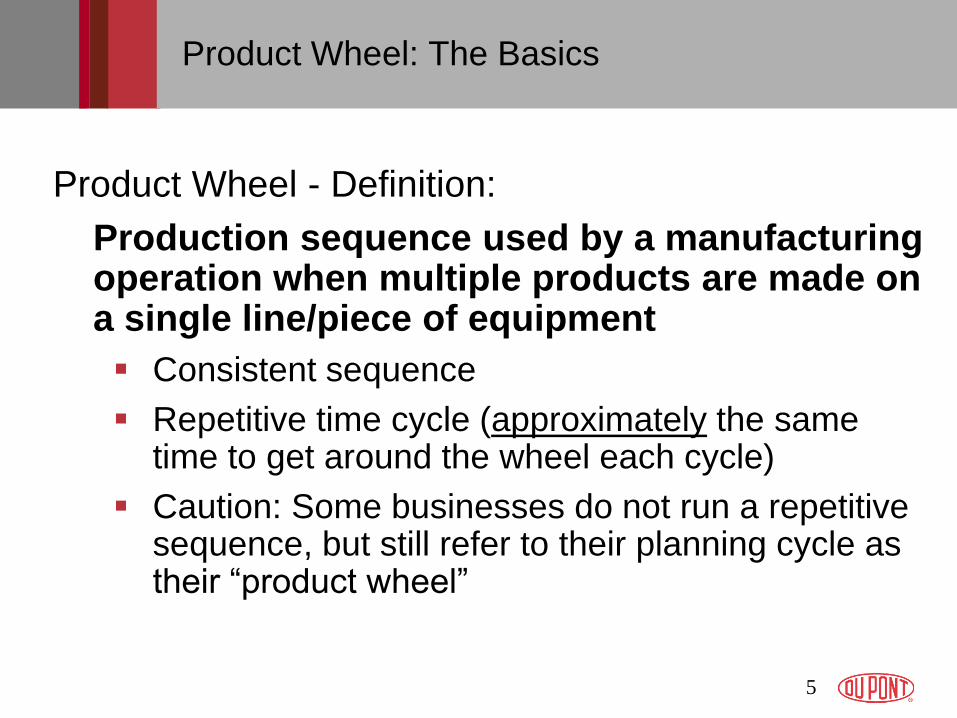
Product Wheel - Definition:
Production sequence used by a manufacturing operation when multiple products are made on a single line/piece of equipment
Consistent sequence
Repetitive time cycle (approximately the same time to get around the wheel each cycle)
Caution: Some businesses do not run a repetitive sequence, but still refer to their planning cycle as their “product wheel”

6
Batch: Size of one unit of production (in batch processes)
Campaign: “spoke”, length of one segment of a product wheel, or a series of batches of same product
Lot: subsets of campaigns to represent some quality commonality
Cycle: planning length that includes multiple campaigns. Sequence, campaign lengths and gaps need
to be specified.
TIME WHEN CYCLE
STOCK INVENTORY
FOR B IS NEEDED
BATCHES
A
D
C
B
IDLE
TRANSITIONS
CAMPAIGN
TRANSITIONS
• The amount of B
produced must be
enough to satisfy
demand of B during
the entire cycle, plus
safety stock make-up
• The inventory left at
the end of the B
campaign must be
enough to last
through the remainder
of the cycle until the
next campaign of B
starts.
Concepts & Definitions
7
Product Wheel: When should they be used?
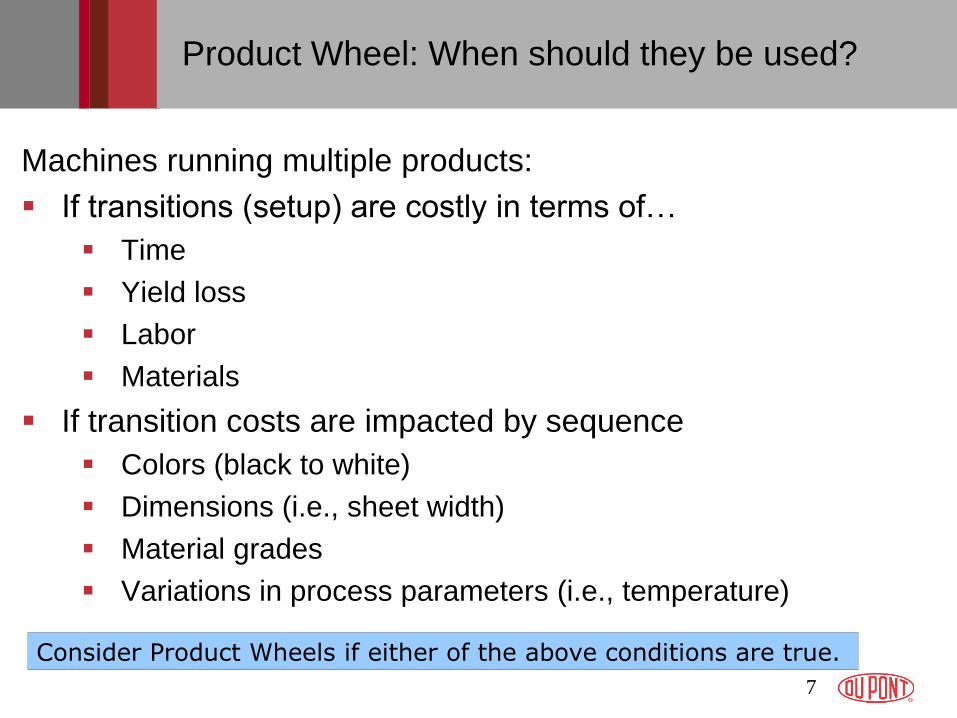
Machines running multiple products:
If transitions (setup) are costly in terms of…
Time
Yield loss
Labor
Materials
If transition costs are impacted by sequence
Colors (black to white)
Dimensions (i.e., sheet width)
Material grades
Variations in process parameters (i.e., temperature)
Consider Product Wheels if either of the above conditions are true.
8
Product Wheel: Why?
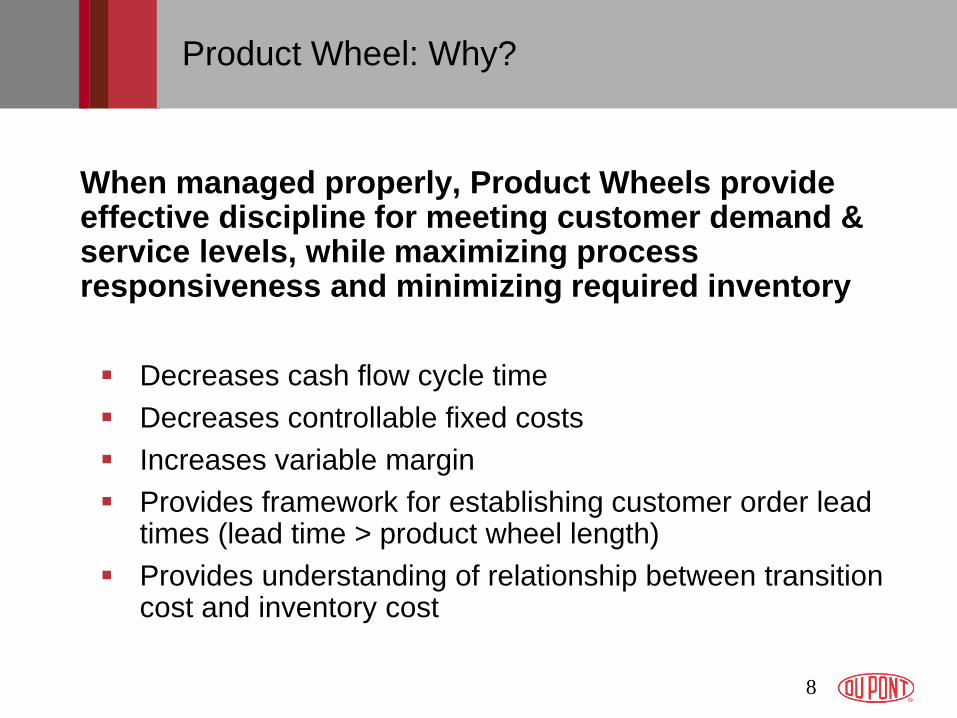
When managed properly, Product Wheels provide effective discipline for meeting customer demand & service levels, while maximizing process responsiveness and minimizing required inventory
Decreases cash flow cycle time
Decreases controllable fixed costs
Increases variable margin
Provides framework for establishing customer order lead times (lead time > product wheel length)
Provides understanding of relationship between transition cost and inventory cost
9
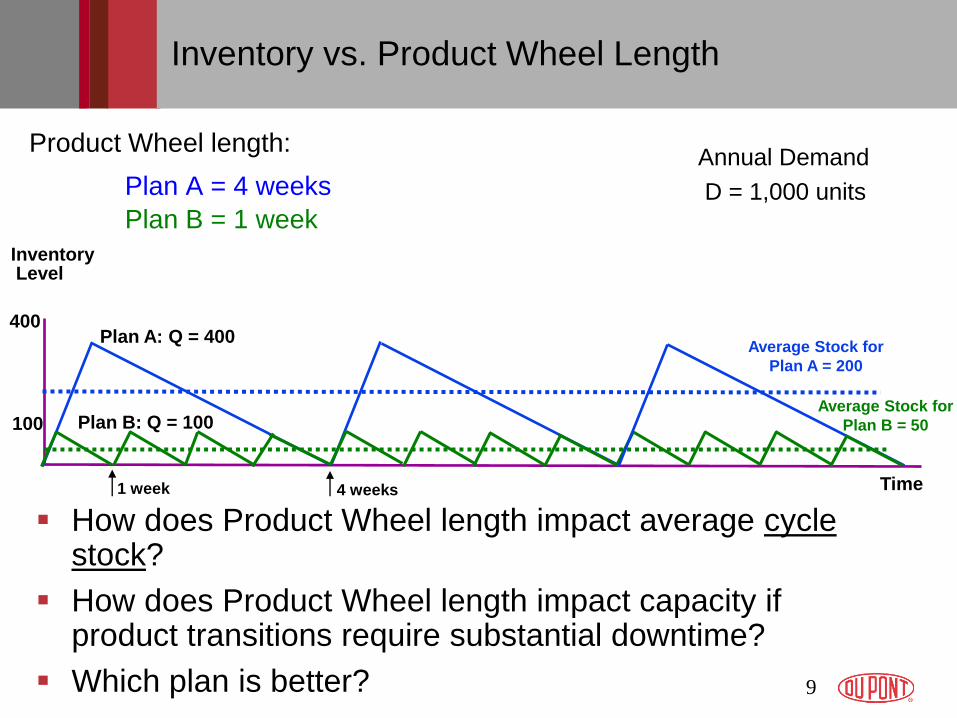
Product Wheel length:
Plan A = 4 weeks
Plan B = 1 week
How does Product Wheel length impact average cycle stock?
How does Product Wheel length impact capacity if product transitions require substantial downtime?
Which plan is better?
Average Stock for
Plan B = 50
Inventory Level
Time
Average Stock for
Plan A = 200
400
100 Plan B: Q = 100
Plan A: Q = 400
1 week 4 weeks
Inventory vs. Product Wheel Length
Annual Demand
D = 1,000 units

10
WHEEL TIME
CYCLE LENGTH
B
A
C
D
A B
B C
D A D
Concepts & Definitions: Product Wheel Cycle Length In
vento
ry L
evel
Cycle Stock
11
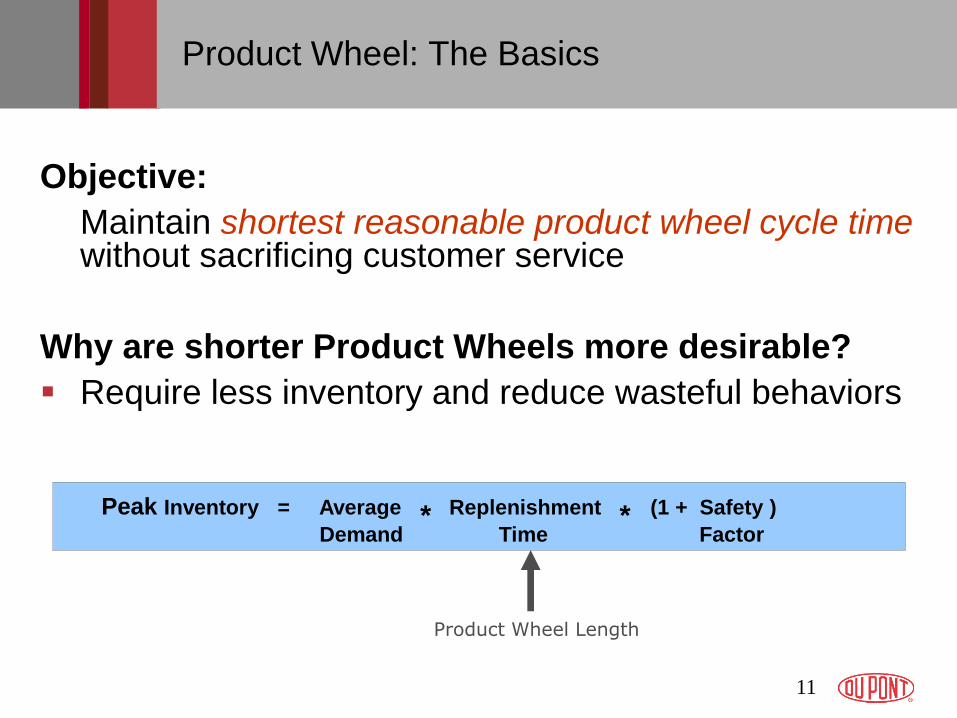
Product Wheel: The Basics
Objective:
Maintain shortest reasonable product wheel cycle time without sacrificing customer service
Why are shorter Product Wheels more desirable?
Require less inventory and reduce wasteful behaviors
Peak Inventory = Average * Replenishment * (1 + Safety )
Demand Time Factor
Product Wheel Length
12
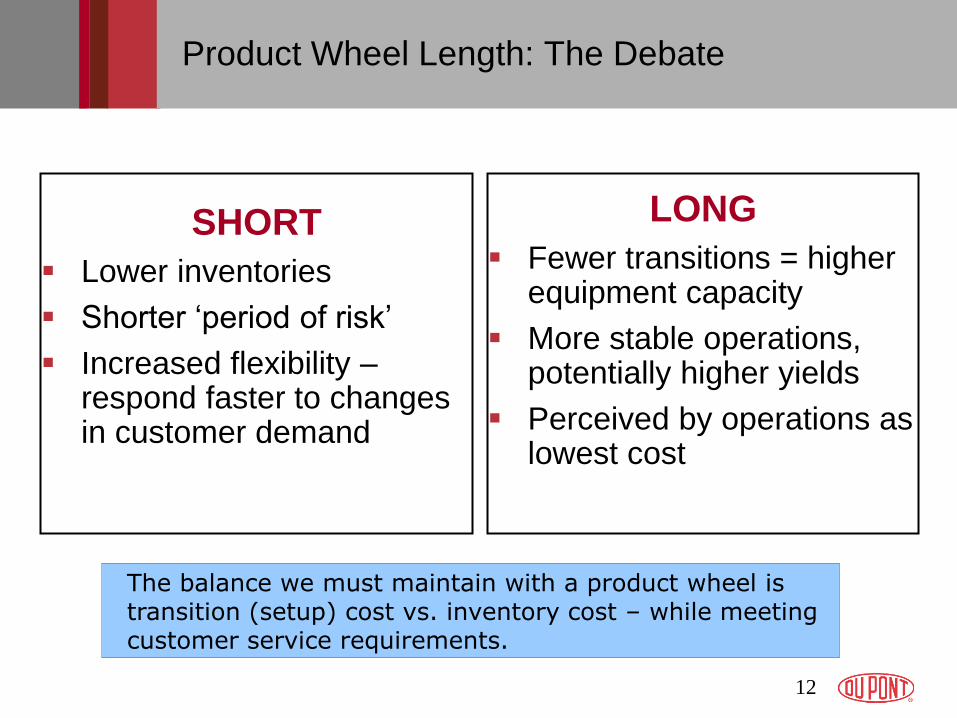
Product Wheel Length: The Debate
SHORT
Lower inventories
Shorter „period of risk‟
Increased flexibility –respond faster to changes in customer demand
LONG
Fewer transitions = higher equipment capacity
More stable operations, potentially higher yields
Perceived by operations as lowest cost
The balance we must maintain with a product wheel is transition (setup) cost vs. inventory cost – while meeting customer service requirements.
13
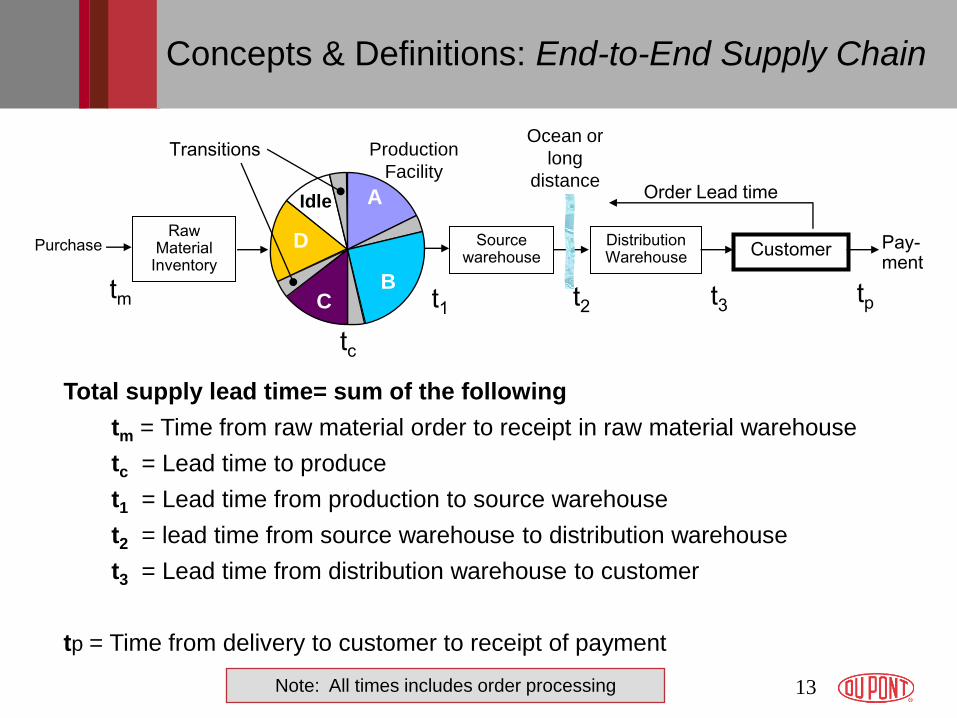
Total supply lead time= sum of the following
tm = Time from raw material order to receipt in raw material warehouse
tc = Lead time to produce
t1 = Lead time from production to source warehouse
t2 = lead time from source warehouse to distribution warehouse
t3 = Lead time from distribution warehouse to customer
tp = Time from delivery to customer to receipt of payment
tc
t1
Source warehouse
Distribution Warehouse
t2 t3
Customer
Order Lead time
Raw Material
Inventory
tm
Pay-ment
Purchase
tp
Ocean or
long
distance
B
A
C
D
Idle
Transitions Production
Facility
Concepts & Definitions: End-to-End Supply Chain
Note: All times includes order processing
14
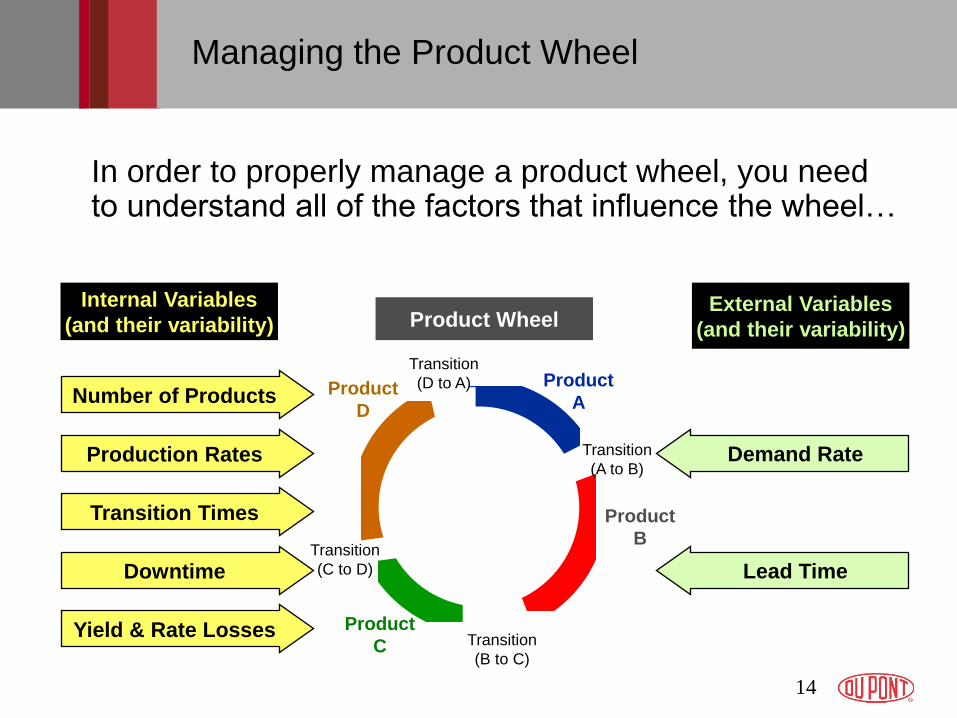
Managing the Product Wheel
In order to properly manage a product wheel, you need to understand all of the factors that influence the wheel…
Internal Variables
(and their variability)
Yield & Rate Losses
Downtime
Transition Times
Production Rates
Number of Products
External Variables
(and their variability)
Lead Time
Demand Rate
Product Wheel
Product
A
Product
B
Product
C
Product
D
Transition
(A to B)
Transition
(B to C)
Transition
(C to D)
Transition
(D to A)
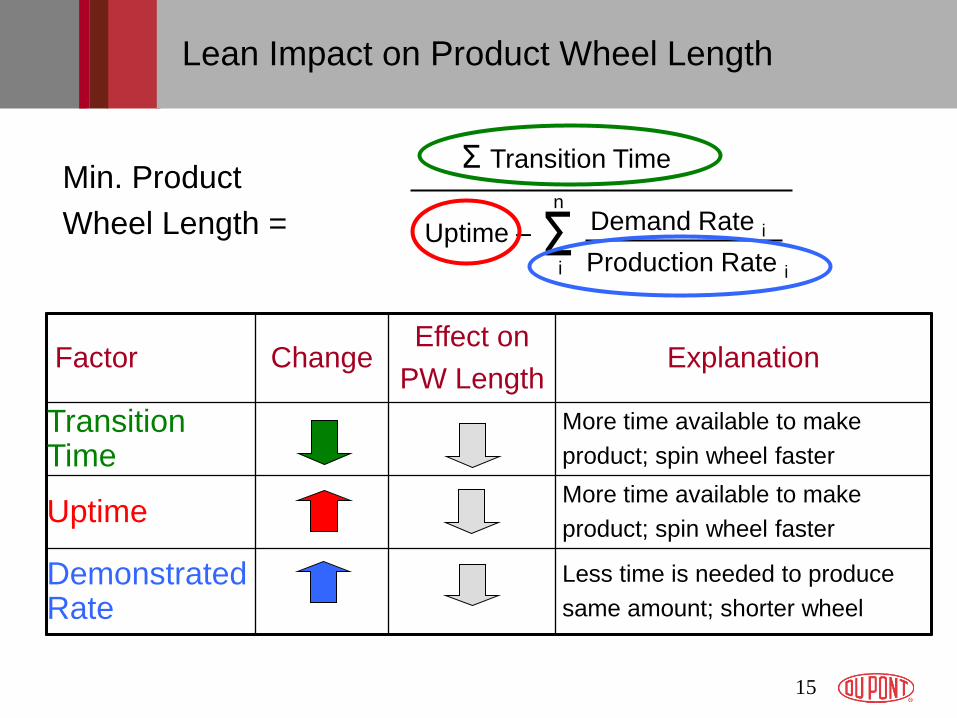
15
Σ Transition Time
Uptime – Σ Demand Rate i
Production Rate i
Min. Product
Wheel Length =
i
n
Lean Impact on Product Wheel Length
Factor Change Effect on
PW Length Explanation
Transition Time
More time available to make
product; spin wheel faster
Uptime More time available to make
product; spin wheel faster
Demonstrated Rate
Less time is needed to produce
same amount; shorter wheel
16
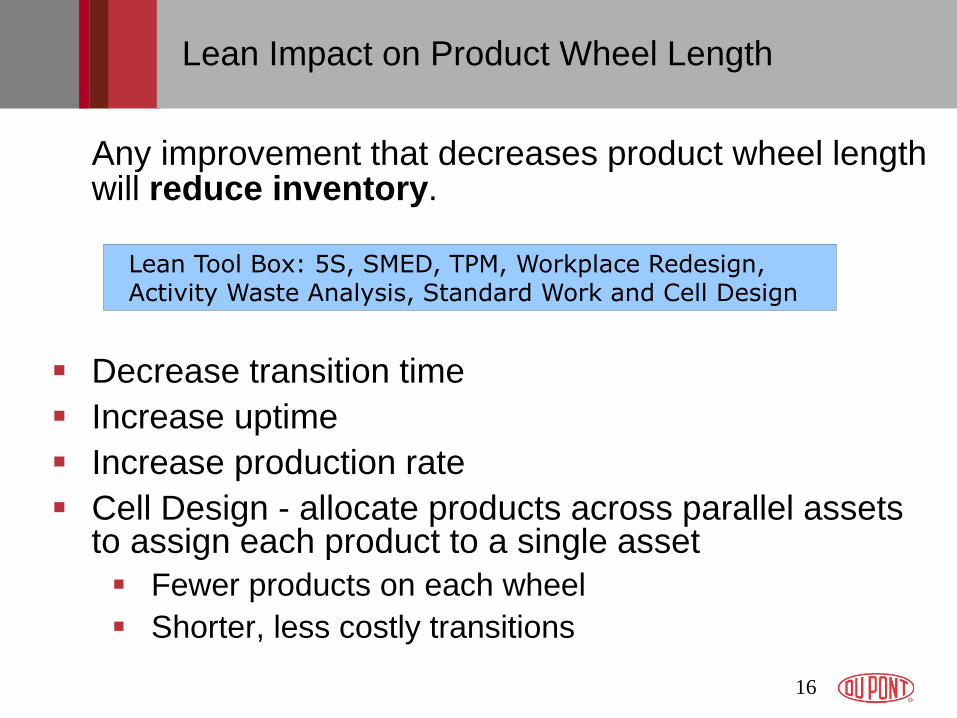
Any improvement that decreases product wheel length will reduce inventory.
Decrease transition time
Increase uptime
Increase production rate
Cell Design - allocate products across parallel assets to assign each product to a single asset
Fewer products on each wheel
Shorter, less costly transitions
Lean Tool Box: 5S, SMED, TPM, Workplace Redesign, Activity Waste Analysis, Standard Work and Cell Design
Lean Impact on Product Wheel Length
17
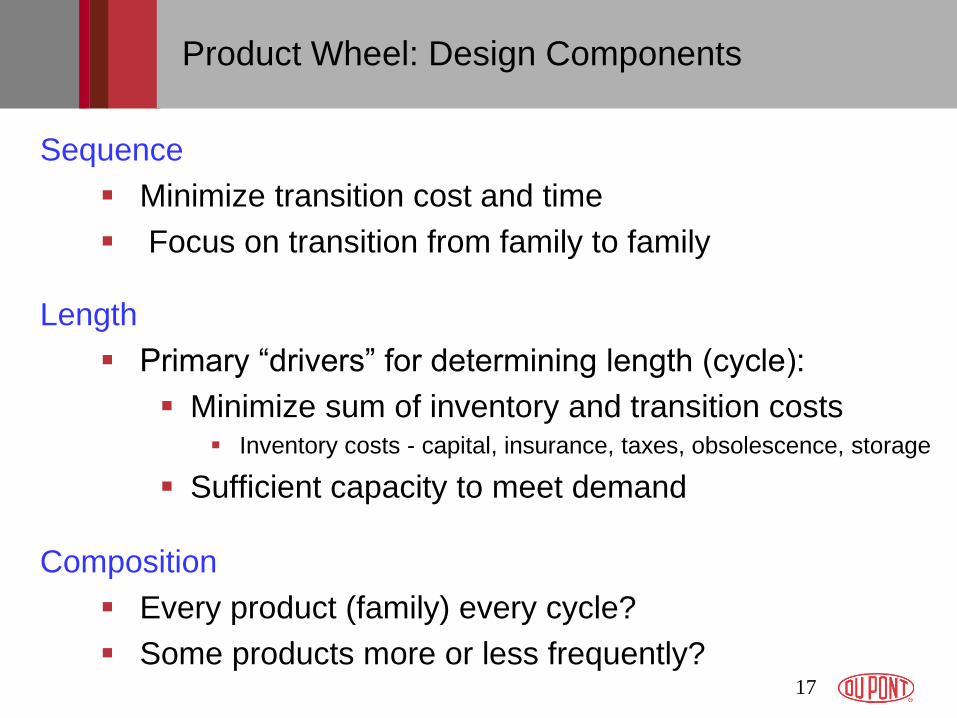
Product Wheel: Design Components
Sequence
Minimize transition cost and time
Focus on transition from family to family
Length
Primary “drivers” for determining length (cycle):
Minimize sum of inventory and transition costs Inventory costs - capital, insurance, taxes, obsolescence, storage
Sufficient capacity to meet demand
Composition
Every product (family) every cycle?
Some products more or less frequently?
18
Other factors that impact Product Wheel design
Minimum campaign lengths and batch sizes
Sales constraints may strongly influence design
Capability to do transitions – timing, run order, …
Other technical constraints: cleanouts, catalysts, …
Process capability
Unscheduled down time: average and variability
Lead time uncertainty
Volume discounts
Transportation economies
Supplier policy
Multiple-item purchases
19
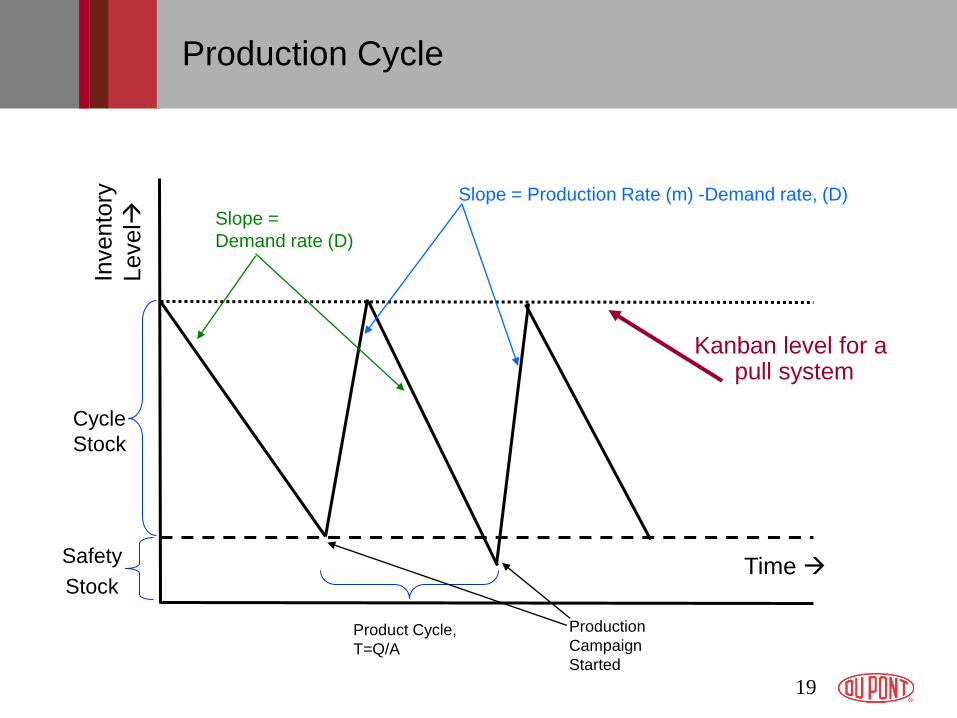
Production Cycle
Time
Invento
ry
Level
Production
Campaign
Started
Product Cycle,
T=Q/A
Cycle
Stock
Slope =
Demand rate (D)
Slope = Production Rate (m) -Demand rate, (D)
Safety
Stock
Kanban level for a pull system
20
Product Wheels – The Case for Spinning Faster
Lower inventory levels mean less investment and lower inventory carrying costs
Running a product more frequently reduces the likelihood of stockouts (a fact that is not accounted for in the EOQ calculations)
From a “Lean” perspective – transition cost and time are factors to be reduced instead of “accepted” – to make lower inventories and more frequent transitions an accepted practice (and a competitive advantage)
21
Product Wheel Calculations – Cycle Stock vs. Safety Stock
Traditionally, cycle stock and safety stock calculations are carried out separately
One might imply that the two are independent
They are not!
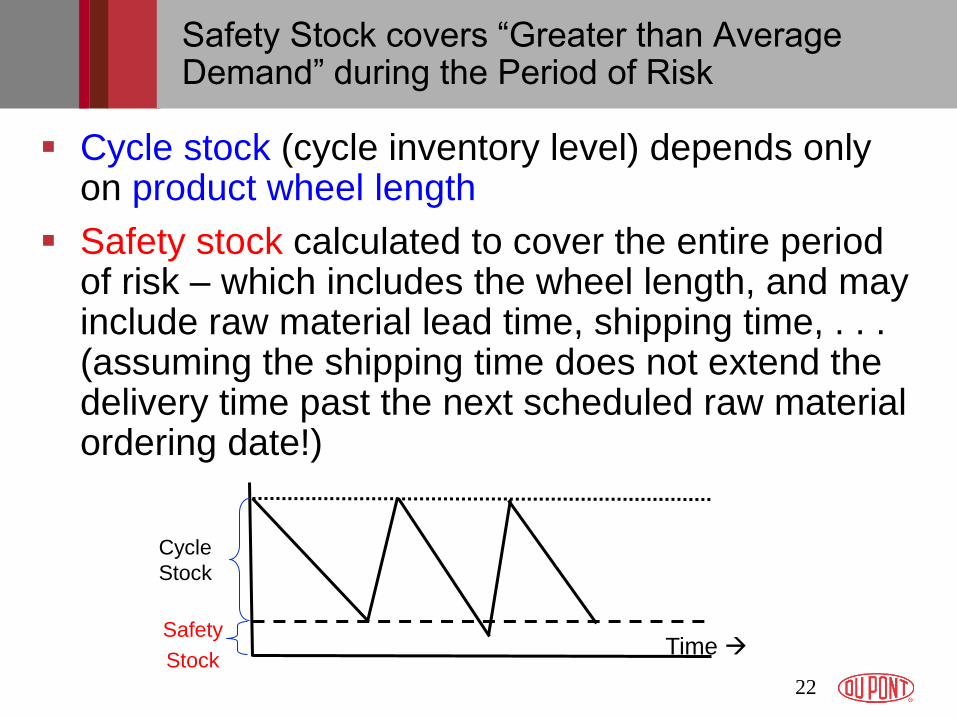
Safety Stock covers “Greater than Average Demand” during the Period of Risk
Cycle stock (cycle inventory level) depends only on product wheel length
Safety stock calculated to cover the entire period of risk – which includes the wheel length, and may include raw material lead time, shipping time, . . . (assuming the shipping time does not extend the delivery time past the next scheduled raw material ordering date!)
22
Time
Cycle
Stock
Safety
Stock
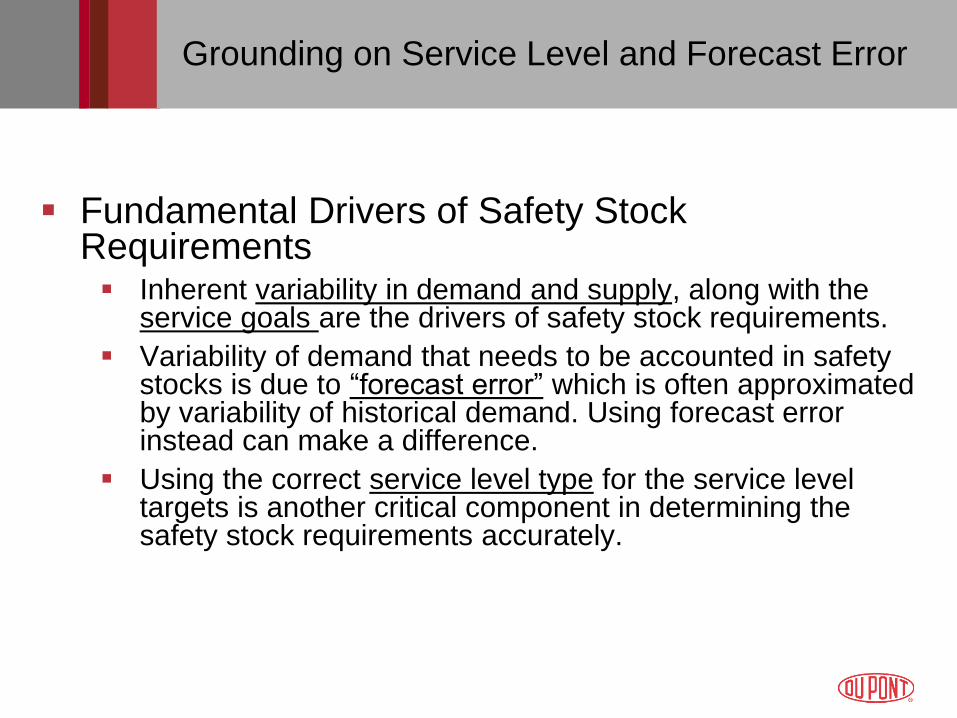
Grounding on Service Level and Forecast Error
Fundamental Drivers of Safety Stock Requirements Inherent variability in demand and supply, along with the
service goals are the drivers of safety stock requirements.
Variability of demand that needs to be accounted in safety stocks is due to “forecast error” which is often approximated by variability of historical demand. Using forecast error instead can make a difference.
Using the correct service level type for the service level targets is another critical component in determining the safety stock requirements accurately.
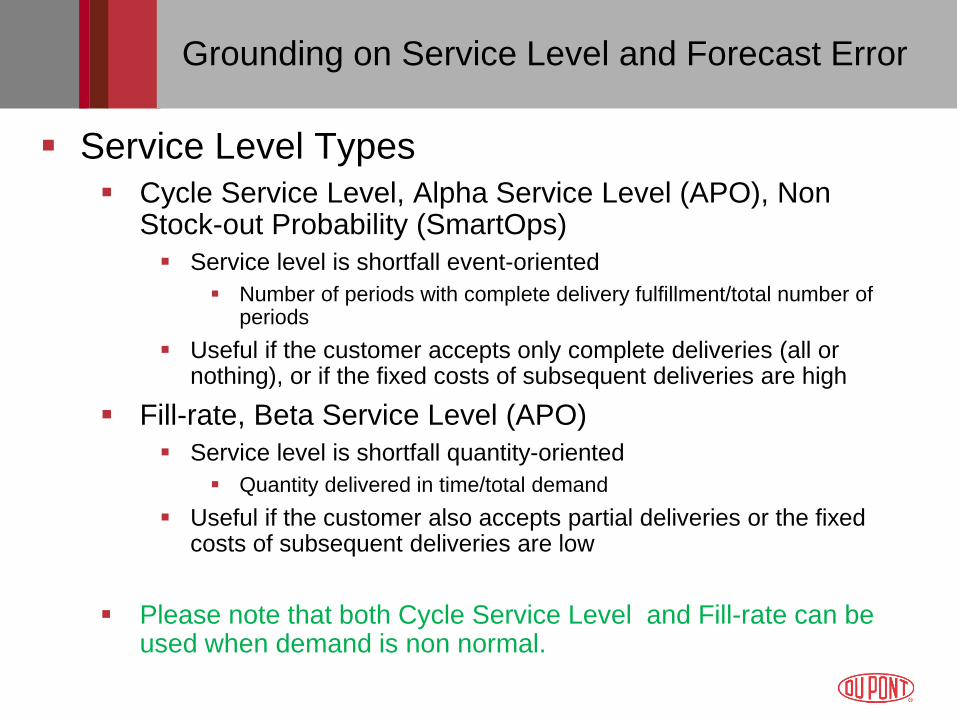
Grounding on Service Level and Forecast Error
Service Level Types
Cycle Service Level, Alpha Service Level (APO), Non Stock-out Probability (SmartOps)
Service level is shortfall event-oriented
Number of periods with complete delivery fulfillment/total number of periods
Useful if the customer accepts only complete deliveries (all or nothing), or if the fixed costs of subsequent deliveries are high
Fill-rate, Beta Service Level (APO)
Service level is shortfall quantity-oriented
Quantity delivered in time/total demand
Useful if the customer also accepts partial deliveries or the fixed costs of subsequent deliveries are low
Please note that both Cycle Service Level and Fill-rate can be used when demand is non normal.
25
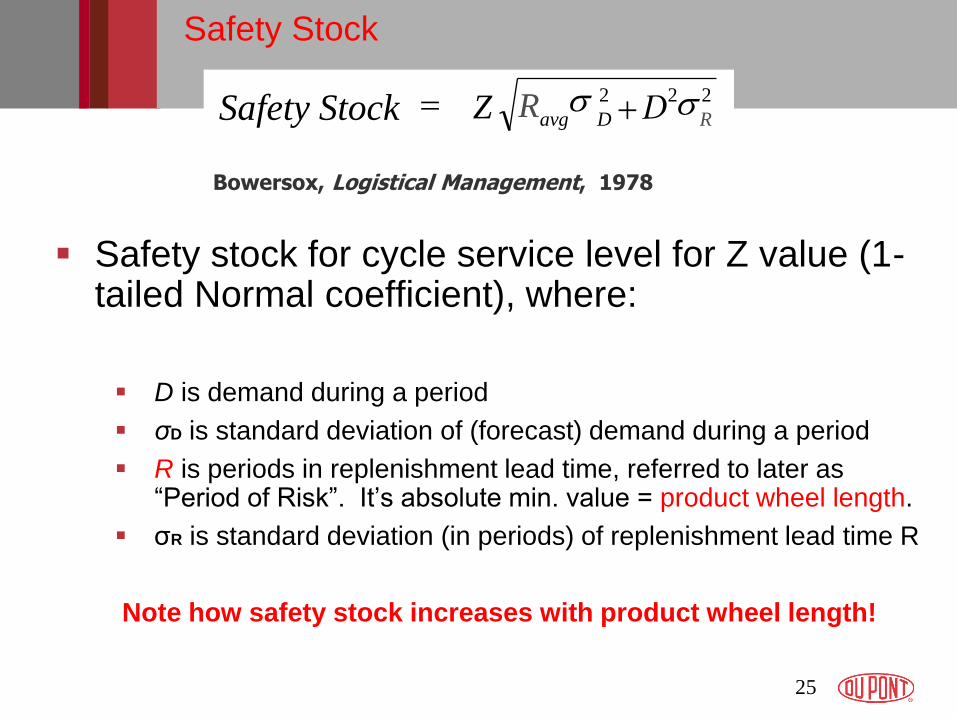
Safety stock for cycle service level for Z value (1-tailed Normal coefficient), where:
D is demand during a period
σD is standard deviation of (forecast) demand during a period
R is periods in replenishment lead time, referred to later as “Period of Risk”. It‟s absolute min. value = product wheel length.
σR is standard deviation (in periods) of replenishment lead time R
Note how safety stock increases with product wheel length!
2 2 2
R D avg R Z s s + = Safety Stock
Bowersox, Logistical Management, 1978
Safety Stock

The Necessity of Comparing Forecasts to Actual
Forecast error is the difference between forecast and actual sales
Using standard deviation of historical demand substitutes forecast error by demand variability, and ignores existing time-varying forecasts
60
70
80
90
100
110
120
130
140
150
160
0 1 2 3 4 5 6 7 8 9 10 11 12 13
Month
De
ma
nd
Forecast
Actual Demand
Average Demand
STDEV of Forecast Error = 5.2
STDEV of Historical Demand = 19
Safety Stock - STDEV of Demand: If you Forecast Demand, use STDEV of Forecast Error
27
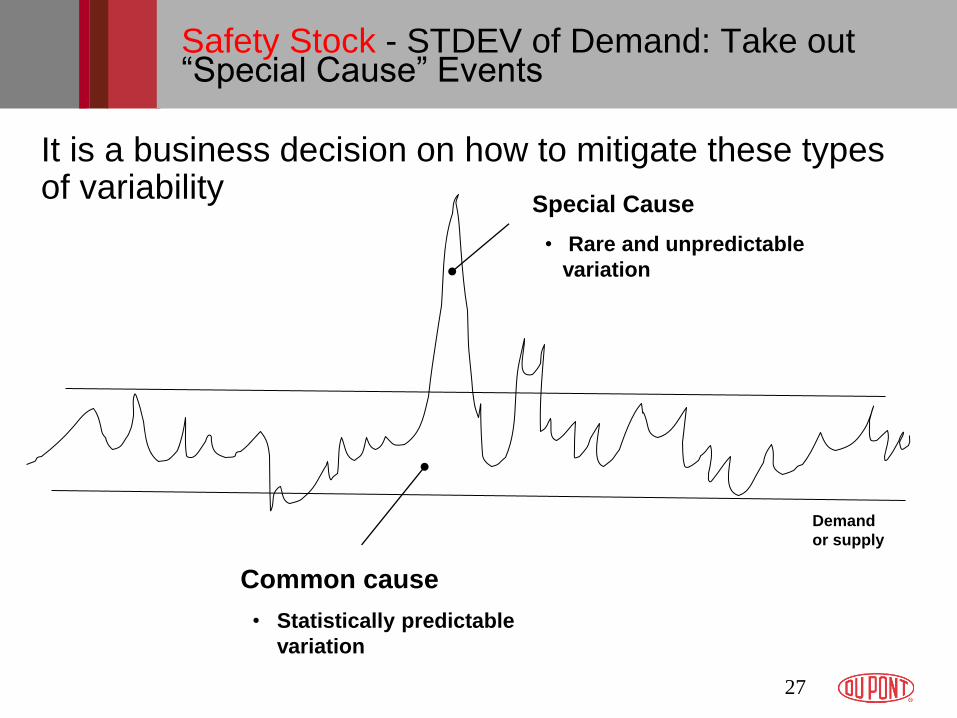
It is a business decision on how to mitigate these types of variability
Common cause
• Statistically predictable
variation
Special Cause
• Rare and unpredictable
variation
Demand
or supply
Safety Stock - STDEV of Demand: Take out “Special Cause” Events
28
D
2 D
1 D
3
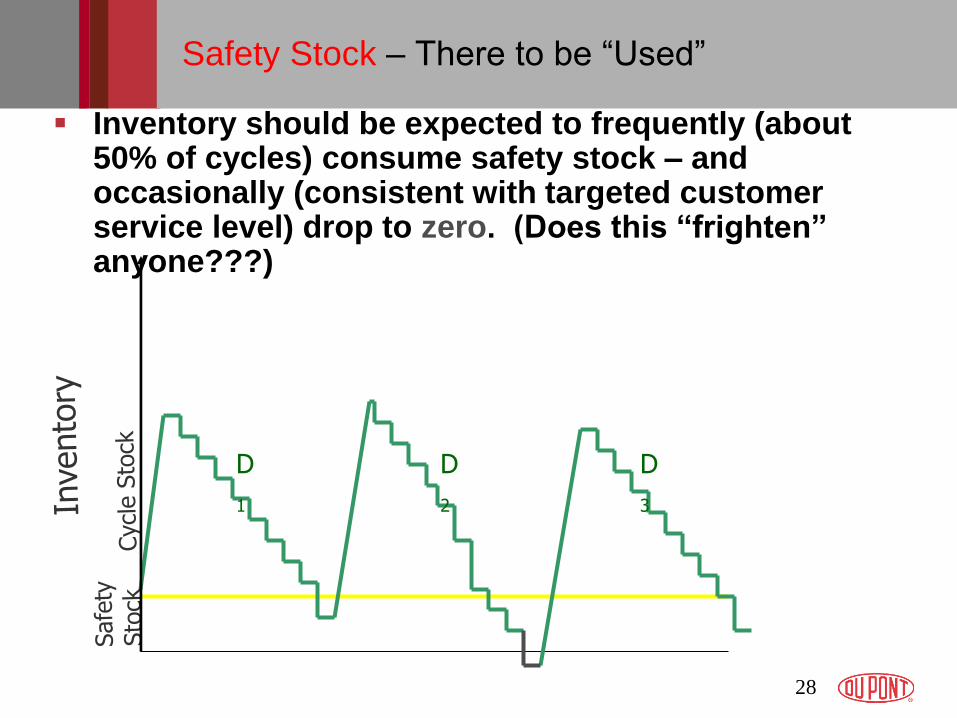
Safety Stock – There to be “Used”
Inventory should be expected to frequently (about 50% of cycles) consume safety stock – and occasionally (consistent with targeted customer service level) drop to zero. (Does this “frighten” anyone???)
29
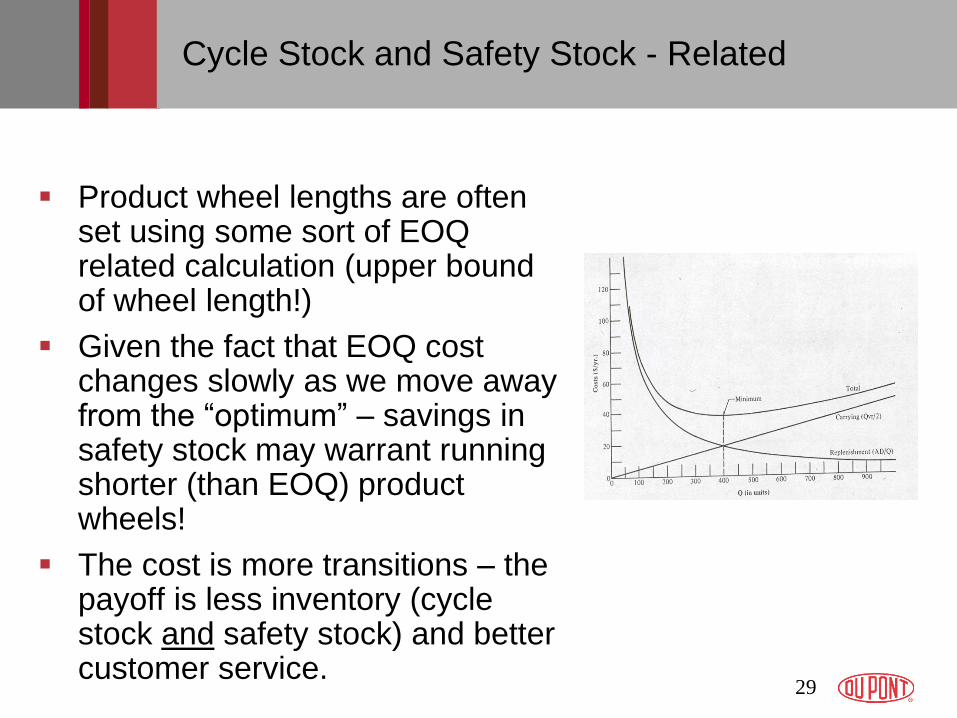
Cycle Stock and Safety Stock - Related
Product wheel lengths are often set using some sort of EOQ related calculation (upper bound of wheel length!)
Given the fact that EOQ cost changes slowly as we move away from the “optimum” – savings in safety stock may warrant running shorter (than EOQ) product wheels!
The cost is more transitions – the payoff is less inventory (cycle stock and safety stock) and better customer service.
30
WHEEL TIME
CYCLE LENGTH
B
A
C
D
A B
B C
D A D
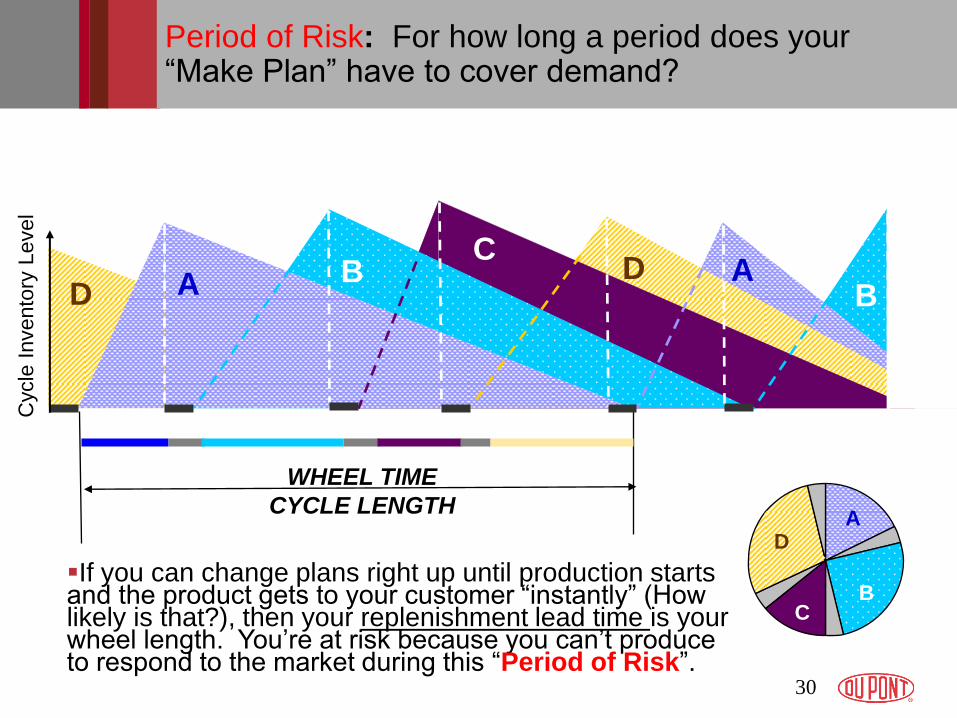
Period of Risk: For how long a period does your “Make Plan” have to cover demand?
If you can change plans right up until production starts and the product gets to your customer “instantly” (How likely is that?), then your replenishment lead time is your wheel length. You‟re at risk because you can‟t produce to respond to the market during this “Period of Risk”.
Cycle
Invento
ry L
evel
31
B
A
C
D
A B
B C
D A D
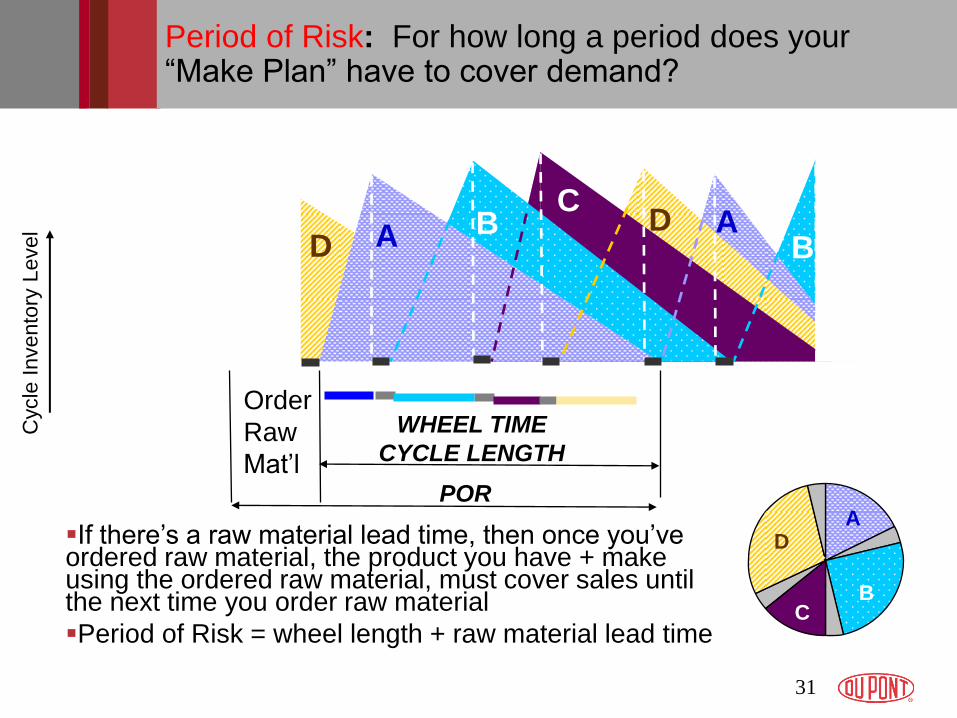
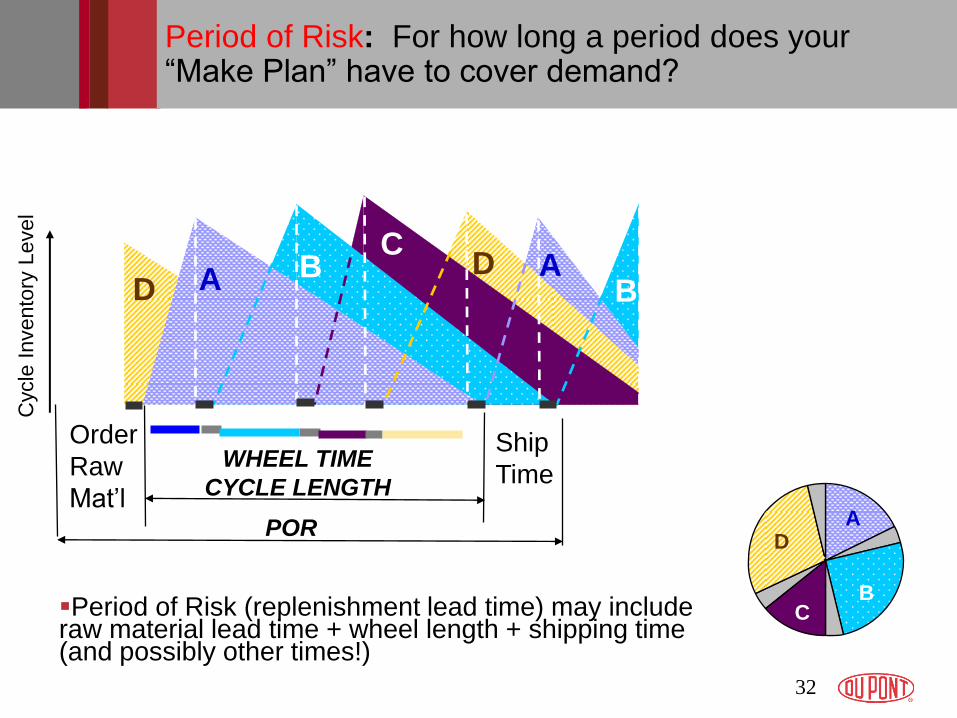
Period of Risk: For how long a period does your “Make Plan” have to cover demand?
If there‟s a raw material lead time, then once you‟ve ordered raw material, the product you have + make using the ordered raw material, must cover sales until the next time you order raw material
Period of Risk = wheel length + raw material lead time
WHEEL TIME
CYCLE LENGTH
Order
Raw
Mat‟l POR
Cycle
Invento
ry L
evel
32
B
A
C
D
A B
B C
D A D
Period of Risk: For how long a period does your “Make Plan” have to cover demand?
Cycle
Invento
ry L
evel
Period of Risk (replenishment lead time) may include raw material lead time + wheel length + shipping time (and possibly other times!)
WHEEL TIME
CYCLE LENGTH
Order
Raw
Mat‟l POR
Ship
Time
33
B
A
C
D
A B
B C
D A D
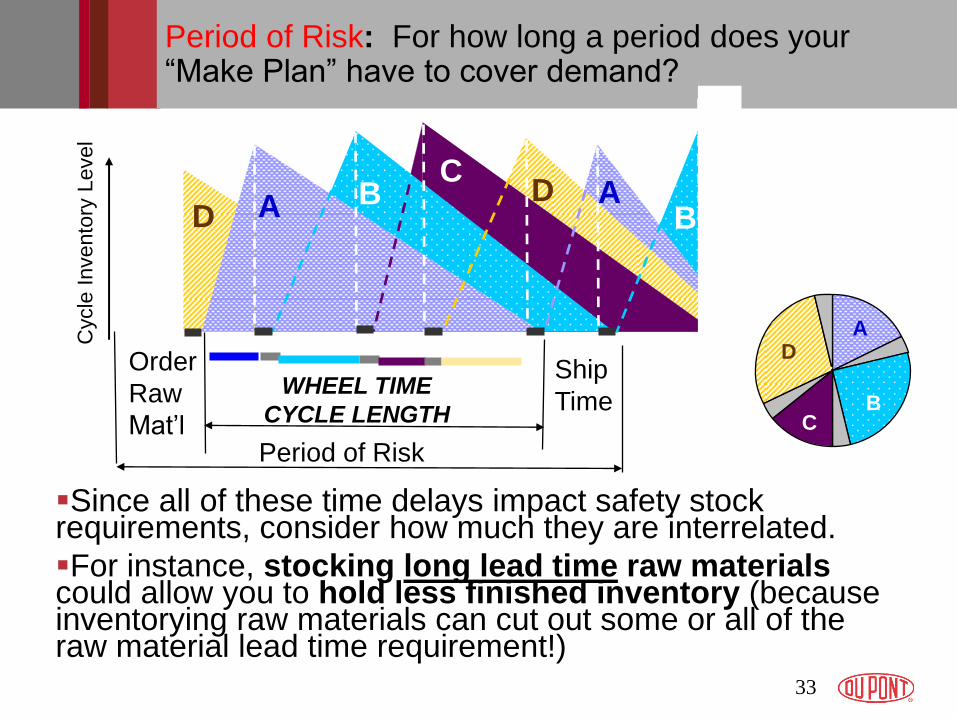
Period of Risk: For how long a period does your “Make Plan” have to cover demand?
Cycle
Invento
ry L
evel
Since all of these time delays impact safety stock requirements, consider how much they are interrelated.
For instance, stocking long lead time raw materials could allow you to hold less finished inventory (because inventorying raw materials can cut out some or all of the raw material lead time requirement!)
WHEEL TIME
CYCLE LENGTH
Order
Raw
Mat‟l
Ship
Time
Period of Risk
Inventory in Supply Chain Networks
The previous slides have concentrated on safety stock held at one location for demand placed on that location.
In our modern interconnected world, life is frequently more complicated! Many times we need to consider supply networks.
The mathematics can get considerably more complicated!
34
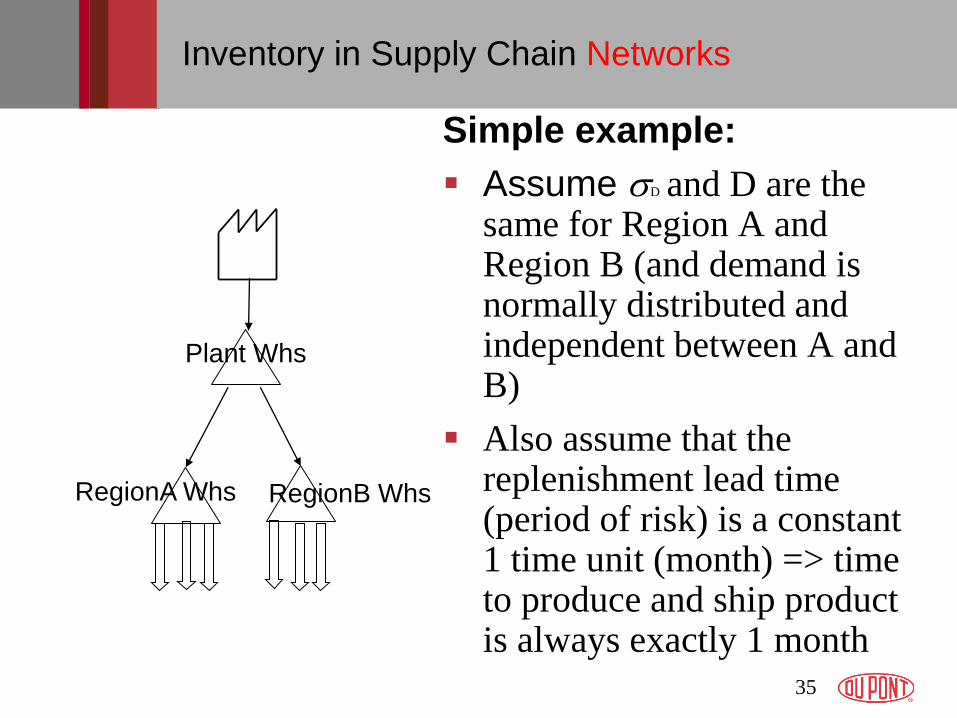
Simple example:
Assume sD and D are the same for Region A and Region B (and demand is normally distributed and independent between A and B)
Also assume that the replenishment lead time (period of risk) is a constant 1 time unit (month) => time to produce and ship product is always exactly 1 month
35
Inventory in Supply Chain Networks
Plant Whs
RegionA Whs RegionB Whs
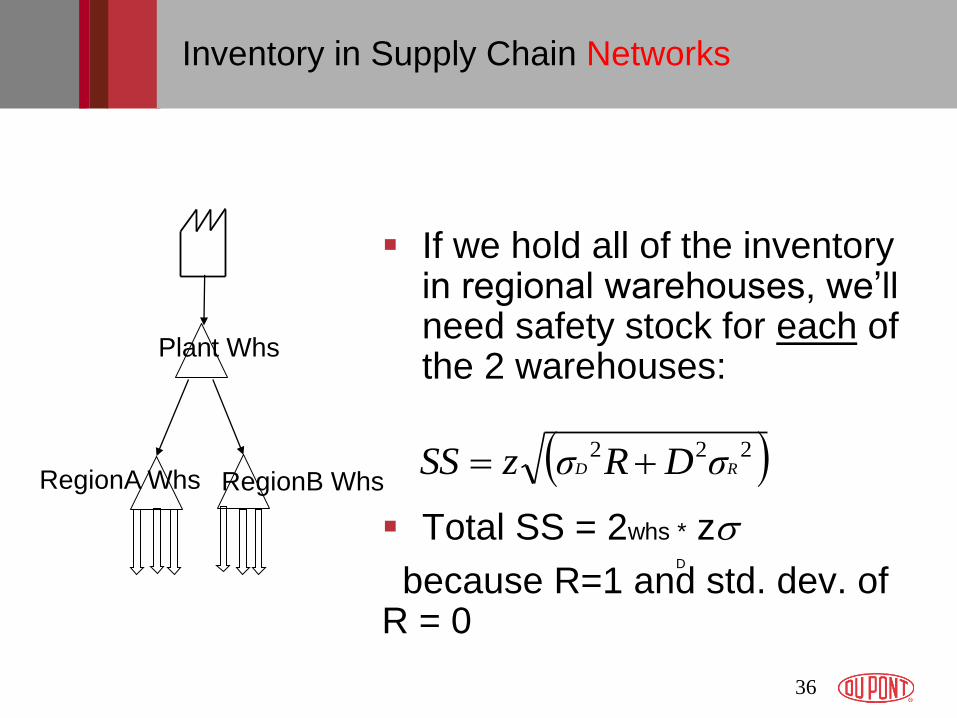
If we hold all of the inventory in regional warehouses, we‟ll need safety stock for each of the 2 warehouses:
Total SS = 2whs * zs
because R=1 and std. dev. of R = 0
36
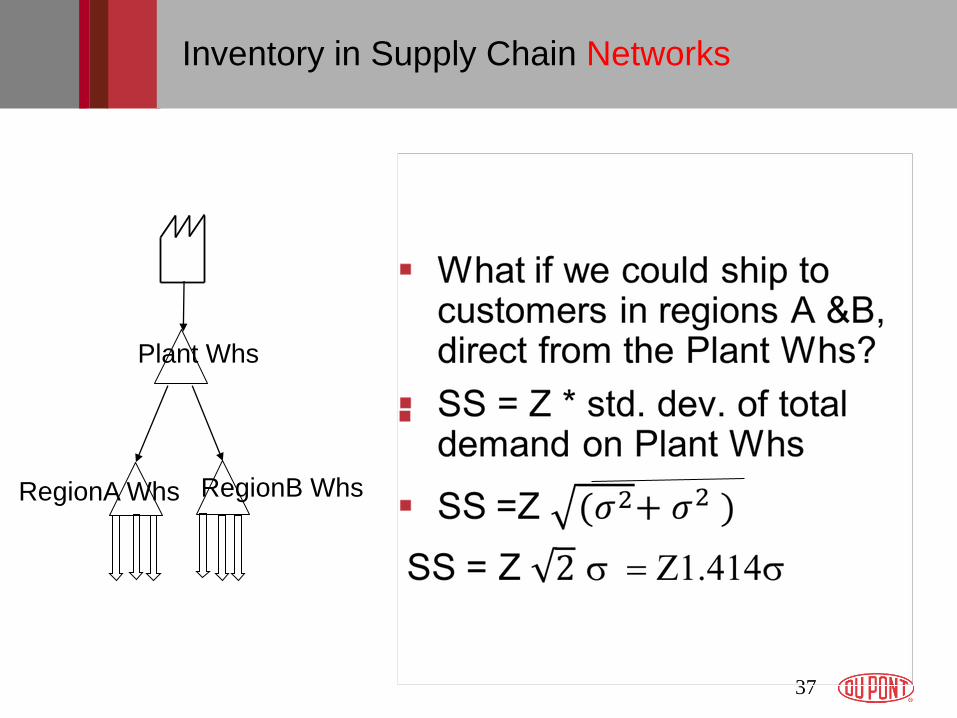
Inventory in Supply Chain Networks
RegionA Whs
Plant Whs
RegionB Whs
D
222RD σDRσzSS +=
37
Inventory in Supply Chain Networks
Plant Whs
RegionB Whs RegionA Whs
38
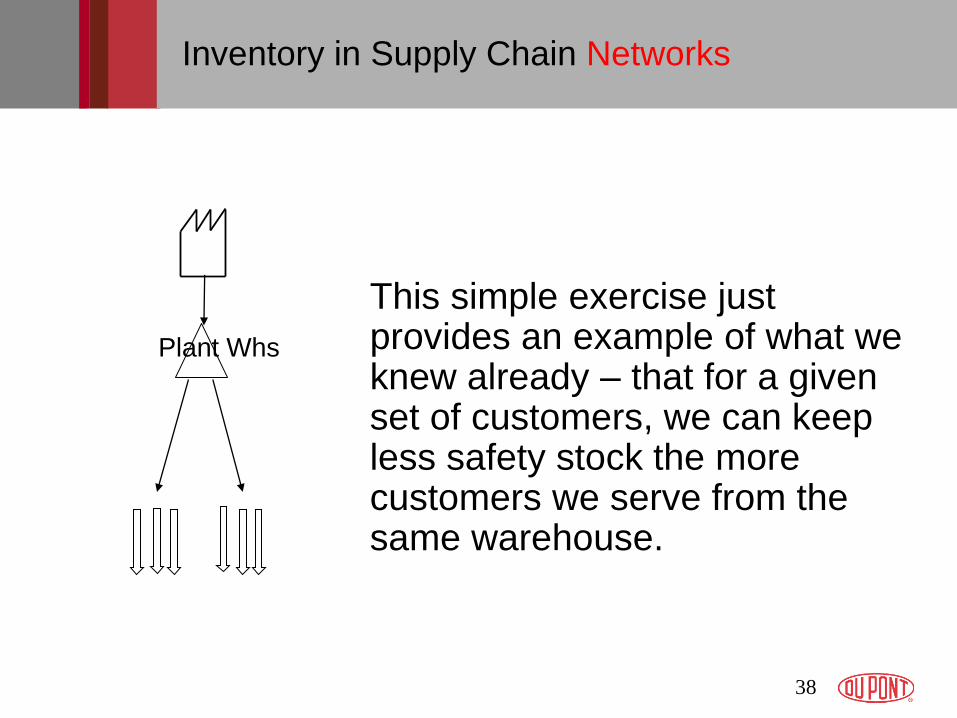
Inventory in Supply Chain Networks
Plant Whs
This simple exercise just provides an example of what we knew already – that for a given set of customers, we can keep less safety stock the more customers we serve from the same warehouse.

39
Inventory in Supply Chain Networks
However, there are lots of reasons why we need regional warehouses:
Delivery times from the plant warehouse exceed competitive order lead times
Customers want local sourcing
Delivery times are too variable to satisfy customer service requirements
Cheaper to bulk ship to a region and break apart shipments for individual shipments to customers
RegionA Whs
Plant Whs
RegionB Whs

The analysis gets much more complex very quickly when we look at questions like:
How many regional warehouses – and where
How much to keep in each warehouse
Consider trans-shipping between certain warehouses for certain customers . . .
40
Inventory in Supply Chain Networks
Plant Whs
RegionA Whs RegionB Whs
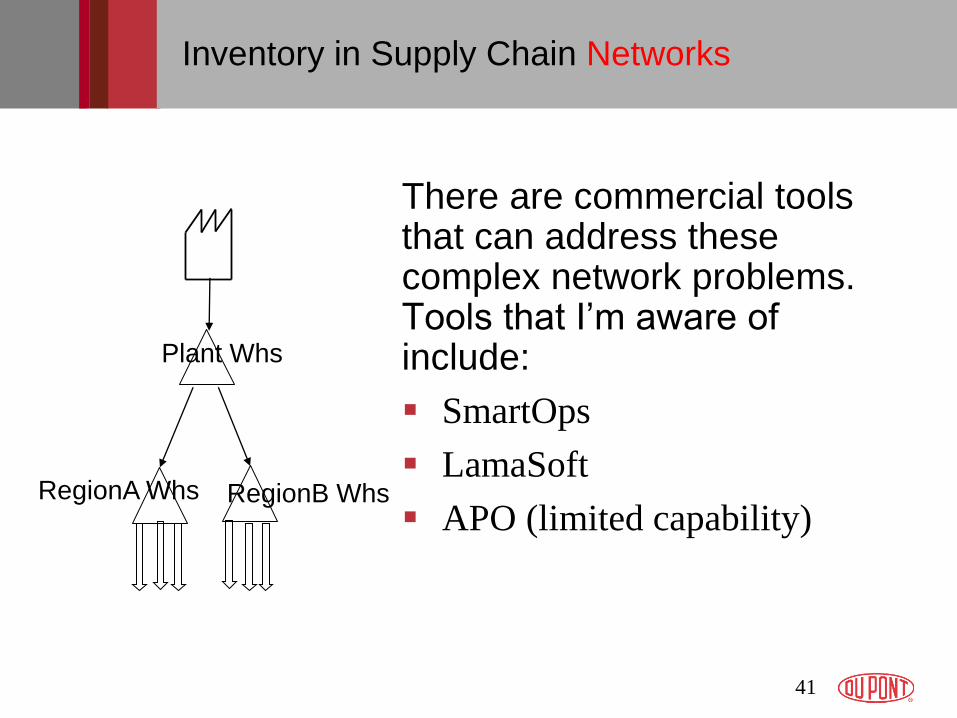
There are commercial tools that can address these complex network problems. Tools that I‟m aware of include:
SmartOps
LamaSoft
APO (limited capability)
41
Inventory in Supply Chain Networks
Plant Whs
RegionA Whs RegionB Whs
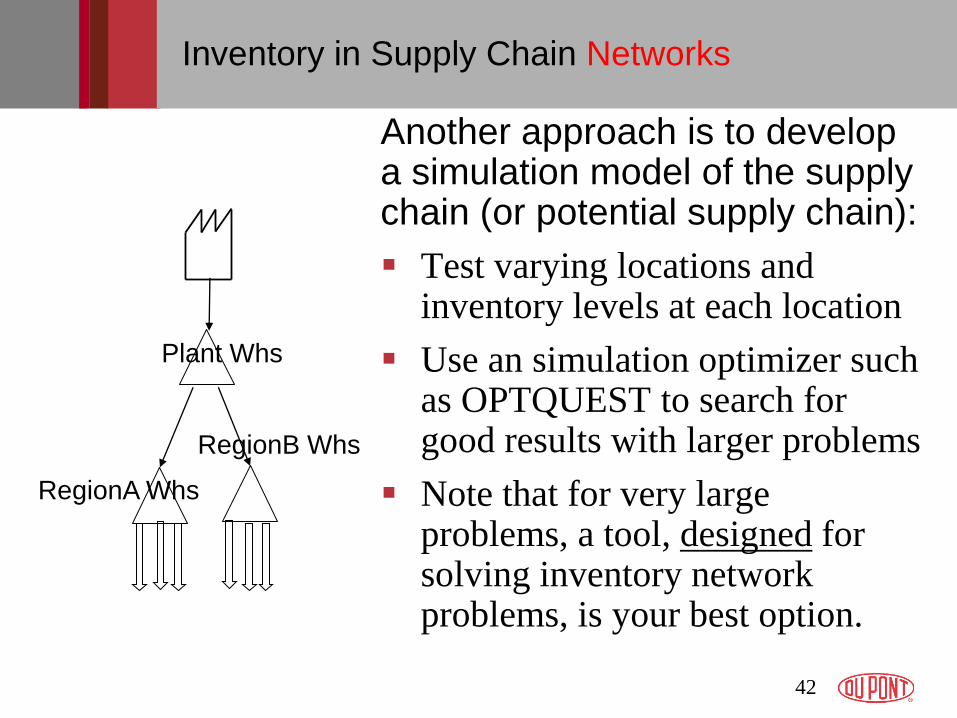
Another approach is to develop a simulation model of the supply chain (or potential supply chain):
Test varying locations and inventory levels at each location
Use an simulation optimizer such as OPTQUEST to search for good results with larger problems
Note that for very large problems, a tool, designed for solving inventory network problems, is your best option.
42
Inventory in Supply Chain Networks
Plant Whs
RegionA Whs
RegionB Whs
43
Questions?
Comments?