“inventory management, cost of capital and firm
TRANSCRIPT

“Inventory management, cost of capital and firm performance: evidence frommanufacturing firms in Jordan”
AUTHORSAshraf Mohammad Salem Alrjoub
Muhannad Akram Ahmad
ARTICLE INFO
Ashraf Mohammad Salem Alrjoub and Muhannad Akram Ahmad (2017).
Inventory management, cost of capital and firm performance: evidence from
manufacturing firms in Jordan. Investment Management and Financial
Innovations, 14(3), 4-14. doi:10.21511/imfi.14(3).2017.01
DOI http://dx.doi.org/10.21511/imfi.14(3).2017.01
RELEASED ON Wednesday, 04 October 2017
RECEIVED ON Tuesday, 11 July 2017
ACCEPTED ON Tuesday, 12 September 2017
LICENSE
This work is licensed under a Creative Commons Attribution-NonCommercial 4.0
International License
JOURNAL "Investment Management and Financial Innovations"
ISSN PRINT 1810-4967
ISSN ONLINE 1812-9358
PUBLISHER LLC “Consulting Publishing Company “Business Perspectives”
FOUNDER LLC “Consulting Publishing Company “Business Perspectives”
NUMBER OF REFERENCES
60
NUMBER OF FIGURES
0
NUMBER OF TABLES
6
© The author(s) 2021. This publication is an open access article.
businessperspectives.org

4
Investment Management and Financial Innovations, Volume 14, Issue 3, 2017
Abstract
Several studies have examined the relationship between inventory management and firm performance. However, most of these studies ignore the impact of inven-tory types on the relationship. Moreover, the relationship is influenced by some factors such as cost of capital which has not been considered. This study exam-ines the moderating effect of cost of capital on the relationship between inven-tory types and firm performance. The data of 48 firms for the period 2010–2016 which formed 279 firm-year observations were used in this study. With the use of Pearson correlation and panel Generalized Method of Moments (GMM) estima-tion, the findings show that inventory management with consideration of its types influence firm performance in the long term. In addition, it is also found that cost of capital moderates the relationship between inventory management and firm performance. However, the interaction between cost of capital and inventory types has different implications. It is suggested that firms should consider cost of capital when making decision on inventory types and align their inventory control to fit in to the changes in their business environment.
Ashraf Mohammad Salem Alrjoub (Jordan), Muhannad Akram Ahmad (Jordan)
BUSINESS PERSPECTIVES
LLC “СPС “Business Perspectives” Hryhorii Skovoroda lane, 10, Sumy, 40022, Ukraine
www.businessperspectives.org
Inventory management,
cost of capital and firm
performance:
evidence from
manufacturing firms in
Jordan
Received on: 11th of July, 2017Accepted on: 12th of September, 2017
INTRODUCTION
The importance of managing inventories cannot be underestimated, especially for merchandizing and manufacturing firms, since it is the most difficult asset they must manage (Kolias et al., 2011), and has a significant influence on supply chain and firm performance (Jeremy F. Shapiro & Wagner, 2009). Due to its influence as driver of perfor-mance, different initiatives have been taken by firms to improve its efficiency and effectiveness (Eroglu & Hofer, 2011a), which include im-plementing initiatives on supply chain collaboration such as quick re-sponse and vendor-managed inventory (Waller et al., 1999), adopting just-in-time inventory management practice (Schwarz & Weng, 2000), employing postponement approaches (Garcia-Dastugue & Lambert, 2007), and applying supply chain software (Blankley et al., 2008).
© Ashraf Mohammad Salem Alrjoub, Muhannad Akram Ahmad, 2017
Ashraf Mohammad Salem Alrjoub, Dr., Al-Balqa Applied University, Jordan.
Muhannad Akram Ahmad, Dr., Al-Bayat University, Jordan.
This is an Open Access article, distributed under the terms of the Creative Commons Attribution-Non-Commercial 4.0 International license, which permits re-use, distribution, and reproduction, provided the materials aren’t used for commercial purposes and the original work is properly cited.
inventory, firm value, raw materials, finished goods, work-in-process, cost of capital
Keywords
JEL Classification G3, G31, G32

5
Investment Management and Financial Innovations, Volume 14, Issue 3, 2017
In addition, as inventory management encompasses financing, purchasing and selling policies, their implementation involves contradictory functional objectives (Kolias et al., 2011). An instance is where the effort of the financial manager to minimize the level of inventory contradicts the ef-fort of the marketing manager to minimize the possibility of inventory shortage. Therefore, inven-tory management entails the specification, retention and control of desired inventory level, on the one hand, and minimization of the total inventory cost, on the other hand. This means that the issue of inventory management lies on optimizing between understocking and overstocking cost. Inventory shortage indicates unfavorable demand and reduction in sales, while excessive invento-ries could result in cost of spoilage, breakage, obsolescence and deterioration, items storage, taxes and insurance, as well as the opportunity cost of investing in alternative capital (Kolias et al., 2011).
Moreover, empirical studies (Capkun et al., 2009; Canon, 2008; Eroglu & Hofer, 2011a, 2011b; Koumanakos, 2008; Sekeroglu & Altan, 2014) have shown evidence of a positive inf luence of an ef-fective inventory management on firm performance. However, while most of these studies focused on effect of total inventories on firm performance, only very few (Capkun et al., 2009; Eroglu & Hofer, 2011a) considered the effect of inventory types on firm performance. Inventory types, which include raw material inventories (RMI), work-in-processing inventories (WIPI), and fin-ished goods inventories (FGI) have different impact on firm performance. For instance, the unit value of RMI is lower than that of FGI, and there is uncertainty in the demand for FGI than that of RMI (Stock & Lambert, 2001). Thus, these significant differences among the inventory types result in their differential inf luences on performance of the firms (Capkun et al., 2009; Eroglu & Hofer, 2011a).
Since inventory management is a part of managing firm’s liquidity problems, firms that are faced with liquidity constraints could have problems raising external finance (Kim et al., 1998). Due to this, their cost of capital turns out to be a vital issue. They must manage their assets by not worry-ing on the cost of financing its investments, or else, it may affect their firm performance. The as-sumption of pecking order theory of financing costs is that firms depend on internal financing and then if liquidity issue occurs, they seek external financing through equity issues and bond issues. As firm can seek capital from many financial markets, there is a need to benchmark corporate use of capital, and cost of capital is one of the ways to benchmark it (Bruner et al., 1998). Firms need to earn above this benchmark to create value for their investors. A typical method of assessing this cost of capital is using weighted average of the individual sources of capital (equity, debt and oth-ers). It cannot be denied that the trade-off theory that relates risks with returns makes financial managers contemplate whether distress costs related with high level of leverage could play a signifi-cant role when determining the form of required capital for the company.
The long-term performance of the firm which is in terms of growth and survival relies on the funds availability from the providers of capital (Ram, 2008). If the funds are used for running the busi-nesses, focus must be specifically on managing its current liabilities. If the funds are expensive because of high individual components of cost of capital or managing it becomes difficult due to erratic supply or scarcity of funds, levels of distress would hugely occur when there is lower level of costs or when there is huge availability of funds. Therefore, the aim of this study is to examine the moderating effect of cost of capital in the relationship between inventory management and firm performance. This is to investigate whether there is causal effect on the relationship between inven-tory management and firm performance with the consideration of cost of capital as a moderator.
The remainder of this paper firstly focused on the literature review and the development of the hypoth-eses, then, it presents the research methodology which include the statistical model and testing proce-dures. The report of the empirical results is given with discussions on the findings. Finally, conclusion was made with provision of implications, limitations and suggestions for future studies.

6
Investment Management and Financial Innovations, Volume 14, Issue 3, 2017
1. LITERATURE REVIEW
AND HYPOTHESES
DEVELOPMENT
1.1. Inventory management
and firm performance
As it has been stated earlier, only few empirical studies examine the effect of inventory types on firm performance and all have been carried out in developed economy (Capkun et al., 2009; Eroglu & Hofer, 2011a). These empirical studies show a depth perception into the causes and implications of RMI, WIPI, and FGI since they depend on firm-level data to ascertain the relationship between in-ventory management and firm performance. This perception is in contrast with other studies that view inventory management through optimiza-tion models to achieve optimal inventory deci-sions (Chopra & Meindl, 2004; Miller & de Matta, 2008; Shapiro, 2007; Shapiro & Wagner, 2009) or as a monolithic entity by estimating its underlying cost structure and testing its theoretical models (Chikán, 1996; Holly & Turner, 2001; Humphreys et al., 2001; Sensier, 2003; Tsoukalas, 2011).
Lieberman et al. (1999) examine what determines RMI, WIPI, and FGI of firms in the automobile in-dustry and the findings indicate that different fac-tors determined each type of inventory. Some of these determinants as identified by different stud-ies include supply chain management (Dehning et al., 2007), process choice (Safizadeh & Ritzman, 1997), and just-in-time inventory techniques (Cachon & Olivares, 2010; Claycomb et al., 1999). In addition, several studies (Cannon, 2008; Chen et al., 2005; Kolias et al., 2011; Koumanakos, 2008; Swamidass, 2007; Vastag & Whybark, 2005) have examined the implications of different inventory management practices, behavior or techniques on firm performance. Though, only a very few studies clearly differentiate among the inventory types (i.e., RMI, WIPI and FGI). Bernard and Noel (1991) ex-amine whether inventory disclosure predict sales and earnings by splitting inventories into RMI, WIPI and FGI. They found different significant re-sults among the inventory types. This is an indica-tion that RMI, WIPI and FGI are different system-atically based on their determinants and influence on operational and financial performance.
Chen et al. (2005) examine the inventories of listed American manufacturing firms between 1981 and 2000, and found that RMI and WIPI decline each year during these periods, but FGI did not decline. Capkun et al. (2009) examine the relationship be-tween inventory and performance of US-based manufacturing firms for the period 1980 to 2005 with 52,254 firm-year observations. Their findings indicate that total inventories, RMI, WIPI and FGI significantly influenced performance of firms in the manufacturing industries. Though, their in-fluence varies but RMI have the most vital influ-ence on firm performance proxied by profit mar-gins and earnings before interest and tax.
The study of Eroglu and Hofer (2011a) explicitly ex-amines inventory types and firm performance, us-ing data of 885 firms from 27 US manufacturing industries, for the period 2003 to 2008 and result-ed in 4121 firm-year observations. With the use of vector autoregressive and vector error correction models, their findings indicate that the level of in-ventory and firm performance relationship differs across the industries based on the inventory types. They also found that RMI have the most vital in-fluence on firm performance compared with WIPI and FGI. In addition, the intertemporal interactions that exist among the types of inventory showed that RMI and FGI asymmetrically influence each other over the periods. They conclude that each inventory types may have both direct and indirect influence on firm financial performance. This means that the influence of a certain inventory type on firm perfor-mance can be mediated by any other inventory type.
All these studies have been carried out in developed economy where there is an innovative system of trading. This is not the case in developing economies where there is a high level of capital market imper-fection (i.e., agency costs and informational asym-metries), unavailability of internal finance, high fi-nancing costs, or inaccessibility to capital markets (Baños-Caballero et al., 2014; Baños-Caballero et al., 2010; Fazzari et al., 1988; Greenwald et al., 1984; Jensen & Meckling, 1976; Myers & Majluf, 1984). All these factors are indications that the effect of inventory management on firm performance in a developing economy may be different from the re-sults from developed economies. Therefore, there is a need to examine the relationship between inven-tory management and firm performance with the
7
Investment Management and Financial Innovations, Volume 14, Issue 3, 2017
consideration of inventory types in a developing economy. Based on all the arguments, this study hypothesized that inventory types have relation-ship with firm performance as follows:
H1a: Firm’s total inventory is positively related with firm performance.
H2a: Firm’s RMI is positively related with firm performance.
H3a: Firm’s WIPI is positively related with firm performance.
H4a: Firm’s FGI is positively related with firm performance.
1.2. Inventory management, cost
of capital and firm performance
One of the factors identified to affect firm perfor-mance in developing economy is high financing costs. Firms need to finance and invest in their as-sets such as inventories over the time to improve their performance, but they need to consider the cost of raising capital before making any decision on financing or investing in any assets. On the other hand, based on finance theory, firm value must be perceived through its expected cash flows and to achieve these cash flows, there is a need for the firm to raise capital. However, costs are at-tached if capital is raised through shareholders, bondholders and through other securities.
From the perspective of a firm, cost of capital is a cornerstone to attract a shareholder to a firm
(Kitagawa & Gotoh, 2011). From the perspective of an investor, cost of capital is the minimum return an investor is expected to get for providing the capital. This is in line with the general belief that maximizing shareholder wealth is the goal of a firm. Cost of capital is used as a yardstick by some firms to affirm that their objectives and goals have been met, and according to Giddy (1981), a firm needs to attain funds at the lowest cost in order to be successful.
In other words, for a firm to improve its firm value and achieve a viable financial soundness, one of the vital things to put into consideration is that cost of capital must be lower than the cash flows generat-ed through firm’s operations. Thus, it is imperative to identify cost of capital as a vital variable that in-fluences firm performance. Furthermore, the as-sumption of contingency theory is that firms do not apply a system all the time (Islam & Hu, 2012; Scott & Cole, 2000). Their processes and struc-tures are shaped based on the environment they operate in (Flynn, Huo, & Zhao, 2010). Therefore, firms must align their structures and systems to fit with their environmental contingencies in or-der to improve firm performance (De Ven et al., 1985; Flynn et al., 2010; Milgrom & Roberts, 1988; Venkatraman & Prescott, 1990).
This study uses cost of capital as a moderating variable to examine the relationship between in-ventory types and firm performance. Also, this in-teraction between inventory management, cost of capital and their influence on firm performance provide the major theme of this study. Based on all these arguments, this study assumes the following hypotheses:
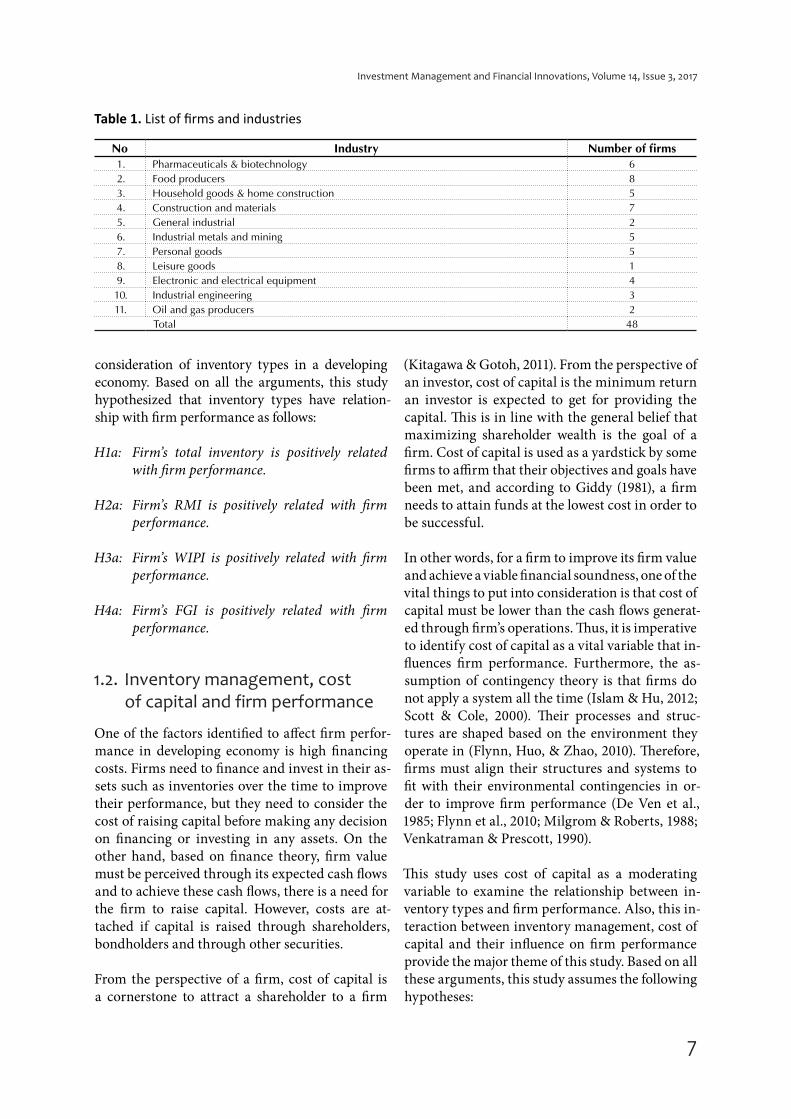
Table 1. List of firms and industries
No Industry Number of firms1. Pharmaceuticals & biotechnology 6
2. Food producers 8
3. Household goods & home construction 5
4. Construction and materials 7
5. General industrial 2
6. Industrial metals and mining 5
7. Personal goods 5
8. Leisure goods 1
9. Electronic and electrical equipment 4
10. Industrial engineering 3
11. Oil and gas producers 2
Total 48

8
Investment Management and Financial Innovations, Volume 14, Issue 3, 2017
H1b: The relationship between total inventory and firm performance is moderated by cost of capital.
H2b: The relationship between RMI and firm per-formance is moderated by cost of capital.
H3b: The relationship between WIPI and firm per-formance is moderated by cost of capital.
H4b: The relationship between FGI and firm per-formance is moderated by cost of capital.
2. DATA ENVIRONMENT AND
VARIABLE DESCRIPTION
2.1. Data environment
The population of this study is the manufactur-ing firms in Jordan. The basis for chosen manu-facturing industry is due to the rapid changing in the manufacturing environment. Moreover, be-side the government service sector, manufactur-ing sector is the second to contribute mostly to the GDP of Jordan. The data of 48 manufacturing firms listed on the Amman Stock Exchange for the period 2010–2016 were applied for this study. Due to some missing data after sorting, 279 firm-year observations were finally applied. The number of
firms and their industry used in this study is de-picted in Table 1 above:
2.2. Variables measurement
The dependent variable of this study is firm per-formance and it is proxied by firm value. The use of firm value as a proxy for firm performance is to measure firm performance in the long term. Most studies use profitability as a measure of firm performance or firm value. However, according to Samiloglu and Demirgunes (2008), profitabil-ity serves as a short-term measure of firm perfor-mance, and its role as a measure of firm soundness is skeptical partially because of its manipulability. A long-term measure of firm performance is firm value. The control of inventory which is part of firm working capital allows firms to adapt easily to variation in economic environments and im-prove its economic added value (Havoutis, 2003). Efficient inventory management helps in increas-ing free cash flows used in valuing firm, therefore it maximizes firm value (Berk et al., 2009).
Therefore, firm value is measured as enterprise value divided by Earnings before interest, tax-es, depreciation and amortization (EV/EBITDA). Enterprise value is measured as Equity Value + Total Debt – Cash & Cash Equivalents + Preferred Stock + Minority Interest. The independent vari-ables are Total Inventory, RMI, WIPI and FGI.
Table 2. Variables measurement
No Variables Connotation Measurement Sources
1. Firm Performance FV(Equity Value + Total Debt– Cash & Cash Equivalents + Preferred Stock + Minority Interest)/EBITDA
Bhullar and Bhatnagar (2013), Lifland (2011)
2. Total Inventory INV Average of total inventory for the year divided by total sales for the year
Capkun et al. (2009), Eroglu and Hofer (2011a)
3. Raw Material Inventories RMI Average of RMI for the year divided by total
sales for the yearCapkun et al. (2009), Eroglu and Hofer (2011a)
4. Working-in-Process Inventories WIPI Average of WIPI for the year divided by total
sales for the yearCapkun et al. (2009), Eroglu and Hofer (2011a)
5. Finished Goods Inventories FGI Average of FGI for the year divided by total
sales for the yearCapkun et al. (2009), Eroglu and Hofer (2011a)
6. Cost of Capital WACCWeighted Average cost of capital = After tax weighted cost of debt + Weighted cost of equity
Estrada (2000),Nenkov (2012)
7. Firm Size SIZE Natural logarithm of sales Inmyxai and Takahashi (2010), Yang and Chen (2009)
8. Financial Leverage LEV Total debt divided by total capital Akintoye (2008), Dhaliwal et al. (2006)
9. Beta Coefficient β Constant term
10. Error term ε Error term
9
Investment Management and Financial Innovations, Volume 14, Issue 3, 2017
Meanwhile, the moderating variable is Cost of Capital and control variables include Firm Size and Financial Leverage. Table 2 below depicts the measurement of the variables of this study.
The hypotheses were estimated with the following models:
1 2
3 4 5
6,
it o it it
it it it
it it
FV INV RMI
WIPI FGI SIZE
LEV
β β ββ β ββ ε
= + ⋅ + ⋅ +
+ ⋅ + ⋅ + ⋅ +
+ ⋅ +
(1)
8
1 2
3 4 5
6 7
9
10.
it o it it
it it it
it it
it it
it it
FV INV RMI
WIPI FGI SIZE
LEV WACC INV
WACC RMI WACC WIPI
WACC FGI
β β ββ β ββ ββ ββ ε
= + ⋅ ⋅
⋅ ⋅ ⋅
⋅ ⋅
+ +
+ + + +
+ + ⋅
⋅ + ⋅ +
+ ⋅ +
+
+ ⋅ ⋅
⋅
(2)
Equation (1) indicates a direct relationship be-tween inventory types and firm performance to test hypotheses H1a to H4a, while the equation (2) indicates the relationship between inventory types and firm performance with the introduction of the interactive term (i.e., moderating variables) to test hypotheses H1b to H4b. Therefore, to exam-ine the assumed models, Pearson correlation and panel Generalized Method of Moments (GMM) was applied.
3. ANALYSIS AND FINDINGS
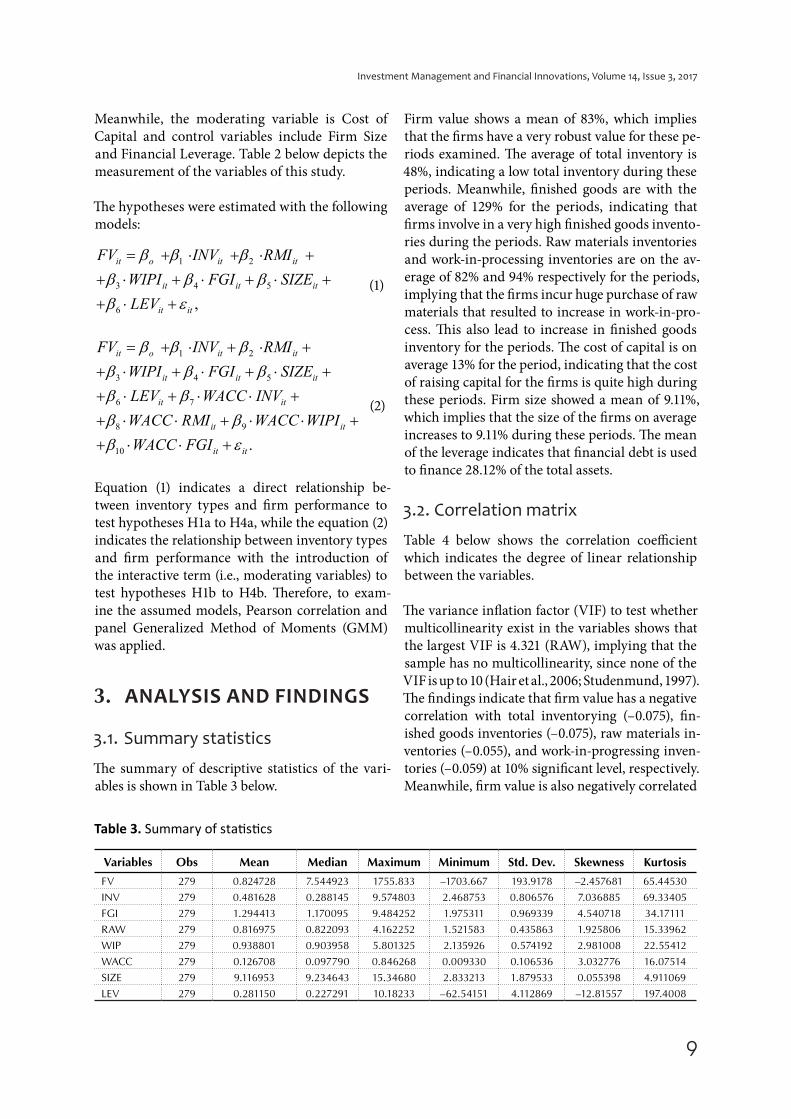
3.1. Summary statistics
The summary of descriptive statistics of the vari-ables is shown in Table 3 below.
Firm value shows a mean of 83%, which implies that the firms have a very robust value for these pe-riods examined. The average of total inventory is 48%, indicating a low total inventory during these periods. Meanwhile, finished goods are with the average of 129% for the periods, indicating that firms involve in a very high finished goods invento-ries during the periods. Raw materials inventories and work-in-processing inventories are on the av-erage of 82% and 94% respectively for the periods, implying that the firms incur huge purchase of raw materials that resulted to increase in work-in-pro-cess. This also lead to increase in finished goods inventory for the periods. The cost of capital is on average 13% for the period, indicating that the cost of raising capital for the firms is quite high during these periods. Firm size showed a mean of 9.11%, which implies that the size of the firms on average increases to 9.11% during these periods. The mean of the leverage indicates that financial debt is used to finance 28.12% of the total assets.
3.2. Correlation matrix
Table 4 below shows the correlation coefficient which indicates the degree of linear relationship between the variables.
The variance inflation factor (VIF) to test whether multicollinearity exist in the variables shows that the largest VIF is 4.321 (RAW), implying that the sample has no multicollinearity, since none of the VIF is up to 10 (Hair et al., 2006; Studenmund, 1997). The findings indicate that firm value has a negative correlation with total inventorying (–0.075), fin-ished goods inventories (–0.075), raw materials in-ventories (–0.055), and work-in-progressing inven-tories (–0.059) at 10% significant level, respectively. Meanwhile, firm value is also negatively correlated
Table 3. Summary of statistics
Variables Obs Mean Median Maximum Minimum Std. Dev. Skewness Kurtosis
FV 279 0.824728 7.544923 1755.833 –1703.667 193.9178 –2.457681 65.44530
INV 279 0.481628 0.288145 9.574803 2.468753 0.806576 7.036885 69.33405
FGI 279 1.294413 1.170095 9.484252 1.975311 0.969339 4.540718 34.17111
RAW 279 0.816975 0.822093 4.162252 1.521583 0.435863 1.925806 15.33962
WIP 279 0.938801 0.903958 5.801325 2.135926 0.574192 2.981008 22.55412
WACC 279 0.126708 0.097790 0.846268 0.009330 0.106536 3.032776 16.07514
SIZE 279 9.116953 9.234643 15.34680 2.833213 1.879533 0.055398 4.911069
LEV 279 0.281150 0.227291 10.18233 –62.54151 4.112869 –12.81557 197.4008

10
Investment Management and Financial Innovations, Volume 14, Issue 3, 2017
with cost of capital (–0.020) and firm size (–0.016) at 5% significant level, respectively. However, firm value and financial leverage are positively correlat-ed at 1% significant level.
3.3. Regression analysis using GMM
estimation
Table 5 depicts the regression analysis using GMM estimation. The R-squared is 18.25% (0.182512), which indicates that the independent variables only explained 18.25% variations in firm value. Total inventory shows insignificant relationship with firm value (at b = 0.020, p > 0.827), which in-dicates that total inventory of the firms does not directly influence their firm value. Finished goods inventories and firm value have a positive signifi-cant relationship (at b = 0.374, p < 0.01). This in-dicates that finished goods inventories positively influence firm value. Raw materials inventories
and firm value are positively related (at b = 2.356, p < 0.01, which implies that raw material invento-ries have positive influence on firm value. Work-in-processing inventories and firm value are posi-tively related (at b = 2.141, p < 0.01), which implies that work-processing has a positive influence on firm value. Financial leverage is negatively related with firm value (at b = –0.169, p < 0.01), while firm size is not significant with firm value.
Table 6 above shows the inclusion of cost of capi-tal as the moderating variable between inventory management and firm value. The R-squared depicts 43%, indicating that with the moderating effect of cost of capital, the independent variables explained 43% fluctuations in firm value during the periods examined. Total inventory has a positive signifi-cant relationship with firm value with the inclu-sion of cost of capital (at b = –0.338, p < 0.01). This is an indication that cost of capital moderates the
Table 4. Correlation matrix
Variables FV INV FIG RAW WIP WACC LEV SIZE
FV 1.000
INV –0.075* 1.000
FGI –0.087* 0.891 1.000
RAW –0.055* 0.176 0.600 1.000
WIP –0.059* 0.239 0.632 0.957 1.000
WACC –0.020** 0.016** 0.064* 0.109 0.151 1.000
LEV 0.000*** 0.014** 0.009*** –0.006*** –0.025** 0.016** 1.000
SIZE –0.016** –0.253 –0.237 –0.066* –0.190 –0.106 0.063* 1.000
Note: significance levels are at 1% (***), 5% (**) and 10% (*).
Table 5. Inventory types and firm value
Variable Coefficient Std. Error t-statistic Prob.
C 2.261 0.887 2.548 0.011
INV 0.020 0.090 0.219 0.827
FGI 0.374 0.146 2.569 0.011**
RMI 2.356 0.734 3.208 0.002***
WIPI 2.141 0.561 3.814 0.000***
LEV –0.169 0.042 –3.990 0.000***
SIZE –0.216 0.407 –0.531 0.595
R-squared 0.182512 Mean dependent var 1.844483
Adjusted R-squared 0.164412 S.D. dependent var 1.393054
S.E. of regression 1.273397 Sum squared resid 439.4375
Durbin-Watson stat 1.395096 J-statistic 271.0000
Instrument rank 8 Prob (J-statistic) 0.000000
Note: Significance levels are at 1% (***), 5% (**) and 10% (*).

11
Investment Management and Financial Innovations, Volume 14, Issue 3, 2017
relationship between total inventory and firm val-ue at 1% significant level. Cost of capital positively moderates the relationship between finished goods inventories and firm value (at b = 1.946, p < 0.01). The relationship between work-in-processing in-ventories and firm value is negatively moderated by cost of capital (at b = –4.205, p < 0.01). However, the relationship between raw materials invento-ries and firm value, and firm size and firm value, respectively, are not moderated by cost of capital. Financial leverage and firm value are significant-ly and negatively moderated by cost of capital (at b = –0.121, p < 0.01). The interaction between total inventory and cost of capital is negatively signifi-cant (at b = –3.077, p < 0.01). Also, the interaction between finished goods inventories and firm val-ue is positively significant (at b = 15.850, p < 0.01). Moreover, work-in-processing and firm value have significant and positive interaction (at b = 16.912, p < 0.01). However, raw materials inventories and firm value have insignificant interaction.
4. DISCUSSION
In the regression of equation (1), which is used to test hypotheses H1a to H4a, total inventory has insig-nificant relationship with firm value which is used as a proxy for firm performance. The plausible rea-son can be traced to inefficient decision making on inventory management by firms which then affect
the impact of total inventory on firm performance. Therefore, based on the insignificant relationship, hypothesis H1a is rejected. The other inventory types (i.e., finished goods, work-in-processing, and raw materials inventories) have a significant and posi-tive relationship with firm performance. Therefore, hypotheses H2a to H4a are accepted. The plausible reason can be traced to the fact that each inventory types have different implications on firm perfor-mance, and effective decision on them can enhance firm performance. The result is consistent with past studies (Capkun et al., 2009; Eroglu & Hofer, 2011a).
Equation (2) is used to test the moderating effect of cost of capital on the relationship between inven-tory management and firm performance. The re-gression of the model using GMM shows that cost of capital moderates the relationship between inven-tory management and firm performance. This can be observed through the R-squared and the coeffi-cients of the variables that change drastically due to the inclusion of cost of capital as a moderating factor in the relationship. Furthermore, the direct relationship between total inventory and firm per-formance is insignificant in the first equation, but with the inclusion of cost of capital in the second equation the relationship became significant. This is an indication that cost of capital has a vital im-plication on both inventory management and firm performance. In addition, the cost of capital has in-fluence on all the inventory types except raw materi-
Table 6. Inventory types, cost of capital and firm value
Variable Coefficient Std. Error t-statistic Prob.
C 0.352 1.334 0.265 0.792
INV 0.338 0.118 –2.869 0.004***
FGI 1.946 0.390 4.984 0.000***
RAW 1.812 1.123 1.613 0.108
WIPI 4.205 0.997 –4.219 0.000***
LEV –0.121 0.047 –2.601 0.009***
SIZE 0.657 0.593 1.107 0.269
INV*WACC –3.077 0.662 4.651 0.000***
FIG*WACC 15.850 2.522 –6.284 0.000***
RAW*WACC –1.678 5.735 –0.292 0.770
WIPI*WACC –16.912 5.618 3.010 0.002***
R-squared 0.429979 Mean dependent var 1.844483
Adjusted R-squared 0.408630 S. D. dependent var 1.393054
S.E. of regression 1.071267 Sum squared resid 306.4125
Durbin-Watson stat 1.648592 J-statistic 27.59233
Instrument rank 12 Prob (J-statistic) 0.000000
Note: Significance levels are at 1% (***), 5% (**) and 10% (*).
12
Investment Management and Financial Innovations, Volume 14, Issue 3, 2017
als inventory. This means that the fluctuation in raw material inventories is not affected by the changes in cost of capital. However, the fluctuation in total inventory and work-in-processing inventories is af-fected by the changes in cost of capital due to their interaction. The higher the changes in cost of capital, the higher the negative effect on total inventory and
work-in processing inventories. Moreover, finished good inventories increase with any changes in cost of capital.
Based on the result of the regression, while hypothe-ses H1b, H3b and H4b are accepted, hypothesis H2b is rejected.
CONCLUSION
This study examines the impact of the moderating role of cost of capital on the relationship between in-ventory management and performance of manufacturing firms listed in Jordan. The uniqueness of the study is the consideration of the moderating effect of cost of capital, inventory types, and firm value as a proxy for firm performance in a developing economy such as Jordan. The data of 48 firms for the period 2010–2016 which formed 279 firm-year observations were used in this study. With the use of Pearson correlation and panel GMM estimation, the findings show that inventory management with consider-ation of its types influences firm performance in the long term. In addition, it is also found that cost of capital moderates the relationship between inventory management and firm performance. However, the interaction between cost of capital and inventory types have different implications.
The implications of this study are that firms need to put the effect of cost of capital before making decision on inventory control. Also, they need to align their inventory types to fit in to changes in their business environment. Managing inventory effectively must be a necessity for managers due to its influence on firm performance and the costs that could be incurred if it is not managed optimally. However, there are other factors that influence the inventory management and firm performance especially in developing economy due to financial constraints. Further study can consider these factors and their impact on the relationship.
REFERENCES
1. Akintoye, I. R. (2008). Sensitivity of Performance to Capital Structure: A Consideration for Selected Food and Beverages Companies in Nigeria. Retrieved from https://papers.ssrn.com/sol3/papers.cfm?abstract_id=2597160
2. Baños-caballero, S., García-teruel, P. J., & Martínez-solano, P. (2014). Working capital management, corporate performance, and financial constraints. Journal of Business Research, 67(3), 332-338. Retrieved from http://doi.org/10.1016/j.jbusres.2013.01.016
3. Baños-Caballero, S., Teruel, P. J. G., & Solano, P. M. (2010). How do market imperfections affect working capital management? IVE. Retrieved from http://www.ivie.es/downloads/docs/wpasec/wpasec-2009-14.pdf
4. Berk, J., DeMarzo, P., & Harford, J. (2009). Fundamentals of Corporate Finance. Pearson Education Inc.,
Boston, MA. Retrieved from https://www.pearson.com/us/higher-education/product/Berk-Funda-mentals-of-Corporate-Finance-3rd-Edition/9780133507676.html
5. Bernard, V., & Noel, J. (1991). Do Inventory Disclosures Predict Sales and Earnings? Journal of Accounting, Auditing & Finance, 6(2), 145-181. http://doi.org/10.1177/0148-558X9100600202
6. Bhullar, P. S., & Bhatnagar, D. (2013). Theoretical framework EV vs Stock price – A better measurement of firm value. Internation Journal of Commerce, Business and Management, 2(6), 335-343. Retrieved from http://www.iracst.org/ijcbm/papers/
vol2no62013/5vol2no6.pdf
7. Blankley, A. I., Khouja, M.,
& Wiggins, C. E. (2008). An
Investigation Into the Effect of Full-
Scale Supply Chain Management
Software Adoptions on Inventory Balances and Turns. Journal of Business Logistics, 29(1), 201. http://doi.org/10.1002/j.2158-1592.2008.tb00075.x
8. Bruner, R. F., Eades, K. M., Harris, R. S., & Higgins, R. C. (1998). Best Practices in Estimating the Cost of Capital: Survey and Synthesis. Financial Practice and Education, 8, 13-28. Retrieved from https://www3.nd.edu/~scorwin/fin70610/CostofCap_Bruner_FPE1998.pdf
9. Cachon, G. P., & Olivares, M. (2010). Drivers of Finished-Goods Inventory in the U.S. Automobile Industry. Management Science, 56(1), 202-216. http://doi.org/10.1287/mnsc.1090.1095
10. Cannon, A. R. (2008). Inventory improvement and financial performance. International Journal of Production Economics, 115(2), 581-593. http://doi.org/10.1016/j.ijpe.2008.07.006
13
Investment Management and Financial Innovations, Volume 14, Issue 3, 2017
11. Capkun, V., Hameri, A.-P., &
Weiss, L. A. (2009). On the
Relationship between Inventory
and Financial Performance in
Manufacturing Companies.
International Journal of Operations
& Production Management,
29(8), 789-808. http://doi.
org/10.1108/01443570910977698
12. Chen, H., Frank, M. Z., & Wu, O.
Q. (2005). What Actually Happened
to the Inventories of American
Companies Between 1981 and
2000? Management Science, 51(7),
1015-1031. http://doi.org/10.1287/
mnsc.1050.0368
13. Chikán, A. (1996). The volume
and structure of inventories.
International Journal of Production
Economics, 45, 1-7. https://doi.org/10.1016/0925-5273(96)00049-7
14. Chopra, S., & Meindl, P. (2004).
Supply Chain Management. Upper
Saddle River, NJ: Pearson Education.
Retrieved from http://mcacareers.
in/USER%20DOWNLOAD%20
OPTIONS/MCA%20Notes/sem-5/
SCM%20TEXTBOOK-SUNIL%20
CHOPRA.pdf
15. Claycomb, C., Droge, C., &
Germain, R. (1999). The effect
of Just-in-time with customers
on organizational design and
performance. The International
Journal of Logistics Management,
10(1), 37-58. http://doi.org/10.1108/
EL-01-2014-0022
16. De Ven, V., Andrew, H., & Drazin,
R. (1985). The Concept of Fit in
Contingency Theory. Chapter in B.
Staw and L. Cummings. Research in
Organizational Behavior, 7.
17. Dehning, B., Richardson, V., &
Zmud, R. (2007). The financial
performance effects of IT-based
supply chain management systems
in manufacturing firms. Journal
of Operations Management.
http://dx.doi.org/10.1016/j.
jom.2006.09.001
18. Dhaliwal, D., Heitzman, S., & Li,
O. Z. (2006). Taxes, leverage, and
the cost of equity capital. Journal of
Accounting Research, 44(4), 691-723.
http://doi.org/10.1111/j.1475-
679X.2006.00214.x
19. Eroglu, C., & Hofer, C. (2011a). Inventory types and firm performance: Vector autoregressive and vector error correction models. Journal of Business Logistics, 32(3), 227-239. http://doi.org/10.1111/j.2158-1592.2011.01019.x
20. Eroglu, C., & Hofer, C. (2011b). Lean, leaner, too lean? the inventory-performance link revisited. Journal of Operations Management, 29(4), 356-369. http://doi.org/10.1016/j.jom.2010.05.002
21. Estrada, J. (2000). The cost of equity in emerging markets: a downshide risk approach. Emerging Markets Quaterly, 1(4), 19-30. http://doi.org/10.1080/135184 7032000137429
22. Fazzari, S. M., Hubbard, R. G., & Petersen, C. B. (1988). Financing Constraints and Corporate Investment. Brookings Papers on Economic Activity, 1. https://doi.org/10.2307/2534426
23. Flynn, B. B., Huo, B., & Zhao, X. (2010). The impact of supply chain integration on performance: A contingency and configuration approach. Journal of Operations Management, 28(1), 58-71. http://doi.org/10.1016/j.jom.2009.06.001
24. Garcia-Dastugue, S. J., & Lambert, D. M. (2007). Interorganizational Time-based postponement in the supply chain. Journal of Business Logistics, 28(1), 57-80. https://doi.org/10.1002/j.2158-1592.2007.tb00232.x
25. Giddy, I. H. (1981). The Cost of Capital in the International firms. Managerial and Decision Economics, 2(4), 263-271. Retrieved from http://search.ebscohost.com/login.aspx?direct=true&db=bth&AN=4624635&site=ehost-live&scope=site
26. Greenwald, B., Stiglitz, J. E., & Weiss, A. (1984). Informational Imperfections in the Capital Market and Macroeconomic Fluctuations. American Economic Review, 74(2), 194-199. Retrieved from http://www.nber.org/papers/w1335.pdf
27. Hair, J. F., Black, B., Babin, B., Anderson, R. E., & Tatham, R. L. (2006). Multivariate data analysis. Baskı. Upper Saddle River, NJ: Pearson Prentice Hall. (Vol. 6). Retrieved from
https://pdfs.semanticscholar.org/6885/bb9a29e8a5804a71bf-5b6e813f2f966269bc.pdf
28. Havoutis, N. (2003). Optimising Working Capital: The Latest Solutions. JP Morgan, New York, NY. Retrieved from https://www.jpmorgan.com/cm/BlobServer?blobtable=Document&blobcol=urlblob&blobkey=name&blobheader=application/pdf&blobwhere=jpmorgan/chase/pdf/sustainedfinancialperf.pdf
29. Holly, S., & Turner, P. (2001). Inventory investment and asymmetric adjustment: Some evidence for the UK. International Journal of Production Economics, 72(3), 251-260. http://doi.org/10.1016/S0925-5273(00)00148-1
30. Humphreys, B. R., Maccini, L. J., & Schuh, S. (2001). Input and output inventories. Journal of Monetary Economics, 47(2), 347-375. http://doi.org/10.1016/S0304-3932(01)00046-0
31. Inmyxai, S., & Takahashi, Y. (2010). The Effect of Firm Resources on business Performance or Male- and Female- Headed Firms in the Case of Lao Micro-, Small- and Medium-Sized Enterprises. International Journal of Business and Information, 5(1), 63-90.
32. Islam, J., & Hu, H. (2012). A review of literature on contingency theory in managerial accounting. African Journal of Business Management, 6(15), 5159-5164. http://doi.org/10.5897/AJBM11.2764
33. Jensen, & Meckling. (1976). Theory of the Firm : Managerial Behavior, Agency Costs and Ownership Structure. Journal of Financial Economics, 3, 305-360. https://doi.org/10.1016/0304-405X(76)90026-X
34. Kim, C., Mauer, D., & Sherman, A. (1998). The determinants of corporate liquidity: Theory and evidence. Journal of Financial and Quantitative Analysis, 33(3), 335-359. https://doi.org/10.2307/2331099
35. Kitagawa, N., & Gotoh, M. (2011). Implied cost of capital over the last 20 years. The Japanese Accounting Review, 1, 71-104. Retrieved from https://www.jstage.jst.go.jp/article/tjar/1/2011/1_5/_pdf

14
Investment Management and Financial Innovations, Volume 14, Issue 3, 2017
36. Kolias, G. D., Dimelis, S. P., & Filios, V. P. (2011). An empirical analysis of inventory turnover behaviour in Greek retail sector: 20002005. International Journal of Production Economics, 133(1), 143-153. http://doi.org/10.1016/j.ijpe.2010.04.026
37. Koumanakos, D. P. (2008). The effect of inventory management on firm performance. International Journal of Productivity and Performance Management, 57(5), 355-369. http://doi.org/10.1108/17410400810881827
38. Lieberman, M. B., Helper, S., & Demeester, L. (1999). The empirical determinants of inventory levels in high-volume manufacturing. Production and Operations Management, 8(I), 44-55. http://doi.org/10.1111/j.1937-5956.1999. tb00060.x
39. Lifland, S. (2011). The Impact of Working Capital Efficiencies on the Enterprise Value Option: Empirical Analysis from the Energy Sector. Lifland Advances in Business Research, 2(1), 57-70.
40. Milgrom, P., & Roberts, J. (1988). Communication and inventory as substitutes in organizing production. Scandinavian Journal of Economics, 90(3), 275-289. http://doi.org/10.2307/3440309
41. Miller, T., & de Matta, R. (2008). A Global Supply Chain Profit Maximization and Transfer Pricing Model. Journal of Business Logistics, 29(1), 175-199. Retrieved from http://www.redi-bw.de/db/ebsco.php/search.ebscohost.com/login.aspx?direct=true&db=buh&AN=33382306&site=ehost-live%5Cn%3CGo to ISI%3E://WOS:000273629300009
42. Myers, S. C., & Majluf, N. S. (1984). Corporate financing and investmentdecisions when firms have information that investors do not have. Journal of Financial Economics, 13, 187-221.
43. Nenkov, D. N. (2012). Dynamics of capital markets and its impact on the cost of equity. Verslo Ir Teisės Aktualijos. Current Issues of Business and Law, 7(2), 365-386. http://doi.org/10.5200/1822-9530.2012.23
44. Ram, S. S. (2008). Relevance of intangible assets to evaluate financial health. Journal of Intellectual Capital, 9(3), 351-366. https://doi.org/10.1108/14691930810891974
45. Safizadeh, M. H., & Ritzman, L. P. (1997). Linking performance drivers in production planning and inventory control to process choice. Journal of Operations Management, 15(4), 389-403. https://doi.org/10.1016/S0272-6963(97)00014-4
46. Samiloglu, F., & Demirgunes, K. (2008). The Effect of Working Capital Management on Firm Profitability: Evidence from Turkey. The International Journal of Applied Economics and Finance, 2(1), 44-50. https://doi.org/10.3923/ijaef.2008.44.50
47. Schwarz, L., & Weng, K. Z. (2000). The design of a JIT supply chain: The effect of leadtime uncertainty on safety stock. Journal of Business Logistics, 21(2), 231-254. Retrieved from http://trid.trb.org/view.aspx?id=668973
48. Scott, W., & Cole, R. (2000). The Quality Movement and Organization Theory. Sage Publications. http://doi.org/10.1108/mbe.2002.26706cae.008
49. Sekeroglu, G., & Altan, M. (2014). The Relationship between Inventory Management and Profitability : A Comparative Research on Turkish Firms Operated in Weaving Industry. Eatables Industry, Wholesale and Retail Industry, 8(6), 1665-1670. Retrieved from http://www.waset.org/publica-tions/9998479
50. Sensier, M. (2003). Inventories and asymmetric business cycle fluctuations in the UK: a structural approach. Applied Economics, 35(4), 387-402. http://doi.org/10.1080/00036840210128735
51. Shapiro, J. F. (2007). Modeling the Supply Chain. Pacific Grove, CA: Duxbury Press. Retrieved from https://www.amazon.com/Modeling-Supply-Chain-Duxbury-Applied/dp/0495126098
52. Shapiro, J. F., & Wagner, S. N.
(2009). Strategic Inventory
Optimization. Journal of Business
Logistics, 30(2), 161-174. http://
doi.org/10.1002/j.2158-1592.2009.
tb00117.x
53. Stock, J. R., & Lambert, D.
M. (2001). Strategic Logistics
Management (4th ed). Boston:
McGraw-Hill ⁄ Irwin. Retrieved
from https://www.amazon.com/
Strategic-Logistics-Management-
James-Stock/dp/0256136874
54. Studenmund, A. H. (1997). Using
econometrics: A practical guide.
New York Addison-Wesley.
55. Swamidass, P. M. (2007).
The effect of TPS on US
manufacturing during 1981–
1998: inventory increased or
decreased as a function of plant
performance. International
Journal of Production Research,
45(16), 3763-3778. http://doi.
org/10.1080/00207540701223675
56. Tsoukalas, J. D. (2011). Input and
Output Inventories in the UK.
Economica, 78(311), 460-479.
http://doi.org/10.1111/j.1468-
0335.2009.00829.x
57. Vastag, G., & Whybark, D. C.
(2005). Inventory management:
Is there a knock-on effect?
International Journal of Production
Economics, 93-94(SPEC. ISS.),
129-138. http://doi.org/10.1016/j.
ijpe.2004.06.011
58. Venkatraman, A. N., & Prescott, J.
E. (1990). Environment-Strategy
coalignment: an Empirical Test
of Its Performance Implications.
Strategic Management Journal,
11(1), 1-23. https://doi.
org/10.1002/smj.4250110102
59. Waller, M., Johnson, M. E., &
Davis, T. (1999). Vendor-managed
inventory in the retail supply chain.
Journal of Business Logistics, 20,
183-204.
60. Yang, C. H., & Chen, K. H. (2009).
Are small firms less efficient? Small
Business Economics, 32(4), 375-395.
http://doi.org/10.1007/s11187-007-
9082-x