inventory modelling in relation to ... -...
TRANSCRIPT

08/04/2010The Basis - getting the inventory right - Morten Birkved1 DTU Management Engineering, Technical University of Denmark
The BasisGetting the inventory right
Assistant professorMorten Birkved
08/04/2010The Basis - getting the inventory right - Morten Birkved2 DTU Management Engineering, Technical University of Denmark
Inventory modelling in relation to quantification of chemical emissions
08/04/2010The Basis - getting the inventory right - Morten Birkved3 DTU Management Engineering, Technical University of Denmark
The relative importance of getting the inventory right
Importance of chemical emission quantification
Impact potential of emissionIPi = Qi x CFi
Where:CFi – Characterization factor of compound iQi – Quantity emitted of compound iIPi – Impact potential of emission of compound i
Thus:Importance of characterization = Importance emission
quantification
08/04/2010The Basis - getting the inventory right - Morten Birkved4 DTU Management Engineering, Technical University of Denmark
The relative importance of getting the inventory right
What do we get and what do not get:Chemical inventories typically include:• Gate to grave processes in the chemical life cycleChemical inventories typically does not include:• Cradle to gate processesWhich means?Almost all chemical impact potentials only include the inherent impact
potentials of the chemicals emitted and not the impact potential of the production of the chemical
Raw materials Production Use EoLImpacts Not included Included
08/04/2010The Basis - getting the inventory right - Morten Birkved5 DTU Management Engineering, Technical University of Denmark
The relative importance of getting the inventory right Definition of emission/elementary flows of chemical compounds:An emission is occurring when fx. a chemical compound crosses the
technosphere - ecosphere boundary
Technosphere Ecosphere
08/04/2010The Basis - getting the inventory right - Morten Birkved6 DTU Management Engineering, Technical University of Denmark
The inventorQuantification of emissions/consumptions
Raw materials Production Use EoL
Consumption
Emission

08/04/2010The Basis - getting the inventory right - Morten Birkved7 DTU Management Engineering, Technical University of Denmark
The inventorQuantification of emissions/consumptions
Unit process
Energy
EoL
Energy
Waste
Chemicals Water
Chemicals
Raw materials Production Use
08/04/2010The Basis - getting the inventory right - Morten Birkved8 DTU Management Engineering, Technical University of Denmark
The inventorQuantification of emissions/consumptions
Raw materials Production Use EoL
Inputs Outputs Net exchange------- ------- -------------- ------- -------------- ------- -------------- ------- -------------- ------- -------
Net exchange:Ressource consumptionEmission of chemical/material
08/04/2010The Basis - getting the inventory right - Morten Birkved9 DTU Management Engineering, Technical University of Denmark
Chemical emission aspectsEmission routes
Emission routes:Emission to airEmission to waterEmission to soil
IPi,air≠ IPi,water ≠ IPi,soil
Risk assessmentTypically 1 route
LCIAAll routes needed
08/04/2010The Basis - getting the inventory right - Morten Birkved10 DTU Management Engineering, Technical University of Denmark
The location of a chemical emission matters, due to:•Fate of emission
-Degradation-Bioavailability-Migration/dispersion…
•Sensitivity of recipient-Biodiversity-Tolerance/adaption-Proximity to emission…..
Chemical emission aspects Location of emission
IPi,j,loc. 1≠ IPi,j,loc. 2
08/04/2010The Basis - getting the inventory right - Morten Birkved11 DTU Management Engineering, Technical University of Denmark
The inventoryInventory and emission modellingWhy model emissions?• Quantification of emission measure is expensive and/or time consuming• Quantification of emission not possible and/or very hard physically• Quantification of emission is not possible due to “resistance” towards
providing necessary data• Quantification of emission is in many cases “theoretical” since it’s made
on a unit process base
What unit processes are typically modelled in inventory models?• Biological unit processes• Very complex mechanical unit processes• Highly varying (temporal and/or spatial) unit processes
What model approaches are used for LCI modelling• All (static, dynamic, linear, non-linear etc.)
08/04/2010The Basis - getting the inventory right - Morten Birkved12 DTU Management Engineering, Technical University of Denmark
The inventoryInventory and emission modellingCase examples:
Case 1 – Emission modelling of chemicals from households via sewage water
Case 2 – PestLCI - modelling of pesticide emissions from fields

08/04/2010The Basis - getting the inventory right - Morten Birkved13 DTU Management Engineering, Technical University of Denmark
Sewage LCIEmission modelling of chemicals from households
Source: EU (2003)
of households connected to STPs
08/04/2010The Basis - getting the inventory right - Morten Birkved14 DTU Management Engineering, Technical University of Denmark
Sewage LCIEmission modelling of chemicals from households
Why model chemical emissions via sewage?•Complex systems
•Combined biological/mechanical systems
•Very important source in terms of chemical emissions
•High temporal emission variability
•High spatial emission variability
08/04/2010The Basis - getting the inventory right - Morten Birkved15 DTU Management Engineering, Technical University of Denmark
Primary
treatment
Secondary
treatment
Tertiary
treatment
Total
1 BE 1998 0.0 22.0 16.1 38.1 44.6 0.0 17.3 17.3
2 DK 1998 1.6 3.4 84.0 89.0 0.1 10.9 0.0 10.9
3 DE 1998 1.1 6.3 83.1 90.5 2.7 4.7 2.1 6.8
4 EL 1997 32.4 14.2 9.6 56.2 11.6 0.0 32.2 32.2
5 ES 1995 10.6 34.4 3.3 48.3 51.7 0.0 0.0 0.0
6 FR 1998 0.0 0.0 0.0 0.0 81.6 10.0 8.4 18.4
7 IE 1995 24.0 31.8 1.8 57.6 10.4 0.0 32.0 32.0
8 IT 1995 2.9 36.1 24.1 63.1 36.9 0.0 0.0 0.0
9 LU 1999 0.0 0.0 0.0 0.0 93.0 7.0 0.0 7.0
10 NL 2000 0.0 18.1 80.0 98.1 0.0 0.0 1.9 1.9
11 AT 2001 0.0 0.0 0.0 0.0 86.0 14.0 0.0 14.0
12 PT 1998 17.8 26.0 2.3 46.1 35.9 4.7 13.3 18.0
13 FI 2001 0.0 0.0 81.0 81.0 0.0 0.0 19.0 19.0
14 SE 2000 0.0 5.0 81.0 86.0 0.0 0.0 14.0 14.0
15 UK 2000 3.6 64.0 27.0 94.6 2.0 0.0 3.4 3.4
16 BG 2001 0.9 37.2 0.0 38.1 29.8 0.0 32.1 32.1
17 CY 2000 0.0 0.0 34.5 34.5 0.0 65.5 0.0 65.5
18 CZ 2001 0.0 0.0 0.0 0.0 74.9 0.0 25.1 25.1
19 EE 2000 1.0 28.0 40.0 69.0 1.0 0.0 30.0 30.0
20 HU 2000 2.3 24.4 5.5 32.2 19.0 17.1 31.7 48.8
No Country Year Urban waste water collecting system Independent waste water
With treatment Without
treatment
TotalWith
treatment
Without
treatment
Sewage LCIEmission modelling of chemicals from households
PT:Urban WWT = 35.9 % NOT treatedIndependent WWT = 18 % NOT treatedTotal = 53,9 % NOT treated
FI:Urban WWT = 0 % NOT treatedIndependent WWT = 19 % NOT treatedTotal = 19 % NOT treated 08/04/2010The Basis - getting the inventory right - Morten Birkved16 DTU Management Engineering,
Technical University of Denmark
Sewage LCIEmission modelling of chemicals from households
Independent WWT
Urban WWT
08/04/2010The Basis - getting the inventory right - Morten Birkved17 DTU Management Engineering, Technical University of Denmark
Sewage LCIEmission modelling of chemicals from households
Nationalsewage systemconfiguration
Compound specific
biodegradationmeasure
Sewagetreatmentefficiency
interpolation
Sewage LCI
Fraction emitted via:•Urban sewage system not treated•Urban sewage system with prim. treatment•Urban sewage system with sec. treatment•Urban sewage system with tert. treatment•Independent sewage system without treatment•Independent sewage system with treatment (septic tank and if relevant mini STP)
08/04/2010The Basis - getting the inventory right - Morten Birkved18 DTU Management Engineering, Technical University of Denmark
Sewage LCIEmission modelling of chemicals from households
0
0.1
0.2
0.3
0.4
0.5
0.6
0.7
0.8
0.9
1
DK BE NL UK DE IT FI SE FR ES
Fraction emitted via emission route E6
Fraction emitted via emission route E5
Fraction emitted via emission route E4
Fraction emitted via emission route E3
Fraction emitted via emission route E2
Fraction emitted via emission route E1
What is the difference (approximately) in impact potential of 1 kg AE applied in NL and FR judged from above?
28.70.03
0.86
NL in emitted Fraction
FR in emitted FractionΔIPAE
0.86
0.03
Alcohol ethoxylates (C12-14EO7)

08/04/2010The Basis - getting the inventory right - Morten Birkved19 DTU Management Engineering, Technical University of Denmark
Sewage LCIEmission modelling of chemicals from householdsValidation example:Compound: Alcohol Ethoxylates (AE)National annual consumption ~ 1,800 tons (CETOX, 2000)Vejle Amt (county) case study:Population ~ 345,000 people (6,45 %) (DST, 2007) AE consumption in Vejle Amt ~ 116 tonsAnnual water emission:Urban sewage system 5,8281010 ltr. (MST, 2007)Independent sewage system: 6,5107 ltr. (calculated)
100 %
08/04/2010The Basis - getting the inventory right - Morten Birkved20 DTU Management Engineering, Technical University of Denmark
Sewage LCIEmission modelling of chemicals from households
Worst case
Realistic/average case
2.1 %
08/04/2010The Basis - getting the inventory right - Morten Birkved21 DTU Management Engineering, Technical University of Denmark
PestLCIEmission modelling of pesticides
08/04/2010The Basis - getting the inventory right - Morten Birkved22 DTU Management Engineering, Technical University of Denmark
PestLCIEmission modelling of pesticides
08/04/2010The Basis - getting the inventory right - Morten Birkved23 DTU Management Engineering, Technical University of Denmark
PestLCIEmission modelling of pesticides
08/04/2010The Basis - getting the inventory right - Morten Birkved24 DTU Management Engineering, Technical University of Denmark
PestLCIEmission modelling of pesticides
White boxes Intra-technosphere transport/migrationprocesses
Yellow box Processes leading to transport outside technosphere (emission)
Grey boxes Terminal processes - intra-technosphere degradation and emissions pools
08/04/2010The Basis - getting the inventory right - Morten Birkved25 DTU Management Engineering, Technical University of Denmark
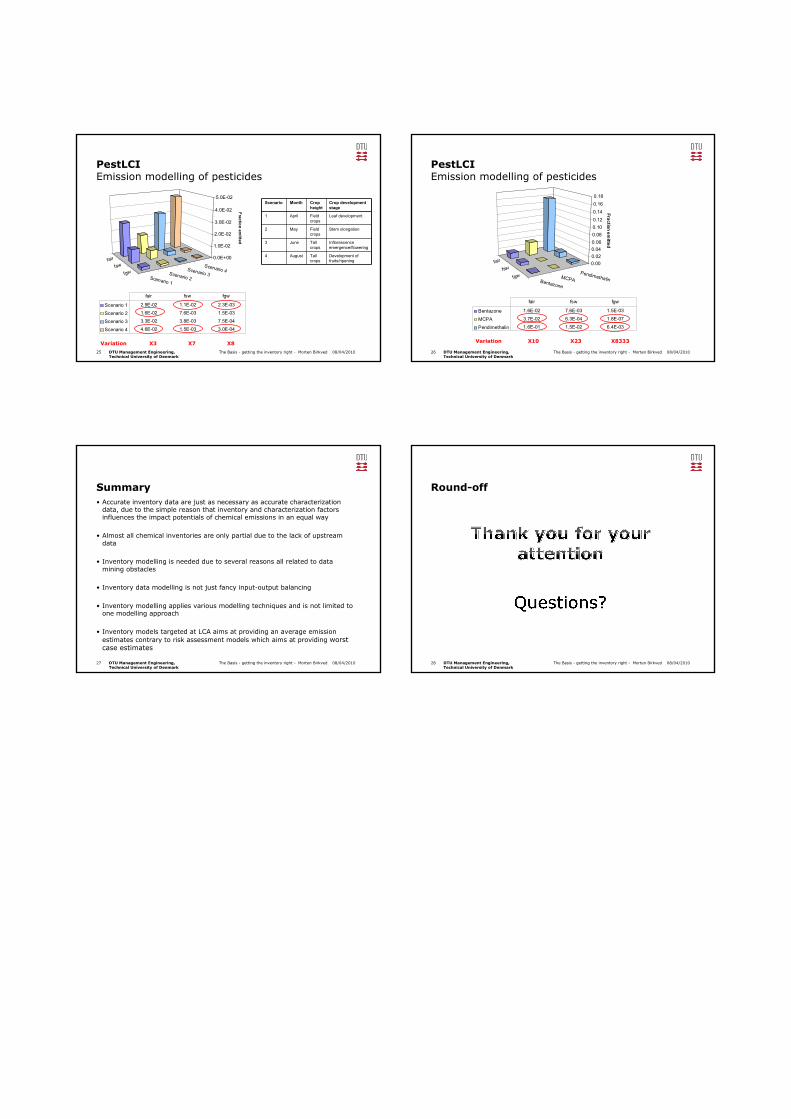
PestLCIEmission modelling of pesticides
fair
fsw
fgwScenario 1
Scenario 2
Scenario 3
Scenario 4
0.0E+00
1.0E-02
2.0E-02
3.0E-02
4.0E-02
5.0E-02
Fractio
n em
itted
Scenario 1 2.9E-02 1.1E-02 2.3E-03
Scenario 2 1.6E-02 7.6E-03 1.5E-03
Scenario 3 3.3E-02 3.8E-03 7.5E-04
Scenario 4 4.6E-02 1.5E-03 3.0E-04
fair fsw fgw
Scenario Month Crop height
Crop development stage
1 April Field crops
Leaf development
2 May Field crops
Stem elongation
3 June Tall crops
Inflorescence emergence/flowering
4 August Tall crops
Development of fruits/ripening
Variation X3 X7 X8
08/04/2010The Basis - getting the inventory right - Morten Birkved26 DTU Management Engineering, Technical University of Denmark
PestLCIEmission modelling of pesticides
fair
fsw
fgwBentazone
MCPA
Pendimethalin
0.00
0.02
0.04
0.06
0.08
0.10
0.12
0.14
0.16
0.18
Fra
ctio
n e
mitte
d
Bentazone 1.6E-02 7.6E-03 1.5E-03
MCPA 3.7E-02 6.3E-04 1.8E-07
Pendimethalin 1.6E-01 1.5E-02 6.4E-03
fair fsw fgw
Variation X10 X23 X8333
08/04/2010The Basis - getting the inventory right - Morten Birkved27 DTU Management Engineering, Technical University of Denmark
Summary• Accurate inventory data are just as necessary as accurate characterization
data, due to the simple reason that inventory and characterization factors influences the impact potentials of chemical emissions in an equal way
• Almost all chemical inventories are only partial due to the lack of upstream data
• Inventory modelling is needed due to several reasons all related to data mining obstacles
• Inventory data modelling is not just fancy input-output balancing
• Inventory modelling applies various modelling techniques and is not limited to one modelling approach
• Inventory models targeted at LCA aims at providing an average emission estimates contrary to risk assessment models which aims at providing worst case estimates
08/04/2010The Basis - getting the inventory right - Morten Birkved28 DTU Management Engineering, Technical University of Denmark
Round-off