inventory of mineral fertiliser use february 2004 final report inventory - final.pdfcroatia dr milan...
TRANSCRIPT

UNDP/GEF Danube Regional Project
Policies for the Control of Agricultural Point and Non-point Sources of Pollution
& Pilot Projects on Agricultural Pollution Reduction
(Project Outputs 1.2 and 1.3)
Inventory of Mineral Fertiliser Use
in the Danube River Basin Countries with Reference to Manure and Land Management
Practices
February 2004
Final Report
GFA Terra Systems in co-operation with Avalon


Your contact person with GFA Terra Systems is
Dr. Heinz-Wilhelm Strubenhoff
Danube Regional Project - Project RER/01/G32
”Policies for the control of agricultural point and non-point sources of pollution” and “Pilot project on agricultural pollution reduction”
(Project Outputs 1.2 and 1.3)
Inventory of Mineral Fertiliser Use in the Danube River Basin Countries with Reference to Manure and Land Management Practices
Address
GFA Terra Systems GmbH Eulenkrugstraße 82
22359 Hamburg Germany
Telephone: 00-49-40-60306-170
Telefax: 00-49-40-60306-179 E-mail: [email protected]


Preface The UNDP-GEF Danube Regional Project supports through this Project Component the development of policies for the control of agricultural point and non-point sources of pollution and the conceptualization and implementation of pilot projects on agricultural pollution reduction in line with the requirements of the EU Water Framework Directive. The Overall Objective of the Danube Regional Project is to complement the activities of the ICPDR required to strengthen a regional approach for solving transboundary problems in water management and pollution reduction. This includes the development of policies and legal and institutional instruments for the agricultural sector to assure reduction of nutrients and harmful substances with particular attention to the use of fertilizers and pesticides. Following the mandate of the Project Document, Objective 1 stipulates the “Creation of Sustainable Ecological Conditions for Land Use and Water Management” and under Output 1.2, “Reduction of nutrients and other harmful substances from agricultural point and non-point sources of pollution through agricultural policy changes”, Activity: 1.2-3 requires to “Review inventory on important agrochemicals (nutrients, etc) in terms of quantities of utilization, their misuse in application, their environmental impacts and potential for reduction” The present document “Inventory of Mineral Fertiliser Use in the Danube River Basin Countries with Reference to Manure and Land Management Practices” responds to this mandate in providing an analysis on the present use of mineral fertiliser, the existing mechanisms of regulation and control and proposed measures for policy reforms and their practical application in line with the requirements of the EU Directives and regulations. The result of this study on the use of mineral fertilisers (including reference to manure and land management practices) complements the review and analysis presented in the other key documents produced within the framework of Output 1.2: • Inventory of Agricultural Pesticide Use in the Danube River Basin Countries • Inventory of Policies for Control of Water Pollution by Agriculture in the Danube River Basin
Countries • Draft Concept for Best Agricultural Practice for the Danube River Basin Countries The findings and analysis in the present report have been prepared by the principal author, Dr Mark Redman, supported by contributions from the following national experts: Bosnia & Herzegovina (including Republica Srpska)
Prof. Dr Hamid Custovic Dr. Mihajlo Markovic
Bulgaria Association for Integrated Rural Development Croatia Dr Milan Mesic Czech Republic Milena Forejtnikova Hungary György Mészáros Moldova Alexandru Prisacari Romania Dr. Cristian Kleps Serbia and Montenegro Prof. Dr. Zorica Vasiljevic
Dr. Vlade Zaric Slovakia Dr. Radoslav Bujnovsky Slovenia Marina Pintar Ukraine Natalia Pogozheva

Table of Contents Abbreviations and Acronyms Country Codes Used Executive Summary ................................................................................................................................ 1 Introduction ............................................................................................................................................. 9 Methodology ......................................................................................................................................... 15 Use of Mineral Fertilisers in the 11 Central and Lower DRB Countries .............................................. 17 Problems Associated with Mineral Fertilisers, Manure Application and Land Management in the DRB Countries ............................................................................................................................................... 21 Potential for Policy Reform in EU Context........................................................................................... 23 “Good Practice” for Improving the Management of Fertilisers and Manures....................................... 31 Recommendations for Policy Reform in DRB Countries ..................................................................... 33 Annex 1: Review of the Use of Mineral Fertiliser Products in the DRB Countries (Questionnaire)... 35 Annex 2: Bosnia & Herzegovina.......................................................................................................... 43 Annex 3: Bulgaria ................................................................................................................................ 53 Annex 4: Croatia .................................................................................................................................. 59 Annex 5: Czech Republic..................................................................................................................... 65 Annex 6: Hungary ................................................................................................................................ 71 Annex 7: Moldova................................................................................................................................ 79 Annex 8: Romania................................................................................................................................ 85 Annex 9: Serbia & Montenegro ........................................................................................................... 89 Annex 10: Slovakia .............................................................................................................................. 95 Annex 11: Slovenia ............................................................................................................................ 101 Annex 12: Ukraine ............................................................................................................................. 107

Abbreviations and Acronyms BAP Best Agricultural Practice CAP Common Agricultural Policy DRB Danube River Basin DRP Danube Regional Project EC European Commission EU European Union FAO UN Food and Agriculture Organisation FAOSTAT Statistical database of the UN Food and Agriculture Organisation GEF Global Environmental Facility ICPDR International Commission for the Protection of the Danube River K Potassium Kg/ha Kilogrammes per hectare MONERIS Modelling Nutrient Emissions in River Systems UNDP United Nations Development Programme N Nitrogen P Phosphorus WFD Water Framework Directive
Country Codes Used BG Bulgaria BH Bosnia and Herzegovina – consisting of 2 entities:
FedBH – Federation of Bosnia and Herzegovina RS – Republic of Srpska
CZ Czech Republic HR Croatia HU Hungary MD Moldova RO Romania SK Slovakia SL Slovenia UA Ukraine CS Serbia and Montenegro (previously the Former Republic of Yugoslavia)


Inventory of Mineral Fertiliser Use in the Danube River Basin Countries 1
Executive Summary Introduction Modern agricultural production systems have developed by making widespread use of mineral fertilisers to replace the traditional reliance upon crop rotations and animal manures to maintain and enhance soil fertility and support profitable crop production. The two most important plant nutrients applied as mineral fertilisers are nitrogen (N) and phosphorus (P). Both occur naturally in the soil and are essential for crop growth. The collapse of the centrally-planned economies of central and eastern Europe in the early 1990s caused a social and economic crisis that profoundly affected agriculture in the central and lower Danube River Basin (DRB). These changes inevitably led to a significant reduction in agricultural productivity in the region, including a decline in the use of external inputs such as mineral fertilisers. Reliable data on mineral fertiliser use in the central and lower DRB region are not available for the decades leading up to 1990. However, the limited data available from the FAOSTAT database shows that after rising strongly for three decades the use of N fertilisers (kg N/ha) by farmers in the former communist DRB countries dropped by approximately 50% around the year 1990 and is now far below the EU average (Figure 1). The decline in fertiliser use was more severe in some countries than others – in Bulgaria, the average application rate of fertiliser N fell from 109.9 kg N/ha in 1981 to 29.9 kg N/ha in 1999. However in all countries, the reduction in the use of mineral fertilisers was the result of economic necessity rather than environmental awareness since for most farmers the lack of working capital has made it difficult to buy in more than the minimum of farm inputs. At the same time, significant changes also occurred in livestock production. The de-collectivisation and privatisation of the state-controlled animal breeding complexes was particularly dramatic in many DRB countries and led to a significant decline in livestock numbers by approximately 50% in most countries, as well as a major change in the way that farm animals are kept. With the decline in livestock numbers there has also been a decline in the availability of manure as a traditional source of crop nutrients and this has resulted in a decline in the nutrient balance of many agricultural soils in the DRB countries to the point that farmers are now relying upon the fertility reserves of the soil to maintain their relatively low levels of crop yield. Figure 1: Long-term trends in nitrogen fertiliser use (kg N/ha) in selected central and lower
DRB countries and EU Member States1
0
10
20
30
40
50
60
70
80
1961 1964 1967 1970 1973 1976 1979 1982 1985 1988 1991 1994 1997
kg/h
a
C EECs EU 15
1 Due to limited data availability, the description of the trend in N fertiliser consumption is limited to the following DRB countries: Bulgaria, Czech Republic, Hungary, Romania and Slovakia

UNDP/GEF Danube Regional Project 2
Source: FAOSTAT - database of the UN Food and Agriculture Organization. The aim of this report is to develop an inventory of fertiliser market products for the central and lower DRB on a country-by-country basis and to review their typical use, misuse and potential for reduction of environmental impact. Additionally reference is made to animal manures and land management practices where these relate to the management of crop nutrients and minimising the risk of water pollution by diffuse losses from agricultural land. The national fertiliser inventories are presented in Annexes 2 –12 of this report. Use of Mineral Fertilisers in the 11 DRB Countries A range of mineral fertiliser products containing nitrogen (N) and phosphorus (P) are available to farmers in DRB countries. There are no consistent patterns to the products being, except to say that the most commonly used products in any country are inevitably those that are locally the cheapest such as ammonium nitrate, calcium ammonium nitrate (CAN) and urea. Figure 2 below shows the annual total consumption (millions tonnes) of N and P mineral fertilisers in all DRB countries under study during the period 1997 – 2002. Whilst there has been little change in total P fertiliser use, there appears to be a discernable trend towards increasing N fertiliser consumption with an 18% increase between 1997 and 2002. However, this aggregate increase obscures: • a 30% increase in total N fertiliser consumption in the 4 DRB countries preparing for EU
accession – either as the result of more land being fertilised by farmers and/or an increase in fertiliser application rate (i.e. farmers applying more fertiliser N per hectare).
• reductions of up to 50% in total N fertiliser consumption in some of the other central and lower DRB countries, including Romania, Ukraine and Serbia & Montenegro
The existing trend towards increasing fertiliser N consumption in the 4 acceding countries is a cause for concern since it is likely to be reinforced by EU enlargement and the implementation of the Common Agricultural Policy (CAP) leading to increasing areas of cereals and oilseeds being grown due to the availability of EU direct payments; increased intensification of crop production, particularly in the more favourable areas with better growing conditions, and a possible reduction in mixed cropping due to an increase in large-scale cereal monocultures. Figure 2: Annual total consumption of N and P (thousand tonnes nutrient/year) as fertiliser products in
the central and lower DRB countries (1997 - 2002)
0
200
400
600
800
1000
1200
1997 1998 1999 2000 2001 2002
Year
Tota
l Fer
tilis
er U
se
(thou
sand
tonn
es n
utrie
nt/y
ear)
Total N fertiliser use Total P fertiliser use

Inventory of Mineral Fertiliser Use in the Danube River Basin Countries 3
Source: Data submitted by GFA National Experts Problems Associated with Mineral Fertilisers, Manure Application and Land Management in the DRB Countries The total amounts of mineral fertiliser applied to agricultural land are certainly an important consideration in assessing the environmental impact of agriculture upon water quality and there is also little doubt that the reduction in fertiliser use in the central and lower DRB countries has contributed to a reduction in nutrient losses. However, the environmental impact of fertiliser use is also closely related both to: a) the way in which farmers apply fertilisers to their crops and b) the overall management of their farming system In particular, the changes in management practice required to optimise the use of mineral fertilisers and avoid their misuse are related to the application of manure and slurry to agricultural land, as well as other soil management practices such as cultivations. Typical problems and “bad practice” identified by the GFA national experts during preparation of the national fertiliser inventories (Annexes 2 - 12) included: • there is a widespread ignorance of ideas such as “pollution” or environment” amongst farmers and
no information on the importance of managing fertilisers and manures properly • farmers often consider manure as a “waste product” rather than a source of nutrients that should be
used carefully to save money spent on fertilisers • the agricultural workforce often consists of more elderly people familiar only with previous
farming methods and who have little (if any) agricultural education and do not understand the importance of applying fertilisers and manures correctly to the soil
• the machinery used for spreading fertilisers is outdated and not appropriate for the modern agricultural operations – consequently application is uneven and commonly results in areas of “under” and “over”-fertilisation. Farmers do not have the knowledge or experience to adjust/operate the equipment correctly
• many cheaper mineral fertilisers are only “milled” and during storage become compacted again which makes uniform spreading very difficult
• fertilisers and manures are commonly stored in unauthorised places where there is a risk of causing pollution
• there is a tendency in some areas for farmers to grow the same crop (or same simple rotation of crops) for many years without application of fertiliser or manures. This is leading to a serious decline in soil fertility and the risk of increasing soil erosion due to loss of soil organic matter
• farmers do not consider the nutrient requirements of the crops they are applying fertilisers (and manures) to
• it is not very common for farmers to practice soil testing before deciding where to apply fertilisers and manures and in what quantities
• farmers and agronomists do not sufficiently recognise the potential value of nutrients in livestock manure. Consequently the application rate of fertilisers is not adjusted and nutrients are wasted because they are surplus to the crop’s requirement
• bad timing of fertiliser application is a common problem, especially when applying large amounts of fertiliser to higher value crops such as vegetables and potatoes. There are many reasons for this including poor knowledge and no access to agronomic advice, but also lack of necessary equipment when needed
• application of nitrogen to soil in autumn before planting a spring crop is common practice in some countries. It is not understood that the nitrogen can be lost over winter. Spreading fertiliser and manure to frozen and snow covered ground is also common in some countries
• over-application of fertiliser N at the time of sowing a crop is a common problem

UNDP/GEF Danube Regional Project 4
• compound fertilisers are often applied with inappropriate balance of nutrients and there is tendency to under-fertilise with P and K
• nitrate losses from agricultural land are associated with farming practice not just the rate of fertiliser or manure application – factors that continue to contribute to high levels of nitrate leaching are poor timing of application, regular cultivations and the ploughing of grassland, legumes and other crop residues
• fertilisers (and manures) are spread too closely to surface waters – rivers, lakes, ponds, streams and springs
• fertilisers (and manures) are spread on sloping land where there is the risk of surface run-off from heavy rain washing them into nearby rivers and streams
• even though the number of farm animals has declined and the quantity of animal wastes produced is less, most farmers do not have good storage facilities for manure and slurry – therefore manures and slurries are being applied at inappropriate times (e.g. autumn and winter) when there is a high risk of leaching or run-off
• because of simplified tax systems in many countries for households and private agricultural plots, including small farms, there is no official obligation for them to have a book-keeping system. As a result they do not keep records of their purchases or use of fertilisers, manures or other relevant information (e.g. crop yields or sales) and there is therefore no reliable information regarding application of fertilizers
Potential for Policy Reform in EU Context As noted in the other summary reports, this review of fertiliser use is undertaken during a period of great change in the Danube River Basin (DRB) with 4 countries (Hungary, Czech Republic, Slovakia and Slovenia) in the final stages of preparation for accession to the EU in 2004 and 2 countries (Bulgaria and Romania) preparing for EU accession sometime after 2004. The policy-making context for agricultural pollution control in the DRB is therefore undergoing significant change and preparation for joining the EU is currently a major driving force for the reform of agricultural pollution control policies in the region. This includes: Adoption of EU Legislation In the European Union, there are three Directives that address the problem of excess nutrient losses from agriculture: • Directive 80/68/EEC on the protection of groundwater against pollution caused by certain
dangerous substances (the Groundwater Directive) • Directive 91/676/EEC concerning the protection of waters against pollution caused by nitrates
from agricultural sources • Directive 2000/60/EC establishing a framework for Community action in the field of water policy
(the Water Framework Directive) Of these, only the Nitrate Directive 91/676 currently places any direct obligation upon farmers and for over a decade has effectively promoted a variety of good practices for reducing diffuse nitrate pollution by nitrates through a variety of good agricultural practices, including good practices in fertiliser and manure application. Unfortunately, the Nitrates Directive has consistently failed to meet its environmental objectives and has suffered from both considerable resistance by the EU agricultural community and poor implementation by many Member States. One problem has been the lack of appropriate tools – particularly economic instruments - to support implementation of the Directive. For example, Member States have not been able to offer farmers agri-environment payments to encourage them to meet the obligatory reductions in fertiliser application required in designated “nitrate vulnerable zones” under the Nitrate Directive because EU rules currently prevent agri-environment payments being made to farmers for complying with the requirements of EU legislation.

Inventory of Mineral Fertiliser Use in the Danube River Basin Countries 5
It is now hoped that the Water Framework Directive (WFD) will offer an additional policy tool for reducing agricultural water pollution – provided that appropriate policy instruments can be developed/utilised by the WFD to address the pressures upon water resources from agriculture. Consequently there is much interest in using the policy tools available in the Common Agricultural Policy (CAP) to support and implement the WFD, including the Pillar 1 – Market Support Measures and the Pillar 2 - Rural Development Measures. Financial Incentives for Pollution Control As mentioned above, the EU Rural Development Regulation 1257/1999 (the “second pillar” of the CAP) makes provision for Member States to encourage more environmentally-friendly farming methods, including practices and actions that reduce the risk of agricultural pollution. This offers a good opportunity for supporting the control of nutrient pollution in those DRB countries joining the EU, by allowing them to develop EU co-financed schemes that: a) offer grant-aided investment (up to 50%) in agricultural holdings that helps to “…preserve and
improve the natural environment” – for example, by purchasing new manure storage facilities or purchasing more up-to-date equipment for fertiliser and manure application
b) training farmers for the “…application of production practices compatible with the maintenance and enhancement of the landscape and the protection of the environment” – this includes: • training for organic farming • training for farming management practices with a specific environmental protection objective
c) introducing agri-environment schemes that offer area payments to support “…agricultural production methods designed to protect the environment and to maintain the countryside” – this is very important tool for supporting the adoption of organic farming, as well other pollution control techniques such as uncultivated buffer strips, conversion of arable to pasture land and the introduction of more diverse crop rotations.
While the four DRB countries (Czech Republic, Slovakia, Hungary and Slovenia) joining the EU in 2004 will shortly be implementing national agri-environment programmes, two DRB countries (Romania and Bulgaria) are unlikely to join the EU until at least 2007. In these latter countries, financial assistance is also available for developing and implementing “pilot” agri-environment measures with SAPARD co-funding – the Special Pre-accession Programme for Agriculture and Rural Development. Additionally, following agreement on proposals arising from the recent Mid-term Review of the CAP a new “meeting EU standards” measure will be introduced to “help farmers adapt to the introduction of demanding standards based on EU legislation…concerning the environment, public, animal and plant health, animal welfare and occupational safety”. This is potentially a very useful tool for reducing pollution and some of the acceding countries are proposing to make extensive use of it to improve manure storage and management facilities on farms. Developing the EU Concept of “Cross Compliance” The concept of cross-compliance in agriculture (setting conditions which farmers have to meet in order to be eligible for direct government support) has been growing in importance since the 1970s. After many years of debate it is now also seen as an important policy tool in the EU to help improve standards in farming and protect the environment. The “Agenda 2000” reform of the CAP introduced cross-compliance for the first time as a key policy instrument for improving the environmental performance of farmers in the EU by: a) allowing Member States to attach environmental conditions to the so-called ‘First Pillar’ of the
CAP, and; b) requiring Member States to define verifiable standards of Good Farming Practice (GFP) for
farmers to follow before they could certain receive funds under the Rural Development Regulation (No. 1257/1999) - the so-called ‘Second Pillar’ of the CAP.
UNDP/GEF Danube Regional Project 6
Member States showed relatively little interest in the option for voluntary cross-compliance introduced in the original “Agenda 2000” CAP reform. In most countries it was not adopted at all, in others it appears only to have been used to address very specific environmental problems e.g. limits on pesticide use in maize in the Netherlands. The June 2003 Mid-term CAP reform package however now obliges all Member States to have a system of cross compliance in place for all direct support schemes from January 2005 in accordance with the revised ‘Common Rules’ Regulation 1782/2003. Good Practice for Improving the Management of Fertiliser and Manures In order to reduce the risk of diffuse pollution by nutrients (N and P) from agriculture it is necessary to encourage practical farm management techniques that minimise the opportunities for nutrients to accumulate in a form that is susceptible to loss. By using current and evolving scientific knowledge it is possible to develop simple practical guidelines for the management of the nutrient inputs most commonly used by farmers – namely mineral fertilisers and manures. These should be applicable to all farmers at little or no cost thereby minimising the need for financial incentives – furthermore, it should always be stressed to farmers that improvements in nutrient management also means improvements in productivity, cost-effectiveness and ultimately profit. The following typical management practices are commonly promoted to reduce the risk of nitrate leaching (especially during periods of high risk, such as the autumn and winter months): 1. Ensure that fertiliser N is applied according to the crop's requirement and taking account of:
• the crop species/variety, expected yield and required quality • the natural supply of N from the soil, including N released from soil organic matter, crop residues
and applied manure/slurry 2. Avoid applications of N fertilisers and manure/slurry in autumn and very early spring when crop
requirements for N are very low 3. Limit the application rate of organic manure/slurry to ensure that N supply does not exceed crop
requirements – this includes applying in smaller quantities at regular intervals to match more closely the crops requirement for nutrients during the growing season
4. Take special care when applying fertilisers and manure/slurry on fields where there is a risk of run-off to surface waters
5. When applying fertilizers/manures, ensure that an adequate distance (a “buffer zone”) is kept away from surface waters to avoid the risk of direct pollution
6. Ensure accurate calibration of fertiliser spreading equipment to minimise the risk of excessive application
7. Minimise the period when the soil is left bare and susceptible to nitrate leaching by increasing the area sown to winter crops, cover crops and grassland, whilst decreasing the areas sown to spring crops
8. Sow winter crops early in the autumn to increase nitrate uptake prior to the onset of the winter leaching period
9. Restrict the ploughing of old grassland.since this leads to excessive amounts of nitrate being produced by the natural process of mineralisation and commonly leads to high levels of nitrate leaching
It must be remembered, however, that diffuse nutrient losses from agriculture are greatly influenced by climate, soil type, cropping system and the forms and quantity of fertiliser and manure applied. Additionally diffuse losses of P are influenced by factors such as the vulnerability of soil to erosion. The typical management practices outlined above must therefore always be elaborated and expanded upon according to different national – and ideally regional/local – contexts. Technological and scientific developments will also play a major role in continuing to improve the efficiency of nutrient use in agriculture – for example, the use of high technology for targeting fertiliser inputs in cereal production through the use of so-called “precision farming techniques” offers considerable opportunity to both improve the efficiency and profitability of fertiliser use, as well further reduce nutrient losses. But for the moment such technology remains very capital intensive and beyond the reach of most farmers.

Inventory of Mineral Fertiliser Use in the Danube River Basin Countries 7
The important thing is to ensure that the practical guidance developed for “good practice” is flexible and pragmatic – this is likely to involve the combination of both new technologies and more traditional nutrient conserving techniques such as those outlined above. Recommendations for Policy Reform in DRB Countries Despite the relatively low levels (compared to many EU Member States) of mineral fertiliser and manure currently applied to agricultural land in the central and lower DRB region, national governments should take seriously the risk of diffuse pollution arising from fertiliser and manure application. The following objectives relating to fertiliser and manure application are recommended for all national strategies aiming to control nutrient pollution from agriculture. Comments are also included on policy instruments that should be adopted where appropriate to national context: OBJECTIVE 1: Develop greater understanding at a national/regional level of the relationship
between agricultural practice (fertiliser, manure and land management) and the risk of diffuse nutrient pollution
1.1 Establish progressive and well-funded research programmes – whilst scientific understanding
of nutrient losses from agricultural land and the related transport processes to ground and surface waters has increased in recent years this cannot be applied uniformly across the DRB for the development of good/best practice. Country/regional specific guidance for farmers must be based upon an understanding of the behaviour of nutrients in the specific agronomic, environmental and socio-economic context of each country. For example: • the nutrient content of animal manures need to be quantified to aid more precise application • the nutrient losses from different components of the farm system to be measures and the
causes of these losses established • the underlying soil processes affecting nutrient availability (e.g. soil mineralisation) need to be
better understood OBJECTIVE 2: Develop appropriate policy instruments and institutional arrangements for
promoting better management of fertilisers and manures 2.1 Raise Farmer Awareness of Good Practice - simple and easy to understand information
materials, combined with well-targeted publicity campaigns, can be very effective at raising farmers’ awareness of the importance of improving the management of fertilisers and manures – a key message to communicate is that better nutrient management increases productivity, saves money and improves profitability.
2.2 Develop and Promote National Codes of Good Practice – national authorities should agree upon clear and simple codes of voluntary good practice for fertiliser and manure management. This should be specific to national context and ideally linked to/derived from progressive and well-funded research programme (see 1.1 above)
2.3 Use Economic Instruments to Promote Good Practice – where government schemes are providing support to farmers then the principle of “environmental cross-compliance” can be applied. This involves the establishment of certain conditions that farmers have to meet in order to be eligible to receive government support and can easily be adapted to the promotion of good practice for fertiliser and manure management. Additionally, payments to farmers from agri-environment schemes (where implemented) can be conditional upon certain standards for fertiliser and manure management. Appropriate financial disincentives might also be developed.
2.4 Develop Appropriate Extension Capacity – agricultural extension services play a key role in raising awareness and improving the technical skills of farmers with respect to good practice for fertiliser and manure management, however they often require support in developing the necessary capacity to do this. National funding should be provided for the training of advisers in good

UNDP/GEF Danube Regional Project 8
practice and modern extension techniques, as well as the development of appropriate institutional frameworks for extension services (including the link to progressive and well-funded research programmes – see 1.1 above)
OBJECTIVE 3: Promote certified organic farming and other low input farming systems as
viable alternatives to the conventional use of fertilisers 3.1 Raise Farmer Awareness – alternative farming systems, such as organic farming, should be
actively promoted to farmers through the preparation of simple and easy to understand information materials. Organic farming is the most well-developed of all alternative farming systems and has good potential to reduce nutrient losses through the avoidance of the most soluble forms of mineral fertiliser, more rational use of manures and use of more diverse crop rotations (e.g. increased winter crop cover) - whilst also contributing to the reduction of pesticide pollution etc.
3.2 Develop Relevant Legislation – national legislation for the certification and inspection of organic farming systems in compliance with internationally recognised standards (particularly those in accordance with EC legislation) should be developed and implemented as a high priority in order to promote the development of domestic markets and international trade
3.3 Develop Appropriate Extension Capacity – agricultural extension services and farm advisers play a fundamental role in the re-orientation of farmers towards alternative production systems, particularly those such as organic farming, which require higher levels of technical knowledge and management. National funding should be provided for the development of appropriate extension capacity as 2.4 above
3.4 Use Economic Instruments to Promote Organic Farming – farmers converting to organic farming techniques can incur certain additional costs associated with reductions in input, establishment of new crop rotations, adoption of new technologies etc. These costs can be a significant obstacle to farmers deciding making the transition from a conventional farming system. Where funds are available, national authorities should encourage farmers to convert to organic farming by offering appropriate levels of compensatory payment. Since organic farmers often have problems to sell or export their products, the marketing of organically-grown products should also be supported by governmental campaigns and action.

Inventory of Mineral Fertiliser Use in the Danube River Basin Countries 9
Introduction Overview Modern agricultural production systems have developed by making widespread use of mineral fertilisers to replace the traditional reliance upon crop rotations and animal manures to maintain and enhance soil fertility and support profitable crop production. The two most important plant nutrients applied as mineral fertilisers are nitrogen (N) and phosphorus (P). Both occur naturally in the soil and are essential for crop growth. N occurs within the soil in the simple ionic forms of ammonium (NH4
+) and nitrate (NO3-) which
plants can easily absorb and utilise. Of the elements essential for plant growth, N is required in the greatest quantity by agricultural crops. The exception to this rule-of-thumb being those crops which form large underground storage organs, notably potatoes, since these also require large quantities of P and potassium (K). However, as well as being the most important crop nutrient in agriculture, N is also a potential environmental pollutant since when found in the wrong place, at the wrong time and in the wrong form, N can cause significant ecological disturbance and, in certain circumstances, may possibly pose a hazard to human health. The dominant feature of the behaviour of P in the soil is its strong adsorption to the surfaces of soil particles and until 20-30 years ago it was thought that P was held so strongly in the soil that its significance as a cause of water pollution was negligible. However, it is now understood that phosphate pollution is a major contributing factor to the occurrence of eutrophic waters, algal blooms and other ecologically-damaging effects. Furthermore, agricultural land is increasingly recognised to be one of the largest non-point sources of P reaching surface waters. Both N and P are transient in the soil and the amounts available in the soil at any time to meet the needs of a growing crop are the product of a network of physical, biological and chemical pathways through which N and P move – the so-called N and P “cycles”. N and P can enter the soil in a number of ways and in a number of different forms. In modern agriculture it has become broadly accepted that the N and P content of the soil should be regularly supplemented with mineral fertilisers and this has become common practice where N and P fertilisers can be easily afforded by farmers. The most commonly used mineral fertilisers containing N and P are listed in Table 1. Table 1: N- and P-containing Chemicals and Materials Commonly Used in Mineral Fertilisers Chemicals/Materials N Content (%) P Content (%) “Straight” Fertilisers Ammonium sulphate 21 Ammonium nitrate 35 Calcium nitrate 17 Urea 46 Anhydrous ammonia 82 Aqueous ammonia 25-29 Rock phosphate 14-17 Triple superphosphate 19-23 “Compound” Fertilisers Mono-ammonium phosphate 11-12 26 Di-ammonium phosphate 18-21 23

UNDP/GEF Danube Regional Project 10
Aim of this Report The aim of this report is to develop an inventory of fertiliser market products for the central and lower DRB on a country-by-country basis and to review their typical use, misuse and potential for reduction of environmental impact. Additionally reference is made to animal manures and land management practices where these relate to the management of crop nutrients and minimising the risk of water pollution by diffuse losses from agricultural land. The DRB Context The collapse of the centrally-planned economies of central and eastern Europe in the early 1990s caused a social and economic crisis that profoundly affected agriculture in the central and lower Danube River Basin (DRB). The market situation changed drastically, with average consumer income decreasing, causing a lowered demand for agricultural products. In addition, important foreign markets, such as the former Soviet Union, were lost. At the same time, large-scale restructuring of the agricultural sector occurred. Land was privatised and most of the collectivised/state farm structures were dismantled. However, in many of the former communist DRB countries the registration of new landownership progressed only slowly (e.g. due to the complexities of the privatisation process, poor management, disputes etc.), adding to the uncertainties of the individual farmer. The economic crisis also put pressure on national budgets. As a result, state support to the agricultural sector was reduced drastically. To make things worse, capital and credit facilities were lacking in the private sector. These changes inevitably led to a significant reduction in agricultural productivity in the region, including a decline in the use of external inputs such as mineral fertilisers2. Reliable data on mineral fertiliser use in the central and lower DRB region are not available for the decades leading up to 1990. However, the limited data available from the FAOSTAT database shows that after rising strongly for three decades the use of N fertilisers (kg N/ha) by farmers in the former communist DRB countries dropped by approximately 50% around the year 1990 and is now far below the EU average (Figure 1). The decline in fertiliser use was more severe in some countries than others – in Bulgaria, the average application rate of fertiliser N fell from 109.9 kg N/ha in 1981 to 29.9 kg N/ha in 1999. Similar declines can also be observed for phosphate (P) and potash (K) use – again in Bulgaria, the average application rate of P and K fell from 90.2 kg P2O5/ha and 26.8 kg K2O/ha in 1981 to 2.2 kg P2O5/ha and 1.2 kg K2O/ha in 19993. In all countries, the reduction in the use of mineral fertilisers was the result of economic necessity rather than environmental awareness. The lack of working capital on new private holdings and remaining collective farms made it difficult to buy in more than the minimum of farm inputs. For most farmers, the low level and fluctuation of agricultural product prices, as well as uncertainty over land ownership, have it made it advisable to operate with a minimum of costs since there is no guarantee of any returns on investment, including farm inputs. At the same time, significant changes also occurred in livestock production. The de-collectivisation and privatisation of the state-controlled animal breeding complexes was particularly dramatic in many DRB countries and led to a significant decline in livestock numbers by approximately 50% in most countries, as well as a major change in the way that farm animals are kept. For example, when state-controlled dairy units were liquidated cattle were commonly distributed amongst former employees. However, new owners were short of facilities for keeping cattle, feed was expensive and land was not easy to buy or lease ahead of the land restitution process. These circumstances were not favourable to the formation of new dairy farms and many cattle were sold for slaughter.
2 “Mineral fertilisers“ are defined as nutrient-containing fertiliser products which have been manufactured for sale to farmers
3 Data supplied by the National Statistical Institute, Sofia

Inventory of Mineral Fertiliser Use in the Danube River Basin Countries 11
Figure 1: Long-term trends in nitrogen fertiliser use (kg N/ha) in selected central and lower DRB countries and EU Member States4
0
10
20
30
40
50
60
70
80
1961 1964 1967 1970 1973 1976 1979 1982 1985 1988 1991 1994 1997
kg/h
a
C EECs EU 15
Source: FAOSTAT - database of the UN Food and Agriculture Organization. With the decline in livestock numbers there has also been a decline in the availability of manure as a traditional source of crop nutrients. When taken together with the reduced use of mineral fertilisers, this has resulted in a decline in the nutrient balance5 of many agricultural soils in the middle and lower DRB countries to the point that many agricultural scientists in the region are concerned that farmers are now relying upon the fertility reserves of the soil to maintain their relatively low levels of crop yield. The long-term changes in the N balance/surplus (kg N/ha) of agricultural areas in selected DRB countries are shown in Figure 2 below. All the countries shown are characterised by a slow long-term increase in N balance from the 1950s/1960s until the end of the 1970s – the period of most rapid intensification of agricultural production in most European countries. Depending upon the original starting level, the N balance/surplus observed in most countries reached a relatively high, but stable plateau in the 1980s. During the 1990s, however, the changes in N balance/surplus observed are very different between: • the gradual decline seen in the upper DRB countries of Germany and Austria, and • the dramatic fall of 40-50 kg N/ha seen within a few years in the former communist countries of the
central and lower DRB. Changes in N balance/surplus are commonly used as an indicator to highlight areas potentially at risk from pollution6 – consequently the observed fall in N balance in the countries of the central and lower suggests a significant reduction in the risk of surplus N being lost from agricultural land to the wider
is limited to the following
indicator and calculate the ures, biological N fixation,
e products) per hectare of y, while a large surplus
n cator of loss of nitrogen to
s, plus any change in the
4 Due to limited data availability, the description of the trend in N fertiliser consumptionDRB countries: Bulgaria, Czech Republic, Hungary, Romania and Slovakia
5 Nutrient balances (particularly nitrogen balances) are a key agri-environmentalbalance between nutrients added to an agricultural system (fertilisers, livestock manatmospheric deposition etc.) and nutrients removed from the system (marketablagricultural land. A deficit (negative balance) suggests that the system is losing fertilit(large positive balance) indicates the risk of nutrient loss and therefore potential pollutio6 Although the calculation of N surplus cannot be immediately interpreted as an indiwater. The balance between inputs and outputs for a system contains all potential lossestore of nitrogen, principally within the soil. The potential loss pathways for nitrogen are:• to air as ammonia by direct volatilisation after spreading of manure on the field • to air as nitrous oxide and nitrogen gas by denitrification • to groundwater by nitrate leaching and in organic compounds • to rivers and lakes through run-off after heavy rainfall

UNDP/GEF Danube Regional Project 12
environment, notably by nitrate leaching. Figure 2: Long-term changes in the N balance (kg N/ha) of agricultural areas in selected DRB
countries (including Austria and Germany – Bavaria and Baden-Wuerttemburg only) Source: Various – compiled by Schreiber et al. (2003)7 Table 2 further presents the most recent calculations (1998-2000) of N balance/surplus for all national territories falling within the DRB together with the agricultural area of each country within the catchment and the estimated N loss by diffuse pollution (tonnes N/year) from this agricultural area. The national territories are divided between the upper DRB countries (Germany and Austria) that are not the subject of this project and the middle/lower DRB countries that are under study. Within each category the countries are ranked according to estimated N balance/surplus. There is a wide variation in the estimated N balances of the agricultural areas of the central and lower DRB countries ranging from 73.6 kg N/ha in Slovenia to 11.9 kg N/ha in Serbia & Montenegro. Furthermore the countries fall into two distinct groups that currently suggest there is: • the highest potential risk of N losses, such as nitrate leaching, occurring from agricultural land in
the territories of Slovenia, Czech Republic and Croatia – although the N surplus in these countries is less than in Germany and previously reported in other EU Member States (e.g. national N surpluses for farmland in Luxembourg and the Netherlands were estimated to be 121 and 213 kg N/ha respectively in 19958)
• a lower risk of N loss from the remaining countries all of which have N surpluses estimated to be less than 25 kg N/ha.
7 Schreiber, H. et al. (2003). Harmonised Inventory of Point and Diffuse Emissions of Nitrogen and Phosphorous for a Transboundary River Basin. Research Report 200 22 232, Federal Ministry of the Environment, Nature Conservation and Nuclear Safety, Germany.
8 Source: EUROSTAT quoted by EEA (2000). Environmental Signals 2000. Environmental Assessment Report No.6, European Environment Agency, Copenhagen

Inventory of Mineral Fertiliser Use in the Danube River Basin Countries 13
However, this situation provides no grounds for complacency in the lower and middle DRB countries since whilst national nutrient balances are useful tools for tracking change and making comparisons between countries/national territories, they: • may hide considerable regional or local nutrient surpluses that are susceptible to high losses
particularly where they occur on vulnerable soils or where groundwater is close to the surface • do not provide any information about how well farmers are managing the (often limited) amounts
of mineral fertiliser and manure that they are applying • take no account of the risk of small point source pollution occurring from farms wherever manures
and other livestock wastes are poorly handled or stored Table 2: Summary of data (1998–2000) from the MONERIS model showing a) estimates of nitrogen
balance/surplus (kg N/ha), b) agricultural area (km2) and c) estimated nitrogen loss by diffuse pollution (tonnes N/year) for all national territories within the Danube river basin catchment
Country
Estimated N Balance (kg N/ha)9
Agricultural Area within Danube Catchment Area (km2)
Estimated N Loss by Diffuse Pollution (tonnes N/year) 10
Germany 90.9 32 839 75 553Upper DRB
Countries Austria 44.0 29 639 28 900
Slovenia 73.6 6 153 10 629Czech Republic 46.8 13 054 16 314Croatia 39.2 18 011 14 886
Slovakia 23.9 23 890 16 702Hungary 21.9 66 400 8 700Romania 21.5 112 931 68 366Moldova 19.1 11 474 2 113Bulgaria 16.8 35 946 18 197Bosnia & Herzegovina 15.9 13 778 7 332Ukraine 15.7 19 433 13 976
Middle and Lower DRB Countries
Serbia & Montenegro 11.9 46 686 10 487 Other 296 388 TOTALS 430 530 km2 292 543 t N/year Source: Schreiber et al. (2003)11 and personal communication with the MONERIS project, IGB Berlin
9 Nutrient balances for the Danube river catchment were prepared for the MONERIS model using the standard OECD soil surface nitrogen balance methodology with crop and livestock data supplied by national consultants for selected countries. Where these data were not available, figures from the OECD and FAO databases were used 10 The total contribution of agricultural non-point source pollution to nutrient emissions into the Danube river is estimated by the MONERIS model (IGB Berlin) as the sum of losses via Surface Run-off, Erosion, Tile Drainage and Groundwater less Background losses
11 Schreiber, H. et al. (2003). Harmonised Inventory of Point and Diffuse Emissions of Nitrogen and Phosphorous for a Transboundary River Basin. Research Report 200 22 232, Federal Ministry of the Environment, Nature Conservation and Nuclear Safety, Germany.

UNDP/GEF Danube Regional Project 14

Inventory of Mineral Fertiliser Use in the Danube River Basin Countries 15
Methodology Due to the limited availability of data sources on mineral fertiliser use in the region, national experts in each of the DRB countries under study were asked to undertake a survey of: 1. amounts of mineral N and P fertilisers typically applied in their won country and how they are
used (e.g. what crops are they applied to) 2. any information available on bad practice by farmers regarding the use of these fertilisers A simple questionnaire approach was used that took the experts through 4 key steps (See Annex 1): Step 1 – identification of the types of N and P mineral fertiliser (including the nutrient-containing chemicals and materials) that are commonly used in agriculture and horticulture. Step 2 – estimation of the total consumption of N and P mineral fertilisers by farmers for the years 1997 - 2002. All data collected was for the amount of nutrient (N or P) not the amount of fertiliser product/chemical (for example, 1 tonne of ammonium nitrate typically contains only 345 kg of nitrogen) Step 3 – collection of information on the characteristics of N and P mineral fertiliser use by farmers, including: • approximately what percentage of the crops grown currently have mineral fertilisers applied to
them • the current average or “typical” application rate (kg per ha) for N and P fertilisers • the typical time of fertiliser application (e.g. in autumn or spring) Step 4 – identification of problems relating to the use of mineral fertilisers, including known “bad practice” such as: • using application rates that are higher than recommended rates (unlikely in many countries) • poor application due to old or poorly maintained equipment • spreading too closely to water sources e.g. streams and rivers • applying mineral fertiliser at an inappropriate time of year (i.e. when the crop is not growing) The results of the survey and the inventories prepared for each country are included in Annexes 2 – 12 of this report.

UNDP/GEF Danube Regional Project 16

Inventory of Mineral Fertiliser Use in the Danube River Basin Countries 17
Use of Mineral Fertilisers in the 11 Central and Lower DRB Countries A range of mineral fertiliser products containing nitrogen (N) and phosphorus (P) are available to farmers in DRB countries – those products typically being used by farmers are summarised in Table 3. There are no consistent patterns to the products being, except to say that the most commonly used products in any country are inevitably those that are locally the cheapest such as ammonium nitrate, calcium ammonium nitrate (CAN) and urea. Figure 3 shows the annual total consumption (millions tonnes) of N and P mineral fertilisers in all DRB countries under study during the period 1997 – 2002. Whilst there has been little change in total P fertiliser use, there appears to be a discernable trend towards increasing N fertiliser consumption with an 18% increase between 1997 and 2002. However, this aggregate increase obscures: • a 30% increase in total N fertiliser consumption in the 4 DRB countries preparing for EU
accession – either as the result of more land being fertilised by farmers and/or an increase in fertiliser application rate (i.e. farmers applying more fertiliser N per hectare).
• reductions of up to 50% in total N fertiliser consumption in some of the other central and lower DRB countries, including Romania, Ukraine and Serbia & Montenegro
The existing trend towards increasing fertiliser N consumption in the 4 acceding countries is a cause for concern since it is likely to be reinforced by EU enlargement and the implementation of the Common Agricultural Policy (CAP) leading to increasing areas of cereals and oilseeds being grown due to the availability of EU direct payments; increased intensification of crop production, particularly in the more favourable areas with better growing conditions, and a possible reduction in mixed cropping due to an increase in large-scale cereal monocultures. Detailed information from the survey of typical fertiliser use is included in Annexes 2 – 12, but Table 4 summarises the results for N fertiliser use on wheat – a crop that is commonly grown in all DRB countries. The results show a wide variety of typical practices with some surprisingly high application rates reported in certain countries (e.g. CS!) – however there appear to be 3 basic groups of typical fertiliser practice: • virtually all of the crop area receives relatively high N application e.g. HR and HU • virtually all of the crop area receives moderate N application e.g. SI and SK • significant proportion of the crop areas receives no N application and the remaining crop areas
receives small or moderate N application e.g. RO and MD

UNDP/GEF Danube Regional Project 18
Table 3: Types of N and P Fertiliser Commonly Used by Farmers in DRB Countries (Note that the most commonly used fertiliser products for each country are marked with ) Fertiliser Type % N/P DRB Country BH BG HR CZ HU MD RO SK SL UA CS Straight N Fertilisers: Ammonium sulphate 21% N Ammonium nitrate 30-35% N Calcium nitrate 15% N Calcium ammonium nitrate 27% N Urea 46% N Anhydrous ammonia 82% N Aqueous ammonia 25-29% N Other Straight P Fertilisers: Rock phosphate Superphosphate < 25% P2O5 Concentrated superphosphate > 25% P2O5 Calcium phosphate Other Compound N-P-K Fertilisers:
Mono-ammonium phosphate Di-ammonium phosphate Other
Figure 3: Annual total consumption of N and P (thousand tonnes nutrient/year) as fertiliser products in
the central and lower DRB countries (1997 - 2002)
0
200
400
600
800
1000
1200
1997 1998 1999 2000 2001 2002
Year
Tota
l Fer
tilis
er U
se
(thou
sand
tonn
es n
utrie
nt/y
ear)
Total N fertiliser use Total P fertiliser use
Source: Data submitted by GFA National Experts Table 4: Summary of typical fertiliser use on wheat in central and lower DRB countries

Inventory of Mineral Fertiliser Use in the Danube River Basin Countries 19
Country
Crop Receiving N Fertiliser
Typical Application (kg N/ha)
Typical Timing of Application
Comments
BH 50-60% 95-160 Autumn* & spring Typical NPK fertiliser to apply in the seed-bed
is 15:15:15 followed by to-dressing with CAN or urea in spring
BG 78% 86 Autumn* & spring 2001/2002 data HR 95-100% 100-120 Autumn* & spring CZ 98% 90 Spring HU 95% 100-110 Autumn* & spring MD 60-75% 35-55 Spring RO 45% 30-66 Autumn* Typical NPK fertiliser where used is 45:23:0.5 SK 90-100% 40-90 Mostly spring SI 90% 40-60 Autumn* & spring UA 60% 33 Spring CS 95% 250 Spring * for winter wheat

UNDP/GEF Danube Regional Project 20

Inventory of Mineral Fertiliser Use in the Danube River Basin Countries 21
Problems Associated with Mineral Fertilisers, Manure Application and Land Management in the DRB Countries The total amounts of mineral fertiliser applied to agricultural land are certainly an important consideration in assessing the environmental impact of agriculture upon water quality and there is also little doubt that the reduction in fertiliser use in the central and lower DRB countries has contributed to a reduction in nutrient losses. However, the environmental impact of fertiliser use is also closely related both to: c) the way in which farmers apply fertilisers to their crops and d) the overall management of their farming system In particular, the changes in management practice required to optimise the use of mineral fertilisers and avoid their misuse are related to the application of manure and slurry to agricultural land, as well as other soil management practices such as cultivations. Typical problems and “bad practice” identified by the GFA national experts during preparation of the national fertiliser inventories (Annexes 2 - 12) included: • there is a widespread ignorance of ideas such as “pollution” or environment” amongst farmers and
no information on the importance of managing fertilisers and manures properly • farmers often consider manure as a “waste product” rather than a source of nutrients that should be
used carefully to save money spent on fertilisers • the agricultural workforce often consists of more elderly people familiar only with previous
farming methods and who have little (if any) agricultural education and do not understand the importance of applying fertilisers and manures correctly to the soil
• the machinery used for spreading fertilisers is outdated and not appropriate for the modern agricultural operations – consequently application is uneven and commonly results in areas of “under” and “over”-fertilisation. Farmers do not have the knowledge or experience to adjust/operate the equipment correctly
• many cheaper mineral fertilisers are only “milled” and during storage become compacted again which makes uniform spreading very difficult
• fertilisers and manures are commonly stored in unauthorised places where there is a risk of causing pollution
• there is a tendency in some areas for farmers to grow the same crop (or same simple rotation of crops) for many years without application of fertiliser or manures. This is leading to a serious decline in soil fertility and the risk of increasing soil erosion due to loss of soil organic matter
• farmers do not consider the nutrient requirements of the crops they are applying fertilisers (and manures) to
• it is not very common for farmers to practice soil testing before deciding where to apply fertilisers and manures and in what quantities
• farmers and agronomists do not sufficiently recognise the potential value of nutrients in livestock manure. Consequently the application rate of fertilisers is not adjusted and nutrients are wasted because they are surplus to the crop’s requirement
• bad timing of fertiliser application is a common problem, especially when applying large amounts of fertiliser to higher value crops such as vegetables and potatoes. There are many reasons for this including poor knowledge and no access to agronomic advice, but also lack of necessary equipment when needed
• application of nitrogen to soil in autumn before planting a spring crop is common practice in some countries. It is not understood that the nitrogen can be lost over winter. Spreading fertiliser and manure to frozen and snow covered ground is also common in some countries

UNDP/GEF Danube Regional Project 22
• over-application of fertiliser N at the time of sowing a crop is a common problem • compound fertilisers are often applied with inappropriate balance of nutrients and there is
tendency to under-fertilise with P and K • nitrate losses from agricultural land are associated with farming practice not just the rate of
fertiliser or manure application – factors that continue to contribute to high levels of nitrate leaching are poor timing of application, regular cultivations and the ploughing of grassland, legumes and other crop residues
• fertilisers (and manures) are spread too closely to surface waters – rivers, lakes, ponds, streams and springs
• fertilisers (and manures) are spread on sloping land where there is the risk of surface run-off from heavy rain washing them into nearby rivers and streams
• even though the number of farm animals has declined and the quantity of animal wastes produced is less, most farmers do not have good storage facilities for manure and slurry – therefore manures and slurries are being applied at inappropriate times (e.g. autumn and winter) when there is a high risk of leaching or run-off
• because of simplified tax systems in many countries for households and private agricultural plots, including small farms, there is no official obligation for them to have a book-keeping system. As a result they do not keep records of their purchases or use of fertilisers, manures or other relevant information (e.g. crop yields or sales) and there is therefore no reliable information regarding application of fertilizers

Inventory of Mineral Fertiliser Use in the Danube River Basin Countries 23
Potential for Policy Reform in EU Context As noted in the other summary reports, this review of fertiliser use is undertaken during a period of great change in the Danube River Basin (DRB) with 4 countries (Hungary, Czech Republic, Slovakia and Slovenia) in the final stages of preparation for accession to the EU in 2004 and 2 countries (Bulgaria and Romania) preparing for EU accession sometime after 2004. The policy-making context for agricultural pollution control in the DRB is therefore undergoing significant change and preparation for joining the EU is currently a major driving force for the reform of agricultural pollution control policies in the region. Adoption of EU Legislation In the European Union, there are three Directives that address the problem of excess nutrient losses from agriculture (Table 5): • Directive 80/68/EEC on the protection of groundwater against pollution caused by certain
dangerous substances (the Groundwater Directive) • Directive 91/676/EEC concerning the protection of waters against pollution caused by nitrates
from agricultural sources • Directive 2000/60/EC establishing a framework for Community action in the field of water policy
(the Water Framework Directive) Table 5: Summary of Legislation Addressing Nutrient Losses from Agriculture in the EU Title of Legislation Obligations Directive 80/778/EEC on the quality of water intended for human consumption (the Drinking Water Directive) – to be replaced by Directive 98/83/EC from 2003
• The Drinking Water Directive (80/778) lays down standards for the quality of water intended for drinking or for use in food and drink manufacture in order to protect human health.
• The Directive does not impact upon farmers directly, but sets a maximum admissible concentration of nitrate in drinking water supplies of 50 mg per litre that water suppliers must comply with. This requires the use of water treatment in some areas to ensure that drinking water supplied is acceptable.
Directive 91/676/EEC concerning the protection of waters against pollution caused by nitrates from agricultural sources
• The objectives of the directive are to ensure that the nitrate concentration in freshwater and groundwater supplies does not exceed the limit of 50 mg NO3- per litre as imposed by the EU Drinking Water Directive (above) and to control the incidence of eutrophication.
• Having set the overall targets, the directive requires individual Member States to draw up their own plans for meeting them, including: Drawing up a Code of Good Agricultural Practice Designating zones vulnerable to pollution by nitrates Establishing and implementing Action Programmes within these zones to prevent further nitrate pollution
Directive 2000/60/EC establishing a framework for Community action in the field of water policy (the Water Framework Directive)
• The Water Framework Directive (WFD) has the overall environmental objective of achieving 'good water status' throughout the EU by 2010 and for it to be maintained thereafter. It sets out to establish a Community framework for the protection of surface and ground waters across the EU through a common approach, objectives, principals and basic measures.
• The WFD establishes the river basin as the primary administrative unit for the purposes of water management. The Directive will have widespread and significant impacts. It brings together much of the existing water legislation into an overall framework establishing broad ecological objectives for water and provides an administrative framework to achieve these.
• This Directive places no direct obligation on farmers, but they influence the standards that must be met by them.

UNDP/GEF Danube Regional Project 24
Of these, only the Nitrate Directive 91/676 currently places any direct obligation upon farmers and for over a decade has effectively promoted a variety of good practices for reducing diffuse nitrate pollution by nitrates through a variety of good agricultural practices, including good practices in fertiliser and manure application. The objectives of the Directive are two-fold: i) to reduce water pollution caused or induced by nitrates from agricultural sources and; ii) to prevent further pollution occurring. The Directive requires EU Member States to identify waters affected by nitrate pollution (as well as waters which could be affected) and to designate the areas draining into these as Vulnerable Zones. Within these zones, the Member States must draw up Action Programmes for the reduction of nitrate leaching – these Action Programmes must contain certain mandatory measures such as limit upon the maximum amounts of manure that can be applied to farmland every year. Member States are also required to establish at least one Code of Good Agricultural Practice which is implemented on a voluntary basis outside the Vulnerable Zones, and is mandatory within them. Annex II of the Nitrate Directive, provides guidance on what a code of good agricultural practice should contain. It requires that all codes should contain measures (where relevant) addressing 6 key issues: 1. periods when land application of fertilizer is inappropriate 2. the land application of fertilizer on steeply sloping ground 3. the land application of fertilizer on water-saturated ground, flooded, frozen or snow-covered
ground 4. the land application of fertiliser near water courses 5. the capacity and construction of storage vessels for livestock manures and other liquid farm
wastes, such as effluent from silage 6. procedures for the land application (including rate and uniformity) of both chemical fertilizer and
animal manure that will maintain nutrient losses to water to an acceptable level Additionally, the Directive suggests that Member States may also include in their code(s) of good agricultural practice additional measures that address the following 4 issues: 7. land use management, including the use of crop rotation systems and the proportion of the land
area devoted to permanent crops relative to annual tillage crops 8. maintenance of minimum quantity of vegetation cover during rainy periods that will take up the
nitrogen from the soil that could otherwise cause nitrate pollution of water 9. the establishment of fertilizer plans on a farm-by-farm basis and the keeping of records on
fertilizer use 10. the prevention of water pollution from run-off and downward water movement beyond the reach
of crop roots in irrigation systems. Unfortunately, the Nitrates Directive has consistently failed to meet its environmental objectives and has suffered from both considerable resistance by the EU agricultural community and poor implementation by many Member States12. One problem has been the lack of appropriate tools – particularly economic instruments - to support implementation of the Directive. For example, Member States have not been able to offer farmers agri-environment payments to encourage them to meet the obligatory reductions in fertiliser application required in designated “nitrate vulnerable zones” under the Nitrate Directive because EU rules currently prevent agri-environment payments being made to farmers for complying with the requirements of EU legislation. It is now hoped that similar rules will not be applied to implementation of the Water Framework Directive 2000/60 since this will significantly limit its ability to promote the use of economic instruments available under the CAP to reduce the risk of nutrient losses from agricultural land and promote the improvement of water quality.
12 European Commission (2002). Implementation of Council Directive 91/676/EEC concerning the protection of waters against pollution caused by nitrates from agricultural sources: Synthesis from year 2000 Member States reports. Report No. COM(2002) 407 final, Brussels, 17.07.2002

Inventory of Mineral Fertiliser Use in the Danube River Basin Countries 25
Opportunities for Implementing the Water Framework Directive The Water Framework Directive (WFD) was adopted in December 2000 and arises out of a long debate concerning the limitations of existing EU water legislation – the existing body of legislation was criticised for being too fragmented, concentrating on specific aspects of environmental quality or specific threats to that quality. The Directive requires that surface waters (rivers, lakes and coastal waters) and ground waters are to be managed within the context of River Basin Management Plans13. All waters are to be characterised according to their biological, chemical and hydro-morphological characteristics. These together are to be compared with an assessment of waters unmodified by human activity and classified into different categories of ecological status. All waters are required to meet ‘good status’, except where specific derogations are applied. The means to achieve this is through the use of the River Basin Management Plans which should integrate existing EU measures to protect the water environment and identify all remaining human pressures which may result in a failure to achieve ‘good status’14. Member States are required to establish a programme of measures in each river basin appropriate to these pressures. There is now considerable debate within many Member States on what the implications of the WFD will mean for agriculture - in particular, how the Member States (including the 10 new Member States joining the EU in 2004) will use appropriate policy instruments to tackle the significant pressures upon water resources that arise from agriculture, including the risk of pollution. A potential problem in many Member States is that unlike other sectors, regulation of the agricultural sector is highly politically sensitive – a situation that arises and results from a range of socio-political and cultural factors. Many governments have therefore tended to avoid the simple imposition of environmental conditions upon farmers – even basic conditions which they would otherwise readily apply, for example, to heavy industry. The WFD requires that Member States now address this issue and consequently there is much interest in using the policy tools available in the Common Agricultural Policy (CAP) to support and implement the WFD15, including: • CAP Pillar 1 – Market Support Measures – according to the revised ‘Common Rules’
Regulation (No. 1782/2003)16, it will be obligatory for all Member States to include specific environmental requirements as a condition for farmers receiving direct support payments from the government (so-called “cross compliance”). Member States were previously reluctant to voluntarily use this policy instrument, but it could now be used for numerous aspects of water pollution control
• CAP Pillar 2 - Rural Development Measures – EU co-financed rural development programmes provide funding for several measures that support farmers, rural communities and protection of the natural environment. Some of these measures could directly contribute to the implementation of the WFD and the reduction of agricultural water pollution, particularly “investment in agricultural holdings”, “training” and “agri-environment measures”
Of all the tools of the CAP, agri-environment measures seem the most useful for supporting implementation of the WFD – however, EC rules currently prevent agri-environment payments being made to farmers for complying with the requirements of EC legislation. For example, farmers cannot be offered support payments to encourage them to meet the obligatory reductions in fertiliser application required in designated “nitrate vulnerable zones” by the Nitrate Directive. If this rule is also extended to the WFD then it will significantly limit the use of CAP Pillar 2 funding for
13 Bloch, H. (2000). EU policy on nutrients emissions: legislation and implementation. In: Wastewater and EU-Nutrient Guidelines, pp 52-59. International Water Association, London. 14 Griffiths, M. (2002). The European water framework Directive: an approach to integrated river basin management. European Water Management Online, 2002. 15 DG Environment (2003) - Working Document on The Water Framework Directive (WFD) and tools within the Common Agricultural Policy (CAP) to support its implementation 16 Council Regulation (EC) No 1782/2003 of 29 September 2003 establishing common rules for direct support schemes under the common agricultural policy and establishing certain support schemes for farmers

UNDP/GEF Danube Regional Project 26
encouraging farmers to the wide range of actions on water pollution that are necessary to achieve good ecological status, etc. No decisions have been made in relation to this issue yet. However, early indications from DG Environment suggest that it would not seek to restrict payments under agri-environment for implementing the WFD as has been done for the Nitrates Directive. Financial Incentives for Pollution Control As mentioned above, the EU Rural Development Regulation 1257/1999 (the “second pillar” of the CAP) makes provision for Member States to encourage more environmentally-friendly farming methods, including practices and actions that reduce the risk of agricultural pollution. This offers a good opportunity for supporting the control of nutrient pollution in those DRB countries joining the EU, by allowing them to develop EU co-financed schemes that: d) offer grant-aided investment (up to 50%) in agricultural holdings that helps to “…preserve and
improve the natural environment” – for example, by purchasing new manure storage facilities or purchasing more up-to-date equipment for fertiliser and manure application
e) training farmers for the “…application of production practices compatible with the maintenance and enhancement of the landscape and the protection of the environment” – this includes: • training for organic farming • training for farming management practices with a specific environmental protection objective
f) introducing agri-environment schemes that offer area payments to support “…agricultural production methods designed to protect the environment and to maintain the countryside” – this is very important tool for supporting the adoption of organic farming, as well other pollution control techniques such as uncultivated buffer strips, conversion of arable to pasture land and the introduction of more diverse crop rotations.
EU Member States began implementing the first so-called “agri-environment programmes” in the 1980s and 1990s, and today such programmes cover over 20% of all agricultural land in the EU. These programmes pay farmers to modify their farming practices in order to benefit the environment. Extensive monitoring of agri-environment programmes in EU Member States shows that they lead to significant benefits for the conservation of valuable semi-natural habitats, biodiversity, landscape, water and soil resources. The potential for agri-environment schemes to contribute to a wide range of rural development objectives, including environmental protection, is recognised by the fact that they are now the only compulsory measures for EU Member States to introduce under Regulation 1257/1999. It will therefore be obligatory upon accession for all new Member States to introduce an EU co-financed agri-environment scheme that offers payments to farmers who change their methods of farming in ways “…which are compatible with the protection and improvement of the environment, the landscape and its features, natural resources, the soil and genetic diversity” – this includes support for a range of actions contributing to the control of pesticide pollution, including the adoption of organic farming. While the four DRB countries (Czech Republic, Slovakia, Hungary and Slovenia) joining the EU in 2004 will shortly be implementing national agri-environment programmes, two DRB countries (Romania and Bulgaria) are unlikely to join the EU until at least 2007. In these latter countries, financial assistance is also available for developing and implementing “pilot” agri-environment measures with SAPARD co-funding – the Special Pre-accession Programme for Agriculture and Rural Development. Co-funding will be available for several years for similar measures to be developed and implemented in Romania and Bulgaria under the SAPARD programme – the Special Pre-accession Programme for Agriculture and Rural Development. According to the SAPARD Implementing Regulation No. 1268/1999, EU co-financing support may be provided for all the agri-environment actions described in the Rural Development Regulation No. 1257/1999.

Inventory of Mineral Fertiliser Use in the Danube River Basin Countries 27
Additionally, following agreement on proposals arising from the recent Mid-term Review of the CAP a new “meeting EU standards” measure will be introduced to “help farmers adapt to the introduction of demanding standards based on EU legislation…concerning the environment, public, animal and plant health, animal welfare and occupational safety”. This is potentially a very useful tool for reducing pollution and some of the acceding countries are proposing to make extensive use of it to improve manure storage and management facilities on farms. Developing the EU Concept of “Cross Compliance” The concept of cross-compliance in agriculture (setting conditions which farmers have to meet in order to be eligible for direct government support) has been growing in importance since the 1970s. After many years of debate it is now also seen as an important policy tool in the EU to help improve standards in farming and protect the environment. The “Agenda 2000” reform of the CAP introduced cross-compliance for the first time as a key policy instrument for improving the environmental performance of farmers in the EU by: c) allowing Member States to attach environmental conditions to the so-called ‘First Pillar’ of the
CAP, and; d) requiring Member States to define verifiable standards of Good Farming Practice (GFP) for
farmers to follow before they could certain receive funds under the Rural Development Regulation (No. 1257/1999) - the so-called ‘Second Pillar’ of the CAP.
Member States showed relatively little interest in the option for voluntary cross-compliance introduced in the original “Agenda 2000” CAP reform. In most countries it was not adopted at all, in others it appears only to have been used to address very specific environmental problems e.g. limits on pesticide use in maize in the Netherlands. The June 2003 Mid-term CAP reform package however now obliges all Member States to have a system of cross compliance in place for all direct support schemes from January 2005 in accordance with the revised ‘Common Rules’ Regulation 1782/200317. “First Pillar” Cross Compliance Discussions are currently underway in Member States on how to implement the new obligations for “first pillar” cross compliance which require that the full payment of direct support schemes under the CAP must be linked to compliance with rules relating to the management of agricultural land and production activities. Most Member States have not yet (December 2003) established a formal position or initiated consultations on “first pillar” cross compliance, but are waiting for clearer guidance from the European Commission in the form of an Implementing Regulation (this is not expected until spring 2004). However, it is clear from Regulation 1782/2003 that there are two general obligations upon Member States: A. Statutory Management Requirements
There are a total of 18 Directives listed in Annex III of Regulation 1782/2003 on the environment, public, plant and animal health and animal welfare. Member States are required to ensure that all farmers receive a list of statutory management requirements for fulfilling obligations under these Directives. Eight of these Directives have to be implemented from 1 January 200518, a further seven from 1 January 2006 and the remainder from 1 January 2007. This will require the development of appropriate verifiable standards, as well on-the-spot checks to ensure compliance with the management requirements.
17 Council Regulation (EC) No 1782/2003 of 29 September 2003 establishing common rules for direct support schemes under the common agricultural policy and establishing certain support schemes for farmers 18 Those relating to the environment are Directives 79/409/79 on conservation of wild birds, 80/68/79 on protection of groundwater, 86/278/86 on sewage sludge, 91/676/91 on nitrates and 92/43/92 on conservation of habitats

UNDP/GEF Danube Regional Project 28
B. Good Agricultural and Environmental Condition
Annex IV of the revised Common Rules Regulation requires Member States to ensure that land is maintained in good agricultural and environmental condition, especially land no longer used for production purposes. Member States must decide how they will define Good Agricultural and Environmental Condition (GAEC) as set out in Annex IV. Appropriate standards can be set for maintaining GAEC at national or regional level, and must take into ‘account ‘the specific characteristics of the areas concerned, including soil and climatic condition, existing farming systems, land use, crop rotation, farming practices, and farm structures’.
Various approaches to the implementation of obligatory cross-compliance are expected, since Member States have considerable subsidiarity on many aspects. Although most Member States will probably only require farmers to meet minimum standards set out in the Regulation, it is again expected that some will use this as an opportunity to raise standards in agriculture and may go beyond EU standards. “Second Pillar” Cross Compliance Another useful tool will be the “verifiable standards of Good Farming Practice (GFP)” that all farmers receiving payments from agri-environment and less-favoured area schemes funded by the Rural Development Regulation - the so-called CAP ‘Second Pillar’ - must comply with across the whole of their farm19. Good Farming Practice (GFP) is a relatively new concept to emerge within the EU and its practical implementation is still being tested in many Member States. Obviously the interpretation of what constitutes a “reasonable” standard of farming will vary from country to country, however it is generally assumed that it will consistently involve farmers: • following relevant existing environmental legislation, and; • not deliberately damaging or destroying environmental assets, including the pollution of
watercourses. It should be noted that GFP is not equivalent to the Code of Good Agricultural Practice (CoGAP) that Member States must introduce in accordance with the requirements of the EU Nitrates Directive 676/91. GFP is likely to become an even more important element of agricultural policy in future and is very relevant to the concept of Best Agricultural Practice promoted by the ICPDR. However, the verifiable standards of GFP prepared by Member States do vary considerably since there are currently no detailed requirements for the establishment of GFP standards and no common baseline exists across the EU. On-farm Quality Assurance Schemes There is increasing interest shown by farmers, the food industry and food retailers in EU Member States to establish “on-farm quality assurance schemes” that offer consumers the assurance of food products having been grown with reduced or minimal pesticide inputs. The most developed example is organic farming as defined by EC Regulation 2092/91. Organic farming has the highest potential for reducing the use of toxic pesticides. Many organic crops are grown without the use of any pesticide, and the former intense use of copper in organic fruits and vineyards is now regulated.
19 Under Section 9 of EC Regulation No. 1750/1999, which sets out the rules for several measures including agri-environment, it is stated that: “Usual good farming practice is the standard of farming which a reasonable farmer would follow in the region concerned.....Member states shall set out verifiable standards in their rural development plans. In any case, these standards shall entail compliance with general mandatory environmental requirements.”
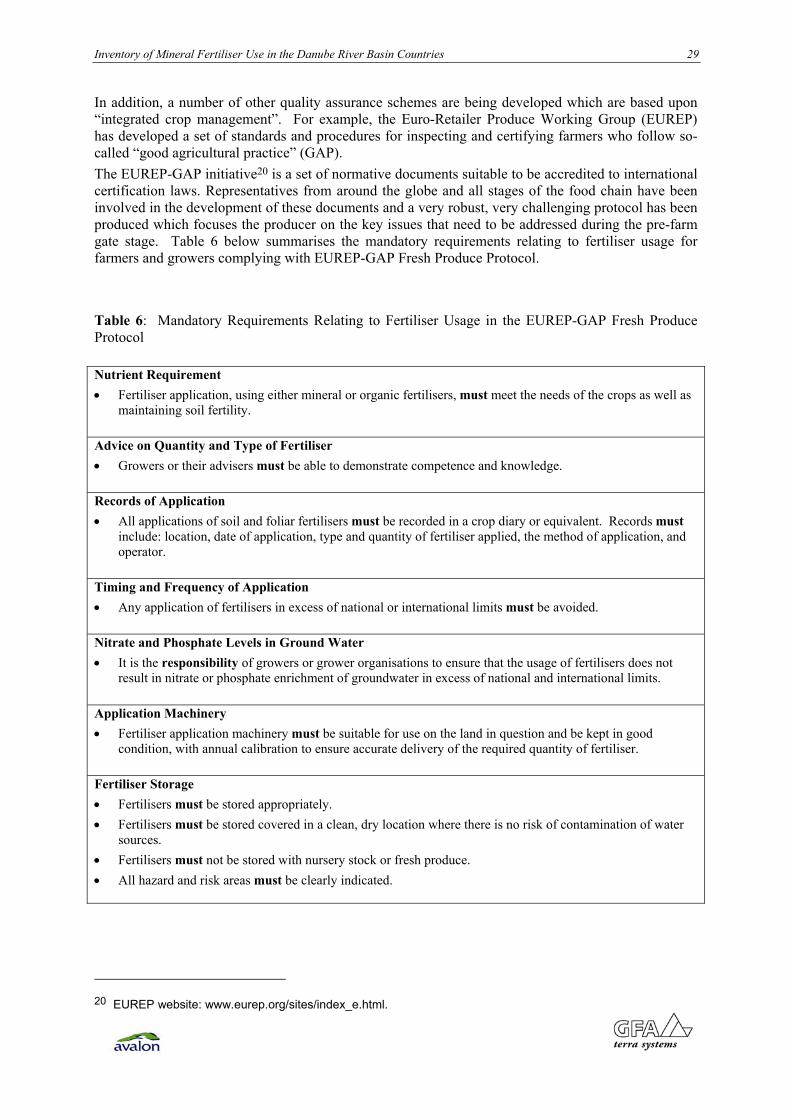
Inventory of Mineral Fertiliser Use in the Danube River Basin Countries 29
In addition, a number of other quality assurance schemes are being developed which are based upon “integrated crop management”. For example, the Euro-Retailer Produce Working Group (EUREP) has developed a set of standards and procedures for inspecting and certifying farmers who follow so-called “good agricultural practice” (GAP). The EUREP-GAP initiative20 is a set of normative documents suitable to be accredited to international certification laws. Representatives from around the globe and all stages of the food chain have been involved in the development of these documents and a very robust, very challenging protocol has been produced which focuses the producer on the key issues that need to be addressed during the pre-farm gate stage. Table 6 below summarises the mandatory requirements relating to fertiliser usage for farmers and growers complying with EUREP-GAP Fresh Produce Protocol. Table 6: Mandatory Requirements Relating to Fertiliser Usage in the EUREP-GAP Fresh Produce Protocol Nutrient Requirement • Fertiliser application, using either mineral or organic fertilisers, must meet the needs of the crops as well as
maintaining soil fertility. Advice on Quantity and Type of Fertiliser • Growers or their advisers must be able to demonstrate competence and knowledge. Records of Application • All applications of soil and foliar fertilisers must be recorded in a crop diary or equivalent. Records must
include: location, date of application, type and quantity of fertiliser applied, the method of application, and operator.
Timing and Frequency of Application • Any application of fertilisers in excess of national or international limits must be avoided. Nitrate and Phosphate Levels in Ground Water • It is the responsibility of growers or grower organisations to ensure that the usage of fertilisers does not
result in nitrate or phosphate enrichment of groundwater in excess of national and international limits. Application Machinery • Fertiliser application machinery must be suitable for use on the land in question and be kept in good
condition, with annual calibration to ensure accurate delivery of the required quantity of fertiliser. Fertiliser Storage • Fertilisers must be stored appropriately. • Fertilisers must be stored covered in a clean, dry location where there is no risk of contamination of water
sources. • Fertilisers must not be stored with nursery stock or fresh produce. • All hazard and risk areas must be clearly indicated.
20 EUREP website: www.eurep.org/sites/index_e.html.

UNDP/GEF Danube Regional Project 30

Inventory of Mineral Fertiliser Use in the Danube River Basin Countries 31
“Good Practice” for Improving the Management of Fertilisers and Manures In order to reduce the risk of diffuse pollution by nutrients (N and P) from agriculture it is necessary to encourage practical farm management techniques that minimise the opportunities for nutrients to accumulate in a form that is susceptible to loss. By using current and evolving scientific knowledge it is possible to develop simple practical guidelines for the management of the nutrient inputs most commonly used by farmers – namely mineral fertilisers and manures. These should be applicable to all farmers at little or no cost thereby minimising the need for financial incentives – furthermore, it should always be stressed to farmers that improvements in nutrient management also means improvements in productivity, cost-effectiveness and ultimately profit. The following typical management practices are commonly promoted to reduce the risk of nitrate leaching (especially during periods of high risk, such as the autumn and winter months): 10. Ensure that fertiliser N is applied according to the crop's requirement and taking account of:
• the crop species/variety, expected yield and required quality • the natural supply of N from the soil, including N released from soil organic matter, crop residues
and applied manure/slurry 11. Avoid applications of N fertilisers and manure/slurry in autumn and very early spring when crop
requirements for N are very low 12. Limit the application rate of organic manure/slurry to ensure that N supply does not exceed crop
requirements – this includes applying in smaller quantities at regular intervals to match more closely the crops requirement for nutrients during the growing season
13. Take special care when applying fertilisers and manure/slurry on fields where there is a risk of run-off to surface waters
14. When applying fertilizers/manures, ensure that an adequate distance (a “buffer zone”) is kept away from surface waters to avoid the risk of direct pollution
15. Ensure accurate calibration of fertiliser spreading equipment to minimise the risk of excessive application
16. Minimise the period when the soil is left bare and susceptible to nitrate leaching by increasing the area sown to winter crops, cover crops and grassland, whilst decreasing the areas sown to spring crops
17. Sow winter crops early in the autumn to increase nitrate uptake prior to the onset of the winter leaching period
18. Restrict the ploughing of old grassland.since this leads to excessive amounts of nitrate being produced by the natural process of mineralisation and commonly leads to high levels of nitrate leaching
It must be remembered, however, that diffuse nutrient losses from agriculture are greatly influenced by climate, soil type, cropping system and the forms and quantity of fertiliser and manure applied. Additionally diffuse losses of P are influenced by factors such as the vulnerability of soil to erosion. The typical management practices outlined above must therefore always be elaborated and expanded upon according to different national – and ideally regional/local – contexts. Technological and scientific developments will also play a major role in continuing to improve the efficiency of nutrient use in agriculture – for example, the use of high technology for targeting fertiliser inputs in cereal production through the use of so-called “precision farming techniques” offers considerable opportunity to both improve the efficiency and profitability of fertiliser use, as well further reduce nutrient losses. But for the moment such technology remains very capital intensive and beyond the reach of most farmers.

UNDP/GEF Danube Regional Project 32
The important thing is to ensure that the practical guidance developed for “good practice” is flexible and pragmatic – this is likely to involve the combination of both new technologies and more traditional nutrient conserving techniques such as those outlined above.

Inventory of Mineral Fertiliser Use in the Danube River Basin Countries 33
Recommendations for Policy Reform in DRB Countries Despite the relatively low levels (compared to many EU Member States) of mineral fertiliser and manure currently applied to agricultural land in the central and lower DRB region, national governments should take seriously the risk of diffuse pollution arising from fertiliser and manure application. The following objectives relating to fertiliser and manure application are recommended for all national strategies aiming to control nutrient pollution from agriculture. Comments are also included on policy instruments that should be adopted where appropriate to national context21: OBJECTIVE 1: Develop greater understanding at a national/regional level of the relationship
between agricultural practice (fertiliser, manure and land management) and the risk of diffuse nutrient pollution
1.2 Establish progressive and well-funded research programmes – whilst scientific understanding
of nutrient losses from agricultural land and the related transport processes to ground and surface waters has increased in recent years this cannot be applied uniformly across the DRB for the development of good/best practice. Country/regional specific guidance for farmers must be based upon an understanding of the behaviour of nutrients in the specific agronomic, environmental and socio-economic context of each country. For example: • the nutrient content of animal manures need to be quantified to aid more precise application • the nutrient losses from different components of the farm system to be measures and the
causes of these losses established • the underlying soil processes affecting nutrient availability (e.g. soil mineralisation) need to be
better understood OBJECTIVE 2: Develop appropriate policy instruments and institutional arrangements for
promoting better management of fertilisers and manures 2.5 Raise Farmer Awareness of Good Practice - simple and easy to understand information
materials, combined with well-targeted publicity campaigns, can be very effective at raising farmers’ awareness of the importance of improving the management of fertilisers and manures – a key message to communicate is that better nutrient management increases productivity, saves money and improves profitability.
2.6 Develop and Promote National Codes of Good Practice – national authorities should agree upon clear and simple codes of voluntary good practice for fertiliser and manure management. This should be specific to national context and ideally linked to/derived from progressive and well-funded research programme (see 1.1 above)
2.7 Use Economic Instruments to Promote Good Practice – where government schemes are providing support to farmers then the principle of “environmental cross-compliance” can be applied. This involves the establishment of certain conditions that farmers have to meet in order to be eligible to receive government support and can easily be adapted to the promotion of good practice for fertiliser and manure management. Additionally, payments to farmers from agri-environment schemes (where implemented) can be conditional upon certain standards for fertiliser and manure management. Appropriate financial disincentives might also be developed.
21 Not all policy instruments are appropriate to all countries

UNDP/GEF Danube Regional Project 34
2.8 Develop Appropriate Extension Capacity – agricultural extension services play a key role in raising awareness and improving the technical skills of farmers with respect to good practice for fertiliser and manure management, however they often require support in developing the necessary capacity to do this. National funding should be provided for the training of advisers in good practice and modern extension techniques, as well as the development of appropriate institutional frameworks for extension services (including the link to progressive and well-funded research programmes – see 1.1 above)
OBJECTIVE 3: Promote certified organic farming and other low input farming systems as
viable alternatives to the conventional use of fertilisers 3.5 Raise Farmer Awareness – alternative farming systems, such as organic farming, should be
actively promoted to farmers through the preparation of simple and easy to understand information materials. Organic farming is the most well-developed of all alternative farming systems and has good potential to reduce nutrient losses through the avoidance of the most soluble forms of mineral fertiliser, more rational use of manures and use of more diverse crop rotations (e.g. increased winter crop cover) - whilst also contributing to the reduction of pesticide pollution etc.
3.6 Develop Relevant Legislation – national legislation for the certification and inspection of organic farming systems in compliance with internationally recognised standards (particularly those in accordance with EC legislation) should be developed and implemented as a high priority in order to promote the development of domestic markets and international trade
3.7 Develop Appropriate Extension Capacity – agricultural extension services and farm advisers play a fundamental role in the re-orientation of farmers towards alternative production systems, particularly those such as organic farming, which require higher levels of technical knowledge and management. National funding should be provided for the development of appropriate extension capacity as 2.4 above
3.8 Use Economic Instruments to Promote Organic Farming – farmers converting to organic farming techniques can incur certain additional costs associated with reductions in input, establishment of new crop rotations, adoption of new technologies etc. These costs can be a significant obstacle to farmers deciding making the transition from a conventional farming system. Where funds are available, national authorities should encourage farmers to convert to organic farming by offering appropriate levels of compensatory payment. Since organic farmers often have problems to sell or export their products, the marketing of organically-grown products should also be supported by governmental campaigns and action.

Inventory of Mineral Fertiliser Use in the Danube River Basin Countries 35
Annexes

UNDP/GEF Danube Regional Project 36

Inventory of Mineral Fertiliser Use in the Danube River Basin Countries 37
Annex 1
Review of the Use of Mineral Fertiliser Products in the DBR (Questionnaire)

UNDP/GEF Danube Regional Project 38

Inventory of Mineral Fertiliser Use in the Danube River Basin Countries 39
Annex 1: Review of the Use of Mineral Fertiliser Products in the DRB Countries (Questionnaire) Step 1 – Types of N and P Fertiliser Commonly Used by Farmers Please identify the types of mineral fertiliser (including the nutrient-containing chemicals and materials) that are commonly used by in agriculture and horticulture by completing the boxes in the tables below. I make the distinction between the use of so-called straight fertilisers that include a single nutrient-containing chemical and compound (NPK) fertilisers that include chemicals or mixtures of chemicals that contain more than one nutrient If you have any comments upon the importance of particular fertiliser types, trends in use etc please add them to the final column Type of Fertiliser
Used by Farmers - Yes/No?
Typical Nutrient-containing Chemicals
Yes/ No?
Typical Formulation (N:P:K)
Comments
N FERTILISERS Straight N Fertilisers Ammonium sulphate Not Ammonium nitrate applicable
Calcium nitrate Urea
Anhydrous ammoniaAqueous ammonia
Other – please specify
Compound Fertilisers Mono-ammoniumphosphate Di-ammonium phosphate
Other – please specify

UNDP/GEF Danube Regional Project 40
Type of Fertiliser
Used by Farmers - Yes/No?
Typical Nutrient-containing Chemicals
Yes/ No?
Typical Formulation (N:P:K)
Comments
P FERTILISERS Straight P Fertilisers Rock phosphate Not Triple superphosphate Applicable Other – please specify
Compound Fertilisers Mono-ammonium
phosphate Di-ammonium phosphate
Other – please specify
Step 2 – Total Consumption of N and P Fertiliser by Farmers Please complete the following table with as much national data as possible on the total use of mineral fertilisers by farmers in your country for the years 1997 - 2002. Please ensure that the data you use for the quantity of fertilisers used and applied is the amount of nutrient (N or P) not the amount of fertiliser product/chemical (for example, 1 tonne of ammonium nitrate contains only 345 kg of nitrogen) Year
1997 1998 1999 2000 2001 2002(?) Source of data N FERTILISERS Total N consumption (tonnes)
Total agricultural area treated with N fertilisers (‘000s ha)
P FERTILISERS Total N consumption (tonnes) Total agricultural area treated with P
fertilisers (‘000s ha)

Inventory of Mineral Fertiliser Use in the Danube River Basin Countries 41
Step 3 – Characteristics of N and P Fertiliser Use by Farmers The data on national sales collected above is very important, but the environmental impact of mineral fertiliser use is related closely to the way in which farmers apply fertilisers to their crops. Please help us to understand more about how farmers are currently using mineral fertilisers in your country by completing the following table as fully as possible – this is organised according to main crop type and includes: 1. approximately what percentage of the crops grown currently have mineral fertilisers applied to them – if no crops are have fertilisers applied because of
the current economic situation, for example, please clearly state this in the final column under Comments 2. the current average or “typical” application rate (kg per ha) for N and P fertilisers – again please ensure this is the amount of nutrient (N or P) applied
not the amount of fertiliser product/chemical. If the application rates vary greatly according to the crop, please clearly state this and include the range of application rates (e.g. 30 - 70 kg N per ha according to the crop variety being grown)
3. the typical time of fertiliser application (e.g. in autumn or spring when planting) – this is particularly important regarding the application of N fertilisers Please feel free to add any additional comments to the final column, such as trends in fertiliser use etc N FERTILISERS P FERTILISERS Crop
% Crop Receiving N Fertiliser
Typical Application Rate (kg N/ha)
Typical Timing of Application
% Crop Receiving P Fertiliser
Typical Application Rate (kg P/ha)
Comments
Wheat, barley etc Maize Sunflower Sugar beet Tobacco Potatoes Field vegetables (except potatoes)
Glasshouse vegetables Orchards Vineyards Pasture and other grassland Others – please specify

UNDP/GEF Danube Regional Project 42
Step 4 - Known “Bad Practice” Regarding the Use of Mineral Fertilisers Next - we would like you to identify any “bad practice” associated with the use of mineral fertilisers by farmers in your country - for example, this might include: • using application rates that are higher than recommended rates (unlikely in many countries) • poor application due to old or poorly maintained equipment • spreading too closely to water sources e.g. streams and rivers • applying mineral fertiliser at an inappropriate time of year (i.e. when the crop is not growing) It would be useful to know where this information about bad practice comes from – is it the professional knowledge of yourself or other experts? Is it actually the common practice amongst farmers? Was it reported in a farming journal or a report? Please do not hesitate to be honest about these things – it is very important information for us to collect The table below is organised according to crop, but if you have only general comments to use please delete these crops (or if you have more specific comments to make, please add more crops) Crops Known Bad Practice by Farmers Source of Information
Wheat, barley etc Maize Sunflower Sugar beet Tobacco Potatoes Field vegetables (except potatoes) Glasshouse vegetables Orchards Vineyards Pasture and other grassland Others

Inventory of Mineral Fertiliser Use in the Danube River Basin Countries 43
Annex 2
Bosnia & Herzegovina

UNDP/GEF Danube Regional Project 44

Inventory of Mineral Fertiliser Use in the Danube River Basin Countries 45
Annex 2: Bosnia & Herzegovina Types of N and P Fertiliser Commonly Used by Farmers in the Republic of Srpska Type of Fertiliser
Typical Nutrient-containing Chemicals
Typical Formulation (N:P:K)
Comments
N FERTILISERS Straight N Fertilisers Ammonium sulphate Relative high use in relation to the total quantity of
single N fertilisers. Ammonium nitrate As above
Calcium nitrate Urea The largest use in relation to single N fertilisers. Anhydrous ammonia
Aqueous ammonia Calcium ammonium nitrate KAN High use in relation to total quantity N fertilisers.
Mixture of urea and ammonium nitrates in aqueous or ammonia form.
High use with trend of increase.
Mixture of calcium nitrate & ammonium nitrate. Low level of use. Sodium nitrate/Calcium nitrate Low level of use. Ammonium chloride Low level of use.
Compound Fertilisers Mono-ammonium phosphate - Low level of use with trend of decrease Di-ammonium phosphate - Low level of use with trend of decrease
Nitrophosphates - Insignificant use
P FERTILISERS Straight P Fertilisers Rock phosphate Low level of use Triple superphosphate The largest use of P fertilisers, but it is still low Calcine phosphates Noted very low use (consumption) Thomas’s flour Very low rate of use
Compound Fertilisers Mono-ammonium phosphate - Low level of use with trend of decrease Di-ammonium phosphate - Low level of use with trend of decrease
Nitrophosphates - Insignificant use

UNDP/GEF Danube Regional Project 46
Total Consumption of N and P Fertiliser by Farmers in the Republic of Srpska Year
1997 1998 1999 2000 2001 2002(?) Source of data N FERTILISERS Total N consumption (tonnes) 756* 977* 1,280* 9,212 17,971 20,138 Institute for Statistics of RS ,
Customs Administration of RS Total agricultural area treated with N
fertilisers (‘000s ha) 19 20 16 405 389 360 Institute for Statistics of RS
P FERTILISERS Total P consumption (tonnes) 315* 348* 488* 3,562 7,455 6,204 Institute for Statistics of RS,
Customs Administration of RS Total agricultural area treated with P
fertilisers (‘000s ha) 19 20 16 405 389 360 Institute for Statistics of RS
* Years: 1997, 1998 and 1999 - these data are related to public sector only (i.e. STATE FARMS ) (Source: Institute for Statistics of RS). The data for: 2000, 2001 and 2002 years are related to the total land under cultivation (arable land), that means and individual and public sector. Characteristics of N and P Fertiliser Use by Farmers in Republic of Srpska N FERTILISERS P FERTILISERS Crop % Crop
Receiving N Fertiliser
Typical Application Rate (kg N/ha)
TypicalTiming of Application
% Crop Receiving P Fertiliser
Typical Application Rate (kg P/ha)
Comments
Wheat 50-60 95 Autumn (during
seeding) and Spring (top- dressing)
50-60 45 About 70,000 ha are under wheat in RS.These application rates (norms) are related to good producers. Farmers mostly have not money to acquire adequate quantities of fertilisers. For start fertilisation (during soil cultivation-preparation for planting) NPK fertilisers are used, mostly 15-15-15, or similar formulation. For top-dressing KAN is used (somewhere UREA).
Barley 50 90 Spring 50 45 The smaller areas in the higher altitudes are under barley. Some farmers are used mineral fertilisers, but most of them are used the manure, without fertilisers.

Inventory of Mineral Fertiliser Use in the Danube River Basin Countries 47
N FERTILISERS P FERTILISERS Crop % Crop
Receiving N Fertiliser
Typical Application Rate (kg N/ha)
TypicalTiming of Application
% Crop Receiving P Fertiliser
Typical Application Rate (kg P/ha)
Comments
Oats 40 90 Spring 40 45 Mostly in hilly-mountain areaa, without top- dressing and
with manure application. Left mentioned application rates are for better producers only.
Maize 70 120 During seeding and top-dressing
70 45 Maize is crop on the first place in RS regarding seeded area (140,000-160,000 ha). NPK fertilisers, mostly 300 kg of 15-15-15 formulation/haare using for fertilisation, during soli cultivation and seeding + 1X top-dressing, with CaAN=KAN (80% of producers) and urea (20% of producers) fertilisers. Such situation applied 70% of farmers. 30 of them applied full quantity of fertilisers before and during the seeding and 70%. About 30% of farmers are used manure (before ploughing) + NPK fertilisers (during the seeding) for maize fertilisation (without top-dressing).
Soyabean 70 45 Before seeding or in autumn before ploughing
70 45 Before sowing or in autumn before ploughing
Tobacco 80 20 Before seeding and top-dressing
80 60 For fertilisation super phosphates are used and for top-seeding compound (complex) fertilisers.
Potatoes 60 180 All before planting 60 100 Farmers are used NPK 10-20-30, 15-15-15 and urea fertilisers mostly. In hilly-mountain regions they are using manure without mineral fertilisers application.
Field vegetables (Tomato and pepper)
70 190 Before ploughing,before planting and top-dressing
70 125 Farmers are used NPK formulations: 7-20-30, 15-15-15, and urea, CaAN=KAN. If they are using manure, application rates are about 20-30 t/ha
Orchards 60 95 Two application February-March, and top-dressing after blooming (flowering)
60 50 These application rates of fertilisers are related to farmers with extensive fruit production, which is dominant now in BIH. Only small areas are under intensive production where farmers are using about 130 kg N/ha about 100 kg P/ha, and sometimes 10-20% more.
Pasture and Forage
40 50-80 Top-dressing Mainly for top-dressing, after mowing tha grass (2-3 times with CaAN=KAN or urea fertilisers)

UNDP/GEF Danube Regional Project 48
Known “Bad Practice” by Farmers Regarding Nutrient Management in the Republic of Srpska Crops Known Bad Practice by Farmers Source of Information
Wheat, barley etc Erosion is increased by irregular cultivation on slopes. Insufficient use of manure and
fertilisers. Uneducated farmers. Application of manure into a dry soil where NH4 evaporate. The main problem is old and uncompleted mechanical equipment.
M.Sc. Milos Nozinic, Agricultural institute, Banja Luka, Dept. for cereals
Maize Wrong time of application, bad quality of cultivation, insufficient quantity of manure, bad and insufficient mechanical equipment. An example of BAD Agr Practice is state farm “Mladen Stojanovic, Nova Toplola, near Vrbas river, between Banja Luka and Gradiska, where during last autumn and this spring they cultivated and fertilised about 100,000-200,000 ha, but not planted (unsatisfied workers-this is on some way their protes against poor relation of society and government to their position).
M.Sc. Slavko Radanovic Maize department, Agricultural institute, Banja Luka
Soybean Bad application because lack of appropriate mechanisation and inappropriate time of fertilisers application.
Slobodanka Markovic, B.Sc. State Farm “Semberija” Bijeljina.
Tobacco Lack of manure, that is very effective in tobacco production.
Own experience.
Potatoes In some production areas farmers are applyied too big application rates (doses) of mineral fertilisers (e.g. in Lijevce polje, near Vrbas river, about 1000 kg NPK before seeding and 400 kg urea for top-dressing).
Spremo Drago, B.Sc., Agricultural institute, Banja Luka
Field vegetables (except potatoes) Mineral fertilisers application rates which are using farmers in Lijevce polje are without the results of earlier soil analyses (approximate). Lack of organic fertilisers, and than using high doses of mineral fertilisers.
M.Sc. Vida Todorovic-Mitric. Faculty of agriculture, Banja Luka
Orchards Late application of NPK. Application of fertilisers on soil surface, without incorporation. Application of inappropriate NPK formulations.
M.Sci. Rados Ljubomir Agricultural institute Banja Luka

Inventory of Mineral Fertiliser Use in the Danube River Basin Countries 49
Types of N and P Fertiliser Commonly Used by Farmers in the Federation of Bosnia & Herzegovina
Typical Nutrient-containing Chemicals
Typical Formulation (N:P:K)
Comments
N FERTILISERS Straight N Fertilisers Ammonium sulphate (NH4) SO 21% N 2 4, Calcium nitrate Ca(NO ) 15 % N 3 2, Very low*
Urea CO(NH ) , 2 246 % N
Calcium ammonium nitrate KAN
NH NO x CaCO 4 327 % N
About 45%
Mixture of urea + ammonium nitrates + water (UAN) 30% N
Very little*
Liquids N-fertilizers
Compound Fertilisers
Type of Fertiliser
Very low*
About 40 %
3
Very little for plastic and green houses, vegetable and flower production*
Mono-ammonium phosphate MAP
NH H PO 4 2 412 % N
Very little*
(NH ) HPO 4 2 4
46 % P2O5
10 % 52 % P2O5
Di-ammonium phosphate DAP!8 % N Usages are increasing every year
* Total amount of the nitrogen from this sources is about 5% P FERTILISERS Straight P Fertilisers - Compound Fertilisers Mono-ammonium phosphate
MAP NH4H2PO4 - 12 % N, 52 % P2O5 Very little
Di-ammonium phosphateDAP
(NH4)2HPO4 - !8 % N, 46 % P2O5
Usages are increasing every years.

UNDP/GEF Danube Regional Project 50
Total Consumption of N and P Fertiliser by Farmers in the Federation of Bosnia & Herzegovina Year
1997 1998 1999 2000 2001 2002(?) Source of data N FERTILISERS Total N consumption (tonnes) 6.066 9.963 11.826 30.315,31 22.207,12 10.292,04 Federal Ministry for
Agriculture Custom office Total agricultural area treated with N
fertilisers (‘000s ha) 766 787 784 729 614 605 Federal Statistics biro
P FERTILISERS Total N consumption (tonnes) 2.729 5.011 4.570 3.428,83 2.410,16 1.193 Federal Ministry for
Agriculture Custom office
Total agricultural area treated with P fertilisers (‘000s ha)
766 787 784 729 614 605 Federal Statistics biro
Characteristics of N and P Fertiliser Use by Farmers in Federation of Bosnia & Herzegovina N FERTILISERS P FERTILISERS Crop % Crop
Receiving N Fertiliser
Typical Application Rate (kg N/ha)
Typical Timing of Application
% Crop Receiving P Fertiliser
Typical Application Rate (kg P2O5/ha) (kg P/ha)
Comments
Wheat 11,58 120-160 Atom
(70%)and Spring (30%)
11,58 70-12030,5-52,3
Typical NPK use fertilizers for star is 15:15:15 or 10:30:20 or 7:14:21, and for topdressing use is nitrogen fertilizers as is 27% KAN, or 46% UREE-a. Sometimes for topdressing farmers use also NPK formulation 15: 15:15 to.
Ray 0,66 100-120 Atom (70%)and Spring
(30%)
0,66 90-10039,3-43,6
Same like wheat
Barley 5,38 80-120 Spring(70%)and
topdressing (30%)
5,38 90-11039,3 – 48,0
Same like wheat

Inventory of Mineral Fertiliser Use in the Danube River Basin Countries 51
N FERTILISERS P FERTILISERS Crop % Crop
Receiving N Fertiliser
Typical Application Rate (kg N/ha)
Typical Timing of Application
% Crop Receiving P Fertiliser
Typical Application Rate (kg P2O5/ha) (kg P/ha)
Comments
Oats 2,13 80-100 Spring (80%)
& topdressing (20%)
2,13 80-10034,9 – 43,6
Same like wheat
Maize 23,2 150-200 Spring (50%)& topdressing
(25 + 25%)
23,2 100-13043,6 – 56,7
Same like wheat
Soya bean 0,19 30-70 Spring 0,19 120-130 52,3-56,7
NPK formulation 5:20:30
Tobacco 0,68 20-50 Spring (80%), topdressing
(20%)
0,68 80-15034,9-65,5
Typical 7:14:21
Potatoes 11,62 100-140 Spring (60 %) & top dressing
(40 %)
11,62 90-120339,3-52,3
NPK formulation 7:14:21 or 10:20:30 An topdressing 2 times with 27 KAN and 46% URRE-a
Field vegetables (except potatoes) 7,0 100-120 Spring (50%) & topdressing (20 +20+10%)
Summer
7,0 100-12043,6-52,3
Typical NPK formulation 7:14:21 or 15:15:15. The formulation 15:15:15 is often use for topdressing to
Glasshouse vegetables 0,83 150-180 Through the season
(5 times)
0,83 110-13048,0-56,7
NPK - 8:26:26, 7:14:21
Orchards 12,0 130-160 Spring(70 %),
topdressing (30%)
12,0 90-12039,3-52,3
Typical 7:14:21
Vineyards 2,0 110-140 Spring (70%),topdressing
(30%)
2,0 80-11034,9-48,0
Typical 7:14:21
Pasture and other grassland 22,39 80-120 Spring and summer (70 +
30 %)
22,39 70-9030,5-39,3
Almost always 15:15:15

UNDP/GEF Danube Regional Project 52
Known “Bad Practice” by Farmers Regarding Nutrient Management in the Federation of Bosnia & Herzegovina Crops Known Bad Practice by Farmers Source of Information
Wheat, barley etc Generally with cereals in BiH we have a very low yields in farmers plots. Reason for that is
inadequate amount of fertilizers especially NPK and an proper NPK combination. Also in many cases physical condition of soil are very poor (heavy soils)
Personal experts experience and research work at the Agricultural Faculty of Sarajevo. There are no Government instructions for any agricultural practises, or government investigations of all this problems. This is for all crops mentioned in this table.
Maize Poor soil fertility, inadequate hybrids, sowing on the slop, and bad equipped farmers. Tobacco This production is almost abounded in Mediterranean region where was production of oriental
tobacco. Nowadays production is mostly in northern part of the Country with tip of Virginia and Barley. Sometimes to high amount of nitrogen and as problem high amount of nicotine (bed qualities)
Potatoes Saving on the slop and erosion problem, seeds with no good quality, inadequate protection, and shortage of potassium in NPK formulation.
Field vegetables (except potatoes) The remarks from ordinary people is to high use of fertilizers especially nitrogen, but there is no official conformation about it. Also organic fertilizers is not use properly and close environmental problems to.
Glasshouse vegetables The remarks from ordinary people is to high use of fertilizers especially nitrogen, but there is no official conformation about it. Also organic fertilizers are not use properly and close environmental problems to. Artificial test and low quality by estimation ordinary people.
Orchards Bed agro technical practise (lack of cutting), bed protection practise, sidling material is low quality, growing on the to high slop, shortage of experience in intensive production and lack of research. No foliar application of fertilizers.
Vineyards The farmers have good experiences with this crop. On stony soils high loses of fertilizers by ground percolation.
Pasture and other grassland Still inadequate use of fertilizers, with problems and lack of other agro technical measures.

Inventory of Mineral Fertiliser Use in the Danube River Basin Countries 53
Annex 3
Bulgaria

UNDP/GEF Danube Regional Project 54

Inventory of Mineral Fertiliser Use in the Danube River Basin Countries 55
Annex 3: Bulgaria Types of N and P Fertiliser Commonly Used by Farmers in Bulgaria Type of Fertiliser
Typical Nutrient-containing Chemicals
Typical Formulation (N:P:K)
Comments
N FERTILISERS Straight N Fertilisers Ammonium sulphate Ammonium nitrate Most commonly used N fertiliser Diamid of carbonic acid Commonly used
Sodium nitrate
Compound Fertilisers Mono-ammonium phosphate N: 10-11%; P2O5: 46-50% Di-ammonium phosphate N: 20-21%; P2O5: 46-51% Potassium nitrate N: 13,5%; K2O: 46% N-K-Mg N: 10%; K2O: 15%; MgO: 7% Nitrofoski N: P2O5: K2O – Macro + Micro N: 14%; P2O5: 4%; K2O: 6% + micro-elements They are produced with different nutrient ratios
Deviferti-Betabor N: 12 P%; 2O5: 2%; K2O: 6% + micro-element B Deviferti-Zeazinc N: 14%; P2O5: 0%; K2O: 6% + micro-element Zn
Deviferti- Feriazotan N: 10%; P2O5: 0%; K2O: 4% + micro-element Fe
P FERTILISERS Straight P Fertilisers Rock phosphate Triple superphosphate
Superphosphate-fosphoriteDouble superphosphatePhosphorite flourBone flour
Compound Fertilisers Mono-ammonium phosphate N: 10-11%; P2O5: 46-50% Di-ammonium phosphate N: 20-21%; P2O5: 46-51% Nitrofoski N: P2O5: K2O – They are produced with different nutrient ratios Macro + Micro N: 14%; P2O5: 4%; K2O: 6% + micro-elements
Deviferti-Betabor N: 12 P%; 2O5: 2%; K2O: 6% + micro-element B
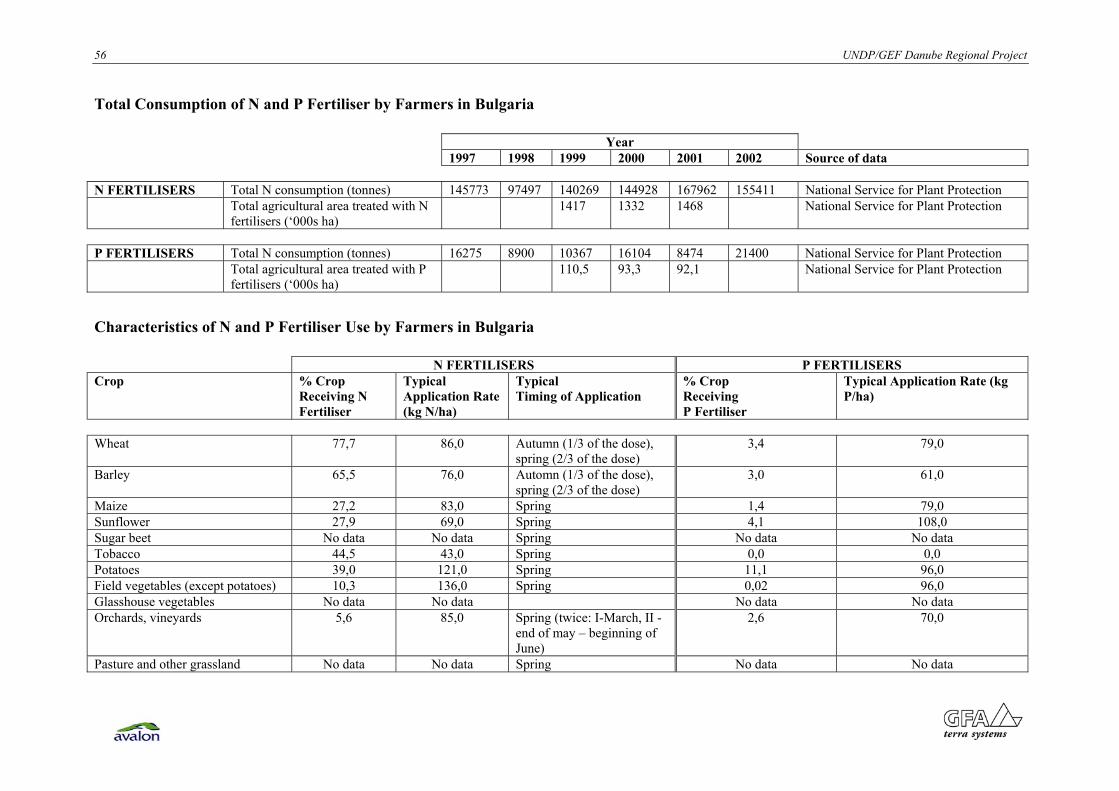
UNDP/GEF Danube Regional Project 56
Total Consumption of N and P Fertiliser by Farmers in Bulgaria Year
1997 1998 1999 2000 2001 2002 Source of data N FERTILISERS Total N consumption (tonnes) 145773 97497 140269 144928 167962 155411 National Service for Plant Protection Total agricultural area treated with N
fertilisers (‘000s ha) 1417 1332 1468 National Service for Plant Protection
P FERTILISERS Total N consumption (tonnes) 16275 8900 10367 16104 8474 21400 National Service for Plant Protection Total agricultural area treated with P
fertilisers (‘000s ha) 110,5 93,3 92,1 National Service for Plant Protection
Characteristics of N and P Fertiliser Use by Farmers in Bulgaria N FERTILISERS P FERTILISERS Crop % Crop
Receiving N Fertiliser
Typical Application Rate (kg N/ha)
Typical Timing of Application
% Crop Receiving P Fertiliser
Typical Application Rate (kg P/ha)
Wheat 77,7 86,0 Autumn (1/3 of the dose), spring (2/3 of the dose)
3,4 79,0
Barley 65,5 76,0 Automn (1/3 of the dose), spring (2/3 of the dose)
3,0 61,0
Maize 27,2 83,0 Spring 1,4 79,0Sunflower 27,9 69,0 Spring 4,1 108,0Sugar beet No data No data Spring No data No data Tobacco 44,5 43,0 Spring 0,0 0,0 Potatoes 39,0 121,0 Spring 11,1 96,0Field vegetables (except potatoes) 10,3 136,0 Spring 0,02 96,0 Glasshouse vegetables No data No data No data No data Orchards, vineyards 5,6 85,0 Spring (twice: I-March, II -
end of may – beginning of June)
2,6 70,0
Pasture and other grassland No data No data Spring No data No data

Inventory of Mineral Fertiliser Use in the Danube River Basin Countries 57
Additional Data In 1999 485000 t of mannure have been used. The manure was applied only on 14800 ha – mainly potatoes and vegetables. In 2002 240000 t of manure have been used- 85% of the quantity used in 2001. The manure was applied on approximately 11900 ha - 85% of the acreage in 2001. In 2002 manure was applied mainly potatoes- 4840 ha, vegetables- 3220 ha, orchards - 280 ha, maize - 350 ha, other crops -770 ha. Comments While the optimum proportion N:P:K is 1:0,8:0,4, in 2000, N:P:K recorded 1:0,11:0,02, indicating an average use of phosphates nearly 8 times and use of potassium fertilizers over 20 times lower than the recommended. In 2001 the ration was 1:0,05:0,01, that is an imbalance of 16 times less phosphorous and 40 times less potassium. For the past few years, this is the worst nutrient balance observed In the country it is very commonly used the unbalanced fertilization (mainly with N). In many regions (Shoumen, Gabrovo, Lovetch, Sofia-town and Kardjali) was not used even a single tonne of K and Pthis reflects in the yields of the different crops as well as on their quality. It also leads to physisological disturbances in the cultivated crops that are results of the insufficient nutrients The reasons for the decline of the use of the mineral fertilisers are different, but the main one is the high preces of the fertilizers on one hand and the limited financial resources of the farmers on the other. Another reason is the low efficiency of the inputs because the technologies are not strictly followed. This information about bad practice comes from experts of National Service for Plant Protection.

UNDP/GEF Danube Regional Project 58

Inventory of Mineral Fertiliser Use in the Danube River Basin Countries 59
Annex 4
Croatia

UNDP/GEF Danube Regional Project 60

Inventory of Mineral Fertiliser Use in the Danube River Basin Countries 61
Annex 4: Croatia Types of N and P Fertiliser Commonly Used by Farmers in Croatia Type of Fertiliser
Typical Nutrient-containing Chemicals
Typical Formulation (N:P:K)
Comments
N FERTILISERS Straight N Fertilisers Ammonium nitrate 33,5 % Calcium ammonium nitrate 27 % Very important and widely used type of single fertilizer in Croatia Urea 46 % Very important and widely used type of single fertilizer in Croatia Urea ammonim nitrate – liquid
fertilizer 30% Relatively small amounts are sold because of different mechanization for
application and lack of habit between farmers
Compound Fertilisers Mono-ammonium phosphate 12:52:0
P FERTILISERS Straight P Fertilisers None Only small amounts of these fertilizers are in use in Croatia because there is
currently no demand for such fertilizers in farmer’s community – they will probably became more important because of problems of P deficiency in soil.
Compound Fertilisers Mono-ammonium phosphate 12-52-0 MAP NPK 5-20-30S Good for tobacco NPK 7-20-30 One of the most important fertilizers for basic fertilization
NPK 8-16-24 NPK 8-26-26 One of the most important fertilizers for basic fertilization NPK 10-20-30 One of the most important fertilizers for basic fertilization NPK 10-30-20 This formulation is very good for soils low on plant available phosphorus, but
farmers do not have habit to buy them because of higher price NPK 13-10-12 Good formulation for pre-seeding fertilization
NPK 15-15-15 Farmers use this formulation very often in basic fertilization. The problem is that they applied too low amounts of phosphorus and potassium.
NPK 20-10-10 Usually used for topdressing or sidedressing Other – please specify
There are also some amounts of compound fertilizers imported in Croatia by
individuals or by companies, but there is no adequate statistics on quantities distributed in different parts of country. At the same time, some of the fertilizers sold in Croatia are transported to neighbouring countries.

UNDP/GEF Danube Regional Project 62
Total Consumption of N and P Fertiliser by Farmers in Croatia Year
1997 1998 1999 2000 2001 2002(?) Source of data
N FERTILISERS Total N consumption (tonnes) 126.462 98.818 104.822 110.471 109.798 Petrokemija fertilizer plant – data on sale of fertilizers, Statistical yearbook, Personal calculation
2992 3151 3151 3156 3148 Agricultural area 1858 2021 1998 1994 1975 Cultivated area Total agricultural area treated with N
fertilisers (‘000s ha) 1441 1587 1586 1582 1576 Probably fertilized area (assumption)
P FERTILISERS Total P consumption (tonnes) -as P2O5 46.904 48.176 37.645 39.932 44.926
Petrokemija fertilizer plant – data on sale of fertilizers, Statistical yearbook, Personal calculation
2992 3151 3151 3156 3148 Agricultural area 1858 2021 1998 1994 1975 Cultivated area Total agricultural area treated with P
fertilisers (‘000s ha) 1441 1587 1586 1582 1576 Probably fertilized area (assumption)

Inventory of Mineral Fertiliser Use in the Danube River Basin Countries 63
Characteristics of N and P Fertiliser Use by Farmers in Croatia N FERTILISERS P FERTILISERS Crop
% Crop Receiving N Fertiliser
Typical Application Rate (kg N/ha)
Typical Timing of Application
% Crop Receiving P Fertiliser
Typical Application Rate (kg P/ha)
Comments
Wheat, barley etc 95-100 100-200 Autumn - small
amounts, spring 2-3 topdresings
95-100 50-100
Maize 95-100 100-200 Autumn, spring,1 topdressing
95-100
60-120
Sunflower 95-100 80-120 Autumn, spring,ev. 1 topdressing
95-100
100-140
Sugar beet 95-100 120-160 Autumn, spring, 1 topdressing
95-100 120-200
Tobacco 95-100 20-40 Autumn, spring 95-100
80-160
Potatoes 95-100 80-140 Autumn, spring,1 topdressing
95-100
80-120
Field vegetables (except potatoes) 95-100 100-400
95-100 80-160
Glasshouse vegetables 100 100-400
100 80-160
Orchards 40
40
Vineyards 60
60
Pasture and other grassland 0 (pastures) – 15 (grassland)
0 (pastures) – 15 (grassland)

UNDP/GEF Danube Regional Project 64
Known “Bad Practice” by Farmers Regarding Nutrient Management in Croatia Crops Known Bad Practice by Farmers Source of Information
Wheat, barley etc Fertilization is carried out without soil analyses and it is mainly based on farmer’s experience
and on general fertilization recommendations and habits in certain parts of Croatia
Well known fact
Maize Farmers usually apply wrong formulation in autumn (15-15-15, Urea). That can cause imbalance in three major nutrients N, P and K later, and it can influence on nitrogen losses during winter
Field vegetables (except potatoes) Sometimes amounts of fertilizers are very high but it is production on relatively small area in Croatia, compared to the area under arable crops
Orchards From the agronomic point of view there is a lot of old orchards without any fertilization. Modern orchards are mainly fertilized according to the recommendations from the existing literature including modifications done by owners
Vineyards Same goes for the vineyards
Pasture and other grassland To low fertilization compared to the current state of domestic livestock production
One of the most important indicators of intensity of agriculture is average mineral fertilizer consumption per unit of agricultural land. Problem is in a fact that in Croatia there is no one place or one institution responsible for evidence of consumption on territorial base. The farmers are not educated to take care about nutrient balance on their farms and there is no such program that will introduce some kind of “green accounting” at the farm level. The advantages of such practice can be expressed through the savings of money and better efficiency of mineral fertilizers.

Inventory of Mineral Fertiliser Use in the Danube River Basin Countries 65
Annex 5
Czech Republic

UNDP/GEF Danube Regional Project 66
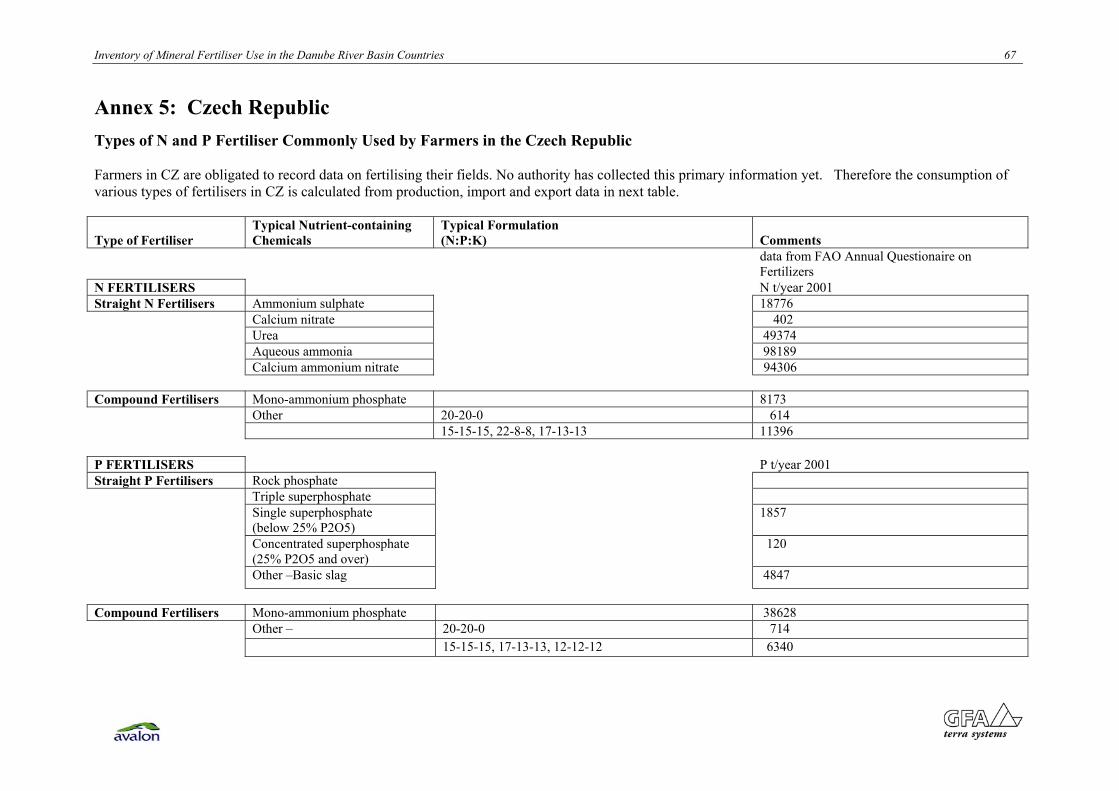
Inventory of Mineral Fertiliser Use in the Danube River Basin Countries 67
Annex 5: Czech Republic Types of N and P Fertiliser Commonly Used by Farmers in the Czech Republic Farmers in CZ are obligated to record data on fertilising their fields. No authority has collected this primary information yet. Therefore the consumption of various types of fertilisers in CZ is calculated from production, import and export data in next table. Type of Fertiliser
Typical Nutrient-containing Chemicals
Typical Formulation (N:P:K)
Comments
data from FAO Annual Questionaire on Fertilizers
N FERTILISERS N t/year 2001Straight N Fertilisers Ammonium sulphate 18776 Calcium nitrate 402
Urea 49374 Aqueous ammonia 98189 Calcium ammonium nitrate 94306
Compound Fertilisers Mono-ammonium phosphate 8173 Other 20-20-0 614
15-15-15, 22-8-8, 17-13-13 11396
P FERTILISERS P t/year 2001 Straight P Fertilisers Rock phosphate Triple superphosphate
Single superphosphate(below 25% P2O5)
1857
Concentrated superphosphate(25% P2O5 and over)
120
Other –Basic slag 4847
Compound Fertilisers Mono-ammonium phosphate 38628 Other – 20-20-0 714 15-15-15, 17-13-13, 12-12-12 6340

UNDP/GEF Danube Regional Project 68
Total Consumption of N and P Fertiliser by Farmers in the Czech Republic Year
1997 1998 1999 2000 2001 2002 Source of data N FERTILISERS Total N consumption (tonnes) 205757 202932 200247 212988 225763 286600 the years 1997-2001 - Statistical Yearbook Total agricultural area (‘000s ha) 2985 of the Czech Republic the year 2002 - P FERTILISERS Total P consumption (tonnes) 50411 45838 40270 39834 44397 50900 Research Institute of Crop Production Total agricultural area (‘000s ha) 1258
Characteristics of N and P Fertiliser Use by Farmers in Czech Republic N FERTILISERS P FERTILISERS Crop
% CropReceiving N Fertiliser
Typical Application Rate (kg N/ha)
Typical Timing ofApplication
Receiving % Crop
P Fertiliser
Typical Application Rate (kg P/ha)
Comments
Wheat spring 98 90 spring 38,6 31 Source of Information: Wheat winter 100 122 autumn, spring 50,5 40 “%Crop” and “Application rate” - from Barley spring 100 60 spring 54,3 33 Research Institute of Crop Production Barley winter 100 92 autumn, spring 42,5 38 (tables prepared for FAO) Rye 96 90 spring 17,8 38Oat 96 70 -“- 23,0 32 “Typical timing” – information from Maize (for corn) 100 105 spring 77,4 39 district agriculture cunsultant Sunflower 100 75 -“- 15,4 32 Rapeseed 100 155 -“- 39,6 47 In face of economical situation Sugar beet 100 92 -“- 66,9 43 majority of farmers keep to recommendation Potatoes (early) 100 90 -“- 86,7 76 to apply two rations of N, first before Potatoes (for starch industry) 100 120 -“- 99,1 82 seed-time, second later in spring. Potatoes (ware) 100 100 -“- 78,2 70 In autumn there are applied P, K. Field vegetables (except potatoes) 100 128 -“- 84,6 92 N fertiliser for winter cereals only. Orchards 40 25 57,1 35 Orchards and vineyards – high rate in time of Vineyards 100 50 100,0 65 their foundation. Pasture and other grassland 44 50 spring, summer 3,1 6 Grassland - in spring or after haymaking, Maize (green, silage) 98 120 42,8 51 but mostly animal manure is applied.

Inventory of Mineral Fertiliser Use in the Danube River Basin Countries 69
Known “Bad Practice” by Farmers Regarding Nutrient Management in the Czech Republic There are not any problems with using the application rates that are higher than recommended rates or with applying mineral fertilisers at an inappropriate time of year. It is expensive for farmers to buy mineral fertilisers, so they effort to make use of them as most as possible. An agriculture consultant is available in every district. Large farms and co-operative farms apply fertilisers according to chemical analysis of soils. The second rate of N fertilisers should be calculated in accordance with an expected harvest. This practice should be introduced at all farms, including small ones. More problems are associated the application of animal fertilisers. Though there are strong rules when and how to use them, sometimes it can happen that they are applied at an inappropriate time because of the lack of storage capacity. The Czech Environment Inspection yearly solves a few accidents on streams that are related to use of slurry; such accidents are usually not related to use of mineral fertilisers. Manure is commonly stored on fields; sometimes the manure/dung heaps are not secure enough. According to my opinion (and based on the professional knowledge) one of greatest problems is arable land spreading very close to streams and rivers. There are not any legal rules for creating the protective zones along streams. Restrictions for farmers are only in water protection zones (drinking water). The farmers are permanently informed to practice contour ploughing (not down hill one) and do not grow hazard crops (such as maize) on slope fields. Strict keeping this rule can help to avoid many problems on soil erosion. Most vineyards are laid out in rows down the slopes. Only some vineyards and orchards from 70s´ and 80s´ practised terracing. It would be necessary to convert some arable land on slopes to grassland and thus reduce the risk of erosions and loss of nutrients. Additional Data There is no central register of animal manure application. All this animal fertilisers should be return to agricultural land.

UNDP/GEF Danube Regional Project 70

Inventory of Mineral Fertiliser Use in the Danube River Basin Countries 71
Annex 6
Hungary

UNDP/GEF Danube Regional Project 72

Inventory of Mineral Fertiliser Use in the Danube River Basin Countries 73
Annex 6: Hungary Types of N and P Fertiliser Commonly Used by Farmers in Hungary Type of Fertiliser
Typical Nutrient-containing Chemicals
Typical Formulation (N:P:K)
(Yearly sales in 2001, tonnes) (Yearly sales in 2000, tonnes)
N FERTILISERS (total) 552224 t 594000 t Straight N Fertilisers Ammonium sulphate 151 t 799 t Ammonium nitrate 312612 t (gran.) 343167 t (gran) Calcium nitrate Soil fert., foliar fert., and nutrient solution Urea 92543 t 94639 t Anhydrous ammonia 8079 t 53912 t Calcium ammonium nitrate 49865 t 42978 t Other Nitrogen fertilisers 88974 t 58505 t
Compound Fertilisers Compound N fertilizers, 15-15-15 68914 t 46595 t granulated 15-10-20 229 t 482 t 15-10-10 112 t 215 t Foliar fertilizers 1815 t (In solutions) 643 t
P FERTILISERS (total) 18902 t 15573 t Straight P Fertilisers Triple superphosphate Granulated fertiliser, used in diff. mixtures Superphosphate 16866 t 15191 t Other P fertilizers total
2036 t 382 t
Compound Fertilisers Mono-ammonium phosphate 12:62:0 Granulated fertiliser Di-ammonium phosphate 21:54:0 Mostly in suspension form Other comp. fertilizers with fixed 11-53-0 21301 t 18162 t formulation, granulated 0-10-24,5 8059 t 7687 t 8-21-21 7379 t 7379 t 8-16-30 2678 t 6068 t 2-18-18 778 t 390 t 7-12-12 42 t 137 t Other compound fertilizers, different
formulation 82963 t 68566 t

UNDP/GEF Danube Regional Project 74
Total Consumption of N and P Fertiliser by Farmers in Hungary Year
1997 1998 1999 2000 2001 2002(?) Source of data “Agricultural area” treated with mineral fertilizers
Total (‘000s ha) 1841.7 1766.4 1519.8 1578.7 1571.8 1511.3 Hungarian Central Statistical Officearable land (‘000s ha) 1799.5 1716.2 1540.8 1484.8 1530 1474.3orchard (‘000s ha) 7.6 9.4 8 9.5 10.3 9.6 vineyards (‘000s ha) 2.1 1.8 2 3 3 2.4
“Enterprises and co-operatives From which: meadow, pasture (‘000s ha) 29 31.5 24.6 20.2 24.5 25
Research and Information Institute for Agricultural Economics (RIIAE)
Private holdings (‘000 ha) 1010.8 1749.1 1962.5 2148.5 2302.7 2301.9 Expert estimationTotal (‘000 ha) 2852 3516 3482 3727 3875 3813 Expert estimation Total NPK nutrients supply (tonnes)
285400 328100 346600 354800 395300 423300 Research and Information Institute for Agricultural Economics (RIIAE)
Specific NPK use (kg/ha)
46.1 53 56 60.6 67.4 72.2 Experts appraisal using official statistical data
NPK nutrients used by enterprises and co-operatives (tonnes)
238800 235400 236700 224600 240100 257100 Hungarian Central Statistical Office“experts appraisal
Specific NPK use (enterprises and co-operatives, average) (kg/ha)
85.3 86 88 85.5 109.4 119.7 Experts appraisal using official statistical data
NPK nutrients used by private holdings (tonnes)
46600 92700 109900 130200 155200 166200 Experts appraisal
N FERTILISERS Total N nutrient supply
(tonnes) 206100 247900 262400 257700 275500 293700 Research and Information Institute for Agricultural Economics/HCSI
N nutrient used by enterprises and co-operatives (tonnes)
172414 177962 179182 163059 192023 178427 Experts appraisal using national average nutrient ratio from statistics
Total agricultural area treated with N fertilisers (enterprises and co-operatives, ‘000s ha)
1841.7 1766.4 1519.8 1578.7 1571.8 1511.3 Experts appraisal: 100 % of the treated area received N nutrient
Specific N use (enterprises and co-operatives, average) (kg/ha)
98.5 106.1 182 108.7 128.6 120 Experts appraisal
N nutrient used by private holdings (tonnes)
33686 69938 83218 94641 83477 115273 Experts appraisal using official statistical data

Inventory of Mineral Fertiliser Use in the Danube River Basin Countries 75
Year1997 1998 1999 2000 2001 2002(?) Source of data
P FERTILISERS Total P supply (tonnes) 42000 39100 39400 45100 57600 59800 Research and Information Institute for
Agricultural Economics/HCSI Total agricultural area treated with P fertilisers
(‘000s ha) 2139 2637 2612 2795 2906 2860 Experts appraisal: 75 % of the total treated area received P nutrient
P nutrient used by enterprises and co-operatives (tonnes)
35103 26600 26984 28524 35054 36251 Experts appraisal using national average P nutrient ratio from the statistics
Total agricultural area treated with P fertilisers (enterprises and co-operatives, ‘000s ha)
1841.7 1766.4 1519.8 1578.7 1571.8 1511.3”” Experts appraisal: 100 % of the treated area received P nutrient
Specific P use (enterprises and co-operatives, average) (kg/ha)
19 15 18 18 22 24 Experts appraisal
P nutrient used by private holdings (tonnes)
6897 12500 12416 16576 22546 23549 Experts appraisal using official statistical data
ANIMAL MANURE APPLICATION Data from the enterprises and co-
operatives only!
(‘000 tonnes) 4908 3257 3915 3863 2869 --- Hungarian Central Statistical Office On arable land (‘000 tonnes) 4839 3172 3822 3737 2746 --- Hungarian Central Statistical Office
In orchards (‘000 tonnes) 30 38 49 52 42 --- Hungarian Central Statistical Office
Total manure applied from which applicated:
In vineyards (‘000 tonnes) 5 9 15 40 15 --- Hungarian Central Statistical Office
Total (ha) 118238 92065 107910 104339 95898 --- Hungarian Central Statistical Office arable land (ha) 110293 84527 99592 96924 84632 --- Hungarian Central Statistical Office orchard (ha) 892 1086 1203 1475 1340 --- Hungarian Central Statistical Office
Agricultural area with manure application from witch: vineyard (ha) 239 392 454 996 666 --- Hungarian Central l Statistical Office

UNDP/GEF Danube Regional Project 76
Characteristics of N and P Fertiliser Use by Farmers in Hungary N FERTILISERS P FERTILISERS Sector/Crop
% Crop Receiving N Fertiliser
Typical Application Rate (kg N/ha)
Typical Timing of Application
% Crop Receiving P Fertiliser
Typical Application Rate (kg P/ha)
Comments
Data from the enterprises and co-operatives only for 2002 Wheat, barley etc 95 100-110 base 40
top 60-70
95 30-35
Maize 96 100-110 base 60 96
top 40-50
20-30
Sunflower, 91 50-60 base 35 top 25
91 20
Sugar beet 88 60-70 base 30-35
top 40
88 50-60
Potatoes 130-140 80-90 Orchards (apple only) 40-50 base 20-25
top 20-25
20-25
Vineyards 30-6+0 30-80 Rape 105-115 30-40 Peas --- 60 base 35
top 25 30

Inventory of Mineral Fertiliser Use in the Danube River Basin Countries 77
Known “Bad Practice” by Farmers Regarding Nutrient Management in Hungary No crop-specific information available - only general statements as follows: • poor application due to old or poorly maintained equipment. The agricultural machinery in general – and the mineral fertiliser spreaders also – are mostly
old and unsuitable for precise and equal spreading. For 10 years 70% of the machinery was more than 10 years old. • spreading too closely to surface waters e.g. on hilly regions • applying mineral fertiliser at an inappropriate time of year e.g. spreding the mineral fertilizers on the top of the snow in winter • using application rates that are locally higher than optimal rates on big fields, where the soil quality differences are high. • A big part of the fertilisers is only milled, their spreading parameters becoming worsen during the storage. • The knowledge of the farmers is poor concerning the right adjustment and operating the spreaders. (Sources of information: Report of Hungarian Institute of Agricultural Engineering, Gödöllő; Dr I. Marton: PhD dissertation, Keszthely,2001; Agroforum/ Plant nutrition section, 2002; Res. & Inf. Inst. For Agr.Economics - Report on Agrochemical plants, Education and Extension Institute of the Ministry of Agriculture) Comments 1. There are official statistical data from the yearly sales (supply) of the mineral fertilisers regarding the nutrients, but no general cadastre from the real use
of fertiliser on the fields (plots). 2. The yearly N and P nutrient use was calculated on the ground of the average N:P:K ratio from the total NPK “use” 3. There are more official data from the plant nutrition activity of the agricultural enterprises and co-operatives so the nutrient use of private holdings was
calculated as the difference of the enterprises/co-operatives and the total. 4. The ratio of the land area treated with mineral fertilisers is approximately 70% of the total at the enterp./co-ops in average, at the main crops is higher,
appr. 90%. 5. The consumption of mineral fertiliser at the enterprise/co-ops is much higher as the total average – but at present is not enough high – comparing to the
needs. It means that the use of mineral fertiliser of the private holdings is even lower in average. Many of the private farmers do not use any fertilisers because of the lack of capital. We can calculate approximately the fertilised area in this segment with the average consumption and the real fertiliser quantity.
There are results of the nutrient use of the main crops and cultures from a representative survey made by the Central Soil and Plant Protection Service measuring more than 500 000 ha in all over Hungary. The average application rate is shown in the Table above. From the results we can state that all the fertilised crops were treated N and nutrients too. That is why the areas treated was calculated equally by the N and P fertilisation.

UNDP/GEF Danube Regional Project 78

Inventory of Mineral Fertiliser Use in the Danube River Basin Countries 79
Annex 7
Moldova

UNDP/GEF Danube Regional Project 80

Inventory of Mineral Fertiliser Use in the Danube River Basin Countries 81
Annex 7: Moldova Types of N and P Fertiliser Commonly Used by Farmers in Moldova Type of Fertiliser
Typical Nutrient-containing Chemicals
Typical Formulation (N:P:K)
Comments
N FERTILISERS Straight N Fertilisers Ammonium nitrate This type of fertiliser constitutes about 99% of total straight N fertilisers applied in Moldova Compound Fertilisers Mono-ammonium phosphate 11 : 44 : 0 This type of fertiliser constitutes about 40% of total compound fertilisers applied in Moldova Compound fertiliser 17 : 17 : 17
“Nitroamofosca” This type of fertiliser constitutes about 60% of total compound fertilisers applied in Moldova
P FERTILISERS Straight P Fertilisers Not used Compound Fertilisers Mono-ammonium phosphate 11 : 44 : 0 This type of fertiliser constitutes about 40% of total compound fertilisers applied in Moldova Compound fertiliser 17 : 17 : 17
“Nitroamofosca” This type of fertiliser constitutes about 60% of total compound fertilisers applied in Moldova
Total Consumption of N and P Fertiliser by Farmers in Moldova Year
1997 1998 1999 2000 2001 2002 Source of data N FERTILISERS Total N consumption (tonnes) 11,70 19,90 6,70 8,10 13,45 20,58 Department for Soil Fertilization,State Inspectorate
of the Ministry of Agriculture and Food Industry Total agricultural area treated (‘000s ha) 377,4 568,6 197,0 270,0 395,6 588,0 As above
P FERTILISERS Total P consumption (tonnes) 0,50 0,10 0,10 0,10 0,28 1,83 As above Total agricultural area treated (‘000s ha) 26,3 4,5 5,0 5,9 12,2 83,2 As above

UNDP/GEF Danube Regional Project 82
Characteristics of N and P Fertiliser Use by Farmers in Moldova N FERTILISERS P FERTILISERS Crop
% Crop Receiving N Fertiliser
Typical Application Rate (kg N/ha)
Typical Timing of Application
% Crop Receiving P Fertiliser
Typical Application Rate (kg P/ha)
Comments
Wheat, barley etc 60 - 75 35 - 55 In spring and
summer 5 – 10 15 – 25
Maize 10 - 15 25 - 35 In spring 0 0 The P fertilisers are not applied to maize because of the current economic situation
Sunflower 5 - 10 25 - 30 In spring 0 0 The P fertilisers are not applied to sunflower because of current economic situation
Sugar beet 35 - 45 35 - 55 In spring 30 - 40 15 – 30 Tobacco 10 - 15 25 - 35 In spring 5 - 10 15 – 25 Potatoes 30 - 40 25 – 35 In spring 30 – 40 20 – 25 Field vegetables (except potatoes) 20 - 25 25 – 35 In spring and
summer 20 – 25 15 – 25
Glasshouse vegetables 60 - 80 25 – 30 In autumn and spring
60 – 80 15 - 25
Orchards 0 0 0 0 The fertilisers are not applied to orchards because of current economic situation
Vineyards 0 0 0 0 The fertilisers are not applied to vineyards because of current economic situation
Pasture and other grassland 0 0 0 0 The fertilisers are not applied to pasture because of current economic situation

Inventory of Mineral Fertiliser Use in the Danube River Basin Countries 83
Known “Bad Practice” by Farmers Regarding Nutrient Management in Moldova Crops Known Bad Practice by Farmers Source of Information Wheat, barley, maize, sunflower Unilateral application of straight N fertilisers (increase the risk of water pollution with
nitrogen) Frequent fertilisers storage in unauthorized places
Mr Valentin Gurau, senior specialist of the Department for Soil Fertilization, Plant Protection with the State Inspectorate of the Ministry of Agriculture and Food Industry
Maize, sunflower, sugar beet, tobacco Irregular application due to old equipment As above Frequent fertilisers storage in unauthorized places
Potatoes, field vegetables Spreading too closely to water sources (ponds and rivers) As above Glasshouse vegetables Applying mineral fertilisers without estimate the nutrient needs of vegetables and soil As above
According to the data of the Department for Soil Fertilization, Plant Protection with the State Inspectorate in Moldova were applied for soil fertilization 157,837 tonnes of manure in 2001 and 199,245 tonnes – in 2002. Currently the use of mineral fertilisers in agriculture of Moldova was reduced by 10 – 15 times comparative to the 1990s. At the moment in Moldova does not exist the special report on the environmental impact of mineral fertilisers use in the last years. The latest report on this issue is: “Nutrient Balances for Danube Countries. Country Report Moldova. Volume 1. 1996”, which was prepared of the National Institute of Ecology. Some of these data’s report were included in the “UNDP / GEF Danube Pollution Reduction Programme, National Review, 1998. Moldova. Executive Summary”.
test
Additional Data

UNDP/GEF Danube Regional Project 84

Inventory of Mineral Fertiliser Use in the Danube River Basin Countries 85
Annex 8
Romania

UNDP/GEF Danube Regional Project 86

Inventory of Mineral Fertiliser Use in the Danube River Basin Countries 87
Annex 8: Romania Types of N and P Fertiliser Commonly Used by Farmers in Romania Type of Fertiliser
Typical Nutrient-containing Chemicals
Typical Formulation (N:P:K)
Comments
N FERTILISERS Straight N Fertilisers Ammonium sulphate 21% N+24 S Ammonium nitrate 33-34.5% N
Urea 46% NAqueous ammonia 250 (2.9:0:0)
Compound Fertilisers Mono-ammonium phosphate 61% P2O5 ; 12% N Di-ammonium phosphate 10% P 2O5: 20%N
P FERTILISERS Straight P Fertilisers Triple superphosphate 55-66 P2O5: 13-18 N Compound Fertilisers Mono-ammonium phosphate 48 P2O5: 11 N : 0 K Di-ammonium phosphate 10:20:0 Poliphosphats 56-60 13-18 0 Total Consumption of N and P Fertiliser by Farmers in Romania Year
1991 1998 1999 2000 2001 2002 Source of data N FERTILISERS Total N consumption (tonnes) 651 505 495 460 390 340 Agriculture Ministry Total agricultural area treated (‘000s ha) 5400000 4200000 3100000 2900000 2700000 2500000
P FERTILISERS Total N consumption (tonnes) 313 225 218 205 183 165 As above Total agricultural area treated (‘000s ha) 2900000 2050000 1950000 1800000 1750000 1700000

UNDP/GEF Danube Regional Project 88
Characteristics of N and P Fertiliser Use by Farmers in Romania N FERTILISERS P FERTILISERS Crop
% Crop Receiving N Fertiliser
Typical Application Rate (kg N/ha)
Typical Timing of Application
% Crop Receiving P Fertiliser
Typical Application Rate (kg P/ha)
Comments
Wheat, barley etc 45 30-66 autumn 48 30-60 N 45: P 23: K 0.5: trends in fertiliser use Maize 35 48-60 spring 20 48-60 -//- -//- -//- Sunflower 40 48-60 spring 20 48 Sugar beet 40 60-80 spring 48 48-60 Tobacco 20 20-45 spring 20 40-60 Potatoes 60 60-120 spring 40 60-80Field vegetables (except potatoes) 65 60-80 spring 45 30-60 Glasshouse vegetables 85 60-80 vegetation 35 30-70 Orchards 20 40-60 vegetation 20 30-40Vineyards 45 30-60 spring 25 30-40Pasture and other grassland 15 30 spring - -

Inventory of Mineral Fertiliser Use in the Danube River Basin Countries 89
Annex 9
Serbia & Montenegro

UNDP/GEF Danube Regional Project 90

Inventory of Mineral Fertiliser Use in the Danube River Basin Countries 91
Annex 9: Serbia & Montenegro Types of N and P Fertiliser Commonly Used by Farmers in Serbia & Montenegro Type of Fertiliser
Typical Nutrient-containing Chemicals
Typical Formulation (N:P:K)
Comments (Trade names of Fertilizer and Labelling)
N FERTILISERS Straight N Fertilisers Ammonium nitrate AN 30-35% Calcium nitrate CALCIJUM NITRAT 15,5+25,5% Urea (Carbamid) UREA 44-46 %; Terafert 36% Compound Fertilisers Mono-ammonium phosphate N-11,1 % +P2O5-51,8 % Chilean Nitrate (KNO3) N-13%+K-46% NPK in Different % 15:15:15; 13:13:13; 14:14:14; 10:30:10; 8:16:24; 7:14:24;
12:24:12; 17:13:10 No specific Names
Compound Hard Fertilisers with Microelements
NPK + Microelements (B, Cu, Fe, Mn, Mo, Zn, Mg etc.)
Compound Liquid Fertiliserswith Microelements
NPK + Microelements (B, Cu, Fe, Mn, Mo, Zn, Mg etc.)
P FERTILISERS Straight P Fertilisers Rock phosphate (SP) SP – Powder 16-18%, SP – Granulate 17,5 –
19% Triple superphosphate (TSP) TSP- Powder 43-43,5 %, Granulate 45,1 %
Compound Fertilisers Duo – Calcium 40% P2O5 - Calcium – P 60-65% -
Other, 20-30% - Other, 5-8% P2O5 Other, 5,5-7% P

UNDP/GEF Danube Regional Project 92
Total Consumption of N and P Fertiliser by Farmers in Serbia & Montenegro Year
1997 1998 1999 2000 2001 2002(?) Source of data N FERTILISERS Total N consumption (tonnes) 89.000 89.000 70.000 74.000 92.000 66.000 Statistical Yearbook of the FRY, 2002 Total agricultural area treated with N
fertilisers (‘000s ha) 2.382 2.360 2.128 2.750 2.630 2.300 Statistical Yearbook of the FRY, 2002
P FERTILISERS Total N consumption (tonnes) 26.000 20.000 14.000 16.000 19.000 18.600 Statistical Yearbook of the FRY, 2002 Total agricultural area treated with P
fertilisers (‘000s ha) 2.380 2.410 2.350 2.340 2.730 2.347 Statistical Yearbook of the FRY, 2002
N – Consumption (Wheat, Maize, Sugar beet, Sunflower) P – Consumption (Maize, Sugar beat, Sunflower, Soya been, Vegetable, Fodder Crops) Characteristics of N and P Fertiliser Use by Farmers in Serbia & Montenegro N FERTILISERS P FERTILISERS Crop
% Crop Receiving N Fertiliser
Typical Application Rate (kg N/ha)
Typical Timing of Application
% Crop Receiving P Fertiliser
Typical Application Rate (kg N/ha)
Typical Application Rate (kg P/ha)
Comments
Wheat, barley etc 95 250 Top Dressing 5 30 Basic Fertilising Maize 50 100 Top Dressing 100 200 Basic FertilisingSunflower 50 95-127 Top Dressing 100 100-120 Basic FertilisingSugar beet 80 116-159 Top Dressing 100 110-150 Basic Fertilising Tobacco 50 46-83 Top Dressing 90 88-112 Basic Fertilising Potatoes 20 140 Top Dressing 90 105-114 Basic Fertilising ManureField vegetables (except potatoes) 50 100 Top Dressing 80 150 Basic Fertilising Manure Glasshouse vegetables 70 150 Top Dressing 90 200 Basic Fertilising Manure Orchards 70 100 Top Dressing 20 200 Basic Fertilising ManureVineyards 80 100 Top Dressing 40 200 Basic Fertilising ManurePasture and other grassland No No Top Dressing 10 200 Basic Fertilising Liquid Manure

Inventory of Mineral Fertiliser Use in the Danube River Basin Countries 93
Known “Bad Practice” by Farmers Regarding Nutrient Management in Serbia & Montenegro Crops Known Bad Practice by Farmers Source of Information
Wheat, barley etc No application of Basic Fertilizer Maize Sunflower Sugar beet Tobacco Potatoes
Application of basic fertilizer in inappropriate time, that is before sowing and not in autumn by tilling.
Orchards Small quantity applied without analysis of soil chemical contents and quality. Pasture and other grassland No control of using liquid manure. Others Using of all kind of fertilizer close to the water (rivers, springs, etc.)
Common practice by farmers caused by inadequate education and awareness absence of the negative environment impacts. Own experience and experts knowledge from Faculty of Agriculture, Information from Farmers and Local Communities.

UNDP/GEF Danube Regional Project 94

Inventory of Mineral Fertiliser Use in the Danube River Basin Countries 95
Annex 10
Slovakia

UNDP/GEF Danube Regional Project 96

Inventory of Mineral Fertiliser Use in the Danube River Basin Countries 97
Annex 10: Slovakia Types of N and P Fertiliser Commonly Used by Farmers in Slovakia Type of Fertiliser Typical Nutrient-containing Chemicals Typical Formulation (N:P:K) Comments N FERTILISERS Straight N Fertilisers Ammonium sulphate 7% share on total within N fertilisers in 2002 Ammonium nitrate 7.1% share on total within N fertilisers in 2002 Ammonium-calcium nitrate 45.4% share on total within N fertilisers in 2002 Urea 15.2% share on total within N fertilisers in 2002 Ammonium nitrate with urea (liquid fertiliser) 14.2% share on total within N fertilisers in 2002 Ammonium nitrate with ammonium sulphate 9.6% share on total within N fertilisers in 2002 P FERTILISERS Straight P Fertilisers Triple superphosphate 25.8% share on total within P fertilisers in 2002 Single superphosphate 60% share on total within P fertilisers in 2002 Hyperphosphate (12.3% P) 14.2% share on total within P fertilisers in 2002
Compound Fertilisers Mono-ammonium phosphate (8534 t in 2002) Compound NPK fertilisers (in different N-P-K ratios) NPK 15-15-15 dominates within
NPK fertilisers – 42.3 t Dominate in the structure of compound fertilisers (93174 t in 2002).
Total Consumption of N and P Fertiliser by Farmers in Slovakia Year
1997 1998 1999 2000 2001 2002(?) Source of data N FERTILISERS Total N consumption (tonnes) 88017 81842 65393 72653 76032 81792 Slovak Statistical Office data Total agricultural area treated (‘000s ha)
P FERTILISERS Total P consumption (tonnes) – as P2O5 24494 20475 13115 15731 17559 18493 Slovak Statistical Office data Total agricultural area treated (‘000s ha)

UNDP/GEF Danube Regional Project 98
Characteristics of N and P Fertiliser Use by Farmers in Slovakia N FERTILISERS P FERTILISERS Crop
% Crop Receiving N Fertiliser
Typical (average) Application Rate (kg N/ha)
Typical Timing of Application
% Crop Receiving P Fertiliser
Typical (average) Application Rate (kg P/ha)
Comments
Wheat, barley etc 90-100% 40 – 90 mostly in spring 4 – 9 Grain maize 90-100% 100 In spring 9 Sunflower 90-100% 75 In spring 7Sugar beet 90-100 % 70 In spring 15 Tobacco 90-100 % 25 Before seeding 17 Potatoes 90-100 % 95 In spring 19 Field vegetables (except potatoes) 90-100 % 80 – 120 In spring 9 – 18 Glasshouse vegetables (100%) before/after planting Orchards 40-50 % 50 In spring 11 Vineyards 50-60 % 60 In spring 15 Pasture and other grassland 30-40 % 20 after cuts 1 Not after the last Rape (seeds) 90-100 % 130 Mostly in spring 10 Silage maize 60-70 % 83 Before seeding 5
The rate of phosphorus is often a result of compound fertilisers use

Inventory of Mineral Fertiliser Use in the Danube River Basin Countries 99
Known “Bad Practice” by Farmers Regarding Nutrient Management in Slovakia There are rather general opinions of inappropriate fertiliser and animal manure utilisation as follows: • often neglecting of nutrients applied especially from liquid manures • use NPK fertilisers is not always appropriate to meet the crop demands with regard to actual inorganic N, available P and K supply within concrete field
(Compound NPK fertiliser can not be applied in autumn when in the soil is sufficient Nin supply – often after legumes or liquid animal manure application or as consequence of residual N in the soil; by compound NPK fertiliser can not cover different crop needs on nutrients such as P and K when their available soil supply is different – occurrence of under/over -fertilisation).
• use of soil analysis for precision the splitted N-rates is not systematic and rather oriented on market crops (winter wheat, spring barley, sugar beet) • good agriculture practice (environmentally oriented) is in the stage of introducing into farm management - so inconsistency occurs. Additional Data Precise information on area treated with N and P fertilisers is not available; use of fertilisers is monitored on around 70 % of agricultural soil – involved set of farms depends on return of completed questionnaires sent to the farmers. Official statistical data are assuming the total agricultural area. Of course, mineral fertilisers are primarily concerned on arable land.

UNDP/GEF Danube Regional Project 100

Inventory of Mineral Fertiliser Use in the Danube River Basin Countries 101
Annex 11
Slovenia

UNDP/GEF Danube Regional Project 102

Inventory of Mineral Fertiliser Use in the Danube River Basin Countries 103
Annex 11: Slovenia Types of N and P Fertiliser Commonly Used by Farmers in Slovenia Type of Fertiliser Typical Nutrient-containing Chemicals Typical Formulation (N:P:K) Comments N FERTILISERS Straight N Fertilisers Ammonium nitrate Not widely used Calcium nitrate Not widely used Urea Not widely used
Calcium ammonium nitrate/ Urea ammonium nitrate
Mostly used
Compound Fertilisers Mono-ammonium phosphate 12 % NPK with emphasis on P and K 15:15:15, 7:20:30, 8:26:26 Mostly used NPK with Mg and B For sugar beet, orchards, vineyards NK 16:00:44 16 %
P FERTILISERS Straight P Fertilisers Rock phosphate Available but too expensive for the farmers to use Compound Fertilisers Mono-ammonium phosphate 12 – 52 – 0 Not widely used Other – PK 0 – 15 – 30 Not widely used
Year
Total Consumption of N and P Fertiliser by Farmers in Slovenia
1997 1998 1999 2001 Source of data 2000 N FERTILISERS Total N consumption (tonnes) 34102 34813 34392 34771 34847 Statistical office of RS Total agricultural area treated (‘000s ha) 411 410 439 431 434 arable land, permanent crops
Total P consumption (tonnes) 17534 18785 19751 1 16685
Total agricultural area treated (‘000s ha) 431 arable land, permanent crops and cut grassland (2 or more cuts) 411 410 439 434
and cut grassland (2 or more cuts) P FERTILISERS 8375

UNDP/GEF Danube Regional Project 104
Characteristics of N and P Fertiliser Use by Farmers in Slovenia
N FERTILISERS P FERTILISERS Crop
% Crop Receiving N Fertiliser
Typical Application Rate (kg N/ha)
Typical Timing of Application
% Crop Receiving P Fertiliser
Typical Application Rate (kg P/ha)
Comments
Wheat, barley etc 90 40 – 60 March, April,
May, September*
80 60 – 80 * winter wheat
Maize 90 50 – 100 April, May, beginning of
June
80 60 – 100
Sugar beet 100 40 – 80 ½ at ng time, ½ side
dressing
sowi 100 100
Potatoes 80 80 – 140 80 60 – 100 Field vegetables (except potatoes) 100 With fertigation:
10 – 20 Without
fertigation: 50 – 100
*
With fertigation:
100
5 – 10
50 – 100
* depends on the type of vegetable mostly March - September
Glasshouse vegetables 100 20 50 – 100
Whole year 100 10 100
50 – 70 75* 20 * intensive orchards Vineyards 60 50 15.4. – 15.6. 30 – 40 50 Pasture and other grassland 25 50 March – May 25 20
Orchards 75* Budbreak
IMPORTANT: There is no statistical data available, therefore these raw estimations are based on an expert knowledge.

Inventory of Mineral Fertiliser Use in the Danube River Basin Countries 105
Known “Bad Practice” by Farmers Regarding Nutrient Management in Slovenia Crops Known Bad Practice by Farmers Source of Information
Over dosage of N at sowing (>40 kg N/ha)
Maize On large livestock farms soils are rich with organic N an therefore any N addition is superfluousSugar beet On large livestock farms soils are rich with organic N an therefore any N addition is superfluous
Chair for Crop Science and Sustainable Farming, Agricultural Institute of Slovenia
Potatoes Over dosage of N and P Field vegetables (except potatoes) Over dosage of N and P Glasshouse vegetables Over dosage of N and P
Agricultural Institute of Slovenia
Orchards Where the Integrated fruit production rules are not practised, which is 15% of the whole Slovenian fruit production
Chair for Fruit Production, Biotechnical Faculty, Agricultural Institute of Slovenia
Pasture and other grassland Low values of P and K due to the unsuitable use mineral fertilisers Agricultural Institute of Slovenia Others Spreading too closely to water sources is (or it use to be) a common practice.
“Water act” which has been accepted in 2002 interdicts spreading fertilisers or pesticides in the 5 m strip near smaller creaks and in 15 m strip near main water courses.
Wheat, barley etc

UNDP/GEF Danube Regional Project 106

Inventory of Mineral Fertiliser Use in the Danube River Basin Countries 107
Annex 12
Ukraine

UNDP/GEF Danube Regional Project 108

Inventory of Mineral Fertiliser Use in the Danube River Basin Countries 109
Annex 12: Ukraine Types of N and P Fertiliser Commonly Used by Farmers in Ukraine
Type of Fertiliser Typical Nutrient-containing Chemicals Typical Formulation (N:P:K)
Comments (product names)
N FERTILISERS Straight N Fertilisers Ammonium sulphate Ammonium nitrate Urea Ammonium sulphate Compound Fertilisers Mono-ammonium Phosphate N -11%; P2O5 - 49%; N - 3%; P2O5 - 5%; N -2%; P2O5 -
16%; N -1-2%; P2O5 -18-29%; N - 3%; P2O5 -17-18% Superagro NP, Ammonium Phosphate, 2-16-0; Granphose
Diammonium Phosphate N -16%; P2O5 -16% Ammophosphate NP Compound - NK Ecolist N -10%; K2O -6%; S -5%; B -0,4%
Compound – various NPK N -3-20%; P2O5 -5-41%; K2O -8-38%; N -2,1-6%; P2O5 - 0,8-17%; K2O -0,8-14,0%; N -6-18%; P2O5 -7-24%; K2O -8-24%; N -10-17%; P2O5 -9-19%; K2O -9-17%; N -8-18%; P2O5 -5-17%; K2O -16-28%; N -4,3%; P2O5 -1,9%; K2O -1,9%; N -3%; P2O5 -5%; K2O -5%;
Aquarine; Tekos; Kemira NPK; Nitrogranphoska; Rastvorin; Riverm; Superagro NPK
P FERTILISERS Straight P Fertilisers Super Phospfate (GR) P2O5 - 17%-20% Compound Fertilisers Mono-ammonium Phosphate N -11%; P2O5 - 49%; N - 3%; P2O5 - 5%; N -2%; P2O5 -
16%; N -1-2%; P2O5 -18-29%; N - 3%; P2O5 -17-18% Superagro NP, Ammonium Phosphate, 2-16-0; Granphose
Di-ammonium Phosphate N -16%; P2O5 -16% Ammophosphate NP Compound - PK P2O5 -14,4%; K2O -14,5% Granphoska
Compound – various NPK N -3-20%; P2O5 -5-41%; K2O -8-38%; N -2,1-6%; P2O5 - 0,8-17%; K2O -0,8-14,0%; N -6-18%; P2O5 -7-24%; K2O -8-24%; N -10-17%; P2O5 -9-19%; K2O -9-17%; N -8-18%; P2O5 -5-17%; K2O -16-28%; N -4,3%; P2O5 -1,9%; K2O -1,9%; N -3%; P2O5 -5%; K2O -5%;
Aquarine; Tekos; Kemira NPK; Nitrogranphoska; Rastvorin; Riverm; Superagro NPK

UNDP/GEF Danube Regional Project 110
Total Consumption of N and P Fertiliser by Farmers in Ukraine Year
1997 1998 2000 2001 2002 Comments N FERTILISERS Total N consumption (tonnes) 223,3 410,3 406,5 327,2 318,2 311,1 Total agricultural area treated with N
fertilisers (‘000s ha) 9317 8 4632 204 7196 6388 6226
Total N consumption (tonnes)
76,1 62,0 37,6
Total agricultural area treated with P fertilisers (‘000s ha)
9317 8204 7196 4632
1999
P FERTILISERS 103,7 52,0 55,0
6388 6226
Characteristics of N and P Fertiliser Use by Farmers in Ukraine
P FERTILISERS N FERTILISERS Crop
Typical Timing of Application
Comments
% Crop Receiving N Fertiliser
Typical Application Rate (kg N/ha)
% Crop Receiving P Fertiliser
Typical Application Rate (kg P/ha)
Wheat, barley etc 60 33 spring 60 31 Maize 42 27 spring 7,2 Sunflower 12 2,5 spring 2,1 Sugar beet 68 59 spring 20 Tobacco - - - - - Potatoes 52 3 9 spring 26Field vegetables (except potatoes) 31 27 spring 12 Pasture and other grassland 13 5,8 spring 0,6

Inventory of Mineral Fertiliser Use in the Danube River Basin Countries 111
Known “Bad Practice” by Farmers Regarding Nutrient Management in Ukraine Agricultural policy of Ukraine in part of agrochemical protection of plants and certain out of control activities of farmers make the agri-industrial sector un efficient. It causes overuse of fertilisers and pesticides and does facilitate pollution of the environment - particularly water, air and soil. It also induces soil erosion and sedimentation of water reservoirs. There are the following bad agricultural practices that are common in Ukraine: • Farmers use out of date, illegal and non-certified pesticides and fertilisers that cost much less than normal. The practice causes soil oxidisation and has
unpredictable effects on the environment and crops. • Farmers apply machines with non-point sprayers. It makes fertilisers spread too largely and thus contaminate soils and water. It also causes over-
enrichment of fertilisers to crops.
• llutants come easily to air and finally drop down into water and soils. • No practice of covered storage of animal wastes. It causes air pollution and water eutrophication (nitrogen and phosphorous load).
• de planting of forest and grass buffers around agricultural fields in order to protect water basins from sedimentation.
• 19 thousand tones of pesticides prohibited for use are stored. The Cabinet of Ministers of Ukraine issued the Decree that prohibited some chemical weeds- and plants-killers. Hence agricultural enterprises came Negative list fertilisers to specials storage places. For the time being the chemicals started dropping down to soils and contaminating water and air.
• There are no unique or complex fertilisers. Farmers use several kinds of fertilisers for every certain kind of weeds and pests. It results in mixing of fertilisers and thus unpredictable influence on the environment and crops. Farmers do not apply the practice of vegetative cover. It makes po
• Farmers do not apply the practice of crop rotation following short-term economic purposes. Steadily it causes more and more poor yields and thus farmers apply more and more fertilisers. Local agriculture and forest bodies do not provi
• Local agriculture, forest and water industry bodies do not provide engineering protection of water streams and water reservoirs from sedimentation due to agricultural activity. In Ukraine around