inventory. the amount of material, a company has in stock at a specific time is known as inventory...
TRANSCRIPT

Inventory
The amount of material, a company has in stock at a specific time is known as inventory or in terms of money it can be defined as the total capital investment over all the materials stocked in the company at any specific time.

Inventory may be in the form of,

Why Inventories?
Inventories are needed because demand and supply can not be matched for physical and economical reasons. There are several other reasons for carrying inventories in any organization.
To safe guard against the uncertainties in price fluctuations, supply conditions, demand conditions, lead times, transport contingencies etc.

To reduce machine idle times by providing enough in-process inventories at appropriate locations.
To take advantages of quantity discounts, economy of scale in transportation etc.
To reduce the material handling cost of semi-finished products by moving them in large quantities between operations.

To reduce clerical cost associated with order preparation, order procurement etc.

Relevant Inventory CostsUnit cost: : it is usually the purchase price of the item
under consideration. If unit cost is related with the purchase quantity, it is called as discount price.
Procurement costs:
This includes the cost of order preparation, tender placement, cost of postages, telephone costs, receiving costs, set up cost etc.
Carrying costs:
This represents the cost of maintaining inventories in the plant. It includes the cost of insurance, security, warehouse rent, taxes, interest on capital engaged, spoilage, breakage etc.
Stock out costs
This represents the cost of loss of demand due to shortage in supplies. This includes cost of loss of profit, loss of customer, loss of goodwill, penalty etc.

Three Mathematical Models for Determining Order Quantity
Economic Order Quantity (EOQ or Q System) An optimizing method used for determining
order quantity and reorder points Economic Production Quantity (EPQ)
A model that allows for incremental product delivery
Quantity Discount Model Modifies the EOQ process to consider cases
where quantity discounts are available

Economic Order Quantity EOQ Assumptions:
Demand is known & constant - no safety stock is required
No quantity discounts are available
Ordering (or setup) costs are constant
All demand is satisfied (no shortages)
The order quantity arrives in a single shipment

EOQ: Total Cost Equation
cost setupor ordering cost holding annual
ordered be oquantity tdemand annual
cost annual total
2
SHQDTCWhere
HQ
SQ
DTCEOQ

EOQ Total CostsTotal annual costs = annual ordering costs + annual
holding costs

The EOQ Formula
Minimize the TC by ordering the EOQ:
H
DSEOQ
2

When to Order:The Reorder Point
Without safety stock:
With safety stock:days/weeksintimelead
unitsindemandlydaily/week
unitsinpointreorderwhere
L
d
R
dLR
unitsin stock safety where
SSSSdLR

EOQ Example
Weekly demand = 240 units No. of weeks per year = 52 Ordering cost = $50 Unit cost = $15 Annual carrying charge = 20% Lead time = 2 weeks

EOQ Example SolutionyearunitsD /480,1224052
yearperunitperH 3$152.0
unitsH
DSQ 64598.644
3
50480,1222
unitsdLR
HQ
SQ
DTC
4802240
$1,934.945.96744.967
32
64550
645
480,12
2

ABC Inventory Classification ABC classification is a method for determining level
of control and frequency of review of inventory items A Pareto analysis can be done to segment items into
value categories depending on annual dollar volume A Items – typically 20% of the items accounting for
80% of the inventory value-use Q system B Items – typically an additional 30% of the items
accounting for 15% of the inventory value-use Q or P C Items – Typically the remaining 50% of the items
accounting for only 5% of the inventory value-use P
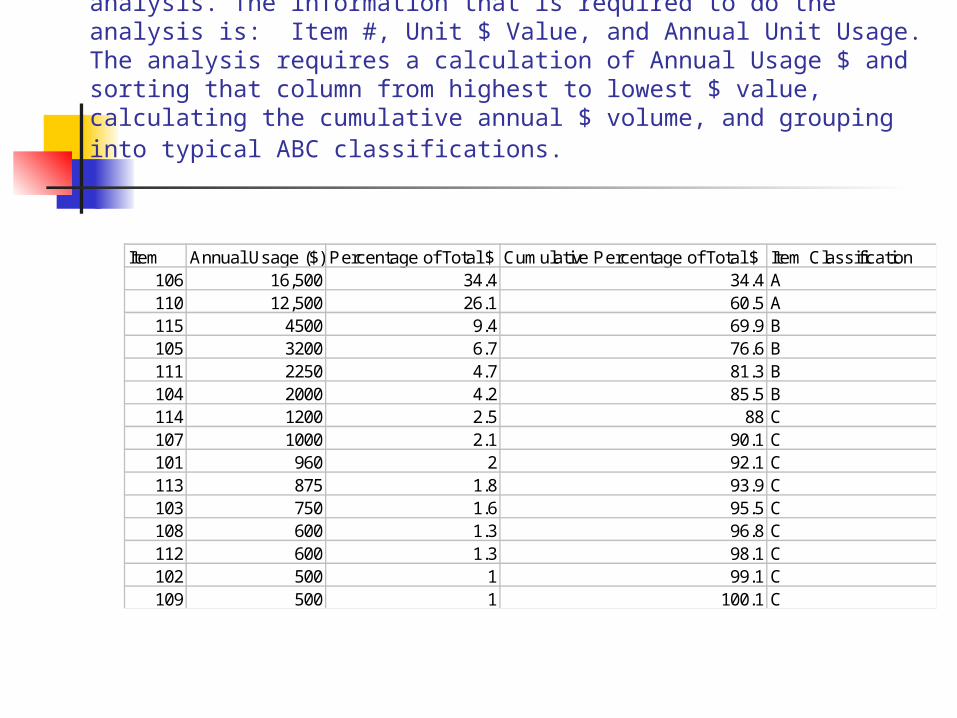
ABC Example: the table below shows a solution to an ABC analysis. The information that is required to do the analysis is: Item #, Unit $ Value, and Annual Unit Usage. The analysis requires a calculation of Annual Usage $ and sorting that column from highest to lowest $ value, calculating the cumulative annual $ volume, and grouping into typical ABC classifications.
Item Annual Usage ($) Percentage of Total $ Cumulative Percentage of Total $ Item Classification106 16,500 34.4 34.4 A110 12,500 26.1 60.5 A115 4500 9.4 69.9 B105 3200 6.7 76.6 B111 2250 4.7 81.3 B104 2000 4.2 85.5 B114 1200 2.5 88 C107 1000 2.1 90.1 C101 960 2 92.1 C113 875 1.8 93.9 C103 750 1.6 95.5 C108 600 1.3 96.8 C112 600 1.3 98.1 C102 500 1 99.1 C109 500 1 100.1 C

V.E.D Analysis
V- Vital items E- Essential Items D- Desirable Items