inverted distribution of ductile deformation in the
TRANSCRIPT

Solid Earth, 9, 859–878, 2018https://doi.org/10.5194/se-9-859-2018© Author(s) 2018. This work is distributed underthe Creative Commons Attribution 4.0 License.
Inverted distribution of ductile deformation in the relatively “dry”middle crust across the Woodroffe Thrust, central AustraliaSebastian Wex1, Neil S. Mancktelow1, Friedrich Hawemann1, Alfredo Camacho2, and Giorgio Pennacchioni31Department of Earth Sciences, ETH Zurich, Sonneggstrasse 5, 8092 Zurich, Switzerland2Department of Geological Sciences, University of Manitoba, 125 Dysart Rd, Winnipeg, Manitoba, R3T 2N2, Canada3Department of Geosciences, University of Padova, Via Gradenigo 6, 35131 Padua, Italy
Correspondence: Neil S. Mancktelow ([email protected])
Received: 31 January 2018 – Discussion started: 7 February 2018Revised: 29 May 2018 – Accepted: 18 June 2018 – Published: 11 July 2018
Abstract. Thrust fault systems typically distribute shearstrain preferentially into the hanging wall rather than thefootwall. The Woodroffe Thrust in the Musgrave Block ofcentral Australia is a regional-scale example that does not fitthis model. It developed due to intracontinental shorteningduring the Petermann Orogeny (ca. 560–520 Ma) and is inter-preted to be at least 600 km long in its E–W strike direction,with an approximate top-to-north minimum displacement of60–100 km. The associated mylonite zone is most broadlydeveloped in the footwall. The immediate hanging wall wasonly marginally involved in the mylonitization process, ascan be demonstrated from the contrasting thorium signaturesof mylonites derived from the upper amphibolite facies foot-wall and the granulite facies hanging wall protoliths. Thermalweakening cannot account for such an inverse deformationgradient, as syn-deformational P –T estimates for the Peter-mann Orogeny in the hanging wall and footwall from thesame locality are very similar. The distribution of pseudo-tachylytes, which acted as preferred nucleation sites for sheardeformation, also cannot provide an explanation, since thesefault rocks are especially prevalent in the immediate hang-ing wall. The most likely reason for the inverted deforma-tion gradient across the Woodroffe Thrust is water-assistedweakening due to the increased, but still limited, presence ofaqueous fluids in the footwall. We also establish a qualita-tive increase in the abundance of fluids in the footwall alongan approx. 60 km long section in the direction of thrusting,together with a slight decrease in the temperature of myloni-tization (ca. 100 ◦C). These changes in ambient conditionsare accompanied by a 6-fold decrease in thickness (from ca.600 to 100 m) of the Woodroffe Thrust mylonitic zone.
1 Introduction
Continental fault and shear zone systems (e.g. Ramsay, 1980)with displacements on the order of several tens to hundredsof kilometres generally show an asymmetric mylonite distri-bution across the main fault horizon that is opposite for re-verse faults or thrusts and normal faults or detachments. Faultzones are predicted to become more viscous and broadenwith depth (e.g. Fossen and Cavalcante, 2017; Handy etal., 2007; Mancktelow, 1985; Passchier and Trouw, 2005;Platt and Behr, 2011b). The juxtaposition of initially differ-ent crustal levels should therefore result in a geometry that,for a thrust, preferentially preserves the broader ductile my-lonite zone in the hanging wall, whereas, for a detachment, itshould be in the footwall (e.g. Mancktelow, 1985, his Fig. 11;Passchier, 1984, his Fig. 2). This model is valid for manylarge-scale fault and shear zone systems, for example, theMoine Thrust Zone, NW Scotland (Christie, 1963; Coward,1980); the Alpine Fault, New Zealand (Cooper and Norris,1994; Sibson et al., 1981); the Saint-Barthélemy Massif shearzone, Pyrenees, southern France (Passchier, 1984); the Sim-plon Fault, central European Alps (Mancktelow, 1985); theGrizzly Creek shear zone, Colorado (Allen and Shaw, 2011);and the Whipple Mountains detachment fault, south-westernUSA (Davis, 1988; Davis and Lister, 1988). The mid- tolower-crustal Woodroffe Thrust of central Australia (Major,1970) is an example that does not fit this model and predom-inantly developed a broader mylonite zone in the footwall(Bell and Etheridge, 1976; Camacho et al., 1995; Flottmannet al., 2004). An interpretation of the Woodroffe Thrust asan original detachment that was later re-oriented and ex-ploited as a thrust can be excluded, both because the meta-
Published by Copernicus Publications on behalf of the European Geosciences Union.
860 S. Wex et al.: Inverted distribution of ductile deformation across the Woodroffe Thrust
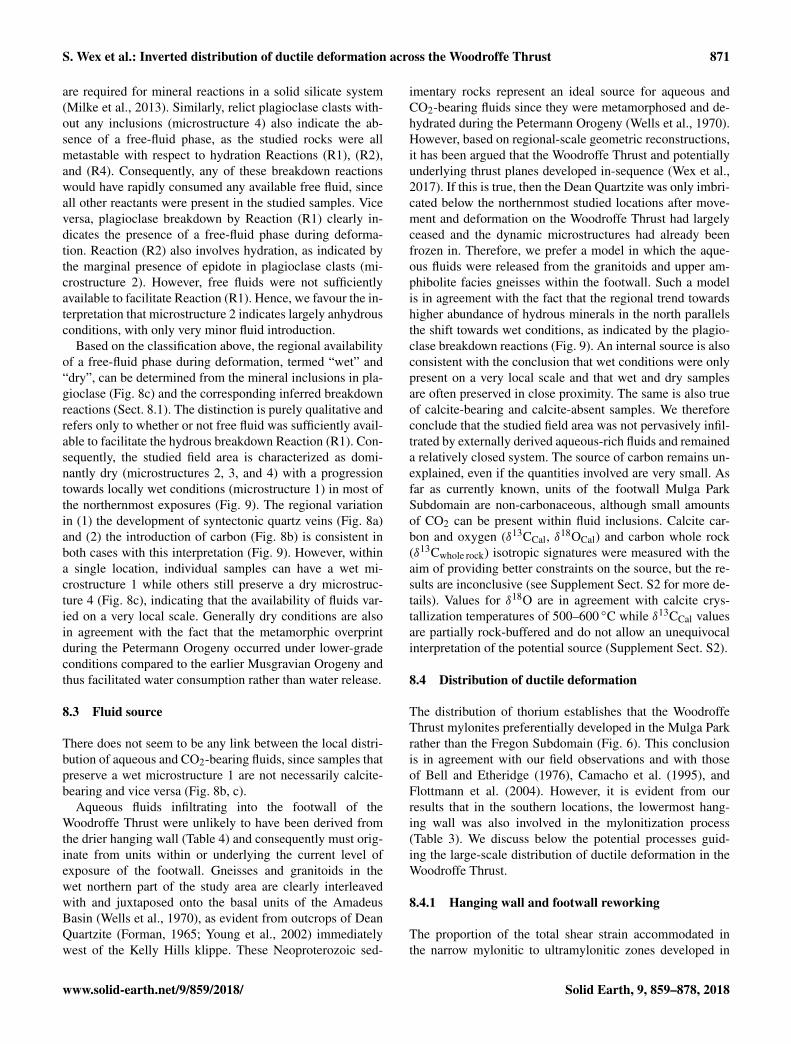
morphic grade decreases in the direction of tectonic transportand because field mapping shows that the fault zone steep-ens and ramps down towards the internal part of the oro-gen, against the transport direction (Wex et al., 2017). Passivetransport and thermal weakening also cannot account for theinverse deformation gradient, as there is no evidence for latebrittle movement on the thrust plane and syn-deformationalP –T estimates in the hanging wall and footwall from thesame locality are very similar (Wex et al., 2017). Bell andEtheridge (1976) and Camacho et al. (1995) proposed thatthe inverted distribution of ductile deformation is explainedby the difference in bulk water content between the up-per amphibolite facies (1.0 wt %) footwall and the granulitefacies (0.2 wt %) hanging wall, reflecting the metamorphicconditions in the protolith prior to thrusting. Similarly, thepreferential formation of shear zones in regions where thehost rock mineralogy had previously been modified by fluid–rock interaction has, for example, also been documented inthe Whipple Mountains detachment fault in SE California(Selverstone et al., 2012) and the Neves area of the TauernWindow in the Eastern Alps (Mancktelow and Pennacchioni,2005). In this paper, we discuss the control of host rocklithology and, potentially, of fluid activity on the distributionof ductile deformation across the Woodroffe Thrust, in an at-tempt to test the local findings of Bell and Etheridge (1976)and Camacho et al. (1995) on a more regional scale (Fig. 1).In particular, we utilize the radiogenic signature of footwalland hanging wall rocks to constrain their respective degreeof reworking in the ductile mylonite zone. We also inves-tigate the effect of varying metamorphic temperatures andfluid conditions on the change in mylonite thickness over adistance of ca. 60 km parallel to the direction of thrusting.
2 Geology
The mid- to lower-crustal Woodroffe Thrust outcrops in theMusgrave Block of central Australia (Major, 1970), whichis located within the suture zone of the north, west, andsouth Australian cratons. These cratons were amalgamatedinto the Australian continent at approx. 1300 Ma in an earlystage of development of the supercontinent Rodinia (Myerset al., 1996). The Woodroffe Thrust is developed over anE–W strike length generally interpreted to exceed 600 kmand separates the Mulga Park Subdomain in the footwall(to the north) from the Fregon Subdomain in the hangingwall (to the south) (Camacho and Fanning, 1995; Edgooseet al., 1993; Major and Conor, 1993). Exposure of the thrustis poor to inexistent in its proposed western (e.g. Stewart,1995, 1997) and eastern (e.g. Edgoose et al., 2004) prolon-gations but is generally excellent for approx. 150 km in thecentral Musgrave Block (Bell, 1978; Camacho et al., 1995;Collerson et al., 1972; Wex et al., 2017), where the currentstudy was conducted. In this region, both footwall and hang-ing wall predominantly consist of granitoids (more common
in the footwall) and quartzo-feldspathic gneisses (more com-mon in the hanging wall), with subordinate metadolerites,mafic gneisses, and metapelites (Fig. 1). Rare quartzites,amphibolites, and schists are restricted to the footwall (Ca-macho and Fanning, 1995; Collerson et al., 1972; Major,1973; Major and Conor, 1993; Scrimgeour and Close, 1999;Young et al., 2002). Protoliths are inferred to have been fel-sic volcanics, sediments, and intrusives with depositional oremplacement ages around 1550 Ma (Camacho, 1997; Ca-macho and Fanning, 1995; Gray, 1977, 1978; Gray andCompston, 1978; Maboko et al., 1991; Major and Conor,1993; Sun and Sheraton, 1992). These protoliths were re-gionally deformed and metamorphosed at upper amphibo-lite facies (Mulga Park Subdomain) to granulite facies (Fre-gon Subdomain) conditions during the ca. 1200 Ma Mus-gravian Orogeny (Camacho, 1997; Camacho and Fanning,1995; Gray, 1978; Maboko et al., 1991; Sun and Sheraton,1992) and syn- to post-tectonically intruded by the Pitjant-jatjara Supersuite granitoids between ca. 1170 and 1130 Ma(Camacho, 1997; Camacho and Fanning, 1995; Scrimgeouret al., 1999; Smithies et al., 2011). Peak temperature andpressure conditions during the Musgravian Orogeny are con-troversial. Earlier estimates were ca. 820–900 ◦C and 1.1–1.4 GPa (Ellis and Maboko, 1992; Maboko et al., 1989,1991), but more recent studies have given conditions of ca.800–1000 ◦C and 0.6–0.9 GPa (Camacho, 1997; Tucker etal., 2015; Walsh et al., 2015). Subsequent to this regional-scale tectono-metamorphic phase, the area experienced bi-modal magmatism (Giles Complex, including the AlcurraDolerite swarm) between ca. 1080 and 1050 Ma and maficmagmatism (Amata Dolerite) at approx. 800 Ma (Ballhausand Glikson, 1995; Camacho et al., 1991; Clarke et al., 1995;Edgoose et al., 1993; Evins et al., 2010; Schmidt et al., 2006;Sun et al., 1996; Zhao et al., 1994; Zhao and McCulloch,1993). In the area considered in the current study, gabbro–norite intrusions, correlated to the Giles Complex, are re-stricted to the Fregon Subdomain. Except for these periodsof magmatic intrusion, the central Musgrave Block remainedlargely unaffected by tectonic events between the Musgra-vian Orogeny at ca. 1200 Ma and the Petermann Orogenyat ca. 560–520 Ma (Camacho and Fanning, 1995; Mabokoet al., 1992). Earlier studies by Maboko et al. (1989, 1991)and Ellis and Maboko (1992) proposed that the Musgravianand Petermann orogenies represented successive stages of asingle anticlockwise P –T –t path, whereas Camacho (1997)and Camacho et al. (1997, 2015) suggested that the Mus-grave Block was partially exhumed prior to the onset of thePetermann Orogeny and then reburied.
The Petermann Orogeny produced a number of large-scalemylonitic shear zones, amongst which the Woodroffe Thrustis the most prominent. Ductile deformation during top-to-north thrusting along the Woodroffe Thrust was largelyaccommodated within the Mulga Park Subdomain footwall(Bell and Etheridge, 1976; Camacho et al., 1995; Flottmannet al., 2004) and is characterized by mylonites with varying
Solid Earth, 9, 859–878, 2018 www.solid-earth.net/9/859/2018/

S. Wex et al.: Inverted distribution of ductile deformation across the Woodroffe Thrust 861
AMAT
A
Kel
ly H
ills
Mt F
rase
r
MU
LGA
PAR
K
N
Woodro�
e Thr
ust
FSZ
14
1315
12
Nor
ther
n Te
rrito
rySo
uth
Aust
ralia
ERN
ABEL
LA
Woo
dro�
e Thr
ust
NDSZ
Man
n Fa
ult
1 2 4 57 8
96
1011
20 k
m3
2019
1617
18
Stud
y ar
ea
Thru
st fa
ult
Loca
tion
Settl
emen
tD
SZ -
Dav
enpo
rt Sh
ear Z
one
ND
SZ -
Nor
th D
aven
port
Shea
r Zon
eFS
Z - F
erdi
nand
She
ar Z
one
132°
E14
4° E 12
° S
24° S
36° S
120°
E
131°00'
- 26°
00'
132°00'
MT
WO
OD
RO
FFE
DSZ
DSZ
Leve
nger
Ark
ose
(Lev
enge
r Gra
ben)
Dea
n Q
uartz
ite(b
asal
Am
adeu
s B
asin
)
Freg
on S
ubdo
mai
nN
orite
s an
d ga
bbro
s(G
iles
Com
plex
)
Alte
red
gran
ulite
faci
es g
neis
s(o
verp
rinte
d du
ring
Pet
erm
ann
Oro
geny
)
Gra
nulit
e fa
cies
gne
iss
(Mus
grav
ian
Oro
geny
)
Amph
ibol
ite fa
cies
gne
iss
(Mus
grav
ian
Oro
geny
)M
ulga
Par
k Su
bdom
ain
Intru
sive
gra
nito
ids
(Pitj
antja
tjara
Sup
ersu
ite &
Gile
s C
ompl
ex)
Dol
erite
dyk
es(A
lcur
ra &
Am
ata
dole
rite)
Mou
ntai
n
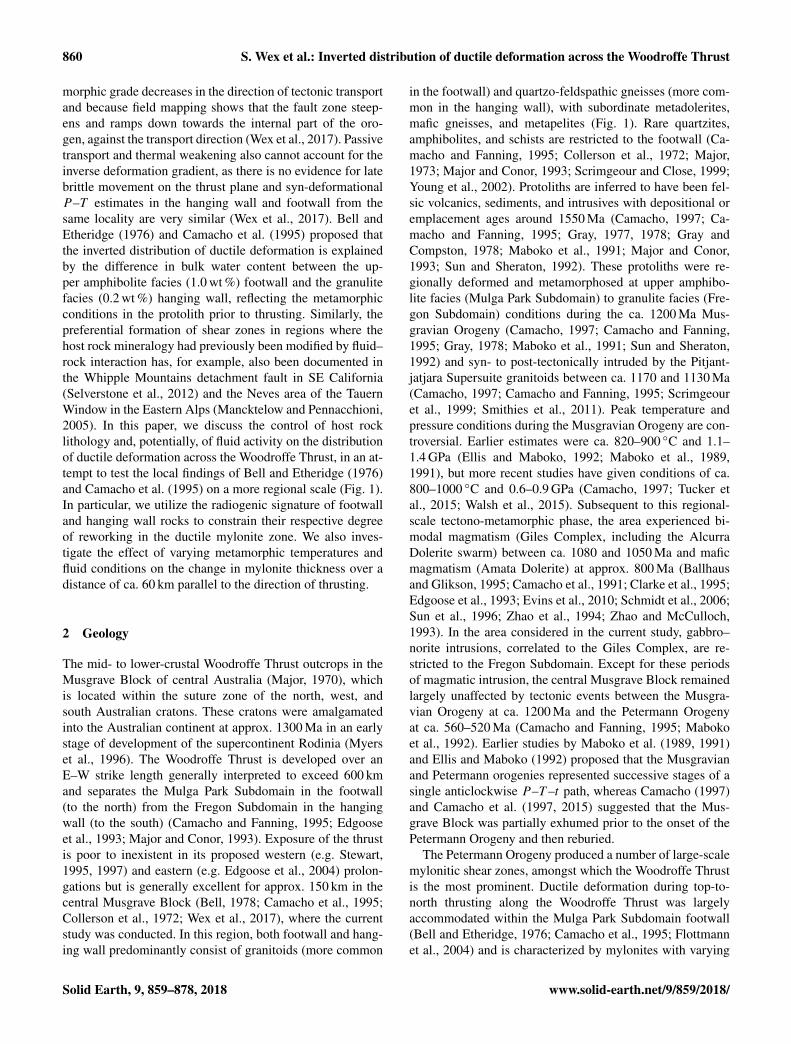
Figure 1. Geological map of the central Musgrave Block (modified after Major et al., 1967; Sprigg et al., 1959; Young et al., 2002).
www.solid-earth.net/9/859/2018/ Solid Earth, 9, 859–878, 2018

862 S. Wex et al.: Inverted distribution of ductile deformation across the Woodroffe Thrust
Woodro�e
Thrust
SW NEUltramylonite
Mylonite
Protomylonite
Pst brecciaPst veinSheared pst
Hanging wall gneiss
Footwall gneiss
SW NE
Fregon SubdomainMulga ParkSubdomain
200
m
2nd pseudotachylyte zone
Figure 2. Photograph and schematic sketch of a cross section through the Woodroffe Thrust at Kelly Hills. Ductile deformation is almostentirely concentrated in the immediate footwall (Mulga Park Subdomain), developing a sequence of protomylonites, mylonites, and ultra-mylonites, with the degree of mylonitization decreasing into the footwall. In contrast, the mostly unaffected or only weakly foliated hangingwall (Fregon Subdomain) is characterized by ubiquitous and voluminous pseudotachylyte (pst) veins and breccias. Further into the hangingwall, a dip slope, characterized by a second zone of highly abundant unsheared pseudotachylyte, has also been documented. Photographcoordinates: 131.45077, −25.89823.
degrees of strain, ranging from protomylonites to ultramy-lonites (Fig. 2), anastomosing around low-strain domains onthe metre to kilometre scale. The syn-kinematic conditionsof deformation along the Woodroffe Thrust were constrainedby conventional geothermobarometry to be within the rangeof 520–650 ◦C and 0.8–1.3 GPa (Wex et al., 2017) and thusof lower temperature when compared to peak conditionsduring the earlier Musgravian Orogeny. The metamorphicassemblage in both mylonitic samples (where the metamor-phic aggregate developed syn-kinematically) and in staticallyoverprinted undeformed samples (e.g. some Alcurra andAmata Dolerite dykes) record similar metamorphic condi-tions, consistent with ambient mid- to lower-crustal levels(Wex et al., 2017). Stable mineral assemblages during thePetermann Orogeny in felsic units of the Woodroffe Thrustcomprise (decreasing modal abundance from left to right)Qz+Pl+Kfs+Bt+ Ilm±Grt±Ep±Ms±Ky±Cpx±Hbl±Rt±Ttn±Mag±Cal, whereas mafic units consist ofPl+ Ilm±Cpx±Grt±Rt±Opx±Bt±Hbl±Ky±Mag±Qz±Kfs±Cal (Wex et al., 2017). Mineral abbreviationsare after Whitney and Evans (2010). The degree of myloni-tization progressively decreases into the footwall but showsa very abrupt transition into the immediate, dominantlybrecciated hanging wall (Figs. 2, 3), which is characterizedby ubiquitous and voluminous pseudotachylyte veins and
breccias (Camacho et al., 1995; Lin et al., 2005). Eventhough this upper boundary of the mylonites is discrete orrapidly transitional in the field (Fig. 3), it does not necessar-ily represent the original boundary between the Mulga Park(footwall) and Fregon (hanging wall) subdomains. In theAmata area (western edge of Fig. 1), Bell (1978) reportedup to 250 m of marginal hanging wall reworking into themylonite zone. However, it remains uncertain how this valuewas exactly determined, since hanging wall and footwallmylonites are very similar in their field appearance.
3 Methods and general approach
The hanging wall, footwall, and numerous transects acrossthe Woodroffe Thrust have been studied and sampled along aN–S traverse, parallel to the direction of thrusting. The sam-pling locations are reported in Fig. 1. Thin sections of thesampled mylonites were prepared from rock chips cut per-pendicular to the foliation and parallel to the stretching lin-eation and analysed using standard polarized light and scan-ning electron microscopy. Firstly, the distribution of duc-tile deformation along and across the Woodroffe Thrust wascharacterized by quantifying (1) the regional variation in themaximum thickness of the mylonitic zone and (2) the asso-ciated degree of hanging wall and footwall reworking. Sec-
Solid Earth, 9, 859–878, 2018 www.solid-earth.net/9/859/2018/

S. Wex et al.: Inverted distribution of ductile deformation across the Woodroffe Thrust 863
Figure 3. Sharp contact between the ultramylonites of theWoodroffe Thrust (below) and the largely undeformed felsic gran-ulite in the hanging wall (above). Photograph looking perpendicu-lar to the direction of thrusting. Outcrop SW13-135 (coordinates:131.87939, −26.21188; location 12 in Fig. 1).
ondly, field and thin-section observations were compiled toassess in a qualitative manner (3) the presence/absence offluids during deformation and (4) the regional variability inmodal abundance of hydrous minerals in felsic units. Poten-tial correlations between parameters (1) to (4) are then dis-cussed. Sample/outcrop coordinates are given in the worldgeodetic system (WGS) 1984. Orientation measurements ofstructural elements are corrected for magnetic declination. Adetailed description of all utilized methods is given in Sup-plement Sect. S1.
4 Mylonite thickness
Field observations indicate that the thickness of theWoodroffe Thrust mylonites is variable. In a section per-pendicular to strike, the thickness (T ) of the mylonitic zoneacross the Woodroffe Thrust was calculated by trigonometry(Fig. 4) from (1) the angle of dip (α) of the thrust (measuredin the field and averaged for each transect); (2) the respec-tive difference in elevation (p) (derived from the 30× 30 mdigital elevation model ASTER) between the lower and up-per structural boundaries of the mylonites to the unshearedcountry rocks (determined from field observations and re-mote sensing); and (3) the apparent thickness (q) (derivedfrom remote sensing). The upper boundary of the myloniticzone is easily recognized (Fig. 3). The lower boundary is de-termined by the first appearance of Petermann mylonitic fo-liation, well characterized by the approximate N–S trend ofthe stretching lineation and by the top-to-north kinematic in-dicators. Errors for parameters α and q are considered negli-gible, whereas the 30× 30 m resolution of the digital eleva-tion model is prone to introduce an uncertainty on the orderof 10–20 m. The geometrical arrangement for the estimate ofT was the same for locations 2–8 and 12–14 (Fig. 4a) but
Topography
p
q
T
α(a) (b)
T
pq
Topography
Footwall gneiss Hanging wall gneissWoodro�e Thrust
α
Figure 4. Schematic illustration of the trigonometry applied toquantify the true thickness of the Woodroffe Thrust mylonitic zonein a section perpendicular to strike. The parameters are defined inthe main text. (a) Geometry applicable to locations 2–8 and 12–14of Fig. 1. (b) Geometry applicable to location 11 of Fig. 1.
slightly different for location 11 (Fig. 1), where the lowerstructural boundary of the mylonites was at a higher eleva-tion than the upper boundary (Fig. 4b). The thickness of themylonitic zone at location 1 (Fig. 1) was not calculated be-cause the Woodroffe Thrust is only exposed along-strike. Theresults for all other studied transects are summarized in Ta-ble 1 and, disregarding local variability, indicate a gradualincrease in mylonite thickness from ca. 100 m in the north toca. 600 m in the south.
5 Degree of hanging wall and footwall mylonitization
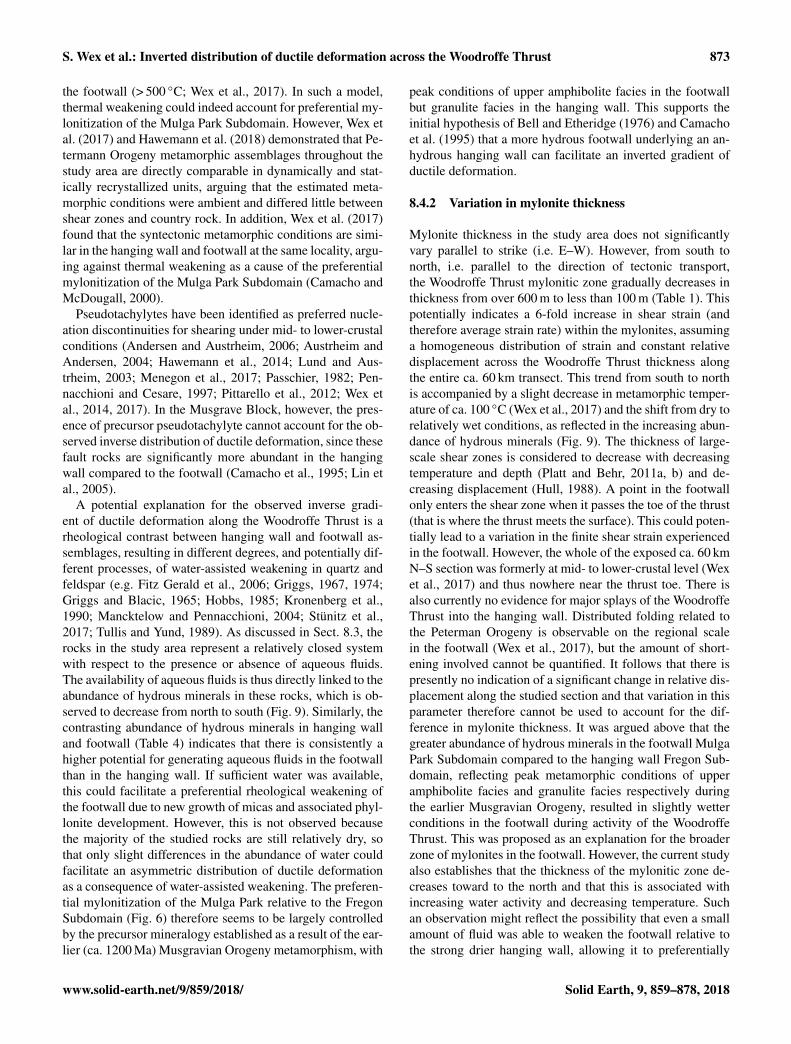
Mylonites derived from the hanging wall and footwall of theWoodroffe Thrust are very similar in both their field appear-ance and microstructural–petrographical characteristics. Thehigh degree of recrystallization and general lack of porphy-roclasts in the uppermost mylonites at locations 4, 6–8, and12–14 (Fig. 1) suggest that these samples were potentiallyderived from the pseudotachylyte-rich Fregon Subdomain,hence indicating local hanging wall reworking. To estab-lish whether mylonites were derived from either the MulgaPark or the Fregon subdomains, we utilized their thoriumconcentrations, based on the general observation that hang-ing wall rocks are depleted in thorium compared to footwallrocks (Fig. 5). This contrast is due to (1) dehydration andmelting reactions during the earlier ca. 1200 Ma MusgravianOrogeny, which depleted the granulite facies hanging wall toa greater degree than the upper amphibolite facies footwall(Heier and Adams, 1965; Lambert and Heier, 1967, 1968),(2) the predominance of granitoids rather than gneisses inthe footwall, and (3) the fact that low-thorium Giles Com-plex gabbro–noritic intrusions are commonly exposed in theimmediate hanging wall of the Woodroffe Thrust. Deforma-tion and metamorphism during mylonitization did not signif-icantly alter the original thorium content of the rocks, sincethe thorium-bearing phases, such as zircon, allanite, mon-azite, and apatite, did not break down during the PetermannOrogeny. Consequently, the original variation in thorium be-tween the granulite and amphibolite facies rocks was pre-
www.solid-earth.net/9/859/2018/ Solid Earth, 9, 859–878, 2018
864 S. Wex et al.: Inverted distribution of ductile deformation across the Woodroffe Thrust
AMATA
Kelly Hills
Mt Fraser
MULGA PARK
N
Woodro�
e Thrust
FS
Z
14
1315
12
- 26°00’
132°
00’
ERNABELLA
Woodro�e Thrust
DSZ
NDSZ
DSZMann Fault
1245
7
89 6
1011
20 km
3
20
19
17
18
16
Thrust fault
Location(Fig. 1)
Settlement
DSZ Davenport Shear Zone
NDSZ North Davenport Shear Zone
FSZ Ferdinand Shear Zone
025 Th (ppm)
Higher-Th granitoids
Lower-Th sediments
MT WOODROFFE
Mountain
131°
00’
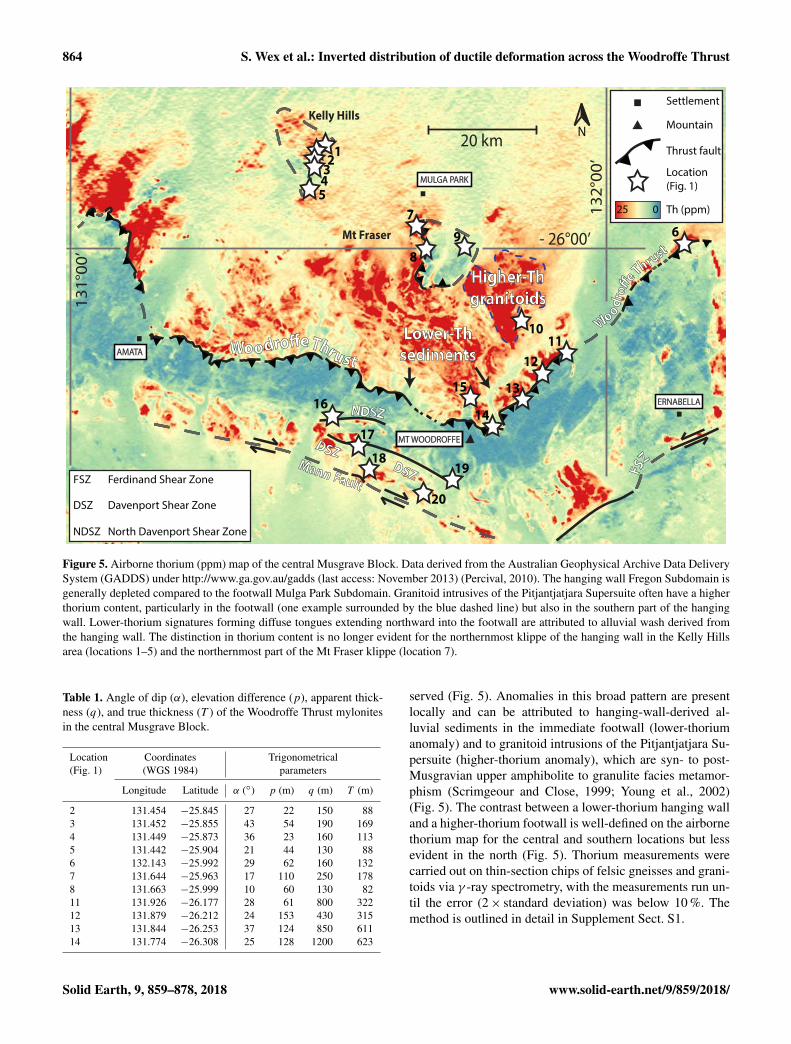
Figure 5. Airborne thorium (ppm) map of the central Musgrave Block. Data derived from the Australian Geophysical Archive Data DeliverySystem (GADDS) under http://www.ga.gov.au/gadds (last access: November 2013) (Percival, 2010). The hanging wall Fregon Subdomain isgenerally depleted compared to the footwall Mulga Park Subdomain. Granitoid intrusives of the Pitjantjatjara Supersuite often have a higherthorium content, particularly in the footwall (one example surrounded by the blue dashed line) but also in the southern part of the hangingwall. Lower-thorium signatures forming diffuse tongues extending northward into the footwall are attributed to alluvial wash derived fromthe hanging wall. The distinction in thorium content is no longer evident for the northernmost klippe of the hanging wall in the Kelly Hillsarea (locations 1–5) and the northernmost part of the Mt Fraser klippe (location 7).
Table 1. Angle of dip (α), elevation difference (p), apparent thick-ness (q), and true thickness (T ) of the Woodroffe Thrust mylonitesin the central Musgrave Block.
Location Coordinates Trigonometrical(Fig. 1) (WGS 1984) parameters
Longitude Latitude α (◦) p (m) q (m) T (m)
2 131.454 −25.845 27 22 150 883 131.452 −25.855 43 54 190 1694 131.449 −25.873 36 23 160 1135 131.442 −25.904 21 44 130 886 132.143 −25.992 29 62 160 1327 131.644 −25.963 17 110 250 1788 131.663 −25.999 10 60 130 8211 131.926 −26.177 28 61 800 32212 131.879 −26.212 24 153 430 31513 131.844 −26.253 37 124 850 61114 131.774 −26.308 25 128 1200 623
served (Fig. 5). Anomalies in this broad pattern are presentlocally and can be attributed to hanging-wall-derived al-luvial sediments in the immediate footwall (lower-thoriumanomaly) and to granitoid intrusions of the Pitjantjatjara Su-persuite (higher-thorium anomaly), which are syn- to post-Musgravian upper amphibolite to granulite facies metamor-phism (Scrimgeour and Close, 1999; Young et al., 2002)(Fig. 5). The contrast between a lower-thorium hanging walland a higher-thorium footwall is well-defined on the airbornethorium map for the central and southern locations but lessevident in the north (Fig. 5). Thorium measurements werecarried out on thin-section chips of felsic gneisses and grani-toids via γ -ray spectrometry, with the measurements run un-til the error (2× standard deviation) was below 10 %. Themethod is outlined in detail in Supplement Sect. S1.
Solid Earth, 9, 859–878, 2018 www.solid-earth.net/9/859/2018/
S. Wex et al.: Inverted distribution of ductile deformation across the Woodroffe Thrust 865
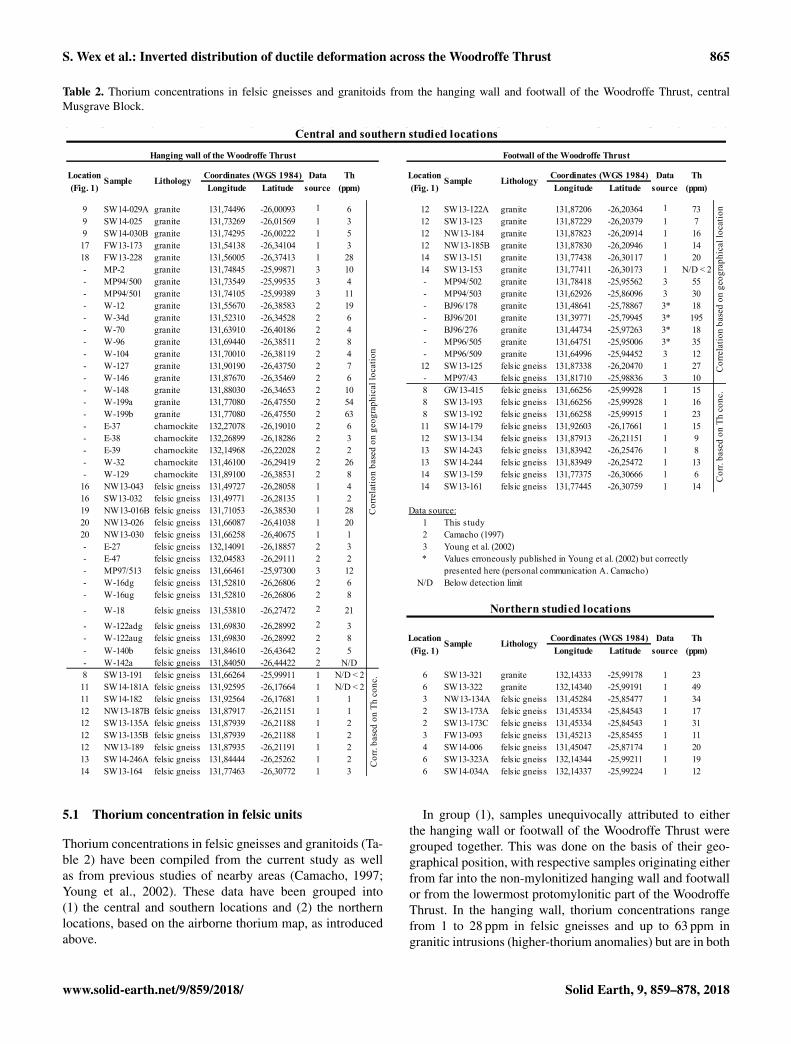
Table 2. Thorium concentrations in felsic gneisses and granitoids from the hanging wall and footwall of the Woodroffe Thrust, centralMusgrave Block.
Location Data Th Location Data Th(Fig. 1) Longitude Latitude source (ppm) (Fig. 1) Longitude Latitude source (ppm)
9 SW14-029A granite 131,74496 -26,00093 1 6 12 SW13-122A granite 131,87206 -26,20364 1 739 SW14-025 granite 131,73269 -26,01569 1 3 12 SW13-123 granite 131,87229 -26,20379 1 79 SW14-030B granite 131,74295 -26,00222 1 5 12 NW13-184 granite 131,87823 -26,20914 1 1617 FW13-173 granite 131,54138 -26,34104 1 3 12 NW13-185B granite 131,87830 -26,20946 1 1418 FW13-228 granite 131,56005 -26,37413 1 28 14 SW13-151 granite 131,77438 -26,30117 1 20- MP-2 granite 131,74845 -25,99871 3 10 14 SW13-153 granite 131,77411 -26,30173 1 N/D < 2- MP94/500 granite 131,73549 -25,99535 3 4 - MP94/502 granite 131,78418 -25,95562 3 55- MP94/501 granite 131,74105 -25,99389 3 11 - MP94/503 granite 131,62926 -25,86096 3 30- W-12 granite 131,55670 -26,38583 2 19 - BJ96/178 granite 131,48641 -25,78867 3* 18- W-34d granite 131,52310 -26,34528 2 6 - BJ96/201 granite 131,39771 -25,79945 3* 195- W-70 granite 131,63910 -26,40186 2 4 - BJ96/276 granite 131,44734 -25,97263 3* 18- W-96 granite 131,69440 -26,38511 2 8 - MP96/505 granite 131,64751 -25,95006 3* 35- W-104 granite 131,70010 -26,38119 2 4 - MP96/509 granite 131,64996 -25,94452 3 12- W-127 granite 131,90190 -26,43750 2 7 12 SW13-125 felsic gneiss 131,87338 -26,20470 1 27- W-146 granite 131,87670 -26,35469 2 6 - MP97/43 felsic gneiss 131,81710 -25,98836 3 10- W-148 granite 131,88030 -26,34653 2 10 8 GW13-415 felsic gneiss 131,66256 -25,99928 1 15- W-199a granite 131,77080 -26,47550 2 54 8 SW13-193 felsic gneiss 131,66256 -25,99928 1 16- W-199b granite 131,77080 -26,47550 2 63 8 SW13-192 felsic gneiss 131,66258 -25,99915 1 23- E-37 charnockite 132,27078 -26,19010 2 6 11 SW14-179 felsic gneiss 131,92603 -26,17661 1 15- E-38 charnockite 132,26899 -26,18286 2 3 12 SW13-134 felsic gneiss 131,87913 -26,21151 1 9- E-39 charnockite 132,14968 -26,22028 2 2 13 SW14-243 felsic gneiss 131,83942 -26,25476 1 8- W-32 charnockite 131,46100 -26,29419 2 26 13 SW14-244 felsic gneiss 131,83949 -26,25472 1 13- W-129 charnockite 131,89100 -26,38531 2 8 14 SW13-159 felsic gneiss 131,77375 -26,30666 1 6
16 NW13-043 felsic gneiss 131,49727 -26,28058 1 4 14 SW13-161 felsic gneiss 131,77445 -26,30759 1 1416 SW13-032 felsic gneiss 131,49771 -26,28135 1 219 NW13-016B felsic gneiss 131,71053 -26,38530 1 2820 NW13-026 felsic gneiss 131,66087 -26,41038 1 20 1 This study20 NW13-030 felsic gneiss 131,66258 -26,40675 1 1 2 Camacho (1997)- E-27 felsic gneiss 132,14091 -26,18857 2 3 3 Young et al. (2002)- E-47 felsic gneiss 132,04583 -26,29111 2 2 * Values erroneously published in Young et al. (2002) but correctly- MP97/513 felsic gneiss 131,66461 -25,97300 3 12 presented here (personal communication A. Camacho)- W-16dg felsic gneiss 131,52810 -26,26806 2 6 N/D Below detection limit- W-16ug felsic gneiss 131,52810 -26,26806 2 8
- W-18 felsic gneiss 131,53810 -26,27472 2 21
- W-122adg felsic gneiss 131,69830 -26,28992 2 3- W-122aug felsic gneiss 131,69830 -26,28992 2 8 Location Data Th- W-140b felsic gneiss 131,84610 -26,43642 2 5 (Fig. 1) Longitude Latitude source (ppm)- W-142a felsic gneiss 131,84050 -26,44422 2 N/D8 SW13-191 felsic gneiss 131,66264 -25,99911 1 N/D < 2 6 SW13-321 granite 132,14333 -25,99178 1 2311 SW14-181A felsic gneiss 131,92595 -26,17664 1 N/D < 2 6 SW13-322 granite 132,14340 -25,99191 1 4911 SW14-182 felsic gneiss 131,92564 -26,17681 1 1 3 NW13-134A felsic gneiss 131,45284 -25,85477 1 3412 NW13-187B felsic gneiss 131,87917 -26,21151 1 1 2 SW13-173A felsic gneiss 131,45334 -25,84543 1 1712 SW13-135A felsic gneiss 131,87939 -26,21188 1 2 2 SW13-173C felsic gneiss 131,45334 -25,84543 1 3112 SW13-135B felsic gneiss 131,87939 -26,21188 1 2 3 FW13-093 felsic gneiss 131,45213 -25,85455 1 1112 NW13-189 felsic gneiss 131,87935 -26,21191 1 2 4 SW14-006 felsic gneiss 131,45047 -25,87174 1 2013 SW14-246A felsic gneiss 131,84444 -26,25262 1 2 6 SW13-323A felsic gneiss 132,14344 -25,99211 1 1914 SW13-164 felsic gneiss 131,77463 -26,30772 1 3 6 SW14-034A felsic gneiss 132,14337 -25,99224 1 12
Central and southern studied locations
Cor
rela
tion
base
d on
geo
grap
hica
l loc
atio
nC
orr.
base
d on
Th
conc
.
Northern studied locations
Cor
r. ba
sed
on T
h co
nc.
Cor
rela
tion
base
d on
geo
grap
hica
l loc
atio
n
Data source:
Hanging wall of the Woodroffe Thrust Footwall of the Woodroffe Thrust
Sample Lithology Coordinates (WGS 1984) Sample Lithology Coordinates (WGS 1984)
Coordinates (WGS 1984)LithologySample
5.1 Thorium concentration in felsic units
Thorium concentrations in felsic gneisses and granitoids (Ta-ble 2) have been compiled from the current study as wellas from previous studies of nearby areas (Camacho, 1997;Young et al., 2002). These data have been grouped into(1) the central and southern locations and (2) the northernlocations, based on the airborne thorium map, as introducedabove.
In group (1), samples unequivocally attributed to eitherthe hanging wall or footwall of the Woodroffe Thrust weregrouped together. This was done on the basis of their geo-graphical position, with respective samples originating eitherfrom far into the non-mylonitized hanging wall and footwallor from the lowermost protomylonitic part of the WoodroffeThrust. In the hanging wall, thorium concentrations rangefrom 1 to 28 ppm in felsic gneisses and up to 63 ppm ingranitic intrusions (higher-thorium anomalies) but are in both
www.solid-earth.net/9/859/2018/ Solid Earth, 9, 859–878, 2018

866 S. Wex et al.: Inverted distribution of ductile deformation across the Woodroffe Thrust
cases usually lower than 8 ppm. In the footwall, concentra-tions vary between 2 and 195 ppm and are typically higherthan 10 ppm (Table 2). These concentrations are in accor-dance with the regional-scale contrast in thorium concentra-tions across the Woodroffe Thrust in the central and southernlocations (Fig. 5), as well as with the results of Lambert andHeier (1968), who determined concentrations of 2.1 ppm forthe granulite facies hanging wall and 11 ppm for the upperamphibolite facies footwall. Based on the compilation in Ta-ble 2, samples with a thorium concentration < 8 ppm wereassigned to the hanging wall and samples with higher valuesto the footwall of the Woodroffe Thrust. In general, samplestaken close to the boundary between the mylonites and un-sheared rocks of the Fregon Subdomain (typically the upper-most few tens to one hundred metres) were investigated. Forthe majority of samples, the assignment was straightforwardsince the inferred hanging wall samples are extremely lowin thorium (< 3 ppm), whereas most inferred footwall sam-ples have values > 8 ppm. Exceptions are samples SW14-243and SW13-159, which have intermediate concentrations of 8and 6 ppm, respectively. Both samples were assigned to thefootwall since subsequent samples further towards the hang-ing wall (SW14-244 and SW13-161) could clearly still beattributed to the footwall. Alternatively, samples SW14-243and SW13-159 could reflect imbrication of the Mulga Parkand Fregon subdomains, but this is not supported by any fieldobservation.
In group (2), thorium concentrations vary between 11 and49 ppm (Table 2) but do not allow a clear distinction be-tween samples derived from the footwall and hanging wall ina manner similar to the central and southern locations. Thisresult is in accordance with the airborne thorium concentra-tions, which also do not indicate a significant jump across theWoodroffe Thrust in these more northerly locations (Fig. 5).
5.2 Determination of boundary between hanging walland footwall
Measured thorium concentrations indicate that in locations 8and 11–14 (Fig. 5) the uppermost mylonites of the WoodroffeThrust developed in the lower-thorium Fregon Subdomain(Table 2). These results are in agreement with the proposedidentification of hanging wall reworking based on field ap-pearance. Similar field relationships, such as progressivedownwards mylonitization of units clearly forming part ofthe hanging wall, also indicate limited reworking of the Fre-gon Subdomain at locations 4 and 6 (Fig. 5). However, thelack of a clear contrast in thorium concentrations betweenfootwall and hanging wall in these locations precludes anyverification of these field observations, as well as any in-dependent determination of the thickness of hanging-wall-derived mylonites in the thrust zone. We therefore excludedthese northern transects when using thorium concentrationas a proxy to map the original boundary between the hang-ing wall and footwall (Fig. 6). It was also not possible to
Table 3. Angle of dip (α), elevation difference (p), apparent thick-ness (q) and true thickness (T ) of the Woodroffe Thrust mylonitesderived from the hanging wall.
Location Coordinates Trigonometrical(Fig. 1) (WGS 1984) parameters
Longitude Latitude α (◦) p (m) q (m) T (m)
8 132.143 −25.992 10 1 10 311 131.926 −26.177 28 5 30 1812 131.879 −26.212 21 22 55 4013 131.844 −26.253 − − − > 014 131.774 −26.308 22 9 30 20
precisely determine the boundary at location 13 (Fig. 1), dueto a large lateral gap between the last sample assigned to thefootwall and the first sample assigned to the hanging wall. Inan attempt to quantitatively calculate the degree of hanging-wall–footwall reworking into the total mylonite zone, weapplied trigonometry based on the geometrical arrangementsketched in Fig. 4a. The only modification was that the lowermylonite boundary was now defined by the newly recon-structed boundary between hanging wall and footwall. Re-sults are summarized in Table 3. In contrast to the 250 mproposed by Bell (1978) for the Amata area (western edgeof Fig. 1), our results indicate that only the lowermost 3 mof the Fregon Subdomain was reworked into the WoodroffeThrust mylonites at location 8, increasing up to 18–40 m atlocations 11–14 (Fig. 1). These values represent 3–6 % ofthe entire thickness of the Woodroffe Thrust mylonites (Ta-ble 1) at locations 8, 11, and 14 and up to 13 % at location 12(Fig. 1). However, the difference in elevation (p) is not well-defined over short distances (q) given the limited (30× 30 m)resolution of the digital elevation model (ASTER). This canintroduce a significant uncertainty into the calculation of thedegree of hanging wall reworking. Nevertheless, our analy-sis clearly shows that the majority of mylonites developed inthe Mulga Park Subdomain (footwall) rather than the FregonSubdomain (hanging wall).
6 Presence or absence of fluids during mylonitization
The syn-deformational presence or absence of fluids in thestudy area is established from a series of field and thin-section observations. These include the regional variation in(1) syntectonic quartz veins, (2) the introduction of carbon,and (3) plagioclase stability and breakdown.
6.1 Quartz veins
Syntectonic quartz veins (Fig. 7a) and associated quartz-richpegmatite dykes are uncommon throughout the field area,being generally absent in the southern locations and onlylocally present in the northern locations (Fig. 8a). Thesequartz veins crosscut the mylonitic fabric but were them-
Solid Earth, 9, 859–878, 2018 www.solid-earth.net/9/859/2018/

S. Wex et al.: Inverted distribution of ductile deformation across the Woodroffe Thrust 867
025 Th (ppm)
Footwall gneiss
Hanging wall gneiss
Dolerite dykes
Pre-Petermann foliation
Petermann foliationQuaternary deposits
Protolith boundary
Lower boundary (WT)
Upper boundary (WT)
Figure 6. Sample-specific thorium (Th) concentrations (measuredby γ -ray spectrometry) plotted across the Woodroffe Thrust (WT)mylonites at locations 8 and 11–14 (Fig. 1). The original boundarybetween the lower-thorium hanging wall and higher-thorium foot-wall is inferred (red line).
selves variably deformed during subsequent shearing, pro-viding direct field evidence that they were broadly coevalwith the Woodroffe Thrust and thus associated with the Pe-termann Orogeny. The sense of shear is both top-to-north andtop-to-south, which is contrary to the dominant top-to-northshear sense associated with the Woodroffe Thrust, but it hasalso been documented by Bell and Johnson (1992) in the Am-ata region (western edge of Fig. 1). Quartz veins are boudi-naged within the mylonitic foliation and, although deformed,did not preferentially localize strain (Fig. 7a, b).
6.2 Introduction of carbon
Finely dispersed calcite is locally found with very lowmodal abundance (typically < 1 %) in the otherwise non-carbonaceous rocks of the central Musgrave Block (Fig. 7c).Calcite-bearing samples are present throughout the studyarea but are generally more common in the north (Fig. 8b).Microstructures indicate that the fine-grained (< 10 µm) cal-cite nucleated during shearing (Fig. 7c). Calcium was madeavailable from dynamic recrystallization of plagioclase tonew grains with lower anorthite content (Wex et al., 2017),
but carbon cannot have an immediately local source becausethe studied rocks were initially entirely non-carbonaceous.
6.3 Plagioclase stability and breakdown
Plagioclase dynamically neo-crystallized in the WoodroffeThrust mylonites and associated shear zones (Bell and John-son, 1989), forming typical core-and-mantle structures. Thecomposition of the newly formed grains ranges from al-bite/oligoclase in felsic rocks to oligoclase/andesine in maficrocks (Wex et al., 2017). Mineral inclusions within plagio-clase clasts are common and allow the distinction of four dif-ferent types of clasts, termed microstructures 1 to 4:
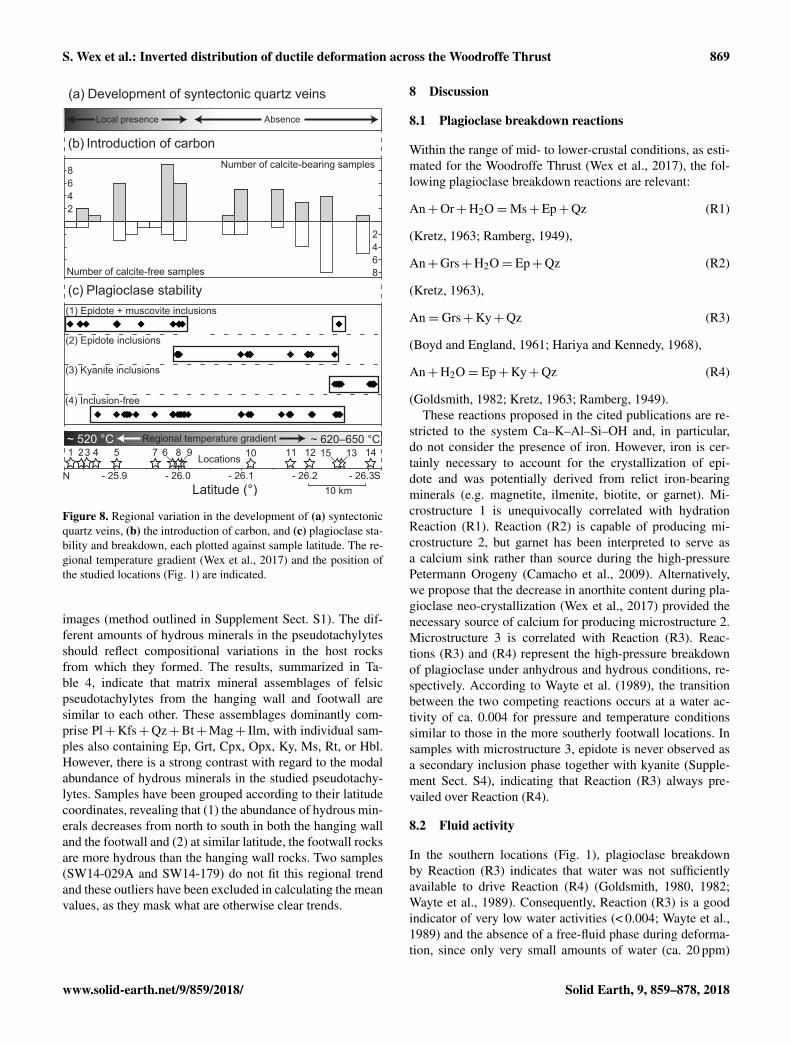
1. Plagioclase studded with abundant inclusions of epidoteand muscovite (Fig. 7d). This type is, with one excep-tion, restricted to the northern locations (Fig. 8c).
2. Plagioclase containing only epidote inclusions (Fig. 7e),with a modal abundance far lower than that of epi-dote + muscovite inclusions of microstructure 1. Thismicrostructure is restricted to the central locations(Fig. 8c).
3. Plagioclase crowded with kyanite needle inclusions(Fig. 7f) (see Supporting Information B of Wex et al.,2017, for identification techniques). This microstructureis restricted to the southernmost locations (Fig. 8c).
4. Plagioclase free of inclusions (Fig. 7g). This mi-crostructure is found in almost all locations (Fig. 8c).
Figure 8c shows that the type of inclusions in plagioclasevaries in a N–S direction, i.e. parallel to the tectonic trans-port direction of the Woodroffe Thrust. From north to south,inclusions progressively change from muscovite + epidote(microstructure 1), to epidote (microstructure 2), and tokyanite (microstructure 3), with inclusion-free plagioclaseclasts (microstructure 4) occurring throughout. There is noapparent variation in the type of plagioclase inclusions along-strike of the Woodroffe Thrust (i.e. E–W).
7 Abundance of hydrous minerals
Pseudotachylytes have been identified as preferred disconti-nuities for the nucleation of ductile shear zones and strainlocalization under mid- to lower-crustal conditions (Ander-sen and Austrheim, 2006; Austrheim and Andersen, 2004;Hawemann et al., 2014, 2018; Lund and Austrheim, 2003;Menegon et al., 2017; Passchier, 1982; Pennacchioni andCesare, 1997; Pittarello et al., 2012; Wex et al., 2014,2017). In order to study the control of host rock min-eralogy on shear initiation, the modal abundance of hy-drous minerals in deformed and undeformed pseudotachy-lytes (representative compilation in Supplement Sect. S3)from felsic footwall and hanging wall samples was deter-mined by image analysis of backscattered electron (BSE)
www.solid-earth.net/9/859/2018/ Solid Earth, 9, 859–878, 2018

868 S. Wex et al.: Inverted distribution of ductile deformation across the Woodroffe Thrust
100 µm(f )
200 µm
400 µm
Trend237/70
S N
Shea
r zo
ne
Quartz vei n
Sm246/8025 cm(a)
(d) (e)
(g)
(b)
(c) 100 µm
100 µm
N
Figure 7. Field and thin-section images providing evidence for the presence or absence of fluids during deformation. (a) Quartz veins(encircled) crosscut the mylonitic foliation of the Woodroffe Thrust showing a sigmoidal shape consistent with rotation during overalltop-to-north shearing. The quartz vein at the bottom of the picture is boudinaged and did not localize deformation. Outcrop NW15-264(coordinates: 131.46883, −25.83040; location 1 in Fig. 1). (b) Quartz vein adjacent to a sinistral shear zone that is not reactivated, eventhough shear zone and quartz vein are almost parallel to each other. Abbreviation: Sm – mylonitic foliation. Outcrop SW13-200 (coordinates:131.73810, −25.99564; location 9 in Fig. 1). (c) Finely dispersed calcite (high birefringence) between newly formed feldspar grains undercrossed polarized light. Thin section is not oriented. Sample NW14-423A (coordinates: 131.84368, −26.11423; location 10 in Fig. 1).(d) Plagioclase clast with muscovite (higher birefringence) and epidote (lower birefringence) inclusions under crossed polarized light. Thinsection is oriented N–S (left–right). Sample SW14-214A (coordinates: 131.44416, −25.90284; location 5 in Fig. 1). (e) Plagioclase clastwith epidote inclusions under crossed polarized light. Thin section is oriented N–S (left–right). Sample GW13-415 (coordinates: 131.66256,−25.99928; location 8 in Fig. 1). (f) Plagioclase clast with kyanite inclusions (greenish needles) and neo-crystallized garnet under plane-polarized light. Thin section is not oriented. Sample SW13-167 (coordinates: 131.77475,−26.30845; location 14 in Fig. 1). (g) Inclusion-freeplagioclase clast under plane-polarized light. Thin section is oriented NNE–SSW (left–right). Sample SW13-318 (coordinates: 132.14311,−25.99142; location 6 in Fig. 1).
Solid Earth, 9, 859–878, 2018 www.solid-earth.net/9/859/2018/
S. Wex et al.: Inverted distribution of ductile deformation across the Woodroffe Thrust 869
Latitude (°)- 25.9 - 26.0 - 26.1 - 26.2 - 26.3
N
S10 km
(1) Epidote + muscovite inclusions
(a) Development of syntectonic quartz veins
Local presence Absence
(c) Plagioclase stability
(2) Epidote inclusions
(3) Kyanite inclusions
(4) Inclusion-free
~ 620–650 °C~ 520 °C Regional temperature gradient
(b) Introduction of carbon
2468
8642
Number of calcite-bearing samples
Number of calcite-free samples
1 23 5 86 974 11 12 141315Locations 10
Figure 8. Regional variation in the development of (a) syntectonicquartz veins, (b) the introduction of carbon, and (c) plagioclase sta-bility and breakdown, each plotted against sample latitude. The re-gional temperature gradient (Wex et al., 2017) and the position ofthe studied locations (Fig. 1) are indicated.
images (method outlined in Supplement Sect. S1). The dif-ferent amounts of hydrous minerals in the pseudotachylytesshould reflect compositional variations in the host rocksfrom which they formed. The results, summarized in Ta-ble 4, indicate that matrix mineral assemblages of felsicpseudotachylytes from the hanging wall and footwall aresimilar to each other. These assemblages dominantly com-prise Pl+Kfs+Qz+Bt+Mag+ Ilm, with individual sam-ples also containing Ep, Grt, Cpx, Opx, Ky, Ms, Rt, or Hbl.However, there is a strong contrast with regard to the modalabundance of hydrous minerals in the studied pseudotachy-lytes. Samples have been grouped according to their latitudecoordinates, revealing that (1) the abundance of hydrous min-erals decreases from north to south in both the hanging walland the footwall and (2) at similar latitude, the footwall rocksare more hydrous than the hanging wall rocks. Two samples(SW14-029A and SW14-179) do not fit this regional trendand these outliers have been excluded in calculating the meanvalues, as they mask what are otherwise clear trends.
8 Discussion
8.1 Plagioclase breakdown reactions
Within the range of mid- to lower-crustal conditions, as esti-mated for the Woodroffe Thrust (Wex et al., 2017), the fol-lowing plagioclase breakdown reactions are relevant:
An+Or+H2O=Ms+Ep+Qz (R1)
(Kretz, 1963; Ramberg, 1949),
An+Grs+H2O= Ep+Qz (R2)
(Kretz, 1963),
An= Grs+Ky+Qz (R3)
(Boyd and England, 1961; Hariya and Kennedy, 1968),
An+H2O= Ep+Ky+Qz (R4)
(Goldsmith, 1982; Kretz, 1963; Ramberg, 1949).These reactions proposed in the cited publications are re-
stricted to the system Ca–K–Al–Si–OH and, in particular,do not consider the presence of iron. However, iron is cer-tainly necessary to account for the crystallization of epi-dote and was potentially derived from relict iron-bearingminerals (e.g. magnetite, ilmenite, biotite, or garnet). Mi-crostructure 1 is unequivocally correlated with hydrationReaction (R1). Reaction (R2) is capable of producing mi-crostructure 2, but garnet has been interpreted to serve asa calcium sink rather than source during the high-pressurePetermann Orogeny (Camacho et al., 2009). Alternatively,we propose that the decrease in anorthite content during pla-gioclase neo-crystallization (Wex et al., 2017) provided thenecessary source of calcium for producing microstructure 2.Microstructure 3 is correlated with Reaction (R3). Reac-tions (R3) and (R4) represent the high-pressure breakdownof plagioclase under anhydrous and hydrous conditions, re-spectively. According to Wayte et al. (1989), the transitionbetween the two competing reactions occurs at a water ac-tivity of ca. 0.004 for pressure and temperature conditionssimilar to those in the more southerly footwall locations. Insamples with microstructure 3, epidote is never observed asa secondary inclusion phase together with kyanite (Supple-ment Sect. S4), indicating that Reaction (R3) always pre-vailed over Reaction (R4).
8.2 Fluid activity
In the southern locations (Fig. 1), plagioclase breakdownby Reaction (R3) indicates that water was not sufficientlyavailable to drive Reaction (R4) (Goldsmith, 1980, 1982;Wayte et al., 1989). Consequently, Reaction (R3) is a goodindicator of very low water activities (< 0.004; Wayte et al.,1989) and the absence of a free-fluid phase during deforma-tion, since only very small amounts of water (ca. 20 ppm)
www.solid-earth.net/9/859/2018/ Solid Earth, 9, 859–878, 2018

870 S. Wex et al.: Inverted distribution of ductile deformation across the Woodroffe Thrust
Table 4. Modal abundance of hydrous minerals in felsic pseudotachylytes from the hanging wall and footwall of the Woodroffe Thrust,central Musgrave Block. Extreme outliers (∗) are not considered. Mineral assemblages are listed in order of decreasing modal abundance(from left to right) with hydrous minerals underlined. A representative compilation of pseudotachylytes is given in Supplement Sect. S3.Errors given are 2× standard deviation.
Loca
tion
Sam
ple
BSE
Coo
rdin
ates
M
iner
al a
ssem
blag
eLo
catio
nSa
mpl
eB
SEC
oord
inat
es
Min
eral
ass
embl
age
(Fig
. 1)
imag
es(W
GS
1984
)(p
seud
otac
hyly
te)
(Fig
. 1)
imag
es(W
GS
1984
)(p
seud
otac
hyly
te)
131,
4530
4Pl
+ K
fs +
Bt +
Cpx
13
1,45
397
Qz +
Bt +
Ms
+ Ep
-25,
8453
2+
Qz +
Mag
+ Il
m-2
5,84
535
+ M
ag +
Pl ±
Kfs
131,
4482
6K
fs +
Pl
131,
4539
7Q
z + B
t + M
s +
Ep-2
5,85
366
+ M
ag +
Bt
-25,
8453
5+
Mag
+ P
l ± K
fs
131,
4503
4Pl
+ K
fs +
Bt +
Hbl
131,
4528
4Pl
+ Q
z + K
fs-2
5,85
414
+ Ep
+ M
ag-2
5,85
477
+ Ep
+ B
t
131,
4516
4Pl
+ B
t + O
px
131,
4521
3Pl
+ Q
z + K
fs +
Hbl
-2
5,85
433
+ Q
z + M
ag-2
5,85
455
+ Bt
+ M
ag +
Ilm
131,
4415
8Pl
+ K
fs +
Ep
+ Bt
-25,
9036
5+
Mag
± Il
m
131,
6626
4Pl
+ C
px +
Bt +
Qz
132,
1433
3Pl
+ K
fs +
Qz +
Bt +
Ep
-25,
9991
1+
Opx
+ M
ag-2
5,99
178
+ Gr
t + M
ag +
Ilm
131,
7449
6Pl
+ K
fs +
Bt +
Qz
132,
1434
4Pl
+ K
fs +
Bt +
Qz
-26,
0009
3+
Grt +
Ep
+ M
ag-2
5,99
211
+ M
ag +
Ilm
131,
7449
6H
bl +
Pl +
Kfs
132,
1434
4Pl
+ K
fs +
Bt +
Qz
-26,
0009
3+
Qz +
Bt +
Ilm
av
. 8 %
-2
5,99
211
+ M
ag +
Ilm
131,
7449
6K
fs +
Pl +
Qz
[12
%]
132,
1434
4Pl
+ K
fs +
Bt +
Qz
-26,
0009
3+
Bt +
Mag
-25,
9921
1+
Mag
+ Il
m
131,
7326
9Pl
+ K
fs +
Opx
+ Q
z 13
1,66
258
Kfs
+ P
l + Q
z+ B
t + E
p-2
6,01
569
+ Bt
+ M
ag +
Ilm
+ C
al-2
5,99
915
+ H
bl +
Grt
+ M
ag
131,
7431
8K
fs +
Pl +
Grt
-26,
0044
2+
Bt +
Qz +
Mag
131,
9259
5K
fs +
Pl +
Qz +
Cpx
13
1,92
603
Pl +
Qz +
Kfs
+ H
bl +
Grt
-26,
1766
4+
Grt +
Mag
+ B
t-2
6,17
661
+ O
px +
Ilm
+ M
ag ±
Bt
131,
9259
5Pl
+ K
fs +
Qz +
Cpx
13
1,87
913
Pl +
Kfs
+ Q
z + B
t-2
6,17
664
+ Gr
t + Il
m ±
Bt
-26,
2115
1+
Opx
+ G
rt +
Ilm
131,
9259
5Pl
+ K
fs +
Grt
+ Q
z 13
1,83
544
Kfs
+ P
l av
. 4 %
-2
6,17
664
+ Cp
x + B
t + Il
m-2
6,25
303
+ Bt
+ M
ag[7
%]
131,
9259
5Pl
+ K
fs +
Grt
+ O
px
131,
8394
9Pl
+ K
fs +
Qz +
Bt
-26,
1766
4+
Cpx +
Qz +
Ilm
± B
t-2
6,25
472
+ H
bl +
Ilm
+ G
rt
131,
7737
5Pl
+ K
fs +
Cpx
+ G
rt -2
6,30
666
+ Q
z + K
y +
Ilm +
Rt
Pristine
Sheared
Pristine
min
eral
s (%
)m
iner
als
(%)
x
av. 3
0 %
x
x
11 12
3 2
6 6 6 6
SW13
-321
SW13
-323
A
35
SW14
-228
Ax
x
North South
40 ±
8
40 ±
2
20 ±
3
29 ±
1
20 ±
1
SW13
-192
8x
2 8
± 1
8 ±
1
10 ±
4
10 ±
2
_0
13 ±
2
21
± 6*
3 ±
1
5 ±
1
7 ±
2
SW13
-159
x
x
Central
13
8SW
13-1
91x
416
± 1
9SW
14-0
29B
x3
13 ±
2
9SW
14-0
29A
x
3 3
3 ±
5*
9SW
14-0
29A
x2
3 ±
0
9SW
14-0
25
13 14
SW14
-179
SW13
-134
SW14
-237
C
SW14
-244
4 2
av. 1
0 %
SW13
-323
A
SW13
-323
A
xx
x5 4 3 3
x x-
Foot
wal
l of t
he W
oodr
offe
Thr
ust
3SW
13-1
712
x
Hyd
rous
3 2 3
SW13
-171
2 3 3
NW
13-1
34A
FW13
-093
xx
Han
ging
wal
l of t
he W
oodr
offe
Thr
ust
Hyd
rous
2SW
13-1
74A
x3
10 ±
2
3N
W13
-139
x3
4 ±
2av
. 10
%3
FW13
-096
x2
7 ±
1
3SW
13-1
02x
417
± 4
Sheared
6 2
± 1
9N
W13
-203
x3
5 ±
1
11SW
14-1
81A
x5
1 ±
2
av. 1
%11
SW14
-181
Bx
- <
1
11SW
14-1
81B
x2
3 ±
0
11SW
14-1
81B
x-
<1
Solid Earth, 9, 859–878, 2018 www.solid-earth.net/9/859/2018/
S. Wex et al.: Inverted distribution of ductile deformation across the Woodroffe Thrust 871
are required for mineral reactions in a solid silicate system(Milke et al., 2013). Similarly, relict plagioclase clasts with-out any inclusions (microstructure 4) also indicate the ab-sence of a free-fluid phase, as the studied rocks were allmetastable with respect to hydration Reactions (R1), (R2),and (R4). Consequently, any of these breakdown reactionswould have rapidly consumed any available free fluid, sinceall other reactants were present in the studied samples. Viceversa, plagioclase breakdown by Reaction (R1) clearly in-dicates the presence of a free-fluid phase during deforma-tion. Reaction (R2) also involves hydration, as indicated bythe marginal presence of epidote in plagioclase clasts (mi-crostructure 2). However, free fluids were not sufficientlyavailable to facilitate Reaction (R1). Hence, we favour the in-terpretation that microstructure 2 indicates largely anhydrousconditions, with only very minor fluid introduction.
Based on the classification above, the regional availabilityof a free-fluid phase during deformation, termed “wet” and“dry”, can be determined from the mineral inclusions in pla-gioclase (Fig. 8c) and the corresponding inferred breakdownreactions (Sect. 8.1). The distinction is purely qualitative andrefers only to whether or not free fluid was sufficiently avail-able to facilitate the hydrous breakdown Reaction (R1). Con-sequently, the studied field area is characterized as domi-nantly dry (microstructures 2, 3, and 4) with a progressiontowards locally wet conditions (microstructure 1) in most ofthe northernmost exposures (Fig. 9). The regional variationin (1) the development of syntectonic quartz veins (Fig. 8a)and (2) the introduction of carbon (Fig. 8b) is consistent inboth cases with this interpretation (Fig. 9). However, withina single location, individual samples can have a wet mi-crostructure 1 while others still preserve a dry microstruc-ture 4 (Fig. 8c), indicating that the availability of fluids var-ied on a very local scale. Generally dry conditions are alsoin agreement with the fact that the metamorphic overprintduring the Petermann Orogeny occurred under lower-gradeconditions compared to the earlier Musgravian Orogeny andthus facilitated water consumption rather than water release.
8.3 Fluid source
There does not seem to be any link between the local distri-bution of aqueous and CO2-bearing fluids, since samples thatpreserve a wet microstructure 1 are not necessarily calcite-bearing and vice versa (Fig. 8b, c).
Aqueous fluids infiltrating into the footwall of theWoodroffe Thrust were unlikely to have been derived fromthe drier hanging wall (Table 4) and consequently must orig-inate from units within or underlying the current level ofexposure of the footwall. Gneisses and granitoids in thewet northern part of the study area are clearly interleavedwith and juxtaposed onto the basal units of the AmadeusBasin (Wells et al., 1970), as evident from outcrops of DeanQuartzite (Forman, 1965; Young et al., 2002) immediatelywest of the Kelly Hills klippe. These Neoproterozoic sed-
imentary rocks represent an ideal source for aqueous andCO2-bearing fluids since they were metamorphosed and de-hydrated during the Petermann Orogeny (Wells et al., 1970).However, based on regional-scale geometric reconstructions,it has been argued that the Woodroffe Thrust and potentiallyunderlying thrust planes developed in-sequence (Wex et al.,2017). If this is true, then the Dean Quartzite was only imbri-cated below the northernmost studied locations after move-ment and deformation on the Woodroffe Thrust had largelyceased and the dynamic microstructures had already beenfrozen in. Therefore, we prefer a model in which the aque-ous fluids were released from the granitoids and upper am-phibolite facies gneisses within the footwall. Such a modelis in agreement with the fact that the regional trend towardshigher abundance of hydrous minerals in the north parallelsthe shift towards wet conditions, as indicated by the plagio-clase breakdown reactions (Fig. 9). An internal source is alsoconsistent with the conclusion that wet conditions were onlypresent on a very local scale and that wet and dry samplesare often preserved in close proximity. The same is also trueof calcite-bearing and calcite-absent samples. We thereforeconclude that the studied field area was not pervasively infil-trated by externally derived aqueous-rich fluids and remaineda relatively closed system. The source of carbon remains un-explained, even if the quantities involved are very small. Asfar as currently known, units of the footwall Mulga ParkSubdomain are non-carbonaceous, although small amountsof CO2 can be present within fluid inclusions. Calcite car-bon and oxygen (δ13CCal, δ18OCal) and carbon whole rock(δ13Cwhole rock) isotropic signatures were measured with theaim of providing better constraints on the source, but the re-sults are inconclusive (see Supplement Sect. S2 for more de-tails). Values for δ18O are in agreement with calcite crys-tallization temperatures of 500–600 ◦C while δ13CCal valuesare partially rock-buffered and do not allow an unequivocalinterpretation of the potential source (Supplement Sect. S2).
8.4 Distribution of ductile deformation
The distribution of thorium establishes that the WoodroffeThrust mylonites preferentially developed in the Mulga Parkrather than the Fregon Subdomain (Fig. 6). This conclusionis in agreement with our field observations and with thoseof Bell and Etheridge (1976), Camacho et al. (1995), andFlottmann et al. (2004). However, it is evident from ourresults that in the southern locations, the lowermost hang-ing wall was also involved in the mylonitization process(Table 3). We discuss below the potential processes guid-ing the large-scale distribution of ductile deformation in theWoodroffe Thrust.
8.4.1 Hanging wall and footwall reworking
The proportion of the total shear strain accommodated inthe narrow mylonitic to ultramylonitic zones developed in
www.solid-earth.net/9/859/2018/ Solid Earth, 9, 859–878, 2018

872 S. Wex et al.: Inverted distribution of ductile deformation across the Woodroffe Thrust
10 km~ 0.3 x vertical
Woodro�e Thrust
Unsheared pst. breccia
Unsheared pst. vein
Sheared pst.
Syntectonic Qz veins
Hydrothermal calcite
Ultramylonite
Mylonite
Protomylonite
Kelly Hills
Hanging wallreworking:
18–40 m Mylonitethickness:ca. 600 m
Enlargement southHanging wallreworking: none
Av. mylonitethickness: 100 m
Enlargement north
Mt Woodro�eDSZ
0 m
1000 m
-1000 m
“Dry”
N S
H O 2 H O 2 H O 2 H2O H O 2 H2O “Dry” “Dry”“Wet”“Wet”
~ 620–650 °C~ 520 °C
An + Or + H2O = Ms + Ep + Qz(microstructure 1) Microstructure 2 An = Grs
+ Ky + Qz(micro-
structure 3)Metastable plagioclase (microstructure 4)
Plagioclase stabilityand breakdown
Regional temperaturegradient
Presence/absenceof aqueous �uids
DSZ - Davenport Shear Zone
Hydrothermal calcite
Syntectonic Qz veins
Hydrous mineralsModal abundance of
Presence of
Abundance of
Present-day topography
Footwall gneiss(Mulga Park Subdomain)
Hanging wall gneiss(Fregon Subdomain)
Figure 9. Projected schematic cross section through the central Musgrave Block. The horizontal scale is compressed by a factor of 3.5 withrespect to the vertical scale. The regional temperature gradient is taken from Wex et al. (2017).
the lowermost hanging wall and uppermost footwall cannotbe determined. However, what could be determined in thisstudy is the relative thickness of the mylonite zones, usingthorium concentrations to distinguish the original hangingwall and footwall protoliths. From this it is established thatthe hanging-wall-derived parts of the Woodroffe Thrust gen-erally make up < 10 % of the entire width of the myloniticzone. This preferential development of a broader mylonitezone in the Mulga Park Subdomain footwall rather than inthe Fregon Subdomain hanging wall is contrary to the ex-pected simple model of a thrust or reverse fault system (e.g.Mancktelow, 1985; Passchier, 1984). Such a model wouldpredict an asymmetric strain profile where the mylonite zoneoccurs in the initially “hotter” hanging wall rather than the
“colder” footwall. An inverse distribution of ductile defor-mation, as a consequence of asymmetric thermal weaken-ing, would be in agreement with the flower-like structuremodel proposed by Camacho and McDougall (2000) for thecentral Musgrave Block. Based on the preservation of pre-Petermann K-Ar, 40Ar-39Ar, and Rb-Sr ages in hornblende,muscovite, biotite, and K-feldspar in the undeformed gneis-sic country rocks, Camacho and McDougall (2000) arguedthat the Fregon Subdomain was rapidly buried and exhumedin less than 40 Myr. Consequently, these rocks failed to ther-mally equilibrate to temperatures above 350 ◦C at a pressureof ∼ 1.2 GPa. With this tectonic model, the hanging wallshould have been at temperatures < 350 ◦C (Camacho andMcDougall, 2000) and thus should have been colder than
Solid Earth, 9, 859–878, 2018 www.solid-earth.net/9/859/2018/
S. Wex et al.: Inverted distribution of ductile deformation across the Woodroffe Thrust 873
the footwall (> 500 ◦C; Wex et al., 2017). In such a model,thermal weakening could indeed account for preferential my-lonitization of the Mulga Park Subdomain. However, Wex etal. (2017) and Hawemann et al. (2018) demonstrated that Pe-termann Orogeny metamorphic assemblages throughout thestudy area are directly comparable in dynamically and stat-ically recrystallized units, arguing that the estimated meta-morphic conditions were ambient and differed little betweenshear zones and country rock. In addition, Wex et al. (2017)found that the syntectonic metamorphic conditions are simi-lar in the hanging wall and footwall at the same locality, argu-ing against thermal weakening as a cause of the preferentialmylonitization of the Mulga Park Subdomain (Camacho andMcDougall, 2000).
Pseudotachylytes have been identified as preferred nucle-ation discontinuities for shearing under mid- to lower-crustalconditions (Andersen and Austrheim, 2006; Austrheim andAndersen, 2004; Hawemann et al., 2014; Lund and Aus-trheim, 2003; Menegon et al., 2017; Passchier, 1982; Pen-nacchioni and Cesare, 1997; Pittarello et al., 2012; Wex etal., 2014, 2017). In the Musgrave Block, however, the pres-ence of precursor pseudotachylyte cannot account for the ob-served inverse distribution of ductile deformation, since thesefault rocks are significantly more abundant in the hangingwall compared to the footwall (Camacho et al., 1995; Lin etal., 2005).
A potential explanation for the observed inverse gradi-ent of ductile deformation along the Woodroffe Thrust is arheological contrast between hanging wall and footwall as-semblages, resulting in different degrees, and potentially dif-ferent processes, of water-assisted weakening in quartz andfeldspar (e.g. Fitz Gerald et al., 2006; Griggs, 1967, 1974;Griggs and Blacic, 1965; Hobbs, 1985; Kronenberg et al.,1990; Mancktelow and Pennacchioni, 2004; Stünitz et al.,2017; Tullis and Yund, 1989). As discussed in Sect. 8.3, therocks in the study area represent a relatively closed systemwith respect to the presence or absence of aqueous fluids.The availability of aqueous fluids is thus directly linked to theabundance of hydrous minerals in these rocks, which is ob-served to decrease from north to south (Fig. 9). Similarly, thecontrasting abundance of hydrous minerals in hanging walland footwall (Table 4) indicates that there is consistently ahigher potential for generating aqueous fluids in the footwallthan in the hanging wall. If sufficient water was available,this could facilitate a preferential rheological weakening ofthe footwall due to new growth of micas and associated phyl-lonite development. However, this is not observed becausethe majority of the studied rocks are still relatively dry, sothat only slight differences in the abundance of water couldfacilitate an asymmetric distribution of ductile deformationas a consequence of water-assisted weakening. The preferen-tial mylonitization of the Mulga Park relative to the FregonSubdomain (Fig. 6) therefore seems to be largely controlledby the precursor mineralogy established as a result of the ear-lier (ca. 1200 Ma) Musgravian Orogeny metamorphism, with
peak conditions of upper amphibolite facies in the footwallbut granulite facies in the hanging wall. This supports theinitial hypothesis of Bell and Etheridge (1976) and Camachoet al. (1995) that a more hydrous footwall underlying an an-hydrous hanging wall can facilitate an inverted gradient ofductile deformation.
8.4.2 Variation in mylonite thickness
Mylonite thickness in the study area does not significantlyvary parallel to strike (i.e. E–W). However, from south tonorth, i.e. parallel to the direction of tectonic transport,the Woodroffe Thrust mylonitic zone gradually decreases inthickness from over 600 m to less than 100 m (Table 1). Thispotentially indicates a 6-fold increase in shear strain (andtherefore average strain rate) within the mylonites, assuminga homogeneous distribution of strain and constant relativedisplacement across the Woodroffe Thrust thickness alongthe entire ca. 60 km transect. This trend from south to northis accompanied by a slight decrease in metamorphic temper-ature of ca. 100 ◦C (Wex et al., 2017) and the shift from dry torelatively wet conditions, as reflected in the increasing abun-dance of hydrous minerals (Fig. 9). The thickness of large-scale shear zones is considered to decrease with decreasingtemperature and depth (Platt and Behr, 2011a, b) and de-creasing displacement (Hull, 1988). A point in the footwallonly enters the shear zone when it passes the toe of the thrust(that is where the thrust meets the surface). This could poten-tially lead to a variation in the finite shear strain experiencedin the footwall. However, the whole of the exposed ca. 60 kmN–S section was formerly at mid- to lower-crustal level (Wexet al., 2017) and thus nowhere near the thrust toe. There isalso currently no evidence for major splays of the WoodroffeThrust into the hanging wall. Distributed folding related tothe Peterman Orogeny is observable on the regional scalein the footwall (Wex et al., 2017), but the amount of short-ening involved cannot be quantified. It follows that there ispresently no indication of a significant change in relative dis-placement along the studied section and that variation in thisparameter therefore cannot be used to account for the dif-ference in mylonite thickness. It was argued above that thegreater abundance of hydrous minerals in the footwall MulgaPark Subdomain compared to the hanging wall Fregon Sub-domain, reflecting peak metamorphic conditions of upperamphibolite facies and granulite facies respectively duringthe earlier Musgravian Orogeny, resulted in slightly wetterconditions in the footwall during activity of the WoodroffeThrust. This was proposed as an explanation for the broaderzone of mylonites in the footwall. However, the current studyalso establishes that the thickness of the mylonitic zone de-creases toward to the north and that this is associated withincreasing water activity and decreasing temperature. Suchan observation might reflect the possibility that even a smallamount of fluid was able to weaken the footwall relative tothe strong drier hanging wall, allowing it to preferentially
www.solid-earth.net/9/859/2018/ Solid Earth, 9, 859–878, 2018

874 S. Wex et al.: Inverted distribution of ductile deformation across the Woodroffe Thrust
take up deformation. Increasing water content in the footwallto the north could result in an increase in the effective rheo-logical contrast between footwall and hanging wall, yieldinga stronger localization toward the interface and a narrowermylonite zone that extends less into the stronger material.This hypothesis is supported by the observations in the cur-rent paper, but there is not yet a theoretical basis to providea full explanation. Decreasing temperature to the north couldalso lead to increased localization and decreased shear zonethickness, both directly (Platt and Behr, 2011a, b) and as asecond-order effect accentuating the rheological contrast asboth footwall and hanging wall become stronger with de-creasing temperature.
9 Conclusions
Field and thin-section observations establish that the rocksof the central Musgrave Block were predominantly dryduring development of the mid-crustal Woodroffe Thrustduring the ca. 560–520 Ma Petermann Orogeny, but witha progression in the thrust direction towards locally wetconditions in some of the northernmost exposures. Thisis indicated by (1) rare occurrence of syntectonic quartzveins and quartz-rich pegmatites (locally found only inthe north), (2) the metastability of plagioclase in the pres-ence of K-feldspar, which rarely shows significant al-teration via the reaction An+Or+H2O=Ms+Ep+Qz(more common towards the north), and (3) preferentialhigh-pressure breakdown of plagioclase via the reactionAn=Grs+Ky+Qz (common in the southerly exposures),rather than An+H2O=Ep+Ky+Qz. Aqueous fluids weremost likely derived internally from hydrous minerals withinthe footwall gneisses and granitoids, implying that the rocksin the study area were a relatively closed system.
The thickness of the Woodroffe Thrust mylonites gener-ally decreases with decreasing metamorphic grade and in-creasing availability of aqueous fluids. Atypical of a thrust,ductile deformation is more extensively developed in thefootwall rocks and only marginally involved several tens ofmetres of the lowermost hanging wall. The inverse gradientof ductile deformation cannot be explained by thermal weak-ening or the distributed presence of pseudotachylyte (actingas preferred nucleation sites for shearing) but rather by pref-erential rheological weakening of the wetter footwall com-pared to the drier hanging wall. This reflects the earlier (Mus-gravian Orogeny) peak metamorphic conditions (granulitefacies in the hanging wall and upper amphibolite facies inthe footwall) and the contrasting availability of aqueous flu-ids derived from relict hydrous minerals in the footwall andhanging wall.
Data availability. Supplementary data are available in SupplementSects. S1 to S4, and further information can be obtained on requestfrom the corresponding author.
The Supplement related to this article is available onlineat https://doi.org/10.5194/se-9-859-2018-supplement.
Author contributions. Each of the listed authors took part in at leasttwo of three field seasons, which formed the basis of this study.AC’s previous knowledge of the Musgrave Ranges and the localcommunities was essential for the success of the campaign. NSMand GP developed the initial idea of the study. SW prepared themanuscript with contributions from all co-authors.
Competing interests. The authors declare that they have no conflictof interest.
Acknowledgements. We thank the communities of the AnanguPitjantjatjara Yankunytjatjara Lands (APY) for granting us accessto the Musgrave Ranges. Logistical support from the NorthernTerritory Geological Survey (NTGS) of Australia, Basil Tikoff(Univ. Wisconsin, Madison), and Shane and Alethea Nicolle aregratefully recognized. We further acknowledge the support ofKarsten Kunze from the Scientific Center for Optical and ElectronMicroscopy (ScopeM) at the ETH, Zurich. Jost Eikenberg isthanked for supervising and conducting the thorium measurementsat the Paul Scherrer Institute (PSI) in Villigen, Switzerland. Wefurther acknowledge the support of Madalina Jaggi, who carriedout the stable isotope analyses at the Geological Institute atETH, Zurich. This project was financed by the Swiss NationalScience Foundation (SNF) grant 200021_146745 awarded toNeil S. Mancktelow, with additional funding from the Universityof Padova (BIRD175145/17: The geological record of deepearthquakes: the association pseudotachylyte-mylonite) awarded toGiorgio Pennacchioni.
Edited by: Renée HeilbronnerReviewed by: Florian Fusseis and Kevin Mahan
References
Allen, J. L. and Shaw, C. A.: Seismogenic structure of a crys-talline thrust fault: fabric anisotropy and coeval pseudotachylyte-mylonitic pseudotachylyte in the Grizzly Creek Shear Zone, Col-orado, in: Geology of the Earthquake Source: A Volume in Hon-our of Rick Sibson, edited by: Fagereng, A., Toy, V. G., and Row-land, J. V., 135–151, Geol. Soc. Spec. Publ., 359, London, UK,2011.
Andersen, T. B. and Austrheim, H.: Fossil earthquakes recordedby pseudotachylytes in mantle peridotite from the Alpine sub-duction complex of Corsica, Earth Planet. Sc. Lett., 242, 58–72,https://doi.org/10.1016/j.epsl.2005.11.058, 2006.
Solid Earth, 9, 859–878, 2018 www.solid-earth.net/9/859/2018/

S. Wex et al.: Inverted distribution of ductile deformation across the Woodroffe Thrust 875
Austrheim, H. and Andersen, T. B.: Pseudotachylytes from Cor-sica: fossil earthquakes from a subduction complex, Terra Nov.,16, 193–197, https://doi.org/10.1111/j.1365-3121.2004.00551.x,2004.
Ballhaus, C. and Glikson, A. Y.: The petrology of layered mafic-ultramafic intrusions of the Giles complex, western MusgraveBlock, Western Australia, AGSO J. Aust. Geol. Geophys., 16,69–90, 1995.
Bell, T. H.: Progressive deformation and reorientation of foldaxes in a ductile mylonite zone: The Woodroffe Thrust,Tectonophysics, 44, 285–320, https://doi.org/10.1016/0040-1951(78)90074-4, 1978.
Bell, T. H. and Etheridge, M. A.: The deformation and recrys-tallization of quartz in a mylonite zone, central Australia,Tectonophysics, 32, 235–267, https://doi.org/10.1016/0040-1951(76)90064-0, 1976.
Bell, T. H. and Johnson, S. E.: The role of deformation par-titioning in the deformation and recrystallization of pla-gioclase and K-feldspar in the Woodroffe Thrust mylonitezone, central Australia, J. Metamorph. Geol., 7, 151–168,https://doi.org/10.1111/j.1525-1314.1989.tb00582.x, 1989.
Bell, T. H. and Johnson, S. E.: Shear sense: a new approachthat resolves conflicts between criteria in metamorphic rocks, J.Metamorph. Geol., 10, 99–124, https://doi.org/10.1111/j.1525-1314.1992.tb00074.x, 1992.
Boyd, F. R. and England, J. L.: Melting of silicates at high pressures,in: Carnegie Inst. Wash. Yr. Book 60, Port City Press, Baltimore,USA, 113–125, 1961.
Camacho, A.: An Isotopic Study of Deep-Crustal Orogenic Pro-cesses: Musgrave Block, Central Australia, PhD Thesis, TheAustralian National University, Canberra, Australia, 1997.
Camacho, A. and Fanning, C. M.: Some isotopic constraintson the evolution of the granulite and upper amphibolite fa-cies terranes in the eastern Musgrave Block, central Australia,Precambrian Res., 71, 155–181, https://doi.org/10.1016/0301-9268(94)00060-5, 1995.
Camacho, A. and McDougall, I.: Intracratonic, strike-slip par-titioned transpression and the formation and exhumationof eclogite facies rocks: An example from the Mus-grave Block, central Australia, Tectonics, 19, 978–996,https://doi.org/10.1029/1999TC001151, 2000.
Camacho, A., Simons, B., and Schmidt, P. W.: Geological andpalaeomagnetic significance of the Kulgera Dyke Swarm, Mus-grave Block, NT, Australia, Geophys. J. Int., 107, 37–45,https://doi.org/10.1111/j.1365-246X.1991.tb01154.x, 1991.
Camacho, A., Vernon, R. H., and Fitz Gerald, J. D.: Large vol-umes of anhydrous pseudotachylyte in the Woodroffe Thrust,eastern Musgrave Ranges, Australia, J. Struct. Geol., 17, 371–383, https://doi.org/10.1016/0191-8141(94)00069-C, 1995.
Camacho, A., Compston, W., McCulloch, M., and McDougall, I.:Timing and exhumation of eclogite facies shear zones, Mus-grave Block, central Australia, J. Metamorph. Geol., 15, 735–751, https://doi.org/10.1111/j.1525-1314.1997.00053.x, 1997.
Camacho, A., Yang, P., and Frederiksen, A.: Constraintsfrom diffusion profiles on the duration of high-straindeformation in thickened crust, Geology, 37, 755–758,https://doi.org/10.1130/G25753A.1, 2009.
Camacho, A., Armstrong, R., Davis, D. W., and Bekker, A.: Earlyhistory of the Amadeus Basin: Implications for the existence
and geometry of the Centralian Superbasin, Precambrian Res.,259, 232–242, https://doi.org/10.1016/j.precamres.2014.12.004,2015.
Christie, J. M.: Moine Thrust Zone in the Assynt region of north-west Scotland, Univ. Calif. Publ. Geol. Sci., 40, 345–440, 1963.
Clarke, G. L., Buick, I. S., Glikson, A. Y., and Stewart, A. J.: Struc-tural and pressure-temperature evolution of host rocks of theGiles Complex, western Musgrave Block, central Australia: ev-idence for multiple high-pressure events, AGSO J. Aust. Geol.Geophys., 16, 127–146, 1995.
Collerson, K. D., Oliver, R. L., and Rutland, R. W. R.: An exam-ple of structural and metamorphic relationships in the Musgraveorogenic belt, central Australia, J. Geol. Soc. Aust., 18, 379–393,https://doi.org/10.1080/00167617208728776, 1972.
Cooper, A. F. and Norris, R. J.: Anatomy, structural evo-lution, and slip rate of a plate boundary thrust: TheAlpine Fault at Gaunt Creek, Westland, New Zealand, Geol.Soc. Am. Bull., 106, 627–633, https://doi.org/10.1130/0016-7606(1994)106<0627:ASEASR>2.3.CO;2, 1994.
Coward, M. P.: The Caledonian thrust and shear zones of N.W. Scot-land, J. Struct. Geol., 2, 11–17, https://doi.org/10.1016/0191-8141(80)90029-2, 1980.
Davis, G. A.: Rapid upward transport of mid-crustal myloniticgneisses in the footwall of a Miocene detachment fault, WhippleMountains, southeastern California, Geol. Rundsch., 77, 191–209, https://doi.org/10.1007/BF01848684, 1988.
Davis, G. A. and Lister, G. S.: Detachment faulting incontinental extension; Perspectives from the SouthwesternU.S. Cordillera, Geol. Soc. Am. Spec. Pap., 218, 133–159,https://doi.org/10.1130/SPE218-p133, 1988.
Edgoose, C. J., Camacho, A., Wakelin-King, G. A., and Simons, B.A.: 1 : 250 000 Geological Map Series Explanatory Notes. Kul-gera SG 53-5, 2nd ed., North. Territ. Geol. Surv., Darwin, Aus-tralia, 1993.
Edgoose, C. J., Scrimgeour, I. R., and Close, D. F.: Report 15: Ge-ology of the Musgrave Block, Northern Territory, North. Territ.Geol. Surv., Darwin, Australia, 2004.
Ellis, D. J. and Maboko, M. A. H.: Precambrian tectonics andthe physicochemical evolution of the continental crust. I. Thegabbro-eclogite transition revisited, Precambrian Res., 55, 491–506, https://doi.org/10.1016/0301-9268(92)90041-L, 1992.
Evins, P. M., Smithies, R. H., Howard, H. M., Kirkland, C. L.,Wingate, M. T. D., and Bodorkos, S.: Record 2010/6: Redefiningthe Giles Event within the setting of the 1120–1020 Ma Ngaany-atjarra Rift, west Musgrave Province, central Australia, Geol.Surv. West. Aust., Perth, Australia, 2010.
Fitz Gerald, J. D., Mancktelow, N. S., Pennacchioni, G., and Kunze,K.: Ultra-fine grained quartz mylonites from high-grade shearzones: Evidence for strong dry middle to lower crust, Geology,34, 369–372, https://doi.org/10.1130/G22099.1, 2006.
Flottmann, T., Hand, M., Close, D., Edgoose, C., and Scrimgeour,I.: Thrust Tectonic Styles of the Intracratonic Alice Springs andPetermann Orogenies, Central Australia, in: AAPG Memoir 82:Thrust tectonics and hydrocarbon systems, edited by: McClay,K. R., American Association of Petroleum Geologists (AAPG),Tulsa, USA, 538–557, 2004.
Forman, D. J.: 1 : 250 000 Geological Series Explanatory Notes. Ay-ers Rock, N.T. SG/52-8, 1st ed., Bur. Miner. Resour. Geol. Geo-phys., Canberra, Australia, 1965.
www.solid-earth.net/9/859/2018/ Solid Earth, 9, 859–878, 2018

876 S. Wex et al.: Inverted distribution of ductile deformation across the Woodroffe Thrust
Fossen, H. and Cavalcante, G. C. G.: Shear zones– A review, Earth-Sci. Rev., 171, 434–455,https://doi.org/10.1016/j.earscirev.2017.05.002, 2017.
Goldsmith, J. R.: The melting and breakdown reactions of anorthiteat high pressures and temperatures, Am. Mineral., 65, 272–284,1980.
Goldsmith, J. R.: Plagioclase stability at elevated temperatures andwater pressures., Am. Mineral., 67, 653–675, 1982.
Gray, C. M.: The Geochemistry of Central Australian Granulitesin Relation to the Chemical and Isotopic Effects of Gran-ulite Facies Metamorphism, Contrib. Mineral. Petr., 65, 79–89,https://doi.org/10.1007/BF00373573, 1977.
Gray, C. M.: Geochronology of granulite-facies gneisses in thewestern Musgrave Block, central Australia, J. Geol. Soc. Aust.,25, 403–414, https://doi.org/10.1080/00167617808729050,1978.
Gray, C. M. and Compston, W.: A rubidium-strontium chronol-ogy of the metamorphism and prehistory of central Aus-tralian granulites, Geochim. Cosmochim. Ac., 42, 1735–1747,https://doi.org/10.1016/0016-7037(78)90259-4, 1978.
Griggs, D.: Hydrolytic Weakening of Quartz and OtherSilicates, Geophys. J. Roy. Astr. S., 14, 19–31,https://doi.org/10.1111/j.1365-246X.1967.tb06218.x, 1967.
Griggs, D.: A Model of Hydrolytic Weakeningin Quartz, J. Geophys. Res., 79, 1653–1661,https://doi.org/10.1029/JB079i011p01653, 1974.
Griggs, D. T. and Blacic, J. D.: Quartz: Anomalous Weak-ness of Synthetic Crystals, Science, 147, 292–295,https://doi.org/10.1126/science.147.3655.292, 1965.
Handy, M. R., Hirth, G., and Bürgmann, R.: Continental fault struc-ture and rheology from the frictional-to-viscous transition down-ward, in: Tectonic Faults: Agents of Change on a Dynamic Earth,edited by: Handy, M. R., Hirth, G., and Hovius, N., MIT Press,Cambridge, USA, 139–181, 2007.
Hariya, Y. and Kennedy, G. C.: Equilibrium study of anorthite underhigh pressure and high temperature, Am. J. Sci., 266, 193–203,https://doi.org/10.2475/ajs.266.3.193, 1968.
Hawemann, F., Mancktelow, N., Wex, S., Camacho, A., and Pen-nacchioni, G.: Strain localization on different scales and the im-portance of brittle precursors during deformation in the lowercrust (Davenport Shear Zone, Central Australia), 13th GeneralAssembly European Geosciences Union, 27 April–2 May 2014,Vienna, Austria, Geophys. Res. Abstr., 16, 5009, 2014.
Hawemann, F., Mancktelow, N. S., Wex, S., Camacho, A.,and Pennacchioni, G.: Pseudotachylyte as field evidence forlower-crustal earthquakes during the intracontinental PetermannOrogeny (Musgrave Block, Central Australia), Solid Earth, 9,629–648, https://doi.org/10.5194/se-9-629-2018, 2018.
Heier, K. S. and Adams, J. A. S.: Concentration of radioactive el-ements in deep crustal material, Geochim. Cosmochim. Ac., 29,53–61, https://doi.org/10.1016/0016-7037(65)90078-5, 1965.
Hobbs, B. E.: The hydrolytic weakening effect in quartz, in: PointDefects in Minerals, edited by: Schock, R. N., Am. Geophys.Union, Geophys. Monogr. Ser., 31, Washington D.C., USA, 151–170, 1985.
Hull, J.: Thickness-displacement relationships for de-formation zones, J. Struct. Geol., 10, 431–435,https://doi.org/10.1016/0191-8141(88)90020-X, 1988.
Kretz, R.: Note on some equilibria in which plagioclaseand epidote participate, Am. J. Sci., 261, 973–982,https://doi.org/10.2475/ajs.261.10.973, 1963.
Kronenberg, A. K., Segall, P., and Wolf, G. H.: Hydrolytic Weaken-ing and Penetrative Deformation Within a Natural Shear Zone,in: The Brittle-Ductile Transition in Rocks, edited by: Duba,A. G., Durham, W. B., Handin, J. W., and Wang, H. F., Am.Geophys. Union, Geophys. Monogr. Ser., 56, Washington D.C.,USA, 21–36, 1990.
Lambert, I. B. and Heier, K. S.: The vertical distribution of ura-nium, thorium and potassium in the Continental Crust, Geochim.Cosmochim. Ac., 31, 377–390, https://doi.org/10.1016/0016-7037(67)90048-8, 1967.
Lambert, I. B. and Heier, K. S.: Geochemical investigations ofdeep-seated rocks in the Australian shield, Lithos, 1, 30–53,https://doi.org/10.1016/S0024-4937(68)80033-7, 1968.
Lin, A., Maruyama, T., Aaron, S., Michibayashi, K., Cama-cho, A., and Kano, K.: Propagation of seismic slip from brit-tle to ductile crust: Evidence from pseudotachylyte of theWoodroffe thrust, central Australia, Tectonophysics, 402, 21–35,https://doi.org/10.1016/j.tecto.2004.10.016, 2005.
Lund, M. G. and Austrheim, H.: High-pressure metamorphismand deep-crustal seismicity: evidence from contemporane-ous formation of pseudotachylytes and eclogite facies coro-nas, Tectonophysics, 372, 59–83, https://doi.org/10.1016/S0040-1951(03)00232-4, 2003.
Maboko, M. A. H., McDougall, I., and Zeitler, P. K.: MetamorphicP-T path of granulites in the Musgrave Ranges, central Australia,in: Evolution of Metamorphic Belts, edited by: Daly, J. S., Cliff,R. A., and Yardley, B. W. D., Geol. Soc. Spec. Publ., 43, London,UK, 303–307, 1989.
Maboko, M. A. H., Williams, I. S., and Compston, W.: Zircon U-PbChronometry of the Pressure and Temperature History of Gran-ulites in the Musgrave Ranges, Central Australia, J. Geol., 99,675–697, 1991.
Maboko, M. A. H., McDougall, I., Zeitler, P. K., and Williams,I. S.: Geochronological evidence for ∼ 530–550 Ma juxtaposi-tion of two Proterozoic metamorphic terranes in the MusgraveRanges, central Australia, Aust. J. Earth Sci., 39, 457–471,https://doi.org/10.1080/08120099208728038, 1992.
Major, R. B.: Woodroffe Thrust Zone in the Musgrave Ranges, Q.Geol. Notes, 35, 9–11, 1970.
Major, R. B.: Explanatory Notes for the Woodroffe 1 : 250 000 Ge-ological Map SG/52-12, 1st ed., Geol. Surv. South Aust., Ade-laide, Australia, 1973.
Major, R. B. and Conor, C. H. H.: Musgrave Block, in: Bulletin 54:The geology of South Australia, vol. 1. The Precambrian, editedby: Drexel, J. F., Preiss, W. V., and Parker, A. J., Geol. Surv.South Aust., Adelaide, Australia, 156–167, 1993.
Major, R. B., Johnson, J. E., Leeson, B., Mirams, R. C., andThomson, B. P.: 1 : 250 000 S. A. Geological Atlas Series Sheet.Woodroffe SG 52-12 Zone 4., 1st ed., Geol. Surv. South Aust.,Adelaide, Australia, 1967.
Mancktelow, N.: The Simplon Line: a major displacement zone inthe western Lepontine Alps, Eclogae Geol. Helv., 78, 73–96,https://doi.org/10.5169/seals-165644, 1985.
Mancktelow, N. S. and Pennacchioni, G.: The influ-ence of grain boundary fluids on the microstructure of
Solid Earth, 9, 859–878, 2018 www.solid-earth.net/9/859/2018/

S. Wex et al.: Inverted distribution of ductile deformation across the Woodroffe Thrust 877
quartz-feldspar mylonites, J. Struct. Geol., 26, 47–69,https://doi.org/10.1016/S0191-8141(03)00081-6, 2004.
Mancktelow, N. S. and Pennacchioni, G.: The control of precursorbrittle fracture and fluid-rock interaction on the development ofsingle and paired ductile shear zones, J. Struct. Geol., 27, 645–661, https://doi.org/10.1016/j.jsg.2004.12.001, 2005.
Menegon, L., Pennacchioni, G., Malaspina, N., Harris, K., andWood, E.: Earthquakes as Precursors of Ductile Shear Zones inthe Dry and Strong Lower Crust, Geochem. Geophy. Geosy., 18,4356–4374, https://doi.org/10.1002/2017GC007189, 2017.
Milke, R., Neusser, G., Kolzer, K., and Wunder, B.: Very little wateris necessary to make a dry solid silicate system wet, Geology, 41,247–250, https://doi.org/10.1130/G33674.1, 2013.
Myers, J. S., Shaw, R. D., and Tyler, I. M.: Tectonic evo-lution of Proterozoic Australia, Tectonics, 15, 1431–1446,https://doi.org/10.1029/96TC02356, 1996.
Passchier, C. W.: Pseudotachylyte and the development of ultra-mylonite bands in the Saint-Barthélemy Massif, French Pyre-nees, J. Struct. Geol., 4, 69–79, https://doi.org/10.1016/0191-8141(82)90008-6, 1982.
Passchier, C. W.: Mylonite-dominated footwall geometry in ashear zone, central Pyrenees, Geol. Mag., 121, 429–436,https://doi.org/10.1017/S0016756800029964, 1984.
Passchier, C. W. and Trouw, R. A. J.: Microtectonics, 2nd ed.,Springer, Berlin, Heidelberg, Germany, 2005.
Pennacchioni, G. and Cesare, B.: Ductile-brittle transition in pre-Alpine amphibolite facies mylonites during evolution fromwater-present to water-deficient conditions (Mont Mary nappe,Italian Western Alps), J. Metamorph. Geol., 15, 777–791,https://doi.org/10.1111/j.1525-1314.1997.00055.x, 1997.
Percival, P. J.: Record 2010/13: Index of Airborne Geophysical Sur-veys, 11th ed., Geoscience Australia, Canberra, Australia, 2010.
Pittarello, L., Pennacchioni, G., and Di Toro, G.: Amphibolite-facies pseudotachylytes in Premosello metagabbro and fel-sic mylonites (Ivrea Zone, Italy), Tectonophysics, 580, 43–57,https://doi.org/10.1016/j.tecto.2012.08.001, 2012.
Platt, J. P. and Behr, W. M.: Deep structure of litho-spheric fault zones, Geophys. Res. Lett., 38, 1–6,https://doi.org/10.1029/2011GL049719, 2011a.
Platt, J. P. and Behr, W. M.: Lithospheric shear zonesas constant stress experiments, Geology, 39, 127–130,https://doi.org/10.1130/G31561.1, 2011b.
Ramberg, H.: The Facies Classification of Rocks: A Clue to theOrigin of Quartzo-Feldspathic Massifs and Veins, J. Geol., 57,18–54, https://doi.org/10.1086/625573, 1949.
Ramsay, J. G.: Shear zone geometry: A review, J. Struct. Geol., 2,83–99, https://doi.org/10.1016/0191-8141(80)90038-3, 1980.
Schmidt, P. W., Williams, G. E., Camacho, A., and Lee, J. K. W.:Assembly of Proterozoic Australia: Implications of a revisedpole for the ∼ 1070 Ma Alcurra Dyke Swarm, central Australia,Geophys. J. Int., 167, 626–634, https://doi.org/10.1111/j.1365-246X.2006.03192.x, 2006.
Scrimgeour, I. and Close, D.: Regional high-pressure meta-morphism during intracratonic deformation: The PetermannOrogeny, central Australia, J. Metamorph. Geol., 17, 557–572,https://doi.org/10.1046/j.1525-1314.1999.00217.x, 1999.
Scrimgeour, I. R., Close, D. F., and Edgoose, C. J.: 1 : 250 000 Ge-ological Map Series and Explanatary Notes. Petermann Ranges
SG52-7, 2nd ed., North. Territ. Geol. Surv., Darwin, Australia,1999.
Selverstone, J., Axen, G. J., and Luther, A.: Fault localiza-tion controlled by fluid infiltration into mylonites: Forma-tion and strength of low-angle normal faults in the mid-crustal brittle-plastic transition, J. Geophys. Res., 117, B06210,https://doi.org/10.1029/2012JB009171, 2012.
Sibson, R. H., White, S. H., and Atkinson, B. K.: Structure anddistribution of fault rocks in the Alpine Fault Zone, New Zealand,in: Thrust and Nappe Tectonics, edited by: McClay, K. R. andPrice, N. J., Geol. Soc. Spec. Publ., 9, London, UK, 197–210,1981.
Smithies, R. H., Howard, H. M., Evins, P. M., Kirkland, C. L.,Kelsey, D. E., Hand, M., Wingate, M. T. D., Collins, A. S., andBelousova, E.: High-Temperature Granite Magmatism, Crust-Mantle Interaction and the Mesoproterozoic IntracontinentalEvolution of the Musgrave Province, Central Australia, J. Petrol.,52, 931–958, https://doi.org/10.1093/petrology/egr010, 2011.
Sprigg, R. C., Wilson, B., Coats, R. P., Webb, B. P., and O’Driscoll,E. S.: 4 Mile Geological Series Sheet. Alberga G 53-9 Zone 4,1st ed., Geol. Surv. South Aust., Adelaide, Australia, 1959.
Stewart, A. J.: Western extension of the Woodroffe Thrust, Mus-grave Block, central Australia, AGSO J. Aust. Geol. Geophys.,16, 147–153, 1995.
Stewart, A. J.: Record 1997/5: Geology of the Bates 1 : 100 000Sheet Area (4646), Musgrave Block, Western Australia, 1st ed.,Aust. Geol. Surv. Organ., Canberra, Australia, 1997.
Stünitz, H., Thust, A., Heilbronner, R., Behrens, H., Kilian, R.,Tarantola, A., and Fitz Gerald, J. D.: Water redistribution inexperimentally deformed natural milky quartz single crystals –Implications for H2O-weakening processes, J. Geophys. Res.-Sol. Ea., 122, 866–894, https://doi.org/10.1002/2016JB013533,2017.
Sun, S. and Sheraton, J.: Zircon U/Pb chronology, tectono-thermaland crust-forming events in the Tomkinson Ranges, MusgraveBlock, Central Australia, AGSO Res. Newsl., 17, 9–11, 1992.
Sun, S., Sheraton, J. W., Glikson, A. Y., and Stewart, A. J.: A majormagmatic event during 1050–1080 Ma in central Australia, andan emplacement age for the Giles Complex, AGSO Res. Newsl.,24, 13–15, 1996.
Tucker, N. M. T., Hand, M., Kelsey, D. E., and Dutch, R.A.: A duality of timescales: Short-lived ultrahigh tem-perature metamorphism preserving a long-lived mon-azite growth history in the Grenvillian Musgrave–Albany–Fraser Orogen, Precambrian Res., 264, 204–234,https://doi.org/10.1016/j.precamres.2015.04.015, 2015.
Tullis, J. and Yund, R. A.: Hydrolytic weakening ofquartz aggregates: The effects of water and pres-sure on recovery, Geophys. Res. Lett., 16, 1343–1346,https://doi.org/10.1029/GL016i011p01343, 1989.
Walsh, A. K., Kelsey, D. E., Kirklan, C. L., Hand, M.,Smithies, R. H., Clark, C., and Howard, H. M.: P–T–t evo-lution of a large, long-lived, ultrahigh-temperature Grenvil-lian belt in central Australia, Gondwana Res., 28, 531–564,https://doi.org/10.1016/j.gr.2014.05.012, 2015.
Wayte, G. J., Worden, R. H., Rubie, D. C., and Droop, G. T. R.:A TEM study of disequilibrium plagioclase breakdown at highpressure: the role of infiltrating fluid, Contrib. Mineral. Petr., 101,426–437, https://doi.org/10.1007/BF00372216, 1989.
www.solid-earth.net/9/859/2018/ Solid Earth, 9, 859–878, 2018
878 S. Wex et al.: Inverted distribution of ductile deformation across the Woodroffe Thrust
Wells, A. T., Forman, D. J., Ranford, L. C., and Cook, P. J.: Bul-letin 100: Geology of the Amadeus Basin, Central Australia, Bur.Miner. Resour. Geol. Geophys., Canberra, Australia, 1970.
Wex, S., Mancktelow, N., Hawemann, F., Camacho, A., and Pen-nacchioni, G.: Pseudotachylyte formation vs. mylonitization –repeated cycles of seismic fracture and aseismic creep in themiddle crust (Woodroffe Thrust, Central Australia), 13th GeneralAssembly European Geosciences Union, 27 April–2 May 2014,Vienna, Austria, Geophys. Res. Abstr., 16, 5071, 2014.
Wex, S., Mancktelow, N. S., Hawemann, F., Camacho, A., andPennacchioni, G.: Geometry of a large-scale, low-angle, mid-crustal thrust (Woodroffe Thrust, central Australia), Tectonics,36, 2447–2476, https://doi.org/10.1002/2017TC004681, 2017.
Whitney, D. L. and Evans, B. W.: Abbreviations for namesof rock-forming minerals, Am. Mineral., 95, 185–187,https://doi.org/10.2138/am.2010.3371, 2010.
Young, D. N., Duncan, N., Camacho, A., Ferenczi, P. A., and Madi-gan, T. L. A.: 1 : 250 000 Geological Map Series and ExplanatoryNotes. Ayers Rock SG 52-8, 2nd ed., North. Territ. Geol. Surv.,Darwin, Australia, 2002.
Zhao, J. and McCulloch, M. T.: Sm-Nd mineral isochron agesof Late Proterozoic dyke swarms in Australia: evidence fortwo distinctive events of mafic magmatism and crustal exten-sion, Chem. Geol., 109, 341–354, https://doi.org/10.1016/0009-2541(93)90079-X, 1993.
Zhao, J., McCulloch, M. T., and Korsch, R. J.: Characterisationof a plume-related ∼ 800 Ma magmatic event and its implica-tions for basin formation in central-southern Australia, EarthPlanet. Sc. Lett., 121, 349–367, https://doi.org/10.1016/0012-821X(94)90077-9, 1994.
Solid Earth, 9, 859–878, 2018 www.solid-earth.net/9/859/2018/