inverter operating characteristics optimization for dc ...€¦ · inverter operating...
TRANSCRIPT
University of Birmingham
Inverter operating characteristics optimization forDC traction power supply systemsZhang, Gang; Tian, Zhongbei; Tricoli, Pietro; Hillmansen, Stuart; Wang, Yong; Liu, Zhigang
DOI:10.1109/TVT.2019.2899165
License:None: All rights reserved
Document VersionPeer reviewed version
Citation for published version (Harvard):Zhang, G, Tian, Z, Tricoli, P, Hillmansen, S, Wang, Y & Liu, Z 2019, 'Inverter operating characteristicsoptimization for DC traction power supply systems', IEEE Transactions on Vehicular Technology, vol. 68, no. 4,8641314, pp. 3400-3410. https://doi.org/10.1109/TVT.2019.2899165
Link to publication on Research at Birmingham portal
Publisher Rights Statement:Checked for eligibility: 22/03/2019
© 2019 IEEE. Personal use of this material is permitted. Permission from IEEE must be obtained for all other uses, in any current or futuremedia, including reprinting/republishing this material for advertising or promotional purposes, creating new collective works, for resale orredistribution to servers or lists, or reuse of any copyrighted component of this work in other works.
G. Zhang, Z. Tian, P. Tricoli, S. Hillmansen, Y. Wang and Z. Liu, "Inverter Operating Characteristics Optimization for DC Traction PowerSupply Systems," in IEEE Transactions on Vehicular Technology.doi: 10.1109/TVT.2019.2899165
General rightsUnless a licence is specified above, all rights (including copyright and moral rights) in this document are retained by the authors and/or thecopyright holders. The express permission of the copyright holder must be obtained for any use of this material other than for purposespermitted by law.
•Users may freely distribute the URL that is used to identify this publication.•Users may download and/or print one copy of the publication from the University of Birmingham research portal for the purpose of privatestudy or non-commercial research.•User may use extracts from the document in line with the concept of ‘fair dealing’ under the Copyright, Designs and Patents Act 1988 (?)•Users may not further distribute the material nor use it for the purposes of commercial gain.
Where a licence is displayed above, please note the terms and conditions of the licence govern your use of this document.
When citing, please reference the published version.
Take down policyWhile the University of Birmingham exercises care and attention in making items available there are rare occasions when an item has beenuploaded in error or has been deemed to be commercially or otherwise sensitive.
If you believe that this is the case for this document, please contact [email protected] providing details and we will remove access tothe work immediately and investigate.
Download date: 22. May. 2020
IEEE Transactions on Vehicular Technology 1
Abstract—Compared with energy storage equipment based on
supercapacitors, flywheels or lithium batteries, inverters have
obvious advantages in installation space, cost, reliability and
service lifetime. For this reason, regenerative inverters are
increasingly installed in the substations of urban rail transit
systems. They have controllable operating characteristics, but
their impact on the energy saving and railway operation cost has
not been fully studied. In this paper, based on the typical
application scheme of regenerative inverters, the operating
characteristics of the inverter including power limitation, start
working voltage, virtual internal resistance are introduced at first.
A simplified power system model containing regenerative
inverters and trains has been built. The impact of operating
characteristics on the amount of regenerative braking energy and
its distribution is analyzed. The inverter operating characteristics
are optimized by a cost function considering total energy
consumption, brake shoes wear and inverter expense. A case
study based on a multi-train scenario is presented to validate the
cost-saving performance. The work is expected to provide some
guides for the design and optimization of the traction power
supply system with inverting substations.
Index Terms—energy consumption, optimization, traction
power supply systems, inverter, railway simulation, cost function
I. INTRODUCTION
he reduction of energy consumption has become essential
due to climate changes taking place as a result of enormous
green gas emission. Urban rail transit system is becoming an
increasingly popular choice to satisfy transportation demands
all over the world because of its relatively low ratio between
energy consumption and transport capacity [1].
All modern trains have regenerative braking capability,
converting the kinetic energy into electricity. The regenerative
braking is widely used because of two major reasons. One
reason is that the regenerative braking is eco-friendly. In
contrast to friction braking, regenerative braking does not
generate wear and tear, dust, smell, heat and sound. The other
This research was supported by the Fundamental Research Funds for the
Central Universities (2018JBZ004). (corresponding author: Zhongbei Tian) G. Zhang is with School of Electrical Engineering, Beijing Jiaotong
University, Beijing 100044, China (e-mail: [email protected]).
Z. Tian, P. Tricoli and S. Hillmansen are with Department of Electronic, Electrical and Systems Engineering, University of Birmingham, Birmingham
B152TT, UK (e-mail: [email protected], [email protected],
[email protected]). Y. Wang is with Institute of standards and metrology, China academy of
railway sciences group co., LTD, Beijing 100081, China
(e-mail:[email protected]). Z. Liu is with Beijing Electrical Engineering Technology Research Center,
Beijing 100044, China (e-mail: [email protected]).
reason, the most important one, is attributed to its huge
potential in energy saving. The recovered energy will firstly be
used to supply the auxiliary load on the train itself, and the
surplus energy will then be provided to the other accelerating
trains on the same DC network. Theoretically, the regenerative
braking power could be completely reused if there are always
accelerating trains nearby requiring higher power at the same
time. However, this is impossible in practice. The DC network
is not always receptive. To avoid the DC overvoltage due to too
much regenerative braking energy, the surplus energy is usually
dissipated by the on-board resistors, causing energy waste and
tunnel temperature rise [2].
In order to maximize the utilization of regenerative braking
energy and reduce the energy consumption, the thyristor-based
inverters were introduced to feed the recovered braking energy
back to medium voltage distribution grid (MVDG) for reuse
[3-5]. However, this kind of inverter is not widely applied in the
DC railway due to its poor power quality and bad
cost-performance. The installation of energy storage devices
(such as super-capacitor, lithium battery or flywheel) at
substations or tracksides could be a good alternative to absorb
the surplus regenerated energy and regulate DC voltage [6-12].
However, compared with inverters, some drawbacks of energy
storage system are bigger installation space, higher cost, shorter
service life and more safety constraints [13].
In recent years, with the technology development of power
semiconductor IGBT and converter control, the cost-effective
IGBT inverters have been increasingly employed in DC
traction power supply system [14-19]. Traction substations
with inverters are called inverting substations or reversible
substations. Up to now, the regenerative inverters have been
used in more than 20 metro lines in China. The energy saving of
inverters installed in Beijing Metro line 10 of China achieves as
high as 11.15% of daily use [20]. Regarding low-order current
harmonic generated by the diode rectifier, the inverter is
proposed to work as an active power filter in some literature
[21-24] , so as to improve the utilization ratio of the inverter. To
solve the low power factor problem in the light load period,
which is caused by the large amount of stray capacitance of the
medium voltage ring cables, the traditional schemes based on
Static Var Generator (SVG) are usually adopted [25, 26]. In
fact, the SVG can be reduced or cancelled when regenerative
inverters are installed in the substations, which have been
verified in Zhengzhou metro line 2 and Chengdu metro line 7 in
China. In this case, the payback period of the regenerative
inverters will be shortened significantly.
Inverter Operating Characteristics Optimization
for DC Traction Power Supply Systems
Gang Zhang, Zhongbei Tian, Pietro Tricoli, Stuart Hillmansen, Yong Wang and Zhigang Liu
T
IEEE Transactions on Vehicular Technology 2
Although inverters have been used in traction power supply
system (TPSS) for several years, few literature discusses the
optimization of the operating characteristics for regenerative
inverters. The most commonly used operating characteristics of
the inverter used in railway substation is constant voltage
control [27-29]. It is easy to implement and beneficial for the
stabilization of DC network voltage. However, the serious
unbalanced distribution of regenerative braking energy
between substations will happen, which is not good for the
reuse of the energy in the medium voltage grid. Two possible
inverter control schemes: the constant advance angle control
and the constant voltage control were illustrated in [3, 4], but
the impact of operating characteristics on the energy saving and
energy distribution were not studied. In addition, the capacity
configuration of inverters in TPSS usually depends on system
simulation [27, 28], but in most existing simulation systems, an
inverter is simply modeled as an ideal voltage source or a
voltage source with internal resistance. The power limitation of
the inverter is not considered in the inverter model. It will bring
obvious error in the simulation results, which cannot be
neglected.
This paper proposes a modeling method considering the
different operating characteristics of inverters including power
limitation, start working voltage, virtual internal resistance. An
approach to optimize operating characteristics of inverters for
cost saving is illustrated. This paper is organized as follows.
The section II introduces application scheme and operating
characteristics of inverters. In section III, impact of inverter
operating characteristics on the energy-saving and regenerative
braking energy distribution is analyzed based on a simplified
system model, then an optimization strategy is proposed. In
section IV, optimization of inverter operating characteristics
considering multi-trains scenario is carried out by a case study.
The conclusions are presented in section V.
II. OPERATING CHARACTERISTICS MODELING
A. Application scheme of inverters
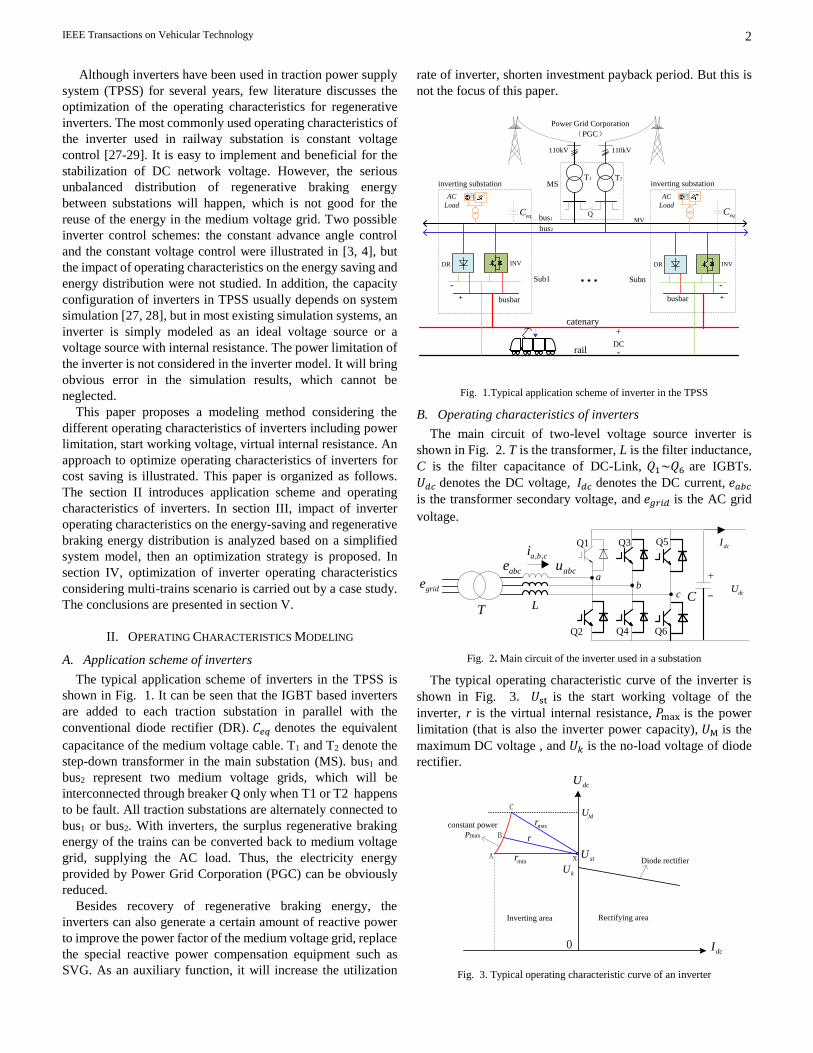
The typical application scheme of inverters in the TPSS is
shown in Fig. 1. It can be seen that the IGBT based inverters
are added to each traction substation in parallel with the
conventional diode rectifier (DR). 𝐶𝑒𝑞 denotes the equivalent
capacitance of the medium voltage cable. T1 and T2 denote the
step-down transformer in the main substation (MS). bus1 and
bus2 represent two medium voltage grids, which will be
interconnected through breaker Q only when T1 or T2 happens
to be fault. All traction substations are alternately connected to
bus1 or bus2. With inverters, the surplus regenerative braking
energy of the trains can be converted back to medium voltage
grid, supplying the AC load. Thus, the electricity energy
provided by Power Grid Corporation (PGC) can be obviously
reduced.
Besides recovery of regenerative braking energy, the
inverters can also generate a certain amount of reactive power
to improve the power factor of the medium voltage grid, replace
the special reactive power compensation equipment such as
SVG. As an auxiliary function, it will increase the utilization
rate of inverter, shorten investment payback period. But this is
not the focus of this paper.
Sub1
MV
+
-
DCrail
catenary+
-
Subn
AC
Load
busbar
AC
Load
110kV
T1 T2
Q
Power Grid Corporation
(PGC)
110kV
MS
bus1
bus2
DR INV DR INV
busbar +
-
eqCeqC
inverting substation inverting substation
Fig. 1.Typical application scheme of inverter in the TPSS
B. Operating characteristics of inverters
The main circuit of two-level voltage source inverter is
shown in Fig. 2. T is the transformer, L is the filter inductance,
C is the filter capacitance of DC-Link, 𝑄1~𝑄6 are IGBTs.
𝑈𝑑𝑐 denotes the DC voltage, 𝐼𝑑𝑐 denotes the DC current, 𝑒𝑎𝑏𝑐 is the transformer secondary voltage, and 𝑒𝑔𝑟𝑖𝑑 is the AC grid
voltage.
Fig. 2. Main circuit of the inverter used in a substation
The typical operating characteristic curve of the inverter is
shown in Fig. 3. 𝑈st is the start working voltage of the
inverter, r is the virtual internal resistance, 𝑃max is the power
limitation (that is also the inverter power capacity), 𝑈M is the
maximum DC voltage , and 𝑈𝑘 is the no-load voltage of diode
rectifier.
dcI
dcU
0
kU
Aminr
MUC
Inverting area Rectifying area
Diode rectifier
constant power
Pmax
stU
r
maxr
B
x
Fig. 3. Typical operating characteristic curve of an inverter
L
, ,a b ci
_ dcU
abce
Q1 Q3 Q5
Q2 Q4 Q6
ab
c
abcu
gride
dcI
TC
IEEE Transactions on Vehicular Technology 3
1) Linear inverting region
When inverter DC voltage is higher than 𝑈st, the inverter
will operate in the linear inverting region. The VI characteristic
curve can be expressed as:
𝑈dc = 𝑈st − 𝑟 × 𝐼𝑑𝑐 (1)
where
𝑈st ≤ 𝑈dc ≤ 𝑈𝑀 𝑟𝑚𝑖𝑛 ≤ r ≤ 𝑟𝑚𝑎𝑥 𝑈dc × 𝐼𝑑𝑐 ≤ 𝑃𝑚𝑎𝑥 𝐼𝑑𝑐 ≤ 0
(2)
The DC voltage keeps constant in the line XA, where the
virtual internal resistance has a minimum value 𝑟𝑚𝑖𝑛 = 0. The
maximum virtual internal resistance of the inverter in the line
XC can be written as:
𝑟𝑚𝑎𝑥 =∆𝑈
∆𝐼=𝑈𝑀 − 𝑈𝑠𝑡𝑃𝑚𝑎𝑥/𝑈𝑀
(3)
2) Constant power region
When transferred power reaches the maximum value, the
inverter operates on the constant power curve (ABC), which
can be expressed as:
𝑃𝑑𝑐 = 𝑈𝑑𝑐 × 𝐼𝑑𝑐 = 𝑃𝑚𝑎𝑥 (4)
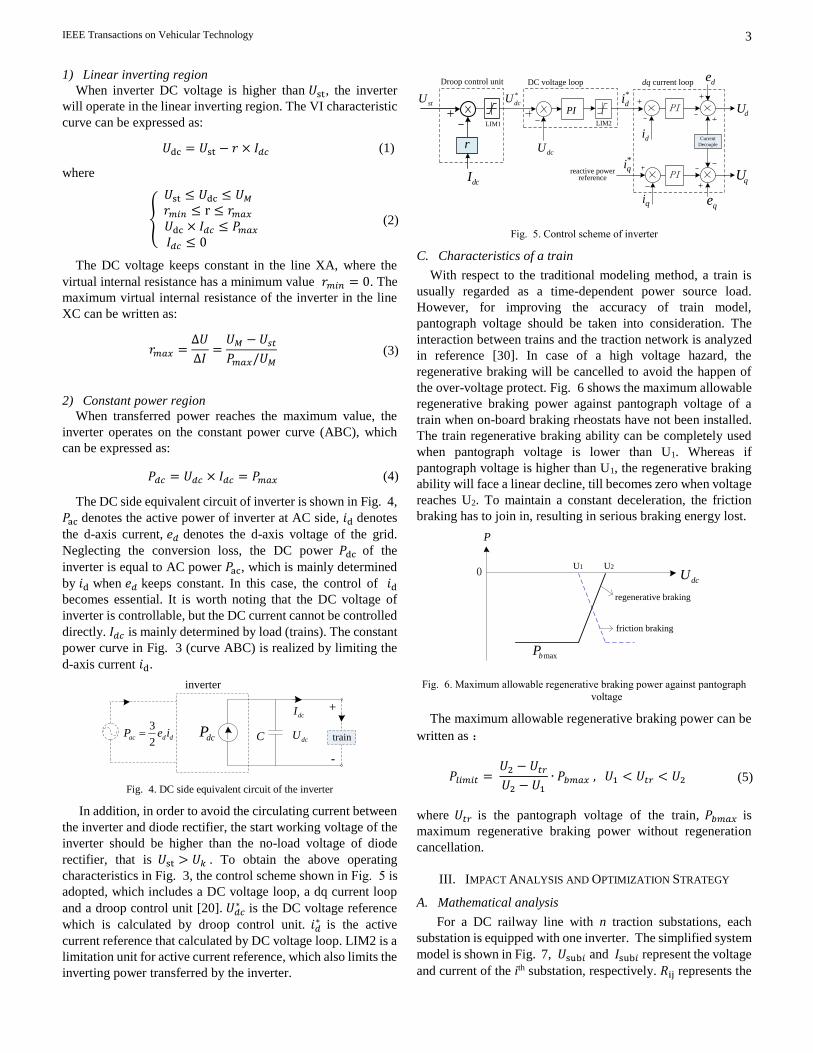
The DC side equivalent circuit of inverter is shown in Fig. 4,
𝑃ac denotes the active power of inverter at AC side, 𝑖d denotes
the d-axis current, 𝑒𝑑 denotes the d-axis voltage of the grid.
Neglecting the conversion loss, the DC power 𝑃dc of the
inverter is equal to AC power 𝑃ac, which is mainly determined
by 𝑖d when 𝑒𝑑 keeps constant. In this case, the control of 𝑖d
becomes essential. It is worth noting that the DC voltage of
inverter is controllable, but the DC current cannot be controlled
directly. 𝐼𝑑𝑐 is mainly determined by load (trains). The constant
power curve in Fig. 3 (curve ABC) is realized by limiting the
d-axis current 𝑖d.
C
+
-
dcU
dcI
3
2ac d dP e i
inverter
traindcP
Fig. 4. DC side equivalent circuit of the inverter
In addition, in order to avoid the circulating current between
the inverter and diode rectifier, the start working voltage of the
inverter should be higher than the no-load voltage of diode
rectifier, that is 𝑈st > 𝑈𝑘 . To obtain the above operating
characteristics in Fig. 3, the control scheme shown in Fig. 5 is
adopted, which includes a DC voltage loop, a dq current loop
and a droop control unit [20]. 𝑈𝑑𝑐∗ is the DC voltage reference
which is calculated by droop control unit. 𝑖𝑑∗ is the active
current reference that calculated by DC voltage loop. LIM2 is a
limitation unit for active current reference, which also limits the
inverting power transferred by the inverter.
Fig. 5. Control scheme of inverter
C. Characteristics of a train
With respect to the traditional modeling method, a train is
usually regarded as a time-dependent power source load.
However, for improving the accuracy of train model,
pantograph voltage should be taken into consideration. The
interaction between trains and the traction network is analyzed
in reference [30]. In case of a high voltage hazard, the
regenerative braking will be cancelled to avoid the happen of
the over-voltage protect. Fig. 6 shows the maximum allowable
regenerative braking power against pantograph voltage of a
train when on-board braking rheostats have not been installed.
The train regenerative braking ability can be completely used
when pantograph voltage is lower than U1. Whereas if
pantograph voltage is higher than U1, the regenerative braking
ability will face a linear decline, till becomes zero when voltage
reaches U2. To maintain a constant deceleration, the friction
braking has to join in, resulting in serious braking energy lost.
0U1 U2
P
maxbP
dcU
regenerative braking
friction braking
Fig. 6. Maximum allowable regenerative braking power against pantograph
voltage
The maximum allowable regenerative braking power can be
written as :
𝑃𝑙𝑖𝑚𝑖𝑡 = 𝑈2 − 𝑈𝑡𝑟𝑈2 − 𝑈1
∙ 𝑃𝑏𝑚𝑎𝑥 , 𝑈1 < 𝑈𝑡𝑟 < 𝑈2 (5)
where 𝑈𝑡𝑟 is the pantograph voltage of the train, 𝑃𝑏𝑚𝑎𝑥 is
maximum regenerative braking power without regeneration
cancellation.
III. IMPACT ANALYSIS AND OPTIMIZATION STRATEGY
A. Mathematical analysis
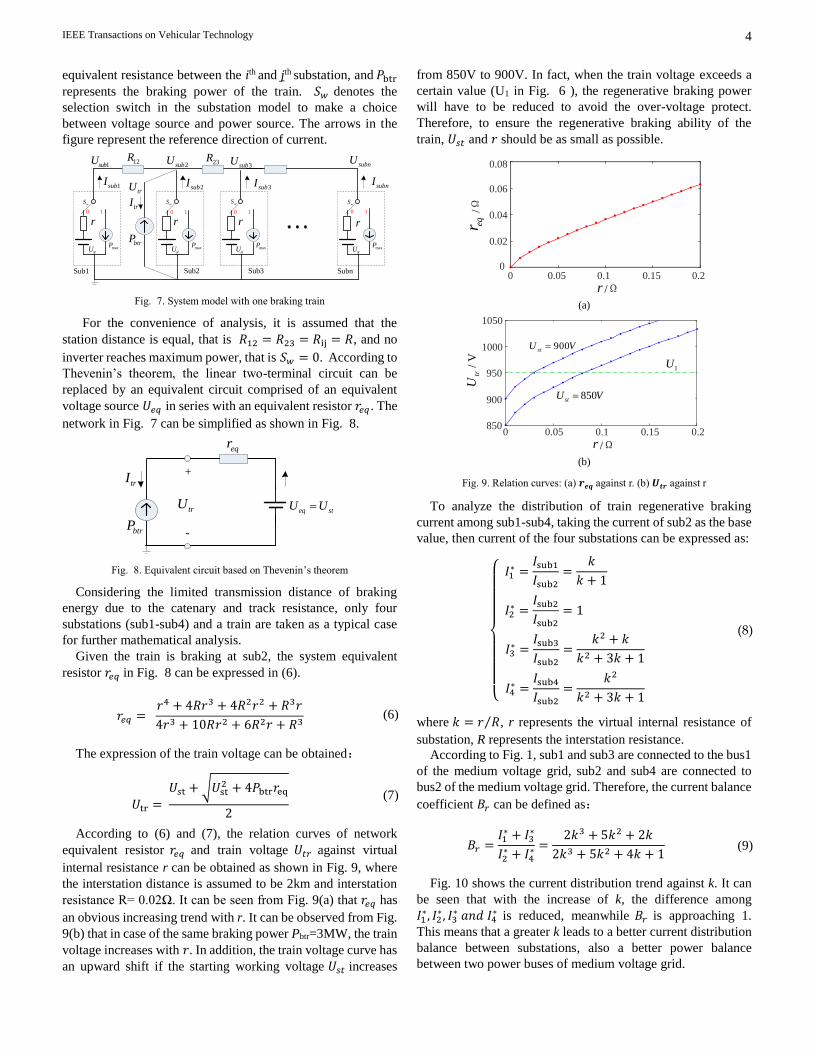
For a DC railway line with n traction substations, each
substation is equipped with one inverter. The simplified system
model is shown in Fig. 7, 𝑈sub𝑖 and 𝐼sub𝑖 represent the voltage
and current of the ith substation, respectively. 𝑅ij represents the
PI
PI
*
di
di
dU
qU
de
qe
*
dcU
dcU
PI
LIM2
DC voltage loop
reactive powerreference
qi
*qi
Current
Decouple
dq current loop
stU
dcI
r
LIM1
Droop control unit
IEEE Transactions on Vehicular Technology 4
equivalent resistance between the ith and jth substation, and 𝑃btr represents the braking power of the train. 𝑆𝑤 denotes the
selection switch in the substation model to make a choice
between voltage source and power source. The arrows in the
figure represent the reference direction of current.
stU maxP
Sub2
stU maxP
Sub1
stU maxP
Sub3
stU maxP
Subn
1subU
1subI
btrP
12R23R
2subU
2subI
3subU
3subI
subnU
subnI
trItrU
wS wS wSwS
r r r r
0 1 0 1 0 1 0 1
Fig. 7. System model with one braking train
For the convenience of analysis, it is assumed that the
station distance is equal, that is 𝑅12 = 𝑅23 = 𝑅ij = 𝑅, and no
inverter reaches maximum power, that is 𝑆𝑤 = 0. According to
Thevenin’s theorem, the linear two-terminal circuit can be
replaced by an equivalent circuit comprised of an equivalent
voltage source 𝑈𝑒𝑞 in series with an equivalent resistor 𝑟𝑒𝑞 . The
network in Fig. 7 can be simplified as shown in Fig. 8.
btrP
eqr
trI
trUeq stU U
+
-
Fig. 8. Equivalent circuit based on Thevenin’s theorem
Considering the limited transmission distance of braking
energy due to the catenary and track resistance, only four
substations (sub1-sub4) and a train are taken as a typical case
for further mathematical analysis.
Given the train is braking at sub2, the system equivalent
resistor 𝑟𝑒𝑞 in Fig. 8 can be expressed in (6).
𝑟𝑒𝑞 = 𝑟4 + 4𝑅𝑟3 + 4𝑅2𝑟2 + 𝑅3𝑟
4𝑟3 + 10𝑅𝑟2 + 6𝑅2𝑟 + 𝑅3 (6)
The expression of the train voltage can be obtained:
𝑈tr =
𝑈𝑠t + √𝑈st2 + 4𝑃btr𝑟eq
2
(7)
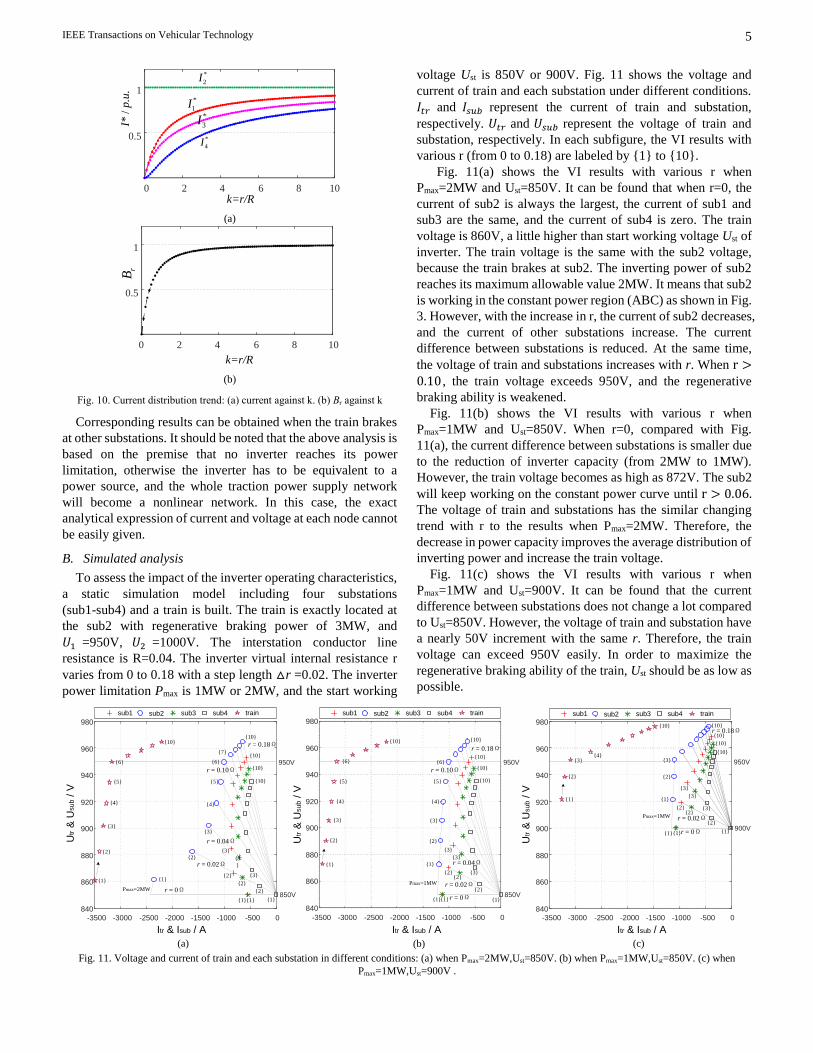
According to (6) and (7), the relation curves of network
equivalent resistor 𝑟𝑒𝑞 and train voltage 𝑈𝑡𝑟 against virtual
internal resistance r can be obtained as shown in Fig. 9, where
the interstation distance is assumed to be 2km and interstation
resistance R= 0.02Ω. It can be seen from Fig. 9(a) that 𝑟𝑒𝑞 has
an obvious increasing trend with r. It can be observed from Fig.
9(b) that in case of the same braking power Pbtr=3MW, the train
voltage increases with 𝑟. In addition, the train voltage curve has
an upward shift if the starting working voltage 𝑈𝑠𝑡 increases
from 850V to 900V. In fact, when the train voltage exceeds a
certain value (U1 in Fig. 6 ), the regenerative braking power
will have to be reduced to avoid the over-voltage protect.
Therefore, to ensure the regenerative braking ability of the
train, 𝑈𝑠𝑡 and 𝑟 should be as small as possible.
(a)
(b)
Fig. 9. Relation curves: (a) 𝒓𝒆𝒒 against r. (b) 𝑼𝒕𝒓 against r
To analyze the distribution of train regenerative braking
current among sub1-sub4, taking the current of sub2 as the base
value, then current of the four substations can be expressed as:
𝐼1∗ =
𝐼sub1𝐼sub2
=𝑘
𝑘 + 1
𝐼2∗ =
𝐼sub2𝐼sub2
= 1
𝐼3∗ =
𝐼sub3𝐼sub2
=𝑘2 + 𝑘
𝑘2 + 3𝑘 + 1
𝐼4∗ =
𝐼sub4𝐼sub2
=𝑘2
𝑘2 + 3𝑘 + 1
(8)
where 𝑘 = 𝑟 𝑅⁄ , r represents the virtual internal resistance of
substation, R represents the interstation resistance.
According to Fig. 1, sub1 and sub3 are connected to the bus1
of the medium voltage grid, sub2 and sub4 are connected to
bus2 of the medium voltage grid. Therefore, the current balance
coefficient 𝐵𝑟 can be defined as:
𝐵𝑟 =𝐼1∗ + 𝐼3
∗
𝐼2∗ + 𝐼4
∗ =2𝑘3 + 5𝑘2 + 2𝑘
2𝑘3 + 5𝑘2 + 4𝑘 + 1 (9)
Fig. 10 shows the current distribution trend against k. It can
be seen that with the increase of k, the difference among
𝐼1∗, 𝐼2
∗, 𝐼3∗ 𝑎𝑛𝑑 𝐼4
∗ is reduced, meanwhile 𝐵𝑟 is approaching 1.
This means that a greater k leads to a better current distribution
balance between substations, also a better power balance
between two power buses of medium voltage grid.
0 0.05 0.1 0.15 0.2
0.02
0.04
0.06
0.08
r
eqr
0
/Ω
/Ω
0 0.05 0.1 0.15 0.2850
900
950
1000
1050
trU
r
850stU V
900stU V
1U/ V
/Ω
IEEE Transactions on Vehicular Technology 5
0 2 4 6 8 10
0.5
1*
1I
*
4I
*
3I
*
2I
k=r/R
I* /
p.u
.
(a)
0 2 4 6 8 10
0.5
1
rB
k=r/R
(b)
Fig. 10. Current distribution trend: (a) current against k. (b) Br against k
Corresponding results can be obtained when the train brakes
at other substations. It should be noted that the above analysis is
based on the premise that no inverter reaches its power
limitation, otherwise the inverter has to be equivalent to a
power source, and the whole traction power supply network
will become a nonlinear network. In this case, the exact
analytical expression of current and voltage at each node cannot
be easily given.
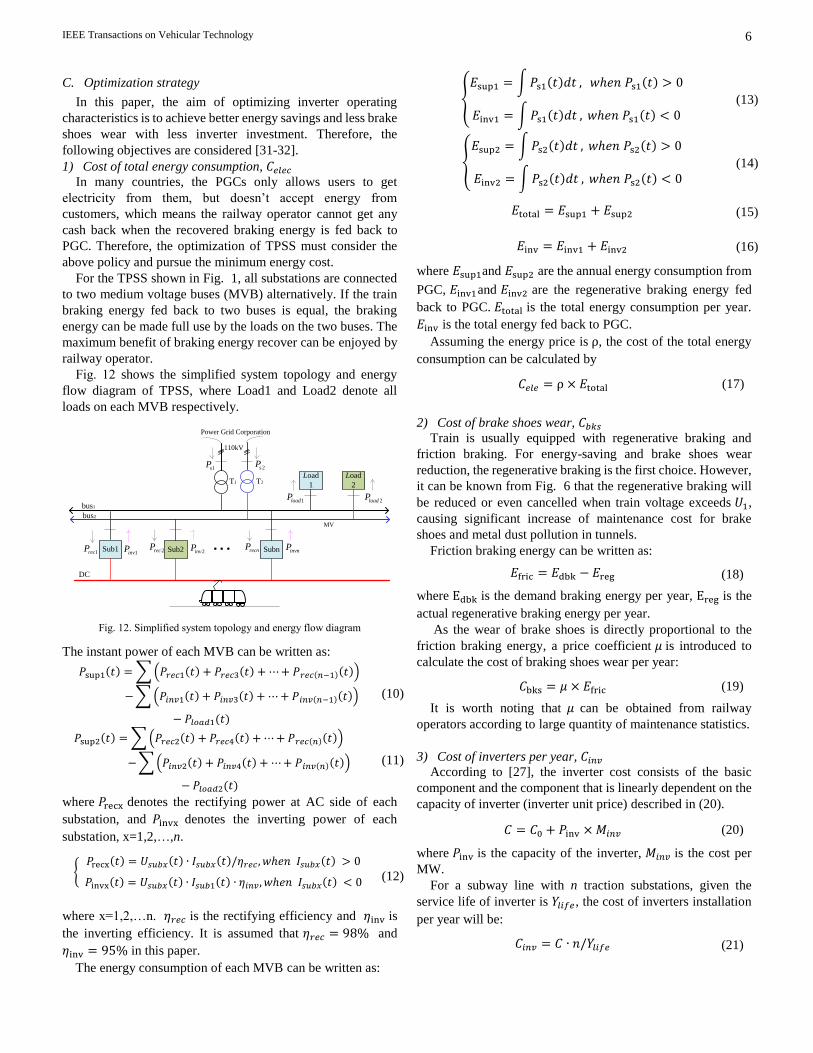
B. Simulated analysis
To assess the impact of the inverter operating characteristics,
a static simulation model including four substations
(sub1-sub4) and a train is built. The train is exactly located at
the sub2 with regenerative braking power of 3MW, and
𝑈1 =950V, 𝑈2 =1000V. The interstation conductor line
resistance is R=0.04. The inverter virtual internal resistance r
varies from 0 to 0.18 with a step length r =0.02. The inverter
power limitation Pmax is 1MW or 2MW, and the start working
voltage Ust is 850V or 900V. Fig. 11 shows the voltage and
current of train and each substation under different conditions.
𝐼𝑡𝑟 and 𝐼𝑠𝑢𝑏 represent the current of train and substation,
respectively. 𝑈𝑡𝑟 and 𝑈𝑠𝑢𝑏 represent the voltage of train and
substation, respectively. In each subfigure, the VI results with
various r (from 0 to 0.18) are labeled by 1 to 10.
Fig. 11(a) shows the VI results with various r when
Pmax=2MW and Ust=850V. It can be found that when r=0, the
current of sub2 is always the largest, the current of sub1 and
sub3 are the same, and the current of sub4 is zero. The train
voltage is 860V, a little higher than start working voltage Ust of
inverter. The train voltage is the same with the sub2 voltage,
because the train brakes at sub2. The inverting power of sub2
reaches its maximum allowable value 2MW. It means that sub2
is working in the constant power region (ABC) as shown in Fig.
3. However, with the increase in r, the current of sub2 decreases,
and the current of other substations increase. The current
difference between substations is reduced. At the same time,
the voltage of train and substations increases with r. When r >0.10 , the train voltage exceeds 950V, and the regenerative
braking ability is weakened.
Fig. 11(b) shows the VI results with various r when
Pmax=1MW and Ust=850V. When r=0, compared with Fig.
11(a), the current difference between substations is smaller due
to the reduction of inverter capacity (from 2MW to 1MW).
However, the train voltage becomes as high as 872V. The sub2
will keep working on the constant power curve until r > 0.06. The voltage of train and substations has the similar changing
trend with r to the results when Pmax=2MW. Therefore, the
decrease in power capacity improves the average distribution of
inverting power and increase the train voltage.
Fig. 11(c) shows the VI results with various r when
Pmax=1MW and Ust=900V. It can be found that the current
difference between substations does not change a lot compared
to Ust=850V. However, the voltage of train and substation have
a nearly 50V increment with the same r. Therefore, the train
voltage can exceed 950V easily. In order to maximize the
regenerative braking ability of the train, Ust should be as low as
possible.
Fig. 11. Voltage and current of train and each substation in different conditions: (a) when Pmax=2MW,Ust=850V. (b) when Pmax=1MW,Ust=850V. (c) when
Pmax=1MW,Ust=900V .
Itr & Isub / A
-3500 -3000 -2500 -2000 -1500 -1000 -500 0
840
860
880
900
920
940
960
980
-3500 -3000 -2500 -2000 -1500 -1000 -500 0
840
860
880
900
920
940
960
980
-3500 -3000 -2500 -2000 -1500 -1000 -500 0840
860
880
900
920
940
960
980
Utr &
Usu
b / V
Utr &
Usu
b / V
Itr & Isub / A
Utr &
Usu
b / V
Itr & Isub / A
sub1 sub2 sub3 sub4 train sub1 sub2 sub3 sub4 train sub1 sub2 sub3 sub4 train
850Vr = 0Ω
r = 0.02Ω
r = 0.04Ω
r = 0.18Ω
950V
850V
950V
r = 0Ω
r = 0.02Ω
r = 0.18Ω
900V
1
2
3
10
6
1
2
3
4
10
1 1
10
10
10
2
3
2
3
1
2
10
1
2
3
10
10
10
10
r = 0.04Ω
1
2
3
10
1
2
3
10
10
10
10
1
22
1
2
1
3
3
3
r = 0Ω
r = 0.02Ω
r = 0.18Ω
11 1
22
2
3
3
3
2
3
950V
(a) (b) (c)
5
6
7
4
5
3
4
5
4
r = 0.10Ω
Pmax=1MWPmax=2MW
6
r = 0.10Ω
6
4
5
1
Pmax=1MW
IEEE Transactions on Vehicular Technology 6
C. Optimization strategy
In this paper, the aim of optimizing inverter operating
characteristics is to achieve better energy savings and less brake
shoes wear with less inverter investment. Therefore, the
following objectives are considered [31-32].
1) Cost of total energy consumption, 𝐶𝑒𝑙𝑒𝑐
In many countries, the PGCs only allows users to get
electricity from them, but doesn’t accept energy from
customers, which means the railway operator cannot get any
cash back when the recovered braking energy is fed back to
PGC. Therefore, the optimization of TPSS must consider the
above policy and pursue the minimum energy cost.
For the TPSS shown in Fig. 1, all substations are connected
to two medium voltage buses (MVB) alternatively. If the train
braking energy fed back to two buses is equal, the braking
energy can be made full use by the loads on the two buses. The
maximum benefit of braking energy recover can be enjoyed by
railway operator.
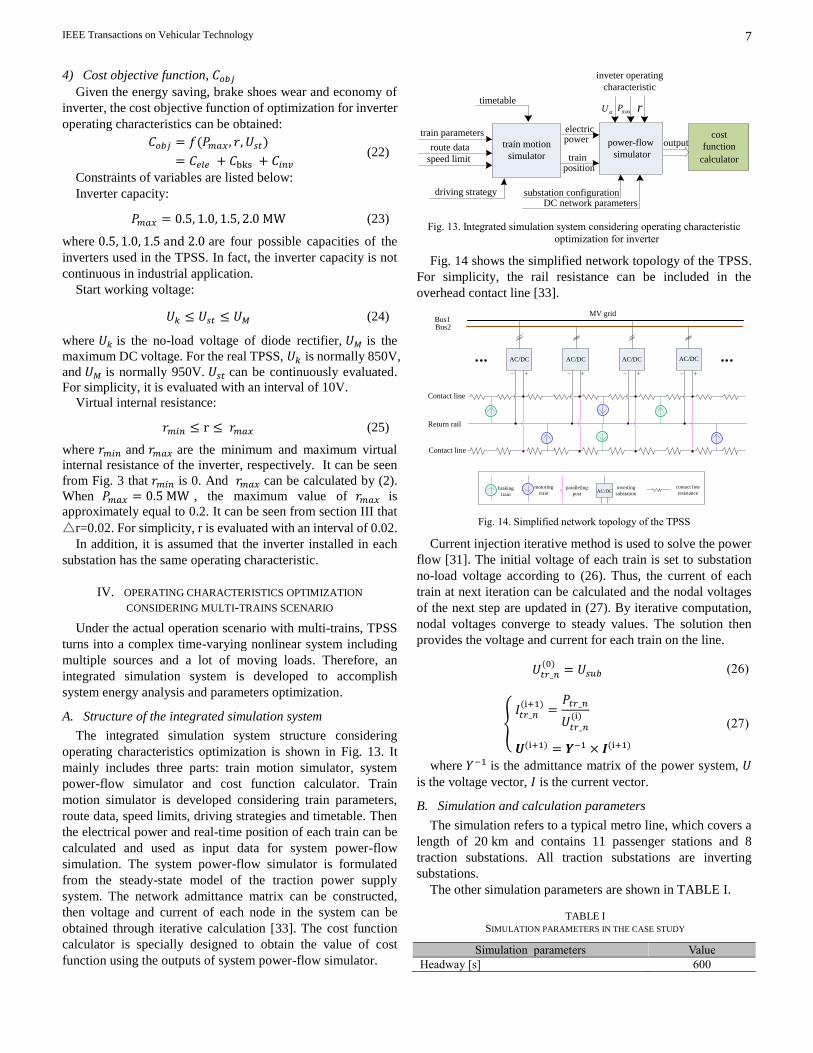
Fig. 12 shows the simplified system topology and energy
flow diagram of TPSS, where Load1 and Load2 denote all
loads on each MVB respectively.
MV
Sub1
bus2
bus1
Sub2 Subn
110kV
T1 T2
Load
1
Load
2
1invP1recP 2invP2recPinvnPrecnP
1loadP 2loadP
s1P s2P
DC
Power Grid Corporation
Fig. 12. Simplified system topology and energy flow diagram
The instant power of each MVB can be written as:
𝑃sup1(𝑡) =∑(𝑃𝑟𝑒𝑐1(𝑡) + 𝑃𝑟𝑒𝑐3(𝑡) + ⋯+ 𝑃𝑟𝑒𝑐(𝑛−1)(𝑡))
−∑(𝑃𝑖𝑛𝑣1(𝑡) + 𝑃𝑖𝑛𝑣3(𝑡) + ⋯+ 𝑃𝑖𝑛𝑣(𝑛−1)(𝑡))
− 𝑃𝑙𝑜𝑎𝑑1(𝑡)
(10)
𝑃sup2(𝑡) =∑(𝑃𝑟𝑒𝑐2(𝑡) + 𝑃𝑟𝑒𝑐4(𝑡) + ⋯+ 𝑃𝑟𝑒𝑐(𝑛)(𝑡))
−∑(𝑃𝑖𝑛𝑣2(𝑡) + 𝑃𝑖𝑛𝑣4(𝑡) + ⋯+ 𝑃𝑖𝑛𝑣(𝑛)(𝑡))
− 𝑃𝑙𝑜𝑎𝑑2(𝑡)
(11)
where 𝑃recx denotes the rectifying power at AC side of each
substation, and 𝑃invx denotes the inverting power of each
substation, x=1,2,…,n.
𝑃recx(𝑡) = 𝑈𝑠𝑢𝑏𝑥(𝑡) ∙ 𝐼𝑠𝑢𝑏𝑥(𝑡)/𝜂𝑟𝑒𝑐 , 𝑤ℎ𝑒𝑛 𝐼𝑠𝑢𝑏𝑥(𝑡) > 0
𝑃invx(𝑡) = 𝑈𝑠𝑢𝑏𝑥(𝑡) ∙ 𝐼𝑠𝑢𝑏1(𝑡) ∙ 𝜂𝑖𝑛𝑣, 𝑤ℎ𝑒𝑛 𝐼𝑠𝑢𝑏𝑥(𝑡) < 0 (12)
where x=1,2,…n. 𝜂𝑟𝑒𝑐 is the rectifying efficiency and 𝜂inv is
the inverting efficiency. It is assumed that 𝜂𝑟𝑒𝑐 = 98% and
𝜂inv = 95% in this paper.
The energy consumption of each MVB can be written as:
𝐸sup1 = ∫𝑃s1(𝑡)𝑑𝑡 , 𝑤ℎ𝑒𝑛 𝑃s1(𝑡) > 0
𝐸inv1 = ∫𝑃s1(𝑡)𝑑𝑡 , 𝑤ℎ𝑒𝑛 𝑃s1(𝑡) < 0 (13)
𝐸sup2 = ∫𝑃s2(𝑡)𝑑𝑡 , 𝑤ℎ𝑒𝑛 𝑃s2(𝑡) > 0
𝐸inv2 = ∫𝑃s2(𝑡)𝑑𝑡 , 𝑤ℎ𝑒𝑛 𝑃s2(𝑡) < 0 (14)
𝐸total = 𝐸sup1 + 𝐸sup2 (15)
𝐸inv = 𝐸inv1 + 𝐸inv2 (16)
where 𝐸sup1and 𝐸sup2 are the annual energy consumption from
PGC, 𝐸inv1and 𝐸inv2 are the regenerative braking energy fed
back to PGC. 𝐸total is the total energy consumption per year.
𝐸inv is the total energy fed back to PGC.
Assuming the energy price is ρ, the cost of the total energy
consumption can be calculated by
𝐶𝑒𝑙𝑒 = ρ × 𝐸total (17)
2) Cost of brake shoes wear, 𝐶𝑏𝑘𝑠 Train is usually equipped with regenerative braking and
friction braking. For energy-saving and brake shoes wear
reduction, the regenerative braking is the first choice. However,
it can be known from Fig. 6 that the regenerative braking will
be reduced or even cancelled when train voltage exceeds 𝑈1,
causing significant increase of maintenance cost for brake
shoes and metal dust pollution in tunnels.
Friction braking energy can be written as:
𝐸fric = 𝐸dbk − 𝐸reg (18)
where Edbk is the demand braking energy per year, Ereg is the
actual regenerative braking energy per year.
As the wear of brake shoes is directly proportional to the
friction braking energy, a price coefficient 𝜇 is introduced to
calculate the cost of braking shoes wear per year:
𝐶bks = 𝜇 × 𝐸fric (19)
It is worth noting that 𝜇 can be obtained from railway
operators according to large quantity of maintenance statistics.
3) Cost of inverters per year, 𝐶𝑖𝑛𝑣
According to [27], the inverter cost consists of the basic
component and the component that is linearly dependent on the
capacity of inverter (inverter unit price) described in (20).
𝐶 = 𝐶0 + 𝑃inv ×𝑀𝑖𝑛𝑣 (20)
where 𝑃inv is the capacity of the inverter, 𝑀𝑖𝑛𝑣 is the cost per
MW.
For a subway line with n traction substations, given the
service life of inverter is 𝑌𝑙𝑖𝑓𝑒, the cost of inverters installation
per year will be:
𝐶𝑖𝑛𝑣 = 𝐶 ∙ 𝑛/𝑌𝑙𝑖𝑓𝑒 (21)
IEEE Transactions on Vehicular Technology 7
4) Cost objective function, 𝐶𝑜𝑏𝑗
Given the energy saving, brake shoes wear and economy of
inverter, the cost objective function of optimization for inverter
operating characteristics can be obtained:
𝐶𝑜𝑏𝑗 = 𝑓(𝑃𝑚𝑎𝑥 , 𝑟, 𝑈𝑠𝑡)
= 𝐶𝑒𝑙𝑒 + 𝐶bks + 𝐶𝑖𝑛𝑣 (22)
Constraints of variables are listed below:
Inverter capacity:
𝑃𝑚𝑎𝑥 = 0.5, 1.0, 1.5, 2.0 MW (23)
where 0.5, 1.0, 1.5 and 2.0 are four possible capacities of the
inverters used in the TPSS. In fact, the inverter capacity is not
continuous in industrial application.
Start working voltage:
𝑈𝑘 ≤ 𝑈𝑠𝑡 ≤ 𝑈𝑀 (24)
where 𝑈𝑘 is the no-load voltage of diode rectifier, 𝑈𝑀 is the
maximum DC voltage. For the real TPSS, 𝑈𝑘 is normally 850V,
and 𝑈𝑀 is normally 950V. 𝑈𝑠𝑡 can be continuously evaluated.
For simplicity, it is evaluated with an interval of 10V.
Virtual internal resistance:
𝑟𝑚𝑖𝑛 ≤ r ≤ 𝑟𝑚𝑎𝑥 (25)
where 𝑟𝑚𝑖𝑛 and 𝑟𝑚𝑎𝑥 are the minimum and maximum virtual
internal resistance of the inverter, respectively. It can be seen
from Fig. 3 that 𝑟𝑚𝑖𝑛 is 0. And 𝑟𝑚𝑎𝑥 can be calculated by (2).
When 𝑃𝑚𝑎𝑥 = 0.5 MW , the maximum value of 𝑟𝑚𝑎𝑥 is
approximately equal to 0.2. It can be seen from section III that
r=0.02. For simplicity, r is evaluated with an interval of 0.02.
In addition, it is assumed that the inverter installed in each
substation has the same operating characteristic.
IV. OPERATING CHARACTERISTICS OPTIMIZATION
CONSIDERING MULTI-TRAINS SCENARIO
Under the actual operation scenario with multi-trains, TPSS
turns into a complex time-varying nonlinear system including
multiple sources and a lot of moving loads. Therefore, an
integrated simulation system is developed to accomplish
system energy analysis and parameters optimization.
A. Structure of the integrated simulation system
The integrated simulation system structure considering
operating characteristics optimization is shown in Fig. 13. It
mainly includes three parts: train motion simulator, system
power-flow simulator and cost function calculator. Train
motion simulator is developed considering train parameters,
route data, speed limits, driving strategies and timetable. Then
the electrical power and real-time position of each train can be
calculated and used as input data for system power-flow
simulation. The system power-flow simulator is formulated
from the steady-state model of the traction power supply
system. The network admittance matrix can be constructed,
then voltage and current of each node in the system can be
obtained through iterative calculation [33]. The cost function
calculator is specially designed to obtain the value of cost
function using the outputs of system power-flow simulator.
Fig. 13. Integrated simulation system considering operating characteristic
optimization for inverter
Fig. 14 shows the simplified network topology of the TPSS.
For simplicity, the rail resistance can be included in the
overhead contact line [33].
Return rail
Contact line
Contact line
+- +- +- +-
braking
train
motoring
trainparalleling
post
inverting
substation
contact line
resistance
+-
MV gridBus1Bus2
AC/DC AC/DC AC/DC AC/DC
AC/DC
Fig. 14. Simplified network topology of the TPSS
Current injection iterative method is used to solve the power
flow [31]. The initial voltage of each train is set to substation
no-load voltage according to (26). Thus, the current of each
train at next iteration can be calculated and the nodal voltages
of the next step are updated in (27). By iterative computation,
nodal voltages converge to steady values. The solution then
provides the voltage and current for each train on the line.
𝑈𝑡𝑟_𝑛(0)
= 𝑈𝑠𝑢𝑏 (26)
𝐼𝑡𝑟_𝑛(i+1)
=𝑃𝑡𝑟_𝑛
𝑈𝑡𝑟_𝑛(i)
𝑼(i+1) = 𝒀−1 × 𝑰(i+1)
(27)
where 𝑌−1 is the admittance matrix of the power system, 𝑈
is the voltage vector, 𝐼 is the current vector.
B. Simulation and calculation parameters
The simulation refers to a typical metro line, which covers a
length of 20 km and contains 11 passenger stations and 8
traction substations. All traction substations are inverting
substations.
The other simulation parameters are shown in TABLE I.
TABLE I
SIMULATION PARAMETERS IN THE CASE STUDY
Simulation parameters Value
Headway [s] 600
stU
train motion
simulator
power-flow
simulator
driving strategy
train parameters
speed limit
route datapower
position
cost
function
calculator
output
timetable
DC network parameterssubstation configuration
inveter operating
characteristic
electric
train
maxP r
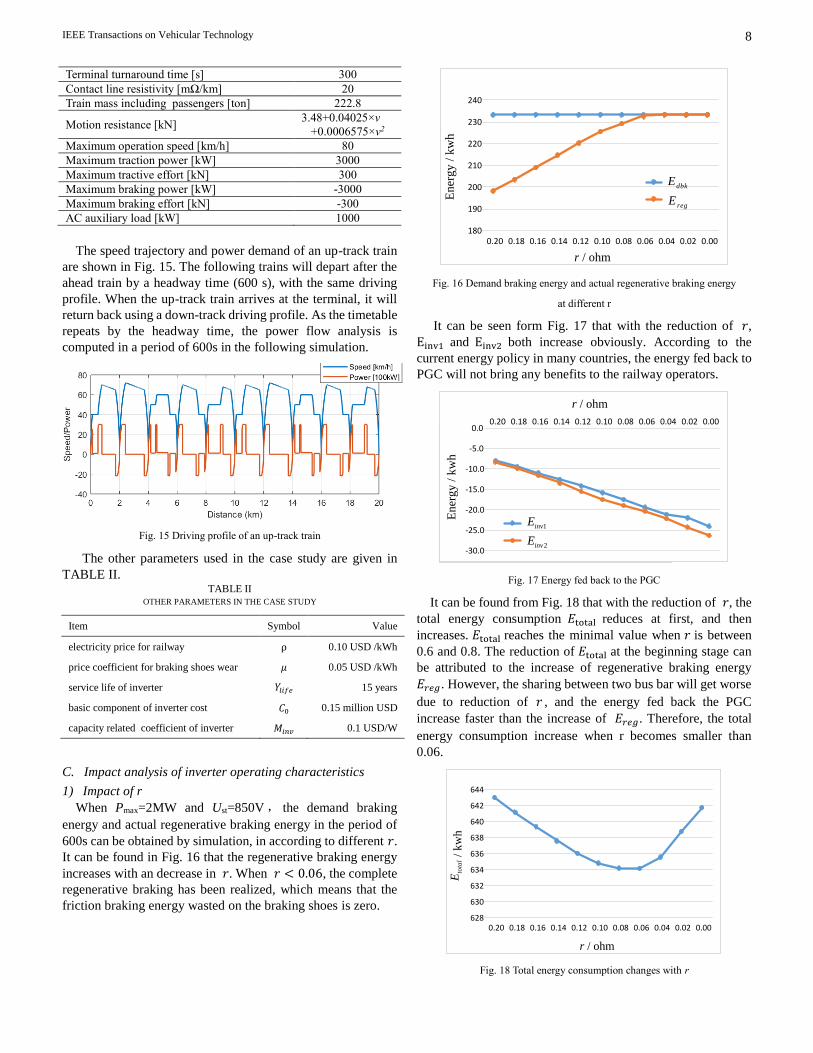
IEEE Transactions on Vehicular Technology 8
Terminal turnaround time [s] 300
Contact line resistivity [mΩ/km] 20
Train mass including passengers [ton] 222.8
Motion resistance [kN] 3.48+0.04025×v
+0.0006575×v2
Maximum operation speed [km/h] 80
Maximum traction power [kW] 3000
Maximum tractive effort [kN] 300
Maximum braking power [kW] -3000
Maximum braking effort [kN] -300
AC auxiliary load [kW] 1000
The speed trajectory and power demand of an up-track train
are shown in Fig. 15. The following trains will depart after the
ahead train by a headway time (600 s), with the same driving
profile. When the up-track train arrives at the terminal, it will
return back using a down-track driving profile. As the timetable
repeats by the headway time, the power flow analysis is
computed in a period of 600s in the following simulation.
Fig. 15 Driving profile of an up-track train
The other parameters used in the case study are given in
TABLE II. TABLE II
OTHER PARAMETERS IN THE CASE STUDY
Item Symbol Value
electricity price for railway ρ 0.10 USD /kWh
price coefficient for braking shoes wear 𝜇 0.05 USD /kWh
service life of inverter 𝑌𝑙𝑖𝑓𝑒 15 years
basic component of inverter cost 𝐶0 0.15 million USD
capacity related coefficient of inverter 𝑀𝑖𝑛𝑣 0.1 USD/W
C. Impact analysis of inverter operating characteristics
1) Impact of r
When Pmax=2MW and Ust=850V , the demand braking
energy and actual regenerative braking energy in the period of
600s can be obtained by simulation, in according to different 𝑟.
It can be found in Fig. 16 that the regenerative braking energy
increases with an decrease in 𝑟. When 𝑟 < 0.06, the complete
regenerative braking has been realized, which means that the
friction braking energy wasted on the braking shoes is zero.
Fig. 16 Demand braking energy and actual regenerative braking energy
at different r
It can be seen form Fig. 17 that with the reduction of 𝑟,
Einv1 and Einv2 both increase obviously. According to the
current energy policy in many countries, the energy fed back to
PGC will not bring any benefits to the railway operators.
Fig. 17 Energy fed back to the PGC
It can be found from Fig. 18 that with the reduction of 𝑟, the
total energy consumption 𝐸total reduces at first, and then
increases. 𝐸total reaches the minimal value when 𝑟 is between
0.6 and 0.8. The reduction of 𝐸total at the beginning stage can
be attributed to the increase of regenerative braking energy
𝐸𝑟𝑒𝑔. However, the sharing between two bus bar will get worse
due to reduction of 𝑟 , and the energy fed back the PGC
increase faster than the increase of 𝐸𝑟𝑒𝑔. Therefore, the total
energy consumption increase when r becomes smaller than
0.06.
Fig. 18 Total energy consumption changes with r
180
190
200
210
220
230
240
0.20 0.18 0.16 0.14 0.12 0.10 0.08 0.06 0.04 0.02 0.00
En
erg
y /
kw
h
r / ohm
regE
dbkE
-30.0
-25.0
-20.0
-15.0
-10.0
-5.0
0.00.20 0.18 0.16 0.14 0.12 0.10 0.08 0.06 0.04 0.02 0.00
En
erg
y /
kw
h
r / ohm
1invE
2invE
628
630
632
634
636
638
640
642
644
0.20 0.18 0.16 0.14 0.12 0.10 0.08 0.06 0.04 0.02 0.00
r / ohm
/
kw
hto
tal
E
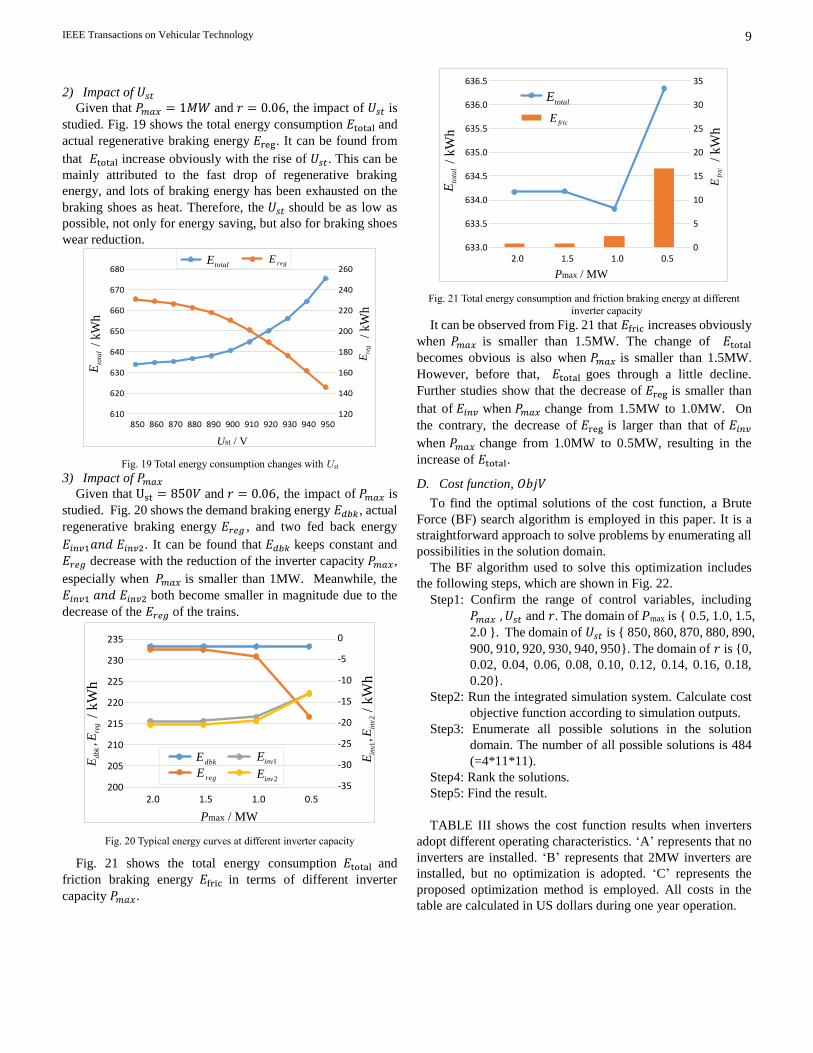
IEEE Transactions on Vehicular Technology 9
2) Impact of 𝑈𝑠𝑡 Given that 𝑃𝑚𝑎𝑥 = 1𝑀𝑊 and 𝑟 = 0.06, the impact of 𝑈𝑠𝑡 is
studied. Fig. 19 shows the total energy consumption 𝐸total and
actual regenerative braking energy 𝐸reg. It can be found from
that 𝐸total increase obviously with the rise of 𝑈𝑠𝑡. This can be
mainly attributed to the fast drop of regenerative braking
energy, and lots of braking energy has been exhausted on the
braking shoes as heat. Therefore, the 𝑈𝑠𝑡 should be as low as
possible, not only for energy saving, but also for braking shoes
wear reduction.
Fig. 19 Total energy consumption changes with Ust
3) Impact of 𝑃𝑚𝑎𝑥
Given that Ust = 850𝑉 and 𝑟 = 0.06, the impact of 𝑃𝑚𝑎𝑥 is
studied. Fig. 20 shows the demand braking energy 𝐸𝑑𝑏𝑘, actual
regenerative braking energy 𝐸𝑟𝑒𝑔 , and two fed back energy
𝐸𝑖𝑛𝑣1𝑎𝑛𝑑 𝐸𝑖𝑛𝑣2. It can be found that 𝐸𝑑𝑏𝑘 keeps constant and
𝐸𝑟𝑒𝑔 decrease with the reduction of the inverter capacity 𝑃𝑚𝑎𝑥,
especially when 𝑃𝑚𝑎𝑥 is smaller than 1MW. Meanwhile, the
𝐸𝑖𝑛𝑣1 𝑎𝑛𝑑 𝐸𝑖𝑛𝑣2 both become smaller in magnitude due to the
decrease of the 𝐸𝑟𝑒𝑔 of the trains.
Fig. 20 Typical energy curves at different inverter capacity
Fig. 21 shows the total energy consumption 𝐸total and
friction braking energy 𝐸fric in terms of different inverter
capacity 𝑃𝑚𝑎𝑥.
Fig. 21 Total energy consumption and friction braking energy at different
inverter capacity
It can be observed from Fig. 21 that 𝐸fric increases obviously
when 𝑃𝑚𝑎𝑥 is smaller than 1.5MW. The change of 𝐸total becomes obvious is also when 𝑃𝑚𝑎𝑥 is smaller than 1.5MW.
However, before that, 𝐸total goes through a little decline.
Further studies show that the decrease of 𝐸reg is smaller than
that of 𝐸𝑖𝑛𝑣 when 𝑃𝑚𝑎𝑥 change from 1.5MW to 1.0MW. On
the contrary, the decrease of 𝐸reg is larger than that of 𝐸𝑖𝑛𝑣
when 𝑃𝑚𝑎𝑥 change from 1.0MW to 0.5MW, resulting in the
increase of 𝐸total.
D. Cost function, 𝑂𝑏𝑗𝑉
To find the optimal solutions of the cost function, a Brute
Force (BF) search algorithm is employed in this paper. It is a
straightforward approach to solve problems by enumerating all
possibilities in the solution domain.
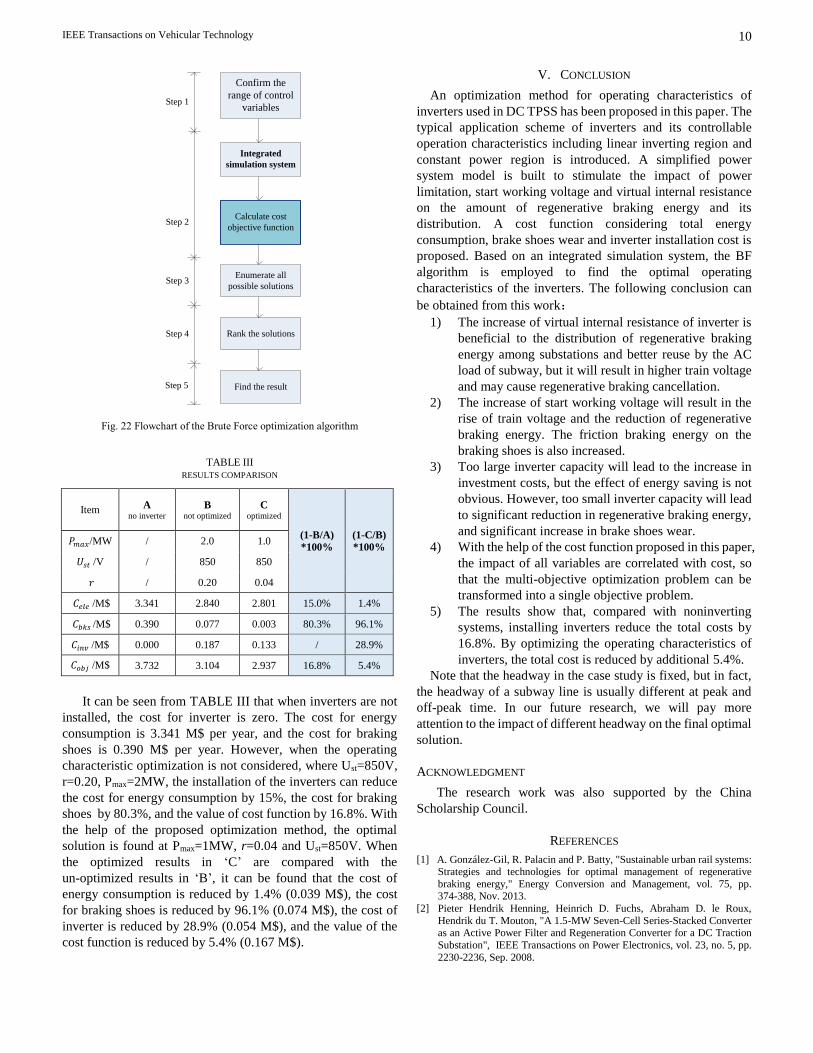
The BF algorithm used to solve this optimization includes
the following steps, which are shown in Fig. 22.
Step1: Confirm the range of control variables, including
𝑃𝑚𝑎𝑥 , 𝑈𝑠𝑡 and 𝑟. The domain of Pmax is 0.5, 1.0, 1.5,
2.0 . The domain of 𝑈𝑠𝑡 is 850, 860, 870, 880, 890,
900, 910, 920, 930, 940, 950. The domain of 𝑟 is 0,
0.02, 0.04, 0.06, 0.08, 0.10, 0.12, 0.14, 0.16, 0.18,
0.20.
Step2: Run the integrated simulation system. Calculate cost
objective function according to simulation outputs.
Step3: Enumerate all possible solutions in the solution
domain. The number of all possible solutions is 484
(=4*11*11).
Step4: Rank the solutions.
Step5: Find the result.
TABLE III shows the cost function results when inverters
adopt different operating characteristics. ‘A’ represents that no
inverters are installed. ‘B’ represents that 2MW inverters are
installed, but no optimization is adopted. ‘C’ represents the
proposed optimization method is employed. All costs in the
table are calculated in US dollars during one year operation.
120
140
160
180
200
220
240
260
610
620
630
640
650
660
670
680
850 860 870 880 890 900 910 920 930 940 950
Ust / V
tota
lE
/ k
Wh
reg
E /
kW
h
totalE regE
-35
-30
-25
-20
-15
-10
-5
0
200
205
210
215
220
225
230
235
2.0 1.5 1.0 0.5
Pmax / MW
/
kW
h
1invE
2invEregEdbkE
,dbk
reg
EE
/
kW
h1
2,
inv
inv
EE
0
5
10
15
20
25
30
35
633.0
633.5
634.0
634.5
635.0
635.5
636.0
636.5
2.0 1.5 1.0 0.5
Pmax / MW
totalE
fricE
/
kW
h
/ k
Wh
tota
lE
fric
E
IEEE Transactions on Vehicular Technology 10
Confirm the
range of control
variables
Integrated
simulation system
Calculate cost
objective function
Enumerate all
possible solutions
Rank the solutions
Find the result
Step 1
Step 2
Step 3
Step 4
Step 5
Fig. 22 Flowchart of the Brute Force optimization algorithm
TABLE III
RESULTS COMPARISON
Item A no inverter
B not optimized
C optimized
(1-B/A)
*100%
(1-C/B)
*100% 𝑃𝑚𝑎𝑥/MW / 2.0 1.0
𝑈𝑠𝑡 /V / 850 850
𝑟 / 0.20 0.04
𝐶𝑒𝑙𝑒 /M$ 3.341 2.840 2.801 15.0% 1.4%
𝐶𝑏𝑘𝑠 /M$ 0.390 0.077 0.003 80.3% 96.1%
𝐶𝑖𝑛𝑣 /M$ 0.000 0.187 0.133 / 28.9%
𝐶𝑜𝑏𝑗 /M$ 3.732 3.104 2.937 16.8% 5.4%
It can be seen from TABLE III that when inverters are not
installed, the cost for inverter is zero. The cost for energy
consumption is 3.341 M$ per year, and the cost for braking
shoes is 0.390 M$ per year. However, when the operating
characteristic optimization is not considered, where Ust=850V,
r=0.20, Pmax=2MW, the installation of the inverters can reduce
the cost for energy consumption by 15%, the cost for braking
shoes by 80.3%, and the value of cost function by 16.8%. With
the help of the proposed optimization method, the optimal
solution is found at Pmax=1MW, r=0.04 and Ust=850V. When
the optimized results in ‘C’ are compared with the
un-optimized results in ‘B’, it can be found that the cost of
energy consumption is reduced by 1.4% (0.039 M$), the cost
for braking shoes is reduced by 96.1% (0.074 M$), the cost of
inverter is reduced by 28.9% (0.054 M$), and the value of the
cost function is reduced by 5.4% (0.167 M$).
V. CONCLUSION
An optimization method for operating characteristics of
inverters used in DC TPSS has been proposed in this paper. The
typical application scheme of inverters and its controllable
operation characteristics including linear inverting region and
constant power region is introduced. A simplified power
system model is built to stimulate the impact of power
limitation, start working voltage and virtual internal resistance
on the amount of regenerative braking energy and its
distribution. A cost function considering total energy
consumption, brake shoes wear and inverter installation cost is
proposed. Based on an integrated simulation system, the BF
algorithm is employed to find the optimal operating
characteristics of the inverters. The following conclusion can
be obtained from this work:
1) The increase of virtual internal resistance of inverter is
beneficial to the distribution of regenerative braking
energy among substations and better reuse by the AC
load of subway, but it will result in higher train voltage
and may cause regenerative braking cancellation.
2) The increase of start working voltage will result in the
rise of train voltage and the reduction of regenerative
braking energy. The friction braking energy on the
braking shoes is also increased.
3) Too large inverter capacity will lead to the increase in
investment costs, but the effect of energy saving is not
obvious. However, too small inverter capacity will lead
to significant reduction in regenerative braking energy,
and significant increase in brake shoes wear.
4) With the help of the cost function proposed in this paper,
the impact of all variables are correlated with cost, so
that the multi-objective optimization problem can be
transformed into a single objective problem.
5) The results show that, compared with noninverting
systems, installing inverters reduce the total costs by
16.8%. By optimizing the operating characteristics of
inverters, the total cost is reduced by additional 5.4%.
Note that the headway in the case study is fixed, but in fact,
the headway of a subway line is usually different at peak and
off-peak time. In our future research, we will pay more
attention to the impact of different headway on the final optimal
solution.
ACKNOWLEDGMENT
The research work was also supported by the China
Scholarship Council.
REFERENCES
[1] A. González-Gil, R. Palacin and P. Batty, "Sustainable urban rail systems: Strategies and technologies for optimal management of regenerative
braking energy," Energy Conversion and Management, vol. 75, pp. 374-388, Nov. 2013.
[2] Pieter Hendrik Henning, Heinrich D. Fuchs, Abraham D. le Roux,
Hendrik du T. Mouton, "A 1.5-MW Seven-Cell Series-Stacked Converter as an Active Power Filter and Regeneration Converter for a DC Traction
Substation", IEEE Transactions on Power Electronics, vol. 23, no. 5, pp.
2230-2236, Sep. 2008.

IEEE Transactions on Vehicular Technology 11
[3] Y. S. Tzeng, R. N. Wu, N. Chen, "Electric network solutions of DC transit systems with inverting substations", IEEE Trans. Veh. Technol., vol. 47,
no. 4, pp. 1405-1412, Nov. 1998.
[4] T. Suzuki, "DC power-supply system with inverting substations for
traction systems using regenerative brakes," IEE Proc B Electr Power
Appl UK, vol. 129,no. 1, pp. 18-26, Jan. 1982.
[5] B. Mellitt, Z. S. Mouneimne and C. J. Goodman, "Simulation study of DC transit systems with inverting substations," IEE Proceedings B - Electric
Power Applications, vol. 131, no. 2, pp. 38-50, Mar. 1984.
[6] N. Ghaviha, J. Campillo, M. Bohlin, and E. Dahlquist, "Review of Application of Energy Storage Devices in Railway Transportation,"
Energy Procedia, vol. 105, pp. 4561-4568, May, 2017.
[7] T. Ratniyomchai, S. Hillmansen and P. Tricoli, "Recent developments and applications of energy storage devices in electrified railways," IET
Electrical Systems in Transportation, vol. 4, no. 1, pp. 9-20, Mar. 2014.
[8] P. Arboleya, B. Mohamed and I. El-Sayed, "DC railway simulation including controllable power electronic and energy storage devices," IEEE
Transactions on Power Systems, pp. 1-1, Feb. 2018.
[9] K. Itani, A. De Bernardinis, Z. Khatir, A. Jammal, and M. Oueidat, " Regenerative Braking Modeling, Control, and Simulation of a Hybrid
Energy Storage System for an Electric Vehicle in Extreme Conditions,"
IEEE Transactions on Transportation Electrification. vol. 2, no. 4, pp. 465-479, Dec. 2016.
[10] A. M. Gee and R. W. Dunn, "Analysis of Trackside Flywheel Energy
Storage in Light Rail Systems," IEEE Transactions on Vehicular Technology, vol. 64, no.9, pp. 3858-3869, Sep. 2015.
[11] D. Roch-Dupré, Á. J. López-López, R. R. Pecharromán, A. P. Cucala, and A. Fernández-Cardador, "Analysis of the demand charge in DC railway
systems and reduction of its economic impact with Energy Storage
Systems," International Journal of Electrical Power & Energy Systems, vol. 93, pp. 459-467, Dec. 2017.
[12] S. de la Torre, A. J. Sanchez-Racero, J. A. Aguado, M. Reyes, and O.
Martianez, "Optimal Sizing of Energy Storage for Regenerative Braking in Electric Railway Systems," IEEE Transactions on Power Systems, vol.
30, no. 3, pp. 1492-1500, May, 2015.
[13] V. Gelman, "Energy Storage That May Be Too Good to Be True: Comparison Between Wayside Storage and Reversible Thyristor
Controlled Rectifiers for Heavy Rail," IEEE Vehicular Technology
Magazine, vol. 8, no. 4, pp. 70-80, Dec. 2013. [14] V. Gelman, "Braking energy recuperation," IEEE Vehicular Technology
Magazine, vol. 4, no. 3, pp. 82-89, Sep. 2009.
[15] D. Cornic, "Efficient recovery of braking energy through a reversible dc substation," Proc. ESARS, pp. 1-9, Oct. 2010.
[16] H. Douglas, C. Roberts, S. Hillmansen, and F. Schmid, "An assessment of
available measures to reduce traction energy use in railway networks," Energy Conversion and Management, vol. 106, pp. 1149-1165, Dec. 2015.
[17] H. Ibaiondo and A. Romo, "Kinetic energy recovery on railway systems
with feedback to the grid," in Proceedings of 14th International Power Electronics and Motion Control Conference EPE-PEMC 2010, Sep. 2010,
DOI: 10.1109/EPEPEMC.2010.5606545
[18] J. Nomura, A. Kataoka and K. Inagaki, "Development of a Hybrid Inverter and a Hybrid Converter for an electric railway," 2007 Power Conversion
Conference - Nagoya, pp. 1164-1169, Apr. 2007. DOI:
10.1109/PCCON.2007.373112 [19] G. Zhang, Z. Tian, H. Du, and Z. Liu, “A Novel Hybrid DC Traction
Power Supply System Integrating PV and Reversible Converters,”
Energies, vol. 11, no. 7, p. 1661, Jun. 2018. [20] G. Zhang, J. Qian and X. Zhang, "Application of a High-Power Reversible
Converter in a Hybrid Traction Power Supply System," Applied Sciences,
vol. 7, no. 3, p. 282, Mar. 2017. [21] M. Popescu, A. Bitoleanu, V. Suru, and A. Preda, "System for converting
the DC traction substations into active substations," The 9th International
Symposium on Advanced Topics in Electrical Engineering (ATEE), pp. 632-637, May. 2015. DOI: 10.1109/ATEE.2015.7133893
[22] C. V. Suru, M. Popescu and A. Bitoleanu, "Control algorithm
implementation for a filtering and regeneration system used in urban traction DC substations," 2016 International Symposium on Power
Electronics, Electrical Drives, Automation and Motion (SPEEDAM), Jun.
2016, pp. 651-656. [23] A. Bitoleanu, M. Popescu and C. V. Suru, "Theoretical and experimental
evaluation of the indirect current control in active filtering and
regeneration systems," 2017 International Conference on Optimization of Electrical and Electronic Equipment (OPTIM) & 2017 Intl Aegean
Conference on Electrical Machines and Power Electronics (ACEMP),
May. 2017, pp. 759-764. DOI: 10.1109/OPTIM.2017.7975060
[24] M. Popescu, A. Bitoleanu and M. Dobriceanu, "FBD-based control in active DC-traction substations," in 2016 International Conference on
Applied and Theoretical Electricity (ICATE), 2016, pp. 1-6.
[25] R. Liu, W. Liu, H. Cui, J. Zhang, and J. Liao, "Capacity optimization
design of reactive compensation device in urban rail traction power supply
system," in 2017 IEEE Transportation Electrification Conference and
Expo, Asia-Pacific (ITEC Asia-Pacific), 2017, pp. 1-6. [26] Z. Zhu, "Research on Reactive Power Compensation Scheme and
Compensation Capacity of Subway Power Supply System," The World of
Inverters, vol. 11, pp. 45-47, 2014. [27] W. Jefimowski and A. Szeląg, "The multi-criteria optimization method for
implementation of a regenerative inverter in a 3 kV DC traction system,"
Electric Power Systems Research, vol. 161, pp. 61-73, Aug. 2018. [28] C. H. Bae, "A simulation study of installation locations and capacity of
regenerative absorption inverters in DC 1500V electric railways system,"
Simulation Modelling Practice and Theory, vol. 17, no. 5, pp. 829-838, May. 2009.
[29] C. H. Bae, M. S. Han, Y. K. Kim, C. Y. Choi, and S. J. Jang, "Simulation
Study of Regenerative Inverter for DC Traction Substation," in 2005 International Conference on Electrical Machines and Systems, 2005, pp.
1452-1456. DOI: 10.1109/ICEMS.2005.202789
[30] P. Arboleya, "Heterogeneous Multiscale Method for Multirate Railway Traction Systems Analysis," IEEE Transactions on Intelligent
Transportation Systems, vol. 18, no. 9, pp. 2575-2580, Sep. 2017.
[31] B. Wang, Z. Yang, F. Lin, and W. Zhao, "An Improved Genetic Algorithm for Optimal Stationary Energy Storage System Locating and Sizing,"
Energies, vol. 7, no. 10, pp. 6434-6458, Oct. 2014. [32] M. Soler, J. Lopez, J. M. Mera Sanchez De Pedro, and J. Maroto,
"Methodology for Multiobjective Optimization of the AC Railway Power
Supply System," IEEE Transactions on Intelligent Transportation Systems, vol. 16, no. 5, pp. 2531-2542, Oct. 2015.
[33] Z. Tian, P. Weston, N. Zhao, S. Hillmansen, C. Roberts, and L. Chen,
"System energy optimisation strategies for metros with regeneration," Transportation Research Part C Emerging Technologies, vol. 75, pp.
120-135, Feb. 2017..
Gang Zhang was born in Chongqing, China.
He received his B.Eng. and Ph.D. degree in
School of Electrical Engineering from
Beijing Jiaotong University, Beijing, China,
in 2005 and 2010, respectively. From 2010 to
2012, he worked as a post-doctor at Tsinghua
university, where he was engaged in research
on high power grid-connected power
converter. He is currently a Lecture in the
School of Electrical Engineering, Beijing Jiaotong University,
Beijing, China. His current research interests focus on power
electronics and control, which includes high power traction
power converter, grid-connected inverter, and energy-saving
techniques in subway.
Zhongbei Tian received the B.Eng in
Huazhong University of Science and
Technology, Wuhan, China, in 2013. He
received the B.Eng. and PhD degree in
Electrical and Electronic Engineering
from the University of Birmingham,
Birmingham, U.K., in 2013 and 2017. He
is currently a Research Fellow at the
University of Birmingham. His research
interests include railway traction system and power network
modeling, energy systems optimization, advanced traction
power systems design, analysis of electric railways.
IEEE Transactions on Vehicular Technology 12
Pietro Tricoli (M’06) received the M.S.
(cum laude) and Ph.D. degrees in
Electrical Engineering from the
University of Naples Federico II, Italy, in
2002 and 2005, respectively. He is
currently a Senior Lecturer of Electrical
Power and Control in the Department of
Electronic, Electrical, and Systems
Engineering, University of Birmingham,
Birmingham, U.K. His research focusses on modeling and
control of power converters with application to storage devices
for electric vehicles, railway electrification and traction
systems, wind and photovoltaic generation.
Stuart Hillmansen received his Ph.D.
degree from Imperial College, London. He
is currently a Senior Lecturer in electrical
energy systems with the Department of
Electronic, Electrical, and Systems
Engineering at the University of
Birmingham. He is a member of the
Birmingham Centre for Railway Research
and Education where he leads the Railway
Traction Research Group, whose portfolio of activities is
supported by the railway industry and government. His
research interests include hybrid traction systems for use in
railway vehicles and the modeling and measurement of energy
consumption for railway systems.
Yong Wang was born in Liaocheng,
China. He received his B.Eng. degree in
School of Electrical Engineering from
Shandong University of Science and
Technology, Shandong, China, in
2011,and obtained his master's degree in
School of Electrical Engineering from
Beijing Jiaotong University, Beijing,
China, in 2017. He works since 2017 in
Institute of standards and metrology China
academy of railway sciences group co., LTD, where he engage
in research on standard of railway product, product testing and
supervision and spot checks, His main research interests
include high-power power electronic devices, energy-saving
techniques in subway, the subway and EMU traction auxiliary
inverter, and EMU electronic device .
Zhigang Liu was born in Shandong,
China. He received his B.Eng. and Ph.D.
degree in School of Electrical Engineering
from Beijing Jiaotong University, Beijing,
China, in 1986 and 1994, respectively. He
is currently a professor in the School of
Electrical Engineering, Beijing Jiaotong
University, Beijing, China. His current
research interests include AC drives,
traction power supply system, power electronic circuit and
system, computer network communication, and industrial
automation technology.