invesco unit trusts dividend sustainability · pdf fileprocter & gamble company pg...
TRANSCRIPT
What makes an aristocrat? A commitment to dividends. The strategy invests in companies that have raised their dividends for the last 25 consecutive years.
Invest with a leader Total return Income sustainability and quality $115 billion. Equity and fixed income unit trust initial deposits since 1975.
70+ years. Industry experience in analysis, surveillance and securities selection.
$723.9 billion. Assets under management or supervision as of March 31, 2013.
Invesco believes that sustainable dividend income and capital appreciation potential are important to total return expectations. Corporate managers use stable and increasing dividends as a sign of confidence in their firm’s prospects, while investors may consider such track records as signs of corporate maturity and strength.1
Companies with strong dividend coverage should be able to increase dividend payments.1
S&P Capital IQ Quality Ranking of B or higher and, if rated by S&P, an S&P Credit Rating of BBB or higher, each as of the initial deposit date.
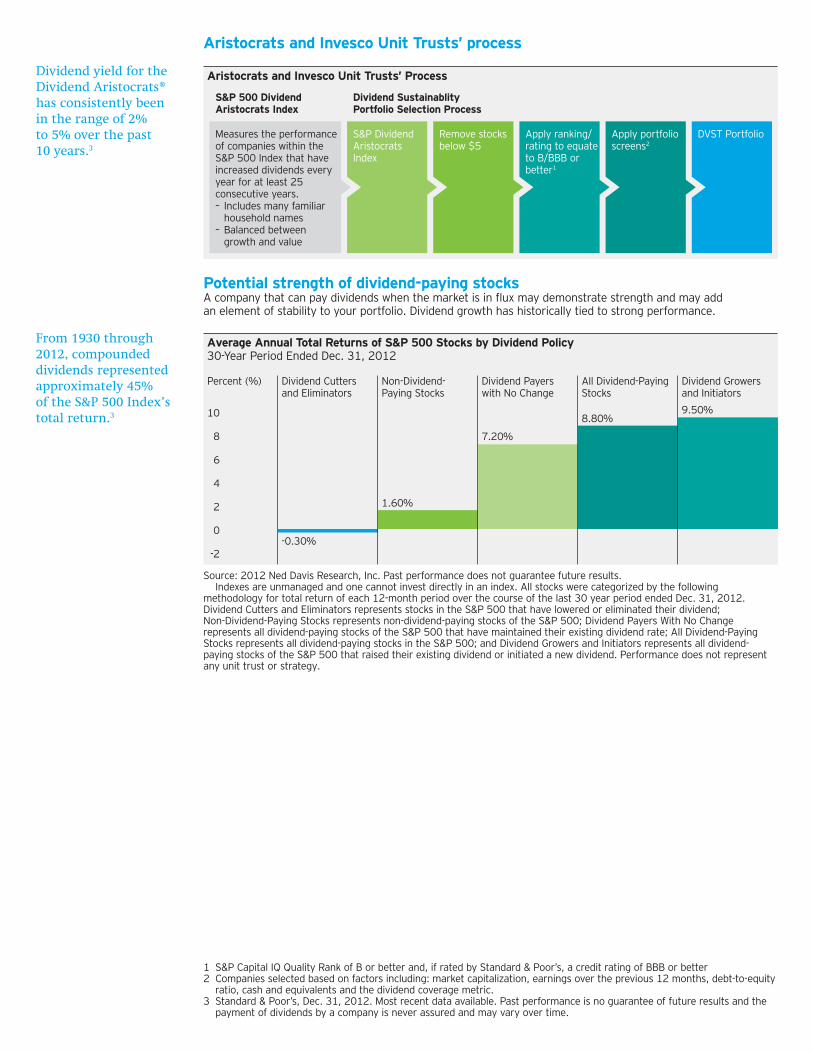
Dividend Aristocrats outperform historicallyThis chart compares the average annual total returns of the S&P 500 Dividend Aristocrats Index to the S&P 500 Index. For all periods shown, the dividend-focused index outperformed the broader stock index.
5
10
15
20
20 Year15 Year10 Year5 Year3 Year1 Year
10.43
7.91
9.938.37
14.77
16.94
8.21
4.47
7.10
1.66
10.87
16.00
Returns (%)
S&P 500 Dividend Aristocrats Index S&P 500 Index
Source: S&P Indices. Data as of Dec. 31, 2012. Past performance does not guarantee of future results. The performance above is not that of any DVST portfolio. Average annual total return and total return measure change in the value of an investment assuming reinvestment of all dividends and capital gains. Average annual total return reflects annualized changes. As a result of recent market activity, current performance may vary.
Symbol: DVST132
Invesco Unit Trusts
Dividend Sustainability Portfolio
Unit trust structure• Diversified. A basket of stocks that are professionally selected and monitored.
• Disciplined. A consistent, repeatable selection methodology and investment process.
• Defined. A fixed portfolio that enables investors to always know what they own.
Dividend Sustainability Portfolio
Symbol DVST132
Term of trust 24 months
Offering period 3 months
Sales charge 3.95%
Breakpoints Begin at $50,000
Number of securities 30
1 There is no guarantee of future results, and the payment of dividends are never assured and may vary over time.
Aristocrats and Invesco Unit Trusts’ process
Aristocrats and Invesco Unit Trusts’ Process
S&P Dividend Aristocrats Index
Measures the performance of companies within the S&P 500 Index that have increased dividends every year for at least 25 consecutive years.– Includes many familiar household names– Balanced between growth and value
S&P 500 Dividend Aristocrats Index
Dividend Sustainablity Portfolio Selection Process
Remove stocksbelow $5
Apply ranking/rating to equate to B/BBB or better1
Apply portfolio screens2
DVST Portfolio
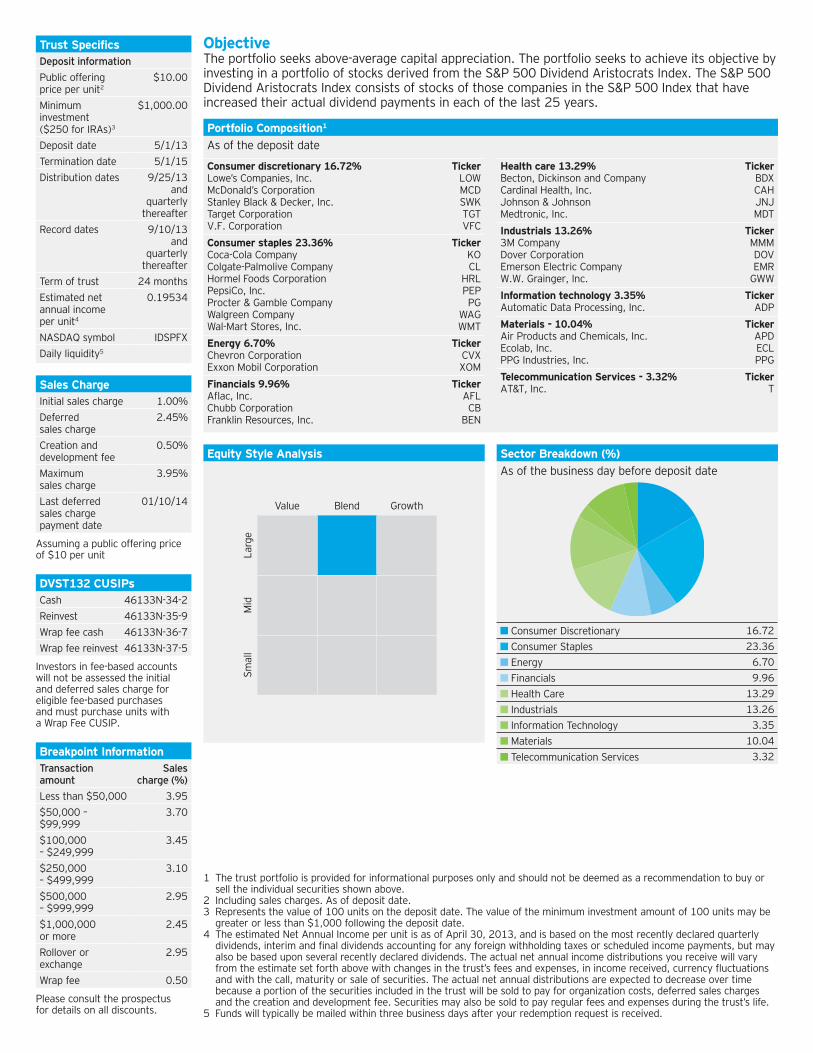
Potential strength of dividend-paying stocksA company that can pay dividends when the market is in flux may demonstrate strength and may add an element of stability to your portfolio. Dividend growth has historically tied to strong performance.
Average Annual Total Returns of S&P 500 Stocks by Dividend Policy30-Year Period Ended Dec. 31, 2012
-2
0
2
4
6
8
10
Dividend Growers and Initiators
9.50%
All Dividend-Paying Stocks
8.80%
Dividend Payers with No Change
7.20%
Non-Dividend-Paying Stocks
1.60%
Dividend Cutters and Eliminators
-0.30%
Percent (%)
Source: 2012 Ned Davis Research, Inc. Past performance does not guarantee future results. Indexes are unmanaged and one cannot invest directly in an index. All stocks were categorized by the following methodology for total return of each 12-month period over the course of the last 30 year period ended Dec. 31, 2012. Dividend Cutters and Eliminators represents stocks in the S&P 500 that have lowered or eliminated their dividend; Non-Dividend-Paying Stocks represents non-dividend-paying stocks of the S&P 500; Dividend Payers With No Change represents all dividend-paying stocks of the S&P 500 that have maintained their existing dividend rate; All Dividend-Paying Stocks represents all dividend-paying stocks in the S&P 500; and Dividend Growers and Initiators represents all dividend-paying stocks of the S&P 500 that raised their existing dividend or initiated a new dividend. Performance does not represent any unit trust or strategy.
Dividend yield for the Dividend Aristocrats® has consistently been in the range of 2% to 5% over the past 10 years.3
From 1930 through 2012, compounded dividends represented approximately 45% of the S&P 500 Index’s total return.3
1 S&P Capital IQ Quality Rank of B or better and, if rated by Standard & Poor’s, a credit rating of BBB or better 2 Companies selected based on factors including: market capitalization, earnings over the previous 12 months, debt-to-equity
ratio, cash and equivalents and the dividend coverage metric. 3 Standard & Poor’s, Dec. 31, 2012. Most recent data available. Past performance is no guarantee of future results and the
payment of dividends by a company is never assured and may vary over time.
Trust SpecificsDeposit informationPublic offering price per unit2
$10.00
Minimum investment ($250 for IRAs)3
$1,000.00
Deposit date 5/1/13
Termination date 5/1/15
Distribution dates 9/25/13 and
quarterly thereafter
Record dates 9/10/13 and
quarterly thereafter
Term of trust 24 months
Estimated net annual income per unit4
0.19534
NASDAQ symbol IDSPFX
Daily liquidity5
Sales ChargeInitial sales charge 1.00%
Deferred sales charge
2.45%
Creation and development fee
0.50%
Maximum sales charge
3.95%
Last deferred sales charge payment date
01/10/14
Assuming a public offering price of $10 per unit
DVST132 CUSIPsCash 46133N-34-2
Reinvest 46133N-35-9
Wrap fee cash 46133N-36-7
Wrap fee reinvest 46133N-37-5
Investors in fee-based accounts will not be assessed the initial and deferred sales charge for eligible fee-based purchases and must purchase units with a Wrap Fee CUSIP.
Breakpoint InformationTransaction amount
Sales charge (%)
Less than $50,000 3.95
$50,000 – $99,999
3.70
$100,000 – $249,999
3.45
$250,000 – $499,999
3.10
$500,000 – $999,999
2.95
$1,000,000 or more
2.45
Rollover or exchange
2.95
Wrap fee 0.50
Please consult the prospectus for details on all discounts.
As of the deposit date
Consumer discretionary 16.72% TickerLowe’s Companies, Inc. LOWMcDonald’s Corporation MCDStanley Black & Decker, Inc. SWKTarget Corporation TGTV.F. Corporation VFC
Consumer staples 23.36% TickerCoca-Cola Company KOColgate-Palmolive Company CLHormel Foods Corporation HRLPepsiCo, Inc. PEPProcter & Gamble Company PGWalgreen Company WAGWal-Mart Stores, Inc. WMT
Energy 6.70% TickerChevron Corporation CVXExxon Mobil Corporation XOM
Financials 9.96% TickerAflac, Inc. AFLChubb Corporation CBFranklin Resources, Inc. BEN
Health care 13.29% TickerBecton, Dickinson and Company BDXCardinal Health, Inc. CAHJohnson & Johnson JNJMedtronic, Inc. MDT
Industrials 13.26% Ticker3M Company MMMDover Corporation DOVEmerson Electric Company EMRW.W. Grainger, Inc. GWW
Information technology 3.35% TickerAutomatic Data Processing, Inc. ADP
Materials - 10.04% TickerAir Products and Chemicals, Inc. APDEcolab, Inc. ECLPPG Industries, Inc. PPG
Telecommunication Services - 3.32% TickerAT&T, Inc. T
Portfolio Composition1
ObjectiveThe portfolio seeks above-average capital appreciation. The portfolio seeks to achieve its objective by investing in a portfolio of stocks derived from the S&P 500 Dividend Aristocrats Index. The S&P 500 Dividend Aristocrats Index consists of stocks of those companies in the S&P 500 Index that have increased their actual dividend payments in each of the last 25 years.
1 The trust portfolio is provided for informational purposes only and should not be deemed as a recommendation to buy or sell the individual securities shown above.
2 Including sales charges. As of deposit date.3 Represents the value of 100 units on the deposit date. The value of the minimum investment amount of 100 units may be
greater or less than $1,000 following the deposit date.4 The estimated Net Annual Income per unit is as of April 30, 2013, and is based on the most recently declared quarterly
dividends, interim and final dividends accounting for any foreign withholding taxes or scheduled income payments, but may also be based upon several recently declared dividends. The actual net annual income distributions you receive will vary from the estimate set forth above with changes in the trust’s fees and expenses, in income received, currency fluctuations and with the call, maturity or sale of securities. The actual net annual distributions are expected to decrease over time because a portion of the securities included in the trust will be sold to pay for organization costs, deferred sales charges and the creation and development fee. Securities may also be sold to pay regular fees and expenses during the trust’s life.
5 Funds will typically be mailed within three business days after your redemption request is received.
Equity Style Analysis
Value Blend Growth
Larg
eM
idS
mall
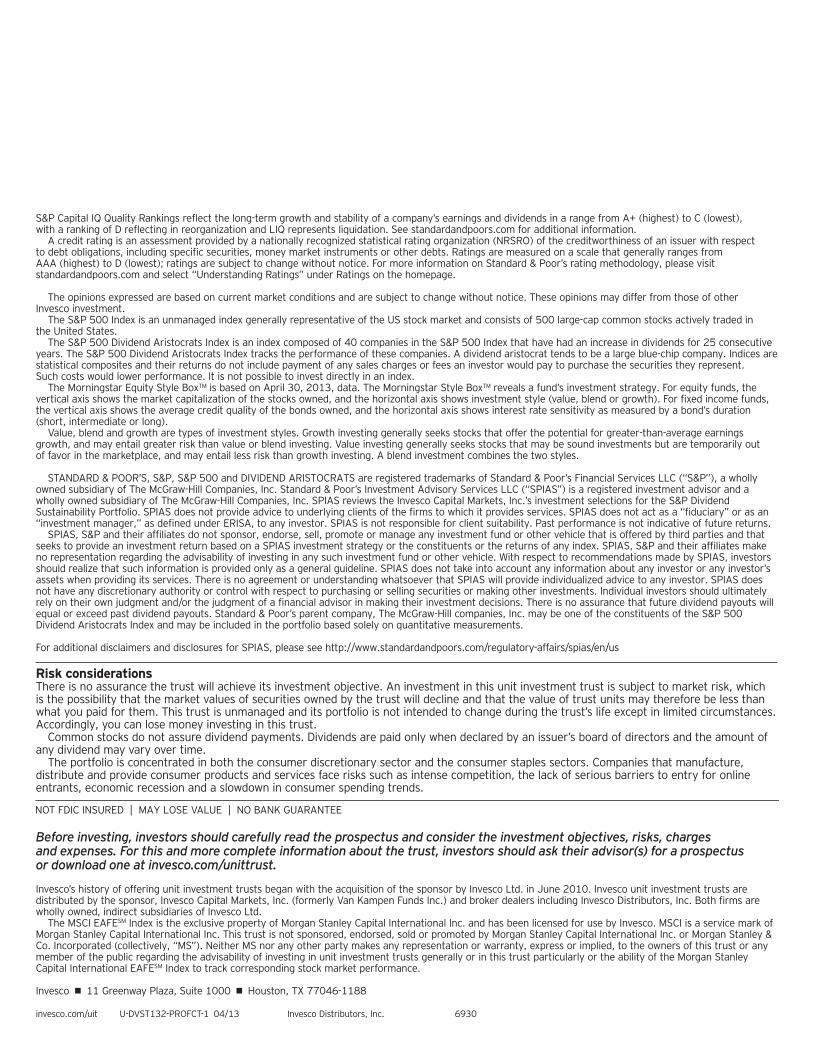
Sector Breakdown (%)As of the business day before deposit date
Consumer Discretionary 16.72
Consumer Staples 23.36
Energy 6.70
Financials 9.96
Health Care 13.29
Industrials 13.26
Information Technology 3.35
Materials 10.04
Telecommunication Services 3.32
S&P Capital IQ Quality Rankings reflect the long-term growth and stability of a company’s earnings and dividends in a range from A+ (highest) to C (lowest), with a ranking of D reflecting in reorganization and LIQ represents liquidation. See standardandpoors.com for additional information. A credit rating is an assessment provided by a nationally recognized statistical rating organization (NRSRO) of the creditworthiness of an issuer with respect to debt obligations, including specific securities, money market instruments or other debts. Ratings are measured on a scale that generally ranges from AAA (highest) to D (lowest); ratings are subject to change without notice. For more information on Standard & Poor’s rating methodology, please visit standardandpoors.com and select “Understanding Ratings” under Ratings on the homepage.
The opinions expressed are based on current market conditions and are subject to change without notice. These opinions may differ from those of other Invesco investment. The S&P 500 Index is an unmanaged index generally representative of the US stock market and consists of 500 large-cap common stocks actively traded in the United States. The S&P 500 Dividend Aristocrats Index is an index composed of 40 companies in the S&P 500 Index that have had an increase in dividends for 25 consecutive years. The S&P 500 Dividend Aristocrats Index tracks the performance of these companies. A dividend aristocrat tends to be a large blue-chip company. Indices are statistical composites and their returns do not include payment of any sales charges or fees an investor would pay to purchase the securities they represent. Such costs would lower performance. It is not possible to invest directly in an index. The Morningstar Equity Style Box™ is based on April 30, 2013, data. The Morningstar Style Box™ reveals a fund’s investment strategy. For equity funds, the vertical axis shows the market capitalization of the stocks owned, and the horizontal axis shows investment style (value, blend or growth). For fixed income funds, the vertical axis shows the average credit quality of the bonds owned, and the horizontal axis shows interest rate sensitivity as measured by a bond’s duration (short, intermediate or long). Value, blend and growth are types of investment styles. Growth investing generally seeks stocks that offer the potential for greater-than-average earnings growth, and may entail greater risk than value or blend investing. Value investing generally seeks stocks that may be sound investments but are temporarily out of favor in the marketplace, and may entail less risk than growth investing. A blend investment combines the two styles.
STANDARD & POOR’S, S&P, S&P 500 and DIVIDEND ARISTOCRATS are registered trademarks of Standard & Poor’s Financial Services LLC (“S&P”), a wholly owned subsidiary of The McGraw-Hill Companies, Inc. Standard & Poor’s Investment Advisory Services LLC (“SPIAS”) is a registered investment advisor and a wholly owned subsidiary of The McGraw-Hill Companies, Inc. SPIAS reviews the Invesco Capital Markets, Inc.’s investment selections for the S&P Dividend Sustainability Portfolio. SPIAS does not provide advice to underlying clients of the firms to which it provides services. SPIAS does not act as a “fiduciary” or as an “investment manager,” as defined under ERISA, to any investor. SPIAS is not responsible for client suitability. Past performance is not indicative of future returns. SPIAS, S&P and their affiliates do not sponsor, endorse, sell, promote or manage any investment fund or other vehicle that is offered by third parties and that seeks to provide an investment return based on a SPIAS investment strategy or the constituents or the returns of any index. SPIAS, S&P and their affiliates make no representation regarding the advisability of investing in any such investment fund or other vehicle. With respect to recommendations made by SPIAS, investors should realize that such information is provided only as a general guideline. SPIAS does not take into account any information about any investor or any investor’s assets when providing its services. There is no agreement or understanding whatsoever that SPIAS will provide individualized advice to any investor. SPIAS does not have any discretionary authority or control with respect to purchasing or selling securities or making other investments. Individual investors should ultimately rely on their own judgment and/or the judgment of a financial advisor in making their investment decisions. There is no assurance that future dividend payouts will equal or exceed past dividend payouts. Standard & Poor’s parent company, The McGraw-Hill companies, Inc. may be one of the constituents of the S&P 500 Dividend Aristocrats Index and may be included in the portfolio based solely on quantitative measurements.
For additional disclaimers and disclosures for SPIAS, please see http://www.standardandpoors.com/regulatory-affairs/spias/en/us
Risk considerationsThere is no assurance the trust will achieve its investment objective. An investment in this unit investment trust is subject to market risk, which is the possibility that the market values of securities owned by the trust will decline and that the value of trust units may therefore be less than what you paid for them. This trust is unmanaged and its portfolio is not intended to change during the trust’s life except in limited circumstances. Accordingly, you can lose money investing in this trust. Common stocks do not assure dividend payments. Dividends are paid only when declared by an issuer’s board of directors and the amount of any dividend may vary over time. The portfolio is concentrated in both the consumer discretionary sector and the consumer staples sectors. Companies that manufacture, distribute and provide consumer products and services face risks such as intense competition, the lack of serious barriers to entry for online entrants, economic recession and a slowdown in consumer spending trends.
Before investing, investors should carefully read the prospectus and consider the investment objectives, risks, charges and expenses. For this and more complete information about the trust, investors should ask their advisor(s) for a prospectus or download one at invesco.com/unittrust.
Invesco’s history of offering unit investment trusts began with the acquisition of the sponsor by Invesco Ltd. in June 2010. Invesco unit investment trusts are distributed by the sponsor, Invesco Capital Markets, Inc. (formerly Van Kampen Funds Inc.) and broker dealers including Invesco Distributors, Inc. Both firms are wholly owned, indirect subsidiaries of Invesco Ltd. The MSCI EAFESM Index is the exclusive property of Morgan Stanley Capital International Inc. and has been licensed for use by Invesco. MSCI is a service mark of Morgan Stanley Capital International Inc. This trust is not sponsored, endorsed, sold or promoted by Morgan Stanley Capital International Inc. or Morgan Stanley & Co. Incorporated (collectively, “MS”). Neither MS nor any other party makes any representation or warranty, express or implied, to the owners of this trust or any member of the public regarding the advisability of investing in unit investment trusts generally or in this trust particularly or the ability of the Morgan Stanley Capital International EAFESM Index to track corresponding stock market performance.
Invesco • 11 Greenway Plaza, Suite 1000 • Houston, TX 77046-1188
invesco.com/uit U-DVST132-PROFCT-1 04/13 Invesco Distributors, Inc. 6930