invesment in public capital, distribution, and governance€¦ · · 2016-01-26invesment in...
TRANSCRIPT
123DECYZJE no 24/2015 DOI: 10.7206/DEC.1733-0092.64
INVESMENT IN PUBLIC CAPITAL,
DISTRIBUTION, AND GOVERNANCE
Martin C. McGuire*Department of Economics, University of California-Irvine
A democracy cannot survive as a permanent form of government.It can last only until its citizens discover that they can vote themselves
largesse from the public treasury. From that moment on, the majority (who vote)will vote for the candidates promising the greatest benefi ts from the public purse,with the result that a democracy will always collapse from loose fi scal policies,
always followed by a dictatorship. Alexander Tytler [18th Century Scottish Historian,
Quoted in The Economist March 21, 1998, p. 36.]
Abstract: How does the redistribution of income that a regime prescribes for society and the amount of public-good social-overhead investment it provides depend on the nature of that regime? And how do these infl uence said society’s productive success? Connections among these phenomena informed much of Mancur Olson’s (1982, 1991) life-work now so foundational to the literature on redistributive politics, economic growth/prosperity, and the nature of regimes. Still a transparent simple account of how the nature of a regime determines trade-offs between transfers and public capital investment can improve the foundations and clarify anomalies present in the literature. Here we elaborate a model to address these questions and we prove, contrary to received wisdom, that redistribution can reduce or actually and unexpectedly
DECYZJE no 24 December 2015
* Emeritus Heinz Professor of Economics, University of California-Irvine, Irvine, CA, and Emeritus Professor of Economics, University of Maryland-College Park, MD. Email: mailto:[email protected]. The author thanks reviewers for this memorial volume for their insightful suggestions and comments. Earlier research for his paper was begun while the author was Visiting Scholar at the International Monetary Fund, and later a Fulbright Scholar at Aoyama Gakuin University and Ritsumeikan University, Japan. Versions were also discussed at workshops at University of Md., Tokyo Metropolitan Public Finance Seminar, and UC-Irvine. I benefitted greatly from participants’ comments. I also benefitted most especially from the advice of Mancur Olson and from comments of Peter Bernholz, Ke-young Chu, Kaku Furuya, Toshihiro Ihori, Hiroshi Ohta, Gareth Myles, Alberto Ramos, Robert Schwab, Vito Tanzi, and Howell Zee. The original impetus for this paper was an exchange of correspondence between Mancur Olson and Robert Barro related to the article by Martin C. McGuire and Mancur L. Olson, 1996. “The Economics of Autocracy and Majority Rule: The Invisible Hand and the Use of Force. Journal of Economic Literature, March: 72-96.” Mancur and I agreed to write a joint paper on the subjects raised by Barro and addressed herein but because of Mancur’s premature death this could not be pursued.
Decyzje 24_2015v2.indd 123Decyzje 24_2015v2.indd 123 2015-12-23 13:55:302015-12-23 13:55:30
124
INVESMENT IN PUBLIC CAPITAL, DISTRIBUTION, AND GOVERNANCE
DECYZJE no 24/2015DOI: 10.7206/DEC.1733-0092.64
increase supplies of public overhead capital. Redistributive taxation reduces capital productivity, which incentivizes governments to supply less. But, contrary to conventional wisdom, redistribution can also so deplete the tax base that to offset some of the loss government will actually invest more in the way of public-overhead factor inputs than would a less redistributive regime of an otherwise comparable society.
Key words: Economic Autocracy, Benevolent Dictator, Consensual Society, Public Investment, Social Capital, Redistribution, Majority Rule, Optimal Government, Leviathan.
1. INTRODUCTION
What is the relationship between the redistribution of income that a regime prescribes for society and the amount of public-good social-overhead investment it provides? As evidenced by The Economist’s quote from Tytler the question is not new. Economists such as Mancur Olson have focused intense scrutiny on the importance of public capital investment in a society’s productive success and on the effects of redistributive transfers – so massively increased over the past generation – to that success. The connection between these two phenomena informed much of Olson’s life-work now so foundational to the literature on redistributive politics, economic growth/prosperity, and the nature of regimes. Still a transparent simple account of how the nature of a regime determines trade-offs between transfers and such public capital investment can improve the foundations and clarify anomalies present in the literature. Such irregularities include non-intuitive efficiency effects of redistribution, and the peculiar role of Cobb-Douglas production in appraising the trade-offs. The modern classic is Robert Barro (1990), which many take as a foundation for such analysis, but as shown here this contains errors. Clarity about these issues can be elusive because of the great variety in sources, and types of redistribution, and even the meaning of the term. We take pains to clarify this in Section II of this paper.
Here we elaborate a model to address these questions and we prove, contrary to received wisdom, that redistribution may reduce or actually increase supplies of public overhead capital. Redistributive taxation reduces capital productivity, which incentivizes governments to supply less. But, contrary to conventional wisdom, redistribution can also so deplete the tax base that to offset some of the loss government will actually invest more in the way of public-overhead factor inputs than would a less redistributive regime of an otherwise comparable society. These conclusions challenge
Decyzje 24_2015v2.indd 124Decyzje 24_2015v2.indd 124 2015-12-23 13:55:302015-12-23 13:55:30

125
Martin C. McGuire
DECYZJE no 24/2015 DOI: 10.7206/DEC.1733-0092.64
Barro’s (1990, 1999) model, which misses this dynamic between redistribution and social investment. Moreover, refuting Barro we show that interactions between redistribution, investment, and type of regime entail deadweight welfare losses even if the amount a government invests in its society is “efficient.”
Classics and moderns alike recognize1 that every society reaps immense allocative benefits from conquering anarchy and imposing a social order on itself via its government, and that the first justification of every social order is the provision of productivity enhancing public goods. A second feature universal to every social order and its government is transfer of wealth from some groups of the population to others. From the positive perspective adopted here redistribution is not as a question of equity but of power. The basic premise is that the tradeoff between these two choices boils down to a benefit cost calculation rather than a value judgment: in return for the net benefits which a society obtains from productive public good investment, it must pay extra costs, transfers to favored and powerful groups which its form of governance exacts. Following Martin McGuire and Mancur Olson (1996) [hereafter MO]. we ask: how far along the public-good-benefit/redistribution-cost margin a society and a government will proceed? As in more recent research on the larger tapestry of a country’s political economy how do governments combine political and economic calculation to balance these competing choices?
Here we extend and elaborate the beginning approach to this problem made by MO. They constructed an argument based solely on substitution effects. National product was a function of public overhead capital inputs, (G), and all other factors including labor (L) were fixed in supply. They demonstrate that governments that choose more redistribution will ordinarily provide less public goods.2 Crucial in this calculus is the share of the private productive economy owned by the governing powers, since this determines how much of the costs of redistribution will be borne by those governing powers and how much of the gains from public good provision they will capture.
1 Selected references would include later work of Barro (1999) the vast work of Acemoglu and co-authors Johnson, Robinson, Yared, Naidu, and Restrepo eg (2006, 2008, 2012, 2013), of Alesina and Rodrik (1994), of Benabou (1996), of Aghion, Alesina, and Trebbi (2008), Persson and Tabellini (1994, 2006, 2008, 2009), Cheibub, Gandhi, and Vreeland (2010). From the classics such as Hobbes (1651) or Schumpeter (1942) to moderns including Barzel (2002), Brennan and Buchanan (1977), Engineer (1989, 1991), Hillman and Ursprung (2000), Hirshleifer (1995), Karras (1996), Niskanen (1997), Olson (1982, 1991, 1993), Sandler (1992), Skaperdas (1992), and Wintrobe (1990, 1998), and recently Jos’e Antonio, Jennifer Gandhi, and James R. Vreeland (2010).
2 One line of research (Cornes and Sandler 2000, Itaya and Myles, 1997) demonstrates contrary to the early M-O model that inequality of distribution by increasing voluntary public good provision as a substitute for benevolent government can benefi t everyone. Although the mechanism that produces this result differs from mine, it is consistent with our result.
Decyzje 24_2015v2.indd 125Decyzje 24_2015v2.indd 125 2015-12-23 13:55:302015-12-23 13:55:30
126
INVESMENT IN PUBLIC CAPITAL, DISTRIBUTION, AND GOVERNANCE
DECYZJE no 24/2015DOI: 10.7206/DEC.1733-0092.64
Barro (1990) also approaches these questions in a dynamic multi-period model.3 He includes both income and substitution effects in the consumer’s responses to linear income taxation and choice of saving. He finds that in the knife-edge case of Cobb-Douglas (C-D) production, the consumer’s maximizing response to linear taxation does not interfere with marginal efficiency conditions in the government’s investment decision calculus. Consequently he argues under a C-D assumption the government always provides an “efficient” amount of G irrespective of the level of taxation employed for redistribution.4 I show this to be wrong. How excess burden of taxation influences the amount of public investment and how it influences the efficiency of government decisions to invest are different issues even though related. In fact,5 income effects may cause greater redistri-bution to lead to more social overhead provision. I construct a simplified, comparative static version of Barro’s dynamic model demonstrating that in his framework too realistic democracies can be envisaged as a linear combination of pure Autocracy and perfect Utopia. Accordingly, this powerful organizing concept of Olson’s, which visualizes every society to behave somewhat like a pure democracy and somewhat like a selfish dictatorship, thus readily extends to environments that include individual labor-leisure as well as savings-consumption choices.
The paper proceeds in several stages. First, to introduce income and scale effects, I develop a basic model and derive outcomes under lump sum taxation. We show these outcomes (1) for a utopian, totally benevolent or consensual dictatorship concerned only with the welfare of the citizens, then (2) for comparison for a totally selfish autocrat concerned only with his own net tax collections. Second, we examine outcomes under linear income taxation. Here again the extreme cases of perfect consensus utopia and totally selfish autocracy are considered. A comparison of regimes demonstrates that an autocrat may actually provide more of the public capital input, and therefore sustain a more productive economy. Third, (Section 7), using the pure autocracy and pure utopian examples as end points, we demonstrate how more realistic semi-3 Production combines (1) fi xed amounts of labor, (2) variable amounts of private capital (k) accumulated
through savings decisions, and (3) variable amounts of tax fi nanced government public factor inputs, (g) to produce generalized output (y). With C-D production, because the productive effi ciency conditions for g/y are the same under benevolent and self-interested governments, the share of public investment as a percentage of national income or product is the same under the two regimes. But because the analysis ignores income effects it overlooks the fact that both y and g differ systematically under different optimizing regimes, so that g and y may differ greatly while g/y does not.
4 This resembles the Diamond and Mirlees (1970-71) [D-M] result that at a constrained-maximum second-best, marginal constraints in consumption markets will not contaminate the optimality of first best marginal conditions in factor markets. Absent C-D production technology, this D-M conclusion may not obtain. This knife-edge peculiarity of Cobb-Douglas production also turns up in analyses of neoclassical balanced growth as in Akerlof and Nordhaus (1967) and Arrow and Kurz (1970), for reasons explained in Section 9.
5 Engineer (1989, 1990) provides early insights into this question. Income and scale effects in consumer utility and government production functions have also been identified and considered in some detail in the literature on optimal inflation tax. See Aiyagari, Christiano, and Eichenbaum (1992) and Mulligan and Sala-i-Martin (1997) for example.
Decyzje 24_2015v2.indd 126Decyzje 24_2015v2.indd 126 2015-12-23 13:55:302015-12-23 13:55:30
127
Martin C. McGuire
DECYZJE no 24/2015 DOI: 10.7206/DEC.1733-0092.64
democratic societies share features of both these components and can --- as in MO (1996) be analyzed as a linear combination of the two. Moreover, we show that there is an inherent tendency for sufficiently democratic societies, where the ownership base of the governing group is sufficiently far reaching, to refrain completely from transfer, and to tax only to pay for public capital public goods. Fourth (Section 9), we explain why it is that other Constant Return to Scale production functions other than Cobb-Douglas necessarily entail violations of the efficiency condition for public factor input provision. This peculiar difference between C-D and other production functions is recognized (Barro 1990, and Karras 1996), but not explained.6
2. DEFINITIONS
Before proceeding, however, a clarification of our underlying categories seems in order. Specifically the categories that we label “public investment,” “redistribution,” and “governance” all may invoke different understandings in the reader, especially since each is often applied to name various different phenomena, entities, or constructs.
Public CapitalThe capital investments referred to in the title should be thought of here as
investments by public authorities in human or physical capital, which enhance the total productive capabilities of an economy in the fashion of public goods. These public good investments can be highly diverse: public safety, health, education, transport and other infrastructure facilities, establishment of judicial and financial institutions and their enforcement, and national security to name some of the more prominent. Economists often have labeled the economically productive capital so amassed as “Social Capital.” However, sociologists and political scientists, among others, could be confused by this usage, as “social capital” has become for them closely associated with Robert Putnam’s usage (following James Coleman) – namely a system of norms and expectations that enable people to work together, or that improve societal functioning, such as norms of reciprocity, truth telling, and trust.
6 Cobb-Douglas (CD) production is not as much of a special case as one might think. For the analysis of macro-production some overall function must be selected for tractability. This points to a choice of a constant returns to scale (CRS) or linear such homogeneous production function, since otherwise either “excess returns” to productive factors over and above their marginal products or sub-marginal returns then must be explained. In other words, non-CRS production simply introduces a need for further accounting of national accounts. There are plenty of CRS production functions other than Cobb-Douglas, but none of the others with its centrality, tractability, and familiarity. This paper shows that other CRS but non-CD choices imply an inefficiency in the tax-investment behavior of government tax/investment decisions, where CD production allows the efficiency loss to be avoided.
Decyzje 24_2015v2.indd 127Decyzje 24_2015v2.indd 127 2015-12-23 13:55:312015-12-23 13:55:31

128
INVESMENT IN PUBLIC CAPITAL, DISTRIBUTION, AND GOVERNANCE
DECYZJE no 24/2015DOI: 10.7206/DEC.1733-0092.64
In that conception “social capital” is a public good, but it is not typically produced by government investment nor more generally associated with capital expenditure and thus not rival with redistribution. It also is not concrete. For this reasonI have omitted that term from the title, and where used in the text it does not refer to “social capital” as conceived by Coleman.7 Moreover, since our analysis has no explicit time dimension, and therefore, follows the “comparative static” scenario typical of introductory economics, there is no distinction between investment (which is a flow) and “capital” (which is an accumulated stock). So I use investment and capital more or less interchangeably.
Governance The government considered here can reflect a unified monolithic king who
“owns” his economy. He taxes and spends (within limits) to suit his own interest, and he maintains this power with no expenditures identified as necessary to maintain his position, indefinitely. There is no treatment of the internal incentives, conflicts and compromises within the government. If the king has no separate interests of his own, he may be “benevolent,” and represent solely the aggregate interest of the people, assumed to be unitary and monolithic. With all internal issues regarding distribution having been settled, this “consensual society” has the same incentives and goals as a perfectly benevolent dictator. Lastly, in the later stages of the paper, the government may represent the interests a subset of the population. How any particular subset might come to command the instruments and powers of governance is left to be addressed another time. Here again, however such a government might be composed, as under the first two “pure” forms, questions of distribution within the governing structure are omitted.
RedistributionThe range and variation of issues under the rubric distribution is vast. Distribution
or redistribution among whom? By what criteria? How decided, enforced, and regulated? Current practices may often involve a parliament, deciding by vote, and as a response to diverse demands and pressures. The distribution addressed in our model however is vastly simpler than such real world examples, yet in its way logically prior to any of them. The only distribution treated here is from the producing economy – the citizen-workers – to the government. This redistribution is implemented by a tax, and a very simple tax at that like a flat rate income tax. The productive economy and its worker/consumers pay the tax with no discrimination among them, as they are taken to be a unitary monolith. The government, whether the creature-client of a (1) 7 I thank a referee for helping with this.
Decyzje 24_2015v2.indd 128Decyzje 24_2015v2.indd 128 2015-12-23 13:55:312015-12-23 13:55:31
129
Martin C. McGuire
DECYZJE no 24/2015 DOI: 10.7206/DEC.1733-0092.64
selfish autocrat or (2) a benevolent dictator, or (3) a unified oligarchy of a fraction of the people sees its interest as congruent with the net benefit that accrues to its client.
Thus the redistribution afforded by the tax and spend options of the government resembles a tribute to the king, or in the case of benevolent dictatorship a “tribute” from the citizenry to itself. One of the insights of this paper is to demonstrate that viewed from this perspective, autocracy and ideal democracy are merely end-points along a spectrum of possible modes or styles of governance.
3. CONTEXT, NOTATION, AND CONSUMER BEHAVIOR
Context: The GameThe economic model developed here is in the economic tradition of comparative
statics. Thus, as in any such analysis, this describes steady state equilibria or tendencies in our political economy. The dynamics of how such equilibria might be achieved (or avoided, or blocked for that matter) – while highly relevant and interesting – are not discussed.
The game proposed between the citizenry as workers/consumers and the collective authority or government is, accordingly, rather simplified (considering the alternatives offered by modern game theory). The unitary, monolithic government – whether it is benevolent dictator who truly represents the welfare of the citizens, or a selfish and greedy autocrat who acts to maximize his own benefit – moves first. It has accurate information as to how the citizenry will respond to his tax and public good provision decisions, and he uses this information when deciding how to tax and invest in his realm. Moving second, the citizens – themselves acting as a unitary monolith also – maximize welfare given the parameters announced by the government. End of game! Note that fascinating issues like the length of time over which the government maximizes, and whether the details of the costs of tax collection and enforcement of the regimes power influence its choices and its durability are left aside as well.
NotationThere is a single, numeraire consumption good, Y, the output of private production.
Y = National Product; price = 1
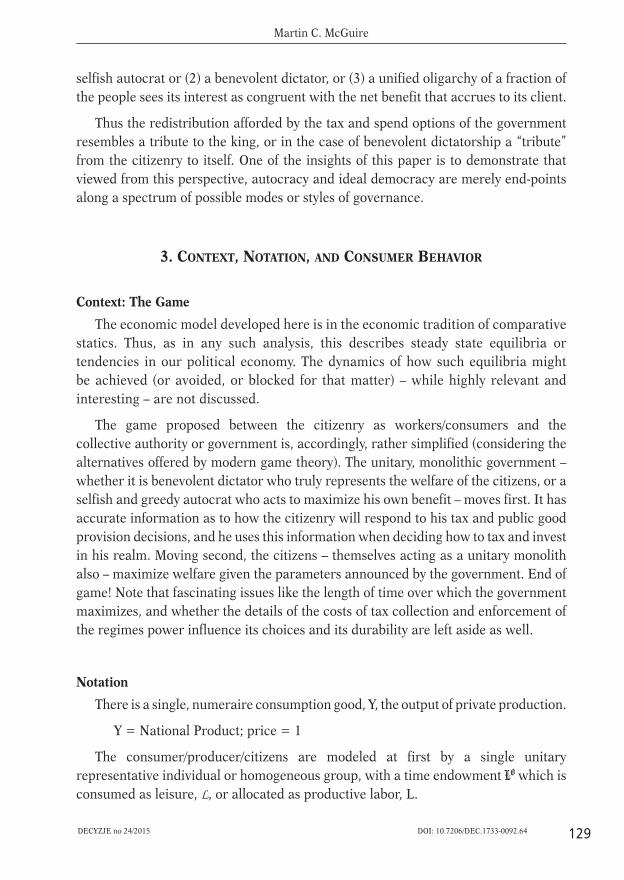
The consumer/producer/citizens are modeled at first by a single unitary representative individual or homogeneous group, with a time endowment LO which is consumed as leisure, L, or allocated as productive labor, L.
Decyzje 24_2015v2.indd 129Decyzje 24_2015v2.indd 129 2015-12-23 13:55:312015-12-23 13:55:31

130
INVESMENT IN PUBLIC CAPITAL, DISTRIBUTION, AND GOVERNANCE
DECYZJE no 24/2015DOI: 10.7206/DEC.1733-0092.64
L = Labor Supply = Time Endowment – Leisure = LO – L
The public good factor input, G, can be transformed from Y at constant average cost of unity.
G = Public Good Factor Input; price = 1
Production is Cobb-Douglas (See footnote 7.)
Y(L, G) = LaG1 – a
YG, YL = Marginal products of G, L
The government or “ruling interest” finances G from tax collections, which may be either lump sum or constant proportional linear income taxes. Lump sum taxation is used here strictly for a heuristic comparison.
T = lump sum taxes, under lump sum taxation.
t = Average/Marginal Income tax rate under linear income taxation.
C = Citizen Consumption after taxes, price of C = 1
C = (1 – t)Y(L, G) – T: either T or t must be zero.
U = U[C, L] : Citizen Utility: maximized for any given T or t, and G.
UC > 0, UL = – UL < 0 : Marginal utility of consumption, labor.
The government chooses values of t or T depending on the case, and of G, to meet its objective, which we shall specify presently. Before doing so, however, we derive two relationships, which will be used throughout the analysis. These are (1) the citizen’s response function to the government tax and public good supply decisions, and (2) the overall society’s Consumption Feasibility Frontier (CFF) as seen by an omniscient planner.
Citizens’ Response: Labor SupplyThe citizens accept government’s choices of G and t (or T) and maximize utility.
Their variable of choice is labor supply. Thus if taxation is lump sum, the citizens’ first order maximization condition becomes:
Max U[C, L] s.t. C = Y(L, G) – T Þ YLUC[C, L] + UL = 0 (1) L
On the other hand, under linear income taxation their FOC becomes:
Max U[C, L] s.t. C = (1 – t)Y(L, G) Þ (1 – t)YLUC[C, L] + UL = 0 (2) L
Decyzje 24_2015v2.indd 130Decyzje 24_2015v2.indd 130 2015-12-23 13:55:312015-12-23 13:55:31
131
Martin C. McGuire
DECYZJE no 24/2015 DOI: 10.7206/DEC.1733-0092.64
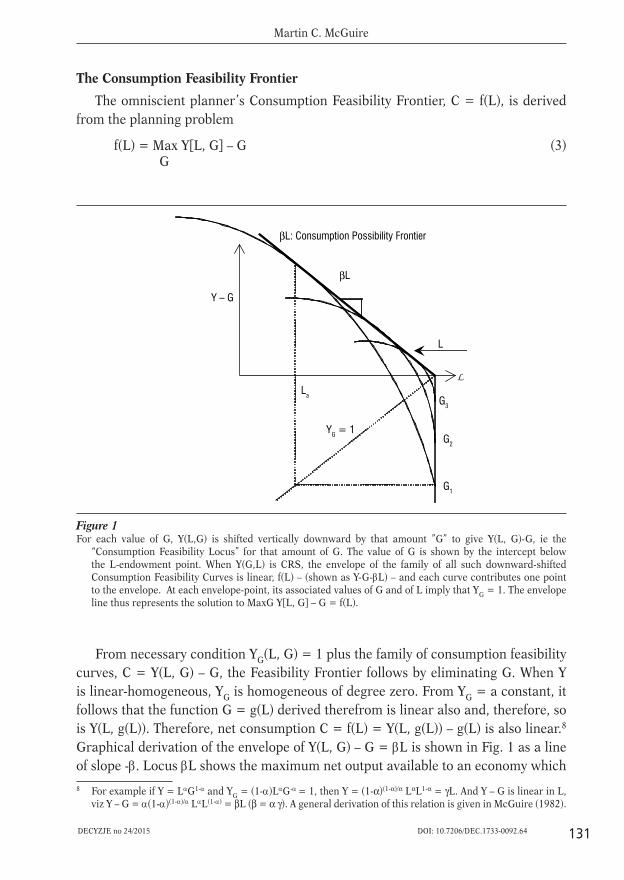
The Consumption Feasibility FrontierThe omniscient planner’s Consumption Feasibility Frontier, C = f(L), is derived
from the planning problem
f(L) = Max Y[L, G] – G (3) G
L
Y – G
G3
G2
G1
La
βL: Consumption Possibility Frontier
L
YG = 1
βL
Figure 1For each value of G, Y(L,G) is shifted vertically downward by that amount ”G” to give Y(L, G)-G, ie the
“Consumption Feasibility Locus” for that amount of G. The value of G is shown by the intercept below the L-endowment point. When Y(G,L) is CRS, the envelope of the family of all such downward-shifted Consumption Feasibility Curves is linear, f(L) – (shown as Y-G-L) – and each curve contributes one point to the envelope. At each envelope-point, its associated values of G and of L imply that YG = 1. The envelope line thus represents the solution to MaxG Y[L, G] – G = f(L).
From necessary condition YG(L, G) = 1 plus the family of consumption feasibility curves, C = Y(L, G) – G, the Feasibility Frontier follows by eliminating G. When Y is linear-homogeneous, YG is homogeneous of degree zero. From YG = a constant, it follows that the function G = g(L) derived therefrom is linear also and, therefore, so is Y(L, g(L)). Therefore, net consumption C = f(L) = Y(L, g(L)) – g(L) is also linear.8 Graphical derivation of the envelope of Y(L, G) – G = L is shown in Fig. 1 as a line of slope -. Locus L shows the maximum net output available to an economy which 8 For example if Y = LG1- and YG = (1-)LG- = 1, then Y = (1-α)(1-α)/α LαL1-α = γL. And Y – G is linear in L,
viz Y – G = (1-)(1-)/ LL(1-) = βL (β = α γ). A general derivation of this relation is given in McGuire (1982).
Decyzje 24_2015v2.indd 131Decyzje 24_2015v2.indd 131 2015-12-23 13:55:312015-12-23 13:55:31
132
INVESMENT IN PUBLIC CAPITAL, DISTRIBUTION, AND GOVERNANCE
DECYZJE no 24/2015DOI: 10.7206/DEC.1733-0092.64
has optimized the supply of G (price of 1) for every value of L. Let G take on various parametric values indexed by the label “k.” Then for each value of k, a consumption feasibility curve exists – i.e. the curve Y(L, Gk) – Gk – and this curve contributes one point (say point “k”) to the envelope Feasibility Frontier, which we label L.
4. LUMP SUM TAXATION: UTOPIA VS. AUTOCRACY
We now can use these analytics to compare a utopian consensual system of government versus a perfectly autocratic one. Both forms represent polar cases; neither is realistic, but they do establish extremes of best and worst which a system of governance can produce when the state can tax in a lump sum manner. An assumption of lump-sum taxation is also unrealistic, as it implies perfect costless information and an ability to tax without creating any excess burden at all, but it forms a heuristic basis for the analysis of income effects. The utopian consensual society – in which all redistribution questions have been settled and taxes are, therefore, levied solely for productive purposes – desires to:
Max U(C, L) s.t. C = Y(G, L) – T, G = T (4)
In the case where Y = LαG1-α, the “Consensus Government,” or benevolent dictator chooses G, and citizens choose L. The outcome of the citizens’ choice is:
UCYL + UL = 0; or YL = αY/L = -UL/UC (5)
The outcome of the Government’s choice is:
YG = (1-α)Y/G = 1 (6)
Therefore, to summarize the optimum with lump-sum taxation and a perfectly benevolent government:
MRTS = (YL/YG) = MRS = (UL/UC) = [α/(1-α)]G/L = α(1-α)(1-α)/α = β (7)
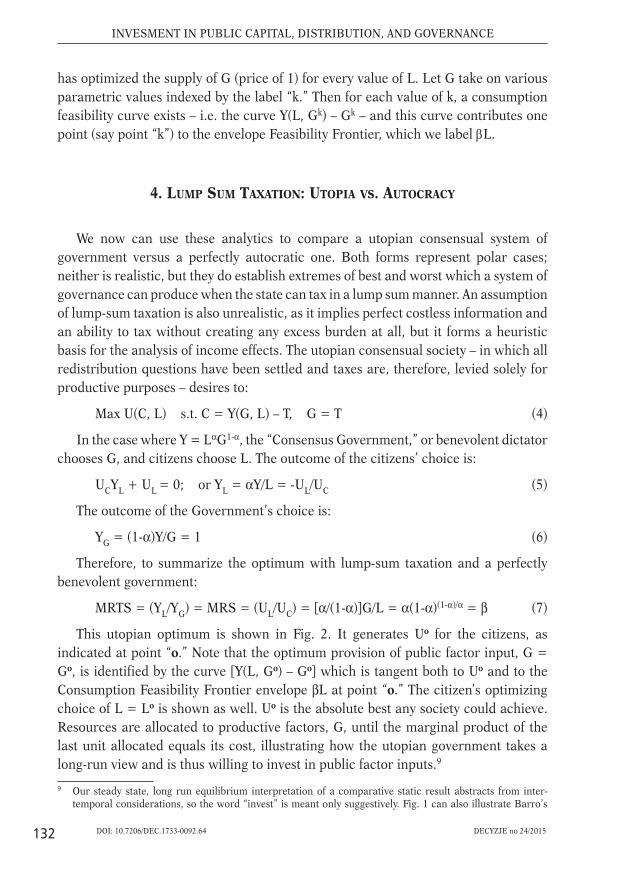
This utopian optimum is shown in Fig. 2. It generates Uo for the citizens, as indicated at point “o.” Note that the optimum provision of public factor input, G = Go, is identified by the curve [Y(L, Go) – Go] which is tangent both to Uo and to the Consumption Feasibility Frontier envelope βL at point “o.” The citizen’s optimizing choice of L = Lo is shown as well. Uo is the absolute best any society could achieve. Resources are allocated to productive factors, G, until the marginal product of the last unit allocated equals its cost, illustrating how the utopian government takes a long-run view and is thus willing to invest in public factor inputs.9
9 Our steady state, long run equilibrium interpretation of a comparative static result abstracts from inter-temporal considerations, so the word “invest” is meant only suggestively. Fig. 1 can also illustrate Barro’s
Decyzje 24_2015v2.indd 132Decyzje 24_2015v2.indd 132 2015-12-23 13:55:312015-12-23 13:55:31
133
Martin C. McGuire
DECYZJE no 24/2015 DOI: 10.7206/DEC.1733-0092.64
L
Y – G
GO
G*
L
YG = 1
LO
βL
OU
U*
R*
L*
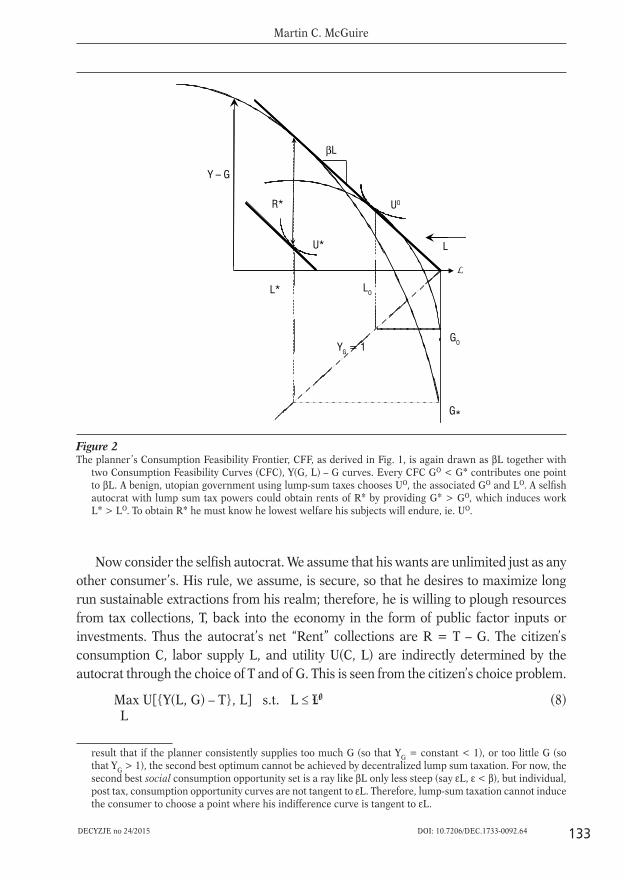
Figure 2The planner’s Consumption Feasibility Frontier, CFF, as derived in Fig. 1, is again drawn as βL together with
two Consumption Feasibility Curves (CFC), Y(G, L) – G curves. Every CFC GO < G* contributes one point to βL. A benign, utopian government using lump-sum taxes chooses UO, the associated GO and LO. A selfi sh autocrat with lump sum tax powers could obtain rents of R* by providing G* > GO, which induces workL* > LO. To obtain R* he must know he lowest welfare his subjects will endure, ie. UO.
Now consider the selfish autocrat. We assume that his wants are unlimited just as any other consumer’s. His rule, we assume, is secure, so that he desires to maximize long run sustainable extractions from his realm; therefore, he is willing to plough resources from tax collections, T, back into the economy in the form of public factor inputs or investments. Thus the autocrat’s net “Rent” collections are R = T – G. The citizen’s consumption C, labor supply L, and utility U(C, L) are indirectly determined by the autocrat through the choice of T and of G. This is seen from the citizen’s choice problem.
Max U[{Y(L, G) – T}, L] s.t. L LO (8) L
result that if the planner consistently supplies too much G (so that YG = constant < 1), or too little G (so that YG > 1), the second best optimum cannot be achieved by decentralized lump sum taxation. For now, the second best social consumption opportunity set is a ray like βL only less steep (say εL, ε < β), but individual, post tax, consumption opportunity curves are not tangent to εL. Therefore, lump-sum taxation cannot induce the consumer to choose a point where his indifference curve is tangent to εL.
Decyzje 24_2015v2.indd 133Decyzje 24_2015v2.indd 133 2015-12-23 13:55:312015-12-23 13:55:31

134
INVESMENT IN PUBLIC CAPITAL, DISTRIBUTION, AND GOVERNANCE
DECYZJE no 24/2015DOI: 10.7206/DEC.1733-0092.64
which yields again UCYL + UL = 0 as in eq (1) or eq (5), and therefore labor supply, L, and consumption, C:
L = h(T, G); C = Y[h(T,G),G] – T (9)
Thus the autocrat, in choosing T and G, effectively chooses the citizen’s utility. How does he determine T? He wants T as large as possible. If we assume a minimum citizen utility exists, and is known by the autocrat U*, below which the autocrat will lose power; then the autocrat’s problem becomes:
Max [T – G] + λ[U* – U{[Y{h(T,G),G} – T], h(T,G)}] (10)
with necessary first order conditions:
1 – λ{ hT[UCYL + UL] – UC} = 0 Þ 1/λ = - UC (11)
and
-1 – λ{hG[UCYL + UL] + UCYG} = 0 Þ 1/λ = -UCYG Þ YG = 1 (12)
The first, Eq. (11), shows that taxation proceeds until the implicit relative weight of the citizens’ to the autocrat’s utility equals λ. Eq. (12) confirms that autocrats who can tax in a lump sum manner impose no excess burden and, therefore, invest until the marginal product of the public factor inputs YG just equals its cost (which is unity).
Figure 2 shows this U*-optimum of the selfish autocrat, also comparing it to theUo-optimum of the utopian consensus. The Uo outcome is simply an autocratic outcome with zero Rent. The after tax consumption opportunity set of the society is shown to be equal to the utopian constraint shifted in by the amount of net rent collections. Fig. 2 also compares the citizen’s choice of L and the government’s choice of G under the two situations. It makes clear, unless leisure is an inferior good, rent collections by the autocrat cause people to work more (a result foreseen in earlier work of Brennan and Buchanan, (1977)), and therefore these provide the autocratic government reason to supply more of the public good. In Figure 2, G* necessarily exceeds Go, and L* necessarily exceeds Lo only provided leisure is non-inferior. With more L supplied by the populace, the productivity of public investments is greater and, at an efficient optimum, more G will be provided. (For confirmation of the relative size of G* and Go, refer again to Fig. 1.) Thus, a tax-price discriminating or multi part taxing autocracy10 has an inherent incentive to provide more G, on an efficiency basis, than would a utopian society. As we shall see this perfectly ordinary interdependence between productivity of factors extends to analysis under less hypothetical taxation systems than lump sum.
10 Olson later proposed a similar multi-part taxation incentive as part of the explanation for the high investment/growth performance of the Soviet economy in the mid 20th Century.
Decyzje 24_2015v2.indd 134Decyzje 24_2015v2.indd 134 2015-12-23 13:55:312015-12-23 13:55:31
135
Martin C. McGuire
DECYZJE no 24/2015 DOI: 10.7206/DEC.1733-0092.64
5. PROPORTIONAL INCOME TAXATION, THE CONSENSUAL SOCIETY,
AND THE CRUCIAL IMPORTANCE OF COBB-DOUGLAS PRODUCTION
Now we introduce more realistic taxation and we will see that in some ways adding scale and income effects can reverse expected results, raising public capital provision despite the increase in deadweight costs occasioned by taxes. Here proportional income tax rather than a lump sum tax generates the revenues for the public investments, G, as well as redistributions from the powerless to the powerful. Public goods and all revenues for redistribution, if any, are financed by the collections tY(L,G).
With C-D production, analytics are dramatically simplified. Citizens’ consumption opportunities are:
C = (1-t)G(1-α)Lα = XLα (13)
using a notation that shows L as functionally independent of (t, G). The citizen’s response to given tax rate and public good supply – t and G – then becomes:
-(UL/UC) = [α(1-t)Y/L = (1-t)G(1-α)αL(α-1) (14)
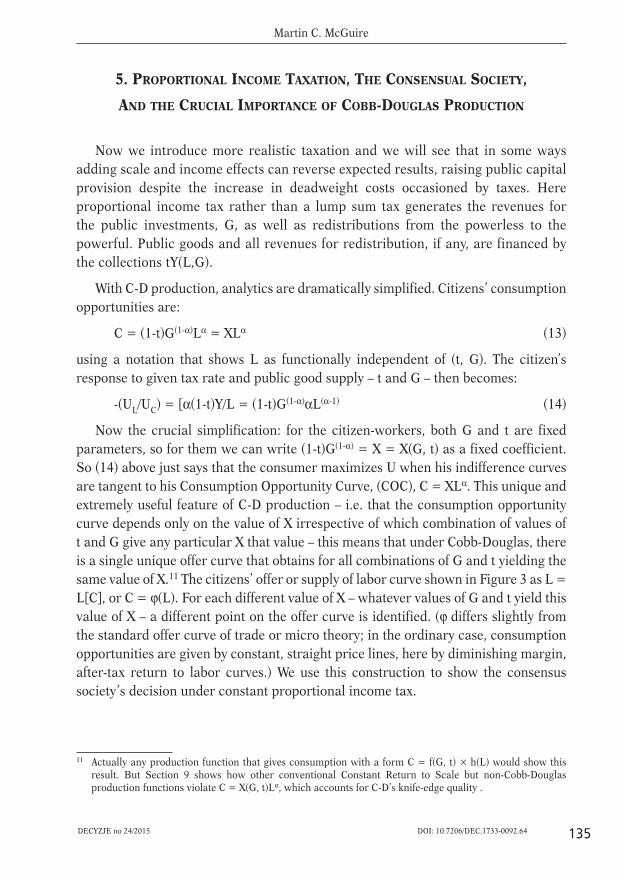
Now the crucial simplification: for the citizen-workers, both G and t are fixed parameters, so for them we can write (1-t)G(1-α) = X = X(G, t) as a fixed coefficient. So (14) above just says that the consumer maximizes U when his indifference curves are tangent to his Consumption Opportunity Curve, (COC), C = XLα. This unique and extremely useful feature of C-D production – i.e. that the consumption opportunity curve depends only on the value of X irrespective of which combination of values of t and G give any particular X that value – this means that under Cobb-Douglas, there is a single unique offer curve that obtains for all combinations of G and t yielding the same value of X.11 The citizens’ offer or supply of labor curve shown in Figure 3 as L = L[C], or C = ϕ(L). For each different value of X – whatever values of G and t yield this value of X – a different point on the offer curve is identified. (ϕ differs slightly from the standard offer curve of trade or micro theory; in the ordinary case, consumption opportunities are given by constant, straight price lines, here by diminishing margin, after-tax return to labor curves.) We use this construction to show the consensus society’s decision under constant proportional income tax.
11 Actually any production function that gives consumption with a form C = f(G, t) × h(L) would show this result. But Section 9 shows how other conventional Constant Return to Scale but non-Cobb-Douglas production functions violate C = X(G, t)Lα, which accounts for C-D’s knife-edge quality .
Decyzje 24_2015v2.indd 135Decyzje 24_2015v2.indd 135 2015-12-23 13:55:312015-12-23 13:55:31
136
INVESMENT IN PUBLIC CAPITAL, DISTRIBUTION, AND GOVERNANCE
DECYZJE no 24/2015DOI: 10.7206/DEC.1733-0092.64
C
L
(L): offer curve
U2
U1
U0
L
X2Lα
XOL
Figure 3 Each value of X(G, t) generates a Consumption Opportunity Curve, XLα. Consumer maximization for that value
of X gives choice at a tangency. The locus of these tangencies is the consumer’s offer curve of labor for consumption.
C
L = Leisure
G**
(1-t2)Y(G**, L)
CFC for G** = Y(G**, L) – G**
(1-tO)Y
L
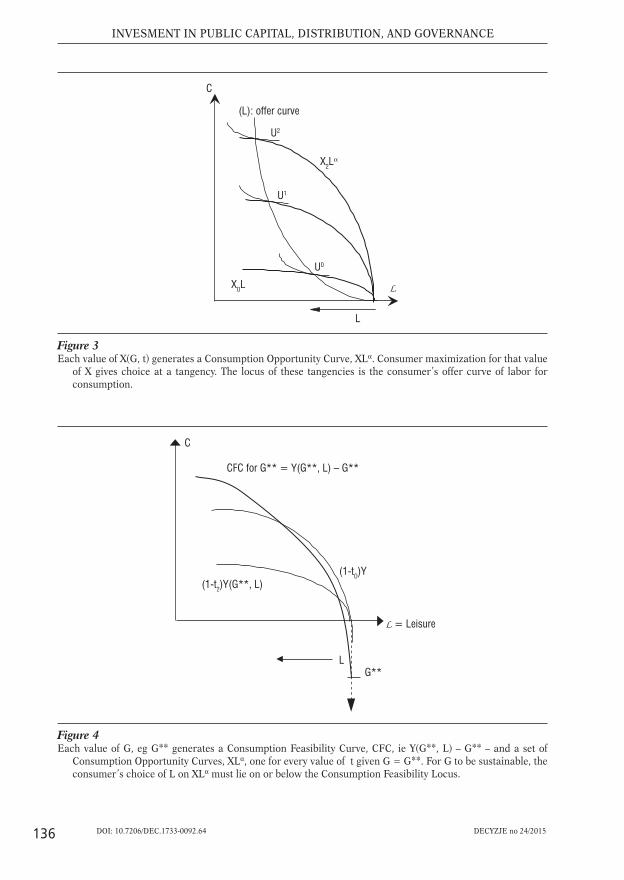
Figure 4 Each value of G, eg G** generates a Consumption Feasibility Curve, CFC, ie Y(G**, L) – G** – and a set of
Consumption Opportunity Curves, XLα, one for every value of t given G = G**. For G to be sustainable, the consumer’s choice of L on XLα must lie on or below the Consumption Feasibility Locus.
Decyzje 24_2015v2.indd 136Decyzje 24_2015v2.indd 136 2015-12-23 13:55:322015-12-23 13:55:32
137
Martin C. McGuire
DECYZJE no 24/2015 DOI: 10.7206/DEC.1733-0092.64
The consensual government’s problem is to maximize citizens’ utility subject to the following conditions:
(1) The citizens are on their offer curve; i.e. L = L[C] or C = ϕ(L)
(2) The income tax pays for G; ie G tY(L,G), or (1-t)Y Y(L,G) – G.
We have already shown the offer curve constraint in Figure 3. Figure 4 shows the budget constraint with one [Y – G] curve for given G = G**, and all the various combinations of (1-t)Y ≡ X(G**, t) ⋅ Lα for that same value G** but different values of t.12 If the government’s choice of G** and t and the citizens’ choice of L put the society on or below [Y(L, G**) – G**] then the tax constraint is satisfied. Using this information, we write the consensus society’s optimization problem therefore13 as:
Max U[C, L]: s.t. C = (1-t)Y(L, G); G = tY(L,G); (1-t){UC[C, L]}YL + UL = 0 C, L, t, G (15)
The necessary conditions for this maximum will imply optimal G and optimal t.
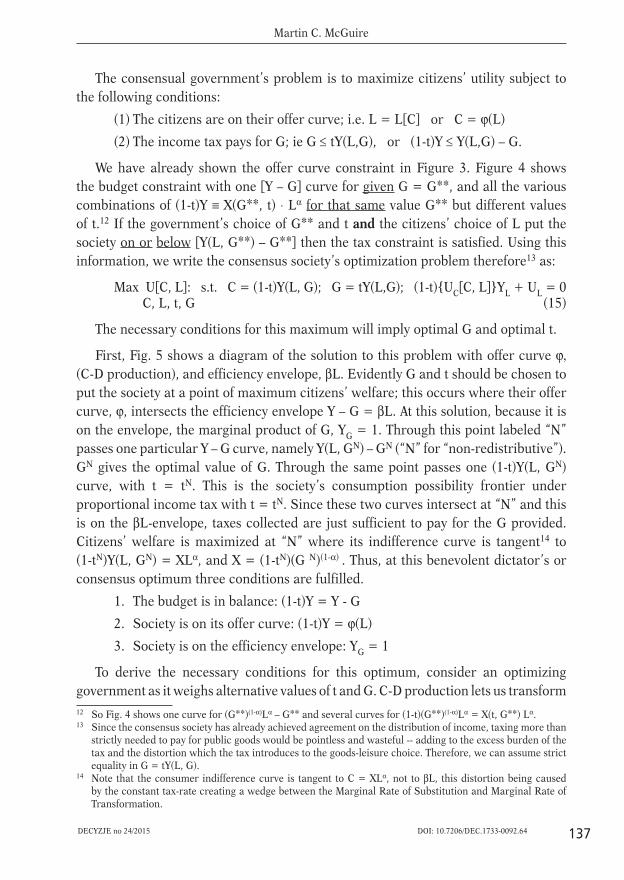
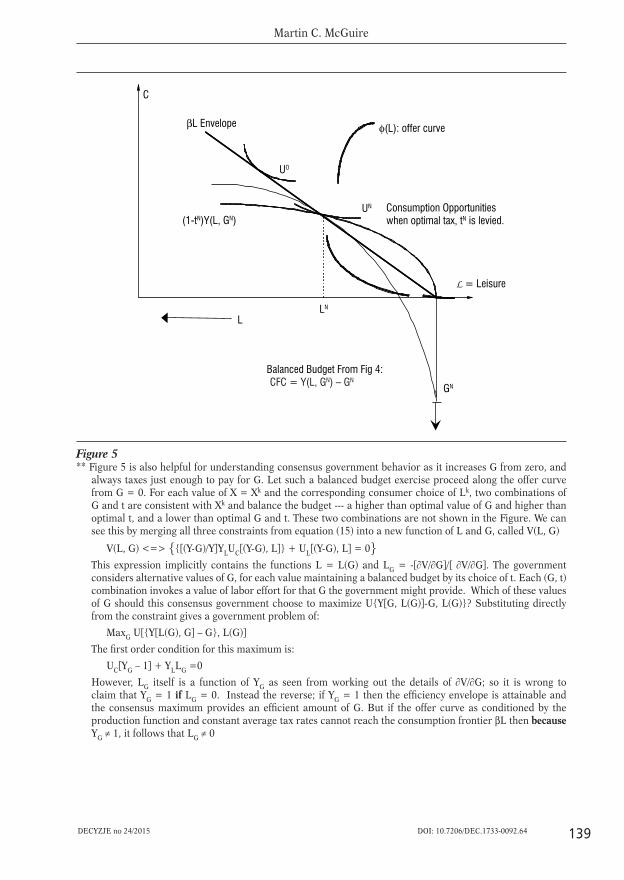
First, Fig. 5 shows a diagram of the solution to this problem with offer curve ϕ, (C-D production), and efficiency envelope, βL. Evidently G and t should be chosen to put the society at a point of maximum citizens’ welfare; this occurs where their offer curve, ϕ, intersects the efficiency envelope Y – G = βL. At this solution, because it is on the envelope, the marginal product of G, YG = 1. Through this point labeled “N” passes one particular Y – G curve, namely Y(L, GN) – GN (“N” for “non-redistributive”).GN gives the optimal value of G. Through the same point passes one (1-t)Y(L, GN) curve, with t = tN. This is the society’s consumption possibility frontier under proportional income tax with t = tN. Since these two curves intersect at “N” and this is on the βL-envelope, taxes collected are just sufficient to pay for the G provided. Citizens’ welfare is maximized at “N” where its indifference curve is tangent14 to (1-tN)Y(L, GN) = XLα, and X = (1-tN)(G N)(1-α) . Thus, at this benevolent dictator’s or consensus optimum three conditions are fulfilled.
1. The budget is in balance: (1-t)Y = Y - G
2. Society is on its offer curve: (1-t)Y = ϕ(L)
3. Society is on the efficiency envelope: YG = 1
To derive the necessary conditions for this optimum, consider an optimizing government as it weighs alternative values of t and G. C-D production lets us transform 12 So Fig. 4 shows one curve for (G**)(1-α)Lα – G** and several curves for (1-t)(G**)(1-α)Lα = X(t, G**) Lα. 13 Since the consensus society has already achieved agreement on the distribution of income, taxing more than
strictly needed to pay for public goods would be pointless and wasteful -- adding to the excess burden of the tax and the distortion which the tax introduces to the goods-leisure choice. Therefore, we can assume strict equality in G = tY(L, G).
14 Note that the consumer indifference curve is tangent to C = XLα, not to βL, this distortion being caused by the constant tax-rate creating a wedge between the Marginal Rate of Substitution and Marginal Rate of Transformation.
Decyzje 24_2015v2.indd 137Decyzje 24_2015v2.indd 137 2015-12-23 13:55:322015-12-23 13:55:32
138
INVESMENT IN PUBLIC CAPITAL, DISTRIBUTION, AND GOVERNANCE
DECYZJE no 24/2015DOI: 10.7206/DEC.1733-0092.64
variables using X ≡ (1-t)G(1-α) or t = [1 – (X/G(1-α) )]. The consumer’s maximizing choice of L then gives the offer curve in parametric form as:
L = L(X); and C = XLα = X[L(X)]α (16a)
The government’s budget constraint, G= tY, is now written as:
G=[1 – (X/G (1-α))][L(X)α G(1-α)] = [G(1-α) – X]L(X)α. (16b)
Therefore, the consensus government’s maximization problem becomes:
Max U[XL(X)α, L(X)] + λ{G – [G(1-α) – X]L(X)α} (17) X,G
The necessary condition for this maximum from differentiating with respect to G is15:
-λ[1 – (1-α)Lα G 1-α)] = 0 (18)
This FOC entails YG = 1 proving – consistent with Barro (1990) – that, in this case, the optimum is on the efficiency envelope so that Y – G = βL.16 At this optimum,G/Y = t = 1 – α.
Now we are in a position to compare the outcomes for the consensus society under the alternative tax regimes of lump sum taxation, and constant proportional income tax. Fig. 5 does this for us. We can see from the diagram that, compared to lump sum taxation, under proportional taxation:
1. Society reaches a lower level of welfare; UN < Uo.
2. Income taxation distorts the supply of labor below its lump sum utopian optimum; ie. LN < Lo.
3. Income taxation produces a deadweight loss or excess burden, Uo – UN.
15 At each point on this offer curve – UL/UC = αXL(α – 1)LX, where LX = dL(X)/dX. Differentiating with respect to X gives:
UC[Lα + αXL(α – 1)LX ] + ULLX – λ[αL(α – 1) LX(G(1 – α) – X) + Lα ] = 0 16 However, absent C-D production, the simplifi cation of isolating X that this transform permits is lost. Only
with this special assumption, does the fi rst order condition require effi ciency in provision of G (Karras, 1996). In general the consensus government’s or benevolent dictator’s maximization problem must be writ-ten out:
Max U(C, L) + λ1[G – tY(L, G)] + λ2[C – (1-t)Y(L, G)] + λ3[(1-t)UC(C,L)YL + UL] C, L, G, t Differentiating, simplifying, and collecting terms now leads to the new following crucial condition:
λ1(1-YG)/(1-t) + (λ1 − λ2)[YG – (YYLG/YL)] = 0: λ1 λ2
The inequality follows from assuming t > 0. Therefore, {YGYL = YYLG} Û {YG = 1}. Note that YGYL = YYLG is defi nitionally true of C-D functions and may be true locally for other CRS functions. Therefore, production need not be globally C-D for effi ciency in provision of G to obtain at the optimum. But if production is CRS and not Cobb-Douglas then {YGYL YYLG} and, therefore, {YG 1}. So a non-CD production function means that the optimum cannot lie on the effi ciency envelope.
Decyzje 24_2015v2.indd 138Decyzje 24_2015v2.indd 138 2015-12-23 13:55:322015-12-23 13:55:32
139
Martin C. McGuire
DECYZJE no 24/2015 DOI: 10.7206/DEC.1733-0092.64
GN
UO
UN
LN
βL Envelope
L = Leisure
(1-tN)Y(L, GN)
L
Consumption Opportunitieswhen optimal tax, tN is levied.
C
Balanced Budget From Fig 4:CFC = Y(L, GN) – GN
Figure 5 ** Figure 5 is also helpful for understanding consensus government behavior as it increases G from zero, and
always taxes just enough to pay for G. Let such a balanced budget exercise proceed along the offer curve from G = 0. For each value of X = Xk and the corresponding consumer choice of Lk, two combinations of G and t are consistent with Xk and balance the budget --- a higher than optimal value of G and higher than optimal t, and a lower than optimal G and t. These two combinations are not shown in the Figure. We can see this by merging all three constraints from equation (15) into a new function of L and G, called V(L, G)
V(L, G) <=> {{[(Y-G)/Y]YLUC[(Y-G), L]} + UL[(Y-G), L] = 0} This expression implicitly contains the functions L = L(G) and LG = -[V/G]/[ V/G]. The government
considers alternative values of G, for each value maintaining a balanced budget by its choice of t. Each (G, t) combination invokes a value of labor effort for that G the government might provide. Which of these values of G should this consensus government choose to maximize U{Y[G, L(G)]-G, L(G)}? Substituting directly from the constraint gives a government problem of:
MaxG U[{Y[L(G), G] – G}, L(G)] The fi rst order condition for this maximum is:
UC[YG – 1] + YLLG =0 However, LG itself is a function of YG as seen from working out the details of V/G; so it is wrong to
claim that YG = 1 if LG = 0. Instead the reverse; if YG = 1 then the effi ciency envelope is attainable and the consensus maximum provides an effi cient amount of G. But if the offer curve as conditioned by the production function and constant average tax rates cannot reach the consumption frontier βL then because YG 1, it follows that LG 0
Decyzje 24_2015v2.indd 139Decyzje 24_2015v2.indd 139 2015-12-23 13:55:322015-12-23 13:55:32

140
INVESMENT IN PUBLIC CAPITAL, DISTRIBUTION, AND GOVERNANCE
DECYZJE no 24/2015DOI: 10.7206/DEC.1733-0092.64
4. Income taxation implies less investment or provision of public goods for the economy than does lump sum taxation; GN < Go.
5. The supply of G = GN is nevertheless efficient in the sense that at this configuration YG = 1.
This outcome refutes Barro: even though there is no marginal inefficiency in provision of G (i.e. YG = 1) there still is deadweight loss due to the distortion on the margin of work effort and this causes sub-optimal provision of G (compared to the lump sum utopian result). So far, introduction of income effects, absent from the M-O analysis, confirms their result. But as we will see next, this is no longer true when we permit the government acting for an autocrat to represent his interests in opposition to those of its citizens.
7. OUTCOMES UNDER PROPORTIONAL INCOME TAXATION:
THE SELFISH AUTOCRAT THE AUTOCRAT’S ALLOCATION PROBLEM:
A dictatorial ruler obtains the resources to satisfy his objectives solely from taxes. He does not sell his labor or any other services in the market. Because his wants are unlimited, he redistributes the maximum sustainable absolute amount to himself without regard for the welfare of his subjects. This gross surplus which goes to the selfish autocrat is tY(L,G). The same self-interest that leads an autocrat to maximize his extractions from the society also motivates a concern for the productivity of his society. First, his monopoly over tax collection induces him to limit those taxes. Second, the autocrat will provide public goods because doing so increases productivity in his domain and, therefore. his tax collections. Thus, tY(L,G) – G > 0 gives the selfish autocrat’s surplus net of his payments for public goods. These conclusions follow from postulating that the autocrat solves either of these equivalent maximization problems to find his optimum Rent, R = Y – C – G:
Max Y(L,G) – C – G: s.t. C = (1-t)Y(L,G) and (1-t) UCYL + UL = 0 (19a)
G, t
or
Max tY(L,G) – G: s.t. C = (1-t)Y(L,G) and (1-t) UCYL + UL = 0 (19b)
G, t
The autocrat must choose both t and G to obtain his optimum. Since provision of the public good, G, affects the level of income, it also affects tax receipts. The ruler pockets all tax revenues beyond those he spends on G. Thus, for any value of G, he wants to obtain as much product as possible for his treasury.17 To achieve
Decyzje 24_2015v2.indd 140Decyzje 24_2015v2.indd 140 2015-12-23 13:55:322015-12-23 13:55:32
141
Martin C. McGuire
DECYZJE no 24/2015 DOI: 10.7206/DEC.1733-0092.64
this he must consider the effects of t, both on his share of income, and on the level of that income via its influence on L. That is, the autocrat’s tax rate determines his share of any increase in income from the provision of more public goods, but it also determines indirectly the productivity of those public goods because that tax rate influences the amount of cooperating factors of production, L, chosen by the autocrat’s subjects in the private sector.17
GA
GA
O
ve
vo
C
L
R
LA
(1-tA)Y(L, GA)
βL
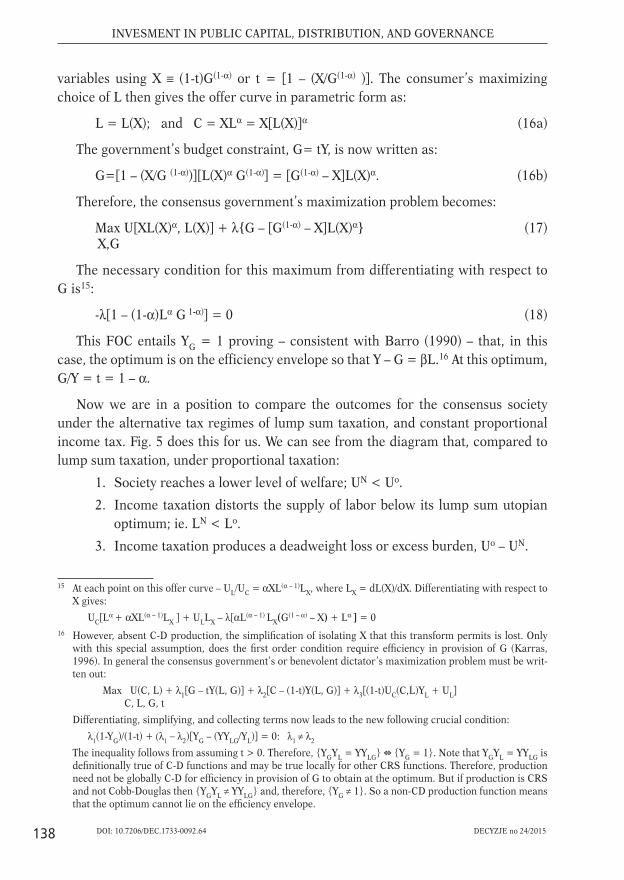
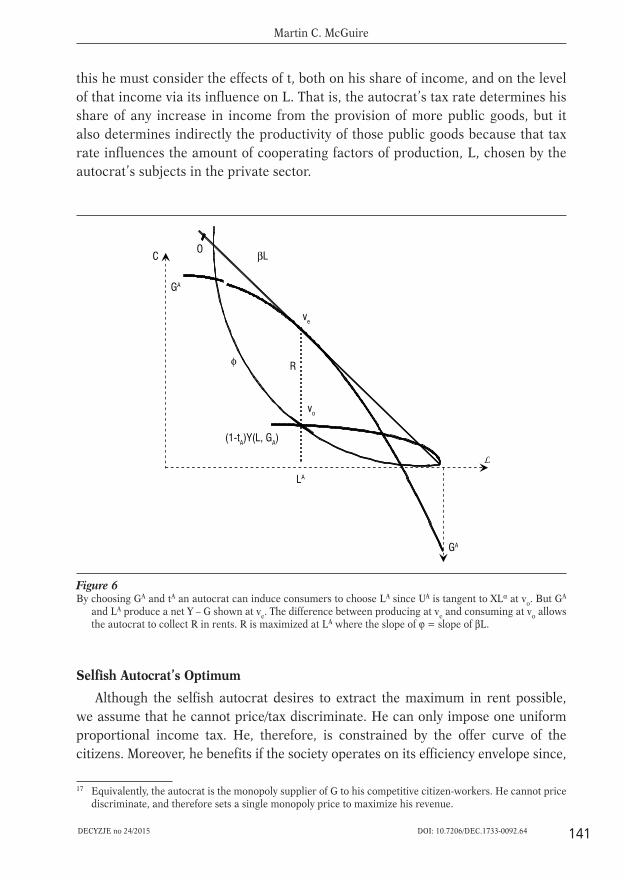
Figure 6 By choosing GA and tA an autocrat can induce consumers to choose LA since UA is tangent to XLα at vo. But GA
and LA produce a net Y – G shown at ve. The difference between producing at ve and consuming at vo allows the autocrat to collect R in rents. R is maximized at LA where the slope of ϕ = slope of βL.
Selfish Autocrat’s OptimumAlthough the selfish autocrat desires to extract the maximum in rent possible,
we assume that he cannot price/tax discriminate. He can only impose one uniform proportional income tax. He, therefore, is constrained by the offer curve of the citizens. Moreover, he benefits if the society operates on its efficiency envelope since,
17 Equivalently, the autocrat is the monopoly supplier of G to his competitive citizen-workers. He cannot price discriminate, and therefore sets a single monopoly price to maximize his revenue.
Decyzje 24_2015v2.indd 141Decyzje 24_2015v2.indd 141 2015-12-23 13:55:322015-12-23 13:55:32

142
INVESMENT IN PUBLIC CAPITAL, DISTRIBUTION, AND GOVERNANCE
DECYZJE no 24/2015DOI: 10.7206/DEC.1733-0092.64
ceteris paribus, he gets all the efficiency gains.18 A graphic solution to the selfish autocrat’s optimum problem is shown in Figure 6. He chooses values of t and of G where the slope of the offer curve, designated OL, equals the slope of the efficiency envelope – β. At this point, (ve on the efficiency envelope, and vo on the offer curve), the distance between C = ϕ(L) and βL is a maximum. This distance represents rents under the assumed constraints. Figure 6 also shows that the autocrat chooses GA such that YG = 1 – at the value of L = LA which obtains at his optimum point on ϕ(L). And he chooses a value of t = tA so that X(GA, tA) just induces LA. Note also that the citizens’ consumption possibility curve (1-t A)Y(GA, L) = X(tA, G A)Lα is below the curve Y(GA, L) – GA which means that more than enough tax is collected to pay for GA. The surplus is labeled “R.” Figure 6 also compares the selfish autocrat’s outcome with the utopian and the consensual outcomes. In the case illustrated in the diagram, GA < GN < GO (although the curves for GN, and GO have been suppressed). So the autocrat supplies less G than the consensus society and still less than a Utopia with lump sum taxes, even though supply of G is “efficient” and YG = 1 in all cases, again a counter proof to Barro’s claims. Moreover, the deadweight loss DWL induced by the selfish autocrat is greater than that induced by the consensual society as would be inferred from by UA < UN < UO. (UA
e, not shown, indicates the welfare which the citizens would enjoy if the autocrat returned all his rents to them --- which amount to the distance ve – vo. This would place consumers at point ve in the diagram.)
Necessary conditions for the autocrat’s maximum confirm this illustration. These again are much simplified in the Cobb-Douglas case by the transformation X = (1-t)G1-α. The autocrat’s problem then becomes:
Max Y – C – G = Max {L(X)}αG1-α – X{L(X)}α – G (20) X,G
Differentiating with respect to G gives:
(1-α)LαG1-α = 1 Þ YG = 1 (21)
and with respect to X gives:
αL(α-1)G(1-α) = [Lα + αXL(α-1)LX]/LX = OL (22)
i.e.
YL = Marg. Prod. of L = Slope of Offer19 Curve = OL.
18 In this case, holding X constant and, therefore, L(X) constant, and, therefore, C(X) = X[L(X)]α constant -- and adjusting t to maintain the constant value of X – the autocrat obtains all the marginal benefi ts of additions to public good provision. And he pays the marginal resource costs of G which equal 1. Therefore he will set YG = 1.
19 Again the consumers’ maximization for any given value of X results in: αXL(α−1) = - UL/UC = MRS. This gives the offer curve in parametric form as in eq (16), with slope as in eq (22). Equation (22) gives the best choice of X, i.e. the rent maximizing choice, for any choice of G, not just the optimal choice. To illustrate, suppose
Decyzje 24_2015v2.indd 142Decyzje 24_2015v2.indd 142 2015-12-23 13:55:322015-12-23 13:55:32

143
Martin C. McGuire
DECYZJE no 24/2015 DOI: 10.7206/DEC.1733-0092.64
As Fig. 6 demonstrates, a sub-optimal choice of G leads the autocrat to induce a sub-optimal L.
Income Effects and the Autocrat’s Provis ion of Public GoodsWith income effects incorporated into the autocrat’s decision environment, the
paradox may arise that an enduring autocrat will invest more in his domain --- that is provide more public goods --- than would a perfectly consensual society. By extracting income from his subjects, a selfish autocrat may cause them to work more than they would under a “perfect” democracy (one with all distribution questions solved, but still obliged to use income taxes to raise the revenues required for public factor inputs). This result is established in Fig. 7 showing a backward bending offer/supply curve and compares the outcomes for a consensus society and for the selfish autocrat. The benevolent government provides less G than does the selfish autocrat.
L
βL
C
LA
GN
GA
ve
vo
Offer Curve
LN
Figure 7 With a back bending offer curve, a rent-maximizing autocrat may induce more L and provide more G than
would a Consensual Democracy.
a non-optimal value of G is chosen such that YG 1. Then the surplus maximizing choice of X (and therefore of t) is the value for which the slope of the offer curve through the point induced by the corresponding consumer choice of L equals the marginal productivity of labor at that value of L and the arbitrary G.
Another approach to the autocrat’s allocation is to re-organize eq. (23) to maximize taxes net of public good costs. Using t =[1 – (X/G)(1-α)] from equation (16) gives the autocrat’s maximand:Max X, G [t(X,G){[L(X)]αG(1-α)} – G].
Then differentiating over G gives YG = 1; and with respect to X gives: tYL LX = Y(L,G)(t/X). The autocrat will increase X until his tax share of the marginal benefi t from the positive inducement which ΔX creates for more work offsets his tax revenue reduction due to the smaller t (t/X < 0) which a higher X entails. At the optimum these two effects just balance.
Decyzje 24_2015v2.indd 143Decyzje 24_2015v2.indd 143 2015-12-23 13:55:322015-12-23 13:55:32
144
INVESMENT IN PUBLIC CAPITAL, DISTRIBUTION, AND GOVERNANCE
DECYZJE no 24/2015DOI: 10.7206/DEC.1733-0092.64
When the offer of labor decreases sufficiently with increases in income/welfare of the citizens (no need for inferior goods here!) a selfish autocrat extracts so much income that he stimulates greater supply of labor. At this greater labor supply, the autocrat is induced to provide more G than would a perfectly benevolent consensus. This completes the refutation of Barro.
8. ECONOMIES GOVERNED BY A SEMI-DEMOCRATIC RULING INTEREST
We have used a consensual, normatively ideal democracy to picture the performance from government that pursues the interests of all its citizens/workers. This is based on assumptions that obviously do not fit real-world societies. We have used an autocratic model to picture the opposite --- the performance of a government pursuing the interests of one individual with a tax monopoly but no productive or working stake in the economy whatsoever. Few if any real governments are controlled by one single, enduring, absolute ruler. Most governments reflect neither unanimous nor zero support and representation, but rather represent some ruling interest, such as a majority, that leaves out part of the society. Accordingly, I now will extend the model to a democratic government that does not embody a social consensus, but rather governs the society solely in the interest of a majority or other ruling interest. Here the rulers both control the government and also earn income in the market economy. The model will show how this more realistic government will resolve the choice between redistribution and provision of public goods, determining both the level of taxation and how much to divide tax proceeds between redistribution to itself and provision of the public good for everyone. As before, the entire national product Y(L,G) is produced in a market economy; since the society’s output depends on the public good G, some of its product will be spent to provide G; the remainder, Y - G, is net income. But now because we assume the ruling group earns market income, its net income comes from two sources: (1) its members’ earnings in the market and (2) any redistribution it extracts from the rest of society.20 We use M-O’s notation to characterize such democracies.
F = the fraction of the labor income (earned in the market) accruing to the redistributive ruling interest; some of the market income will be earned by them and some by the rest of the society, so 0 < F < 1. This ruling interest contains people who produce 100 F% of national product. Its identity and its F are exogenous parameters. If F = 1 everyone is in the ruling interest and a consensual model would be appropriate. In
20 I assume that the ruling majority, like the autocrat, obtains everything that is redistributed.
Decyzje 24_2015v2.indd 144Decyzje 24_2015v2.indd 144 2015-12-23 13:55:322015-12-23 13:55:32
145
Martin C. McGuire
DECYZJE no 24/2015 DOI: 10.7206/DEC.1733-0092.64
an autocracy, where the dictator obtains all of his income through the government, F=0.
D = the fraction of all private inputs to production (ie. all other inputs than public goods, G) owned by the ruling interest. I assume D = F; D appears in the analysis only implicitly.
S = the share of total production that the ruling interest receives from earnings plus redistribution. The “majority’s” share is the sum of these two sources as a percentage of society’s total income.
S = F + (1 – F)t (23)
If F = 0 then S = t, as in the analysis of the selfish autocrat. If F = 1, then S = 1, representing the unanimous consensus.
The Redistributive Democracy’s Allocation ProblemWe now model the choice of t, and of G, and of rents, R, for the redistributive
ruling interest. As we shall see, such a governmental form can be described asa liner combination of the two polar cases we have already analyzed, or a point ona spectrum between autocracy, and a consensus society. If the rulers supply D = F% of the “labor” they earn F% of total product. The gross earnings of the F-majority defined as EF = FY is their gross payment received in return for offer of work. Similarly ENF = (1-F)Y defines the gross earning of the minority. Both EF and ENF are reduced by the tax rate the rulers impose on the entire society, themselves included.21 I use “Cj” (j = F, NF) to indicate post tax earnings.
CF = (1-t)FY: CNF = (1-t)(1-F)Y (24)
It is this net of tax rate-of-reward which decides the offer of labor. It simplifies the technical presentation without prejudicing the outcome to assume identical preferences for everyone. For the same reason we will assume that income transfers do not change the economy wide supply of labor, allowing us to write the economy wide offer curve independent income distribution.22
L = LF + LNF = θ[CF + CNF] = θ[C]: or C = ϕ(L) (25)
21 The tax, which the ruling majority imposes on itself, comes back to it as a transfer and therefore cancels out. Because the ruling majority is assumed to be unable to tax itself differentially from the minority, we assume that the tax which the majority imposes on itself has the same effect on its labor supply as the similar tax has on the minority’s labor supply.
22 In effect this assumes that the marginal utility of consumption or income is constant, so that the transfer of income effected through redistribution does not infl uence the offer of L of either of the exploiters nor of the exploited.
Decyzje 24_2015v2.indd 145Decyzje 24_2015v2.indd 145 2015-12-23 13:55:322015-12-23 13:55:32
146
INVESMENT IN PUBLIC CAPITAL, DISTRIBUTION, AND GOVERNANCE
DECYZJE no 24/2015DOI: 10.7206/DEC.1733-0092.64
Individual offer curves derive from consumer FOCs: (1-t)YLUC[Cj, Lj] + UL [Cj, Lj] = 0, with (j = F, NF). Assuming identical preferences means the aggregate offer curve is a radial expansion of individual curves. This in turn implies:
LF = FL = Fθ[C] : LNF = (1-F)L = (1-F)θ[C] (26)
CF = FC = Fϕ[L] : CNF = (1-F)C = (1-F)ϕ[L]
Again, “Cj” gives a ruling group’s after tax consumption but before receipts of transfers. The ruling majority not only obtains CF for its consumption, but also the excess by which tax revenues exceed its expenditure on G. So the rent received by the majority after payment for public goods is R = Y – CF – CNF – G. Therefore, we write the majority’s total consumption after paying taxes, receiving transfers, and paying for G as:23
CF + R = Y – CNF – G
or (27)
CF + R = FY + t (1-F)Y – G ≡ SY – G
The Redistributive Democracy’s Optimum Thus, the majority’s allocation problem is:
Max U[{Y(L,G)-CNF-G}, FL ] ≡ Max U[{SY(L,G)-G}, FL]:s.t. CF = FC = F ϕ(L)
(28)
With Cobb-Douglas production, again the transformation X ≡ (1-t)G1-α greatly simplifies derivation of necessary conditions.24 The transformed maximization problem becomes:
Max U{[CF + R], FL} = Max U{[{L(X)}αG(1-α) – (1-F)X{L(X)}α – G], FL} (29) X,G X,G
Differentiating with respect to G gives:
(1-α)LαG1-α =1 Þ YG = 1 (21 repeated)
which is the same as for the selfish autocrat. Just as an autocrat, a redistributive democracy, if it transfers a strictly positive amount to itself, provides an efficient supply of the public good. In turn, G is always adjusted to bring the pre-tax or gross marginal product of labor equal to the slope of the efficiency envelope, YL = β. Next
23 Eq. (27) shows how S for a ruling interest resembles t for an autocrat. The autocrat collects tY, the ruling interest SY.
24 Consumers maximization for any given X results in αX[L(X)]α-1 = -UL/UC = MRS. This gives the offer curve, in parametric form, as: L = [MRS/αX]1/(1-α) ≡ L(X); and C(X) ≡ X[L(X)]α, with slope as derived in equation (22).
Decyzje 24_2015v2.indd 146Decyzje 24_2015v2.indd 146 2015-12-23 13:55:322015-12-23 13:55:32
147
Martin C. McGuire
DECYZJE no 24/2015 DOI: 10.7206/DEC.1733-0092.64
differentiating (29) with respect to X and incorporating the slopes of indifference and offer curves proves a central result of this paper:
αL(α-1)G(1-α) = F[-UL/UC] +(1-F) [Lα + αXL(α-1)LX]/LX (30)
or
YL = F · MRS + (1-F)OL (31)
Equation (31) shows that the ruling interest’s optimum is “in between” the optimum of the consensus majority, and that of the selfish autocrat – a weighted average of the two with the weight determined by the fraction of the private economy owned by the ruling interest, and thus the fraction included in their calculations. With constant marginal utility of income, a redistributive democracy always induces more labor supply and provides more public good than a selfish autocrat25: LR = LF/F > LA; GR > GA. The ruling interest’s tax collections in excess of costs of G is given by R = βL – ϕ(L).
Benevolent Ruling Interests Which Refrain From RedistributionIf we use the condition MRS = (1-t)YL, inserting it back into equation (31) gives:
F = [OL – OY]/[OL – (1-t)YL] (32)
Equation (32) might seem to indicate that the equation applies when F = 1 – where the redistributing interest represents the entire society. But this would be wrong. F = 1 can only be compatible with equation (32) if t = 0. But then no public goods could be provided. The proper interpretation here is more surprising – namely that as F increases t must decline, but only to a point. Once F reaches a critical crossover value of F = all taxes are spent exclusively on public good provision. For values of F greater or equal to this critical value, all redistribution ceases, and a ruling interest government taxes only to provide public goods, just as would a consensus government. This parallels the similar result first established with fixed labor supply and absence of income effects in M-O (1996). Because G is essential to positive output under Cobb-Douglas, and because the ruling majority must on our assumptions tax itself as well as the minority at the same rate, there is a built-in incentive to limit that taxation even though its purpose is to redistribute to the rulers themselves. Once the marginal deadweight loss, which the ruling interests themselves bear, reaches the same value as their marginal gain from transfers, they stop redistribution because it does not benefit them. The larger the value of F, the sooner this happens, and if F is
25 The assumption of constant marginal utility of C precludes a back bending offer curve. Comparisons of the consensus, autocrat, and redistributive majority when the supply of labor decreases with greater net wage therefore become much more involved. Income effects of transfers from unrepresented workers to the controlling majority no longer offset each other.
Decyzje 24_2015v2.indd 147Decyzje 24_2015v2.indd 147 2015-12-23 13:55:332015-12-23 13:55:33
148
INVESMENT IN PUBLIC CAPITAL, DISTRIBUTION, AND GOVERNANCE
DECYZJE no 24/2015DOI: 10.7206/DEC.1733-0092.64
large enough – equal to or greater than – the tax necessary to finance a second best optimal provision of public goods itself creates so large a marginal deadweight loss for the majority that it does not pay them to redistribute at all. And this effect most definitely arises before F = 0; that is necessarily > 0.26
9. EXTENSION BEYOND COBB-DOUGLAS PRODUCTION FUNCTIONS
Most of the conclusions derived above use an assumption of C-D production. Barro (1990), and Karras (1996) note that other CRS production functions change the results.27 Absent C-D, it no longer is optimal to provide an “efficient” supply of G28. Without C-D, YG may be greater than unity and in a sense too little G supplied by an optimizing benign government; or YG may be less than unity and too much G will be supplied by an optimizing Consensus. Here, we briefly provide an intuition behind the change to CES production (also CRS), which is non-C-D. All other elements of our analysis remain the same except for the description of technology. Consider then the CES function:
Y = [aLα + bGα]1/α (33)
with 0 < a, b < 1. As the function Y is CRS, the envelope function Y(L) [derived from MaxGY(L,G) – G and defined by combining Y(L,G) – G and YG(L,G) = 1] is linear as in Fig. 2, with no qualitative change in the efficiency envelope, slope say γ29. Under proportional taxation and given values of G and of t the consumer maximizes utility along:
(1-t)Y = (1-t)L[a + b(G/L)a]1/a = (1-t)G[a(L/G)a + b]1/a (34)
But now for any given value of G, say G*, each value of t gives a different consumption opportunity curve. Unlike the CD case as discussed earlier, these consumer opportunity curves do not originate at the origin. Moreover, and crucially, for each value of G = Gk there is an entire map of (1-t)Y(L, Gk) curves. Therefore each G k generates “its own” offer curve, O k. So for each value of G = Gk there is a separate offer curve, Ok and a separate balanced budget curve, Y(L, Gk) – Gk. Once the government chooses G and t, consumers choose, L and then C as implied by that L. For a combination of choices to be viable the consumer’s choice must place the society on or below the balanced budget curve Y(L, Gk) – Gk = 0 pertaining to that choice of G = Gk.
26 The effect is also valid when F ≥ and YG > 1.27 With complete planning control, overall effi ciency conditions remain as described in Section III above.28 More accurately, without local factor substitution elasticity of unity at the optimum, it is no longer optimal
to supply an effi cient amount of G; i.e. YG 1. 29 The formula for γ is: γ = [a + b/m]1/α – [1/m]1/α, where m = [(1/b)α/(1−α) – b]/α.
Decyzje 24_2015v2.indd 148Decyzje 24_2015v2.indd 148 2015-12-23 13:55:332015-12-23 13:55:33
149
Martin C. McGuire
DECYZJE no 24/2015 DOI: 10.7206/DEC.1733-0092.64
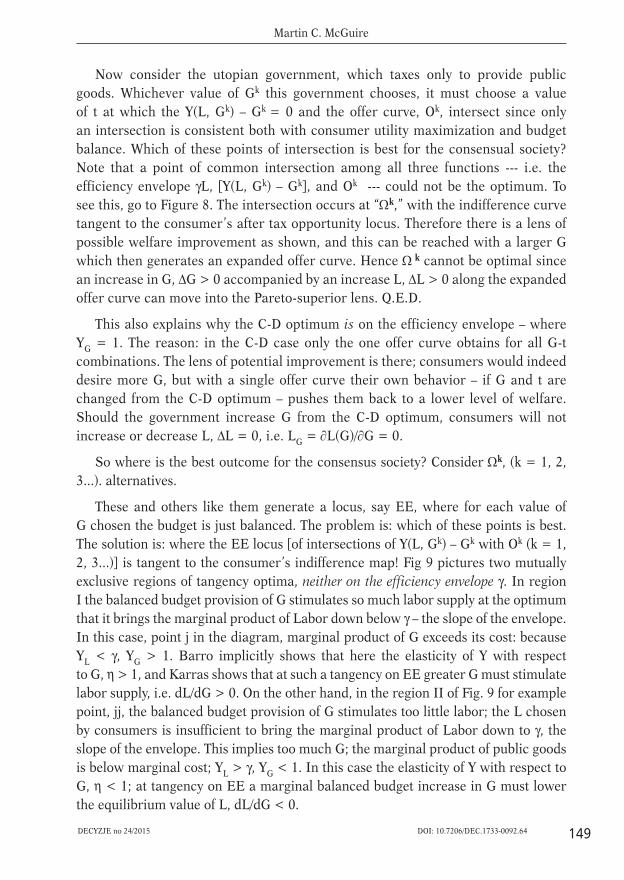
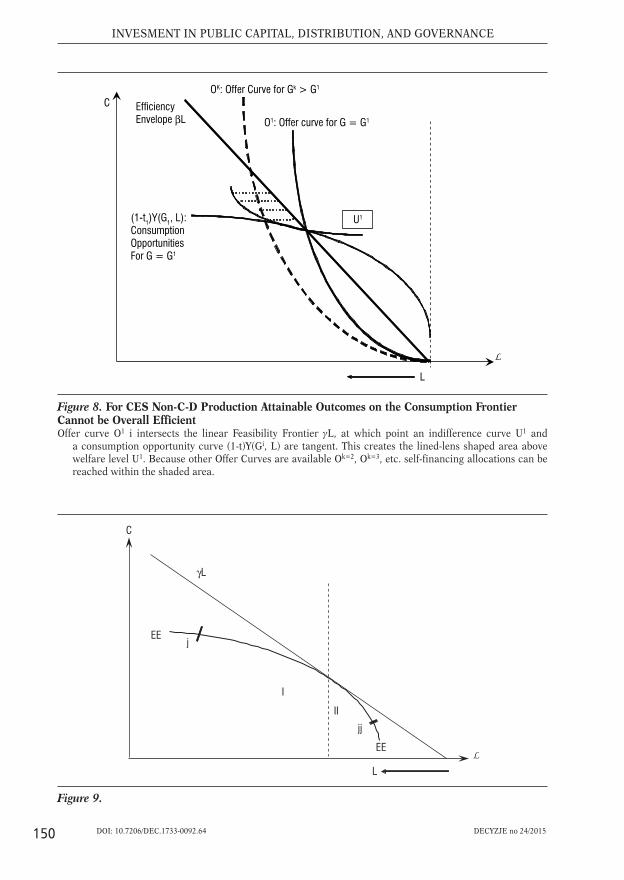
Now consider the utopian government, which taxes only to provide public goods. Whichever value of Gk this government chooses, it must choose a value of t at which the Y(L, Gk) – Gk = 0 and the offer curve, Ok, intersect since only an intersection is consistent both with consumer utility maximization and budget balance. Which of these points of intersection is best for the consensual society? Note that a point of common intersection among all three functions --- i.e. the efficiency envelope γL, [Y(L, Gk) – Gk], and Ok --- could not be the optimum. To see this, go to Figure 8. The intersection occurs at “k,” with the indifference curve tangent to the consumer’s after tax opportunity locus. Therefore there is a lens of possible welfare improvement as shown, and this can be reached with a larger G which then generates an expanded offer curve. Hence k cannot be optimal since an increase in G, ΔG > 0 accompanied by an increase L, ΔL > 0 along the expanded offer curve can move into the Pareto-superior lens. Q.E.D.
This also explains why the C-D optimum is on the efficiency envelope – where YG = 1. The reason: in the C-D case only the one offer curve obtains for all G-t combinations. The lens of potential improvement is there; consumers would indeed desire more G, but with a single offer curve their own behavior – if G and t are changed from the C-D optimum – pushes them back to a lower level of welfare. Should the government increase G from the C-D optimum, consumers will not increase or decrease L, ΔL = 0, i.e. LG = L(G)/G = 0.
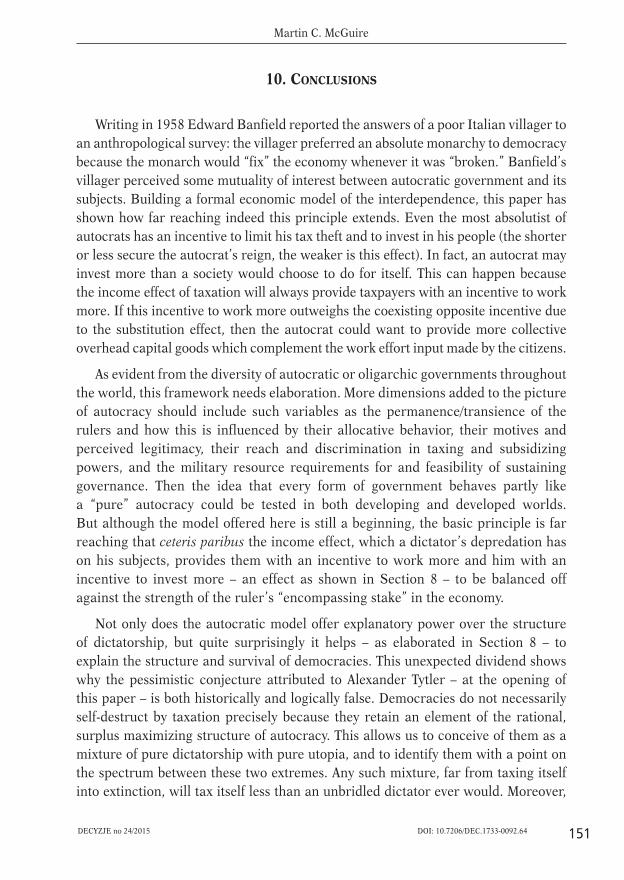
So where is the best outcome for the consensus society? Consider k, (k = 1, 2, 3...). alternatives.
These and others like them generate a locus, say EE, where for each value ofG chosen the budget is just balanced. The problem is: which of these points is best. The solution is: where the EE locus [of intersections of Y(L, Gk) – Gk with Ok (k = 1, 2, 3...)] is tangent to the consumer’s indifference map! Fig 9 pictures two mutually exclusive regions of tangency optima, neither on the efficiency envelope γ. In regionI the balanced budget provision of G stimulates so much labor supply at the optimum that it brings the marginal product of Labor down below γ – the slope of the envelope. In this case, point j in the diagram, marginal product of G exceeds its cost: because YL < γ, YG > 1. Barro implicitly shows that here the elasticity of Y with respectto G, η > 1, and Karras shows that at such a tangency on EE greater G must stimulate labor supply, i.e. dL/dG > 0. On the other hand, in the region II of Fig. 9 for example point, jj, the balanced budget provision of G stimulates too little labor; the L chosen by consumers is insufficient to bring the marginal product of Labor down to γ, the slope of the envelope. This implies too much G; the marginal product of public goods is below marginal cost; YL > γ, YG < 1. In this case the elasticity of Y with respect to G, η < 1; at tangency on EE a marginal balanced budget increase in G must lower the equilibrium value of L, dL/dG < 0.
Decyzje 24_2015v2.indd 149Decyzje 24_2015v2.indd 149 2015-12-23 13:55:332015-12-23 13:55:33
150
INVESMENT IN PUBLIC CAPITAL, DISTRIBUTION, AND GOVERNANCE
DECYZJE no 24/2015DOI: 10.7206/DEC.1733-0092.64
C
(1-t1)Y(G1, L):ConsumptionOpportunities For G = G1
OK: Offer Curve for Gk > G1
L
U1
L
O1: Offer curve for G = G1
Figure 8. For CES Non-C-D Production Attainable Outcomes on the Consumption Frontier Cannot be Overall EfficientOffer curve O1 i intersects the linear Feasibility Frontier gL, at which point an indifference curve U1 and
a consumption opportunity curve (1-t)Y(Gi, L) are tangent. This creates the lined-lens shaped area above welfare level U1. Because other Offer Curves are available Ok=2, Ok=3, etc. self-financing allocations can be reached within the shaded area.
EE
EE
j
γL
I
II jj
L
C
L
Figure 9.
Decyzje 24_2015v2.indd 150Decyzje 24_2015v2.indd 150 2015-12-23 13:55:332015-12-23 13:55:33
151
Martin C. McGuire
DECYZJE no 24/2015 DOI: 10.7206/DEC.1733-0092.64
10. CONCLUSIONS
Writing in 1958 Edward Banfield reported the answers of a poor Italian villager to an anthropological survey: the villager preferred an absolute monarchy to democracy because the monarch would “fix” the economy whenever it was “broken.” Banfield’s villager perceived some mutuality of interest between autocratic government and its subjects. Building a formal economic model of the interdependence, this paper has shown how far reaching indeed this principle extends. Even the most absolutist of autocrats has an incentive to limit his tax theft and to invest in his people (the shorter or less secure the autocrat’s reign, the weaker is this effect). In fact, an autocrat may invest more than a society would choose to do for itself. This can happen because the income effect of taxation will always provide taxpayers with an incentive to work more. If this incentive to work more outweighs the coexisting opposite incentive due to the substitution effect, then the autocrat could want to provide more collective overhead capital goods which complement the work effort input made by the citizens.
As evident from the diversity of autocratic or oligarchic governments throughout the world, this framework needs elaboration. More dimensions added to the picture of autocracy should include such variables as the permanence/transience of the rulers and how this is influenced by their allocative behavior, their motives and perceived legitimacy, their reach and discrimination in taxing and subsidizing powers, and the military resource requirements for and feasibility of sustaining governance. Then the idea that every form of government behaves partly likea “pure” autocracy could be tested in both developing and developed worlds. But although the model offered here is still a beginning, the basic principle is far reaching that ceteris paribus the income effect, which a dictator’s depredation has on his subjects, provides them with an incentive to work more and him with an incentive to invest more – an effect as shown in Section 8 – to be balanced off against the strength of the ruler’s “encompassing stake” in the economy.
Not only does the autocratic model offer explanatory power over the structure of dictatorship, but quite surprisingly it helps – as elaborated in Section 8 – to explain the structure and survival of democracies. This unexpected dividend shows why the pessimistic conjecture attributed to Alexander Tytler – at the opening of this paper – is both historically and logically false. Democracies do not necessarily self-destruct by taxation precisely because they retain an element of the rational, surplus maximizing structure of autocracy. This allows us to conceive of them as a mixture of pure dictatorship with pure utopia, and to identify them with a point on the spectrum between these two extremes. Any such mixture, far from taxing itself into extinction, will tax itself less than an unbridled dictator ever would. Moreover,
Decyzje 24_2015v2.indd 151Decyzje 24_2015v2.indd 151 2015-12-23 13:55:332015-12-23 13:55:33

152
INVESMENT IN PUBLIC CAPITAL, DISTRIBUTION, AND GOVERNANCE
DECYZJE no 24/2015DOI: 10.7206/DEC.1733-0092.64
the closer such a mixture comes to representing the entire society, the greater will be its government’s stake in the private economy, and the less will it redistribute. Thus, contrary to Tytler the mixed modern semi-democracy is limited in its greed to be less redistributive than the autocrat on the one hand, and to require less than unanimous representation to in fact represent the entire society.
While there are many gaps in the theory presented here, some can be filled by refinements: such as allowing differential taxation between those in and out of power, or discrimination between groups in the targeting of benefits of government outlay. But some of the missing elements require more than fine-tuning. Especially glaring is the absence of an explanation for how a ruling interest obtains and maintains its position. Thus, the role of coercion and force in establishing and supporting the monopoly power to tax, in defending the regime from external and internal conquest, and in defending the citizenry from each other’s predations, without overwhelming and subjugating the state that it is supposed to protect must be integrated into future analysis.
REFERENCES
Acemoglu, Daron, Simon Johnson, James A. Robinson, and Pierre Yared. (2008). Income and Democracy. American Economic Review, 98 (3), 808–842.
Acemoglu, Daron. (2008). Oligarchic Vs. Democratic Societies. Journal of the European Economic Association, 6(1), 1–44.
Acemoglu, Daron, Suresh Naidu, Pascual Restrepo and James A. Robinson. (2013). Democracy, Redistribution and Inequality. Working Paper No. 19746. National Bureau of Economic Research.
Acemoglu, Daron and James A. Robinson. (2006). Economic Origins of Dictatorship and Democracy. New York NY: Cambridge University Press.
Aghion, Phillipe, Alberto Alesina, and Francisco Trebbi. (2008). Democracy, Technology, and Growth. In: Institutions and Economic Performance. Elhanan Helpman, ed. Cambridge, MA: Harvard University Press.
Aiyagari, S. Rao, John D. Lawrence, and Martin Eichenbaum. (1992). The Output, Employment, and Interest Rate Effects of government Consumption. Journal of Monetary Economics, 30, 73-86.
Akerlof, G and W. D. Nordhaus. (1967). Balanced Growth --- A Razor’s Edge? International Economic Review, 83, 343.
Alesina, Alberto and Dani Rodrik. (1994). Distributive Politics and Economic Growth. Quarterly Journal of Economics, 109 (2), 465–490.
Arrow, Kenneth. J., and Mordecai. Kurz. (1970). Public Investment, The Rate of Return, and Optimal Fiscal Policy. Baltimore, MD: Resources for the Future, The Johns Hopkins Press.
Banfield, Edward. (1958). The Moral Basis of a Backward Society. Glencoe, IL: The Free Press.
Decyzje 24_2015v2.indd 152Decyzje 24_2015v2.indd 152 2015-12-23 13:55:332015-12-23 13:55:33
153
Martin C. McGuire
DECYZJE no 24/2015 DOI: 10.7206/DEC.1733-0092.64
Barro, Robert J. (1990). Government Spending in a Simple Model of Endogenous Growth. Journal of Political Economy, 98(5, Part 2), S103-25.
Barro, Robert J. (1999). Determinants of Democracy. Journal of Political Economy, 107(S6), 158–183.Barro, Robert J. and Xavier Sala-i-Martin. (1996). Economic Growth. New York, NY: McGraw-Hill.Barzel, Yoram. (2002). A Theory of the State: Economic Rights, Legal Rights, and the Scope of the
State. New York, NY, Cambridge University Press. Benabou, Roland. (1996). Inequality and Growth. NBER Macroeconomics Annual, 1996, 11-92.Brennan, Geoffrey and James. M. Buchanan. (1977). Toward a Tax Constitution for Leviathan.
Journal of Public Economics, 8, 255-74.Cheibub, Jose, Jennifer Gandhi Antonio, and James R. Vreeland. (2010). Democracy and
Dictatorship Revisited. Public Choice, 143(1-2), 67–101.Cornes, Richard and Todd Sandler. (2000). Pareto-Improving Redistribution and Pure Public
Goods. German Economic Review, 1(2), 169-186.Diamond, Peter. A., and James A. Mirlees. (1971). Optimal Taxation and Public Production I:
Production Efficiency. American Economic Review, 61, 8-27.Engineer, Merwan. (1989). Taxes, Public Goods, and the Ruling Class: An Exploration of the
Territory Between Brennan and Buchanan’s Leviathan and Conventional Public Finance. Public Finance, 44, 19-30.
Engineer, Merwan. (1990). Brennan and Buchanan’s Leviathan Models. The Social Science Journal, 27(4), 419-33.
Hillman, Arye. and Heinrich Ursprung. (2000). Political Culture and Economic Decline. European Journal of Political Economy, 16(2), 189-213.
Hirshleifer, Jack. (1995). Anarchy and its Breakdown. Journal of Political Economy, 26-52.Hobbes, Thomas. (1651). Leviathan. London: Andrew Crooke, at the Green Dragon in St. Paul’s
Churchyard. Republished by The Project Gutenberg EBook of Leviathan. http://www.gutenberg.org/files/3207/3207-h/3207-h.htm
Itaya, Jun-Ichi, David de Meza, and Gareth. D. Myles. (1997). In Praise of Inequality: Public Good Provision and Income Distribution. Economic Letters, 57, 289-96.
Karras, George. (1996). The Optimal Government Size: Further International Evidence on the Productivity of Government Services. Economic Inquiry, 34(April), 193-203.
McGuire, Martin C. (1982). Regulation, Factor Rewards and International Trade. Journal of Public Economics, 17(3), 335-354.
McGuire, Martin C. and Mancur L. Olson. (1996). The Economics of Autocracy and Majority Rule: The Invisible Hand and the Use of Force. Journal of Economic Literature, 72-96.
Mulligan, Casey and Xavier Sala-i-Martin. (1997). The Optimum Quantity of Money: Theory and Evidence. Journal of Money Credit, and Banking, 29(4), 687.
Niskanen, William A. (1997). Autocratic, Democratic, and Optimal Government. Economic Inquiry, 35(3), 464-79.
Olson, Mancur L. (1991). Autocracy, Democracy, and Prosperity. In: Strategy and Choice (pp.131-157). Richard J. Zeckhauser, ed. Cambridge, MA: The MIT Press.
Olson, Mancur L. (1982). The Rise and Decline of Nations. New Haven, CT: Yale University Press.
Decyzje 24_2015v2.indd 153Decyzje 24_2015v2.indd 153 2015-12-23 13:55:332015-12-23 13:55:33
154
INVESMENT IN PUBLIC CAPITAL, DISTRIBUTION, AND GOVERNANCE
DECYZJE no 24/2015DOI: 10.7206/DEC.1733-0092.64
Papaioannou, Elias and Gregorios Siourounis. (2008). Democratisation and Growth. Economic Journal, 118(532), 1520–1551.
Persson, Torsten and Guido Tabellini. (1994). Is Inequality Harmful to Growth? American Economic Review, 84(3), 600–621.
Persson, Torsten and Guido Tabellini. (2006). Democracy and Development: The Devil in the Details. American Economic Review, 96(2), 319–324.
Persson, Torsten and Guido Tabellini. (2008). The Growth Effects of Democracy: Is it Heterogeneous and How Can It Be Estimated? In: Institutions and Economic Performance. Elhanan Helpman, ed. Cambridge, MA: Harvard University Press.
Persson, Torsten and Guido Tabellini. (2009). Democratic Capital: The Nexus of Political and Economic Change. American Economic Journal: Macroeconomics, 1(2), 88–126.
Przeworski, Adam and Fernando Limongi. (1993). Political Regimes and Economic Growth. Journal of Economic Perspectives, 7(3): 51–69.
Sandler, Todd. (1992). Collective Action: Theory and Applications. Ann Arbor, MI: University of Michigan Press.
Schumpeter, Joseph A. (1942). Socialism, Capitalism, and Democracy. New York, NY: Harper.Wintrobe, Ronald. (1990). The Tinpot and the Totalitarian: An Economic Theory of Dictatorship.
American Political Science Review, 84(3), 849-72.Wintrobe, Ronald. (1998). The Political Economy of Dictatorship. New York, NY: Cambridge
University Press.
Citations referring to this article should include the following information: McGuire, Martin. (2015). Investment in public capital, distribution, and governance. In: Decyzje
24 (December), pp. 123-154, Kaminski Marek M., ed., Warsaw: Kozminski Academy.
Decyzje 24_2015v2.indd 154Decyzje 24_2015v2.indd 154 2015-12-23 13:55:332015-12-23 13:55:33