investec group ltd analyst presentation 2002 · 2018-08-11 · ... 72.7 61.4 % change (5.2) (5.3)...
TRANSCRIPT

Investec Group Ltd Analyst Presentation 2002
“Please note that except for historical information, matters discussed in today’s conference call may contain forward looking statements which are subject to various risks and uncertainties and other factors, some of which are beyond the Company’s control. These factors may cause the Company’s results, performance or achievements in the markets in which it operates to differ from those expressed or implied.”

Summary of Results

Snapshot of 2002 results
31 March2001
31 March2002
%Change
Headline attributable earnings(R’mn)
1 3141 684 28.2
Headline EPS (cents) 1 628.21 840.4 13.0
DPS (cents) 750825 10.0
Return on equity (%) 25.827.6Cost to income ratio (%) 63.265.5Assets under administration(R’mn)
514 629758 858 47.5

Reconciliation to headline earnings
R’mn 31 March2002
Headline earnings 1 684
1 058
Share of associate’s exceptional losses 45
Amortisation of goodwill for the year 747
Attributable earnings 626Exceptional items
Goodwill impairment 51221Loss on disposal of subsidiaries and
fixed assetsProfit on disposal of non-trading loans (267)

Goodwill impairment
• AC 128 and AC 131: annual review of carrying value of all assets and test on goodwill arising from acquisitions for impairment losses
• Result of exercise: Impairment of R472mn with respect to goodwill on Fedsure insurance business and R40mn on Private Client Group in the US

Headline EPS, DPS and ROE
10 Year CAGRHeadline EPS: 28.9%DPS: 28.0%
0200400600800
100012001400160018002000
1992 1993 1994 1995 1996 1997 1998 1999 2000 2001 200214
16
18
20
22
24
26
28DPS Headline EPS ROEcents (%)

Global Positioning and Review

Operating environment
“It was the best of times, it was the worst of times...”
- Charles Dickens

It was the best of times...- Charles Dickens

Operating environment
Best of times...
• Fedsure rationalised and integrated
• Received permission to dual list:> Key to internationalisation strategy> Expected to raise the international profile
and perception of the Group> Provides clear strategic direction
• The Group demonstrated resilience in a challenging environment

It was the worst of times...- Charles Dickens

Operating environment
Worst of times...
• Negative sentiment surrounding Fedsure
• Delays on the UK listing permission
• SA banking sector experienced a difficult period
• Depressed global markets
• Regional political upheaval
• Exceptionally challenging operating environment

Operating environment
• Overall, the environment was not very conducive for a specialist banking group like Investec
• Notwithstanding the difficult environment, Investec has grown earnings below historic levels but still above other international investment banks

Geographic review
Headline NIBT
Headline Earnings
UK & Europe
Southern Africa & Other
USA
Israel
5.2% 5.3%
82.4%
89.3% 97.5%
61.5% 78.6%
For the year ended31 March 2002
1.7%

Assets by geography
UK & Europe55.9%
SA & Other36.3%
Israel4.8%
USA3.0%
Year ended 31 March 2002(31 March 2001)
(4.5%)
(58.4%)
(5.8%)
(31.3%)

Tangible NAV by geography
Year ended 31 March 2002(31 March 2001)
UK & Europe51.0%
SA & Other38.4%
Israel7.0%
USA3.6%
(8.0%)
(41.0%)
(42.0%)
(9.0%)

Headline NIBT by geography
UK & Europe
56.3%SA & Other
(52.9%)
Israel 0.7%USA
(3.5%)
Year ended 31 March 2002(31 March 2001)
(38.6%)
38.6%
4.4%(5.0%)

Headline earnings by geography
UK & Europe
47.3%SA & Other
(62.8%)
Israel3.0%
USA(4.4%)
Year ended 31 March 2002(31 March 2001)
(30.7%)
46.4%
3.3%(2.1%)

UK and Europe
• Headline NIBT declined marginally in Rand terms:
> Equity related activities suffered from market volatility
> Stronger performances from private banking, treasury and specialised finance

UK and Europe
• Continued to focus on developing core areas:
> Acquisition of European Capital team
> Established structured finance and financial products operations
> Made several key recruitments

UK and Europe
Salient financial features31 March
2002
Headline NIBT (R’mn) 915
Headline earnings (R’mn) 781
Staff 1 492
Return on tangible NAV (%) 24.1
31 March2001
965
825
1 432
34.4
Assets (R’bn) 170 114
Cost to income ratio (%) 72.7 61.4
%change
(5.2)
(5.3)
4.2
49.1

Southern Africa and Other
• Strong performance from SA operations
• Particularly good performances from treasury and specialised finance, investment banking, private banking and the property division
• Inclusion of the Fedsure acquisition for 10 months enhanced overall results

Southern Africa and Other
Salient financial features**31 March
2002
Headline NIBT (R’mn) 1 333
796Staff 3 111Return on tangible NAV (%) 36.7
31 March2001
704
4032 30323.2
**Includes: Mauritius, Botswana, Hong Kong and Australia
Assets (R’bn) 110 61
Cost to income ratio (%) 49.6 59.3
%change
89.3
97.535.1
80.3
Headline earnings (R’mn)

USA
• Negative earnings growth as a result of:
> Subdued state of the equity markets
> Investment banking and private client operations negatively impacted
• Enhanced investment banking capability – select recruitment
• Decided to exit Private Client Stockbroking business in March 2002

USA
Salient financial features31 March
2002
Headline NIBT (R’mn) 1657
Staff 688Return on tangible NAV (%) 14.0
31 March2001
9158
85913.2
Assets (R’bn) 9 9
Cost to income ratio (%) 98.2 84.1
%change
(82.4)(1.7)
(19.9)
-
Headline earnings (R’mn)

Israel
• Posted creditable results off a low base
• Extremely difficult political and economic environment
• Rationalisation of the business in process which will result in reductions in headcount and costs

Israel
Salient financial features31 March
2002
Headline NIBT (R’mn) 10550
Staff 238Return on tangible NAV (%) 9.8
31 March2001
6528
2426.6
Assets (R’bn) 15 11
Cost to income ratio (%) 59.7 66.1
%change
61.578.6(1.7)
36.4
Headline earnings (R’mn)

Australia
• Creditable performance, particularly from Investec Wentworth
> Headline NIBT of R15mn
• Banking license application in process
• Robust and scalable business platforms are being created

Divisional Review

Divisional review
Headline NIBT
7.7%
22.7%
42.3%
22.8%
Investment BankingDecline reflecting difficult market
conditions
Treasury and Specialised FinanceGood results despite market volatility
Private Client ActivitiesStrong performance from private
banking in UK and SA
Asset ManagementSound contribution, supported by
acquisition of Fedsure

Contribution analysis
Year ended 31 March 2002(31 March 2001)
Investment Banking
24.6%
Asset Management
21.0%
Private Client Activities
23.9%
Treasury &Specialised Finance30.5% (31.9%)
(21.6%)
(12.3%)(34.2%)& Assurance

Investment Banking
• Performance reflects the weak market conditions
• Decline primarily from the UK and the US
• Internationalisation strategy continued:
> Focus on key sectors
> Senior appointments made in SA and UK

Investment Banking
Salient financial features31 March
2002%
Change
Net operating income (R’mn) 1 324 29.7
Operating expenses (R’mn) 740 90.7
Headline NIBT (R’mn) 584 (7.7)
Cost to income ratio (%) 55.6
31 March2001
1 021
388
633
37.4
Includes: Corporate Finance, Institutional Stockbroking, Private Equity, Direct Investments

Investment Banking
• Corporate Finance - continued to perform strongly relative to local peers
• Institutional Stockbroking - structured equity desk performed well in its first year of operation
• Private Equity and Direct Investments -performed better than expected and select investments and realisations were made
South Africa

Investment Banking
• Investment Banking & Securities> Slowdown in IPO’s and secondary fundraisings> Growth in large cap agency business and
market making offset difficult secondary market> Concluded 21 M&A transactions
• Private Equity and Direct Investments> Focused on enhancing and realising existing
portfolio of investments
United Kingdom and Europe

Investment Banking
USA• Acquired PMG Capital in June 2001• Particularly vulnerable to weak US markets• Acquired teams to boost niche sectors of TMT
and Healthcare

Investment Banking
• Corporate advisory capability established with the acquisition of Wentworth Associates in March 2001
• Good deal flow with contribution to headline NIBT of R34mn
• Private Equity capability established
Australia

Treasury and Specialised Finance
• Banking activities performed well, particularly:
> Treasury, financial products, structured finance and project and resource finance
• Financial market activities produced mixed performances:
> Good results from the commodities unit

Treasury and Specialised Finance
Salient financial features31 March
2002%
Change
Net operating income (R’mn) 1 320 31.2
Operating expenses (R’mn) 595 43.4
Headline NIBT (R’mn) 725 22.7
Cost to income ratio (%) 44.1
31 March2001
1 006
415
591
39.3
Includes: non-private client deposit-taking, corporate and public sector lending, structuring and proprietary trading activities

Treasury and Specialised Finance
• Project Finance:
> N1-N4 Platinum Toll Road project - joint lead arranger
> Arranged, underwrote and placed R1bn of CPI-linked bonds in SA capital market
South Africa

Treasury and Specialised Finance
• Structured Finance benefited from low interest rate levels in SA which stimulated demand for long term funding
• Interest rate desk suffered from volatility experienced in the market in December
South Africa contd.

Treasury and Specialised Finance
• Further expansion and development of international capabilities
• UK and Europe:> Acquired European Capital team> Good progress made by structured finance in
its first year of operation> Financial products and resource teams were
established
• Australia:> Set up a structured finance team
International Operations

Private Client Activities
• Strong results
• Particularly strong performances from private banking in the UK and SA
• Global lending book grew 39.1% to R28.1bn

Private Client Activities
Salient financial features31 March
2002%
Change
Net operating income (R’mn) 2 048 29.2
Operating expenses (R’mn) 1 479 24.8
Headline NIBT (R’mn) 569 42.3
Cost to income ratio (%) 68.0
31 March2001
1 585
1 185
400
70.3
Includes: Private Banking, Private Client Stockbroking and Portfolio Management

Private Client Activities
• Total headline NIBT for Private Client Activities
> Private Banking increased from R200mn to R352mn
> Private Client Stockbroking and Portfolio Management increased from R200mn to R217mn

Private Client Activities
• South Africa:
> Solid performance driven by strong growth in advances, assets under administration and non-interest income
> Loan portfolio grew 36% to R13.7bn
> Product innovation and differentiation continued to be a core focus
Private Banking

Private Client Activities
• UK and Europe:> Strong performance supported by healthy
growth in advances
> Commendable performance from the trust and fiduciary businesses
> Loan portfolio grew 28% to £797mn
• Australia:> Private Banking still in its development
phase and has been refocused
Private Banking contd.
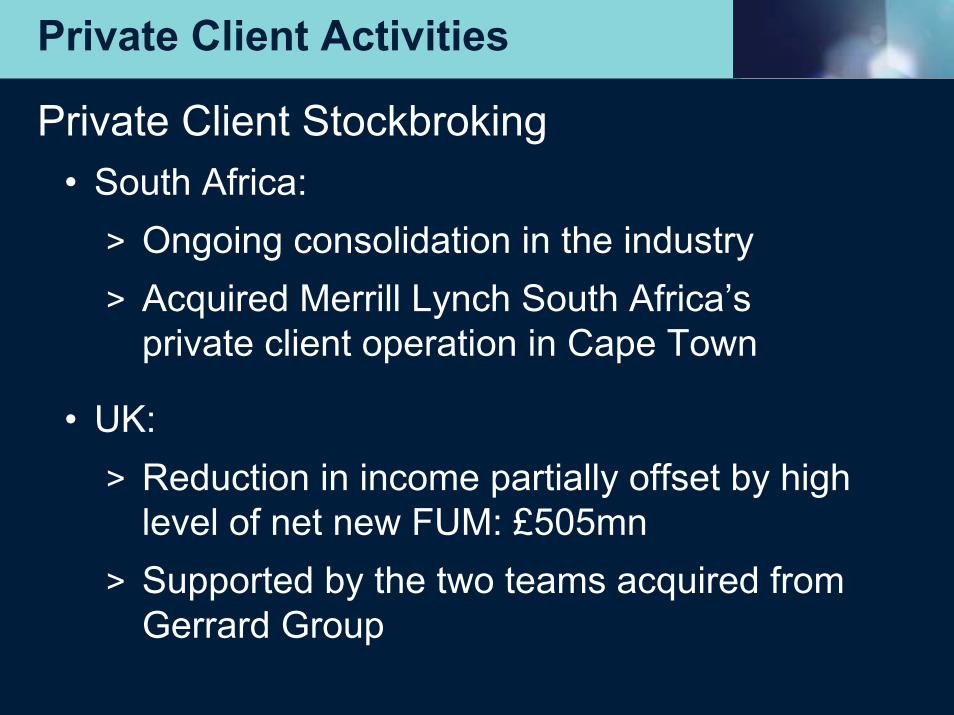
Private Client Activities
• South Africa:> Ongoing consolidation in the industry> Acquired Merrill Lynch South Africa’s
private client operation in Cape Town
• UK:> Reduction in income partially offset by high
level of net new FUM: £505mn> Supported by the two teams acquired from
Gerrard Group
Private Client Stockbroking

Private Client Activities
• USA:
> Particularly impacted by poor market conditions
> In March 2002, corporate management decided to exit the retail brokerage business with the current management of the business identified as the primary buyers
Private Client Stockbroking contd.

Asset Management
• Sound performance supported by Fedsure acquisition
• Strong performance in SA • Effectively integrated Fedsure assets and retail
business• Grew the offshore funds• Strong net sales in UK retail• Continued success in UK equities• Strong global fixed income performance

Asset Management
Includes: Institutional, Retail and Investment Trust Asset Management and Linked Product Provider Business
Salient financial features31 March
2002%
Change
Net operating income (R’mn) 1 097 24.5
Operating expenses (R’mn) 817 25.1
Headline NIBT (R’mn) 280 22.8
Cost to income ratio (%) 74.5
31 March2001
881
653
228
74.0

Asset ManagementSouth Africa - Top 3 performer over last 5 years1
1 Measured for ten 6 month periods for rolling five years* Data only available for 7 periodsBased on monthly compounded performance (Source: Alexander Forbes)
0123456789
10
Old Mutual
Investe
cSan
lamRMBAMStan
lib
BOECoronati
on*
Frankli
n Templet
onAlla
n Gray
# times in top 3 over 10 5-year periods ending Dec and June annually
2
10
1
4
5
8

Asset ManagementSouth Africa - retail performance• Improvement in SA investment performance• Percentile ranking of in-house managed funds on avg., top quartile
30%
40%
50%
60%
70%
80%
Jan-01 Mar-01 May-01 Jul-01 Sep-01 Nov-01 Jan-02 Mar-02
Including Multi-manager

Asset Management
• Total FUM increased from R172bn to R263bn
> Inclusion of Fedsure assets
> Depreciation of the Rand
> Reasonable inflows

Assurance Activities
• Completed restructuring of policyholder portfolios
• Significant cost reductions
• Improvement in compliance
Investec Employee Benefits

Assurance Activities
Investec Employee BenefitsMarch2002
Embedded value (R’mn) 2 951
Net asset value 2 523
Qualifying capital (net of inadmissable assets)
CAR coverOperational income
2 368
2.73220
(R’mn)
(R’mn)
(R’mn)
May2001
2 478
2 308
2 271
1.85-

Other Activities
31 March2002
%Change
Net Income - International Trade Finance 34 (47.7)
Net Income - Property Worldwide 261 222.2
Net Income - USA Clearing and Execution 44 (24.1)
Traded Endowments 46
31 March2001
65
81
58
-
Net Return on Surplus Capital 317 (10.5)354
Central Costs (502) 30.0(386)
Centralised Funding (209) 5.0(199)
Headline NIBT (9) 66.7(27)
-
R’mn

Other Activities
• Investec Property Group
> Significant enhancement to Property Group took place during the period with:
– the acquisition of Fedsure;– the merger of Growthpoint with the Mines
Pension Fund properties; and– the management contract of Melrose Arch
> Benefited from the low long term interest rates during the first 8 months of the financial year
> Thereby significantly increasing the contribution from Property activities

Other Activities
• US Clearing and Execution Activities:
> Highly dependent on transactional activity
> Negatively impacted by market conditions
> Partially offset by acquisition of the clearing arm of Herzog Heine Geduld

Group Performance

Salient financial features
Balance Sheet31 March
200231 March
2001%
Change
Shareholders’ funds 13 230 9 028 46.5Total capital resources 16 016 11 240 42.5Total assets 303 841 194 732 56.0Advances 54 413 38 062 43.0Third party FUM 455 017 319 897 42.2
R’mn

Salient financial features
Income Statement31 March
2002%
ChangeNet interest income 2 183 16.3Provision for bad &doubtful debts
202 2.0
Other income 5 273 45.6Operating expenses 4 885 40.5Headline NIBT 2 369 29.8Headline earnings 1 684 28.2
31 March20011 878
198
3 6213 4761 8251 314
R’mn

0
10
20
30
40
50
60
70
1992 1994 1996 1998 2000 2002
Ran
ds
10 Year CAGR: 20.0%
Salient financial features
Growth in net tangible asset value per share

10 Year CAGR: 54.2%
0
50
100
150
200
250
300
350
1992 1994 1996 1998 2000 2002
Salient financial features
Growth in total assets
R’b
n

10 Year CAGR: 55.8%
Salient financial features
Growth in assets under administrationR
’bn
0100200
300400500600
700800
1992 1994 1996 1998 2000 2002

Salient financial features
Operating income by typeCommission & fees- recurring
Margin incomePrincipal transactions& trading incomeCommission & fees- non-recurringIncome from long term assurance business
41.2% (44.1% )
27.3% (31.7% )
18.3% (12.0% )
10.1% (12.2% )
3.1%
Year ended 31 March 2002(31 March 2001)

Salient financial features
Annuity income as a % of total income
%
71.876.1
70.777.4
81.183.273
6069
0102030405060708090
1994 1995 1996 1997 1998 1999 2000 2001 2002

Salient financial features
Organic growth in income 22.2%
19.2%
29.7%
37.3%32.2%
34.7%41.3%30.7%18.8%
0
1000
2000
3000
4000
5000
6000
7000
1994 1996 1998 2000 2002
R’m
n

Salient financial features
Organic growth in expenses
R’m
n
25.5%
20.4%
27.9%
35.6%20.1%
28.1%38.2%16.6%15.3%0
500100015002000250030003500400045005000
1994 1996 1998 2000 2002

Salient financial features
Organic growth in net income
16.0%
16.9%33.0%
54.9%71.3%
46.2%58.9%
60%57.6%
0
500
1000
1500
2000
2500
1994 1996 1998 2000 2002
R’m
n

Additional information
• Fedsure acquisition
• Foreign currency translation gains from integrated operations
• Employee share incentive schemes

Operational Issues

Risk Management
• Bradley Tapnack was appointed as the Global Head of Corporate Governance and Compliance
• Introduced a Global Risk Committee that supervises global risk as a sub-committee of the Board
• Developed Operational Risk Management as a separate discipline within the Group risk management function
• Continued to embed a culture of risk awareness, control and compliance

Adequacy of provisions
Bad debt charge as % of average advances
%0.43
0.54
0.75
1.13
0.710.530.58
0.8
0
0.2
0.4
0.6
0.8
1
1.2
1995 1996 1997 1998 1999 2000 2001 2002

Adequacy of provisions
Gross NPLs as a % of total loans and advances
%
1.11
1.652.1
3.02.6
1.82.0
2.7
0
0.5
1
1.5
2
2.5
3
3.5
1995 1996 1997 1998 1999 2000 2001 2002

Capital resources
• Total capital resources increased by 42.5% to R16 016mn, attributable to:> Net increase of R2 755mn in shares and debenture
issues following the Fedsure acquisition and share buy-back
> Foreign currency translation reserve increased R1.6bn
> Issue of additional R300mn subordinated debt in SA market
• Risk weighted assets increased by 33% partly as a consequence of exchange rates and partly organic

Capital adequacy
R’mn31 March
2002Tier 1 12 109Tier 2 - Permanent 2 915
Total 16 979Capital Reserved for Non-Banking Activities
(3 017)
Capital available for Banking Activities 8 418Risk Weighted Assets 63 826
Tier 2 - Redeemable 1 955
Impairments (5 544)
Capital Adequacy Ratio 13.2%
31 March 20017 3782 676
11 835(1 516)
7 36448 034
1 781
(2 955)
15.3%

Deploying capital productively
31 March2002
31 March2001
Return on Equity (%) 27.6 25.8
Return on Investment (%) 17.2 17.1
Return on RWA (%) 3.0 3.0

Cost Control
• Operating expenses increased 40.5%:> Acquisitions included for the full period - 15%> Devaluation of the Rand - 18.3%> Underlying organic growth - 7.2%
• Cost to income ratio increased to 65.5% from 63.2%:> Reflecting reduced revenues generated from
the UK Investment Banking activities; and > Capacity building in some of the offshore
acquisitions

Cost Control
Expenses by type
PersonnelBusinessEquipmentPremisesMarketing
55.8% (53.5% )
20.7% (19.9% )
12.0% (13.7% )
7.1% (7.1% )
4.4%
Year ended 31 March 2002(31 March 2001)
(5.8% )
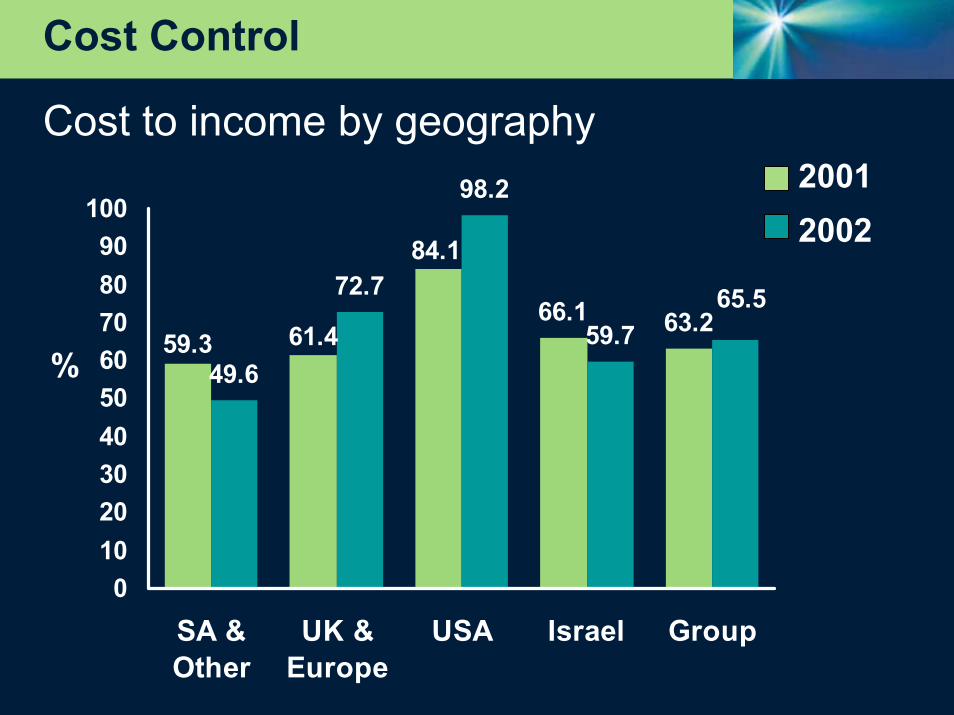
Cost Control
Cost to income by geography
%66.1 63.2
49.6
72.7
98.2
59.7
84.1
61.459.365.5
0102030405060708090
100
SA &Other
UK &Europe
USA Israel Group
20012002

People
806 8261067
13451659
22382706
3721
44414836
5529
0
1000
2000
3000
4000
5000
6000
1992 1994 1996 1998 2000 2002

Headline earnings per employee
108139
188.921216
236
307 320339
363
04080
120160200240280320360400
1994 1996 1998 2000 2002
R’000

Systems and Infrastructure
• Focused on aligning the IT Organisation with the Group Matrix
• Key issue is to cut down on diversity and duplication
• Global IT Management Committee in place to address these issues

Corporate Citizenship
• Established a separate Social Investment Division
• Concentrate on entrepreneurial projects that are sustainable and empower people
• Entrepreneurial impact:> Business Place> Rural schools initiative> CIDA City Campus> The Cradle Project

Looking Forward

Looking Forward
Investec will continue to pursue its strategy to be one of the world’s leading specialist banking groups through an emphasis on:
> Reinforcing a specialised and focused
approach
> Pursuing growth opportunities
> Leveraging group skills across product and
geography
> Perpetuation of Investec’s culture

Investec Group Ltd Analyst Presentation 2002