investigating agricultural sustainability and strategies...
TRANSCRIPT

Journal of Archaeological Science 35 (2008) 821e835http://www.elsevier.com/locate/jas
Investigating agricultural sustainability and strategies in northernMesopotamia: results produced using a socio-ecological
modeling approach
Mark Altaweel*
Decision and Information Sciences Division, Argonne National Laboratory, 9700 South Cass Avenue, Argonne, IL 60439, USA
Received 19 March 2007; received in revised form 27 May 2007; accepted 19 June 2007
Abstract
Some of the most politically and culturally significant cities in first millennium BC northern Mesopotamia were located in agriculturallymarginal landscapes. In order to sustain these settlements, variant cultivation techniques were practiced by local populations. Understandingthe dynamics and implications of crop management practices requires that socio-ecological variables be addressed over recurrent cropcycles. This paper employs a coupled socio-ecological modeling approach that enables interactions between a quantitative environmentalmodel and an agent-based social model by using the ENKIMDU simulation tool. The reconstructed landscape near the ancient city of Assuris used as the example setting to test the effectiveness of simulated cultivation strategies. These methods include sole dependence on bi-ennial fallow and rainfall, gravity flow irrigation, application of manure, and the integration of all these approaches. Results obtained withinENKIMDU attempt to delineate agricultural constraints and potential benefits of the specific anthropogenic processes and strategies ad-dressed.� 2007 Published by Elsevier Ltd.
Keywords: Modeling; Simulation; Landscape; Socio-ecological; Agriculture; Mesopotamia
1. Introduction
As is well documented, northern Mesopotamia is a regionthat can present significant environmental constraints forlong-term grain agriculture and the sustainment of settlementsystems. In different periods, variant anthropogenic strategiesto counter the environmental constraints posed by the land-scape and climate were attempted. These strategies, or formsof crop management, included biennial fallow with a primarydependence on rainfall, gravity flow irrigation in areas withsignificant water resources, manuring to improve soil fertility,
* Tel.: þ1 630 252 1379.
E-mail addresses: [email protected], [email protected]
0305-4403/$ - see front matter � 2007 Published by Elsevier Ltd.
doi:10.1016/j.jas.2007.06.012
and the integration of all these strategies (Wilkinson, 1994;van Driel, 2000; van Koppen, 2001).
The landscape near the ancient city of Assur, a settlementthat was politically and culturally significant in the Iron Age(1200e600 BC), is considered to have been particularly mar-ginal. Modern day rainfall amounts often do not exceed200 mm, the perceived minimum amount required for grainproduction (Davies, 1957). In addition, significant areas wereunusable for agriculture due to the thin soils and exposedsedimentary rocks. Cultivation limitations in this landscapecan explain why the relatively large settlement, roughly 90 hain the Iron Age (Miglus, 1996), may have depended on grainfrom distant regions (Altaweel, 2004; Freydank, 1992). Never-theless, archaeological and historical records likely suggest sig-nificant agricultural intensification in the region of Assur duringthe Iron Age (Altaweel, 2004; Bagg, 2000).

822 M. Altaweel / Journal of Archaeological Science 35 (2008) 821e835
Cultivation intensification in the region of Assur likely in-corporated aspects of all the strategies mentioned earlier.The question that arises is can the degree to which thesestrategies could have been successful be measured? In addi-tion, are these strategies productive over time, or are therelong-term consequences that ultimately limit agriculturalproduction? This paper will attempt to address thesequestions by modeling the crop management strategies men-tioned using a coupled environmental and social modelingapproach. Specifically, the approach applied incorporatesa quantitative model that represents environmental processesand an agent-based model that address social processeswithin a temporal and spatial setting. Feedback relationshipsare enabled between the environmental and social models.The end result of this approach is not intended to providedefinitive answers for past agricultural output, but the resultsare intended to provide clarity to the physical constraints andpotential benefits and consequences of anthropogenic strate-gies employed by social agents. Because this paper does notattempt to replicate real results achieved, a number of vari-ables impacting agriculture, including those related to de-mography and availability of certain cultivation resources,will be made constant. This allows results to be more easilytractable and enables a better understanding of a given cul-tivation strategy’s productive capabilities under the condi-tions addressed.
The organization of this paper will include a presentationon the modeling inputs. These data can be used to reconstructthe landscape and environmental setting. For the purposes ofthis paper, the landscape addressed by the modeling will com-prise a 10-km radius around Assur. The discussion on thephysical processes impacting agriculture will include detailson the specific environmental model used. Following this pre-sentation, the anthropogenic processes and cultural variablesinvolved in agriculture will be presented. Barley (Hordeumvulgare) will be the crop modeled, because this crop wasand still is a major staple grain in agriculturally marginal re-gions in northern Mesopotamia. Following the presentationof the data and models, there will be a brief discussion onthe simulation method and technologies used. Four differentmodeling scenarios will then be discussed, including a baselinebiennial fallow scenario, an irrigation scenario, a manureapplication case, and a scenario integrating all previous strat-egies. After the presentation of the modeling results, histori-cal and ethnographic data will be compared with modeledoutput.
Table 1
Input sources used in the SWAT environmental model
General landforms Soil reports Climate data
March 3, 2002 ASTER image Buringh (1960) NOAA (Nationa
Administration),British Admiralty (1944)
van Liere (2003)
Mulders (1969)
2. Environmental input and physical processes
Existing environmental models, particularly those that havebeen validated in numerous environmental settings and createdby multidisciplinary teams, can be used to investigate land-scape processes. One such current model is the Soil and WaterAssessment Tool (SWAT). The modeling suite addresses cropgrowth (Arnold and Allen, 1992; Arnold et al., 1998; Neitschet al., 2002), including various significant processes:
� soil evolution� vertical and horizontal hydrology� evapotranspiration� plant phenology� daily weather
Most of these actions are addressed by algorithms detailedin Neitsch et al. (2002). Table 1 provides references to inputsused in this study, and the following description will detailthese sources.
Given all the required input parameters for SWAT (Soiland Water Assessment Tool), 2007, the challenge is to obtainthe most useful data that closely reflect the Assur setting.Fig. 1 is an Advanced Spaceborne Thermal Emission andReflection Radiometer (ASTER) image of the region sur-rounding Assur. The image was derived through a forwardPrincipal Component Analysis (PCA) with a covariance ma-trix on the Visible and Near-Infrared Radiometer (VNIR) andShort Wave Infrared Radiometer (SWIR) bands, specificallyBands 2, 3, and 4. Alluvial areas, as indicated on the image,form significant portions of the landscape near Assur, partic-ularly near the Tigris. To the south and west of Assur, the ter-rain features large areas of limestone/gypsum ridges and thinsoils not suitable for agriculture. The rest of the terrain can becharacterized as undulating plains along uplands at a distancefrom the Tigris. The satellite data can be used to form the lo-cation of landforms that are modeled in SWAT. Althoughthese landforms have evolved over the last few thousandyears, including the Tigris’ avulsion near Assur, the featuresdescribed can be considered to have been the general typesencountered (Altaweel, 2004).
Soil reports and observations from Assur’s region, such asthose provided by Buringh (1960) and the British AdmiraltyHandbook (British Admiralty, 1944), can be used as inputdata for addressing crop development. Rich alluvial claysand silts near the Tigris characterize the alluvial zones,
Vegetation data Default SWAT inputs
l Oceanic and Atmospheric
2007
Thalen (1979) Neitsch et al. (2002)
Guest (1966) SWAT (Soil and Water
Assessment Tool), 2007

Fig. 1. ASTER image from March 3, 2002 showing the region near Assur. Numbers 1-3 indicate alluvial zones, areas of thin soils and non-agricultural areas, and
upland plains respectively. Colors on the imagery can be used to delineate areas, and in this case red indicates vegetation growth, green represents moisture and/or
vegetation, and blue shows gypsum/limestone. (For interpretation of the references to colour in figure legends, the reader is refered to the web version of this
article).
823M. Altaweel / Journal of Archaeological Science 35 (2008) 821e835
limestone and gypsum form much of the thin soils and nearbyridges, and reddish-brown gypsiferous loamy soils are locatedalong the uplands. The observations and data provided by Bur-ingh and the British Admiralty are not completely adequate tocreate the main soil profiles used in SWAT. Comparable soilsto those observed near Assur can be found in parts of Syria,and reports from van Liere (2003) and Mulders (1969) canbe used to address data voids, such as saturated hydraulic con-ductivity, in the given soil type. Although the soil profiles forthe periods being addressed are not completely known, thedata reflect current understanding.
In addition to soils, SWAT allows users to model specificvegetation surface cover. For this study, scrub and grassesformed most natural vegetation in all zones, although ripariantrees (e.g. Salix sp.) are found along the Tigris near Assur(Thalen, 1979; Guest, 1966). The only other vegetation mod-eled was barley.
The reconstruction of the paleoclimate for Assur is difficultfor the period in question, but based on several studies generalconditions can be derived. Paleoclimate estimates suggest thatrainfall and temperature conditions during the first half of thefirst millennium BC were considered to have been dry andwarm, somewhat similar to relatively recent conditions inthe region (Issar and Zohar, 2004). Given these observations,climate data from the last century can be applicable in estimat-ing conditions that are used as weather inputs in SWAT. Thenearest weather stations to Assur that have published dataspanning several decades are Qayara, Beiji, and Mosul(NOAA(National Oceanic and Atmospheric Administration),2007). These weather stations’ climate data, recorded during1935e1957, can be used to recreate monthly averages thatcan be used in a stochastic Markov chain to derive dailyweather conditions. The averages of the Qayara and Beijiweather stations’ monthly results were used to recreate theoverall monthly averages, while Mosul’s results were
employed in cases where data were missing. Weatherconditions modeled included daily wind speed, temperature,sunshine/overcast, and rainfall (SWAT (Soil and Water Assess-ment Tool), 2007).
3. Social variables and anthropogenic processes
Mesopotamia is unique among archaeological regions inthat the historical data are relatively extensive. In addition tohistorical sources, ethnographic data can potentially clarifyfarming processes as well as add new details. Where relevant,behaviors and data derived from historical and/or ethnographicsources are used to create an anthropogenic agricultural modeland form model inputs. Table 2 lists the sources of the inputsand behaviors applied.
Farming in the Near East during many periods consisted ofboth private and communal ownership of land. The system ofp�uru, the Akkadian word for lot, was comprised of differenthouseholds having field shares that gave them rights to agri-cultural fields; however, these rights were not specific to anyparticular field (Renger, 1995; Postgate, 1989). Private owner-ship was generally conventional, with households owning spe-cific land. What could be considered the case in the regionnear Assur, elite households and the state very like ownedmany of the fields, but common households likely workedthese fields (Freydank, 1994). These common householdslikely retained a p�uru system, but gave shares of the yieldsto owners. For the purposes of the modeling, the significanceof this system implies that fields were rotated among house-holds after each cultivation cycle. For all modeled scenarios,households were given at least two field shares.
Field plot sizes are an important input because these impactfield labor requirements. Historical data indicate that fieldsizes ranged between 1.8 and 14.4 ha (Freydank, 1980), withfields often long and rectangular in shape in order to limit
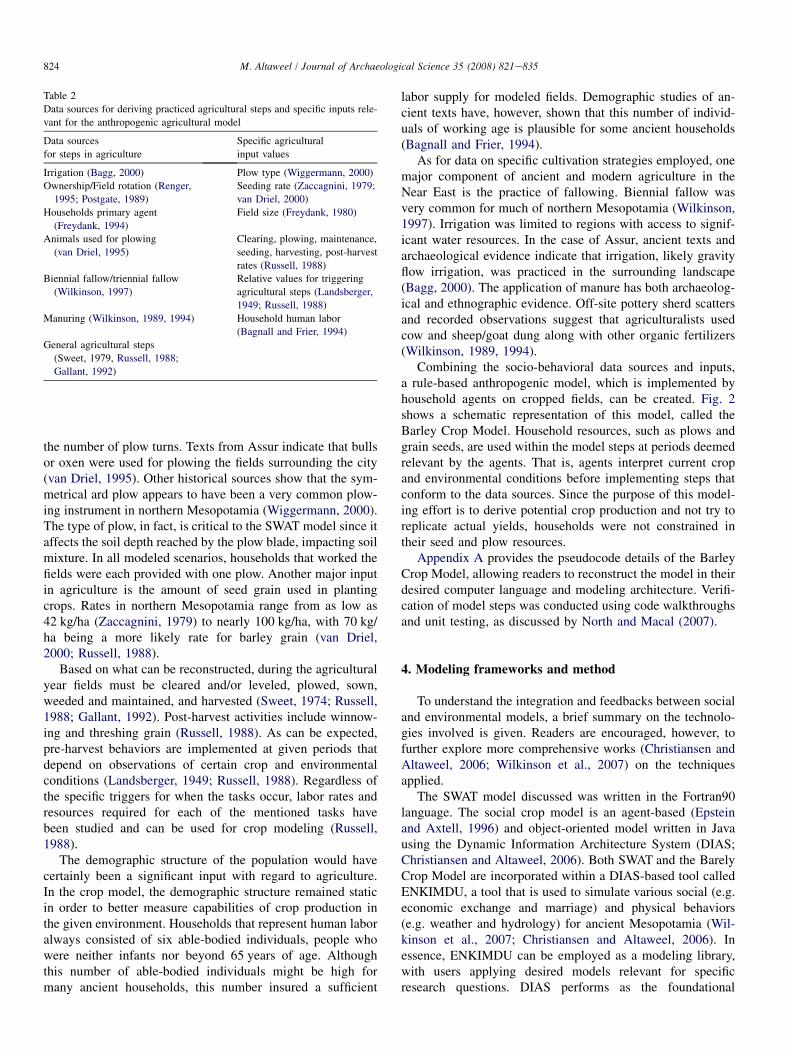
Table 2
Data sources for deriving practiced agricultural steps and specific inputs rele-
vant for the anthropogenic agricultural model
Data sources
for steps in agriculture
Specific agricultural
input values
Irrigation (Bagg, 2000) Plow type (Wiggermann, 2000)
Ownership/Field rotation (Renger,
1995; Postgate, 1989)
Seeding rate (Zaccagnini, 1979;
van Driel, 2000)
Households primary agent
(Freydank, 1994)
Field size (Freydank, 1980)
Animals used for plowing
(van Driel, 1995)
Clearing, plowing, maintenance,
seeding, harvesting, post-harvest
rates (Russell, 1988)
Biennial fallow/triennial fallow
(Wilkinson, 1997)
Relative values for triggering
agricultural steps (Landsberger,
1949; Russell, 1988)
Manuring (Wilkinson, 1989, 1994) Household human labor
(Bagnall and Frier, 1994)
General agricultural steps
(Sweet, 1979, Russell, 1988;
Gallant, 1992)
824 M. Altaweel / Journal of Archaeological Science 35 (2008) 821e835
the number of plow turns. Texts from Assur indicate that bullsor oxen were used for plowing the fields surrounding the city(van Driel, 1995). Other historical sources show that the sym-metrical ard plow appears to have been a very common plow-ing instrument in northern Mesopotamia (Wiggermann, 2000).The type of plow, in fact, is critical to the SWAT model since itaffects the soil depth reached by the plow blade, impacting soilmixture. In all modeled scenarios, households that worked thefields were each provided with one plow. Another major inputin agriculture is the amount of seed grain used in plantingcrops. Rates in northern Mesopotamia range from as low as42 kg/ha (Zaccagnini, 1979) to nearly 100 kg/ha, with 70 kg/ha being a more likely rate for barley grain (van Driel,2000; Russell, 1988).
Based on what can be reconstructed, during the agriculturalyear fields must be cleared and/or leveled, plowed, sown,weeded and maintained, and harvested (Sweet, 1974; Russell,1988; Gallant, 1992). Post-harvest activities include winnow-ing and threshing grain (Russell, 1988). As can be expected,pre-harvest behaviors are implemented at given periods thatdepend on observations of certain crop and environmentalconditions (Landsberger, 1949; Russell, 1988). Regardless ofthe specific triggers for when the tasks occur, labor rates andresources required for each of the mentioned tasks havebeen studied and can be used for crop modeling (Russell,1988).
The demographic structure of the population would havecertainly been a significant input with regard to agriculture.In the crop model, the demographic structure remained staticin order to better measure capabilities of crop production inthe given environment. Households that represent human laboralways consisted of six able-bodied individuals, people whowere neither infants nor beyond 65 years of age. Althoughthis number of able-bodied individuals might be high formany ancient households, this number insured a sufficient
labor supply for modeled fields. Demographic studies of an-cient texts have, however, shown that this number of individ-uals of working age is plausible for some ancient households(Bagnall and Frier, 1994).
As for data on specific cultivation strategies employed, onemajor component of ancient and modern agriculture in theNear East is the practice of fallowing. Biennial fallow wasvery common for much of northern Mesopotamia (Wilkinson,1997). Irrigation was limited to regions with access to signif-icant water resources. In the case of Assur, ancient texts andarchaeological evidence indicate that irrigation, likely gravityflow irrigation, was practiced in the surrounding landscape(Bagg, 2000). The application of manure has both archaeolog-ical and ethnographic evidence. Off-site pottery sherd scattersand recorded observations suggest that agriculturalists usedcow and sheep/goat dung along with other organic fertilizers(Wilkinson, 1989, 1994).
Combining the socio-behavioral data sources and inputs,a rule-based anthropogenic model, which is implemented byhousehold agents on cropped fields, can be created. Fig. 2shows a schematic representation of this model, called theBarley Crop Model. Household resources, such as plows andgrain seeds, are used within the model steps at periods deemedrelevant by the agents. That is, agents interpret current cropand environmental conditions before implementing steps thatconform to the data sources. Since the purpose of this model-ing effort is to derive potential crop production and not try toreplicate actual yields, households were not constrained intheir seed and plow resources.
Appendix A provides the pseudocode details of the BarleyCrop Model, allowing readers to reconstruct the model in theirdesired computer language and modeling architecture. Verifi-cation of model steps was conducted using code walkthroughsand unit testing, as discussed by North and Macal (2007).
4. Modeling frameworks and method
To understand the integration and feedbacks between socialand environmental models, a brief summary on the technolo-gies involved is given. Readers are encouraged, however, tofurther explore more comprehensive works (Christiansen andAltaweel, 2006; Wilkinson et al., 2007) on the techniquesapplied.
The SWAT model discussed was written in the Fortran90language. The social crop model is an agent-based (Epsteinand Axtell, 1996) and object-oriented model written in Javausing the Dynamic Information Architecture System (DIAS;Christiansen and Altaweel, 2006). Both SWAT and the BarelyCrop Model are incorporated within a DIAS-based tool calledENKIMDU, a tool that is used to simulate various social (e.g.economic exchange and marriage) and physical behaviors(e.g. weather and hydrology) for ancient Mesopotamia (Wil-kinson et al., 2007; Christiansen and Altaweel, 2006). Inessence, ENKIMDU can be employed as a modeling library,with users applying desired models relevant for specificresearch questions. DIAS performs as the foundational

Fig. 2. Barley Crop Model schema showing the different steps of agriculture as defined by historical and ethnographic sources. This anthropogenic model is applied
by a household on a specific field, with that field evolved based on physical processes and agent inputs.
825M. Altaweel / Journal of Archaeological Science 35 (2008) 821e835
technology to enable ENKIMDU’s capabilities. In addition toallowing models to be written, DIAS allows standalonemodels written in different computer languages to be accessedvia distributed computing and model wrappers. This enablesthe user to construct simulations that integrate varying typesof models with objects (e.g. households) that represent themodeled setting. Household objects can interpret and reactto output produced by the SWAT model on specific croppedfields, and these objects can affect subsequent SWAT pro-cesses by providing new inputs. Rates and types of appliedseeds, fertilizers, and plows can all affect how SWAT evolvesagricultural fields.
Within ENKIMDU, GIS tools can be integrated, allowingfor analysis and display of spatial data. The geospatial tool in-tegrated for this study is JeoViewer (Lurie et al., 2002). Differ-ent agents, cropped fields, and the general landscape can beviewed and analyzed during and after simulations (Figs. 3and 4). Fig. 3 shows the modeled region; Fig. 4 is a closerview during a simulation scenario. In addition to visual displayand analysis, output is provided via spreadsheet and textformats.
Fig. 3. JeoViewer image showing the general layout of agricultural fields near
Assur based on Fig. 1’s ASTER imagery. Both agricultural and non-agricul-
tural areas are indicated.
5. Modeling results
For all the modeling scenarios, there were 3243 total crop-ped fields, with 2518 fields in the uplands and 725 alluvialfields. Rainfall averaged 200 mm per annum, but fluctuationswere allowed from year-to-year. In fact, year-to-year varia-tions of rainfall ranged between 100 and 450 mm. In eachsimulation variation from the baseline scenario, only thetested behavior varies from the baseline. All simulated cases
lasted 100 years, a simulation span that was sufficient toproduce clear agricultural trends. Longer timeframes weremodeled; however, results beyond 100 years did not yieldsignificantly different trends. There were at least 40 simula-tion runs executed for each simulation scenario, but compara-ble outputs within a scenario never varied more than 3%,showing relatively consistent results for the scenarios. Thepresented results of each scenario derive from the simulationrun that was the median of the 100-year average crop yieldsfor that scenario.

Fig. 4. JeoViewer image showing the simulation in progress during the harvest season, roughly June 1st, in the baseline scenario. The fields modeled include the
alluvial zone near Assur and uplands farther from the Tigris. Information shown includes biomass (kg/ha) and Growing Heat Units (GHU). Greater soil fertility
near the Tigris generally produces higher yields, as shown on the image. GHU was a crop maturity measure that was used by the household agents, indicated as
circular icons, to trigger the harvest cycle.
826 M. Altaweel / Journal of Archaeological Science 35 (2008) 821e835
5.1. Biennial fallow baseline scenario
In this first scenario, the goal was to measure cultivationpotential of the modeled fields employing biennial fallowand rainfall. The scenario served as the baseline to compareto all other scenarios. Fig. 4 shows the simulation run duringthe harvest cycle.
Fig. 5 shows average crop yields for the fields in theuplands and alluvial zones and rainfall amounts duringa 100-year simulation. The overall 100-year averages were549 kg/ha in the uplands and 643 kg/ha in the alluvial zones.As one would expect, there is a strong positive relationshipbetween rainfall and crop yield for a large part of the simu-lation. For example, in Years 10e20 the correlations betweenrainfall and yield were.75 and.83 for the uplands and alluvial
Fig. 5. Chart showing average agricultural yields in the upland plains and
alluvial zones as well as rainfall amounts during a baseline simulation.
fields respectively, as determined by a Pearson’s r correlation.Although rainfall generally remained near 200 mm/year forthe length of the scenario, yearly average yields in all zonesgradually declined as the simulation progressed. In fact, inthe first half of the simulation the overall average yieldswere 623 kg/ha and 731 kg/ha in the uplands and alluvial re-gions respectively, while in the second half they were474 kg/ha in the uplands and 555 kg/ha in the alluvial zones.Over time, in high rainfall years, the increase in yields be-came less as other factors began to affect productivity, whilethe yields began to decrease more markedly in years of lowerrainfall.
Both the environmental and anthropogenic models can betested for significant variables affecting crop yields by con-ducting parameter sweeps and sensitivity analysis on the dif-ferent inputs (North and Macal, 2007). The loss of soilnutrients was determined to be the most significant processon yield values observed. Fig. 6 shows a graph that indicatesyearly averages of nitrogen (N) stress. This rate is measuredbetween 0 and 1, with 0 signifying no reduction of plantgrowth due to N stress and 1 representing no plant growthdue to N stress. As an example, a rate of 0.5 would mean50% crop growth reduction due to N stress. The graph showsthat there were insufficient nutrient inputs being put back intothe fields as the simulation progressed. Consequently, nitrogendeficiencies became an increasing stress on plant growth,causing overall yields to decrease. Despite the decliningyields, losses did not continue to trend downward continu-ously, but yields began to flatten near 390 kg/ha in the uplandsand 450 kg/ha in the alluvial areas during the last 10 years of

Fig. 8. Graph showing yield averages in both the uplands and alluvial zones as
well as rainfall amounts in an irrigation scenario simulation.
Fig. 6. Graph indicates average levels of field nitrogen stress during a baseline
simulation.
827M. Altaweel / Journal of Archaeological Science 35 (2008) 821e835
the simulation. Longer simulations, in fact, showed that theseyield rates were not significantly different from the averagesbeyond the 100-year mark for the different zones.
Although, for the most part, the baseline scenario showedthat crop yields declined so long as there was only dependenceon rainfall without other inputs, there was some benefit to thestrategy employed. Biennial fallow is often practiced to pre-serve soil water content, particularly for the upper soil hori-zons most affecting crop growth. Soil water content in thisscenario remained generally stable throughout the scenario,as fields left fallow after a cropped year added additionalsoil moisture. Average soil moisture in fields ranged between2.52 and 2.57 m per year per field for the entire 100-year sce-nario (Fig. 7), indicating general soil moisture stability in thestrategy employed.
5.2. Irrigation scenario
The variation in this scenario from the last case is the em-ployment of irrigation for all modeled fields. Even though allof the fields in the scenario would not have been irrigated inthe past, this case attempted to test possible benefits to cultiva-tion if this capability were possible. All modeled fields wereassumed to border water channels. Agents implemented irriga-tion in different periods after barley was sown. Householdagents were able to apply 150 mm of water to any cropped
Fig. 7. Graph shows the average amounts of soil water content in modeled
fields for the length of a baseline simulation.
field, insuring that in every year there was sufficient waterfor crop needs.
Fig. 8 shows the yield results for cropped fields in this sce-nario. As expected, overall average crop yields per year werehigher in this scenario than the last. For the entire duration ofthe scenario, yields averaged 689 kg/ha and 788 kg/ha in theuplands and alluvial areas respectively. However, similar tothe last scenario, average yields in both zones were signifi-cantly less in the second half of the simulation run than inthe first half. Average yields in the uplands were 766 kg/hain the first half and 612 kg/ha in the second half. In the alluvialareas, yields were 895 kg/ha in the first half and 680 kg/ha inthe second half. Similar to the last scenario, the lack of soilnutrient replenishment directly affected the simulation as thescenario continued. Long-term grain production, therefore, de-clined as field nutrients declined. The dramatic decline in yieldaverages in the alluvial areas are particularly striking, drop-ping roughly 24% on average between the first and secondhalves. In fact, in the last ten years of the scenario the averageswere 578 kg/ha and 625 kg/ha in the uplands and alluvialzones respectively, indicating almost little difference betweenthe two areas. In contrast, in Year 10 of the scenario the allu-vial region’s average yield was over 1700 kg/ha, while the up-lands averaged 1200 kg/ha.
5.3. Manure application scenario
In this scenario, manuring was allowed on all the agricul-tural fields, with no additional changes made to the baselinescenario. Agents were able to apply 200 kg of sheep/goatdung per hectare within a crop cycle. The application of ma-nure was conducted prior to sowing as well as after sowing,but no application of manure was allowed one month priorto harvest. The manure input amount was likely to be higherthan actual average amounts applied in the past. Despite thehigh input value, the phosphates and nitrates added wasroughly 10 kg per 200 kg of sheep/goat manure, resulting inrelatively low nitrogen and phosphate inputs by modern stan-dards (Neitsch et al., 2002; SWAT (Soil and Water AssessmentTool), 2007).

Fig. 9. Graph showing yield averages for both the uplands and alluvial zones
as well as rainfall amounts for a manure application scenario simulation.
828 M. Altaweel / Journal of Archaeological Science 35 (2008) 821e835
Fig. 9 indicates the crop yields as a result of applying ma-nure. The overall 100-year average yield results were 703 kg/ha and 993 kg/ha for the uplands and alluvial zones respec-tively. For the alluvial zone, this average is significantlyhigher than earlier scenarios. In the first half of this scenario,the yield results were 783 kg/ha in the uplands and 1087 kg/ha in the alluvial zones, while in the second half the resultswere 623 kg/ha and 899 kg/ha in the uplands and alluvialzones respectively. Similar to the other scenarios, yields be-gan to level in the last ten years of the scenario, and longersimulations showed similar trends to these years. Looking atYears 90 to 100, the results were 578 kg/ha and 781 kg/ha inthe uplands and alluvial zones respectively. Although yieldsdid clearly decline in both zones in the second half of thescenario, the overall yields remained relatively high, particu-larly because no irrigation was applied in this scenario. Infact, the average yields from the alluvial fields in this casewere higher than the average yields from the alluvial fieldsin the irrigation case during the last ten years of bothscenarios.
Looking at the average nitrogen stress rates for fields,yearly averages were significantly lower in this scenariothan earlier cases (Fig. 10). Nevertheless, despite thereduced overall stress rates for the entire scenario, this
Fig. 10. Graph showing the average N stress rates for fields in a manure appli-
cation scenario simulation. Overall N stress rate change is shown by a linear
trend line.
case still showed increasing overall N stress levels as thesimulation progressed. Fig. 10, in fact, shows that towardthe end of the scenario N stress rates were generally higherthan the earlier years of the simulation. During the first20 years of the scenario, the average N stress rate was0.064, while in the last 20 years it was 0.08. These resultsindicate that despite the relatively high fertilizer quantitiesapplied, N stress continued to be a limiting factor in cropgrowth.
5.4. Integration of strategies scenario
This scenario integrates biennial fallow, irrigation, and ma-nuring. The purpose is to test the capabilities of blending allprevious scenario strategies. Results shown by Fig. 11 indicatethat average yields were far more stable throughout the 100-year simulation than in previous cases. High yields wereachieved early in the simulation, and although production de-clined later in the simulation, the yields did not decline as sig-nificantly as other scenarios. The overall average yields were825 kg/ha in the uplands and 1159 kg/ha in the alluvial zones.The averages in the uplands were 893 kg/ha in the first half ofthe scenario and 757 kg/ha in the second half. In the alluvialzones, the overall averages were 1262 kg/ha and 1056 kg/hain the first and second halves respectively. In the uplands,the decline in average yield from the first half to the secondhalf was 15%, while the decline was 16% in the alluvialzones. In contrast, declines between the first and secondhalves in the manure application scenario were 20% and17% in the uplands and alluvial zones respectively. In thelast ten years of this scenario, the averages were 833 kg/hain the uplands and 1095 kg/ha in the alluvial areas, whichwere higher values than the overall averages for the secondhalf of the simulation. This indicates that not only were yielddeclines less drastic in this scenario than previous cases, butthe yields were more stable in the second half of the simula-tion and did not continue to decline near the end of thescenario.
Fig. 11. Graph showing yield averages for the uplands and alluvial zones as
well as rainfall amounts for a simulation that integrates all previous agricul-
tural strategies.

829M. Altaweel / Journal of Archaeological Science 35 (2008) 821e835
6. Comparisons with observed results
Comparing modeling results with ancient records can, asone would expect, be a difficult undertaking. Nevertheless, us-ing ethnographic and historical data, reasonable comparisonsbetween modeled and observed results can be made. In rainfedand non-irrigated regions in northern Mesopotamia, yields canvary from 300 kg/ha to over 600 kg/ha, with averages gener-ally ranging between 400 and 500 kg/ha in relatively dry re-gions (van Driel, 2000; Wilkinson, 1994, 1997). Informationon irrigated regions is derived from both sites in northernand southern Mesopotamia, with irrigation being far morecommon in southern Mesopotamia. In northern Mesopotamia,average yields for likely irrigated zones range closer to700 kg/ha, but possibly reaching as high as 1000 kg/ha ormore (van Koppen, 2001). Irrigation was generally not men-tioned in locations where it was possible, such as Mari in Sy-ria, but relatively high yields (i.e. 700 kg/ha or more) at suchdry locations suggest that it was practiced. Although most ofthe historical agricultural data do not mention application ofmanure and length of fallow periods for barley crop, one canassume that manuring and biennial fallow were practiced formost areas of cultivation in northern Mesopotamia.
With the exception of the last scenario discussed, the lastten years, or roughly that time span, appear to indicate resultsthat were more stable. In fact, longer simulations did not showsignificant variations from the averages for those ten-yearspans, suggesting these last ten years represent a long-termtrend. One noticeable trend in the baseline case is that even un-der relatively ideal conditions, particularly in labor supply andother resources, relatively low yields in comparison to ob-served values were achieved in all agricultural zones duringthe last ten years. As for the irrigation and manure applicationscenarios, yield results from the last ten years were not muchhigher than averages obtained from the historical and ethno-graphic data. Given that irrigation was likely more limited inuse in northern Mesopotamia, and often limited to alluvialzones near major watercourses, the likelihood is that manureor other organic fertilizers were more commonly employedto enhance crop yields. The benefits of the application of ma-nure would allow higher yields even in relatively dry condi-tions, as shown by various studies (Sørensen et al., 1994)and indicated by the manure application scenario. The outputproduced by the models discussed also suggests that the appli-cation of manure can help to diminish rapid yield declines.The last modeled scenario showed that, in fact, the optimalor best strategy would have been to combine the benefits ofthe different strategies. This scenario showed that yield de-clines could have been eased by integrating strategies, withoverall higher yields achieved. Assur in the Iron Age mayhave been among the locations where multiple strategies couldhave been practiced concurrently.
7. Conclusion
This paper has attempted to discuss cultivation potentialunder varying strategies likely employed during the Iron
Age in northern Mesopotamia. Prior to this effort, thesestrategies have not been extensively studied using anapproach that couples a mathematically validated environ-mental model with an agent-based model representing socialbehaviors. In addition, applying the interactions of socialand environmental models at varying temporal and spatialparameters allows socio-ecological processes to affect thecrop cycle at different phenological stages in a givenlocation.
What the results show is that yield enhancing inputs arerequired in order to sustain yields near to the levels observedin the historical and ethnographic sources. The integration ofbiennial fallow, gravity flow irrigation, and application of ma-nure produced the most stable yield results and the highestyields. In several scenarios, access to seemingly ideal inputsupplies, such as organic fertilizer, resulted in decliningyields over time, indicating the difficulties of producing sus-tained high yields in the given environment and with thecultivation technologies (e.g. types of plow and fertilizer)used. The best benefit of the crop yields and other outputspresented was not in the absolute values given; rather, signif-icant insights in socio-ecological interactions were obtainedby observing the overall yield and other output trends inthe studied strategy.
Future studies focusing on crop production and capabilitiescan build from this effort. Better comprehension of cultivationbehaviors conducted by agents and improving the physicallandscape and environmental data used in SWAT can enhancecurrent results. The applied approach can be extended to otherregions, and different or alternative anthropogenic strategiescan be attempted. In addition to the insights provided, thestudy has attempted to show the utility of coupling environ-mental processes with a social behavioral model that enactsdifferent anthropogenic behaviors at specific temporal andspatial scales.
Acknowledgments
This paper was made possible by the ‘‘Modeling BronzeAge Settlement Systems in a Dynamic Environment’’ project,an effort funded by the National Science Foundation Program:Dynamics of Coupled Natural and Human Systems (Grant No.0216548). Further information regarding this work and othersimilar publications can be viewed at http://oi.uchicago.edu/OI/PROJ/MASS/Mass.htm.
Appendix A. Barley crop model pseudocode
Note: Slashes indicate comments related to pseudocode.Method steps repeat until finished. Only methods critical forrecreating agricultural steps are included, and support methods(e.g. getting and setting data) are not shown.

clearAndLevel() //clear and level substep {
f = getField() //f is a field object instance evolved in model r=getResources() //get agent resources, called r fieldArea = f.getLeveledAreaLeft() //get the work area t=workTimeRemaining() //how much work time left today
workTimeLeft=fieldArea*r.levelRateOfWork()//time=area * hour/area
if (f.isLeveled()=false) then //check to see if field leveled
if(workTimeLeft>t) then //finish what you can today areaFinished=t*r.levelRateOfWork() f.setLeveledArea(areaFinished)//finished area set return //finish step today, back tomorrow
else //finish today timeFinished=fieldArea*r.levelRateOfWork() t=t-timeFinished //work time reamin is adjusted f.setLeveled(true) //field is leveled now f.setLeveledAreaLeft(0) //finish leveling
end-if
end-if
fieldArea = f.getClearedAreaLeft(); workTimeLeft=fieldArea*r.clearRateOfWork() //reset work time
if(workTimeLeft>t) then areaFinished=t*r.clearRateOfWork() f.setClearedArea(areaFinished)//set finished return //finish step today, back tomorrow
else //finish today timeFinished=fieldArea*r.clearRateOfWork() t=t-timeFinished f.setClearedAreaLeft(0) //finish clearing, SWAT informed plow() //go to next step
end-if
}
plow() //plow substep {
f = getField() //f is a field object instance r=getResources() //get agent resources, called r fieldArea = f.getPlowedAreaLeft() //get the work area of field t=workTimeRemaining() //get how much time left to work today
workTimeLeft=fieldArea*r.plowRateOfWork() //how much time needed plowType=r.getPlowUsed() //needed to tell SWAT type of plow
f.setPlowType(plowType) //this informs SWAT of plow used
if(workTimeLeft>t) then areaFinished=t*r.plowRateOfWork() f.setPlowedArea(areaFinished) //amount finished
return //finish step today, back tomorrow
830 M. Altaweel / Journal of Archaeological Science 35 (2008) 821e835

else //finish today timeFinished=fieldArea*r.plowRateOfWork() t=t-timeFinished f.setPlowedAreaLeft(0) //finish plowing, inform SWAT sow() // go to next step
end-if
}
sow() //sow crop substep {
f = getField() //f is a field object instance if (f.canFertilize()=true) then //check if fertilizer used
fertilize()
r=getResources() //get agent resources, called r fieldArea = f.getSownAreaLeft()//get the work area of field t=workTimeRemaining() //get how much time left to work today
workTimeLeft=fieldArea*r.sowRateOfWork() //how much time needed seedType=r.getSeedTypeUsed() //let SWAT know of crop planted f.setVegetationPlanted(seedType);//SWAT informed about crop
if(workTimeLeft>t) then
areaFinished=t*r.sowRateOfWork() f.setSownArea(areaFinished) //amount finished set return //finish step today, back tomorrow
else //finish today timeFinished=fieldArea*r.sowRateOfWork() t=t-timeFinished //work time remaining is adjusted f.setSownAreaLeft(0) //finish sowing, SWAT informed f.setSown(true) //field has now been sown maintainCrop() // go to next step
end-if
}
maintainCrop() //maintain crop substep, checks tasks {
cropState=f.getCropGHUState() //crop GHU(growth state) from SWAT
if(cropState>=f.getHarvestGHU()) then //desired harvest state? harvest() //go to harvest step now
end-if
//can irrigate now? Irrigate only if possible at the given time if (f.canIrrigate()=true) then
resetIrrigationAreaLeft() //reset area irrigated if 0 irrigate()
end-if
831M. Altaweel / Journal of Archaeological Science 35 (2008) 821e835

//can fertilize now? Fertilize only if possible at the given time if (f.canFertilize()=true) then resetFertilizerAreaLeft() //reset area fertilized if 0
fertilize()
end-if
//can weed? Weed only if needed now if(f.needToWeed()) then
resetWeedAreaLeft() //reset area weeded if 0 weed()
end-if
}
irrigate() //irrigation substep {
f = getField() //f is a field object instance r=getResources() //get agent resources, called r fieldArea = f.getIrrigationAreaLeft() //get irrigated area left t=workTimeRemaining() //get how much time left to work
workTimeLeft=fieldArea*r.irrigationRateOfWork() //how much time //water amount function of time waterAmount=r.getIrrigationAmount(t)f.setIrrigationAmount(waterAmount); //tell SWAT irrigation amount
//irrigation is usually relatively quick, but check time anyway if(workTimeLeft>t) then
areaFinished=t*r.irrigationRateOfWork() f.setIrrigatedArea(areaFinished) //amount finished return //go home, back later
else //finish today timeFinished=fieldArea*r.irrigationRateOfWork() t=t-timeFinished
f.setIrrigatedAreaLeft(0) //finished for now
end-if
maintainCrop() //see other maintenance needed
}
fertilize() //fertilization substep {
f = getField() //f is a field object instance r=getResources() //get agent resources, called r fieldArea = f.getFertilizeAreaLeft() //get fertilizer area t=workTimeRemaining() //get how much time left to work
workTimeLeft=fieldArea*r.fertilizeRateOfWork() //how much time fertilizerType=r.getFertilizerType() //type of fertilizer used fertilizerAmount=r.getFertilizerAmount(t) //amount based on time f.setFertilizerType(fertilizerType) //fertilizer type set f.setFertilizerAmount(fertilizerAmount) //tell SWAT fert. amount
832 M. Altaweel / Journal of Archaeological Science 35 (2008) 821e835

if(workTimeLeft>t) then areaFinished=t*r.irrigationRateOfWork() f.setFertilizeArea(areaFinished) //finished area
else //finish today timeFinished=fieldArea*r.fertilizeRateOfWork() t=t-timeFinished
f.setFertilizeAreaLeft(0)//finished for now
end-if
if(f.getSown()!=true) then //check if field sown by now return //if not, finish and break step
else maintainCrop() //go back to maintaining crops
}
weed() //weed substep {
f = getField() //f is a field object instance r=getResources() //get agent resources, called r fieldArea = f.getWeedAreaLeft() //get irrigated area t=workTimeRemaining() //get how much time left to work
workTimeLeft=fieldArea*r.weedRateOfWork() //how much time
if(workTimeLeft>t) then areaFinished=t*r.irrigationRateOfWork() f.setWeededArea(areaFinished) //amount finished
else //finish today timeFinished=fieldArea*r.weedRateOfWork() t=t-timeFinished
f.setWeededAreaLeft(0) //finished weeding area for now
end-if
maintainCrop() //see other maintenance needed }
harvest() //harvest substep {
f = getField() //f is a field object instance g=getGrain() //g is an instance of grain
r=getResources() //get agent resources, called r fieldArea = f.getHarvestAreaLeft() //get work area t=workTimeRemaining() //get how much time left to work today
workTimeLeft=fieldArea*r.harvestRateOfWork() //time needed
if(workTimeLeft>t) then areaFinished=t*r.harvestRateOfWork ()
f.setHarvestArea(areaFinished) //amount finished g.addHarvestGrain((areaFinished/f.getTotalArea())*f.totalGra
inInField()) //figure harvested and add to total return //finish step today, back tomorrow
833M. Altaweel / Journal of Archaeological Science 35 (2008) 821e835

}
processHarvest() //process harvest substep { g=getGrain() //g is an instance of grain grainAmount=g.getAmountHarvestedLeft()//amount of grain harvested
r=getResources() //get agent resources, called r t=workTimeRemaining() //get how much time left to work today
workTimeLeft=g.size()*r.processRateOfWork() //time needed
if(workTimeLeft>t) then amountFinished=t*r.processRateOfWork () grainAmount=grainAmount-amountFinished //recalculate amount g.setAmounHarvestLeft(grainAmount); g.addProcessedAmount(amountFinished)//add processed
return //finish step today, back tomorrow
else //finish today timeFinished=grainAmount*r.processRateOfWork () t=t-timeFinished g.addProcessedAmount(grainAmount) //add the rest distributeHarvest() // go to next step
end-if
}
distributeHarvest() //distribution step, last step { g=getGrain()//get grain object instance agents[]=getAgentsReceivingGrain()//retrieves grain recipients for i to length agents[]
else //finish today timeFinished=fieldArea*r.harvestRateOfWork () t=t-timeFinished f.setHarvestAreaLeft(0) //nothing left, tell SWAT
g.addHarvestGrain((fieldArea/f.getTotalArea)*f.totalGrainInField()) //add rest of harvest processHarvest() // go to next step
end-if
agent=agents[i] //gets a specific agent //grain share as ratio between 0-1 share=agent.getGrainShare() //add grain amount agent deserves to get agent.addGrainShare(g.getTotalGrain()*share)
end-for
return //return, model finished }
834 M. Altaweel / Journal of Archaeological Science 35 (2008) 821e835
References
Altaweel, M., 2004. The Land of Ashur: A Study of Landscape and Settlement
in the Assyrian Heartland. Ph.D. dissertation. University of Chicago,
Chicago.
Arnold, J.G., Allen, P.M., 1992. A comprehensive surface-groundwater flow
model. Journal of Hydrology 142, 47e69.
Arnold, J.G., Srinivasin, R., Muttiah, R.S., Williams, J.R., 1998. Large area
hydrologic modeling and assessment, Part I: Model development. Journal
of the American Water Resources Association 34 (1), 73e89.
Bagg, A.M., 2000. Assyrische Wasserbauten: Landwirtschaftliche Wasser-
bautn im Kernland Assyriens zwischen der 2. Halfte des 2. und der I.
Halfte des I. Jahrtausends v. Chr. Baghdader Forschungen 24. P. von
Zabern, Mainz.

835M. Altaweel / Journal of Archaeological Science 35 (2008) 821e835
Bagnall, R.S., Frier, B.W., 1994. The Demography of Roman Egypt. Cam-
bridge University Press, Cambridge.
British Admiralty, 1944. Iraq and the Persian Gulf. Her Majesty’s Stationary
Office, London.
Buringh, P., 1960. Soils and Soil Conditions in Iraq. Ministry of Agriculture,
Baghdad.
Christiansen, J.H., Altaweel, M.R. 2006. Understanding ancient societies: A
new approach using agent-based holistic modeling. Structure and Dynam-
ics: eJournal of Anthropological and Related Sciences 1(2). http://reposi-
tories.cdlib.org/imbs/socdyn/sdeas/vol1/iss2/art7/.
Davies, D.H., 1957. Observations on land use in Iraq. Economic Geography
33, 122e134.
Epstein, J., Axtell, R., 1996. Growing Artificial Societies: Social Science from
the Bottom Up. MIT Press, Cambridge.
Freydank, H., 1980. Zur Lage der deportierten Hurriter in Assyrien. Altorien-
talische Forschungen 7, 89e117.
Freydank, H., 1992. Das archiv Assur 18764. Altorientalische Forschungen 19,
276e321.
Freydank, H., 1994. Drei tafeln aus der verwaltung des mittelassyrischen kron-
landes. Altorientalische Forschungen 21, 13e30.
Gallant, F., 1992. Risk and Survival in Ancient Greece: Reconstructing the
Rural Domestic Economy. Stanford University Press, Stanford.
Guest, E., 1966. Flora of Iraq. Ministry of Agriculture, Baghdad.
Issar, A., Zohar, M., 2004. Climate Change: Environment and Civilization in
the Middle East. Springer, Berlin.
Landsberger, B., 1949. Jahreszeiten im Sumerisch-Akkadischen. Journal of
Near Eastern Studies 8, 273e297.
Lurie, G.R., Sydelko, P., Taxon, T., 2002. An object-oriented geographic informa-
tion system toolkit for web-based and dynamic decision analysis applications.
Journal of Geographic Information and Decision Analysis 6 (2), 108e116.
Miglus, P., 1996. Das Wohngebiet von Assur: Stratigraphie und Architektur.
Wissenschaftliche Veroffentlichung der Deutschen Orient-Gesellschaft
93-Text. Gebr. Mann, Berlin.
Mulders, H.A., 1969. The Arid Soils of the Balikh Basin. Syria. Ph.D. disser-
tation. Utrecht University, Utrecht.
Neitsch, S.L., Arnyold, J.G., Kiniry, J.R., Williams, J.R., King, K.W., 2002.
Soil and Water Assessment Tool Theoretical Documentation, Version
2000. Blackland Research Center, Temple, TX.
NOAA (National Oceanic and Atmospheric Administration), 2007. Environ-
mental Data Rescue Program. http://docs.lib.noaa.gov/rescue/data_rescue_
iraq.html.
North, M., Macal, C., 2007. Managing Business Complexity: Discovering
Strategic Solutions with Agent-Based Modeling and Simulation. Oxford
University Press, New York.
Postgate, N., 1989. The ownership and exploitation of land in Assyria in the 1st
Millennium B.C., in: Lebeau, M., Talon, P. (Eds.), Reflets des Deu Fleuves:
Volume de Melanges Offerts a Andre Finet. Peters, Leuven, pp. 141e152.
Renger, J., 1995. Institutional, communal, and individual ownership or pos-
session of arable land in ancient Mesopotamia from the end of the
fourth to the end of the first millennium. Chicago Kent Law Review
71, 269e319.
Russell, K.W., 1988. After Eden: The Behavioral Ecology of Early Food Pro-
duction in the Near East and North Africa. BAR International Series 391.
British Archaeological Reports, Oxford.
Sørensen, P., Jensen, E.S., Nielsen, N.E., 1994. The fate of 15N-labelled
organic nitrogen in sheep manure applied to soils of different texture under
field conditions. Plant and Soil 162 (1), 39e47.
SWAT (Soil and Water Assessment Tool), 2007. Input/Output File Documen-
tation. http://www.brc.tamus.edu/swat/doc.html.
Sweet, L.E., 1974. Tell Toqaan, a Syrian Village. University of Michigan
Press, Ann Arbor.
Thalen, D.C.P., 1979. Ecology and Utilization of Desert Shrub Rangelands in
Iraq. W. Junk Publications, The Hague.
van Driel, G., 1995. Cattle in the Neo-Babylonian period. Bulletin of Sumerian
Agriculture 8, 215e240.
van Driel, G., 2000. The Mesopotamian north: Land use, an attempt. In:
Jas, R.M. (Ed.), Rainfall and Agriculture in Northern Mesopotamia, Pro-
ceedings of the Third MOS Symposium (Leiden 1999). Nederlands Histor-
isch-Archaeologisch Instituut, Istanbul, pp. 265e299.
van Koppen, F., 2001. The organization of institutional agriculture in Mari.
Journal of the Economic and Social History of the Orient 44 (4), 451e
504.
van Liere, W., 2003. Survey of Soil, Present Land Use and Land Capabilities
of the Jezireh. Bloomsbury, London.
Wiggermann, F.A.M., 2000. Agriculture in the Northern Balikh Valley: The
case of Middle Assyrian Tell Sabi Abyad. In: Jas, R.M. (Ed.), Rainfall
and Agriculture in Northern Mesopotamia, Proceedings of the Third
MOS Symposium (Leiden 1999). Nederlands Historisch-Archaeologisch
Instituut, Istanbul, pp. 171e231.
Wilkinson, T.J., 1989. Extensive sherd scatters and land-use intensity: Some
recent results. Journal of Field Archaeology 16 (1), 31e46.
Wilkinson, T.J., 1994. The structure and dynamics of dry-farming states in
upper Mesopotamia. Current Anthropology 35 (5), 483e520.
Wilkinson, T.J., 1997. Environmental fluctuations, agricultural production and
collapse: A view from Bronze Age Upper Mesopotamia. In: Dalfes, H.N.,
Kukla, G., Weiss, H. (Eds.), Third Millennium BC Climate Change and
Old World Collapse. Springer, Berlin, pp. 67e106.
Wilkinson, T.J., Gibson, M., Christiansen, J.H., Widell, M., Schloen, D.,
Kouchoukos, N., Altaweel, M., Ur, J., Hritz, C., 2007. Modeling settlement
systems in a dynamic environment: Case studies from Mesopotamia. In:
Kohler, T.A., Leeuw, S.D. (Eds.), Model-Based Archaeology of Sociona-
tural Systems. SAR Press, Santa Fe, pp. 175e208.
Zaccagnini, C., 1979. Notes on the Nuzi surface measures. Ugarit-Forschung
11, 849e856.