investigating economic and demographic factors … · page | 1 investigating economic and...
TRANSCRIPT

Investigating Economic and Demographic Factors Affecting Consumer Demand for
Coconut-milk in the United States
Jing Li
Department of Agricultural Economics
Texas A&M University
Senarath Dharmasena
Department of Agricultural Economics
Texas A&M University
Selected Paper prepared for presentation at the 2016 Agricultural & Applied Economics
Association Annual Meeting, Boston, Massachusetts, July 31-August 2
Copyright 2016 by Jing Li and Senarath Dharmasena. All rights reserved. Readers may make
verbatim copies of this document for non-commercial purposes by any means, provided that this
copyright notice appears on all such copies.
P a g e | 1
Investigating Economic and Demographic Factors Affecting Consumer Demand for
Coconut-milk in the United States
Abstract
Data from U.S. households for calendar year 2014 were used in examining demographic
and economic factors affecting demand for dairy alternative beverages such as coconut milk,
almond milk, soymilk, and lactose free milk using Heckman two-step procedure. Preliminary
analysis of data reveal that the own-price elasiticity of demand for almond milk, soymilk, dairy
milk in the United States is -3.50, -1.68,and -0.53 respectively. Soymilk is found to be a
substitute for almond milk and white milk, while white milk was found to be a substitute for
soymilk. Income, age, employment status, education level, race, ethnicity, region and presence
of children in a household are significant drivers of demand for soymilk and almond milk.
Sample selection bias was statistically significant.
Keywords: Dairy alternative beverages, coconut-milk, almond milk, soymilk, lactose free milk
probit model, Heckman two-step procedure, Nielsen Homescan data
JEL Classification: D11, D12

P a g e | 2
Background and Justification
The Dairy Alternative Beverages Market
Dairy alternative beverages are plant-based milk which is extracted through grains, nuts and
seeds. Unlike the regular dairy beverages they have low cholesterol and low fat content. With
the increase in awareness, rising health concerns, and the increasing vegan population, in the
United States, the demand for dairy alternative beverages is increasing in the past decades.
According to the “Global Dairy Alternative Beverages Market 2014-2018”, the global dairy
alternatives market is estimated to grow at a rate of 16% over the period 2013-2018. In terms
of value, the global dairy alternative beverages market is projected to reach about $19.5 billion
by 2020. In 2014, the global consumption of dairy alternatives was 583.2 KT, and is projected to
grow at a rate of about 15.2% from 2015 to 2020 (Dairy Alternatives Market-Global Forecast to
2010).
The Dairy alternative beverages market can be segmented into four divisions: Soymilk, Almond
Milk, Coconut Milk, and Others (rice milk, hazelnut milk, hemp milk, and oat milk). Soymilk used
to be dominated in the dairy alternative beverages market. However, in recent years, consumer
migrated from soymilk to other dairy alternatives such as almond milk and coconut milk due to
taste, health concerns and calories. It is estimated that sales of soymilk in U.S. declined 5.8%
from $981 million in 2009 to $924 million in 2010, and another 8.5% in 2010 reaching $846
million in 2011. In 2012, almond milk has overtaken soymilk and has become America’s most

P a g e | 3
popular plant-based milk alternative accounting for 4.1% of total milk sales (KCT.org, 2014). In
2014, Almond Milk took the top spot of U.S. dairy alternative beverages market with 65.5% of
the market share, which puts soymilk in the second spot with a 30% share of the market. To put
this into context, almond milk had captured only 3% of the market in 2008. Almond milk aids in
improving the immune function and helps in reducing the risk of osteoporosis. Moreover, it
contains no hormones and is prescribed by dermatologists to patients with acne. Almond milk
is a good source of unsaturated fats, is rich in proteins and omega fatty acids, and is derived
from natural almond oils. It helps in improving vision, strengthens the bone, maintains
cardiovascular health, building strong muscles, and aids in controlling the blood pressure.
Considering all the advantages of almond milk, it has a great potential to growth in the U.S.
dairy alternative beverages market. As it shown in the Information Resources Inc. (IRI), Chicago,
refrigerated almond milk dollar sales increased 24% in the 52 weeks ending May 17, 2015.
Other dairy alternative beverages like Coconut Milk also show great potential for growth.
According to data from Information Resources Inc. (IRI), Chicago, refrigerated coconut milk
dollar sales grew by 9.2% in the 52 weeks ending May 17, 2015. Coconut milk took the
fourth-largest part of the dairy alternatives segment, with 3% market share last year(2015) (Soy
and Almond Milk Production in the U.S., 2015).
P a g e | 4
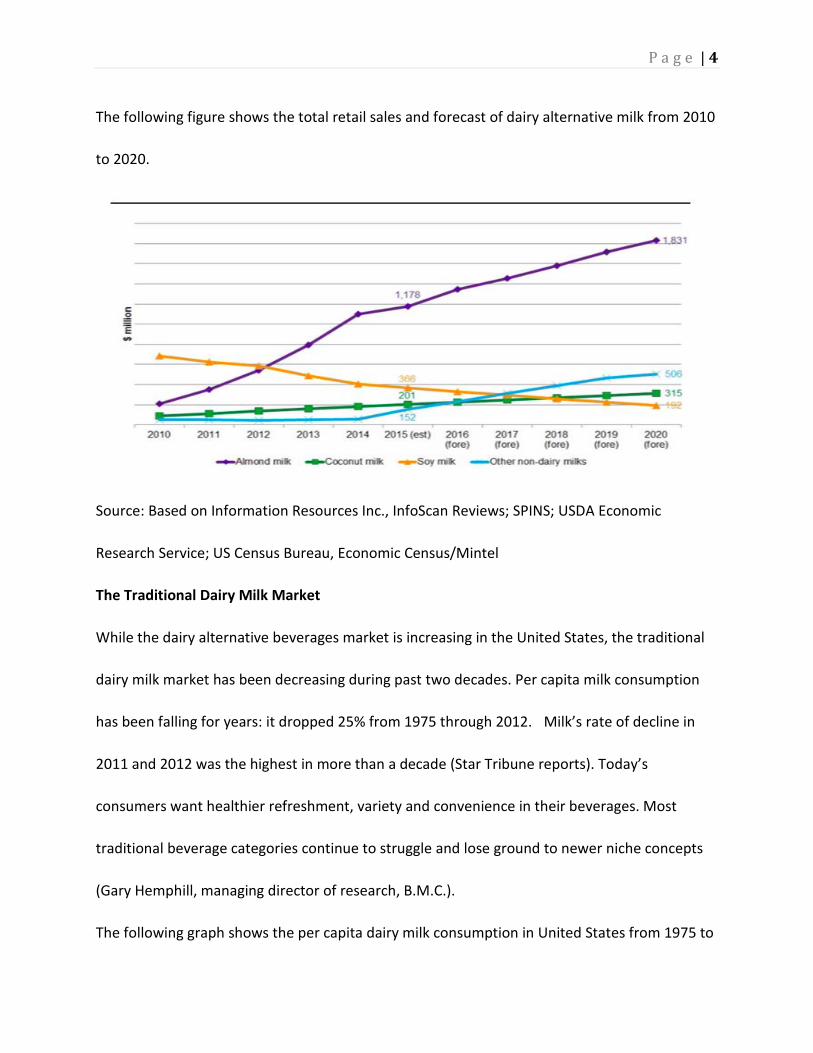
The following figure shows the total retail sales and forecast of dairy alternative milk from 2010
to 2020.
Source: Based on Information Resources Inc., InfoScan Reviews; SPINS; USDA Economic
Research Service; US Census Bureau, Economic Census/Mintel
The Traditional Dairy Milk Market
While the dairy alternative beverages market is increasing in the United States, the traditional
dairy milk market has been decreasing during past two decades. Per capita milk consumption
has been falling for years: it dropped 25% from 1975 through 2012. Milk’s rate of decline in
2011 and 2012 was the highest in more than a decade (Star Tribune reports). Today’s
consumers want healthier refreshment, variety and convenience in their beverages. Most
traditional beverage categories continue to struggle and lose ground to newer niche concepts
(Gary Hemphill, managing director of research, B.M.C.).
The following graph shows the per capita dairy milk consumption in United States from 1975 to
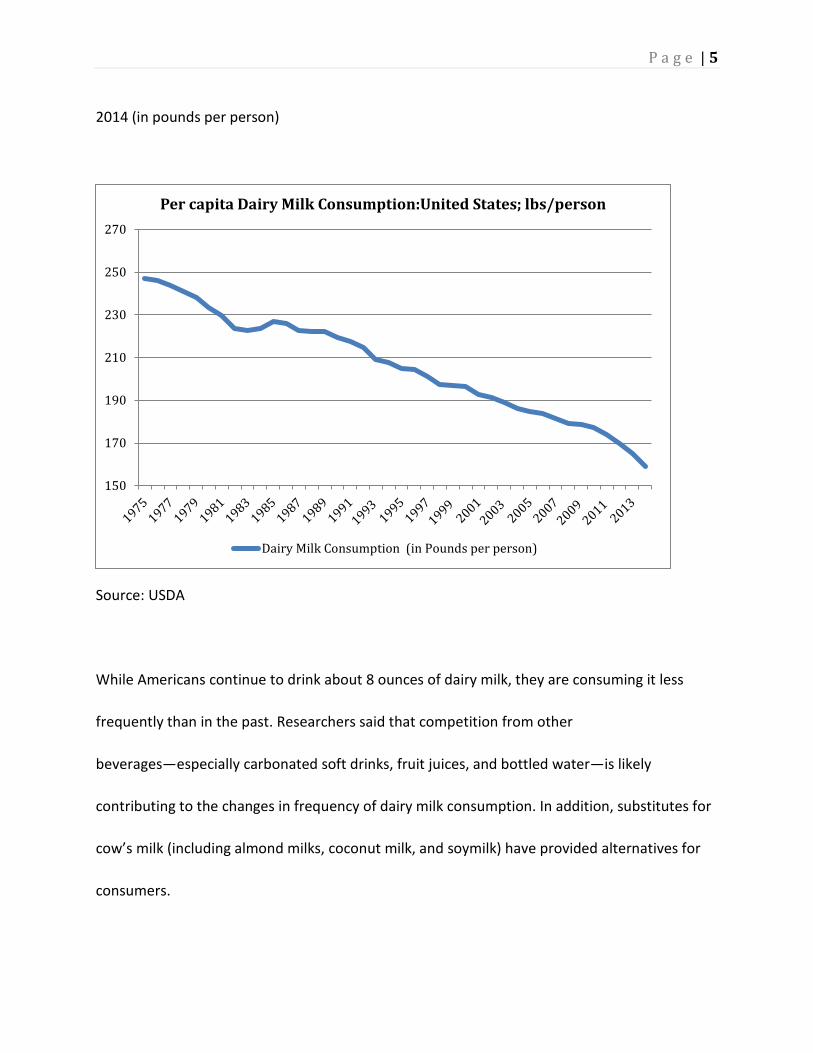
P a g e | 5
2014 (in pounds per person)
Source: USDA
While Americans continue to drink about 8 ounces of dairy milk, they are consuming it less
frequently than in the past. Researchers said that competition from other
beverages—especially carbonated soft drinks, fruit juices, and bottled water—is likely
contributing to the changes in frequency of dairy milk consumption. In addition, substitutes for
cow’s milk (including almond milks, coconut milk, and soymilk) have provided alternatives for
consumers.
150
170
190
210
230
250
270
Per capita Dairy Milk Consumption:United States; lbs/person
Dairy Milk Consumption (in Pounds per person)

P a g e | 6
The following graph shows the consumption of total beverage milk, low-fat milk and whole milk
in United States from 1970 to 2012.
Source: USDA, Economic Research Service, Food Availability Data System
From the above graph, we can see that the people in the United States tend to drink more
low-fat milk, and the consumption of whole milk is decreasing significantly since 1970s. Since
dairy alternative beverages contain less fat, it might be one of the reasons why it’s a popular
substitute for dairy milk. To make their product more competitive, dairy milk companies is
going to force stressing the protein levels of their products, along with other healthy added
ingredients such as "ancient grains." More flavored milks will be introduced as well as
P a g e | 7
additional organic milk products.
Research on the Demand for Dairy Alternative Beverages Market
While the research about dairy alternative beverages’ benefits with emphasis on the healthy
ingredient and performance edge are abundant, when it comes to the demand analysis for
dairy alternative beverage, especially the economic and demographic factors, the research is
scarce. Fengxia Dong (2006) researched the Asian diary market considering the effects of
demographics, income, and prices. By using Heien and Wessells’s technique, he found that
dairy product consumption growth is decomposed into contributions generated by income
growth, population growth, price change, and urbanization and these contributions are
quantified. He also found that dairy market growth would be mostly driven by income and
population growth and, as a result, would raise world dairy prices. Dharmasena and Capps
(2014) used data from U.S. households for year 2008 to exam market competitiveness of
soymilk via tobit procedure. They found that unconditional own and cross-price elasticities are
larger than their conditional counterparts. Income, age, employment status, education level,
race, ethnicity, region and presence of children are significant drivers affecting the demand for
soymilk. They also found that white milk and flavored milk are competitors for soymilk, and
soymilk is a competitor for white milk. Copeland and Dharmasena (2015) investigated the
growth of the dairy alternative beverage market in the United States. By using household-level
purchase data from 2011 Nielsen Homescan panel and tobit econometric procedure, they
estimated the conditional and unconditional own-price, cross-price and income elasticities for
P a g e | 8
soymilk and almond milk. They also found that incomes, age, employment status, education
level, race, ethnicity, region and presence of children are significant drivers affecting the
demand for dairy alternative beverages. However, according to best of our knowledge, authors
could not find a study investigating consumer demand for coconut milk.
Coconut Milk Market in the United States
Coconut-milk has been used primarily in Southeast Asian cooking for ages. Recent years,
consumers are showing new interest in coconut milk as a substitute of dairy beverage. With the
2014 Innova trend report showing that coconut milk product introductions grew 36% from
2012 to 2013, it's proving to be a popular addition to many consumers' kitchens. Also, the
Packaged Facts report noted that coconut milk dollar sales were up double-digits from 2013 to
2014.
The potential reasons that made coconut milk become popular are likely as follows: (1)
compared with traditional dairy beverage, coconut milk has more flavors such as: vanilla,
original, unsweetened and chocolate, which provide more choices for consumers. (2) Coconut
milk contains more calcium and vitamin than dairy milk. For example, due to fortification, Silk
Coconut milk has a mildly nutty taste with 50% more calcium than dairy milk. It's also a great
source of vitamin D because of the same reason. (3) Coconut milk has fewer calories and fat
than milk, which may be better for consumers who intend to drink it regularly. (4) Lactose
intolerance is ubiquitous and coconut milk is a good substitute for milk for those people who

P a g e | 9
are lactose intolerant. Approximately 65% of the human population has a reduced ability to
digest lactose after infancy. Lactose intolerance in adulthood is most prevalent in people of East
Asian descent, affecting more than 90% of adults in some of these communities. In the United
States, as many as 90% of Asian Americans and 75% of African Americans and Native Americans
are lactose intolerant. Coconut milk is a good substitute of milk for those people. (5) With
greater consumer awareness of coconut water as a beneficial sports drink substitute, people
are becoming more interested in coconut-based products.
Despite so many advantages that coconut milk has, market researches noticed that repeat
purchases are weak in coconut milk, partly due to the flavor, which is not as universally
appealing as that of almond milk. Another reason might be the rising costs for coconut milk
producers have been partially passed on to consumers, which has reduced demand. Therefore,
to uncover the market competitiveness of coconut milk, in the dairy alternative beverage
marketplace in the United States, further research is warranted.
Objectives
Based on the fact that the dairy alternative beverage market is competitive and dynamic while
research about the market demand for those beverages is scarce, information about the price
sensitivities, substitutes or complements and demographic profiling with respect to
consumption of those beverages is important for related manufacturers, retailers, advertisers
and other stakeholders. More specifically, the main objectives of this study are to (1) analyze
P a g e | 10
the demographic and economic factors that influence decision to purchase coconut milk,
almond milk, soymilk, dairy milk (regular) and dairy milk (lactose free); (2) estimate the income
elasticity, own-price elasticity and cross-price elasticity of those beverages; (3) once the
decision to purchase these beverages is made, we want to find out the factors that determine
the volume of consumption; (4) make some suggestion with respect to marketing as well as
advertising strategies for those beverages in the dynamic and competitive marketplace.
Data and Methodology
DATA
The data we used for this study is the 2014 Nielsen Homescan scanner data. There are two
types of scanner data that are collected on consumer and/or purchase/consumption:
point-of-sale scanner data and household-based scanner data. Point-of-sale scanner data are
collected at cash registers and identify the products, quantities sold, and prices paid.
Point-of-sale scanner data have been used in academic research since the early 1980s. On the
other hand, household-based scanner data are a relatively recent innovation. Household-based
scanner data come from a sample of households that scan universal product codes (UPCs) of all
purchased products after each shopping trip. These data are unique in that they provide
information on household demographic characteristics that are not available in store scanner
data. Moreover, because the household scanner data panelists are instructed to scan all
purchases from all outlets, it’s more like a first-hand data and thus more accurate and complete

P a g e | 11
than point-of-sale scanner data. In this paper, we use household-based scanner data to do all
the analysis.
Nielsen started collecting in-home household scanner data in 1989. Both the number of the U.S.
Homescan panelists and the number of projectable geographic areas have expanded
substantially over the years. The Nielsen Homescan data consist of a panel of households who
record their grocery purchases. The purchases data can come from a wide variety of store types,
including traditional food stores, supercenters and warehouse club and online merchants.
Interested consumers who are 18 or older register online to participate and are asked to supply
demographic information. Consumers must report data for at least 10 of 12 months during the
year to be included in the static sample.
Methodology
In this paper, first, we plan to find out the demographic factors affecting consumer’s decision to
buy dairy alternative beverages such as coconut milk, almond milk and soymilk. In other words,
try to calculate the factors affecting the probability of consumption of those beverages. We are
using probit model to achieve this objective. Once the decision to purchase the beverage is
made, we will use conditional demand function to estimate factors affecting the volume of
purchase of each beverage. This procedure is formally known as Heckman two-step (Heckman,
1979) sample selection procedure.
P a g e | 12
The Probit Model
In this study, there is large number of households who didn’t buy dairy alternative beverages.
This decision to purchase or not to purchase could be affected by various
socio-economic-demographic factors. Buy or not-to buy is a dichotomous discrete (“one” if buy
and “zero” if do not buy) and this kind of consumption behavior leads to corner solutions for
some nontrivial fraction of the population. Application of ordinary least squares to estimate this
kind of regression gives rise to biased estimates even asymptotically (Kennedy 2003). In this
case, a binary probit model is used to generate probability of consumption of dairy alternative
beverages given a host of demographic factors and a weighted average price of dairy
alternative beverages such as coconut milk, almond milk, soymilk and dairy milk (regular and
lactose free. The stochastic model underlying the Probit Model generally represented as
follows:
(1) 𝑃𝑖 = 𝐹𝑝(𝑋𝑖′𝛽) = 𝐹𝑝(𝑍𝑖) = ∫ 1√2𝜋
𝑒
𝑍𝑖2
2�
𝑑𝑑𝑍𝑖−∞
where 𝑋′are explanatory variables and 𝛽 are regression coefficients. Because buy or
not-to buy is a dichotomous problem, we need to run the index values 𝑍𝑖 through a
standard normal cumulative distribution function, 𝐹𝑝(𝑍𝑖). Thus, we get at probabilities
𝑃𝑖 that are bounded by 0-1 interval.
P a g e | 13
For the dichotomous event, we have:
(2) 𝑃𝑟(𝑍 = 1|𝑋,𝛽) = 𝐹𝑝(𝑍𝑖)
(3) 𝑃𝑟(𝑍 = 0|𝑋,𝛽) = 1 − 𝐹𝑝(𝑍𝑖)
We use maximum likelihood estimation technique to estimate the unknown parameters, 𝛽.
First, let us take a sample of n individual observations on individual choices 𝑦𝑖. The probability
density functions of the observable variables 𝑦𝑖 can be specified as follows:
(4) 𝑔(𝑦𝑖) = 𝑃𝑖𝑦𝑖(1 − 𝑃𝑖)1−𝑦𝑖
Joint probability density function of the sample of n independent observations is the product of
the n probability density functions 𝑔(𝑦𝑖). Mathematically:
(5) 𝑔(𝑦1, 𝑦2,𝑦3,⋯, 𝑦𝑛) = ∏ 𝑔(𝑦𝑖)𝑛𝑖=1
Substituting (4) in (5) gives us the following:
(6) 𝑔(𝑦1, 𝑦2,𝑦3,⋯, 𝑦𝑛) = ∏ 𝑃𝑖𝑦𝑖(1 − 𝑃𝑖)1−𝑦𝑖𝑛
𝑖=1
Because
(7) 𝑃𝑖 = 𝐹𝑝(𝑍𝑖) = 𝐹𝑝(𝑥𝑖′𝛽)
Substituting (7) in (6) gives us the following likelihood function:

P a g e | 14
(8) 𝑔(𝑦1, 𝑦2,𝑦3,⋯, 𝑦𝑛) = ∏ 𝐹𝑝(𝑥𝑖′𝛽)𝑦𝑖[1 − 𝐹𝑝(𝑥𝑖′𝛽)]1−𝑦𝑖𝑛𝑖=1
(9) 𝑙(𝛽) = ∏ 𝐹𝑝(𝑥𝑖′𝛽)𝑦𝑖[1 − 𝐹𝑝(𝑥𝑖′𝛽)]1−𝑦𝑖𝑛𝑖=1
In probit model estimation either the researcher can maximize (9) and solve for 𝛽s or can
maximize the log of the likelihood function stated in equation (10):
(10) 𝑙(𝛽) = ∑ 𝑦𝑖𝑛𝑖=1 ln (𝐹𝑝(𝑥𝑖′𝛽)) + ∑ (1 − 𝑦𝑖) ln(1 − 𝐹𝑝𝑛
𝑖=1 (𝑥𝑖′𝛽))
Above maximum likelihood estimator for probit model has large sample properties where,
with large n, the maximum likelihood estimator 𝛽 has a sampling distribution that is
approximately normal with mean 𝛽 and covariance matrix:
(11) 𝑐𝑐𝑐(𝛽)� = (𝑋′𝐷𝑋)−1
where X is the (n × k ) design matrix of observations on k explanatory variables for n individuals.
Design matrix has diagonal elements as depicted in equation (12):
(12) 𝑑𝑖 = [𝑓(𝑥𝑖′𝛽)]2
𝐹(𝑥𝑖′𝛽)[1−𝐹(𝑥𝑖
′𝛽)]

P a g e | 15
where 𝑓(𝑥𝑖′𝛽)and 𝐹(𝑥𝑖′𝛽) are the probability density function and cumulative distribution
function for standard normal random variable, respectively.
Unlike the usual linear statistical model, the parameter value of 𝛽 in probit model cannot be
directly interpretable as the effect of change of explanatory variable on the mean of the
dependent variable. Let us differentiate equation for probit model (1) with respect to 𝑋𝑖𝑖. With
the help of the chain rule in differentiation, we can write the following:
(13) 𝜕𝑃𝑖𝜕𝑋𝑖𝑖
= 𝜕𝐹(𝑍𝑖)𝜕𝑍𝑖
∗ 𝜕𝑍𝑖𝜕𝑋𝑖𝑖
= 𝑓(𝑍𝑖) ∗ 𝛽
where 𝑓 (𝑍𝑖 )is the probability density function of the standard normal distribution.
Therefore, to calculate the marginal effect of a continuous explanatory variable in probit model,
first we need to calculate the probability density value for a given value of explanatory variable
and multiply that by the parameter estimate of the respective explanatory variable.
Marginal effect calculation for a discrete explanatory variable (0-1 type dummy variable) is
different from above approach. The appropriate marginal effect for a binary independent
variable, say 𝑑, would be as follows:
(14) 𝜕𝑃𝑖𝜕𝑑𝑖𝑖
= 𝑓(𝑥𝑖′𝛽,𝑑 = 1) − 𝑓(𝑥𝑖′𝛽,𝑑 = 0)
where 𝑓 (𝑥𝑖′𝛽) is the probability density function of the standard normal distribution.
P a g e | 16
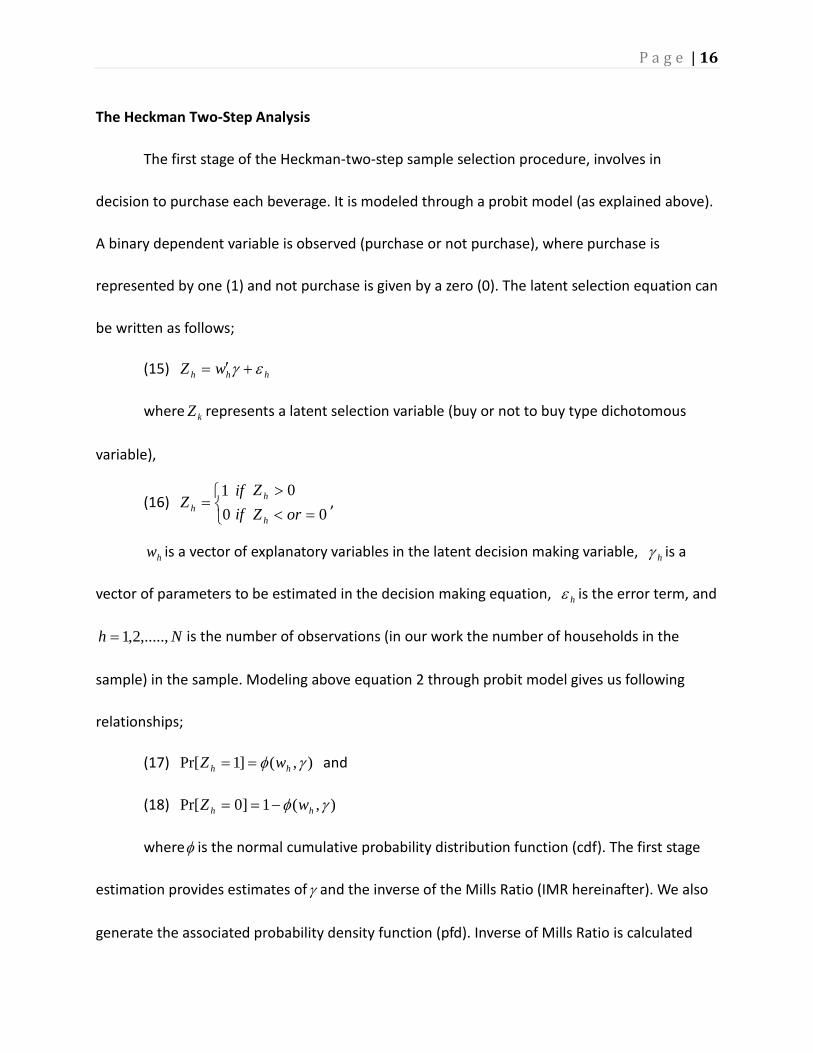
The Heckman Two-Step Analysis
The first stage of the Heckman-two-step sample selection procedure, involves in
decision to purchase each beverage. It is modeled through a probit model (as explained above).
A binary dependent variable is observed (purchase or not purchase), where purchase is
represented by one (1) and not purchase is given by a zero (0). The latent selection equation can
be written as follows;
(15) hhh wZ εγ +′=
where kZ represents a latent selection variable (buy or not to buy type dichotomous
variable),
(16)
=01
hZifif
00
=<>
orZZ
h
h ,
hw is a vector of explanatory variables in the latent decision making variable, hγ is a
vector of parameters to be estimated in the decision making equation, hε is the error term, and
Nh ,.....,2,1= is the number of observations (in our work the number of households in the
sample) in the sample. Modeling above equation 2 through probit model gives us following
relationships;
(17) ),(]1Pr[ γφ hh wZ == and
(18) ),(1]0Pr[ γφ hh wZ −==
whereφ is the normal cumulative probability distribution function (cdf). The first stage
estimation provides estimates ofγ and the inverse of the Mills Ratio (IMR hereinafter). We also
generate the associated probability density function (pfd). Inverse of Mills Ratio is calculated

P a g e | 17
taking the ratio of pdf to cdf. Mathematically, it is as follows;
for 1=kZ ,
(19) )ˆ()ˆ(
γφγϕ
h
hh w
wIMR = ,
whereϕ represents the probability density function. Inverse mills ratio is a monotone
decreasing function of the probability that an observation is selected into the sample, )ˆ( kkw γφ
(Heckman, 1979). In particular,
(20) 0lim 1)( =→ hZ IMRhiφ
(21) ∞=→ hZ IMRhi 0)(limφ
(22) 0)(<
∂∂
h
h
ZIMRφ
The calculated IMR, will be used as an additional explanatory variable in the second
stage volume equation, which takes care of the sample selection bias in the data. Second stage
equation is given as follows;
(23) )ˆ()ˆ(
]1|[γφγϕ
αβh
hhhh w
wXZYE +′==
(24) hhhh RIMXZYE ˆ]1|[ αβ +′==
where kX is a vector of explanatory variables considered in the second stage. Importantly, only
observations associated with non-zero observations on kY are considered here. The IMR
calculated using information retrieved from first stage probit model is used as an explanatory
variable in the second stage (see equations 23 and 24 above). Presence of a sample selection
bias in data will be communicated through statistical significance of the coefficient associated

P a g e | 18
with IMR, i.e. kα . If kα is statistically not different from zero, we conclude that there is no
sample selection bias in the data and result in the following regression model;
(25) ihhh XZYE β′== ]1|[
It is important to know that the explanatory variables in first stage and second stage equations
may or may not be the same. In our work, the price variables in both equations do not. However,
rest of the demographic variables is exactly the same in the first stage and second stage.
Choice of explanatory variables in the first and second stage has an implication on the
derivation and interpretation of marginal effects associated with variables in the second stage.
This is because in the second stage, we have the IMR term augmenting the regular regression
function with other explanatory variables. Therefore, in calculating marginal effects, the
influence of IMR and its associated regression coefficient on other regression coefficients have
to be taken into consideration.
Suppose kjX denote the jth regressor that is common to both first stage regressors, kw and,
second stage regressors, jX . Differentiating equation 24 with respect to jth regressor, the
marginal effect is given by the following relationship (following explanation is borrowed from
Saha, Capps and Byrne (1997));
(26) hj
hiiij
kj
hh
XRIM
XZYE
∂∂
+=∂
=∂ )ˆ(]1|[αβ
P a g e | 19
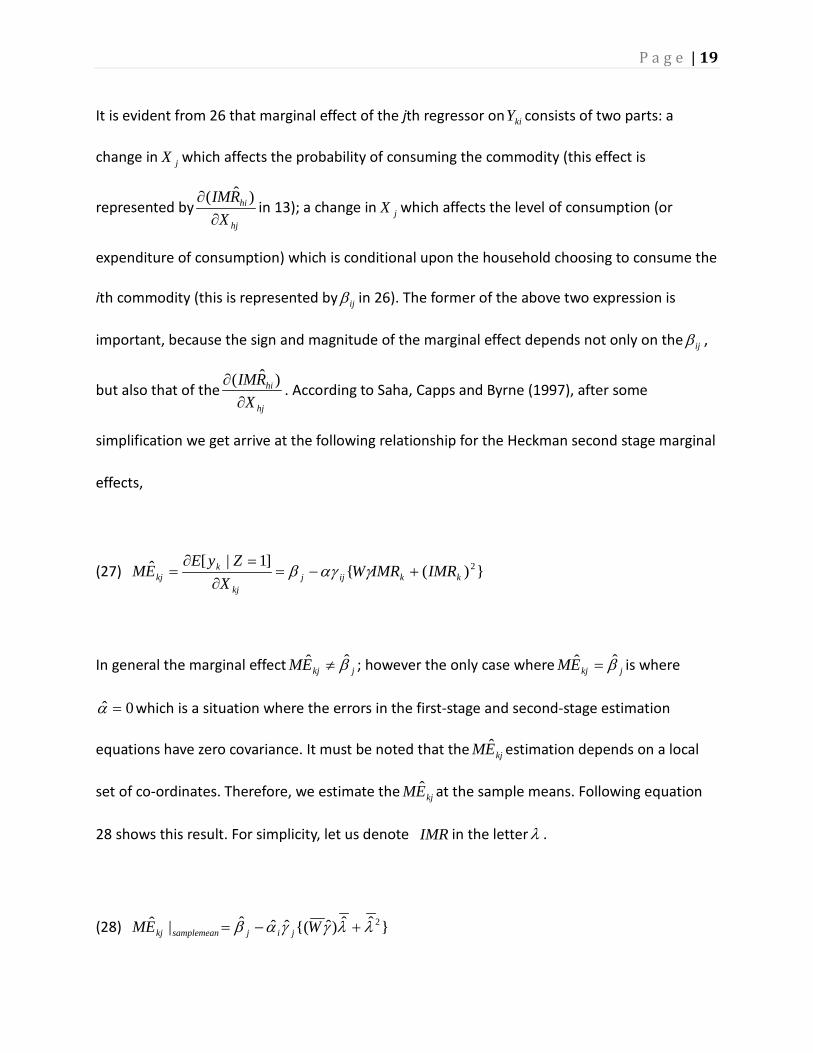
It is evident from 26 that marginal effect of the jth regressor on kiY consists of two parts: a
change in jX which affects the probability of consuming the commodity (this effect is
represented byhj
hi
XRIM
∂∂ )ˆ(
in 13); a change in jX which affects the level of consumption (or
expenditure of consumption) which is conditional upon the household choosing to consume the
ith commodity (this is represented by ijβ in 26). The former of the above two expression is
important, because the sign and magnitude of the marginal effect depends not only on the ijβ ,
but also that of thehj
hi
XRIM
∂∂ )ˆ(
. According to Saha, Capps and Byrne (1997), after some
simplification we get arrive at the following relationship for the Heckman second stage marginal
effects,
(27) })({]1|[ˆ 2
kkijjkj
kkj IMRIMRW
XZyE
EM +−=∂
=∂= γαγβ
In general the marginal effect jkjEM β̂ˆ ≠ ; however the only case where jkjEM β̂ˆ = is where
0ˆ =α which is a situation where the errors in the first-stage and second-stage estimation
equations have zero covariance. It must be noted that the kjEM ˆ estimation depends on a local
set of co-ordinates. Therefore, we estimate the kjEM ˆ at the sample means. Following equation
28 shows this result. For simplicity, let us denote IMR in the letterλ .
(28) }ˆˆ)ˆ{(ˆˆˆ|ˆ 2λλγγαβ +−= WEM jijsamplemeankj
P a g e | 20
whereW denotes the vector of regressor sample means in the probit equation (the first stage
equation of the Heckman two-step model and
(29) )ˆ()ˆ(ˆ
γφγϕλ
WW
=
is the inverse Mills ratio evaluated at those means.
The Heckman two-step demand model for say coconut-milk can be written as follows:
(30)
iiiii
ii
ii
ii
iii
iii
iii
iiii
iiii
iiii
IMRINCOMEFHONLYMHONLYANDAGEPCLTONLYANDAGEPC
ONLYAGEPCLTONLYAGEPCLTONLYAGEPCONLYAGEPC
ONLYAGEPCLTYESHISPOTHERRACEORIENTALRACEBLACKRACEWESTREG
SOUTHREGCENTRALREGEDUHHPCEDUHHUEDUHHHSEMPHHFTEMPHHPT
AGEHHGTAGEHHAGEHHAGEHHAGEHHAGEHHPq
εαβββββ
ββββ
βββββββββ
ββββββββ
ββββ
++++++
++++
++++++
+++++++
++++++++=
302928
2726
2524
2322
212019
181716
151413
1211109
8765
4321
17_1312_6_617_1312_617_13_612_6_6
17_1312_6_6__
_____
6455644554354430342529
where ni ,......,1= is the number of observations (households in our work) in the model. iq
corresponds to the quantity of purchase of coconut milk and iP variable represent the price of
all beverage products considered in this study. We have defined the variables in the above
equation 30 in Table 1. In the equation 30, IMR stands for the inverse Mills ratio and iα
corresponds to the coefficient associated with IMR. Presence of sample selection bias is
determined looking at the significance of iα . If we have sample selection bias, we have to do an
adjustment to the coefficient estimates in the second stage estimation in trying to get at correct
P a g e | 21
marginal effects. Procedure to adjust for marginal effects was elaborated in the preceding
section.
As such, we will calculate marginal effects associated with each explanatory variable. The level
of significance we will be using in this study is 0.05. We further conduct an F-test for
demographic variable categories to find statistically significant demographics.
Results and Discussion
We will be in position to estimate own-price, cross-price and expenditure elasticities for the
separable group of goods, namely coconut milk, almond milk, soymilk, dairy milk. Also, we will
be profiling demographic characteristics of consumers with regards to these food groups.
Preliminary analysis of data reveal that the own-price elasiticity of demand for almond milk,
soymilk, dairy milk in the United States is -3.50, -1.68,and -0.53 respectively. Soymilk is found to
be a substitute for almond milk and white milk, while white milk was found to be a substitute
for soymilk. Income, age, employment status, education level, race, ethnicity, region and
presence of children in a household are significant drivers of demand for soymilk and almond
milk.

P a g e | 22
References
Beverage Industry, 2011, “Substitutions expand non-dairy options.” Internet access:
http://www.bevindustry.com/articles/85060-substitutions-expand-nondairy-options?v=
preview (accessed on May 23, 2016)
Beverage Industry, 2015, “Almond milk continues to lead dairy alternatives segment.” Internet
access:
http://www.bevindustry.com/articles/87980-almond-milk-leads-growth-in-the-dairy-alte
rnatives-segment?v=preview (accessed on May 23, 2016)
Copeland, A., S. Dharmasena, 2015. “Consumer Demand for Dairy Alternative Beverages in the
United States and its Implication to U.S. Dairy Industry.” Selected paper presentation
presented at the Agricultural and Applied Economics Association (AAEA) annual
meetings, San Francisco, CA
Dharmasena, S., 2010, The Non-Alcoholic Beverage Market In The United States: Demand
Interrelationships, Dynamics, Nutrition Issues And Probability Forecast Evaluation, PhD
dissertation, Texas A&M University
Dharmasena, S., O.Capps Jr. 2014. “Unraveling Demand for Dairy-Alternative Beverages in the
United States: The Case of Soymilk.” Agricultural and Resource Economics
Review 43(1):140-157.
Dong, F, 2006, “The outlook for Asian dairy markets: The role of demographics, income, and
prices.” Food Policy, 31:260-271
Food navigator-usa, 2015, “Packaged Facts: Almond and coconut milk on fire; soy milk on the
skids; skim milk losing share.” Internet access:
http://www.foodnavigator-usa.com/Markets/Packaged-Facts-Almond-coconut-milk-on-fi
re-soy-milk-on-the-skids
Heckman, J. J., (1979). “Sample Selection Bias as a Specification Error”. Econometrica 47:
153-161

P a g e | 23
KCT.org, (2014) “Demand for Almond Milk is Growing, but is it Bad for the Planet?” Internet
access:
http://www.kcet.org/living/food/the-nosh/demand-for-almond-milk-is-soaring-but-is-it-b
ad-for-the-planet.html (accessed on January 6, 2016).
Kennedy, P. (2003). Limited Dependent Variables. A Guide to Econometrics, MIT Press.
Mary K., Muth Peter H., and Siegel Chen Zhen, 2007, Homescan Data Description, U.S.
Department of Agriculture Economic Research Service
Packaged Facts, 2015, Dairy and Dairy Alternative Beverage Trends in the U.S.
Research and Market, 2014, Global Dairy Alternative Beverages Market 2014-2018
Research and Market, 2015, Dairy Alternatives Market by Type (Soy milk, Almond milk, Rice milk,
Others), Formulation (Plain sweetened, Plain unsweetened, Flavored sweetened,
Flavored unsweetened), Application (Food & Beverages), & by Region - Global Forecast
to 2020
Saha, A., O.Capps. Jr, et al. (1997). "Calculating Marginal Effects in Dichotomous-Continuous
Models." Applied Economic Letters 4(3): 181-185.
StarTribune, 2014, “Fewer U.S. consumers drinking milk.” Internet access:
http://www.startribune.com/got-regular-milk-fewer-consumers-say-yes-these-days/250
482531/ (accessed on May 23, 2016)
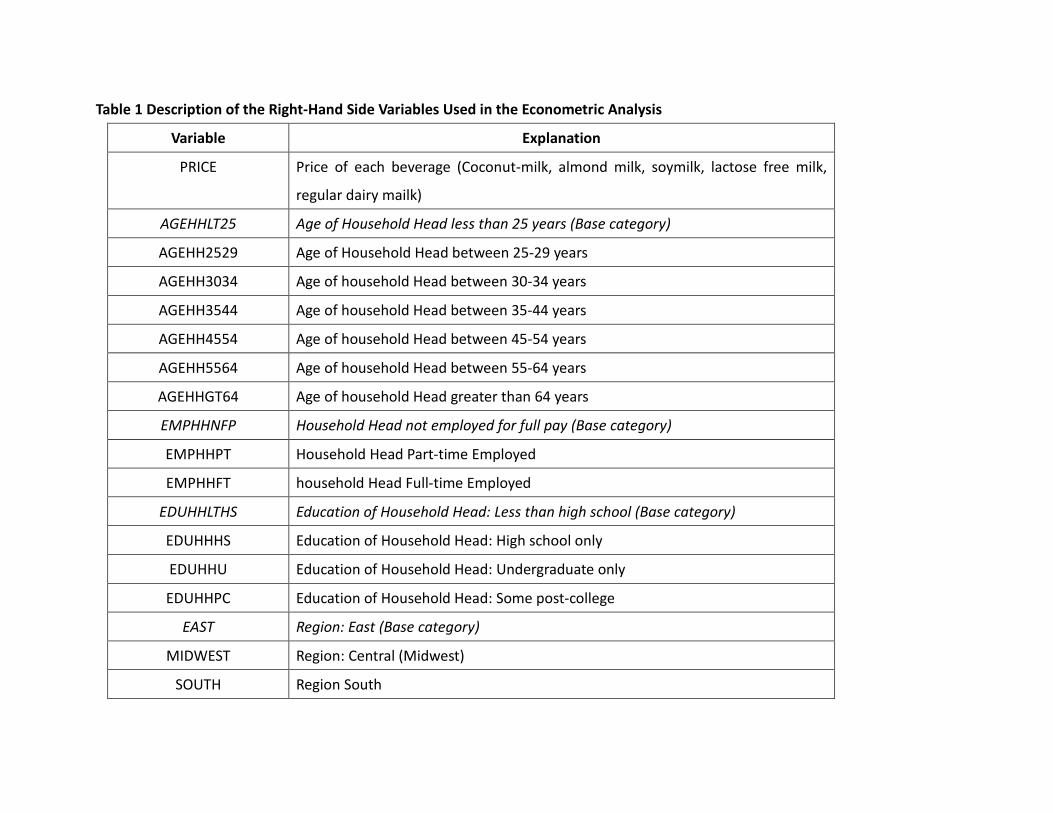
Table 1 Description of the Right-Hand Side Variables Used in the Econometric Analysis
Variable Explanation
PRICE Price of each beverage (Coconut-milk, almond milk, soymilk, lactose free milk,
regular dairy mailk)
AGEHHLT25 Age of Household Head less than 25 years (Base category)
AGEHH2529 Age of Household Head between 25-29 years
AGEHH3034 Age of household Head between 30-34 years
AGEHH3544 Age of household Head between 35-44 years
AGEHH4554 Age of household Head between 45-54 years
AGEHH5564 Age of household Head between 55-64 years
AGEHHGT64 Age of household Head greater than 64 years
EMPHHNFP Household Head not employed for full pay (Base category)
EMPHHPT Household Head Part-time Employed
EMPHHFT household Head Full-time Employed
EDUHHLTHS Education of Household Head: Less than high school (Base category)
EDUHHHS Education of Household Head: High school only
EDUHHU Education of Household Head: Undergraduate only
EDUHHPC Education of Household Head: Some post-college
EAST Region: East (Base category)
MIDWEST Region: Central (Midwest)
SOUTH Region South

P a g e | 25
WEST Region West
WHITE Race White (Base category)
BLACK Race Black
ASIAN Race Asians
RACE_OTHER Race Other (non-Black, non-White, non-Oriental)
HISP_NO Non-Hispanic Ethnicity (Base category)
HISP_YES Hispanic Ethnicity
NPCLT_18 No Child less than 18 years (Base category)
AGEPCLT6_ONLY Age and Presence of Children less than 6-years
AGEPC6_12ONLY Age and Presence of Children between 6-12 years
AGEPC13_17ONLY Age and Presence of Children between 13-17 years
AGEPCLT6_6_12ONLY Age and Presence of Children less than 6 and 6-12 years
AGEPCLT6_13_17ONLY Age and Presence of Children less than 6 and 13-17 years
AGEPC6_12AND13_17ON
LY
Age and Presence of Children between 6-12 and 13-17 years
AGEPCLT6_6_12AND13_
17
Age and Presence of Children less than 6, 6-12 and 13-17 years
FHMH Household Head both Male and Female (Base category)
MHONLY Household Head Male only
FHONLY Household Head Female only