investigating factors affecting brand awareness of … awareness factors 515 in the verbal learning...
TRANSCRIPT

511
Journal of Sport Management, 2009, 23, 511-544© 2009 Human Kinetics, Inc.
Investigating Factors Affecting Brand Awareness of Virtual Advertising
Yosuke TsujiWashington State University
Gregg BennettTexas A&M University
James H. LeighTexas A&M University
The purpose of this study was to investigate factors affecting brand awareness of virtual advertising in sports. Specifically, the study tested the effects of animation, repetition, baseball involvement, and team identification. An experiment using two Latin square designs was conducted to assess the effects of these factors on awareness levels. Results indicated no effect of animation, while effects of repetition, baseball involvement, and team identification were found to affect viewers’ cognitive responses. Managerial implications, limitations, and future research are discussed.
Brand awareness has been one of the most important components of assess-ing advertising and sponsorship effectiveness (e.g., Johar & Pham, 1999; Keller, 1993, 2003, 2008; Leigh, 1984; Sandler & Shani, 1993; Singh & Rothschild, 1983; Till & Baack, 2005). Extant literature has focused on awareness levels of brands and advertisements in numerous media such as print advertising (Leigh, 1984), television advertising (Singh & Rothschild, 1983; Till & Baack, 2005), online advertising (Danaher & Mullarkey, 2003), and product placements in video games (Nelson, 2002). The brand awareness construct has significantly informed sponsorship effectiveness studies in both sport marketing and marketing literature (e.g., Johar & Pham, 1999; Nebenzahl & Hornik, 1985; Sandler & Shani, 1993). Although cognitive awareness of brands and advertisements is an established stream of research and researchers have conducted investigations with numerous media, the effectiveness of virtual advertising, a newer media vehicle, has gone relatively unexplored in the marketing and advertising literature.
Virtual advertising is the seamless insertion of digitized images into a televi-sion broadcast (Turner & Cusumano, 2000), and it has been increasingly used within sport broadcasts (e.g., football’s first down line, corporate signage behind
Tsuji is with the Dept. of Education Leadership and Counseling Psychology, Washington State University, Pullman, WA 99164. Bennett is with the Dept. of Health and Kinesiology, Texas A&M University, College Station, TX 77843. Leigh is with the Dept. of Marketing, Texas A&M University, College Station, TX 77843.

512 Tsuji, Bennett, and Leigh
home plate in baseball). Those watching the broadcast from their homes are exposed to the communication content; however, the message cannot be seen by event attendees because it is electronically generated, or digitally inserted, within the broadcast. Virtual advertising offers some advantages over conventional adver-tising media (see Turner & Cusumano, 2000). Virtual advertising does not allow viewers to skip through advertisements as they are placed within the sport broad-cast. Likewise, virtual advertising firms can insert logos anywhere on the screen, seemingly leading to greater brand exposure. Another advantage includes the fact that virtual advertisements can be animated.
Because these unique advantages of virtual advertising pose important mar-keting questions with respect to its effectiveness on cognition of consumers, greater understanding of this specific medium seems warranted. Therefore, the purpose of this study was to empirically assess consumers’ brand awareness levels as well as factors affecting them with brands virtually inserted within a sport broadcast.
Relevant Literature ReviewBrand awareness has been an important and often used construct for researchers assessing advertising and sponsorship effectiveness (e.g., Johar, Pham, & Wake-field, 2006; Keller, 1993, 2003, 2008; Lardinoit & Derbaix, 2001; Macdonald & Sharp, 2003; Sandler & Shani, 1993). Keller (1993, 2008) pointed out that brand awareness, or consumers’ ability to recall and recognize a brand from memory, is an important factor in the consumer decision-making process. For example, it is important that consumers are able to retrieve the name of the brand when they think of a particular product category. He argued that consumers are seldom loyal to a brand; instead they possess a certain set of brands, a consideration set, when they make a purchase. Brands in the consideration set benefit from its presence as recall of the brand sometimes inhibits recall of other brands in the product cate-gory (Nedungadi, 1990).
In addition, brand awareness is important as it alone can affect consumers’ decisions about brands in a consideration set (Keller, 1993). This is especially true for low-involvement products (e.g., soap) as consumers are likely to minimize their decision-making efforts (Keller, 1993, 2008). Consumers attempt to save time and cognitive effort, by selecting a brand they know (Macdonald & Sharp, 2003) or with which they are familiar (Aaker, 1991).
Brand awareness is also a necessary step for creating an association with the image of a brand. Without awareness of a brand, no other form of communication effects (e.g., brand attitude, brand images, and brand experience) can occur (Aaker, 1991; Keller, 1993, 2003, 2008; Macdonald & Sharp, 2003). Keller (1993, 2003, 2008) explained that in addition to brand awareness, these effects comprise brand knowledge and they serve as the source of brand equity.
Since brand awareness has been linked to key variables in building brand equity, it seems important for sport marketers to obtain a better understanding of virtual advertising and factors that affect this construct. In this study, an attempt is made to examine the possible effects of animation, repetition, baseball involve-ment, and team identification. Animation and repetition have been reported to

Brand Awareness Factors 513
increase brand awareness levels in other marketing media (e.g., Danaher & Mul-larkey, 2003; Drèze & Hussherr, 2003; Grohs, Wagner, & Vsetecka, 2004; Hong, Thong, & Tam, 2004); however, these two constructs have received minimal atten-tion in previous studies in virtual advertising. Previous research has also called for further exploration of the virtual advertising effects of animation and repetition on brand awareness (Cianfrone, Bennett, Siders, & Tsuji, 2006). Likewise, sport involvement (i.e., baseball involvement) has been reported to influence brand awareness (e.g., Lardinoit & Derbaix, 2001; Levin, Joiner, & Cameron, 2001). Similarly, team identification has been linked to support behaviors (e.g., attitudes, purchase intentions) by its fans (e.g., Fisher & Wakefield, 1998; Madrigal, 2000, 2001). Therefore, each of these brand awareness antecedents is primary to the focus of this investigation.
Animation
Consumer recall of television commercials has decreased in the past couple of decades (du Plessis, 1994). This is arguably due to the notion that those watching them have begun to pay less attention because they are inundated with unwanted messages (du Plessis, 1994). With increased levels of clutter, especially in sport broadcasting, advertisers have sought more creative methods to reach and com-municate with their target markets (Mullin, Hardy, & Sutton, 2007).
Virtual technology has been used as a new and creative communication vehi-cle used by advertisers to cut through clutter and reach targeted markets (Mullin et al., 2007). For example, virtual technology allows the insertion of animated brand logos into a live broadcast. This places the brand into the live sport broad-cast and oftentimes into a primary viewing location on the screen. Broadcast firms have used virtual advertising technology since the 1990s, and more recently these firms have used animation effects in live broadcasts (e.g., the 2006 World Baseball Classic). According to Wertheim’s (1998) report, brands virtually inserted via on-field signage were twice as likely to be recalled than brands from traditional 30-s commercial spots.
When an individual encounters an unexpected stimulus in a familiar setting (e.g., animation effects in sport broadcasts), the unexpected stimulus tends to cap-ture attention making it relatively visible (Johnston, Hawley, Plewe, Elliott, & DeWitt, 1990; Reicher, Snyder, & Richards, 1976). Researchers have illustrated that novelty and visual prominence increases attention in a variety of settings, including advertising (Till & Baack, 2005). In online advertising, Li and Bukovac (1999) found that animated banner ads, in comparison with still banner ads, were quickly identified and better recalled. Other researchers have demonstrated that increased attention leads to greater levels of both unaided (Rosbergen, Pieters, & Wedel, 1997) and aided recall (Rajaram, Srinivas, & Travers, 2001). However, Drèze and Hussherr (2003) found contradictory results when assessing online banner advertising. Their eye-tracking study found that peripheral information was not attended to, and animating the banners did not increase awareness of them. Similar results of ineffectiveness of animated online banners on memory have been reported by Bayles (2002).

514 Tsuji, Bennett, and Leigh
Although researchers have reported mixed results regarding the effect of ani-mation on consumers’ attention and awareness levels, the effect seems to vary under different conditions (Hong et al., 2004). Greenwald and Leavitt (1984) cited that if the novel stimulus is repeatedly presented, individuals probably reduce the attention they give elsewhere and the effectiveness of the stimulus would likely decrease (i.e., habituation). On the other hand, Pechmann and Stewart (1990) reported that consumers required more exposures to comprehend novel and com-plex advertising content. Thus, with the increasing presence of virtual advertising in sport settings, it seems appropriate to investigate the effects of animation on brand awareness levels.
Research Question 1: What are the effects of animation on brand awareness levels of virtual advertising?
Repetition
An advantage of stadium signage is the potential for repeated exposure within a television broadcast (Nebenzahl & Hornik, 1985). Virtual advertising allows brand logos to be uniquely placed at or on different surfaces of the broadcast, and for this reason, receive substantial repeat exposure during the broadcast. There-fore, investigating the repetition effects of virtual advertising seems warranted. Research regarding the effects of repetition on advertising effectiveness has been well established using other media (e.g., Cacioppo & Petty, 1979; Danaher & Mullarkey, 2003; Pechmann & Stewart, 1988; Singh & Cole, 1993).
An important aspect of advertising repetition research with any type of com-munication media is the concept of “wear-in” and “wear-out” (Pechmann & Stew-art, 1988). An ad is said to have “worn-in” when viewers perceive the ad to have a significant positive effect on them. On the other hand, “wear-out” occurs when the viewers are no longer affected or when an ad creates a negative effect by being seen too frequently.
In regard to recall, researchers have suggested “wear-in” usually occurs immediately after an exposure to advertising (Cacioppo & Petty, 1979; Pechmann & Stewart, 1988; Ray & Sawyer, 1971). Consumer recall of advertising increases with the number of exposures until a “wear-out” occurs, which is said to be approximately six times (Pechmann & Stewart, 1988). Ray and Sawyer (1971), assessing print advertising, found a linear relationship between the number of exposures and percentage of recall. However, this recall eventually flattened due to a ceiling effect after the fourth exposure (Ray & Sawyer, 1971). Singh and Cole (1993) reported a similar result from their investigation of television commercials. They found that repetition significantly influenced subjects’ recall rates between one and four exposures, but no effects were detected between four and eight expo-sures. Studies exploring repetition effects on recognition measures have reported similar results. Singh and Rothschild (1983) noted that recognition scores rose with the number of repetitions (1, 2, and 4) and with the length of television com-mercials. In an online advertising setting, repeated exposure to banner ads increased viewers’ awareness levels (Danaher & Mullarkey, 2003; Drèze & Hussherr, 2003). Within sponsorship effectiveness studies, Grohs et al. (2004) found that more exposure to sponsorship signage increased recall levels.
Brand Awareness Factors 515
In the verbal learning literature, high repetition of words produces high recall rates, but the same high repetition hinders recognition rates (Gregg, 1976). Gregg (1976) contended that recognition rates are better for low frequency words. Lynch and Srull (1982) argued that subjects cannot discriminate whether they had seen the word in reality or in an experimental setting. In another study, Pham (1991) found that an increase in exposure time was not predictive of recognition rates of sponsorship signage.
Cianfrone et al. (2006) investigated the brand awareness levels of virtual advertising in a football setting. However, this exploratory field study failed to account for repetition effects on the sample, a limitation suggested by these schol-ars as a foundation for further research. For these reasons, it seems appropriate to investigate the effects of repetition of virtual advertising on levels of brand awareness.
Research Question 2: What are the effects of repetition on brand awareness levels of virtual advertising?
In addition, when coupled with an eye-attracting effect such as animation, repetition of such signage is likely to create an interaction of these two variables, resulting in greater consumers’ awareness levels. Therefore, we propose the fol-lowing research question.
Research Question 3: What are the interactive effects of animation and repeti-tion on brand awareness levels of virtual advertising?
Baseball Involvement
The involvement construct has been widely studied by sport marketing scholars in an effort to better understand sport consumer behavior (e.g., Hill & Green, 2000; Iwasaki & Havitz, 2004; Shank & Beasley, 1998). Involvement is known to influ-ence future attendance of sport events (Hill & Green, 2000; Shank & Beasley, 1998), greater sport media consumption (Shank & Beasley, 1998), and loyalty to an organization (Iwasaki & Havitz, 2004). In addition, several studies have been conducted with regard to effects of involvement on consumers’ cognitive responses (i.e., recall and recognition) in a sport setting (e.g., Celsi & Olson, 1988; d’Ydewalle, Abeele, Rensbergen, & Coucke, 1988; Grohs et al., 2004; Lardinoit & Derbaix, 2001; Lascu, Giese, Toolart, Guehring, & Mercer, 1995; Levin et al., 2001; Meenaghan, 2001; Pham, 1992; Tavassoli, Shultz, & Fitzsimons, 1995). These brand awareness studies have suggested that involvement is predictive of correctly identifying sponsors at an event (Grohs et al., 2004; Lascu et al., 1995; Meenaghan, 2001), which eventually leads to greater positive attitude toward the sponsors (Meenaghan, 2001). As previous literature in consumer behavior has indicated, involvement is the perceived personal relevance of a target to an indi-vidual (Celsi & Olson, 1988, Zaichkowsky, 1985).
Celsi and Olson (1988) have suggested that involvement activates one’s knowledge (i.e., ability) in memory. This activation of knowledge, in turn, creates a motivational drive that could potentially stimulate an individual’s cognitive behavior, such as attention and comprehension processes. Celsi and Olson (1988) studied the effect of involvement on attention and comprehension processes. They found that greater involvement led to subjects attending to advertisements, cogni-

516 Tsuji, Bennett, and Leigh
tively processing the advertisements, and engaging in more elaborate thinking. In addition, according to Mitchell (1981), involvement has two properties, intensity and direction. In this regard, intensity refers to the level of involvement (e.g., high-low), and direction involves the focus of their attention (e.g., directed at the game or other peripheral information).
Another important concept within the involvement construct is the classifica-tion into situational involvement (SI) and enduring involvement (EI). SI refers to the temporary involvement that an individual experience in a particular situation, while EI refers to a consumer’s long term, strongly held interest toward a product (Richins & Bloch, 1986). In a sport setting, an individual’s SI may fluctuate depending on the progress and outcome of the game; however, an individual’s EI will not likely be altered just because his/her favorite team is winning or losing. Although previous research has identified effects of SI on brand awareness levels (e.g., Pham, 1992; Tavassoli et al., 1995), since this study was conducted in an experimental setting, it seems more appropriate to focus on EI rather than on SI. Therefore, only EI was used in the study.
With regard to this study, EI with baseball should greatly affect participants’ information processing of advertising stimuli. Individuals exhibiting low levels of EI are likely to have a low motivational state. These individuals would most likely have their attention divided between actual game and peripheral information (e.g., stadium signage) with minimum ability to process information. As the degree of EI increases, individuals are likely to allocate more attention to the overall game, and greater processing capacity would be allocated to elaborative thinking of the game (Celsi & Olson, 1988; MacInnis & Jaworski, 1989). This implies, in a sport context, that highly involved fans may pay closer attention to the game and elabo-rate on the information collected with their knowledge held in memory. This pro-cess may shut out any peripheral information that would distract from their view-ing experience. d’Ydewalle et al.’s (1988) study found that more involved soccer fans spent less time looking at the billboards in a broadcast.
Other researchers have reported mixed results of the effect of fan involvement on recognition rates. Levin et al. (2001) investigated viewers’ recall and recogni-tion of NASCAR sponsors. Their recall and recognition rates of on-car advertise-ments were higher for highly involved fans than for less involved fans. Similarly, Lardinoit and Derbaix (2001) found that EI increased both unaided recall and recognition; however, the practical significance was minimal. With the use of vir-tual advertising and its capability of placing a brand logo on any surface of the broadcast, the construct of involvement casts additional questions with respect to its impact on awareness levels.
Research Question 4: What are the effects of baseball involvement on brand awareness levels of virtual advertising?
Team IdentificationAnother factor potentially affecting the awareness of virtual advertising is a fan’s identification with a team. Studies of team identification in a sport setting have mainly focused on potential effects of this construct on event attendance, support behaviors, and consumption behaviors (e.g., Fisher & Wakefield, 1998; Madrigal,
Brand Awareness Factors 517
2000, 2001; Sutton, McDonald, Milne, & Cimperman, 1997; Wann & Branscombe, 1993). Yet, there has been a dearth of research linking team identification to brand awareness.
Identification with an entity is grounded in social identity theory. Social iden-tity theory is the classification of people into various social categories according to an individual’s categorization schemas (Tajfel & Turner, 1986). This segmenta-tion (a) allows an individual to cognitively classify and systematically define people, and (b) enables the individual to place him/herself into that categorized social environment (Ashforth & Mael, 1989). In general, individuals attempt to establish and enhance their positions by affiliating with a group that promotes positive self-images in the social environment (Fisher & Wakefield, 1998). In addition, identified group members extend support to those individuals who belong to the same group, while alienating those in other groups. This in-group favoritism toward other members, or to the group itself, is evidenced by Fisher and Wakefield (1998). They found that highly identified respondents indicated extra support for the team during the game, higher frequencies of game atten-dance, and greater amounts of licensed goods owned regardless of team perfor-mance. Madrigal (2000, 2001) found that highly identified members expressed intentions to purchase a product from team sponsors irrespective of their attitudes toward that behavior. That is, highly identified fans would purchase from the team sponsors from the sheer notion of what is good for the team (Madrigal, 2000, 2001).
According to Keller’s (1993, 2003, 2008) framework of building customer-based brand equity, an individual first needs to be aware of such products to form any associations (e.g., attitudes, preference, and intentions). In this sense, highly identified individuals may actively attend to brand sponsorships during television broadcast. Therefore, the study attempts to examine the effects of team identifica-tion on brand awareness levels.
Research Question 5: What are the effects of team identification on brand awareness levels of virtual advertising?
Measuring Brand Awareness
Researchers have often assessed brand awareness through the use of recall and recognition scales, which test the ability of consumers to remember advertising or sponsorships from memory. Unaided recall requires consumers to generate rele-vant cues for retrieval as well as perform necessary retrieval tasks cognitively (Zinkhan, Locander, & Leigh, 1986). Aided recall or cued recall is less demand-ing for the consumer because they are provided with some specific cues to access the appropriate memory trace or nodes in memory (Leigh, 1984; Leigh & Menon, 1986, 1987; Zinkhan et al., 1986). Recognition is much easier than the previous two methods in that target items are presented along with one or more distractor items to the respondents (Brown, 1976; Leigh, 1984; Leigh & Menon, 1986, 1987; Zinkhan et al., 1986). Thus, recognition is solely dependent upon one’s ability to discriminate the correct items from the distractors (Brown, 1976; Lardinoit & Derbaix, 2001; Zinkhan et al., 1986).

518 Tsuji, Bennett, and Leigh
In an advertising recognition test, there are two possible responses (i.e., “yes” or “no”) to two types of advertising stimulus (i.e., real or distractor), which create four possible outcomes. First, a “hit” is recorded when an individual responds, “yes” to real advertising. If, however, one fails to recognize the real ad, the response is called a “miss.” Another incorrect judgment by a respondent is “false alarm” in which the subject answers “yes” to a bogus advertising stimulus. Finally, a “correct rejection” occurs when the subject says “no” to a distractor.
Further analyses of recognition tests mainly use the hit rate (H) and the false-alarm rate (FA) for adjustments and corrections (Leigh & Menon, 1986). A hit rate is calculated by the ratio of targets correctly chosen (Tc) to the total number of target stimuli available (T), whereas the false-alarm rate is the ratio of incor-rectly chosen items (Dc) to the total number of distractor items included in the test (D) Brown, 1976; Leigh & Menon, 1986). For instance, a hit rate of 1.0 denotes that the respondent correctly selected all target stimuli in the test set. However, a hit rate of 1.0 would not be a brilliant score unless his or her false-alarm rate is also low. Scores of both 1.0 on both hit rates and false-alarm rates imply that the subject answered yes to all items. When one has a same score on both hit rate and false-alarm rate (i.e., H = 0.3, FA = 0.3), it implies that the responses occurred by chance. Therefore, marketers seek high hit rates and low false-alarm rates from respondents.
According to Singh and Churchill (1986, 1987), recognition tests are criti-cized for their failure to account for respondents’ errors. Shapiro (1994) argued that recognition studies that use only the correct number of responses would be unable to completely understand the human recognition process. He also noted that research that merely counts the number of correct responses may incorrectly conclude that recognition memory is substantial, when, in reality, it was changes in judgment about memory. Previous research in sport sponsorship studies has failed to account for respondents guessing. Therefore, this study will control for the effects of subjects’ guessing in recognition tests.
Although there are a plethora of alternative measures to evaluate and correct respondents’ sensitivity and biases (see Leigh & Menon, 1986), Lockhart (2000) suggested a simple solution for correcting recognition research. He argued that a simple measure of hit rate (H) minus false-alarm rate (FA) would suffice. Further-more, this simple measure has been empirically found to be consistent and to converge with recall measures (Leigh & Menon, 1986). In this study, this formula will be referred to as “corrected hit rate” or HC.
HC = H—FA (1)
Method
Participants and Research Design
Participants (n = 208) were undergraduate students at a large university located in the southwestern United States. Students were solicited from several physical education classes to participate in the study in exchange for extra credit. Upon entering a computer laboratory/classroom, students were randomly handed one of
Brand Awareness Factors 519
six different CDs with 24 min of professional baseball game with virtual adver-tisements embedded. Students were instructed to view the content and answer to the questionnaire administered via Survey Monkey. Students were asked to work independently and to refrain from reviewing the CD while answering questions. The questionnaire contained items addressing the proposed research questions.
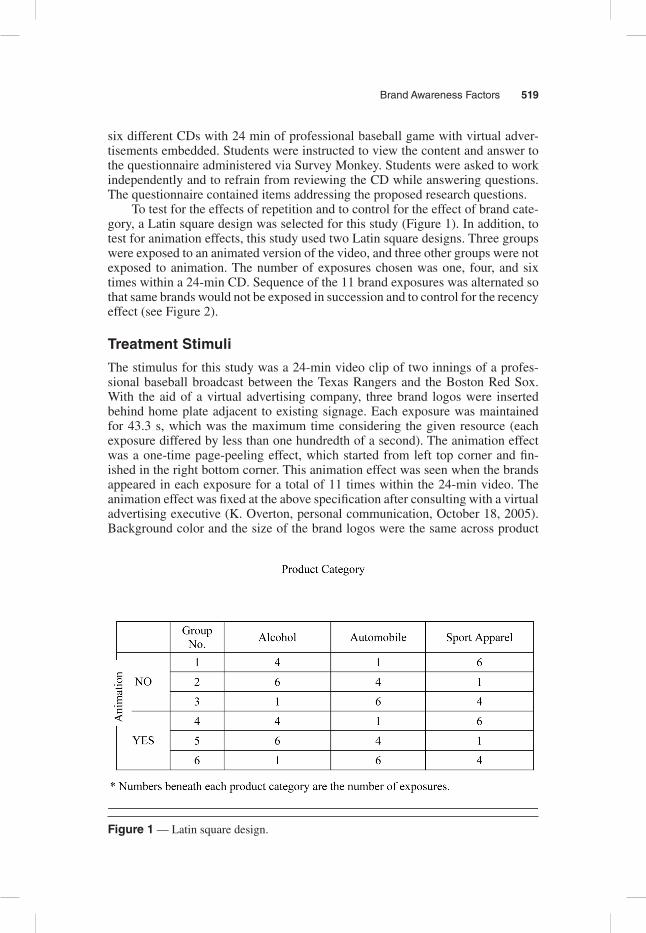
To test for the effects of repetition and to control for the effect of brand cate-gory, a Latin square design was selected for this study (Figure 1). In addition, to test for animation effects, this study used two Latin square designs. Three groups were exposed to an animated version of the video, and three other groups were not exposed to animation. The number of exposures chosen was one, four, and six times within a 24-min CD. Sequence of the 11 brand exposures was alternated so that same brands would not be exposed in succession and to control for the recency effect (see Figure 2).
Treatment Stimuli
The stimulus for this study was a 24-min video clip of two innings of a profes-sional baseball broadcast between the Texas Rangers and the Boston Red Sox. With the aid of a virtual advertising company, three brand logos were inserted behind home plate adjacent to existing signage. Each exposure was maintained for 43.3 s, which was the maximum time considering the given resource (each exposure differed by less than one hundredth of a second). The animation effect was a one-time page-peeling effect, which started from left top corner and fin-ished in the right bottom corner. This animation effect was seen when the brands appeared in each exposure for a total of 11 times within the 24-min video. The animation effect was fixed at the above specification after consulting with a virtual advertising executive (K. Overton, personal communication, October 18, 2005). Background color and the size of the brand logos were the same across product
Figure 1 — Latin square design.

520 Tsuji, Bennett, and Leigh
categories in an effort to prevent introducing confounding variables. The broad-cast was clipped and edited to shorten the length and reduce tedium for the sub-jects. Similarly, television commercials were limited to one 30-s commercial between innings, and the content was irrelevant to the treatment.
Three brands were selected within product categories that typically sponsor professional baseball. Three product categories were selected so that two of them would serve as replicates of the study and strengthen our argument. The three product categories selected were automobile, alcohol, and sport apparel. These three product categories were selected as they were typical sponsors of a sport game as evidenced by their ranking in the top ten product categories that invested in sport sponsorship in 2004 (Brand Strategy, 2005). Brand logos were then digi-tally inserted uniquely onto a canvas behind home plate adjacent to existing sta-dium signage. Within those respective categories, domestic brands were chosen to control for any potential country-of-origin effect. In addition, previous research has indicated that bias exists in identification of more prominent brands; there-fore, less prominent brands within each product category were selected (Johar & Pham, 1999; Johar et al., 2006; Pham & Johar, 2001). Selection criteria for two of the brands, Icehouse (alcohol) and Champion (sport apparel), was based on the fact that these brands did not rank in the “Top 2,000 Brands,” which were scaled on media spending in the United States (Brandweek, 2005; Roy & Cornwell, 2004). The third brand selected, Mercury (automobile), was ranked in “Top 2,000 Brands” by Brandweek (2005); however, it was one of the lowest media spending brands within the domestic automobile category.
Survey InstrumentA questionnaire was constructed, based upon a review of the relevant literature and research questions, to measure the brand awareness fostered by virtual adver-tising in a sport broadcast. First, several questions related to the content of the game were asked to measure subjects’ attention to the game. Then, unaided recall questions were asked, followed by aided recall and recognition tests. For unaided recall, respondents were asked to list the names of brands from scratch. A prompt of a product category was used as a cue for aided recall and five distractors were provided for each product category in the recognition tests. Next, baseball involve-ment was measured using Zaichkowsky’s (1994) 10-item Personal Involvement Inventory (PII) scale. Items in PII scale were measured using 7-point semantic differential scale. Team identification was measured using Trail and James’ (2001) Team Identification Index. These items were scaled on a 7-point Likert-type scale ranging from strongly agree (7) to strongly disagree (1). Then, the subjects were
Figure 2 — Example of exposure sequence of Group 1 in Figure 1.
Brand Awareness Factors 521
asked single demand artifact question adopted and modified from the work of Leigh (1984). Demand artifacts occur when an individual suspects, interprets, and behaves in a way that he or she believes is expected or desired by the researcher (Sawyer, 1975). Previous research has reported its effects on the dependent vari-able and the need for its control in experimental studies (Sawyer, 1975; Shimp, Hyatt, & Snyder, 1991). For the demand artifact question, respondents answered whether they had attempted to memorize the sponsors of the game on a 7-point Likert-type scale ranging from strongly agree (7) to strongly disagree (1). Finally, relevant demographic questions were asked. The online questionnaire was config-ured to prevent respondents from attempting to go back to previous questions.
A panel of experts then assessed the initial survey to judge its relevance, rep-resentativeness, and clarity. They were also asked to provide suggestions for improvement to the instrument. The panel consisted of one marketing professor and one sport management professor. In addition, 20 graduate students in a sport marketing class watched the video and evaluated the survey for its face validity. Students in this class were asked to rate the quality of the stimulus as well as to comment on the items’ clarity. After these procedures, the questionnaire was mod-ified based on the feedback from the panel and the students.
Pilot Test
A pilot test was undertaken to determine whether the stimulus and the instrument were acceptable. The sample for the pilot study was 70 undergraduate students enrolled in a sport management class. These respondents participated in the study using a procedure similar to the main study. The results presented problems for analyses using the Latin square design. Latin square design usually calls for the use of analysis of variance (ANOVA; Ott & Longnecker, 2000). Leigh’s (1984) work on recall and recognition of umbrella ads used a dichotomous dependent variable, in which he conducted an ANOVA and an analysis of covariance (ANCOVA) on the basis that both methods are robust analyses if the dependent variables are between .25 and .75 (Knoke, 1975). The pilot study could not meet the assumption set forth by Knoke (1975); thus additional questions regarding brand involvement (Champion, Icehouse, and Mercury) were incorporated in the actual study (PII) to control for their potential effects (Zaichkowsky, 1994). Other than these corrections, the study was carried out as planned after some minor modifications.
Data Analysis
To answer the research questions for this study, descriptive statistics, logistic regression analyses, and ANCOVA were conducted. Since unaided recall and aided recall rates were dichotomized, they were assessed using logistic regres-sion. ANCOVA was used to assess the Latin square design for recognition mea-sures (HC) while controlling for other factors, and dichotomized hit rate was assessed using logistic regression.
The alpha reliabilities for baseball involvement, Rangers team identification, and Red Sox team identification were .92, .94, and .95, respectively. Mean scores (out of 7) for these three variables were calculated and they were 4.70 (SD = 1.37),

522 Tsuji, Bennett, and Leigh
2.37 (SD = 1.68), and 1.61 (SD = 1.15) respectively. Alpha coefficients for the brand involvement factors (Icehouse, Mercury, and Champion) were .93, .91, and .88, respectively. Accordingly, the mean scores of the retained factors were calcu-lated for subsequent analyses.
Data analyses for the research questions included the use of logistic regres-sion. Furthermore, to understand the significant increase of relevant factors, sequential logistic regression analyses were adopted. Three separate analyses were conducted for each brand for unaided recall, aided recall, and hit rates. Since animation and repetition variables were manipulated in the experiment, these two variables were entered in the latter steps of the analyses. First, items intended to control for the effects of demand artifact and brand involvement along with base-ball involvement item, and team identification items (Rangers and Red Sox), were inserted as the first set of variables. The next block contained two dummy-coded variables for repetition and a dummy-coded variable for animation. In one of the dummy-coded variables for repetition, a numeric value of one was assigned to those subjects who were exposed to four repetition of the brand and a zero for others and for another variable, a numeric value of one was assigned to those subjects who saw six repetitions and zero was assigned to the others. For the dummy-coded variable for animation effect, a numeric value of one was assigned to those subjects who were exposed to the animated version of virtual advertising, and a zero was assigned to subjects exposed to the still form. Finally, two interac-tive dummy-coded variables (repetition × animation) were inserted as the last set.
Results
The findings of this investigation are presented as follows: (a) descriptive statis-tics, and (b) analysis of the research questions.
Descriptive Statistics
The sample (n = 208) included undergraduate students from a large southwestern university in the United States. Respondents of this study consisted of 48.6% males and 51.4% females with most of them being White (79.1%). The average age of the sample was 19.79 years (SD = 1.89). The sample included students from all years (i.e., freshman, sophomore, junior, senior) and from different disci-plines on campus. In addition, three game-content questions revealed that most of the subjects had paid attention to the game (i.e., 90% of respondents had correctly answered to these items). For the demand artifact question, 90% of the subjects reported they did not pay close attention to the sponsors. Mean score for this ques-tion was 2.04 (SD = 1.47).
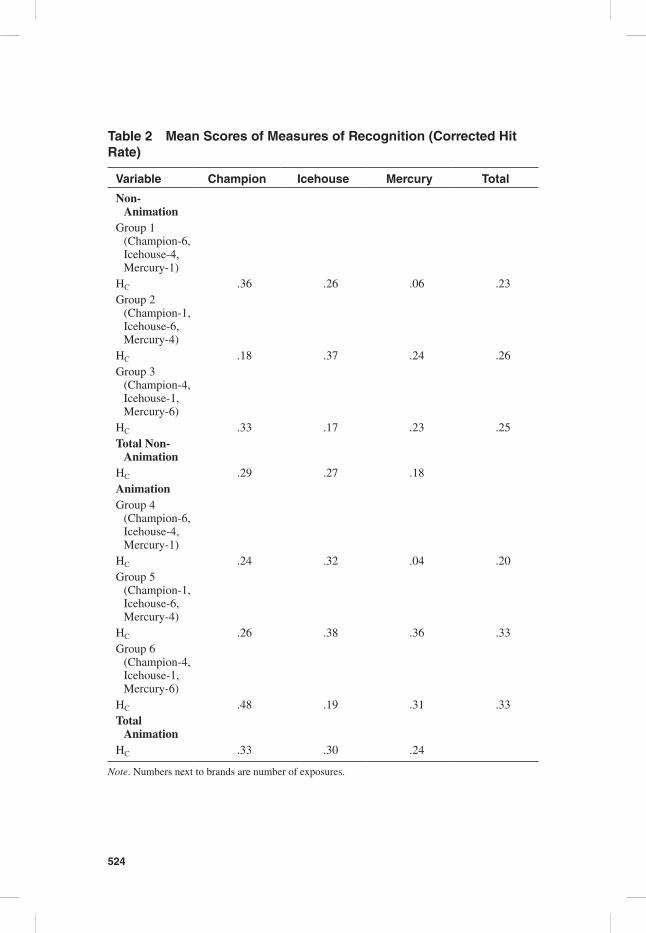
Frequencies of all awareness measures were calculated for the sample. The numbers of correct responses and percentages by groups are listed in Table 1. Next, alternative measures of recognition (corrected hit rate [HC]) were calculated and are presented in Table 2.

Brand Awareness Factors 523
Analyses of Research Questions
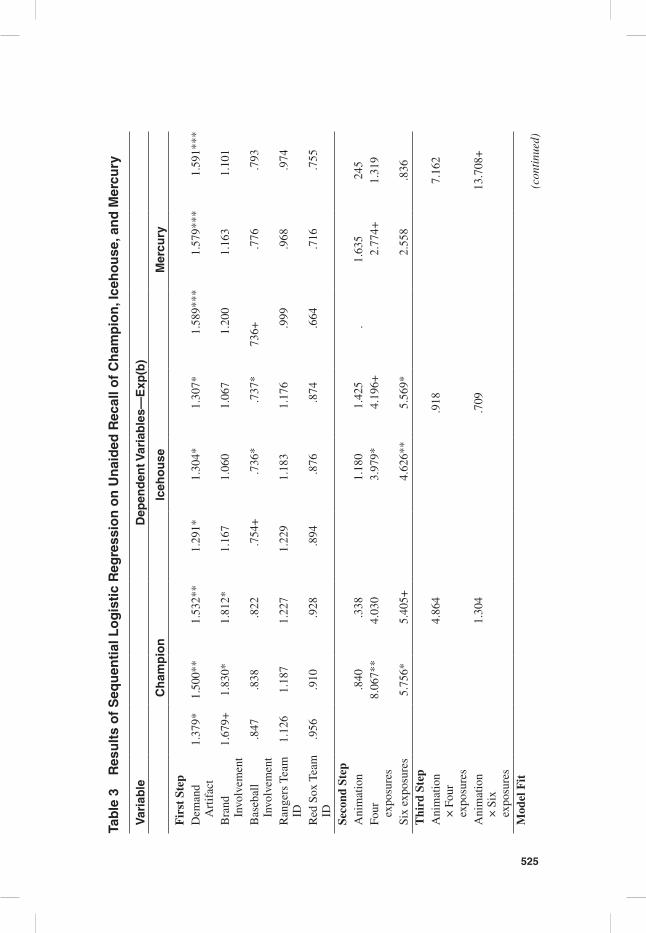
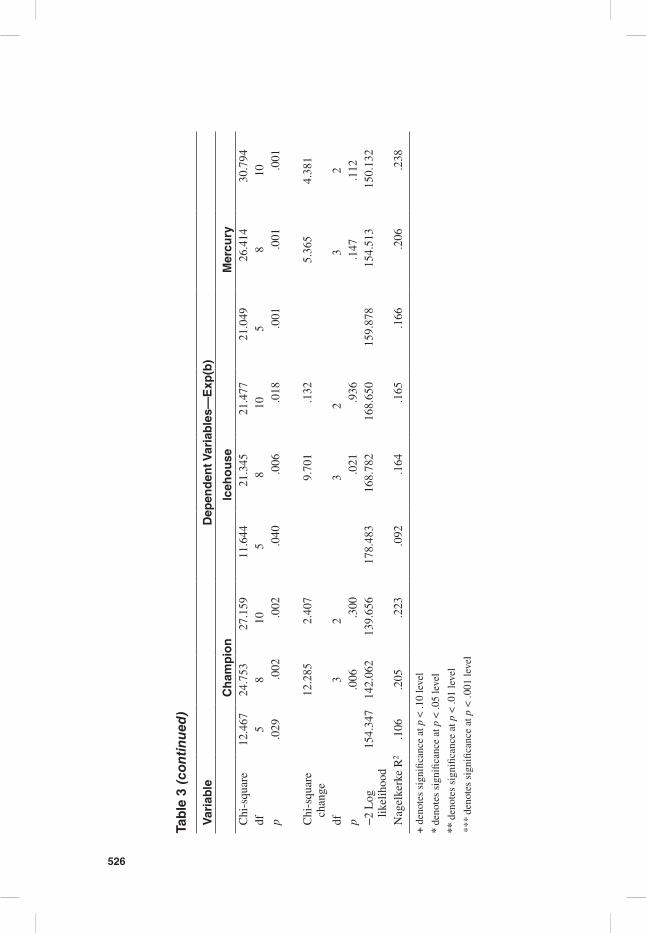
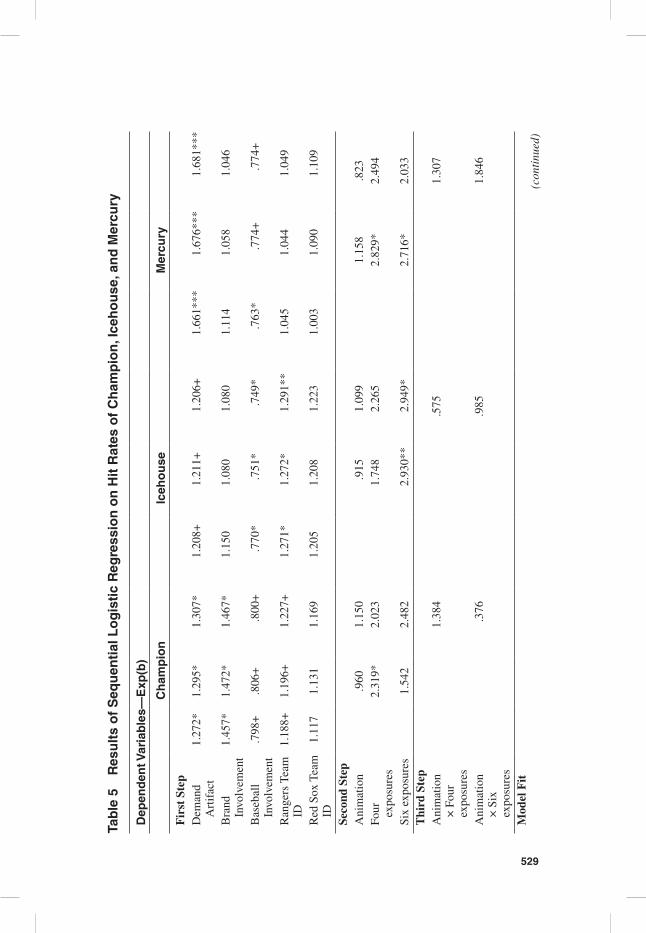
The analyses of the research questions were conducted using sequential logistic regression analyses and ANCOVA. First, analyses of unaided recall are presented followed by aided recall and recognition. The results of these analyses are pre-sented in Tables 3, 4, and 5.
Unaided Recall. Results suggest that the first set of items had significant effects on unaided recall rates of Champion (|2 (5) = 12.467, p = .029), Icehouse (|2(5) =
Table 1 Frequencies of Unaided Recall, Aided Recall, and Recognition
Variable Number of Exposures
Unaided Recall Aided Recall Recognition N
Yes % Yes % Yes %
Non-Animation
Group 1 34Champion 6 exposures 6 17.6% 3 8.8% 15 44.1%Icehouse 4 exposures 6 17.6% 6 17.6% 12 35.3%Mercury 1 exposure 4 11.8% 4 11.8% 6 17.6%Group 2 34Icehouse 6 exposures 8 23.5% 4 11.8% 15 44.1%Mercury 4 exposures 5 14.7% 7 20.6% 11 32.4%Champion 1 exposure 2 5.9% 1 2.9% 9 26.5%Group 3 36Mercury 6 exposures 4 11.1% 6 16.7% 11 30.6%Champion 4 exposures 6 16.7% 11 30.6% 15 41.7%Icehouse 1 exposure 2 5.6% 2 5.6% 8 22.2%AnimationGroup 4 34Champion 6 exposures 5 14.7% 6 17.6% 12 35.3%Icehouse 4 exposures 9 26.5% 7 20.6% 13 38.2%Mercury 1 exposure 1 2.9% 2 5.9% 6 17.6%Group 5 36Icehouse 6 exposures 9 25.0% 7 19.4% 16 44.4%Mercury 4 exposures 11 30.6% 12 33.3% 15 26.5%Champion 1 exposure 2 5.6% 3 8.3% 12 33.3%Group 6 34Mercury 6 exposures 10 29.4% 9 26.5% 13 38.2%Champion 4 exposures 9 26.5% 9 26.5% 18 52.9%Icehouse 1 exposure 3 8.8% 3 8.8% 8 23.5%
524
Table 2 Mean Scores of Measures of Recognition (Corrected Hit Rate)
Variable Champion Icehouse Mercury Total
Non-Animation
Group 1 (Champion-6, Icehouse-4, Mercury-1)
HC .36 .26 .06 .23Group 2
(Champion-1, Icehouse-6, Mercury-4)
HC .18 .37 .24 .26Group 3
(Champion-4, Icehouse-1, Mercury-6)
HC .33 .17 .23 .25Total Non-
AnimationHC .29 .27 .18AnimationGroup 4
(Champion-6, Icehouse-4, Mercury-1)
HC .24 .32 .04 .20Group 5
(Champion-1, Icehouse-6, Mercury-4)
HC .26 .38 .36 .33Group 6
(Champion-4, Icehouse-1, Mercury-6)
HC .48 .19 .31 .33Total
AnimationHC .33 .30 .24
Note. Numbers next to brands are number of exposures.
525
Tab
le 3
R
esu
lts
of
Seq
uen
tial
Lo
gis
tic
Reg
ress
ion
on
Un
aid
ed R
ecal
l of
Ch
amp
ion
, Ice
ho
use
, an
d M
ercu
ry
Var
iab
leD
epen
den
t Var
iab
les—
Exp
(b)
Ch
amp
ion
Iceh
ou
seM
ercu
ry
Fir
st S
tep
Dem
and
Art
ifac
t1.
379*
1.50
0**
1.53
2**
1.29
1*1.
304*
1.30
7*1.
589*
**1.
579*
**1.
591*
**
Bra
nd
Invo
lvem
ent
1.67
9+1.
830*
1.81
2*1.
167
1.06
01.
067
1.20
01.
163
1.10
1
Bas
ebal
l In
volv
emen
t.8
47.8
38.8
22.7
54+
.736
*.7
37*
736+
.776
.793
Ran
gers
Tea
m
ID1.
126
1.18
71.
227
1.22
91.
183
1.17
6.9
99.9
68.9
74
Red
Sox
Tea
m
ID.9
56.9
10.9
28.8
94.8
76.8
74.6
64.7
16.7
55
Seco
nd S
tep
Ani
mat
ion
.840
.338
1.18
01.
425
.1.
635
245
Four
ex
posu
res
8.06
7**
4.03
03.
979*
4.19
6+2.
774+
1.31
9
Six
expo
sure
s5.
756*
5.40
5+4.
626*
*5.
569*
2.55
8.8
36T
hird
Ste
pA
nim
atio
n ×
Fou
r ex
posu
res
4.86
4.9
187.
162
Ani
mat
ion
× S
ix
expo
sure
s
1.30
4.7
0913
.708
+
Mod
el F
it(c
onti
nued
)
526
Tab
le 3
(co
nti
nu
ed)
Var
iab
leD
epen
den
t Var
iab
les—
Exp
(b)
Ch
amp
ion
Iceh
ou
seM
ercu
ryC
hi-s
quar
e12
.467
24.7
5327
.159
11.6
4421
.345
21.4
7721
.049
26.4
1430
.794
df5
810
58
105
810
p.0
29.0
02.0
02.0
40.0
06.0
18.0
01.0
01.0
01
Chi
-squ
are
chan
ge12
.285
2.40
79.
701
.132
5.36
54.
381
df3
23
23
2p
.006
.300
.021
.936
.147
.112
−2
Log
lik
elih
ood
154.
347
142.
062
139.
656
178.
483
168.
782
168.
650
159.
878
154.
513
150.
132
Nag
elke
rke
R2
.106
.205
.223
.092
.164
.165
.166
.206
.238
+ de
note
s si
gnifi
canc
e at
p <
.10
leve
l
* de
note
s si
gnifi
canc
e at
p <
.05
leve
l
** d
enot
es s
igni
fican
ce a
t p <
.01
leve
l
***
deno
tes
sign
ifica
nce
at p
< .0
01 le
vel
527
Tab
le 4
R
esu
lts
of
Seq
uen
tial
Lo
gis
tic
Reg
ress
ion
on
Aid
ed R
ecal
l of
Ch
amp
ion
, Ice
ho
use
, an
d M
ercu
ry
Dep
end
ent V
aria
ble
s—E
xp(b
)
Ch
amp
ion
Iceh
ou
seM
ercu
ry
Fir
st S
tep
Dem
and
Art
ifac
t1.
192
1.28
11.
269
1.36
9*1.
376*
1.36
6*1.
460*
*1.
439*
*1.
430*
*
Bra
nd
Invo
lvem
ent
1.62
3+1.
765*
1.78
8*1.
447+
1.35
91.
356
1.44
51.
394
1.36
3
Bas
ebal
l In
volv
emen
t.8
58.8
63.8
73.6
77*
.668
*.6
68*
.634
**.6
43**
.640
**
Ran
gers
Tea
m
ID1.
295*
1.36
5*1.
360*
1.21
41.
173
1.19
41.
031
1.02
11.
037
Red
Sox
Tea
m
ID.9
28.9
42.9
311.
013
.979
.995
.815
.883
.913
Seco
nd S
tep
Ani
mat
ion
.972
2.82
31.
182
1.60
51.
223
.515
Four
exp
osur
es8.
665*
*20
.153
**2.
816+
4.07
63.
089*
2.09
0Si
x ex
posu
res
2.82
34.
842
2.25
12.
271
2.30
91.
366
Thi
rd S
tep
Ani
mat
ion
× F
our
expo
sure
s
.237
.476
2.55
3
Ani
mat
ion
× S
ix
expo
sure
s
.432
.956
3.34
5
Mod
el F
it
(con
tinu
ed)

528
Tab
le 4
(co
nti
nu
ed)
Dep
end
ent V
aria
ble
s—E
xp(b
)
Ch
amp
ion
Iceh
ou
seM
ercu
ryC
hi-s
quar
e12
.389
28.7
3730
.112
17.9
1421
.382
21.9
8221
.523
26.7
8427
.974
df5
810
58
105
810
p.0
30.0
00.0
01.0
03.0
06.0
15.0
01.0
01.0
02C
hi-s
quar
e ch
ange
16.3
481.
375
3.46
7.6
005.
260
1.19
0
df3
23
23
2p
.001
.503
.325
.741
.154
.551
−2
Log
lik
elih
ood
168.
186
151.
838
150.
463
145.
265
141.
797
141.
197
175.
044
169.
784
168.
594
Nag
elke
rke
R2
.100
.224
.234
.153
.181
.186
.162
.199
.207
+ de
note
s si
gnifi
canc
e at
p <
.10
leve
l
* de
note
s si
gnifi
canc
e at
p <
.05
leve
l
** d
enot
es s
igni
fican
ce a
t p <
.01
leve
l
***
deno
tes
sign
ifica
nce
at p
< .0
01 le
vel
529
Tab
le 5
R
esu
lts
of
Seq
uen
tial
Lo
gis
tic
Reg
ress
ion
on
Hit
Rat
es o
f C
ham
pio
n, I
ceh
ou
se, a
nd
Mer
cury
Dep
end
ent V
aria
ble
s—E
xp(b
)
Ch
amp
ion
Iceh
ou
seM
ercu
ry
Fir
st S
tep
Dem
and
Art
ifac
t1.
272*
1.29
5*1.
307*
1.20
8+1.
211+
1.20
6+1.
661*
**1.
676*
**1.
681*
**
Bra
nd
Invo
lvem
ent
1.45
7*1.
472*
1.46
7*1.
150
1.08
01.
080
1.11
41.
058
1.04
6
Bas
ebal
l In
volv
emen
t.7
98+
.806
+.8
00+
.770
*.7
51*
.749
*.7
63*
.774
+.7
74+
Ran
gers
Tea
m
ID1.
188+
1.19
6+1.
227+
1.27
1*1.
272*
1.29
1**
1.04
51.
044
1.04
9
Red
Sox
Tea
m
ID1.
117
1.13
11.
169
1.20
51.
208
1.22
31.
003
1.09
01.
109
Seco
nd S
tep
Ani
mat
ion
.960
1.15
0.9
151.
099
1.15
8.8
23Fo
ur
expo
sure
s2.
319*
2.02
31.
748
2.26
52.
829*
2.49
4
Six
expo
sure
s1.
542
2.48
22.
930*
*2.
949*
2.71
6*2.
033
Thi
rd S
tep
Ani
mat
ion
× F
our
expo
sure
s
1.38
4.5
751.
307
Ani
mat
ion
× S
ix
expo
sure
s
.376
.985
1.84
6
Mod
el F
it(c
onti
nued
)

530
Tab
le 5
(co
nti
nu
ed)
Dep
end
ent V
aria
ble
s—E
xp(b
)
Ch
amp
ion
Iceh
ou
seM
ercu
ryC
hi-s
quar
e17
.804
22.9
1526
.096
19.1
1826
.862
27.4
8429
.148
36.0
7236
.565
df5
810
58
105
810
p00
3.0
03.0
04.0
02.0
01.0
02.0
00.0
00.0
00C
hi-s
quar
e ch
ange
5.11
13.
181
7.74
4.6
216.
924
.493
df3
23
23
2p
.164
.204
.052
.733
.074
.781
2 L
og
likel
ihoo
d25
4.53
824
9.42
724
6.24
524
4.54
123
6.79
723
6.17
621
8.71
221
1.78
821
1.29
5
Nag
elke
rke
R2
.113
.144
.163
.123
.170
.174
.189
.230
.233
+ de
note
s si
gnifi
canc
e at
p <
.10
leve
l
* de
note
s si
gnifi
canc
e at
p <
.05
leve
l
** d
enot
es s
igni
fican
ce a
t p <
.01
leve
l
***
deno
tes
sign
ifica
nce
at p
< .0
01 le
vel

Brand Awareness Factors 531
11.644, p = .040) and Mercury (|2(5) = 21.049, p = .001). The results indicate a significant impact of subjects’ demand artifact on unaided recall rates for Cham-pion (Exp(b) = 1.379, p < .05), Icehouse (Exp(b) = 1.291, p < .05), and Mercury (Exp(b) = 1.589 p < .001). For Champion, brand involvement had a marginal effect on the outcome variable (Exp(b) = 1.679 p < .10). Similarly baseball involvement had a marginal effect on unaided recall of Icehouse (Exp(b) = .754, p < .10) and Mercury (Exp(b) = .736, p < .10). The second block contained items that measured the main effects of repetition and animation on respondents’ aware-ness levels. Inclusion of the second block had a significant effect for Champion (Δ|2(3) = 12.285, p = .006) and Icehouse (Δ|2(3) = 9.701, p = .021), but not on Mercury. The results report significant effects for four repetitions of Champion (Exp(b) = 8.067, p < .01) and Icehouse (Exp(b) = 3.979, p < .05). Likewise, sub-jects in the group with six exposures were more likely to recall Champion (Exp(b) = 5.756, p < .05) and Icehouse (Exp(b) = 4.626, p < .01) than others in the sample. No main effects for animation were found in all three analyses. The last block, which assessed the effect of the interaction between animation and repetition, did not have a significant chi-square change for all three brands. This model explained 20.5% of variance of Champion, 16.4% of variance of Icehouse, and 16.6% of variance of Mercury (all effect sizes are reported using Nagelkerke’s R2).
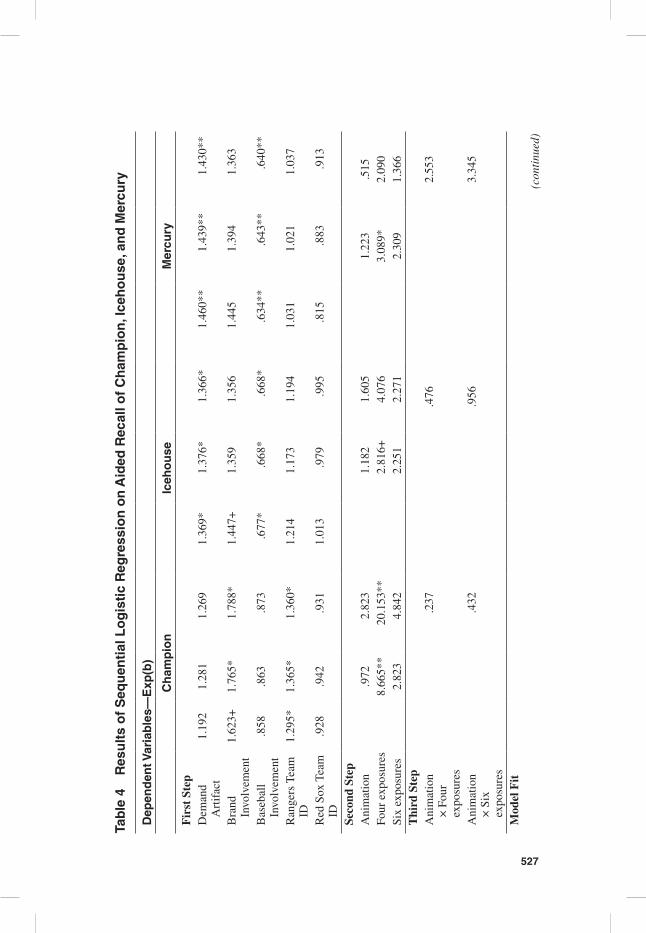
Aided Recall. The results for the first block suggest that the initial model had a good fit to the data for Champion (|2(5) = 12.389, p = .030), Icehouse (|2(5) = 17.914, p = .003), and Mercury (|2(5)= 21.523, p = .001). Parameter estimates indicate a significant effect for demand artifact for Icehouse (Exp(b) = 1.369, p < .05) and Mercury (Exp(b) = 1.460, p < .01). Brand involvement with Champion (Exp(b) = 1.623, p < .10) and Icehouse (Exp(b) = 1.447, p < .10) had a marginal effect on respective aided recall rates. Baseball involvement had a significant effect on Icehouse (Exp(b) = .677, p < .05) and Mercury (Exp(b) = .634, p < .01), while team identification with Texas Rangers increased the likelihood of aided recall rates for Champion (Exp(b) = 1.295, p < .05).
The next block examined the effects of repetition and animation. Results sug-gest a significant effect of items on Champion (⊗|2(3) = 16.348, p = .003). Four repetition of the brand Champion increased subjects’ aided recall rates by more than eight times (Exp(b) = 8.665, p < .01). The final block containing items assess-ing the interactive effects was not significant for all three brands. Thus, no inter-pretations were made. The model explained 22.4% of variance of Champion, 15.3% of variance of Icehouse, and 16.2% of variance of Mercury.
Hit Rate. Results suggest that the first block had a significant effect on hit rates for Champion (|2(5) = 17.804, p = .003), Icehouse (|2(5) = 19.118, p = .002) and Mercury (|2(5) = 29.148, p < .001). The results indicate a significant effect of respondents’ demand artifact on recognition of Champion (Exp(b) = 1.272, p < .05) and Mercury (Exp(b) = 1.661, p < .001). Marginal effect of demand artifact was found for the brand Icehouse (Exp(b) = 1.208, p < .10). Brand involvement with Champion had a significant effect on the dependent variable (Exp(b) = 1.457, p < .05). In addition, baseball involvement had a significant effect on subjects’ ability to recognize Icehouse (Exp(b) = .770, p < .05) and Mercury (Exp(b) = .763, p < .05) with all others equal. For the brand Champion, baseball involvement had a marginal effect on recognition rates (Exp(b) = .798, p < .10). In addition,

532 Tsuji, Bennett, and Leigh
team identification with the Texas Rangers had a significant effect for Icehouse (Exp(b) = 1.271, p < .05) and a marginal effect for Champion (Exp(b) = 1.188, p < .10).
The next set of variables was entered to assess the main effects of repetition and animation. The results indicated no significant effect, but a marginal effect on hit rates of Icehouse (⊗|2(3) = 7.744, p = .052) and Mercury (⊗|2(3) = 6.924, p = .074). The results from analysis of Icehouse revealed that respondents who saw six exposures of the brand recalled the brand better than others in the sample (Exp(b) = 2.930, p < .01). For Mercury, results suggested a significant effect of four repetition (Exp(b) = 2.829, p < .05) and six repetition (Exp(b) = 2.716, p < .05) on hit rates. Lastly, adding the final block containing the interaction items was not significant in predicting hit rates of Champion, Icehouse, and Mercury. The model explained 11.3% of variance of Champion, 17% of variance of Ice-house, and 23% of variance of Mercury.
Corrected Hit Rate. To test for the effects of repetition, animation, baseball involvement, and team identification variables, a two-way mixed ANCOVA was conducted. The results of this analysis are presented in Table 6. First, assumptions for the ANCOVA were checked for the acceptability of its use (i.e., linearity, homogeneity of regression slopes, correlations among covariates). Based on the findings, it appeared that all assumptions were met; thus, the analyses were con-ducted. Dependent variables for the analyses were corrected hit rate for the number of exposures. Data were reorganized for this purpose. These three variables were inserted as the within-subjects factors, and animation was entered as the between-subjects factor. In addition, demand artifact item, brand involvement items, base-ball involvement item, and team identification items were inserted in the equation as covariates. Levene’s test of equality of error variances, Box’s test of equality of covariance matrices, and Mauchly’s test of sphericity did not pose any problems for proceeding with the analysis (p > .05).
The results suggested no effect in multivariate analysis. In univariate test of within subjects, a marginal interaction effect between baseball involvement and repetition (F(2, 388) = 2.571, p = .078). Further analysis of test of within-subjects contrast indicated that this relationship was a linear relationship. From the param-eter estimates, assumptions can be made about the interaction. It seems that when a brand appeared four times, greater involvement with baseball marginally decreased the corrected hit rates (b = -.056, p = .051) and for those brands that appeared six times, greater baseball involvement further decreased the likelihood of recognition (b = -.082, p = .004). The effect size of the interaction of these fac-tors was minimal (repetition x baseball involvement 2 = .013). In addition, uni-variate test of between subjects found that demand artifact was a significant pre-dictor (F(1,194) = 12.224, p = .001). Although effect size was small (2 = .059), further analysis revealed that demand artifact had a positive influence on four (b = .077, p = .002) and six exposures (b = .073, p = .003) of corrected hit rates.

533
Table 6 Two-Way Mixed ANCOVA for HC
Source Wilks’s F df p 2
Multivariate Tests
Repetition .996 .378 2, 193 .686 .004× Demand
Artifact.987 1.268 2, 193 .284 .013
× Champion Brand Involvement
.994 .544 2, 193 .582 .006
× Icehouse Brand Involvement
.994 .561 2, 193 .571 .006
× Mercury Brand Involvement
.988 1.185 2, 193 .308 .012
× Baseball Involvement
.978 2.204 2, 193 .113 .022
× Rangers Team ID
.996 .364 2, 193 .695 .004
× Red Sox Team ID
.999 .118 2, 193 .889 .001
× Animation .991 .834 2, 193 .436 .009Univariate—
Within Subjects
Repetition .386 2, 388 .680 .002× Demand
Artifact1.383 2, 388 .252 .007
× Champion Brand Involvement
. 567 2, 388 .567 .003
× Icehouse Brand Involvement
.653 2, 388 .521 .003
× Mercury Brand Involvement
1.359 2, 388 .258 .007
× Baseball Involvement
2.571 2, 388 .078 .013
× Rangers Team ID
.373 2, 388 .689 .002
× Red Sox Team ID
.104 2, 388 .901 .001
× Animation .229 2, 388 .495 .004
(continued)

534 Tsuji, Bennett, and Leigh
DiscussionThe purpose of this study was to explore the brand awareness levels of virtual advertising in sports. Furthermore, the study attempted to gain a better under-standing of the impact of antecedents of brand awareness on virtually inserted ads
Table 6 (continued)
Source Wilks’s F df p 2
Repetition × Baseball Involvement
b
One exposure -.010 -.367 (t–value)
.714 .001
Four exposures
-.056 −1.961 (t value)
.051 .019
Six exposures -.082 −2.946 (t value)
.004 .043
Univariate—Between Subjects
Demand Artifact
12.224 1, 194 .001 .059
Champion Brand Involvement
.381 1, 194 .538 .002
Icehouse Brand Involvement
1.405 1, 194 .237 .007
Mercury Brand Involvement
.053 1, 194 .818 .000
Baseball Involvement
5.945 1, 194 .016 .030
Rangers Team ID
2.517 1, 194 .114 .013
Red Sox Team ID
.923 1, 194 .338 .005
Animation .022 1, 194 .883 .000Demand
Artifactb
One exposure .035 1.515 (t value)
.131 .012
Four exposures
.077 3.094 (t value)
.002 .047
Six exposures .073 3.010 (t value)
.003 .045
Brand Awareness Factors 535
within a sport broadcast. The four antecedents were animation, repetition, base-ball involvement, and team identification. Animation and repetition were manipu-lated and presented to different groups to explore their effects on virtual advertis-ing. Baseball involvement and team identification were also included to investigate their effects on brand awareness of virtual advertising.
The first research question assessed the effects of animation on brand aware-ness levels. Based on the findings, it appeared that there were no significant effects of animation on viewers’ levels of awareness of virtual advertising. This is consis-tent with Drèze and Hussherr’s (2003) finding that animation of a banner in an online environment did not increase awareness. This nonsignificant finding is an important contribution of this study. A couple of explanations can be derived from this result. First, the reason for the failure to detect significance may be that the novelty of animation had worn out for most of the respondents. According to Tellis (2004), technology in advertising lasts only for a short period of time because of rapid imitation by competitors. Tellis (2004) reported that response rates for banner advertising were 10% when it first appeared on the Internet. How-ever, reports show that due to heavy usage, the response rate declined to 1% by 2002 (Tellis, 2004). This may be the reason for differences between significant findings (Li & Bucovac, 1999) and nonsignificant findings (Bayles, 2002; Drèze & Hussherr, 2003; current study). This sample of college students, who are most likely technologically savvy, might have become used to watching animation effects either on television or the Internet and no longer consider them something that “pops-out” in their viewing experience. An alternative explanation may be that the respondents became accustomed to watching sponsorship signage in sports and thus they may have learned to ignore irrelevant peripheral information even if there is an animation effect.
The second research question assessed the effects of repetition on brand awareness levels. With respect to repetition effects, virtual advertising seemed to wear-in immediately for all unaided recall, aided recall, and recognition rates in all groups. These findings are consistent with previous studies in the past that found subjects were able to recall with one exposure to the stimuli (Cacioppo & Petty, 1979; Pechmann & Stewart, 1988; Ray & Sawyer, 1971). For unaided recall, with the exception of Mercury, exposing brands either four times or six times generated greater unaided recall rates, which were at least three times more likely than showing brands only once. These findings are similar to those of Ray and Sawyer’s (1971) and Singh and Cole’s (1993) studies that identified a linear relationship between recall and number of exposures. Although total unaided recall rates were low, multiple exposures of virtual advertisements left substantial traces in respondents’ memories.
For aided recall, subjects who saw Champion four times recalled the brand significantly better than those with one or six exposures. Effects of repetition were not present in other brands. With regard to aided recall rates, this type of measure is oftentimes greater than those for unaided recall (Leigh, 1984; Leigh & Menon, 1986, 1987: Zinkhan et al., 1986). However, in the current study, the contrary occurred. Some respondents may not have had the prior experience linking the brand to the product category. Thus, readers should exercise care when interpret-ing the results of aided recall.
536 Tsuji, Bennett, and Leigh
In terms of hit rates, although effects were marginal, four exposures of Ice-house, and both four and six exposures of Mercury had a greater likelihood of being recognized. These results support the previous finding that recognition mea-sures improved with number of repetition (Danaher & Mullarkey, 2003; Drèze & Hussherr, 2003; Grohs et al., 2004; Singh & Rothschild, 1983). In addition, these results indicate that repetition of virtual advertising affects all aspects of viewers’ awareness similar to other marketing communication media. However, when con-trolling for false-alarm rates, effects of repetition of brands on brand awareness diminished. This indicates that several respondents had mistakenly associated filler companies as actual sponsors of the game. This research does not address the extent of the effects of false-alarm rates; however, future research should investi-gate the effects of, and control for, false-alarm rates in advertising and sponsor-ship studies in sport settings.
The third research question assessed the potential interaction effect between animation and repetition on brand awareness levels. No effect was detected for this specific research question in measures. This may be due to animation effect being subtle during the broadcast or because of aforementioned reasons for main effect of animation.
The fourth research question assessed the effects of baseball involvement on awareness levels. Baseball involvement was found to marginally decrease the likelihood of unaided recall rates of both Icehouse and Mercury. For aided recall rates, baseball involvement was shown to significantly decrease the aided recall for both Icehouse and Mercury. In terms of hit rates, marginal effect was detected for Champion and significant effects were found for both Icehouse and Mercury. These results show that an increase in baseball involvement led to a lesser likeli-hood of recall. This is contradictory to Lardinoit and Derbaix’s (2001) findings, but is consistent with d’Ydewalle et al.’s (1988) study in which more involved viewers paid less attention to the stadium signage. Viewers with higher levels of baseball involvement tend to focus more on the game itself rather than on periph-eral information. Although, virtual advertising is located in a unique place, highly involved baseball fans were not aware of these marketing tactics.
With regard to corrected hit rates (HC), a marginal interaction effect of repeti-tion and baseball involvement was detected. Results suggest that with the increase in viewers’ involvement with baseball in addition to the frequency of exposure of virtual advertising, there is a lesser tendency of respondents’ ability to recognize the brand. This is a unique and interesting finding of this study. This may be due to the fact that more involved subjects are focused on the game or they are used to seeing signage behind home plate that they no longer pay attention to peripheral information with multiple exposures.
The fifth research question assessed the effects of team identification with the Texas Rangers and the Boston Red Sox on brand awareness levels. The results suggest significance with regard to team identification. Team identification with the Rangers was found to increase the aided recall rates for Champion and the hit rates for Icehouse. In addition, there was a marginal effect of Rangers team iden-tification on hit rates of Champion. No evidence was found for team identification with the Red Sox. Results suggest fans may actively look for sponsors that sup-port their identified team. This is an interesting finding given the fact that baseball

Brand Awareness Factors 537
involvement decreased the likelihood of brand awareness. Results suggest that identified fans used a different information-processing scheme when watching the broadcast. Future studies may want to (a) explore the differences of these two constructs and (b) examine the extent to how these two constructs work in the minds of sport consumers.
However, care must be exercised for generalization of this finding as most of the subjects in this study indicated low identification with the two teams. Different results may be present with different sample of fan who highly identify with a particular team. Because the effects of team identification were not found consis-tently, caution is suggested when interpreting and generalizing to other settings.
The single constantly effective factor predicting viewers’ awareness levels was the individuals’ demand artifact during the experiment. This factor was sig-nificant (or with marginal effect) in most of the analyses (with one exception being aided recall of Champion), consistently increasing the likelihood of recall and recognition. This factor was included in this study because demand character-istics need to be controlled when conducting experiments (Sawyer, 1975; Shimp et al., 1991). Given the artificial setting of this study, subjects memorizing the sponsors of the event is somewhat expected. Nonetheless, in the current study, main effects (repetition, baseball involvement, and team identification) were pres-ent despite this tendency, which we believe are important contributions to the field of sport marketing.
Managerial ImplicationsWe propose some managerial implications based upon the results of this investi-gation. For example, animation effects did not have any influence on brand aware-ness levels. These nonsignificant findings suggest that it may be safe not to use any animation effect as it may evoke negative attitudes from viewers. This may be particularly true among baseball purists, who may view new marketing activities and brands that use such tactics in a negative light. This is evidenced by the number of protests against the cross-promotion of baseball and the movie “Spi-derman 2” (Rovell, 2004).
Repetition effects were found to affect both recall and recognition of virtual advertising. Sport marketers should consider purchasing a unique signage loca-tion with the use of virtual advertising where one can expect multiple exposures within a broadcast. In addition to purchasing signage, sport marketers may want to reinforce the association of their brands with the sport property using other communication media (e.g., in-game announcement, television commercials) so that the fans do not inaccurately identify other companies as sponsors.
Baseball involvement decreased the likelihood of awareness levels in this study. However, sport marketers may be able to reach this segment by creating an additional promotion that is related to the actual game. Companies may want to consider investing in a sponsorship program in a broadcast where it presents fans with statistics of the game. Highly involved fans would most likely pay attention to these types of information. Other examples would be the use of media mentions during the game, providing viewers with trivia questions related to the team or to baseball, or product giveaways.
538 Tsuji, Bennett, and Leigh
On the other hand, team identification was found to increase recognition on several occasions. This is a good finding as relevant literature indicates support of highly identified fans toward team sponsors. Companies may want to expose their brands using virtual advertising as much as possible since these fans actively seek out sponsors that benefit the team. Furthermore, companies may want to reinforce their association with the team using additional promotions and consider investing their money on teams with a larger fan base, especially those with highly identi-fied fans (e.g., Boston Red Sox, New York Yankees, Chicago Cubs).
Limitations of the StudyThe sample was limited to students at one university in southwestern United States, a convenient sample of university students. This sample may not be repre-sentative of baseball consumers. Future studies should aim to collect information from samples that reflect the general baseball audience.
Another obvious limitation is the lack of ecological validity. This study was conducted in a laboratory setting, which limits generalizability of the findings. The length of the video may have brought additional confound to the study. Although most of the subjects had responded correctly to the game-content ques-tions, it seems difficult to pay close attention to the game for the whole duration of the video. It is a possibility that this small contingent of subjects lead to specu-lation that one may not have watched the video in its entirety. Indeed this is an assumption of experimental research; future studies may want to consider using a deception story to increase subjects’ attention to the game content. In addition, the quality of the videos may not have been professional grade. Some viewers may have noticed the degraded quality of virtual advertising in the stimuli, potentially making them aware of the content of the study.
The placement of virtual advertising was limited to the canvas behind home plate. Other unique placement of virtual advertising may create different aware-ness levels for other subjects. Furthermore, physically existing signage took up the majority of the canvas behind home plate. Most virtual advertising displays are currently shown in an isolated area behind home plate. The existing signage may have affected viewers’ learning experience.
The animation effect took place only when the brands were introduced on screen. Within 24 min of video time, there were 11 opportunities to watch the animation effect for those in the animation group. In addition, the animation effect did not include a game enhancement feature. First down lines in NFL or college football are sometimes drawn by a brand sponsoring the event. Since the brand helps enhance the viewing experience of consumers, it may leave stronger trace in one’s memory. Thus, generalization for this study should be limited only to brand logos appearing for commercial purposes.
Sponsors of the game usually have additional advertising/sponsorship oppor-tunities during the television broadcast (e.g., television commercial, in-game announcements). This study was limited to the effects of virtual advertising within the actual broadcast. Thus, the coordinated media effect remains unknown.
The content of the video was from 2002. With the current fluidity of players in the Major League Baseball, several players belong to different teams than at the

Brand Awareness Factors 539
time of the study (e.g., Rafael Palmeiro from Texas Rangers to Baltimore Orioles; Alex Rodriguez from Texas Rangers to New York Yankees). In addition, some players had off-the-field problems before the study, and one of the players was an alumnus of the subjects’ university. The stadium has been renovated, and the sec-tion behind home plate has changed since 2002. Therefore, viewers may have watched the video with greater interest and intensity than they usually watch base-ball games. These factors may have swayed the subjects’ attention more to the game than usual resulting in different awareness levels of virtual advertising.
The study used three brands from three different product categories (automo-bile, beer, sport apparel). Although these were typical sponsors of a baseball game, other brands or other product categories may yield different responses. Research-ers should explore the potential effects in future studies.
Lastly, the sample was neither fans of the Texas Rangers nor the Boston Red Sox. Furthermore, the sample did not seem to be avid baseball fans. Effects of baseball involvement and team identification usually occur when fans are highly involved with a sport or identified with a team. Thus, future research should inves-tigate the brand awareness levels of highly involved and/or highly identified fans. Such research should provide both practitioners and scholars with valuable infor-mation with regard to effectiveness of virtual advertising.
Future Research DirectionsIn relation to virtual advertising, future research should consider other sports that may use it as an alternative means of communication. One such sport may be basketball. For example, regional coverage of Texas Tech University’s men’s bas-ketball broadcasts is inundated with virtual advertisements. Placing virtual adver-tisements in different sport settings may raise additional research questions regarding their effectiveness.
The animation effect in this study appeared only when ads first appeared in the broadcast. Constant animation of brand logos may generate different responses from viewers. Furthermore, virtual advertising with animation effect allows sport marketers to deliver corporate messages to consumers in sentences. With normal virtual advertising or sponsorship signage, the messages are usually the brand logo or at the longest one or two words. However, longer messages can be deliv-ered with the use of animation effect of virtual advertising. They can be scrolled on the canvas or they can dissolve in and out of the canvas, creating sentences. Future studies should consider its effect on consumers.
In addition, exploring viewers’ perceptions of combinations of virtual adver-tising should be considered. That is, broadcast companies have combined virtual game enhancement technology (e.g., virtual first down line in football) and com-mercial virtual advertising to increase effectiveness. Brand logos that help draw the virtual first down yard line or help indicate the speed of a pitch might evoke different awareness levels as well as different emotions than strictly commercial purpose virtual advertisements.
From a methodological standpoint, the survey was administered immediately after the subjects were exposed to the stimuli. The differences between immediate awareness and delayed awareness (e.g., day-after-recall) remain unknown. Singh,
540 Tsuji, Bennett, and Leigh
Rothschild, and Churchill (1988) reported that recognition decays over time, but very slowly. On the other hand, recall rates of advertising need consistent rein-forcements (Krugman, 1972). Therefore, as time differences may affect recall and recognition differently in the virtual advertising context, future research should consider this factor.
To achieve ecological validity, future research may want to explore conduct-ing the study in a real world setting. For instance, examining brand awareness levels at a home party or at a sport bar, where most of the sport viewing occurs, may provide interesting findings. This will certainly bring additional confounds to the study; however, researchers should be able to obtain the ecological validity needed.
Attitudes should be measured along with awareness levels to determine the acceptability of virtual advertising for brands (or companies) that use the medium to reach consumers. Some people may notice the virtual ads on television; how-ever, they may perceive them to be annoying and deceiving rather than conveying brand related information. Bennett, Ferreira, Tsuji, Siders, and Cianfrone’s (2006) study suggested that viewers do not perceive them as intrusive or deceptive. How-ever, their study was conducted in a football broadcast without animation or rep-etition effects. These different factors may pose different effects and outcomes.
In conclusion, this study assessed the effects of animation, repetition, base-ball involvement, and team identification on awareness levels of virtual advertis-ing in sports. The results showed effects of repetition, baseball involvement, and team identification on awareness levels. Multiple exposure of virtual advertising increased respondents’ brand awareness levels. Baseball involvement decreased the likelihood of awareness and team identification increased the levels of brand awareness. Animation, on the other hand, did not influence respondents’ aware-ness levels. This study was an initial attempt to determine the antecedents to brand awareness of virtual advertising in a controlled experimental setting. Further research of this communication method should provide additional contributions to the field of sport marketing.
ReferencesAaker, D.A. (1991). Managing brand equity. New York: The Free Press.Ashforth, B.E., & Mael, F. (1989). Social identity theory and the organization. Academy of
Management Review, 14, 20–39.Bayles, M.E. (2002). Designing online banner advertisements: Should we animate? Pro-
ceedings of the ACM Computer-Human Interaction 2002 conference on human fac-tors in computing systems: Changing our world, changing ourselves, 363-366.
Bennett, G., Ferreira, M., Tsuji, Y., Siders, R., & Cianfrone, B. (2006). Analyzing the effects of advertising type and antecedents on attitude toward advertising in sport. International Journal of Sports Marketing and Sponsorship, 8, 62–81.
Brand Strategy. (2005). Sports sponsorship in first place. Brand Strategy, 191, 37–39.Brandweek (2005, June 20). America’s top 2000 brands. Brandweek, 46(25), S71-S90.Brown, J. (1976). An analysis of recognition and recall and of problems in their comparison.
In J. Brown (Ed.), Recall and recognition (pp. 1–35). London: John Wiley & Sons.Cacioppo, J.T., & Petty, R.E. (1979). Effects of message repetition and position on cogni-
tive response, recall, and persuasion. Journal of Personality and Social Psychology, 37, 97–109.
Brand Awareness Factors 541
Celsi, R.L., & Olson, J.C. (1988). The role of involvement in attention and comprehension processes. The Journal of Consumer Research, 15, 210–224.
Cianfrone, B., Bennett, G., Siders, R., & Tsuji, Y. (2006). Virtual advertising and brand awareness. International Journal of Sport Management and Marketing, 1, 289–310.
Danaher, P.J., & Mullarkey, G.W. (2003). Factors affecting online advertising recall: A study of students. Journal of Advertising Research, 43, 252–267.
Drèze, X., & Hussherr, F-X. (2003). Internet advertising: Is anybody watching? Journal of Interactive Marketing, 17(4), 8–23.
du Plessis, E. (1994). Recognition versus recall. Journal of Advertising Research, 34(3), 75–91.
d’Ydewalle, G., Abeele, P.V., Van Rensbergen, J., & Coucke, P. (1988). Incidental process-ing of advertisements while watching soccer games broadcasts. In M. Gruneberg, P. Morris, & R. Sykes (Eds.), Practical aspects of memory: Current research and issues (pp. 478–483). New York: John Wiley & Sons.
Fisher, R.J., & Wakefield, K.L. (1998). Factors leading to group identification: A field study of winners and losers. Psychology and Marketing, 15, 23–40.
Greenwald, A.G., & Leavitt, C. (1984). Audience involvement in advertising: Four levels. The Journal of Consumer Research, 11, 581–592.
Gregg, V.H. (1976). Word frequency, recognition, and recall. In J. Brown (Ed.), Recall and recognition (pp. 183–216). London: John Wiley & Sons.
Grohs, R., Wagner, U., & Vsetecka, S. (2004). Assessing the effectiveness of sport sponsor-ships: An empirical examination. Schmalenbach Business Review, 56, 119–138.
Hill, B., & Green, B.C. (2000). Repeat attendance as a function of involvement, loyalty, and the sportscape across three football contexts. Sport Management Review, 3, 145–162.
Hong, W., Thong, J.Y.L., & Tam, K.Y. (2004). Does animation attract online users’ atten-tion? The effects of flash on information search performance and perceptions. Infor-mation Systems Research, 15, 60–86.
Iwasaki, Y., & Havitz, M.E. (2004). Examining relationships between leisure involvement, psychological commitment and loyalty to a recreation agency. Journal of Leisure Research, 36, 45–72.
Johar, G.V., & Pham, M.T. (1999). Relatedness, prominence, and constructive sponsor identification. JMR, Journal of Marketing Research, 36, 299–312.
Johar, G.V., Pham, M.T., & Wakefield, K.L. (2006). How event sponsors are really identi-fied: A (baseball) field analysis. Journal of Advertising Research, 46, 183–198.
Johnston, W.A., Hawley, K.J., Plewe, S.H., Elliott, J.M.G., & DeWitt, M.J. (1990). Atten-tion capture by novel stimuli. Journal of Experimental Psychology. General, 119, 397–411.
Keller, K.L. (1993). Conceptualizing, measuring, and managing customer-based brand equity. Journal of Marketing, 57(1), 1–22.
Keller, K.L. (2003). Brand synthesis: The multidimensionality of brand knowledge. The Journal of Consumer Research, 29, 595–600.
Keller, K.L. (2008). Strategic brand management (3rd ed.). Upper Saddle River, NJ: Pear-son Education, Inc.
Knoke, D. (1975). A comparison of log-linear and regression models for systems of dichot-omous variables. Sociological Methods & Research, 3, 416–434.
Krugman, H.E. (1972). Why three exposures may be enough. Journal of Advertising Research, 12(6), 11–14.
Lardinoit, T., & Derbaix, C. (2001). Sponsorship and recall of sponsors. Psychology and Marketing, 18, 167–190.
Lascu, D., Giese, T., Toolan, C., Guehring, B., & Mercer, J. (1995). Sport involvement: a relevant individual difference factor in spectator sports. Sport Marketing Quarterly, 4(4), 41–46.
542 Tsuji, Bennett, and Leigh
Leigh, J.H. (1984). Recall and recognition performance for umbrella print advertisements. Journal of Advertising, 13(4), 5–18, 30.
Leigh, J.H., & Menon, A. (1986). A comparison of alternative recognition measures of advertising effectiveness. Journal of Advertising, 15(3), 4–12, 20.
Leigh, J.H., & Menon, A. (1987). Audience involvement effects on the information pro-cessing of umbrella print advertisements. Journal of Advertising, 16(3), 3–12.
Levin, A.M., Joiner, C., & Cameron, G. (2001). The impact of sports sponsorship on con-sumers’ brand attitudes and recall: The case of NASCAR fans. Journal of Current Issues and Research in Advertising, 23(2), 23–31.
Li, H., & Bukovac, J.L. (1999). Cognitive impact of banner ad characteristics: An experi-mental study. Journalism & Mass Communication Quarterly, 76, 341–353.
Lockhart, R.S. (2000). Methods of memory research. In E. Tulving & F.I.M. Craik (Eds.), The Oxford handbook of memory (pp. 45–57). New York: Oxford University Press.
Lynch, J.G., & Srull, T.K. (1982). Memory and attentional factors in consumer choice: Concepts and research methods. The Journal of Consumer Research, 9, 18–37.
Macdonald, E., & Sharp, B. (2003). Management perceptions of the importance of brand awareness as an indication of advertising effectiveness. Marketing Bulletin, 14, 1–11.
MacInnis, D.J., & Jaworski, B.J. (1989). Information processing from advertisements: Toward an integrative framework. Journal of Marketing, 53(4), 1–23.
Madrigal, R. (2000). The influence of social alliances with sports teams on intentions to purchase corporate sponsors’ products. Journal of Advertising, 29(4), 13–24.
Madrigal, R. (2001). Social identity effects in a belief-attitude-intentions hierarchy: Impli-cations for corporate sponsorship. Psychology and Marketing, 18, 145–165.
Meenaghan, T. (2001). Understanding sponsorship effects. Psychology and Marketing, 18, 95–122.
Mitchell, A.A. (1981). The dimensions of advertising involvement. Advances in Consumer Research. Association for Consumer Research (U. S.), 8(1), 25–30.
Mullin, B.J., Hardy, S., & Sutton, W.A. (2007). Sport marketing (3rd ed.). Champaign, IL: Human Kinetics.
Nebenzahl, I., & Hornik, J. (1985). An experimental study of the effectiveness of com-mercial billboards in televised sports arenas. International Journal of Advertising, 4, 27–36.
Nedungadi, P. (1990). Recall and consumer consideration sets: Influencing choice without altering brand evaluations. The Journal of Consumer Research, 17, 263–276.
Nelson, M.R. (2002). Recall of brand placements in computer/video games. Journal of Advertising Research, 42(2), 80–92.
Ott, R.L., & Longnecker, M. (2000). An introduction to statistical methods and data analy-sis (5th ed.). Florence, KY: Duxbury Press.
Pechmann, C., & Stewart, D.W. (1988). Advertising repetition: A critical review of wearin and wearout. Current Issues and Research in Advertising, 11, 285–329.
Pechmann, C., & Stewart, D.W. (1990). The effects of comparative advertising on attention, memory, and purchase intentions. The Journal of Consumer Research, 17, 180–191.
Pham, M.T. (1991). The evaluation of sponsorship effectiveness: A model and some meth-odological considerations. Gestion, 2000(4), 47–65.
Pham, M.T. (1992). Effects of involvement, arousal, and pleasure on the recognition of sponsorship stimuli. Advances in Consumer Research. Association for Consumer Research (U. S.), 19(1), 85–93.
Pham, M.T., & Johar, G.V. (2001). Market prominence biases in sponsorship identification: Processes and consequentiality. Psychology and Marketing, 18, 123–143.
Rajaram, S., Srinivas, K., & Travers, S. (2001). The effects of attention on perceptual implicit memory. Memory & Cognition, 29, 920–930.

Brand Awareness Factors 543
Ray, M.L., & Sawyer, A.G. (1971). Repetition in media models: A laboratory technique. JMR, Journal of Marketing Research, 8, 20–29.
Reicher, G.M., Snyder, C.R., & Richards, J.T. (1976). Familiarity of background charac-ters in visual scanning. Journal of Experimental Psychology. Human Perception and Performance, 2, 522–530.
Richins, M.L., & Bloch, P.H. (1986). After the new wears off: The temporal context of product involvement. The Journal of Consumer Research, 13, 280–285.
Rosbergen, E., Pieters, R., & Wedel, M. (1997). Visual attention to advertising: A segment-level analysis. The Journal of Consumer Research, 24, 305–314.
Rovell, D. (2004, May 7). Baseball scales back movie promotion. ESPN.com. Retrieved June 11, 2008, from http://sports.espn.go.com/espn/sportsbusiness/news/story?id=1796765
Roy, D.P., & Cornwell, T.B. (2004). The effects of consumer knowledge on responses to event sponsorships. Psychology and Marketing, 21, 185–207.
Sandler, D.M., & Shani, D. (1993). Sponsorship and the Olympic Games: The consumer perspective. Sport Marketing Quarterly, 2(3), 38–43.
Sawyer, A.G. (1975). Demand artifacts in laboratory experiments in consumer research. The Journal of Consumer Research, 1(4), 20–30.
Shank, M.D., & Beasley, F.M. (1998). Fan or fanatic: Refining a measure of sports involve-ment. Journal of Sport Behavior, 21, 435–443.
Shapiro, M.A. (1994). Signal detection measures of recognition memory. In A. Lang (Ed.), Measuring psychological responses to media messages (pp. 133–148). Hillsdale, NJ: Erlbaum Associates.
Shimp, T.A., Hyatt, E.M., & Snyder, D.J. (1991). A critical appraisal of demand artifacts in consumer research. The Journal of Consumer Research, 18, 273–283.
Singh, S.N., & Churchill, G.A. (1986). Using the theory of signal detection to improve ad recognition testing. JMR, Journal of Marketing Research, 23, 327–336.
Singh, S.N., & Churchill, G.A. (1987). Response-bias-free recognition tests to measure advertising effects. Journal of Advertising Research, 27(3), 23–36.
Singh, S.N., & Cole, C.A. (1993). The effects of length, content, and repetition on televi-sion commercial effectiveness. JMR, Journal of Marketing Research, 30, 91–104.
Singh, S.N., & Rothschild, M.L. (1983). Recognition as a measure of learning from televi-sion commercials. JMR, Journal of Marketing Research, 20, 235–248.
Singh, S.N., Rothschild, M.L., & Churchill, G.A. (1988). Recognition versus recall as mea-sures of television commercial forgetting. JMR, Journal of Marketing Research, 25, 72–80.
Sutton, W.A., McDonald, M.A., Milne, G.R., & Cimperman, J. (1997). Creating and foster-ing fan identification in professional sports. Sport Marketing Quarterly, 6(1), 15–22.
Tajfel, H., & Turner, J.C. (1986). The social identity theory of intergroup behavior. In S. Worchel & W.G. Austin (Eds.), Psychology of intergroup relations (2nd ed., pp. 7–24). Chicago: Nelson-Hall.
Tavassoli, N.T., Shultz, C.J., & Fitzsimons, G.J. (1995). Program involvement: Are mod-erate levels best for ad memory and attitude toward the ad? Journal of Advertising Research, 35(5), 61–72.
Tellis, G.J. (2004). Effective advertising: Understanding when, how, and why advertising works. Thousand Oaks, CA: Sage.
Till, B.D., & Baack, D.W. (2005). Recall and persuasion. Journal of Advertising, 34(3), 47–57.
Trail, G.T., & James, J.D. (2001). The motivation scale for sport consumption: Assessment of the scale’s psychometric properties. Journal of Sport Behavior, 24, 108–127.
Turner, P., & Cusumano, S. (2000). Virtual advertising: Legal implications for sport. Sport Management Review, 3, 47–70.

544 Tsuji, Bennett, and Leigh
Wann, D.L., & Branscombe, N.R. (1993). Sports fans: Measuring degree of identification with their team. Journal of Sport Psychology, 24, 1–17.
Wertheim, L.J. (1998). Now you see it. Sports Illustrated, 89(8), 23.Zaichkowsky, J.L. (1985). Measuring the involvement construct. The Journal of Consumer
Research, 12, 341–352.Zaichkowsky, J.L. (1994). The personal involvement inventory: Reduction, revision, and
application to advertising. Journal of Advertising, 23(4), 59–70.Zinkhan, G.M., Locander, W.B., & Leigh, J.H. (1986). Dimensional relationships of aided
recall and recognition. Journal of Advertising, 15(1), 38–46.