investigating factors influencing students’ attitude · investigating factors influencing...
TRANSCRIPT

Investigating factors influencing students’ attitude
and performance when using web-enhanced learning in
developing countries: The case of Saudi Arabia
A thesis submitted for the degree of Doctor of Philosophy
By
Saud Al-Nefaie
School of Information Systems, Computing and
Mathematics
Department of Information Systems and Computing
Brunel University
August, 2015

I
Abstract
This thesis aims to explore learning management systems use and usefulness in
Higher Education (HE) environments in a Middle Eastern developing country (Saudi
Arabia) and gauge what factors influence the attitudes of the learners and by the same
token investigate which of these, if any, do affect their performances in such
environments.
This study intends to delve into these factors and single out any relationships that
might exist among these factors. The LMS (learning management system) chosen for
the purpose of this research is the „Blackboard‟ LMS. To enable the researcher to look
thoroughly at the issue, three separate studies were conducted to achieve
comprehensive results.
Qualitative and quantitative methodologies were combined for maximum Data
collection from participants using questionnaires, interviews and numerical data from
the Blackboard tracking system. A framework encompassing all the perceived critical
variables that could play a part in affecting students' attitudes in the use of the
Blackboard LMS and their overall achievements was designed, developed and then
tested.
The framework consists of four main parts, 1) Learners interaction with their peers;
their ability to use the Internet and associated technologies, named 'learner
dimension'. 2) Instructors‟ technical knowledge and competence, the manner in which
they deliver lessons to learners using 'Blackboard' and the interactions taking place
between the two parties named ' instructor variable or dimension'. 3) The technology
itself variable or dimension: usability, flexibility and quality. 4) The HE institution's
support dimension: training and technical support.
The results have indicated that students were keen to adopt the LMS Blackboard for
their courses. Instructor attitudes and behaviours when using Blackboard were found
to play a major role in students' attitudes and performances. A major relationship was
found in relation to student gender, academic specialization and attitude towards using
the LMS, but not in the way the system is used. Students varied and various academic
specializations were found to impact positively on their attitude towards the use of the

II
system and in their learning (in terms of performance on a specific course). The
learner variable was found to be a good indicator of how students behaved towards
VLE and Blackboard and their achievements. The Instructor dimension was also
found to be a positive indicator of students' attitudes, their use of Blackboard and
achievements in its use. Similarly the technology and the HE institution variables
were also found to be sound indicators of their attitudes.

III
Acknowledgements
I would like to express my deepest appreciation to my supervisor, Dr. Steve Love, for
his guidance, patience, encouragement, interest and cooperation. His comments
always helped me to improve the quality of my thesis and kept me on the right track
throughout my program of study.
From the bottom of my heart, a special thanks goes to my wife and children, for their
support, and efforts in helping me to focus on my study.Without them, I would never
have been able to complete the work.
It is difficult to find words to express my gratitude to my late father who was
dreaming in this moment, but he died before it became a reality, I would also like to
express my deepest gratitude to him through my mother who has kept faith in me all
along.
Finally, I would like to sincerely thank Taif University for providing the funds and the
time to enable me to do my PhD at Brunel University, London. Without their
sponsorship and trust, this work would have never seen the light of day.

IV
Publications:
The following papers are under publication:
Alnefaie, S., Love, S. (2015) Students‟ perceived satisfaction, behavioral intentions
and effectiveness of the Blackboard system at Taif University. The international
review of research in open and distance learning.
Alnefaie, S., Love, S. (2015) A Framework for explaining the relationship between
the main success factors in web-based learning in developing countries. International
Journal of Information & Communication Technology Education.

V
Table of Contents
Chapter 1 Introduction ............................................................................................ 1
1.1. Introduction ..................................................................................................... 1
1.2. Research motivation ........................................................................................ 2
1.3. Research methods ............................................................................................ 3
1.4. Contribution of research……………………………………………………...4
1.5. Organization of the thesis ................................................................................ 5
1.6. Summary ......................................................................................................... 7
Chapter 2 Literature Review .................................................................................. 8
2.1. Introduction ..................................................................................................... 8
2.2. E-Learning overview ....................................................................................... 9
2.3. Learning management system ....................................................................... 10
2.4. Blackboard .................................................................................................... 11
2.5. The importance of learning management systems in higher education in
Saudi Arabia ............................................................................................................. 12
2.6. Critical Success Factors Influencing e-learning (CSFs) ............................... 13
2.7. Students' attitudes towards information and communication technology
(ICT) and e-learning in developing countries .......................................................... 15
2.8. Students‟ satisfaction with and performance in web-enhanced learning ...... 16
2.9. Factors affecting students‟ achievements in web-enhanced learning ........... 23
2.10. University support aspects and satisfaction with technology .................... 26
2.11. Summary .................................................................................................... 29
Chapter 3 Research Methodology ........................................................................ 32
3.1. Introduction ................................................................................................... 32
3.2. Overview of the research questions .............................................................. 32

VI
3.3. Overview of the research approaches employed in the thesis ....................... 34
3.4. Data collection............................................................................................... 36
3.4.1. Questionnaires........................................................................................ 36
3.4.2. Interviews ............................................................................................... 39
3.4.3. Blackboard tracking system data ........................................................... 41
3.5. Analysis of data ............................................................................................. 42
3.6. Summary ....................................................................................................... 44
Chapter 4 learners' perceptions on integrating e-learning into Teaching and
Learning at Taif university ...................................................................................... 45
4.1. Introduction ................................................................................................... 45
4.2. Research Methodology .................................................................................. 49
4.2.1. Data collection instruments.................................................................... 50
4.2.2. Participants ............................................................................................. 51
4.2.3. Procedure ............................................................................................... 52
4.2.4. Data analysing ........................................................................................ 52
4.3. Findings ......................................................................................................... 53
4.3.1. Academic instructor behaviour .............................................................. 53
4.3.2. Questionnaire results .............................................................................. 54
4.4. Discussion ..................................................................................................... 62
4.5. Chapter summary .......................................................................................... 64
Chapter 5 Students’ perceived satisfaction, behavioral intentions and
effectiveness of the Blackboard system at Taif University ..................................... 67
5.1. Introduction ................................................................................................... 67
5.2. Research Methodology .................................................................................. 74
5.2.1. Data collection instruments.................................................................... 74
5.2.2. Participants ............................................................................................. 77
5.2.3. Procedure ............................................................................................... 77
5.2.4. Data analysis .......................................................................................... 78

VII
5.3. Findings ......................................................................................................... 79
5.3.1. Academic instructor behaviour .............................................................. 79
5.3.2. Questionnaire findings ........................................................................... 80
5.3.3. The findings from the Blackboard tracking system ............................... 85
5.4. Discussion ..................................................................................................... 90
5.5. Chapter summary .......................................................................................... 94
Chapter 6 A Framework for explaining the relationship between the main
success factors in web-based learning in developing countries ............................. 96
6.1. Introduction ................................................................................................... 96
6.2. Research dimensions and hypotheses ......................................................... 101
6.2.1. The learner dimension.......................................................................... 101
6.2.2. The instructor dimension ..................................................................... 102
6.2.3. The technology dimension ................................................................... 104
6.2.4. The university support dimension ........................................................ 105
6.3. Demographic differences ............................................................................ 108
6.3.1. Gender .................................................................................................. 109
6.3.2. Discipline type ..................................................................................... 110
6.4. Methodology ............................................................................................... 112
6.4.1. Research design ................................................................................... 112
6.4.2. Data collection instruments.................................................................. 112
6.4.3. Participants ........................................................................................... 113
6.4.4. Procedure ............................................................................................. 113
6.4.5. Data analysis ........................................................................................ 114
6.5. Findings ....................................................................................................... 117
6.5.1. Findings from Science specialisation: ................................................. 121
6.5.2. Findings from Humanities specialisation: ........................................... 124
6.5.3. Findings from Health science specialisation: ...................................... 127

VIII
6.6. Discussion ................................................................................................... 131
6.6.1. Attitudes ............................................................................................... 132
6.6.2. Use of the Blackboard system.............................................................. 134
6.6.3. Achievements ....................................................................................... 136
6.7. Chapter summary ........................................................................................ 138
Chapter 7 Discussion and conclusions ............................................................... 140
7.1. Introduction ................................................................................................. 140
7.2. Summary of the studies' results ................................................................... 141
7.2.1. Students‟ perceptions on integrating e-learning into Teaching and
Learning at Taif University ................................................................................ 141
7.2.2. The relationship between students' use of Blackboard, their performance
on a Blackboard course and students' attitudes towards it ................................. 142
7.2.3. The relationships among the main success factors in web-enhanced
learning........ ....................................................................................................... 144
7.3. Limitations of the study............................................................................... 150
7.4. Future work ................................................................................................. 152
7.5. Chapter summary ........................................................................................ 152
References............... ................................................................................................... 153
Appendix 1........... ...................................................................................................... 178
Appendix 2................ ................................................................................................. 181
Appendix 3............ ..................................................................................................... 182
Appendix 4........... ...................................................................................................... 185
Appendix 5........... ...................................................................................................... 186

IX
List of Figures
Figure 1: A framework for Studying Student Achievements, Attitudes and the use of
Web-based Courses in Relation to Technology, Instructors and Learners (Hammoud
2010) ............................................................................................................................ 99
Figure 2: Illustrates the model (research framework) used in this study. .................. 100
Figure 3: The significant relationships in the framework .......................................... 132

X
List of Tables
4.1: Alpha Coefficients for Constructs with Multiple Items ........................................ 50
4.2:The comparison of mean's across gender .............................................................. 54
4.3:The comparison of mean's between males and females using the Wilcoxon Test 55
4.4: The means across three academic specializations ............................................... 56
4.5: Comparisons across three academic specialization .............................................. 57
4.6: The post-hoc tests across Scientific, Humanities and Health Sciences factors .... 58
4.7: Regression across students' gender, major and ATT ............................................ 59
4.8: Regression across students' gender, major and ESE ............................................. 60
4.9:Regression across students' gender, major and PU ................................................ 60
4.10: Regression across students' gender, major and BI .............................................. 61
4.11: Regression across students' gender, major and ILA ........................................... 61
4.12: Regression across students' gender, major and CUIT ........................................ 62
4.13: Mean and standard deviations in the main constructs ........................................ 65
5.1: Alpha coefficients for constructs ......................................................................... 75
5.2: Demographic profile of respondents..................................................................... 80
5.3: The mean, standard deviation and item-total correlation ..................................... 80
5.4: Comparison of mean's across males and females using the Wilcoxon Test ......... 82
5.5: post-hoc tests across Sciences, Humanities and Health Sciences ......................... 82
5.6: Correlation analyses of variables .......................................................................... 84
5.7: Regression results of predicted path relationships ................................................ 84
5.8: Summary of students‟ use of Blackboard ............................................................. 85
5.9: Means of student visits to each page on Blackboard. (The students were grouped
according to gender) .................................................................................................... 86
5.10: Means of student visits to each page on Blackboard. (The students were grouped
according to field of study) .......................................................................................... 86
5.11: Means of students' grades on all their assignments and exams for the course.
(The students were grouped according to gender) ....................................................... 88

XI
5.12: Means of students' grades on all their assignments and exams for the course.
(The students were grouped according to field of study) ............................................ 88
5.13: Correlations between students‟ use of Blackboard & their grades ..................... 89
6.1: The study sample ................................................................................................ 113
6.2: Reliability of measurements .............................................................................. 115
6.3: Mean and SD of the variables measured by the questionnaire .......................... 117
6.4: Students‟ attitudes toward the use of Blackboard with regard to gender ........... 117
6.5: Results of the t-test for students' achievement with regard to gender ................ 118
6.6: Results of the t-test for students' actual use of Blackboard with regard to gender
.................................................................................................................................... 118
6.7: Results of post hoc-tests for student's attitudes toward the use of Blackboard with
regard to their academic specialization ...................................................................... 119
6.8: Results of post hoc tests for students' achievements with regard to their academic
specialization.............................................................................................................. 119
6.9: Results of post hoc-tests for students' actual use of Blackboard with regard to
their academic specialization ..................................................................................... 120
6.10: Descriptive statistics of students‟ use of Blackboard for S 1 ........................... 121
6.11: Correlations across the four independent variables and the students' attitudes
towards Blackboard in S 1 ......................................................................................... 122
6.12: Correlations across the four independent variables and the students' achievement
in S1 ........................................................................................................................... 122
6.13: Correlations across the four independent variables and the students' use of
Blackboard in S1 ........................................................................................................ 123
6.14: Correlations across students‟ grades and their use of Blackboard in S 1 ......... 124
6.15: Descriptive statistics concerning students‟ use of Blackboard for S2 .............. 124
6.16: Correlations across the four independent variables and the students' attitudes
towards Blackboard in S2 .......................................................................................... 125
6.17: Correlations across the four independent variables and the students' achievement
in S2 ........................................................................................................................... 125
6.18: Correlations across the four independent variables and the students' use of
Blackboard in S2 ........................................................................................................ 126
6.19: Correlations across the students‟ grades and their use of Blackboard in S2 .... 126
6.20: Descriptive statistics of students‟ use of Blackboard for S3 ............................ 127

XII
6.21: Correlations across the four independent variables and the students' attitudes
towards Blackboard in S3 .......................................................................................... 128
6.22: Correlations across the four independent variables and the students'
achievements in S3 .................................................................................................... 128
6.23: Correlations across the four independent variables and the students' use of
Blackboard in S3 ........................................................................................................ 129
6.24: Correlations acrossstudents‟ grades and their use of Blackboard in S3 ........... 129
6.25: Summary of findings ........................................................................................ 130

1
Chapter 1
Introduction
1.1. Introduction
This thesis aims to examine and gauge the factors that affect students' attitudes and
performances in web-enhanced learning environments (VLEs). This chapter begins by
discussing the motivation behind this research and presents a brief background to the
work. The aims and objectives are herein identified and the methodologies employed
to investigate the research questions are introduced. Finally, an outline of the thesis
structure is presented, giving a brief description of the contents of the remaining
chapters.
1.2. Research motivation
The World Wide Web (www) has nowadays become known and used as an important
new and alternative vehicle for the delivery of local online courses or distance
learning (Lee and Shih 2001). Interest in web-based learning and the technologies
associated for its delivery and support has increased no end in higher education (HE)
and this can be seen and is reflected in large number of HE publications and journals
(Hoskins and Hooff 2005). Large numbers of HE institutions are now offering web-
based courses (Owston 2000) or starting to use course management systems, such as
WebCT or Blackboard (Mazzaand and Dimitrova 2004). The Blackboard Learning
System (LMS), which was originally established in 1997, is a virtual learning
environment that is licensed to colleges and other institutions and is now being used
in many professional education institutions for e-learning (Blackboard, 2014).
Blackboard Inc., the developer of the learning system, is a private company, which
has merged its operation with other learning platforms, like Angel and WebCT

Chapter 1
2
(Vilela-Malabanan 2014). It is an LMS that was designed to facilitate the creation and
development of teaching materials to be delivered remotely in VLE environments.
As the number of students seeking entry to HE has increased gradually in recent
years, educational institutions in order to keep up with the demands, have looked at
means in the form of technological learning management systems to facilitate learning
to their applicants as comprehensively and as efficiently as in classroom environments
(Carbone 1998).
HE institutions using technology for the delivery and support for their courses have to
know about the suitability, efficiency and efficacy of their systems. ICT research
clearly shows that one of the most important factors to access that is user satisfaction
(Delon and McLean 1992). For this reason a host of studies have been carried out to
assess students' satisfaction with their web-enhanced learning. Web-enhanced
learning although a traditional face-to-face classroom learning has the benefit and the
innovation of adopting a learning management system (LMS) for enhancement and
enriching of materials. As an example, we cite Blackboard (Sivo, Pan et al. 2007).
Empirical research that has attempted to develop a conceptual framework that gauges
the success of e-Learning implementation is thin on the ground worldwide (Sun et al.,
2008). There is therefore a need for a conceptual framework that can be used to
identify the factors that result in the success of learning management systems. Few
developing countries have attempted such steps, especially in the Arab region (AL-
Fadhli 2008; Abbad, Morris et al. 2009;AbuSneineh and Zairi 2010). The research
carried out in developed countries is not to be taken however as generally relevant to
all because of the diversity of traditions and customs of their developing counterparts,
as it may not be suitable or applicable (Abouchedid and Eid 2004). According to
(AL- Ammary and Hamad 2008; Al-Harbi 2010; AL-Fadhli 2011; Zewayed, Maynard
et al. 2011) the major problems E-Learning projects were faced with in the Arab
region related to a low level of user awareness, attitudes and motivation, lack of a
conceptual framework, absence of a clear vision and strategy, insufficient ICT
infrastructure, lack of adequate internet connectivity, lack of technical and
administrative support and lack of E-Learning repositories containing educational
material and content in Arabic language.
Chapter 1
3
To use computer technology in education does not mean to simply provide the
technology and expect the students and teachers to use it in their courses. It is
important to investigate and develop an understanding of the best ways to use
technology in teaching and learning (Alavi 1994). The wide use of learning
management systems in higher education has highlighted the need for research to
address subjects like users' attitudes and what factors affect students' performance
when using computer mediated communication (CMC), in particular in developing
countries. The program of research in this thesis will focus on web-enhanced learning.
Therefore, the aim of the research reported in this thesis is to investigate the use of a
learning management system in teaching / learning environments and the factors that
affect students' attitudes and performance in developing countries, especially in Saudi
Arabia. The learning management system that is used in this research is Blackboard.
The research objectives driving the research programme reported in this thesis are as
follows:
To investigate undergraduate students' perceptions towards applying e-
learning at Taif University, taking in consideration the effect of using e-
learning on both gender, and academic specialization.
To investigate learners‟ satisfaction, behavioral intentions and the
effectiveness of LMS. Additionally, it undertakes to scrutinize the
relationship, if any, between students' use of this LMS in particular, their
performances and their attitudes towards it.
To revise and modify the conceptual framework of the critical factors
affecting students' attitudes towards Blackboard and test this framework in one
course and in different specializations and to compare the findings.

Chapter 1
4
1.3. Contributions of the research
This work is original, firstly in that it was conducted in the context of a developing
country (Saudi Arabia). Secondly, the key source of originality here is that very few
studies have been undertaken in developing countries on student performance and in
web-based learning in particular. Therefore, the main contribution of this research is
that it addresses the success factors affecting the adoption of LMS at a university in
Saudi Arabia, as this area of research lacks theoretical and empirical studies. In
addition, the research proposes a conceptual framework that integrates critical factors
and demographic variables.
Thirdly, it was empirically concluded in this study that students' use of Blackboard is
significantly influenced through the instructor factor. A likely reason for this is
instructor attitudes towards LMS. The framework for the thesis was developed in
order to understand the relationships among the main success factors in web-enhanced
courses and has not been presented in any previous studies.
Fourthly, the role of social variables like gender and academic specialization has been
proven in the revised conceptual framework, when the actual implementation of
learning management system is explained.
(Hammod 2010) has only investigated the impact of student dimension, instructor
dimension and technology dimension on the success of e-learning but university
support dimension and instructor's attitude factor are not investigated in her study.
This thesis has investigated the influence of university support and instructor's attitude
factor on the success of e-learning, and has found that university support and
instructor's attitude factor are considered as the most important and significant factors
that influences of e-learning with the rest of factors.
This provides a better understanding of the factors which need to be addressed to
achieve an effective implementation of e-learning.
Also, this research fills the void with regard to the lack of studies in developing
countries in general and in Saudi in particular related to the factors that influence e-
learning implementation in higher education.
Chapter 1
5
Finally, one of the main characteristics distinguishing this research is the
methodological approach. The research meets (Al-Hadrami 2012)'s call for using a
more objective measure of student participation (i.e., the student tracking tool
available from the online learning system). Based on the researcher's knowledge, no
other study was observed to use this particular approach to students' actual use of
Blackboard from the tracking system in Saudi Arabia. This research depended on the
quantitative and qualitative data that were collected from participants. The unique
feature is that the quantitative data for this work were gathered from the log file of the
system, which explained exactly how students used Blackboard. These data allowed
the researcher to compare students' and course instructors‟ attitudes towards the
system and how they actually used it. Moreover, it gave the possibility to support the
results concluded from the qualitative work using this type of quantitative data.
1.4. Research methods
Three studies were conducted for the purpose. A combination of quantitative and
qualitative research methodologies was used. The mixed approach was chosen to -
hopefully- enhance findings and results. Naturally field studies were conducted on site
in order to accurately gauge the everyday conditions of usage of 'Blackboard' and to
subsequently perhaps increase the results ecological validity.
Data was collected from not only all participants (students, instructors), but also from
the 'Blackboard tracking systems'; a very useful tool indeed. A number of instruments
were used (questionnaires, interviews and numerical data from the Blackboard
tracking system). In each study, students' attitudes towards the adoption and use
'Blackboard' were measured using questionnaires designed for the purpose. This was
complemented by a series of interviews to gauge instructors' opinions and experience
of the LMS 'Blackboard'. In addition numerical data about students' use of Blackboard
were also collected from the log files in 'Blackboard'. Chapter three provides a
detailed discussion of these instruments and the data collection tools used.

Chapter 1
6
1.5. Organization of the thesis
Chapter two highlights and reviews the pertinent literature. The latter provides the
background to the justification of the research undertaken. An overview of E-learning
in general is presented and is followed by a broad explanation of learning
management systems in general and a detailed account of the LMS Blackboard and its
tools in particular. The chapter consists of a number of sections on the use of Learning
Management Systems in higher education in Saudi Arabia and those variables and
factors surrounding the adoption and use of ICT in VLEs (virtual learning
environments) in developing countries such as students' satisfaction and performance
in web-enhanced learning, those affecting achievements and those related to
institutional support to all users of this new Technology.
The general methodologies and techniques used to carry out empirical tests are
highlighted in chapter three, which is in turn divided into four main sections giving an
overview of the research problems/questions, of the research approaches adopted, the
data collection instruments and the data analysis techniques.
Chapter four lays out the first study which investigates undergraduate students'
perceptions towards applying e-learning at Taif University by looking at the effects e-
learning on both gender and academic specialization. The first study is described in
details and is enhanced by a clarification of the research methods. In other words the
data collection instruments, participants, the procedure adopted and data analysis are
then explained. Finally, the results are reported and discussed and a conclusion is
presented.
Chapter five describes the second field study, which examines learners‟ attitudes
towards e-learning, to understand how to improve e-learning satisfaction, behavioural
intention, and to enhance learning effectiveness. The research methodology is
presented, including sampling, data collection instruments, participants, procedure
and data analysis. The results are then documented, followed by a discussion section,
concluding with a chapter summary.
Chapter six deals with the third and final study. A framework to explore the various
variables and the relationships governing their impact on e-learning/wed-enhanced

Chapter 1
7
learning is put forward and tested. Similarly as for previous chapters, the
methodology and findings are presented and summarised.
In chapter seven the overall results and findings are discussed and potential areas of
limitations are identified and highlighted leaving to others the possibility to further
explore the gaps and extend the research in the future, as ICT is in continuous
development in every sphere of life and indeed in education.
1.6. Summary
A brief explanation of the motivation behind this research is presented in this chapter,
in addition to a brief background to it and the research aims and objectives. The
methodological approach and a brief outline of the thesis were presented. The chapter
that follows is to tackle the background to the research which will be the backdrop for
the aims and objectives of the research undertaken.
8
Chapter 2
Literature Review
2.1. Introduction
This chapter sets out to review some of the previous research on web-based learning
and „Blackboard‟, in order to help to clarify the aim of the thesis in relation to
previous work in the area. First of all, this research aims to examine the use of course
management tools in undergraduate courses and to study factors that affect the
students‟ use, achievements and attitudes towards the learning management systems
(LMSs) used on their courses. The learning management system under study in this
research is „Blackboard‟. This chapter begins with an overview of E-learning, and
then focuses on specific details relating to LMS. The significance of using Blackboard
in higher education in Saudi Arabia is explained, and, following on from that, the
factors that should be considered when studying web-based courses are reviewed. The
focus is here on the medium of communication that the technology creates, rather than
the technological products themselves. The chapter concludes with an indication of
how the author arrived at the research question, based on a perceived gap in the
literature.

Chapter 2
9
2.2. E-Learning overview
Since the inception of E-Learning in 1990, it has become a core element in the
educational process, transforming traditional learning environments, in order to
integrate technology for the creation of more efficient and more attractive learning
experiences. Before E-Learning was widely adopted as the term for electronic
learning, various other names were used, and are referenced in the literature, namely:
web-based learning (WBL), web-based instruction (WBI), web-based training
(WBT), Internet-based training (IBT), distributed learning (DL), advanced distributed
learning (ADL), distance learning (DL), online learning (OL), mobile learning (m-
learning), nomadic learning, remote learning and off-site learning (Khan 2005;
Masrom 2007; Taha 2014).
There are wide range of E-Learning definitions. For example, (Okiki 2011) defined it
as "the use of network technologies to create, foster, deliver and facilitate learning
anytime and anywhere". (Xaymoungkhoun, Bhuasiri et al. 2012) defined it as "an
innovative approach to education delivery via electronic forms of information, which
enhances learners‟ knowledge, skills or other areas of performance". (Mbarek and
Zaddem 2013) defined E-Learning as "educational and learning instruction supported
by the use of ICT allowing learners to acquire new knowledge and skills that are
delivered electronically without worrying about the space-time shift". (Al-Homod and
Shafi 2013) define E-Learning as "an educational system that delivers information
using information technology resources, using the Internet, intranet, satellite
broadcasting and multimedia applications".
Many researchers and practitioners from the fields of information and communication
technology, computer science, education and educational technology have contributed
to defining the concept of e-Learning. E-Learning is claimed to be the new
generation‟s mode of learning and education and is also considered as a new mode of
delivering information in the educational field (Malik 2010; Xaymoungkhoun,
Bhuasiri et al. 2012;Odunaike, Olugbara et al. 2013).

Chapter 2
10
2.3. Learning management system
Multiple networks have emerged as a fourth generation in the e-learning field. Their
three main features are: the retrieval of large amounts of information, the ability to
interact via computer-mediated communication (CMC) and the processing power of
the Java language. These characteristics facilitate the creation of a set of new e-
learning technologies and Learning Management Systems (LMSs), namely WebCT,
Blackboard, Moodle, and Lotus Notes (Garrison and Anderson 2003). A learning
management system is important to learning models, since it provides the flexibility
for learning to exist outside of the traditional classroom. A learning management
system allows traditional courses to migrate to new learning and delivery models to
reach a broader audience. The most popular learning management systems used in
education are Blackboard, Moodle, Desire2Learn, Sakai, Jenzabar, Pearson Learning
Studio/e College, Canvas, Angel, Cengage, Loud Cloud, Adrenna and McGraw-Hill
Connect (Riddell 2013). Most universities use a learning management system to
deliver web-based technologies for online learning to virtual and on-campus students
(Schartz 2014).
LMSs are also called Virtual Learning Environments (VLEs) or Course Management
Systems (CMSs). The key word here is 'Virtual'. This means physical presence in a
traditional classroom environment is not needed as any course can be offered
remotely over huge distances. They offer solutions for both students and instructors
not only locally but also around the globe (Altun, Gulbahar et al. 2008; Chang 2008).
An LMS is defined as a web-based technology that can assist in the planning,
distribution, and evaluation of a specific learning processes (Alias and Zainuddin
2005). As for (Sallum 2008), it is a high solution package that allows for the delivery
and administration of content and resources to students, instructors and employees
alike. LMSs are conceived to contain specific software applications and features
designed to make learning contents easily accessible and manageable. In addition,
registration of students and delivery of programmes is at finger tips and interactions
between instructors and students can be done almost at leisure without the hassle of
making appointments.
These LMSs are also valuable databases in which students activities are logged and
can be monitored at any time over the course of their studies and beyond according to
Chapter 2
11
(Mazza and Dimitrova 2004). Instructors can view accurate statistical data about
students' use of course pages and even times of log-ins log-outs of any student on the
course such as a student's first and last log-ins, the history of pages visited, the
number of messages students have read and posted in discussions, grades achieved in
quizzes and assignments, etc. Instructors are therefore able to use the information to
monitor students' progress and by the same token intervene early to correct the
situation if potential problems are discovered.
2.4. Blackboard
The Blackboard Learning System was introduced to the educational field back in
1997. It is a virtual learning environment (VLE) licensed to HE institutions (colleges
and other institutions) and is now used in K-12, in professional education institutions
as an e-learning tool (Blackboard, 2014). Blackboard Inc., the mother company and
its developer is a private company which has merged its operation with other learning
platforms like Angel and WebCT (Schartz 2014).
At present its share of the educational market is around 41% which makes it the most
popular and the most widely used LMS across the world in HE institutions. It includes
Blackboard-owned products in addition to Angel and WebCT (Green 2013). (Hill
2014) has found that Blackboard was the leading provider of learning management
systems for all schools with larger than 800 enrolment. In 2014 Blackboard held
33.9% of market share well above its nearest rival Moodle with 19.5%, though open-
source options were growing (Chung, Pasquini et al. 2013; Schartz 2014).
Blackboard contains many web-based applications and software tools for educators to
use and as the main source of course delivery. These tools take the form of discussion
boards, videos, live lecture chats, group content sharing, quizzes, exams, wikis,
journals, scheduling systems, reminders, emails, and messaging. The tools that
faculties may choose and wish to implement for a particular course are left at their
discretion.

Chapter 2
12
2.5. The importance of learning management systems in higher education
in Saudi Arabia
Learning management systems and their facilities are being adopted increasingly
frequently in Saudi Arabian universities, a phenomenon mainly caused by the steady
rise in the Saudi Arabian student population in higher institutions. In the academic
year 2012/2013, the student population in altogether 25 universities totalled 880,000
students (Ministry of Higher Education, 2012). Saudi Arabian universities are now
facing problems of overcrowding. In response to increased demand, the use of
information technology is generally viewed as the most viable solution to meet the
challenge. However, the pressing need to adopt computer technology and e-learning
in higher education also means that Saudi Arabian faculty members have to integrate
information technology into their classrooms and use IT facilities as part of their
teaching processes.
Like other universities in developing countries, Saudi Arabian universities suffer from
a shortage of faculty members, especially in applied and medical specializations
(Mazi and Obuamh 2002). One of the greatest benefits of e-learning is that it helps to
reduce dependency on local teaching staff (Alzamil 2006). Thus, through the use of e-
learning, the problem of staff shortages can be minimized, because the internet allows
the design of interactive course materials, which are then delivered over the network
to attending students (Clark and Mayer 2008).
The education system in Saudi Arabia is, like all domains in Saudi Arabian public
life, based on complete separation of students and staff by gender. Hence, educational
institutions have to provide separate buildings and staff for their male and female
students. This puts a considerable strain on available resources and accommodation.
In this respect, (Alaugab 2007) affirms that “the number of female instructors is lower
than male instructors at all academic levels.” E-learning and its various applications is
viewed as the perfect solution in the face of this challenge. Saudi Arabian universities
are thus encouraged to introduce e-learning tools to provide e-courses for female
students in different faculties, since such an arrangement would require only a
minimum number of female instructors.

Chapter 2
13
2.6. Critical Success Factors Influencing e-learning (CSFs)
For (Selim 2007) students, teachers, information technology and institution support
are the major factors that have a significant influence on e-learning and its success or
failure. Similarly, (Frimpon 2012) has added that the role by each of the above
participants is crucial too. A number of studies such as (Sun, Ray et al. 2008), on the
other hand have concentrated on more technical dimensions as requirements for e-
Learning success; namely learner, instructors, course, technology, design and
environmental factors. In turn, (Malik 2010) has also identified that students,
instructors, course design, and other technical factors are significant as well. In
addition, (Mosakhani and Jamporazmey 2010) have identified the following as E-
Learning CSFs: instructor characteristics, student characteristics, content quality,
information technology quality, participant interaction, and educational institutes‟
support and knowledge management. In summary most of studies have highlighted
the significance of the human element in e-Learning such as the roles played by
students and institutions staff as being the most critical components for the success or
failure of e-Learning (Taha 2014).
A host of studies have explored the factors that may play a critical role in the
implementation of e-Learning programmes. (Selim 2007) has identified students‟
characteristics as one of the major factors that have an impact during the
implementation and adoption of integrated technologies such as in the case of e-
learning technology (Presley and Presley 2009; Hammoud 2010; Chokri 2012;Taha
2013). In turn, (AL- Fadhli 2008) has found that the teacher dimension was the most
important factor in e-Learning environments which directly influences students‟
satisfaction (Sun, Ray et al. 2008; Chen, Liao et al. 2009; Owens and Price 2010; Jan
and Contreras 2011; Musa and Othman 2012). In terms of the technology factor
(Pituch and Lee 2006) showed that technology used and the level of its effectiveness
are considered the most significant. These factors seem to highly influence the
acceptance of e-learning. This finding has also been supported by studies conducted
by (Volery and Lord 2000; Masoumi 2006; Selim 2007; AbuSneineh and Zairi 2010;
AL-Fadhli 2011; Musa and Othman 2012), these scholars have indicated that
technology plays an essential role in the successful implementation of e-Learning. As
for the findings of (Masoumi 2006) and (Selim 2007) studies, they have revealed that
the institutional support factor plays a significant role in terms of increasing the use of

Chapter 2
14
e-Learning and enhancing user satisfaction and acceptance of it (Goi and Ng 2009;
Ahmed 2010; Al-Harbi 2010; Mosakhani and Jamporazmey 2010).
2.7. The framework development
Information system research clearly shows that user satisfaction is one of the most
important factors in assessing the success of system implementation (Delon and
McLean, 1992). Wu et al. (2006) stated that this model has partially contributed to
understanding the success of e-Learning. The Technology Acceptance Model theory
is useful in explaining people's attitudes and behaviour towards using information
technology (IT) (Davis et al., 1989). The theory was built upon Ajzen & Fishbein's
(1977) theory of reasoned action which asserts that beliefs could influence attitudes
which lead to intentions to use such systems and eventually influence actual usage
behaviours. Understanding this causal relationship would be helpful in explaining
behaviour in adopting information technology (including e- Learning systems).
Davis (1993) stated that perceived usefulness and perceived ease of use represent
beliefs finally leading to actual use of information technology. Perceived usefulness is
the degree to which a person believes that a particular system will enhance his or her
job performance (i.e., by reducing the time to accomplish a task or providing timely
information). Perceived ease of use is the degree to which a person believes that using
a particular system will be free of effort. The attitude toward use is the user's
evaluation of the desirability of employing a particular information system
application. Behavioural intention to use is a measure of the likelihood a person will
employ the application (Ajzen & Fishbein, 1977). Both attitude and behavioural
intention are critical in studying the use of information technology (Oliver, 1980). The
technology acceptance model (TAM) describes that a person's behavioural intention
concerning the use of an application is determined by perceived usefulness and
perceived ease of use. Since its introduction by Davis, TAM has been widely used for
predicting the use of information technologies (Selim, 2003).
(Selim, 2003) introduced a model for the use of ICT in education. He used the
Technology Acceptance Model proposed by Davis et al. (1989) as a basis for
research. Selim (ibid.) studied the effect of usefulness and ease of use of a course
website on students' course website use. Course Website Usefulness is defined as the

Chapter 2
15
student's belief that using the course website will increase his or her learning
performance, efficiency, and effectiveness. As mentioned above, Course Website
Ease of Use refers to the degree to which the student expects the use of the course
website to be free of effort. Course Website Use is the intention to use the course
website, which is used as an indicator of the acceptance of course websites.
These models (TAM and CWAM) have tended to focus on technology. In addition,
frameworks have been developed to identify critical factors influencing the success of
web-based learning such as the six-dimension integrated model developed by Sun et
al. (2008). Sun et al. (2008) identified critical factors influencing e-Learning
satisfaction. They designed a model consisting of thirteen factors in six dimensions.
They examined the validity of their model by conducting interviews with various
experienced e-Learning learners. Then they developed a questionnaire based on the
interview comments. The questionnaire results showed that only seven factors of their
model affected students' perceived satisfaction which were: learner computer anxiety,
instructor attitude toward e-Learning, e-Learning course flexibility, e- Learning
course quality, perceived usefulness, perceived ease of use, and diversity in
assessments.
Based on previous models and frameworks, a model was developed as the theoretical.
The framework consists of three main dimensions with ten variables; technology
dimension, instructor dimension, and learner dimension. The framework has three
dependent variables which are students' attitude towards using WebCT, students'
achievement, and students' use of WebCT while the literature models only have one
variable which is students' attitude or satisfaction with the web-based learning system.
The study aimed to investigate the relationship between the three dimensions and
three dependent variables: students' attitude towards using WebCT, students'
achievement, and students' use of WebCT (Hammoud 2010). These were explained in
detail in chapter 6.
2.8. Students' attitudes towards information and communication
technology (ICT) and e-learning in developing countries
Research undertaken in the area of attitude and attitude formation shows that attitudes
and beliefs are linked, and attitudes and behaviours are linked; moreover, attitudes are
Chapter 2
16
essentially divided into likes and dislikes (Siragusa and Dixon 2008). With the broad
expansion of ICT in education during the last decade, many studies have explored the
attitudes of users (educators and students) towards the integration of ICT in education
(Mishra and Panda 2007; Wen and Shih 2008;Gasaymeh 2009).
A survey carried out in 2002 to gauge undergraduate students attitudes towards the
use of multimedia tools in Pakistan‟s Virtual University has found that over 90% of
its 387 final year students viewed learning through satellite TV and the Internet as
advantageous, and have in general shown a positive and encouraging attitude toward
the use of such technological tools and e-learning (Hussain 2007). (Omidinia,
Masrom et al. 2011) have identified that it was student attitudes towards modern
multimedia technology which was the dominant factor that determined the adoption
of e-learning in Iran's Educational institutions. (Selim 2007) has stated that users who
were very familiar with web technologies and who had the skills needed to
comfortably manipulate computer and mobile devices for use in instruction have
developed positive attitudes for multimedia use in education. However those students
who did not have much experience in ICT, have shown anxiety in front of computers
and never had high expectations from this modern educational technology. Indeed
they often tended to believe in there were not any benefits in e-learning (Vrana,
Fragidis et al. 2013).
Having had a critical look at the topic, (Friedrich and Hron 2010;Malik
2010;Zewayed, Maynard et al. 2011) concluded that there is no doubt that students'
attitudes had major influence on E-Learning implementation. For them it is Students‟
behaviour and attitude that determine their satisfaction and acceptance of E-Learning.
They have found that the more positive the attitude towards a newly introduced
technology is, the enhanced the experience and the satisfaction rates are.
2.9. Students’ satisfaction with and performance in web-enhanced learning
Technology has the possibility to enhance and transform teaching, but it can also be
used incorrectly or in ways that may interfere with learning, so it is important to know
how to achieve effective learning online (Salter 2003). Different ways can be used to
measure the effectiveness of web-based courses. Therefore, studies in distance
Chapter 2
17
education differ in what they use as evidence of online course effectiveness. As an
example one can cite (Volery and Lord 2000). These scholars have collected data
from students enrolled on a Global Business course in which WebCT was used to
deliver the course materials. They investigated factors that could affect the online
course delivery. Factors such as: ease of access and navigation, interface, interaction
with the instructor, attitudes towards students, instructor technical competence, and
classmates' interaction were explored. (Volery and Lord 2000) have found that
WebCT is easy to use, well designed and a well-structured system that allowed
students to spend considerable amounts of time on the site. The technology itself was
not enough in their view. It has been supplemented by a sound and effective approach
on the part of instructors. Here, the ability to motivate students from going astray by
religiously following instructions and adhering to the content of the course, is the key
to the effectiveness of e-learning remotely or in the classroom. Ability means not only
familiarity with the technology, but also sound knowledge of how it can be
manipulated to the advantage of students and learning outcomes.
Factors that could influence students' performance was investigated by (Al-Hadrami
2012) in web-based courses. Variables such as computer experience, student attitude
toward web-based learning, self-efficacy, motivation, and prior performance were
explored. In addition to that, environmental variables such as student perceptions of
instructor interactions taking place, the usefulness of technology and participation in
the online learning environment were thoroughly looked at one of themselves in
Jordan. The findings have revealed that the input variables (in particular, 'prior
performance' and 'student attitudes toward web-based learning') were the most
significant direct input factors affecting student performances. In addition to that,
environmental variables (particularly student participation in web-based courses and
student perceptions on instructors' instructions) were found to have a considerable
direct effect on student performances.
In another study, (Jurczyk, Benson et al. 2004) results have indicated that students'
attitudes can change during web-based courses. (Hisham, Campton et al. 2004) state
that many factors can affect student satisfaction with asynchronous e-learning systems
having gauged that when they explored the use of WebCT. They have found that a
feedback tailored and personalized was an important factor that plays a significant

Chapter 2
18
role in the success of any asynchronous e-learning system. Supportive learning was
another factor affecting students' satisfaction. This can be achieved by the use of tools
such as discussion boards that can enhance student-instructor and student-student
interactions. Ease of use and ease of manipulation of the LMS by both students and
instructors is a key variable for the satisfaction of participants'. Finding the right and
suitable interface to facilitate the use of the LMS is the right way forward. For this
reasons a well-designed interface is mandatory. This will in no doubt give students
not only the opportunity but also urge to easily access course contents.
(Reisetter, Lapointe et al. 2007) in their investigation of the topic have found that
students taking an online course of study have attributed their successful mastery of
the course contents was due to a large extent to the structure of the website itself,
coupled with the feedback from, and access to instructors. Larger classes in e-learning
are found to affect e-learning according to (Arbaugh and Duray 2002). The larger they
are, the more negative the relationship with online learning and course satisfaction is.
However, flexibility of delivery can reduce participants' negative feelings and can in
the long run affect students' learning and satisfaction positively. Students with
previous experience in using the internet and on-line courses were found to be more
satisfied with the course delivery medium than those who were not. Other scholars the
likes of (Klobas and McGill 2010) chose to look at the issue to gauge the role of
participants involvement and its effect on Learning Management Systems (LMS)
success. The researchers measured LMS success in terms of students‟ satisfaction,
use, and benefits. The results have shown that both instructors and students
involvements can significantly affect information quality, with instructor involvement
having the stronger effect.
A study by (Hammoud, Love et al. 2008), it was found that instructors attitudes affect
student attitudes toward web-based learning considerably. In turn, this has proved to
have a significant effect on student achievement. By being positive instructors
encourage students to interact with each other and with their instructors and this
engenders motivation which reflects in their achievements. This work which was
conducted at Brunel University in London has explored the effects of instructor
attitudes on student attitudes and achievements. The participants were 131
undergraduates enrolled in the second level of a web-based course offered by the
Chapter 2
19
School of Information Systems that used the WebCT system. The researchers have
discovered that student attitudes and performance were significantly affected by their
instructor‟s attitudes. However, in another study conducted by (Hammoud 2010)
which investigated the relationship between the independent model variables
(Learner, instructor, and technology dimensions) and the dependent variables (student
attitudes toward using WebCT, their achievement, and their way of using WebCT
there was no relationship found between the instructor dimension and the students'
use of WebCT. In a similar study undertaken by (Al-Busaidi 2012) the key factors
that could affect and influence LMSs success in blended learning in terms of actual
usage, perceived usefulness, perceived ease of use, and user satisfaction from the
learners‟ perspective were investigated. In other words critical factors related to the
major entities of LMS adoption: learner characteristics (computer anxiety, technology
experience, self-efficacy, and personal inventiveness and innovation), instructor
characteristics (attitude, teaching style, control, and responsiveness), LMS
characteristics (system quality, information quality, and service quality), classmates
characteristics (attitude and interaction), course characteristics (quality and
flexibility), and organization characteristics (management support and training) were
all explored and thoroughly scrutinized. The results indicated that most of these
factors played a critical role to one or several success measures, except those of
learner self-efficacy, management support, and instructor online responsiveness. (Al-
Busaidi 2012) stressed that instructors‟ attitude toward LMS and their control over
LMS are significant factors that could affect learners‟ perceived ease of use;
instructors‟ interactive teaching style is a significant factor for learners‟ perceived
usefulness and satisfaction, whereas the instructor‟s attitude is a significant factor for
learners‟ actual use.
(Yang and Tsai 2008) stated that what students think and feel about any learning tool
might indeed affect their learning behaviour. These learner characteristics have not
been widely explored in web-based contexts. For these scholars, interactions between
students and instructors were found to be one of the most significant features of web-
based learning environments.
A host of studies have highlighted various and numerous factors that affect user
satisfaction with web-based learning. (Sun, Ray et al. 2008) have developed an
integrated model containing the following six dimensions: learners, instructors,

Chapter 2
20
courses, technology, design, and environment. They found that student satisfaction
with e-learning is drastically affected by what they call 'critical factors'; namely
learner computer anxiety, instructor attitude towards e-learning, course quality and
flexibility, perceived usefulness, perceived ease of use, and assessments methods and
diversity. For them, the way forward to improve students' satisfaction toward web-
based courses was to conduct more research and take students views into account to
enable institutions to satisfy the needs of their learners. These researchers have also
stated that many other important variables were identified in studies of psychology
and information system fields that could be relevant to web-based courses. Indeed
they put forward a six dimensions model: student dimension, instructor dimension,
course dimension, technology dimension, design dimension, and environment
dimension, which are in turn made up of thirteen factors.
Learner attitude toward computers, computer anxiety and learner Internet self-efficacy
make up the learner dimension. Instructor response, time and instructor attitude
toward e-Learning form the instructor dimension. Course flexibility and course
quality are the main variables in the course dimension. In the technology dimension
technology quality and Internet delivery quality are the main factors. Finally, how
usefulness and ease of use were perceived was identified as the design dimension
variables and how learners perceived the diversity in assessments and the interactions
with others made up the environmental dimension. They concluded that all the above
factors are closely tied to learner satisfaction. They stated that course quality is every
important variable in e-Learning environment. In other words, course content must be
carefully designed and delivered. This means that the technology used must be user
friendly and easy to manipulate by instructors and students alike, not only to be
perceived easy to use and useful, but also truly useful and easy to handle for satisfying
end users. Easy to manipulate, means flexible in time and content, which gives it an
advantage on traditional classroom learning as it allows learners to choose the most
suitable learning methods and choose their time to accommodate their needs. LMS
administrators have to make sure that all system functions are available and ready to
be accessed (e.g. communication board, mail tool and chat rooms) to provide fluid
and uninterrupted effective environment that enhances student satisfaction with the
whole experience of e-Learning. (Sun, Ray et al. 2008) stress the importance of
students' confidence in using computers as very an important factor in making them

Chapter 2
21
enjoy their e-learning experience. A prerequisite for any online course to better
prepare students must be the preparation of end users instructors and learners alike.
Similarly to other studies, instructors' attitudes were found to impact positively on e-
Learning and consequently on students' satisfaction. Real commitment on the part of
instructors and real enthusiasm will rub off on their students and that would in turn
increase their motivation and eventually their satisfaction with to e-Learning. Here,
institutions careful choice of instructors is paramount. Not only instructors must be
competent and knowledgeable, they must also be enthusiastic and motivating.
Continuous training for instructors to adapt to innovation in technologies should be
the way forward to keep on top of changes in the e-learning domain, (Sun, Ray et al.
2008).
Other researchers, the likes of (Gil 2008) opted to focus on identifying the critical
incidents that may impact on learners' satisfaction with e-learning. Four categories of
critical incidents were found to affected e-learning satisfaction: administration,
functionality, instruction, and interaction. Interactions between participants and
instruction were found to have the most significant impact on students' satisfaction.
To gauge the effects of prior internet use, computer knowledge and experience and
learning styles on students' attitudes, (Wells 2000) investigated the attitudes of a
cohort of students enrolled in a computerized on-line multimedia communication
course. Learning activities and instructional strategies were found to play a key and
effective role in teaching the necessary skills that nudge students to have positive
attitudes and allow them to focus on methods of integration. Prior computer
experience was not found to be an issue for graduate students taking an on-line
course, as they seem to adapt quickly and easily because of knowledge in mobile
gadgets manipulation. There was no need for students to be taught advanced computer
skills as their basic skills were adequate for computer-mediated communication
participation. The course delivery method itself did not give rise to any student
concern, but the course assignment formats raised some concern. Students pointed out
that instructors should focus their attention on how to facilitate activities, rather than
set assignments regardless of whether students have accepted and the technology or
not, because it is the main requirement for multimedia communication. Despite the
fact that sound computer skills on the part of learners had a positive effect on their
attitudes toward the web, little influence was found on overall student performance.

Chapter 2
22
This can only indicate that computer-aided communication, course delivery and
transfer of information back and forth, do accommodate a variety of learning styles
with hardly any negative consequences learning and learning outcomes.
For (Malik 2010) the quality of the technological tools and the infrastructure
efficiency not only encourage students and teachers to interact with the multimedia
resources in e-learning environments, but also increase their satisfaction regarding the
e-learning implementation. In turn, (Friedrich and Hron 2010) ) have pointed out that
certain technical variables have a significant impact on the perceived usefulness of the
technology used and this allowed administrators to successfully predict students‟
acceptance of the e-Learning system used. By comparison, (Zewayed, Maynard et al.
2011) have shown that a determinant and important factor which nudged students to
accept e-learning systems was none other than their perception of how the technology
was easy to use and manipulate despite their basic computer skills.
Students' perception of the quality and quantity of interactions online is closely tied to
the perception of their performances according to (Picciano 2002). However this does
not tally when comparing student interaction as defined by actual postings on a
discussion board with actual performances. As measures are designed specifically to
measure course objectives, the results were not consistent. Actual student interactions
are measured by the number of postings on discussion boards. Looking at this, the
above scholar has found that there were not any differences between the three (low,
moderate & high) interaction groups in terms of performance on the examination.
This was explained by the fact that all students, and especially the low interaction
group, have preferred to focus their attention on the examination instead. As for the
high interaction group, results have shown that the high level of interactions impacted
somewhat on written assignments.
(Hong, Lai et al. 2003) explored a Malaysian university postgraduate students'
perception of success in a web-based learning environment in terms of problem-based
learning. Problem-based learning is a student-centered instructional approach in
which students work in collaboration to solve problems and reflect on their
experiences, while instructors/teachers just take a learning facilitator role. They
endeavoured to map out the differences between learning outcomes of a web-based
course and a face-to-face version of it. The results showed that most students were on

Chapter 2
23
the whole satisfied with their web-based learning experiences, because they have
found the web-based course flexible enough for them learn anytime, anywhere. A few
students however, felt a little isolated and needed face-to-face lectures. This was
attributed to their lack of computer skills. For this reason, supporting students to
develop these skills is mandatory in order to improve learning outcomes in problem-
based learning. Therefore it was recommended that a better design of problem-based
modules and clear structures must be put in place for the guidance of students to
surmount problems in web-based environments.
A huge and pertinent amount of data was collected by (Storey, Phillips et al. 2002) for
the purpose of evaluating the usability of WebCT and blackboard following a survey
of students during course time. Students' satisfaction was found to be closely tied the
convenience and flexibility in the use of web-based tools. Being able to access
information anytime, anywhere and web-based tools that cater for their different
learning styles were also found to be of high importance to students. The scholars also
added that web-based learning tools are not only supporting traditional teaching and
learning by offering new means of delivering education, but also satisfying students
learning needs.
To determine the factors that influence students satisfaction with online learning, a
host of researchers (Peltier, Schibrowsky et al. 2007; Lin, Lin et al. 2008; Klobas and
McGill 2010) have conducted various empirical studies. What they found was that
satisfaction with online learning is influenced by numerous factors; factors mostly
related with the issues of course content, instructors, students, technology, and
support service and learning environment.
2.10. Factors affecting students’ achievements in web-enhanced learning
As there has been a rapid increase in on-line corporate training, the future of internet-
based courses can only be brighter and more lucrative (Arbaugh, 2000). For this to
occur, Arbaugh argues that much more research needs to be conducted to investigate
the effectiveness of using ICT in teaching more closely. What is recommended in
future research is to try and determine accurately what the most appropriate ways of
teaching internet-based courses are and what type of student and instructor function

Chapter 2
24
are best suited in an online environment (Arbaugh, 2000). The effects of student
gender on learning and class participation in a web-based MBA course were
scrutinized. The results indicated that there were not any significant differences in
learning, but only some moderately significant differences in class participation
between males and females. Interaction difficulties were used as a predictor of class
participation as the male students showed the more difficulty in interacting on the
course than their female counterparts.
A host of studies link student characteristics and behaviours to their learning
experience perceptions and attitudes, such as satisfaction, frustration and anxiety. The
impact of perception on learning outcomes and performance was explored. Kim and
Moore for instance, following the investigation of a 2005 web-based course came to
the conclusion that students' interaction with their classmates and instructors may
have an impact on their satisfaction with Web–based courses. Eighty-two graduate
students enrolled on a web-based course at a Midwest university took part. The
finding indicated that those students' who had more interactions with an instructor and
other peers tended to be more satisfied with their web courses (Kim and Moore 2005).
On the whole, interactions seemed to be central in teaching and learning; students
interactions with each other, their interactions with instructors and indeed with the
course itself. As the learning process is based on these interactions, the success or the
failure in learning outcomes depend largely on this social characteristic (Lei, Pahl et
al. 2003). Once communication and collaboration are well established between the
participants, i.e. students and instructors, the world wide web seems to work its magic
in enhancing the working relationships between the two (Cheng and Yen 1998).
In a course delivered in three different ways, (Rivera, McAlister et al. 2002) looked at
the achievements and satisfaction of a cohort of voluntarily enrolled students. A
traditional face to face delivery and assessment method, a web base method in which
both delivery and assignments were online and a hybrid one where the LMS WebCT
was used to deliver the course to a cohort of students physically present in a
classroom. The exam questions for all the participants were taken from the same test
bank. The results showed that students' performances were not affected by the course
delivery methods. However, the different methods seemed to impact on student
Chapter 2
25
satisfaction. In addition, students under the traditional and the hybrid methods have
shown to be more satisfied with their courses than the web-based counterparts.
Student perception of online learning was explored by (Hoskins and Hooff 2005).
They looked at the issue through two questions: ''one, which students use web-based
learning voluntarily; and two, is their academic achievements influenced by this?”
One hundred and ten (110) undergraduate students of different ages and both genders
took part. WebCT was used as the course delivery vehicle. The findings indicated that
the older students accessed WebCT much more than their younger counterparts, spent
longer time on it, and used the notice board more frequently. In addition male students
used the chatting facility more than their female peers. In summary, the age and
gender of learners were found to play a considerable role in determining students' use
of web-supported learning. There was also a definite relationship between the use of
discussion boards and the students' achievements. Those students who posted
messages on the discussion board performed better and obtained better grades than
those who did not. The scholars cited above, despite the fact that they considered their
findings to be important, have called for more research to be conducted on more
students and more courses to confirm the results.
The factors that influence students grades in online course, were the subject of an
investigation by (Coldwell, Craig et al. 2008). These scholars tested student
participation in online discussions. The sample was a cohort of 500 Australian
students that took an ICT bachelor's degree course online. The e-learning LMS
tracking tools were used to track student participation and collect the necessary data
that would provide statistics about the time each student spends online, number of
messages read and posted by each student and course documents viewed by each
student. Students were divided into five categories according to their final grades:
high distinction, distinction, credit, pass and fail. The findings revealed that the
students who obtained high grades (i.e., high distinction, distinction and credit) were
those who participated fully and substantially more than their peers.
Students performances with and without the use of WebCT were compared by
(Sayers, Nicell et al. 2004). Two different groups of students doing the same module
in two different academic years were looked at. The authors hypothesized that online
assessments could have unfavourable effect on the students' end of semester

Chapter 2
26
examination grades. However this did not materialize as the results indicated that
online assessments do not necessarily have a detrimental effect on students' end of
semester examination results. The participant students in this study had the traditional
end of semester exam along with two on-line multiple choice tests delivered by
WebCT. The findings showed that the students who used WebCT achieved slightly
better results than the previous year students who did not use WebCT.
2.11. University support aspects and satisfaction with technology
Being a very recent tool in the educational field, E-learning is still growing and will in
doubt continue to be refined as requirements and services expand and more
applications are introduced. The technological multimedia revolution of the last
decades of the twentieth century have pushed the e-learning process into the fore of
many an educational institution. With more and more institutions moving to e-
learning platforms and technology cost decreasing because of competition, there is no
doubt that e-learning will be challenging traditional face to face learning. Hence
technological and technical support in those establishments that adopt LM systems is
crucial. Teaching and operating problems due to the introduction of such LMSs can
be minimized and even overcome through training, user involvement, and
commitment from institutions and their IT departments. For encouraging - not to say
great - results in e-learning outcomes, coaching and training students and instructors
alike on how to maximize the use of the technologies involved effectively is crucial
during both pre- and post -implementation. Like anything in life, training and practice
breed self-confidence and eventually expertise. Evidence to that has been provided by
several researchers, the likes of (Igbaria 1990; Thompson, Higgins et al. 1991;
Igbaria 1993).
For them, the level of training is most important. They found that users' beliefs
regarding the technology and their subsequent behaviour are positively influenced by
the amount and level of training, as training students on the use and manipulation of
the e-learning system used is thought truly to enhance their awareness on the system‟s
usefulness and ease of use. This is congruent with (Thompson, Higgins et al. 1991)
findings. According to these scholars, technical support to users on the e-learning
delivery technology has been shown to enhance not only their perceived ease of use of
Chapter 2
27
it, but also their views and perceptions regarding the institution's commitment to and
investment in resources that facilitate e- learning for its learners. This would further
demonstrate that institutions, having invested in new technologies and technical
support, would indeed expect their students to use the systems introduced and
persevere with it, (Lopez. and Manson. 1997). Other researchers, the likes of (Igbaria
1990; Thompson, Higgins et al. 1991; Trevino and Webster 1992;Igbaria 1993) also
see technical support as an important facilitator for user attitudes and subsequent
acceptance of LMSs. (Igbaria 1990; Igbaria 1993) goes further as to show that 'Top
management' support is one of the most important factors for the successful
implementation and use of ICT systems in general
Training – (Masrom, Zainon et al. 2008; Mosakhani and Jamporazmey 2010; Puri
2012), all these researchers agree that training for all groups concerned, is a very
crucial factor in the development and the success of e-learning. As technologies are
dynamic and innovations - hardware and software alike - are in constant change all
the time, no e-learning can progress and become very efficient unless users are being
constantly supported and training periodically evaluated and enhanced to satisfy the
needs of learners, (Selim 2003; Selim 2007;Bacsich, Bastiaens et al. 2009). For many,
training on its own is not enough. Scholars suggest that, in order to increase student
satisfaction and by the same token enhance learning outcomes, instructors have to
show not only competence, but also real motivation and sincere enthusiasm during
interactions to coach students and nudge them steadily forward in order to increase
their expertise and satisfaction with LMSs and ultimately enhance their learning
outcomes using multimedia tools (Selim 2005) and (Cruz 2010) totally agree.
Technical Support- By nature, people are always apprehensive when faced with
unfamiliar settings and it is not different for people faced with new technology. For
this reason the availability of technical support is one of the most significant factors in
determining the acceptance of technology for teaching and learning (Williams 2002).
Normally it is often the case in the early implementation stages of technology.
(Venkatesh 1999) found that facilitating conditions and monitoring use are markers
that serve as anchors to inform institutions on the students perception of the ICT used.
Empirical evidence indicates that e-learning projects that were not successful in
achieving their goals did not have access to technical help desks to support users,
(Alexander, McKenzie et al. 1998; Soong, Chan et al. 2001). (Ngai, Poon et al. 2007)
Chapter 2
28
extended the TAM to include technical support as an external variable to gauge and
explain the use of WebCT. Their findings showed that technical support played a
significant direct role on perceived ease of use and usefulness. Similarly, (Abbad,
Morris et al. 2009) found that technical support available to users can have a direct
impact in terms of perceived usefulness and a reasonable indirect impact on the
intention to use the ICT available to the parties involved.
Like in many other domains of social life, there is a general acceptance in the domain
of education that new technologies in general and the World Wide Web in particular,
will continue to have important influence on the ways data is used, shared, stored and
retrieved, stored and shared in learning environments (Jones and Jones 2005). A huge
amount of empirical research in this field was conducted to investigate and compare
traditional methods of course delivery with the new technological ways that use VLE
as a tool in education, to gauge the advantages, disadvantages and effectiveness of
each.
Web-based or VLE teaching is similar to traditional teaching in many ways as it often
has the same amount of face-to-face instruction, but the main difference, according to
(Allen and Seaman 2014), is that web-facilitated instruction uses multimedia
technology to deliver around 29% of course content. The other three quarters plus of
the content is delivered traditionally in this teaching model. Many HE institutions
have in recent years, with the expansion of the web and new platforms, introduced
new technologies in the delivery of education, including social networking tools such
as Twitter (Junco, Heiberger et al. 2011) and classroom blogs (Cakir 2013). These
new platforms have shown a significant increase in student engagement and
improvement in grades in an on-campus environment if their use is integral to
instructional outcomes. However, the classification of the course is determined by the
extent to which these technologies are used in a traditional a teaching model,
alongside other technologies.
Like many other innovations, online learning has created its own challenges for
stakeholders. Despite the continuous developments, the sophistication and the user
friendly designs, student dissatisfaction with the lack of interaction coupled with
technical problems that keep plaguing learning management systems, remain a cause
for concern for educators wishing to promote and extend e-learning (Watters and
Chapter 2
29
Roberston 2009). The public perception that online courses are somewhat inferior to
on-campus courses does not seem to shift (Parker, Lenhart et al. 2011), although that
has been changing over the years (Allen and Seaman 2014), the fact remains that
online learning is not making the huge strides technologist and educators were
wishing for, in spite of the fact that students have reported that this sort of learning
offers more flexibility and convenience, which may in the long run outweigh its
numerous disadvantages (Serhan 2010; Johnson 2012). Perhaps the greatest benefit of
online learning to HE institutions is cost cutting.
Over recent years, learner satisfaction with e-learning environments was meticulously
examined in several studies (Santhanam, Sasidharan et al. 2008; So and Brush 2008;
Wu, Tennyson et al. 2010;Zhu 2012) to gauge out the factors affecting take up. The
findings have indicated that a positive learning climate and performance expectations
affected student satisfaction, with performance expectations providing the greatest
contribution (total effect). Users (students and instructors) attitudes are positive
regarding e-learning when the latter is not only seen, but also felt and recognized to be
helpful in improving their learning and teaching effectiveness and efficiency (Wu,
Tennyson et al. 2010; Rahamat, Shah et al. 2012). For (Chen and Huang 2012)
gauging and understanding student attitudes is paramount in order to be able to better
develop and indeed expand e-learning system functions to meet student needs. In turn
this would in no doubt increase the impact of learning and enhance their satisfaction
with the e-learning process. (Aixia and Wang 2011) have found that students who
showed or held positive attitudes and feelings towards e-learning are those who were
the most satisfied with it the whole process of VLE. This perceived satisfaction was
identified as one of four factors that helped explain 83.8% of the variance of student
attitude.
2.12. Summary
The use of learning management systems to support face-to-face courses is widely
discussed in the current literature. As student population has been expanding over the
years, a large numbers of institutions have been offering courses supported by LMSs
such as the Blackboard system to meet the needs of a greater number of students.

Chapter 2
30
This chapter has looked at the background research on which this thesis would be
based in order to help formulate the research question. The review highlighted the
significance of using learning management systems to support the traditional
teaching-learning process. Students' satisfaction in using these systems and their
achievements are markers and indicator of the learning taking place. For this reason, it
is important to investigate factors that influence this learning. As the literature shows,
student attitudes towards any LMS is an important factor that influences their use of
the system and eventually their satisfaction or dissatisfaction with it. Instructor
attitudes are factors that play a significant role in the motivation of students to use
LMSs and should be considered when institutions are introducing or offering web-
based courses. Additionally in order to improve user satisfaction with LMSs and
enhance learning experience and effectiveness, a need to examine, ascertain and
understand learners‟ needs and behavioral intentions is mandatory. To fully grasp how
effective or not the Blackboard system would be for such or such course,
comprehensive training for users on the technology and continuous institutional
support and commitment to them over the period of the course must be paramount.
The review showed that none of the reviewed studies has attempted to combine the
four dimensions in one research. Further, it was found that no study on the adoption
of e-learning from the Saudi students' perspective has been conducted. The chapter
also looked in depth at the constructs comprising the research conceptual model.
Therefore, the aim of the research reported in this thesis is to investigate the use of a
learning management system in teaching / learning environments and the factors that
affect students' attitudes and performance in developing countries, especially in Saudi
Arabia. The learning management system that is used in this research is Blackboard.
The research objectives driving the research programme reported in this thesis are as
follows:
• investigating undergraduate students' perceptions towards applying e-learning at
Taif University, taking in consideration the effect of using e-learning on both gender,
and academic specialization.
• investigating learners‟ satisfaction, behavioral intentions and the effectiveness of
LMS. Additionally, it undertakes to scrutinize the relationship, if any, between
Chapter 2
31
students' use of this LMS in particular, their performances and their attitudes towards
it.
• revising and modify the conceptual framework of the critical factors affecting
students' attitudes towards Blackboard and test this framework in one course and in
different specializations and to compare the findings.
In general, it can be identified that there is a shortage of studies on E-Learning
implementation in higher education in Arab countries and subsequently a lack of a
conceptual framework to enhance the success of E-Learning when implemented or the
adoption of E-Learning in educational settings. Despite the shortage of a significant
number of studies in Arab countries, it can be seen from the previous studies that
there are some common challenges and issues for implementing and adopting E-
Learning in educational settings, challenges such as the significant and the most
important factors for successful implementation and adoption of E-Learning.
The next chapter will describe the research methods used in the studies reported in
this thesis.

32
Chapter 3
Research Methodology
3.1. Introduction
Four main parts make up this chapter. A review of the questions that this thesis is
attempting to answer is followed by a general definition and explanation of the
approach used in conducting the research. The third part gives an account of the data
collection procedure, and finally, the findings obtained and analysis are presented in
the last part.
3.2. Overview of the research questions
This study aims to examine students' use of the learning management system
(„Blackboard‟) in undergraduate courses. Specifically, the relationship between the
main variables and the success or the failure of web-based courses will be explored.
The first study cited therein looks at investigating undergraduate students' perceptions
towards applying e-learning at Taif University, taking into consideration the effect of
use of e-learning on both gender and academic specialization. The second study
investigates learners‟ satisfaction, behavioural intentions and the effectiveness of the
Blackboard system and, additionally, the relationship between students' use of the
Blackboard, their performance and students' attitudes towards it. Finally, in the third
Chapter 3
33
study, a framework showing the relationships between the most relevant variables in
web-based courses is developed and tested.
The research to be carried out will benefit from the experience gained at Taif
University, one of the leading universities in the KSA, which has invested in and
implemented the Blackboard learning management system to support many courses
offered to students. This avant-garde teaching and learning programme began in 2012,
and soon became important in the assessment of user satisfaction following
implementation and delivery. The investigation looked at the factors that could affect
students' use of the system and their learning outcomes. These factors are
multifaceted, and can originate from any associated variable: the system itself, the
institution‟s support, as well as student and instructor characteristics.
The first study, as will be reported in Chapter 4, starts by investigating undergraduate
students' perceptions towards applying e-learning at Taif University taking in
consideration the effect use the Blackboard system on both gender, and academic
specialization. It will describe general students‟ perceptions towards the new system
and various attitudes from the instructors. The second study, as will be presented in
Chapter 5, investigates learners‟ attitudes towards e-learning, in order to understand
better how to improve e-learning satisfaction, behavioural intention, and also to
enhance learning effectiveness.
This study uses Blackboard as the Taif university e-learning system. Additionally, the
relationship between students' uses of Blackboard, their performance and students'
attitudes towards it. The second study shows the level of student satisfaction with the
system and its effectiveness. A significant relationship was found between students'
gender, academic specializations and students' attitude, but not their way of using it.
Students with different academic specializations were found to have a positive
attitude towards the Blackboard system, and use it in their learning. Consequently,
based on the first and second study, a framework was developed to explore the critical
factors influencing student satisfaction, their performance and achievements in
coursework supported by this LMS.
Chapter 3
34
3.3. Overview of the research approaches employed in the thesis
A combination of qualitative and quantitative approaches was used to draw on the
strengths of each in order to attempt to obtain empirical results that could lead to
sound conclusions, in a similar fashion to (Owston 2000), who used mixed-method
evaluation strategies to evaluate web-based learning environments. In his opinion, the
richness and complexity of a web-based learning environment can only be captured
and fully understood to its greatest potential by combining research methods rather
than using a single approach. (Creswell 2003) seems to agree. In using this
combination method, the researcher gathered a wealth of data by employing a host of
instruments, such as surveys, experiments, interviews and observations, in order to
arrive at a set of comprehensive results or findings and consequently answer the
pending research questions. This method is a very useful way to truly capture the
dynamics of a topic, as it offers the best of both worlds; the quantitative and the
qualitative.
(Breakwell, Hammond et al. 1995) state: “... hypotheses are formal statements of
predictions derived from evidence from earlier research and theory or simply the
result of a hunch”. These hypotheses can be thoroughly tested by the manipulation of
one or more of the variables involved (Preece, Rogers et al. 2002). By assigning
participants to different conditions and manipulating the various variables involved,
researchers can obtain results by measuring the effects of this manipulation on one or
more dependent variables and the control of others in a controlled experiment
(Robson 2002).
Researchers have two kinds of experiment at their disposal: laboratory tests and field
experiments. Laboratory tests take place in a controlled environment resembling the
real one, but, in essence, differ physically and environmentally. This could affect
participants due to the fact that this closed, laboratory environment is alien. This
could be a blessing in disguise. (Coolican 1994) explains that the advantage of the
laboratory is that it allows the manipulation and control of variables in order to obtain
accurate cause and effect measurements, thus facilitating comparison between the
many different designs. Moreover, laboratories allow a large number of technological
devices and apparatus to be stocked and easily used, being close at hand, unlike in

Chapter 3
35
remote field work, thus enabling researchers to carry out extensive data recordings in
an environment where all participants concerned are free from everyday distractions.
On the same issue, (Coolican 1994) singled out two potential weaknesses that
laboratory settings seem to be prone to. One is the fact that they are artificial, and
there is an inability to generalize. Because the setting, or more precisely the situation,
is not real, there is no doubt that this may affect the participants taking part. Taken out
of their natural and customary environment, laboratory settings could cause them to
be anxious or overawed. These feelings of anxiety and awe, if accentuated and
accumulated, could no doubt affect performance negatively, especially if the persons
carrying out the experiment decide to be inflexible in following rigid or standardized
protocols, without giving a second thought or appropriate consideration to the human
element involved. Neglecting interaction norms may lead to a negative impact on
performance, and, by the same token, to a disappointment in the desired outcomes and
perhaps even an all-round failure to meet the objectives and targets set.
An element of bias may also creep in, as a result of the experimental situation‟s
demanding characteristics. In other words, the participants may alter their behavioural
ways in order to satisfy not only the requirements of the experiment, but also their
interpretation of what the experiment is testing, and thus accommodate for the
demands of the experimenter. This effect has been shown to be always present and is
indeed most pronounced among participants who have volunteered for an experiment
(Rosenthal and Rosnow 1975). Despite the fact that bias could be mitigated by
keeping experimenter-participant interactions to a minimum, as is often the case when
dealing with human-computer interaction experiments, many scholars have argued
that there will always be weaknesses which prevent results from being generalized to
the real world outside the laboratory.
Fieldwork places participants into a real or natural environment, causing real situation
interactions between participants and technology systems such as LMS (Coolican
1994). Participating parties act and interact in real world situations, with all their input
of ambient noises, different and varied movements, natural interruptions and
occasional distractions, which are hard to replicate in laboratories. This enables
results to be generalized to the real world, thus increasing the validity and the
reliability of results; bias is largely reduced. The natural environment in which

Chapter 3
36
fieldwork takes place does not give rise to participants altering their behaviour to
satisfy experimental demand characteristics. In this way performance is not affected.
For (Robson 2002), using ethical means to randomly allocate participants to
experimental conditions makes field studies preferable to laboratory ones.
Taking into consideration the potency and relevancy of the above arguments, this
study has cast aside laboratory work and has opted instead for field studies using the
mixed methodology approach to gather a wealth of data and consequently enhance
results through sound analysis. The LMS (Blackboard) was the target topic for on-site
evaluation, i.e. in real and natural everyday teaching and learning situations and
venues, to yield results better than could be achieved if laboratory conditions were to
apply.
3.4. Data collection
A number of instruments were used to collect the data. Questionnaires, interviews and
Blackboard tracking system's numerical data were the main tools for gathering them.
A brief outline of each instrument is presented in the next sub-sections.
3.4.1. Questionnaires
According to (Coolican 2004) “A questionnaire is one of the basic research
techniques for gathering structured information from individuals or group of
individuals”. Questionnaires are often designed to gauge participants' views, opinions,
attitudes, behaviours or thoughts about a specific topic, and tend to gather a wealth of
data. Researchers have to adhere to a set of commonly agreed rules and bear certain
principles in mind while designing such questionnaires.
In questionnaire design, time has to be given serious consideration, as it may be very
precious to respondents. Questions have to be to the point; any excess time spent
answering them will affect mood and by the same token may affect answers.
Questionnaires must contain clear, concise, usable and answerable questions fit to the
purpose; they must be designed to allow for honest, natural and truthful responses, as
complicated, difficult or wide-ranging questions may not be answered truthfully, or

Chapter 3
37
may not reflect the individual‟s real beliefs. The subject of parenting may be used as
an example. If questions on child upbringing are not phrased sufficiently clearly, they
may lead to responses that conform with general expert views on good practice rather
than to parents' actual practice. Finally, there is the issue of ethics. Here, researchers
have to take extra care not to offend respondents, and to make sure that questions will
be answered and not rejected. Some might refuse to answer questions about sensitive
topics (Coolican 2004).
The researcher took great care in the formulation of questionnaires for this study,
details of which are presented in Chapters four, five and six, respectively. The three
questionnaires were generally set to gauge students' attitudes about the use and
usefulness of the Blackboard LMS for their courses and to gather information about
students' experiences. These questionnaires contained closed and open-ended
questions, divided into two groups of positively and negatively worded statements, in
order to obviate the bias effects that may be caused by a respondents' tendency to
habitually agree or disagree with the statements.
In accordance with (Coolican 2004) and other authors, we believe that open-ended
questions have several advantages, in that they tend to deliver richer information and
encourage respondents to answer in accordance with their own views and beliefs and
not stick with fixed-choice answers. Open-ended questions are more realistic, because
they tend to nudge respondents to give reasons or explanations for why they agree or
disagree with such or such a statement.
For accurate and more comprehensive results, a 5-point Likert scale was used to
measure students' attitude. (Coolican 2004) states that: “... attitude scales are highly
structured measures which usually contain statements to which respondents provide
the most appropriate response”. Here, the researcher is aware that each attitude scale
attempts to be a unitary measuring instrument, not an opinion questionnaire. Several
popular types of scales are used by researchers (Coolican 2004).
Equal-appearing intervals (Thurstone 1931): on this scale a score values equate with
the equivalent agreement or disagreement strength of every statement that a
respondent makes. To well re-structure such a scale, the researcher needs to take the
following steps:
Chapter 3
38
Offer quite a large number of both positive and negative statements regarding the
attitude issue.
Refer this to a chosen group of judges to rate the statements ranging from 1
(highly negative) to 11 (highly positive).
Take the mean value of all the ratings for each statement to set the scale values.
The overall attitude score should be the total of all scale values on items
respondents agreed with.
Despite all these measures, the scale remained problematic and plagued with
difficulties. Although the respondents were honest and truthful, they could never be
completely neutral, as it is difficult to select the most discriminating statements from
items that have the same scale value.
(Osgood, Suci et al. 1957) refer to the concept of semantic differential. The scale is
used when the connotative meaning of an object for an individual needs to be
measured. Here, respondents are asked to mark a scale between bi-polar adjectives
according to which they feel the object pertains.
The semantic differential tends to correlate with other attitude scales used in attitude
measurement and often produces good reliability values. However this scale seems to
carry a weakness. This weakness resides in the fact that respondents may have a
tendency towards a position response bias, usually marking at the extreme end of the
scale (or won't use the extreme at all) without considering possible weaker or stronger
responses.
In summated rating (Likert 1932), researchers need to take the following steps in
order to structure the scale:
As for the Thurston scale, they need to create a set of favourable and unfavourable
statements about an attitude.
Respondents should be requested to give their response to each statement, using a
scale ranging between strongly disagree to strongly agree.
The most effective method for field measurements is to choose a moderate range scale
amid the many scales available (Dix, Finlay et al. 2003). In other words, scales that

Chapter 3
39
range from 1 to 3 points (too low) and those that range from 1 to 9 (too high) should
be avoided, and scales between 1 to 5 or 1 to 7 should be selected. Taking this into
consideration, it was decided to use a scale of 1 to 5 for the measurements. As a score
for each respondent for each item, a single value is attributed, five for strongly agree
and one for strongly agree. Overall attitude scores are calculated by summing the
scores for each item.
The Likert scale also has its problems. "Undecided" or score 3 is ambiguous. Does it
represent no opinion or an on-the-fence opinion? This makes the response unclear,
which makes the central value in an overall score distribution quite unclear, not to say
inaccurate. Median values such as 25 out of 50 or 30 out 60 could be 'undecided', or
could represent a collection of „strongly for‟ and „strongly against‟ responses, which
can be frustrating.
Nevertheless, the Likert scale was adopted for this research, because of the
advantages indicated by (Coolican 1994). He states that it is more natural to complete
and maintain the respondents' direct involvement, and this scale has been shown to
have a high degree of validity and reliability, and has also been shown to be effective
in measuring changes over time.
3.4.2. Interviews
For the first study (discussed in Chapter four) the researcher used interviews to collect
information from the participants. For the collection of qualitative data scholars agree
that interviews are a suitable and easy instrument to use and may contain both open-
ended and closed questions. An array of face-to-face interview techniques that range
from fully structured to totally unstructured is available to researchers according to
use (Coolican 2004):
Non-directive interview: As the term indicates, in this type of interview, the subjects
had the freedom to express themselves about the topic and say what they liked or felt
without guidance or direction, to avoid affecting the topic under discussion. This type
of interview is often used in studies where interviewees need assistance in dealing
with personal problems or to increase their self-awareness. This sort of research
Chapter 3
40
instrument is used by psychotherapists and counsellors, but it is not favoured in
academic research circles for data gathering.
Informal interview: If there is no need for the research questions to be pre-set, this
type of interview is perfect for the job in hand. Here, interviewees are free to talk
about any aspect of a topic. The interviewer may just give direction to keep them on
track and sometimes prompt them. Interviewees should be made aware of the reason
for the interview, what the topic is and what is really expected from them and how the
information will be used.
Semi-structured interview (informal but guided): This type of interview rates among
the most popular instruments, because procedures and administration are kept quite
informal. Here the questions are not organized in the same order each time, and the
interviewer alters them to reduce monotony and formality and to put the interviewee
at ease.
Structured but open-ended interview: For this instrument a pre-set and pre-
determined number of open-ended questions are asked in a certain order to keep the
interviewer focused solely on data gathering, thus avoiding two-way conversations
and time-wasting, especially if field studies are carried out at a long distance from
base, by the same token reducing costs. In this type of interview, the inconsistency
and looseness that may creep into other types of interviews can be side-stepped by the
interviewer. However, respondents are left to express themselves freely and can still
respond in any way they wish. This type was employed in the studies reported in
Chapters four and five.
Fully structured interview: As the name indicates, this sort of interview consists of a
number of pre-set questions asked in a pre-determined order. This format is
characterised by yes-no questions, multi-choice response statements or multiple-
answer questions. They are easy and less time-consuming to administer, and can be
used in conjunction with other instruments to gather data, even in the street.
Responses can be counted and analysed numerically.
Chapter 3
41
3.4.3. Blackboard tracking system data
Following in the footsteps of previous scholars like (Wellman and Marcinkiewicz
2004; Hoskins and Hooff 2005; Johnson 2005; Hammoud 2010; Al-Busaidi 2012),
objective data were gathered from the Blackboard tracking system database. To
faithfully comply with this method of data collection, statistical data relating to
students' use of LMS (Blackboard) were collected weekly from the start of term (for
each study reported in this thesis). The Blackboard tracking system is that it provides
information regarding the students' use and visits to every tool and page on
Blackboard.
The students' use of the LMS (Blackboard) can be monitored, indeed measured. In
other words, it is possible to compute and record the number of Blackboard page hits,
the total amount of time spent using Blackboard, the number of times they accessed
Blackboard and bulletin board use. A „hit‟ is the number of times a user accesses a
page such as homepage or content page (containing lecture notes) or any other page.
Bulletin board use is the number of messages each student reads or posts on the
discussion board. Statistical information can be collected in various ways, and
scholars like (Owston 2000) used Web Trends and the server log files analysis tool, as
a data collecting tool, to perform similar operations as Blackboard's tracking system
log files. This researcher has regarded log files as a potentially useful and rich data
source for evaluating web-based learning.
The present research makes use of the valuable and readily available data on the
Blackboard tracking system, enabling the researcher to obtain accurate information
about students and course leaders, without asking them a huge number of questions or
resorting to conducting interviews. Tracking system data has facilitated the
researcher's task of matching the results obtained following the analysis of the data
gathered from questionnaires and interviews with results obtained from the tracking
system numerical data analysis.

Chapter 3
42
3.5. Analysis of data
The students' general use of Blackboard was measured as the number of times each
student visited any of the Blackboard pages or made use of the discussion board, by
either reading or posting information. Their achievements were measured by the
grades they obtained while they were doing the course, and their attitudes towards the
LMS (Blackboard) were measured using a Likert scale. The data were analysed using
SPSS.
All information obtained from the students' study records was kept strictly
confidential at all times, and none of the identifying information was disclosed or
referenced in an identifiable way, in either a written or verbal form or context.
For reliability, validity and transparency purposes, all statistical tests to be applied to
the data are agreed upon at the planning stage of the study, to ensure that data can be
meticulously manipulated and properly and carefully analysed, in order to fully test
the hypotheses and either support them or refute them (Breakwell et al. 2000). For all
the three studies presented, the numerical data obtained after the administration of the
questionnaires were analysed using frequency measurements. The qualitative data
from interviews with lecturers and students' comments were subjected to thematic
analysis, in line with what (Bryman and Cramer 2005) perceived as suitable for this
sort work. In other words, they saw that correlation was one of the most important and
reliable tools to show explain and clarify the relationships among the various
variables involved, as measuring the correlation between variables would show the
strength, significance and the direction of this relationship.
In the sphere of the social sciences, one of the most widely employed techniques for
data analysis currently used is regression analysis, and, for this reason, it was used to
explore relationships between pairs of variables. This study makes it apparent that
regression is a powerful tool for showing and summarizing the nature of the
relationships among variables and for making predictions about the likely values of
the dependent variable (Bryman and Cramer 2005).
The measurements of students' academic achievements for the courses used in the
studies cited in this research were correlated using the Pearson's Product Moment
Correlation Coefficient with the measurements of the LMS use (e.g. Blackboard hits

Chapter 3
43
and communication board usage). The researcher also endeavoured to test the
potential significance of the relationships between students' achievements and their
use of Blackboard, and it was used to illustrate the relationships that exist among
these variables.
(Bryman and Cramer 2005) stated that one of the most important explanations of the
relationship between variables is the correlation. The measures of correlation between
variables indicate the strength, significance and the direction of the relationship.
Pearson's (r) gives the strength and the direction of the linear relationship between
variables to be assessed. Pearson's (r) varies between -1 and +1. A relationship of -1
or +1 would indicate a perfect relationship, negative or positive respectively, between
two variables. The significant (p) value tells us how confident we can be that there is
a relationship between two variables.
An ANOVA is a “statistical technique used to determine whether samples from two
or more groups come from populations with equal means (i.e., Do the group means
differ significantly?)” (Hair et al.2010). Thus, it is a statistical procedure that uses the
F-ratio to test the overall fit of a linear model (Field, 2009).
A paired t-test was used to compare means on the same or related subjects over time
or in differing circumstances. However, the observed data are from the same subject.
An extension to this test, the repeated measurement ANOVA, was added, because it is
known to be a powerful means of analysing differences among three or more
conditions, and it is a sound and efficient technique used for studies similar to the
work undertaken in this thesis. In other words, we can use a one Way ANOVA test to
compare three or more groups or conditions in an experiment. A one Way ANOVA
can help you find out if the means for each group / condition are significantly
different from one another or if they are relatively the same. If the means are
significantly different, you can say that the variable being manipulated Independent
Variable, had an effect on the variable being measured Dependent Variable.

Chapter 3
44
3.6. Summary
In the chapter 'Methodology', the researcher carefully laid and described the
methodologies and techniques that he has used to carry out the work conducted for
this thesis. At first, the researcher presented an overview of the research problem;
then, the general research approach was explained and a justification for the selection
of the methodological approach was provided. Following that, a detailed explanation
of the data collection instruments and procedures was put forward. Finally, an
explanation of the data analysis procedure and the tests that have been conducted in
order to draw conclusions from the findings were presented.
45
Chapter 4
Learners' perceptions on integrating e-learning into Teaching and
Learning at Taif University
4.1. Introduction
E-learning (or Internet-based learning) has become one of the fastest moving modes
to provide exceptional opportunities for increasing access to education for a greater
number of learners. The rapid growth in its use over the last couple of decades has
naturally – and for obvious reasons – occurred in developed countries, such as the
United States (US) and the United Kingdom (UK). In the US, this mode of learning
has taken different names, such as CMS (course management system) or LMS
(learning management system), while in the UK, VLE (virtual learning environment)
and MLE (managed learning environment) are more commonly used terms (Martin-
Blas and Serrano-Fernandez 2009).
E-learning platforms come in different shapes and forms. Some are very professional
and are intended to be used as commercial software, such as 'WebCT' and
'Blackboard' (www.blackboard.com), whereas others are open-source software, such
as 'Moodle' (www.moodle.org) and 'Atutor' (www.atutor.ca) or even amateurish
products such as individual teachers or educational groups with small projects
designed locally just to satisfy the needs of local learners. Most applications have
common features, but some are more flexible and complete than others (Martin-Blas
and Serrano-Fernandez 2009). What make these platforms very attractive to learners
and instructors alike are quality, superior instructional design and ease of delivery. In
addition they are very cost efficient for teaching in institution

Chapter 4
46
(Ettinger, Holton et al. 2006). If the make-up of the instructional design is not
sufficiently easy for students to follow, no amount of modern technology will be able
to help, even if motivation is very high and teachers or instructors are exceptionally
committed, as technology is merely an aiding tool to the teaching and learning
processes (Kamarulzaman, Madun et al. 2011).
As indicated in Chapter 2, the use of Information and Communication Technology
(ICT) in delivery of education has major implications for learners and institutions. It
is widely accepted that advances in information technology and new developments in
learning science provide opportunities to create well-designed, learner-centred,
interactive, affordable, efficient and flexible e-learning environments (Khan 2005).
Considering that students‟ perceptions of e-learning are important to the successful
development of e-learning in higher education, the attitude of the user towards the
application of information technology has become an important factor. The first study
in this thesis is presented in the current chapter. It focuses on the students' attitudes
that play a substantial role in improving the efficiency of the e-learning system.
At the beginning of the 2012 academic year, Taif University took the courageous
decision to introduce and adopt Blackboard as an online learning management system
for all of its students. In the face of such rapid growth in the use of LMS systems, it is
important to understand how these platforms and the technologies associated with
them are being used, and how they impact on users. As Coates puts it, LMSs are here
to stay, because, apart from providing resources for distance learning, they add a
virtual dimension to traditional campus-based study and a huge reduction in
educational costs (Coates 2007). In addition to that, because of their flexibility, they
also facilitate hybrid or blended studies that combine online and on-campus
components.
In exploring the factors that affect and indeed influence this non-traditional learning
sphere in Saudi HE institutions, Al-Harbi carried out a study in 2011 (Al-Harbi 2011).
He looked at students' attitudes and perceptions and their impact on the acceptance or
dislike, not to say refusal, of this mode of education. The findings will be discussed in
due course. We believe we need to carry out further research in the Kingdom to truly
gauge Saudi male and female students attitudes to, and their perceptions of, new
learning platforms using contemporary communication technologies, because, in my

Chapter 4
47
view, e-learning is here to stay. Like anything new, some non-conformist or non-
traditional users are at first very uncomfortable, especially if the topic has not been
well researched and well tested on large samples of users.
(Alobiedat and Saraierh 2010) agree, believing that at a multitude of HE institutions
and universities around the world, the effectiveness of this new mode of learning and
all its tools, instruments and methodologies have not been fully researched prior to
adoption. My aim in conducting this study is to better understand the mechanisms
involved, and the impact of remote learning technologies on student attitudes towards
e-learning in general and its deployment by HE institutions. The objective is to
achieve that by investigating the faculty of education‟s students' attitudes towards e-
learning in general, and the use of the platform as a learning resource in particular.
We shall look at the effects of accessing and using the internet in general and
endeavour to gauge the impact of using the platform as a learning resource on gender
in particular.
Studies by (Oye, Iahad et al. 2012) have confirmed that, positive perceptions on not
only the use, but also the continuation in using this sort of learning are crucial to
nourish individuals‟ intentions. Their study demonstrated that attitudes do impact
significantly on intentions, and that actual e-learning usage produces ample and
much-welcomed effects on students‟ performances in their studies. It was found that
continuous e-learning use is indeed associated with students‟ increased academic
performance. For e-learning and m-learning processes to improve and become more
efficient for better students learning outcomes, it is recommended that HE institutions
focus on how the technology involved needs to be, not only adequate, but indeed
effective to help facilitate the said processes.
To this end, (Aixia and Wang 2011) presented a survey of an e-learning environment
which they had carried out using the integrated E-learning process. This was the
outcome of a survey that they had conducted to investigate and gauge the critical
factors surrounding the e-learning environments that had affected student satisfaction
or their unhappiness with it, and also their attitudes and that of the universities
implementing them. We shall endeavour to dissect the findings below.

Chapter 4
48
Others, such as (Sun, Ray et al. 2008), developed models that included six
dimensions: the main participants, the learners and the instructors, the courses offered,
the technology involved, the design proposed and finally the environment hosting the
event. They succeeded in deriving an integrated model after they had investigated
which critical factors affected learners‟ satisfaction with this new type of learning.
The results revealed many variables and factors were in play: learners' anxiety about
using computers, instructors' behaviour comportment regarding this way of learning
in general, its quality, flexibility, usefulness and how it's easy to use by both parties
and finally assessment methods and diversity.
Recently, the Jordanian scholar Al-Shboul carried out a study to explore to what
extent e-Learning has been integrated within the University of Jordan (UJ). He
investigated the variables which could impact on user attitudes relating to e-learning
introduction in the teaching process, in order to gauge what factors, if any, that could
affect e-Learning tools used at the institution (users and non-users) (Al-Shboul 2013).
A year or so earlier, one of his colleagues (Alwraikat 2012) also examined the corpus
of literature surrounding the issue of e-learning and its adoption by universities and
other HE institutions in various parts of the world. He concluded that most of the
qualitative and quantitative studies that had investigated the factors involved, such as
the academic achievement of students, specialization, attitudes of end users, the
learner perception, processes adopted, skills used, evaluation and assessment, have
indeed indicated that e-learning as an effective mode of learning was accepted. As a
result, he conducted a study to examine graduate students' attitudes at the Educational
Sciences faculty of Educational Sciences.
As gender was found to play a key role in understanding the differences in perception
about the usefulness of technology and its ease of use, with regard to attitudes and
perceptions about e-learning, scholars like (Suri and Sharma 2013) state that gender
has a significant simultaneous impact on both attitude towards computer technology
and e-learning. They found that the impact of gender touches even the basic e-
learning forms of e-learning, such as uploading/downloading, course content,
interactive videos and pod casting.
Other scholars have looked at various other variables that could impact on e-learning.
Among these, (Agboola 2013) conducted a comprehensive study on the topic and
Chapter 4
49
investigated the socio-demographic variables which may affect take-up and
acceptance of e-learning in the International Islamic University of Malaysia (IIUM)
by its academic staff. The findings will be discussed in due course.
The results obtained from previous studies indicate that learners' perceptions do have
a substantial impact on how to make the e-learning system more efficient.
Accordingly, the present study investigates undergraduate students' perceptions about
applying e-learning at Taif University, taking into consideration the effect of the use
of e-learning on both gender and academic specialization. It reflects the aspiration of
how the Saudi educational establishment are trying to nudge ahead to emulate western
countries and adopt new contemporary technologies in the educational sphere, albeit
at HE level. However, before this can be achieved, Saudi education officials need to
have an a thorough understanding of user (learners, instructors and support staff)
attitudes and behaviours in the face of the introduction of this new form of learning
and potentially transforming the educational social environment. Hence this study
seeks and needs to answer the following questions to be able to make a significant
contribution in nudging the country towards a VLE environment. Taking Taif
University as the first sample in the move towards the new revolution in HE, we
propose to look for solutions that would encourage this new form of learning not only
in the Kingdom, but also in the Arab world who tends to lag well behind its western
counterpart.
1. How do undergraduate students perceive the application of e-learning?
2. Does gender significantly affect user perceptions regarding this mode of
learning?
3. Does academic specialization (Scientific, Humanities and Health sciences)
have any impact, significant or otherwise on how undergraduates view and
perceive e-learning?
4.2. Research Methodology
The study target population were first year undergraduates. They had neither used
computers and laptops for learning purposes, nor have they experienced e-learning
elsewhere. They were anticipating applying e-leaning to complement face-to-face

Chapter 4
50
learning. The target population also included the academic staff who had experience
in using LMS. The study was conducted at Taif University as the environment under
consideration. A number of students was chosen randomly as the sample for this
study, as any group from the cohort would have been suitable at the university of Taif.
4.3. Data collection instruments
Both qualitative and quantitative methods were used. The instruments were developed
according to the objectives of the study. The questionnaire consisted of two parts. Part
1 was designed to identify respondents' demographics. It contained demographic
questions, such as their academic year, gender and subject of study.
Reliability Test:
In this stage, pilot testing is a very important phase, it helps the researcher in making
the necessary modification before full-scale adoption (Lanphear, 2001) and helps in
specifying fields that need attention (Schwarz and Sudman, 1995). It also allows for
identifying the reliability of the instrument and the question wording and whether the
instrument includes any mistakes or mysterious items. In a pilot study, the
questionnaire is tested using a sample from the targeted population and also using the
same procedures that will be used in the main study. The researcher distributed
questionnaires to a sample of twenty-five students, and used an internal consistency
measure (Cronbach Alpha, Table 4.1, below). The reliability of the scale was:
Attitude (0.897), Perceived usefulness (0.865), Behavioural intention (0.878), E-
learning self-efficacy (0.864), Interactive learning activities (0.867), and Confidence
in using technology (0.863). All scales and subscales were greater than 0.7, which,
according to (George and Mallery 2003), is considered “acceptable” for exploratory
research. (Nunnaly 1978) suggested that 0.7 be an acceptable reliability coefficient.
4.1: Alpha Coefficients for Constructs with Items
Construct Number of Items Cronbach Alpha
Attitude 4 .897

Chapter 4
51
e-learning self-efficacy 3 .865
Perceived usefulness 5 .878
Behavioral intention 3 .864
Interactive learning activities 2 .867
Confidence in using technology 3 .863
Questions were selected to explore and assess both positive and negative students‟
perceptions about e-learning. The items and constructs were an adaptation of others‟
work in the literature (Park 2009; Hammoud 2010; Worrall 2011). Items were
developed for the study that included twenty-two questions in two parts, which could
be classified into six dimensions, namely: Attitude, perception regarding usefulness,
intentional behaviour, self-efficacy, learning activities and confidence in using
technology for e-learning. To measure students' responses to the above six
dimensions, a 5-point Likert scale was used. (see Appendix 1). Twenty statements
needed to be responded to by the sample. In addition, two open-ended questions, the
aim was to collect information regarding the following:
What are the problems encountered by students with e-learning?
What do students think of the administrators' management of the courses?
Hence, the researcher interviewed five lecturers. (see Appendix 2 for the full
interview questions). The interviews were structured and yet with open-ended
questions. Here the interviewers' skills are called upon to guide the interviewer to
obtain the information sought. The focus is on gathering honest, clear and concise
information on the experiences, if any, of lecturers regarding e-learning, namely:
What do they generally and honestly think about e-learning?
What effects, if any, does this type of learning have on the learning process on one
hand and their and their students' performances on the other?
4.4. Participants
The participants consisted of undergraduate students who were required to participate
in a specific number of subject hours in year one as part of the credits towards their
degree.

Chapter 4
52
The study was conducted to understand learners‟ attitudes regarding VLEs. These
were undergraduates of both genders in three main major subjects. Respondents' ages
ranged between 18 and 22. The questionnaire was distributed randomly to 180
university students. Participants who were guaranteed confidentiality, were asked to
complete a questionnaire on their demographics. A total of 180 students answered the
questionnaire after being informed on the purpose of the work undertaken and given
instruction on how to complete it. Eight students (8) were found to have missed a few
responses. Hence, only 172 students responded fully. These were a cohort taking three
subject areas, namely: Scientific majors N= 65, Humanities majors N= 55, Health
sciences majors N=52 and both genders: Male N= 79 (45.9%), Female N=93 (54.1%).
In addition, five lecturers were interviewed regarding the use of e-learning and the
courses they taught using this mode of teaching.
4.5. Procedure
Halfway through 2012, the researcher undertook to interview five lecturers regarding
e-learning and the courses delivered. These interviews have been carried out online
via Skype. The questionnaires were distributed to participants during class time and
the data were gathered on paper. They were distributed randomly.
4.6. Data analysing
The Likert scale was used for the questionnaires complemented by a Thematic
analysis for the interviews (Braun and Clarke 2006). Descriptive statistics for all
statements were computed to obtain the means and standard deviations for all
responses according to major and gender. The data were analysed using SPSS
software functions and tools. The Wilcoxon Test to gauge students' attitudes
regarding gender to compare and look for any significant differences
Students' perceptions regarding e-learning in three academic specializations were
monitored to gauge if any differences that might occur. An ANOVA test was carried
out on the findings. A post-hoc test was conducted with the aim of determining where
the differences were between the three academic specializations.

Chapter 4
53
Linear regression was used to predict changes in students' perception of the e-learning
environment. Multiple regression analysis was selected to test the linear relationship
between students' gender and major, which were taken as independent variables,
while the six constructs were taken as dependent variables.
The five lecturers' interviews were recorded with the permission of the interviewees,
and a Thematic analysis of the data obtained was made for comparison with data and
results obtained from the questionnaires.
4.7. Findings
4.7.1. Academic instructor behaviour
The academic staffs concerned were from various majors; all of them had previous
experience in using e-learning. The learners were first year of undergraduate students.
The instructors did not try to use the LMS tools to design special course materials but
used it as delivery tool only. They had various and different between opinions and
attitudes towards the use of e-learning and the advantages and disadvantages of LMSs
and their effects on the learning process.
One instructor showed a negative attitude towards the use of e-learning. He found the
experience a little daunting as he could not get to grasp with the whole atmosphere
saying: “I don’t like using e-learning ... it is more complex for what I need. For me
face-to-face learning is preferable as feedback from students is prompt and can be
heard”. The others believed otherwise. They were well impressed by the flexibility of
this teaching tool and the multi-tasking it enables. They stated that “using e-learning
was useful, not only to learning and teaching, but also for better communication
between them and their learners, especially those students who are shy in traditional
face-to-face classroom settings”. The lack of training and experience has made the
first instructor a little weary of the LMS because he was treading on new unfamiliar
grounds. The other instructors had previous experience of e-learning and for this reason,
they did appreciate the new system and felt it completely met all their requirements.
All academic staff agreed that introducing an e-learning system in learning and
teaching would in doubt - if correctly used - have a beneficial impact on both students'

Chapter 4
54
performances and teaching in general. One of them said: ''using LMSs in learning and
teaching would surely bring enormous benefits to both students and institutions and
especially for females because of the gender segregation in place in the kingdom.''
His opinion is a direct result of this long standing gender segregation in the Saudi
educational system.
4.7.2. Questionnaire results
172 students took part in the questionnaires on students‟ perceptions regarding the
introduction of e-learning into teaching and learning. A five-point Likert scale from 1
(strongly disagree) to 5 (strongly agree) was used for statistical purposes. The
outcome indicated that in general, students have shown a positive response to e-
learning.
Table 4.2 below illustrates a comparison of the means‟ across gender (male and
females). To the 20 questions, the average for both genders was above three out of
five (Neutral). The means were somewhat similar, which is a good indicator of the
students‟ understanding about gender in relation to e-learning needs, taking into
consideration the difference in constructs and the variety of the questions in each
construct. The students of both genders were at the early stage of experience, but,
even so, the desire for e-learning led them to almost similar responses.
The results show the means based on gender. The means ranged for males between
3.46 to 4.14, while the means for each construct were between 3.85 to 3.97.The means
for females ranged from 3.45 to 4.32, and the means for each construct were between
3.82 and 4.13, which indicates a positive perception about using the E-learning
environment for both genders.
4.2:The comparison of mean's across gender
statements Male's
mean
Female's
mean
I do not believe that using e-learning requires technical ability. 4.03 4.17
I do not believe that using e-learning will help me to obtain good grades. 3.95 4.03
E-learning will help me to achieve the learning outcomes required for my studies. 3.77 3.83

Chapter 4
55
Using e-learning in my studies will help me to learn the subject thoroughly. 3.84 3.77
I would not feel confident using e-leaning. 4.11 4.17
I would feel confident using online learning content. 3.46 3.45
I have the necessary skills for using an e-learning system. 3.97 3.83
I do not believe e-learning content is informative. 3.96 4.06
E-learning would not increase my academic productivity. 4.14 4.26
E-learning would not make it easier to study course content. 4.08 4.20
The e-learning in my course will in the future help me to get a better job. 3.75 3.89
E-learning will improve my learning performance. 3.84 4.01
I am going to use e-learning content to assist my learning. 3.84 3.88
I am not going to use e-learning as an autonomous learning tool. 4.10 4.32
I am not going to be a heavy user of an e-learning system. 3.97 4.11
I would like to share my knowledge through e-learning tools. 3.80 3.78
I do not believe e-learning can assist teacher-learner interaction. 4.09 4.18
Using e-learning in my course will not increase my confidence in using computers and
technology. 4.10 4.25
I feel the information technologies used in e-Learning have many useful functions 3.73 4.03
Having e-learning to support face-to-face lectures will improve the quality of the learning 3.73 4.12
*Male N= 79 Female N=93
To gauge if there were any significant differences, Wilcoxon Test was applied, as
illustrated in Table 4.3, below. The statements on gender represented males and
females. The difference was statistically significant, as Z= 3.083, p<0.01,which
means that the results found positively significant differences in mean scores between
males and females, favouring males with regard to their level of confidence in using
technology, as shown in Table 4.12 at the end of the chapter.
4.3:The comparison of mean's between males and females using the Wilcoxon
Test
N Mean
Rank
Sum of
Ranks
female -
male
Negative
Ranks 4
a 5.63 22.50
Positive Ranks 16b 11.72 187.50
Ties 0c
Total 20
a. female < male
b. female > male
c. female = male
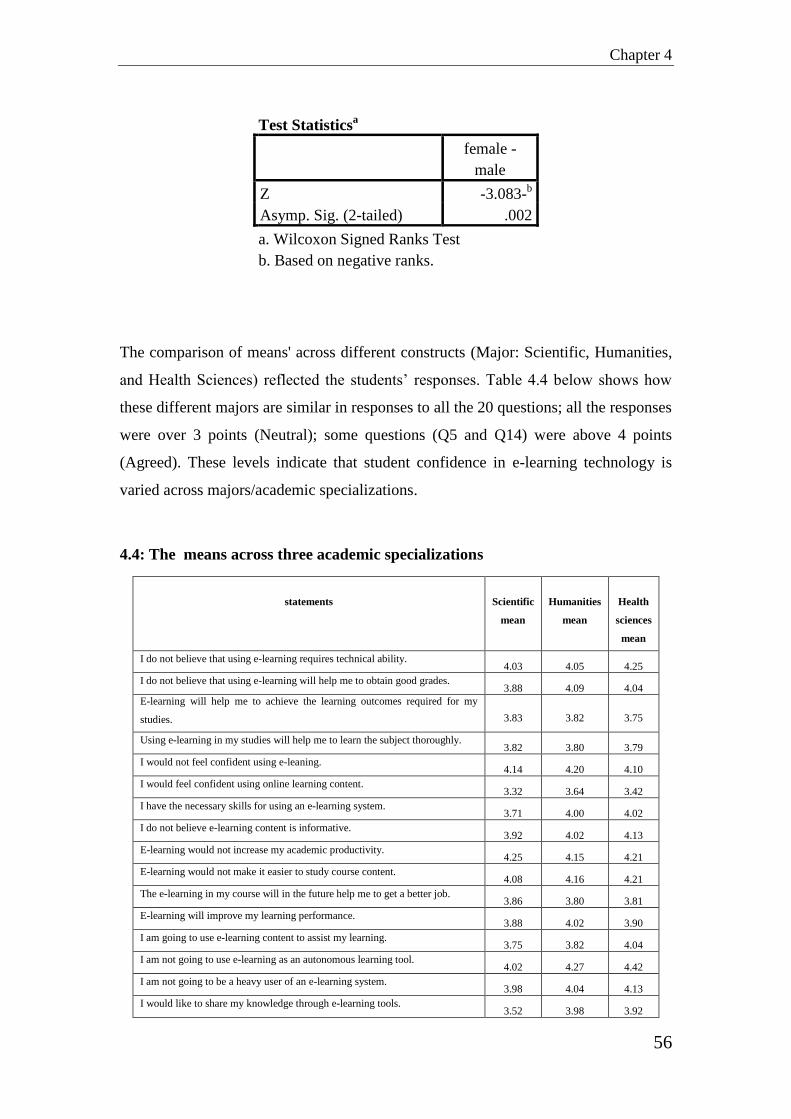
Chapter 4
56
Test Statisticsa
female -
male
Z -3.083-b
Asymp. Sig. (2-tailed) .002
a. Wilcoxon Signed Ranks Test
b. Based on negative ranks.
The comparison of means' across different constructs (Major: Scientific, Humanities,
and Health Sciences) reflected the students‟ responses. Table 4.4 below shows how
these different majors are similar in responses to all the 20 questions; all the responses
were over 3 points (Neutral); some questions (Q5 and Q14) were above 4 points
(Agreed). These levels indicate that student confidence in e-learning technology is
varied across majors/academic specializations.
4.4: The means across three academic specializations
statements
Scientific
mean
Humanities
mean
Health
sciences
mean
I do not believe that using e-learning requires technical ability. 4.03 4.05 4.25
I do not believe that using e-learning will help me to obtain good grades. 3.88 4.09 4.04
E-learning will help me to achieve the learning outcomes required for my
studies. 3.83 3.82 3.75
Using e-learning in my studies will help me to learn the subject thoroughly. 3.82 3.80 3.79
I would not feel confident using e-leaning. 4.14 4.20 4.10
I would feel confident using online learning content. 3.32 3.64 3.42
I have the necessary skills for using an e-learning system. 3.71 4.00 4.02
I do not believe e-learning content is informative. 3.92 4.02 4.13
E-learning would not increase my academic productivity. 4.25 4.15 4.21
E-learning would not make it easier to study course content. 4.08 4.16 4.21
The e-learning in my course will in the future help me to get a better job. 3.86 3.80 3.81
E-learning will improve my learning performance. 3.88 4.02 3.90
I am going to use e-learning content to assist my learning. 3.75 3.82 4.04
I am not going to use e-learning as an autonomous learning tool. 4.02 4.27 4.42
I am not going to be a heavy user of an e-learning system. 3.98 4.04 4.13
I would like to share my knowledge through e-learning tools. 3.52 3.98 3.92

Chapter 4
57
I do not believe e-learning can assist teacher-learner interaction. 4.09 4.02 4.33
Using e-learning in my course will not increase my Confidence in using
computers and technology. 4.15 4.13 4.27
I feel the information technologies used in e-Learning have many useful
functions 3.83 3.93 3.94
Having e-learning to support face-to-face lectures will improve the quality of
the learning. 3.83 3.82 4.21
*Scientific major N= 65, Humanities major N= 55, Health sciences major N=52
After using ANOVA analysis, the results in Table 4.5 below show that there are no
significant differences in scores across academic specializations (Scientific,
Humanities and Health Sciences), and the twenty statements have statistically
significant differences in mean scores at p<0.05, except for Q14 (F [5.842] = 0.004,
p<0.01), and Q16 (F [3.319] = 0.039, p<0.05).
4.5: Comparisons across three academic specialization
Sum of Squares df Mean Square F Sig.
Q1
Between Groups 1.591 2 .796 1.962 .144
Within Groups 68.525 169 .405
Q2
Between Groups 1.510 2 .755 1.606 .204 Within Groups 79.484 169 .470
Q3
Between Groups .209 2 .104 .093 .911 Within Groups 189.070 169 1.119
Q4
Between Groups .021 2 .011 .010 .990 Within Groups 179.258 169 1.061
Q5
Between Groups .293 2 .147 .313 .731 Within Groups 79.073 169 .468
Q6 Between Groups 2.993 2 1.496 1.121 .328 Within Groups 225.635 169 1.335
Q7 Between Groups 3.689 2 1.845 1.829 .164 Within Groups 170.427 169 1.008
Q8
Between Groups 1.293 2 .646 1.525 .221 Within Groups 71.655 169 .424
Q9
Between Groups .307 2 .153 .290 .749 Within Groups 89.571 169 .530
Q10
Between Groups .551 2 .275 .639 .529 Within Groups 72.816 169 .431
Q11
Between Groups .137 2 .068 .063 .939 Within Groups 184.631 169 1.092
Q12
Between Groups .646 2 .323 .363 .696 Within Groups 150.516 169 .891
Q13 Between Groups 2.485 2 1.242 1.153 .318 Within Groups 182.166 169 1.078
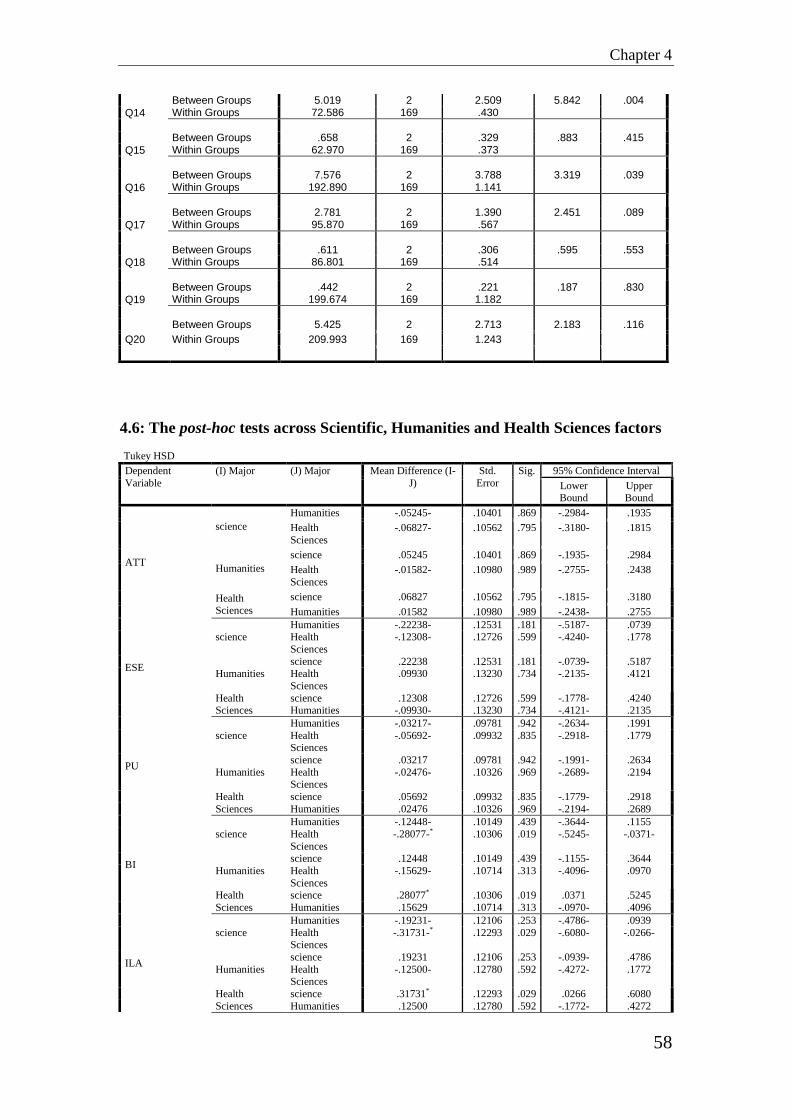
Chapter 4
58
Q14
Between Groups 5.019 2 2.509 5.842 .004 Within Groups 72.586 169 .430
Q15
Between Groups .658 2 .329 .883 .415 Within Groups 62.970 169 .373
Q16
Between Groups 7.576 2 3.788 3.319 .039 Within Groups 192.890 169 1.141
Q17
Between Groups 2.781 2 1.390 2.451 .089 Within Groups 95.870 169 .567
Q18 Between Groups .611 2 .306 .595 .553 Within Groups 86.801 169 .514
Q19 Between Groups .442 2 .221 .187 .830 Within Groups 199.674 169 1.182
Q20
Between Groups 5.425 2 2.713 2.183 .116
Within Groups 209.993 169 1.243
4.6: The post-hoc tests across Scientific, Humanities and Health Sciences factors
Tukey HSD
Dependent
Variable
(I) Major (J) Major Mean Difference (I-
J)
Std.
Error
Sig. 95% Confidence Interval
Lower Bound
Upper Bound
ATT
science
Humanities -.05245- .10401 .869 -.2984- .1935
Health
Sciences
-.06827- .10562 .795 -.3180- .1815
Humanities
science .05245 .10401 .869 -.1935- .2984
Health
Sciences
-.01582- .10980 .989 -.2755- .2438
Health Sciences
science .06827 .10562 .795 -.1815- .3180
Humanities .01582 .10980 .989 -.2438- .2755
ESE
science Humanities -.22238- .12531 .181 -.5187- .0739 Health
Sciences
-.12308- .12726 .599 -.4240- .1778
Humanities science .22238 .12531 .181 -.0739- .5187 Health
Sciences
.09930 .13230 .734 -.2135- .4121
Health Sciences
science .12308 .12726 .599 -.1778- .4240 Humanities -.09930- .13230 .734 -.4121- .2135
PU
science
Humanities -.03217- .09781 .942 -.2634- .1991
Health Sciences
-.05692- .09932 .835 -.2918- .1779
Humanities
science .03217 .09781 .942 -.1991- .2634
Health Sciences
-.02476- .10326 .969 -.2689- .2194
Health
Sciences
science .05692 .09932 .835 -.1779- .2918
Humanities .02476 .10326 .969 -.2194- .2689
BI
science
Humanities -.12448- .10149 .439 -.3644- .1155
Health
Sciences
-.28077-* .10306 .019 -.5245- -.0371-
Humanities
science .12448 .10149 .439 -.1155- .3644
Health
Sciences
-.15629- .10714 .313 -.4096- .0970
Health
Sciences
science .28077* .10306 .019 .0371 .5245
Humanities .15629 .10714 .313 -.0970- .4096
ILA
science
Humanities -.19231- .12106 .253 -.4786- .0939
Health Sciences
-.31731-* .12293 .029 -.6080- -.0266-
Humanities
science .19231 .12106 .253 -.0939- .4786
Health Sciences
-.12500- .12780 .592 -.4272- .1772
Health
Sciences
science .31731* .12293 .029 .0266 .6080
Humanities .12500 .12780 .592 -.1772- .4272

Chapter 4
59
CUIT
science
Humanities -.01911- .13781 .989 -.3450- .3067
Health
Sciences
-.20256- .13995 .319 -.5335- .1283
Humanities
science .01911 .13781 .989 -.3067- .3450
Health Sciences
-.18345- .14549 .419 -.5275- .1606
Health
Sciences
science .20256 .13995 .319 -.1283- .5335
Humanities .18345 .14549 .419 -.1606- .5275
*. The mean difference is significant at the 0.05 level.
The post–hoc test Table 4.6 showed there were not any noticeable differences in
Attitude, Perceived usefulness, E-learning self-efficacy and Confidence in using
technology across the three academic specializations (Scientific, Humanities and
Health Sciences) (p>0.05). However, the test results indicated varied differences in
Behavioural intention and Interactive learning activities between only Scientific
subject and Health sciences (p<0.05), while there are no significant differences
between Sciences and Humanities, and neither between Health sciences and
Humanities (p>0.05).
One can notice that the majority of students did not answer the open-ended questions,
and a few of them just gave silly answers. Therefore, all these answers were excluded.
The linear multiple regression analyses of the relationships between the six variables
were: Attitude (ATT), Perceived usefulness (PU), Behavioural intention (BI), E-
learning self-efficacy (ESE), Interactive learning activities (ILA) and Confidence in
using technology (CIUT);they were based on students' gender and students' major.
The results were as follow:
4.7: Regression across students' gender, major and ATT
Model R R
Square
Adjusted R
Square
Std. Error of the
Estimate
Change Statistics
R Square
Change
F
Change df1 df2
Sig. F
Change
1 .069a .005 -.007- .56712 .005 .409 2 169 .665
a. Predictors: (Constant), Gender, Major
Model Unstandardized Coefficients Standardized Coefficients
t Sig. B Std. Error Beta
(Constant) 3.779 .170 22.231 .000
Major .033 .053 .049 .634 .527
Gender .054 .087 .047 .618 .537
a. Dependent Variable: ATT

Chapter 4
60
A regression analysis was conducted taking Attitude (ATT) as dependent variable,
and students' gender and major as independent variables. (see Table 4.7). As can be
observed, the coefficient of regression (R2) is 0.005; this means that students' gender
and major have no statistically significant effect on Attitude (ATT) (p>0.05).
4.8: Regression across students' gender, major and ESE
Model R R
Square
Adjusted R
Square
Std. Error of the
Estimate
Change Statistics
R Square
Change
F
Change df1 df2
Sig. F
Change
1 .085a .007 -.005- .68791 .007 .613 2 169 .543
a. Predictors: (Constant), Gender, Major
Model Unstandardized Coefficients Standardized Coefficients
t Sig. B Std. Error Beta
(Constant) 3.755 .206 18.212 .000
Major .068 .064 .082 1.067 .287
Gender -.036- .105 -.026- -.339- .735
a. Dependent Variable: ESE
Table 4.8 shows that there is no statistically significant influence between E-learning
self-efficacy (ESE) as the dependent variable and students‟ gender with major as the
independent variable. The coefficient of the regression (R2) is 0.007; this means that
students' gender and major have a statistically significant effect on E-learning self-
efficacy (ESE) (p> 0.05).
4.9:Regression across students' gender, major and PU
Model R R
Square
Adjusted R
Square
Std. Error of the
Estimate
Change Statistics
R Square
Change
F
Change df1 df2
Sig. F
Change
1 .132a .017 .006 .52969 .017 1.500 2 169 .226
a. Predictors: (Constant), Gender, Major
Model Unstandardized Coefficients Standardized Coefficients
t Sig. B Std. Error Beta
(Constant) 3.772 .159 23.760 .000
Major .025 .049 .039 .511 .610
Gender .132 .081 .125 1.631 .105
a. Dependent Variable: PU
As shown in Table 4.9, perceived usefulness (PU) is the dependent variable and
students' gender and major is the independent variable. The coefficient of regression
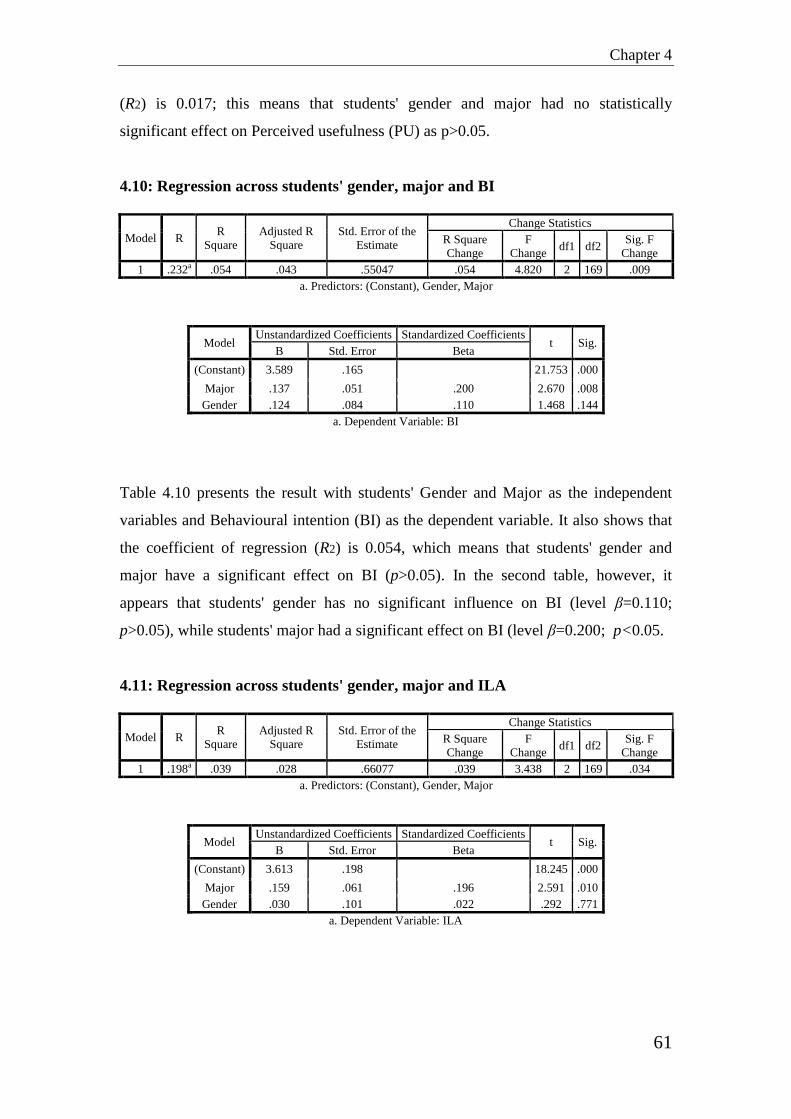
Chapter 4
61
(R2) is 0.017; this means that students' gender and major had no statistically
significant effect on Perceived usefulness (PU) as p>0.05.
4.10: Regression across students' gender, major and BI
Model R R
Square
Adjusted R
Square
Std. Error of the
Estimate
Change Statistics
R Square
Change
F
Change df1 df2
Sig. F
Change
1 .232a .054 .043 .55047 .054 4.820 2 169 .009
a. Predictors: (Constant), Gender, Major
Model Unstandardized Coefficients Standardized Coefficients
t Sig. B Std. Error Beta
(Constant) 3.589 .165 21.753 .000
Major .137 .051 .200 2.670 .008
Gender .124 .084 .110 1.468 .144
a. Dependent Variable: BI
Table 4.10 presents the result with students' Gender and Major as the independent
variables and Behavioural intention (BI) as the dependent variable. It also shows that
the coefficient of regression (R2) is 0.054, which means that students' gender and
major have a significant effect on BI (p>0.05). In the second table, however, it
appears that students' gender has no significant influence on BI (level β=0.110;
p>0.05), while students' major had a significant effect on BI (level β=0.200; p<0.05.
4.11: Regression across students' gender, major and ILA
Model R R
Square
Adjusted R
Square
Std. Error of the
Estimate
Change Statistics
R Square
Change
F
Change df1 df2
Sig. F
Change
1 .198a .039 .028 .66077 .039 3.438 2 169 .034
a. Predictors: (Constant), Gender, Major
Model Unstandardized Coefficients Standardized Coefficients
t Sig. B Std. Error Beta
(Constant) 3.613 .198 18.245 .000
Major .159 .061 .196 2.591 .010
Gender .030 .101 .022 .292 .771
a. Dependent Variable: ILA

Chapter 4
62
The summary Table 4.11 shows that the coefficient of regression (R2) is 0.039
between students' Gender and Major as independent variables and Interactive learning
activities (ILA) as the dependent variable (p<0.05), which means that students'
Gender and Major have a significant effect on ILA. The second table, however, shows
that students' gender has no significant influence on ILA (level β=0.022; p>0.05),
whereas students' major had a significant effect on BI (level β=0.196; p<0.05).
4.12: Regression across students' gender, major and CUIT
Model R R
Square
Adjusted R
Square
Std. Error of the
Estimate
Change Statistics
R Square
Change
F
Change df1 df2
Sig. F
Change
1 .209a .044 .032 .74091 .044 3.845 2 169 .023
a. Predictors: (Constant), Gender, Major
Model Unstandardized Coefficients Standardized Coefficients
t Sig. B Std. Error Beta
(Constant) 3.415 .222 15.377 .000
Major .091 .069 .100 1.326 .187
Gender .270 .113 .179 2.376 .019
a. Dependent Variable: CUIT
The results in Table 4.12 show students' Gender and Major as independent variables
and Confidence in using technology (CIUT) as the dependent variable. The
coefficient of regression (R2) is .044 (p<0.05), which means that students' Gender and
Major have a significant effect on CIUT. In the second table, the results indicate that
students' major had no significant effect on CIUT (level β=0.100; p>0.05), while
students' gender had a significant influence on CIUT (level β=0.179; p<0.05.
4.8. Discussion
E-learning has certainly become an important and growing trend in the use of e-
learning in Saudi Arabia. It has been shown that students and instructors at Taif
University see this new and innovative mode of learning as a good facilitator of
learning; a technological tool that can surely enhance education in the future,
especially that of female in this uncommon segregated environment. Having focused
Chapter 4
63
on participants (students & instructors) perceptions and attitudes, this study has shown
a favourable response to e-learning overall at the said university. This result is
congruent with the findings of (Jafar, Iraj et al. 2008; Al-fahad 2009; Aixia and Wang
2011; Al-Harbi 2011; Alwraikat 2012; Oye, Iahad et al. 2012; Al-Shboul 2013).
These study findings, in calculating students' actual opinions on this new genre of
learning, taking into consideration the two variables of gender and specializations
have indicated that:
1- Learner perceptions of e-learning are very positive overall, for both gender and
academic specializations. The highest mean score was 4.32 for both gender and 4.42
for all subjects. Moreover, the mean statements in females were higher than those for
males. The results can be attributed to students' attitudes towards contemporary
educational technology and their willingness to adopt e-learning systems in their
learning.
It is evident from the data analysis that gender and specialization do impact on how
learners view e-learning. Nevertheless the great majority do believe that this new
mode of learning would engender net benefits for their education.
2- To gauge the linear relationship between the key six constructs and students'
gender and subjects, multiple linear regression was used. The study has found that
statistically there is no significant differences between students' gender and attitude,
e-learning self-efficacy and perceived usefulness at the level of p<0.05; neither is
there any statistically significant influence between students' subject and attitude, e-
learning self-efficacy and perceived usefulness. This may be attributed to the
availability of ICT courses to students and tutors to bridge the gap in their lack of
computer knowledge. Besides, social media has put computer culture right bang in the
middle of every learner's life and has nudged everyone and especially students to
delve into this mode of acquiring knowledge, albeit in primary, secondary or tertiary
education. This result is consistent with what was found in previous studies
(Alwraikat 2012; Agboola 2013; Suri and Sharma 2013), but it is inconsistent with
(Alobiedat and Saraierh 2010).
The results of this study suggest that students' gender had no statistical significant
effect on behavioural intention and interactive learning activities (p<0.05), while
Chapter 4
64
there is a statistically significance effect between students' subjects and behavioural
intention and interactive learning activities. According to this study, there is no
statistical significance influence between students' major and confidence in using
technology (p<0.05), whereas students' gender had a statistically significant effect on
confidence in using technology. This finding corresponds with that of (Agboola
2013).
This study also shows noticeable differences in behavioural intention and interactive
learning activities, in students' sciences and health sciences, whereas there were no
differences in students' of humanities studies.
It is important to mention that one of the academic staff's negative attitude towards
using e-learning may have affected the students' attitude towards adopting e-learning.
This is congruent with the findings of (Sun, Ray et al. 2008), who link instructors'
attitudes with the impact they have on e-learner satisfaction. In similar research,
(Mahdizadeh, Biemans et al. 2008) studied factors influencing teachers and VLEs,
Mahdizadeh et al. noted that teachers' perceptions of e-learning directly influenced
learner attitudes to this mode of learning.(Mahdizadeh, Biemans et al. 2008), teachers'
attitudes and opinions about web-based learning activities are effective in shaping
their attitude towards the e-learning environment.
4.9. Chapter summary
VLEs have increasingly become an integral part of educational life. In recent years
HE institutions have scrambled hurriedly to integrate ICT in the delivery of courses
and the internet has played a major role in the popularity of such mode of education.
This technology, with all its negatives, is a blessing that has made education reach
those places in the world impossible to reach by traditional means. The results
obtained at Taif University have shown that students‟ perceptions about e-learning
were positive. Testing the main constructs and related questions through statistical
analysis raised two aspects:
1- Students‟ responses reflected the willingness of the students in all different
categories to have e-learning established to greater benefit by its application in the

Chapter 4
65
academic environment. Table 4.13 clearly shows the main constructs means and
deviation, taken as an average of the questions‟ sub-sets, where the mean shows how
high are the expectations with student involvement. The standard deviation showed
how these responses were grouped around the mean, as indicators of students‟
enthusiasm for e-learning.
4.13: Mean and standard deviations in the main constructs
2- The above statistical analysis for correlation between the 20 questions and the main
constructs can be observed, as reflected by the sub-sets of the 20 questions. A number
of questions reflected each one of the main constructs, where the constructs illustrated
different aspects of the first year students‟ engagement in academic life.
This chapter has constituted an exploratory study to determine students‟, as well as
academic staff's attitudes towards using e-learning. The study showed that students
have positive attitudes towards using e-learning on their courses. The results also
show that the academic staff's attitudes towards using e-learning affected students'
attitudes. Students had a more positive attitude towards using e-learning, while the
academic staff had a less positive attitude towards it, which means that the academics'
perspective may affect students' actual use of the learning management system.
In this chapter, the researcher has demonstrated that student attitudes regarding the
use of LMSs and indeed ICT in their studies are a significant variable. More variables
need to be explored and for this reason, the next chapter will first explore learner
Descriptive Statistics
constructs Mean Std.
Deviation N
ATT 3.9259 .56515 172
ESE 3.8314 .68635 172
PU 4.0244 .53123 172
BI 4.0426 .56264 172
ILA 3.9651 .67013 172
CUIT 4.0058 .75314 172

Chapter 4
66
satisfaction, behavioural intentions and the effectiveness of the Blackboard LMS, then
look for ways to understand how to increase learner and instructor acceptance of this
new mode of learning and finally how to enhance learning effectiveness.
67
Chapter 5
Students’ perceived satisfaction, behavioral intentions and
effectiveness of the Blackboard system at Taif University
5.1. Introduction
The first study (Chapter 4 of the thesis) has examined undergraduate students'
perceptions towards applying e-learning at Taif University taking into consideration
the effect of e-learning on both gender and academic specialization. Students were
found to show positive attitudes about the use of LMSs in their studies, to be more
positive than academic staff and the attitudes of the latter have an effect on those of
the former.
Learner satisfaction is linked to their performance and is an important element for the
investigation of a successful learning management system (Bolliger and Wasilik
2009). The study reported in this chapter investigate student satisfaction, behavioural
intentions and the effectiveness of the Blackboard system, as well as the relationship
between the students' use of Blackboard, their performance and students' attitudes
towards it.
(Frederickson, Reed et al. 2005) noted the importance of evaluating distance
education innovations, in terms of both learner outcomes and learner satisfaction.
They argued for the need for well-designed and carefully controlled studies that

Chapter 5
68
Investigate them. In particular, they emphasized that evaluation should be an integral
part of the online course implementation stage, rather than an add-on at the end.
Technology when correctly used can enhance and transform teaching (Salter 2003).
There is a wide variety of ways to measure the effectiveness of web-based courses.
Scholars the likes of (Wells 2000) have explored the effects of mediated
communication courses, and investigated variables such as prior computer
knowledge, internet experience and learning styles on students' e-learning attitudes.
In examining students' satisfaction with the LMS (Blackboard), (Telia 2012) paid
special attention to the factors that could play a part and predict their levels of
satisfaction. He concluded that all the variables and factors in terms of net benefits,
system content and quality and learning and delivery issues all seem to correlate with
student satisfaction. This study has shown that these factors, when taken jointly, do
predict 54% of the variations in student satisfaction. The consequence is that, were
universities and other HE institutions to offer e-learning using LMS systems, they
must work tirelessly to deliver the most comprehensive service and support to their
users after their implementation.
To investigate the effectiveness of multimedia courseware and whether it enhances
learning or not, scholars the likes of (Chang, Chen et al. 2011) have used Augmented
Reality (AR) technology to implement an AR-learning system for English vocabulary
learning. They concluded that it does indeed enhance learning, as many other studies
have indicated, but there were various and important issues that are susceptible to
hinder or cause negative effects. By investigating learners‟ satisfaction and
behavioural intention, as well as how effective AR-learning systems were or can be,
they showed that system quality was one of the most critical factors that affect, not
only users‟ perceived satisfaction, but also their perceived usefulness of the system
and AR-learning effectiveness. They also found that perceived self-efficacy, along
with multimedia instruction, played a significant part in perceived satisfaction and
perceived usefulness and AR usefulness, which can be verified.
In an attempt to explore the gender differences influencing E-Learning, Jung (2012)
found a relationship between gender differences in the perceptions of dimensional
impact on the quality of E-Learning. The researcher indicated that females had

Chapter 5
69
perceived all quality domains and dimensions as being more important in evaluating
the quality of E-Learning than males. Keller et al. (2007) also found gender to
influence acceptance and in line with Jung‟s study (2012), females experienced a
higher degree of performance expectancy than males did. Gonzalez-Gomez et al.
(2011) found significant differences in E-Learning satisfaction between male and
female students. The researchers indicated that female students achieve higher scores
in E-Learning courses than male students. Moreover, female students assign more
importance to teaching methods and planning than male students.
For (Sun, Ray et al. 2008) the following six variables: learners, instructors, courses,
technology, design and environment sufficed to develop an integrated model. They
needed to conduct a survey to investigate what factors may affect learners‟
satisfaction. Their work put forward some solutions that may help HE institutions in
the integration of VLE technology, on how to overcome obstacles, and by the same
token, reduce risks of failure during implementation. Their findings revealed that
learners' perceived satisfaction with e-learning was affected by the following critical
factors: Course quality and flexibility, Usefulness and easy use of the LMS and the
technology involved, the variety and diversity of assessments, and above all, learner
ICT anxiety.
Other scholars like (Liaw and Huang 2013) turned their attention to learner self-
regulation in e-learning environments, to try and understand learner attitudes towards
the whole process of e-learning. Their findings show that the following factors:
interactive learning environments, users‟ perceived satisfaction and ICT system
perceived usefulness were all key variables necessary to predict perceived self-
regulation in e-learning environments. They concluded that perceived usefulness can
be impacted by interactive learning environments, perceived self-efficacy and
perceived satisfaction, and the latter is closely linked to the perceived anxiety of
users.
If one takes the issue from a user's perspective, there is no doubt that all the above
cited factors are critical variables that play influential roles in the success of LMS in
blended learning environments. Another scholar (Al-Busaidi 2012) conducted an
examination of how the above factors impacted learners‟ continuous intention to use
LMS in blended learning. He found that, for the adoption of LMS, these factors are

Chapter 5
70
closely related to various characteristics, such as instructor and learner characteristics,
attitudes of both participants, their ICT use anxieties, their technological experiences,
their motivation and responsiveness to, control of and, more importantly, to the
quality and flexibility of LMSs themselves, and the efficiency of their delivery and
subsequent user training and support. The study was based on 512 learners, and the
results were congruent with the findings of other researchers in the field. However, in
this particular study, it was clear that learner self-efficacy, instructor online
responsiveness and management support were more than a hindrance, and this was
perhaps was due to the lack of ICT literacy in general on both sides and the attitudes
of teachers being entrenched in the past. In other words, it was difficult for some
instructors to come to terms with this new mode of teaching, having spent the best
part of their professional lives in the traditional face-to-face learning environments.
The introduction of internet use in the traditional face-to-face educational field in
general and in distance learning or e-learning in particular has aroused the curiosity
and the interest, not only of education organization officials, but also many a scholar
and researcher around the world. (Sandersa and Morrison 2011) undertook the task of
looking at the introduction of a web component into the delivery of courses and its
effect or effects on student attitudes. For this, they decided to examine the delivery of
a general biology course in e-learning mode to midsize rural university non-major
undergraduates. They discovered that the web component, in allowing asynchronous
learning outside the classroom, was favoured by many students for varied reasons: it
hugely increased student-to-student interaction in class and over the web. By setting
essays, short questionnaires and MCQs (multiple choice questions) and engaging in
class discussion, they managed to assess and measure the effects of the introduction of
this web-enhancement tool. The results were startling and unexpected to say the least,
and quite contrary to what was generally thought and accepted. In this instance, the
attitudes of female students on the course towards web-based learning were found to
be significantly more positive than those of their male counterparts. What is more
significant is that they discovered that female students were found to use the internet
more often than their male colleagues. The course was designed to allow students to
use the web to solve quizzes, use the bulletin board, download lessons and do
problem-solving questions, respond to lecturer queries and access their marks and
grades. All of these facilities allowed for asynchronous learning.
Chapter 5
71
Looking into the topic, (Al-Hadrami 2014) investigated the factors and variables that
could have a significant impact on e-learning. In examining a host of factors closely
associated with the learner, such as the demographic, physical, behavioural, financial
and emotional factors, and an array of variables associated with the technical side of
e-learning, he drew the following conclusions: age was very influential on motivation
and there were significant gender differences in student perceptions of interaction
with instructors. Computer ownership also showed significant differences regarding
student participation and performance.
Other researchers (Erdogan, Bayram et al. 2011) decided to investigate the factors
that affect learner achievements and attitudes to VLEs education. The participants
consisted of a cohort of 127 male and female students enrolled on an e-MBA at Bilgi
University. The findings of this study revealed that web-based education does indeed
have a positive effect on improvement in academic results. As for the effect of web-
based education on attitudes towards e-learning, the study indicated that using the
internet had impacted on learners‟ motivation and indeed increased their interest in
attending lessons.
As technologies have developed and become, not only more readily available and
easily and cheaply accessible, but also very practical, extremely useful and, more
importantly, far reaching and even life-changing for those who cannot afford the
exponentially increasing cost of traditional face-to-face education. We believe that it
is imperative, and of huge and significant interest, even if it is from only an academic
perspective, to try and determine whether this availability and increased use of online
teaching resources have enhanced students‟ academic performances, and, by the same
token, improved learning outcomes.
In dissecting and analyzing the findings of a survey conducted on a cohort of first-
year accounting students to gauge the level of their engagement with and commitment
to the use of online learning resources, the scholar (Wong 2013) indicated that,
despite the availability of three new online options easily accessible to them via
WebCT, the majority of students have not only expressed, but have shown strong
support for the traditional face-to-face delivery approach as the more effective
learning option. Furthermore the results also revealed a close and extremely positive

Chapter 5
72
relationship between students‟ academic results and the level of their engagement
with online resources.
Similar work was carried out by (Daniel Strickera, Weibela et al. 2011). These
scholars took the steps to explore the topic. They looked at a psychology
undergraduate course where a virtual learning environment (VLE) was blended with
traditional face-to-face lectures. Demographic data, attitudes towards the subject,
motivation, computer literacy, quality and availability of the e-learning resources and
learning efforts were gauged by means of participants‟ self-reporting. To this they
added grades obtained in the final exam as a learning outcome. Their objective was to
determine differences in the impact on performance between the cohort of VLE users
and its non-user counterpart. The mean performance in the VLE was taken as a
predictor for success in the final exam. The results have shown that „heavy‟ VLE
users performed better than non-users in the final exam. After careful analysis of the
findings, they concluded that the best predictor for grades in the final examination
was how often the VLE was used.
Another scholar (Hammoud 2010) looked at the issue from a different angle. This
time the relationship between learner attitudes to WebCT and that of their instructors
and the relationship between their use of WebCT and their eventual performance were
investigated. The study indicated that learners have shown a positive attitude to using
WebCT and their instructors' attitudes to it have had huge and positive effects on
learner attitudes. The more positive the leaders‟ attitudes were the more positive and
enthusiastic the students were in using the platform. In turn, this enthusiasm was
found to impact positively on students‟ achievements. However, there no indication
that or compelling evidence to confirm or refute that the students performances were
affected by their instructors knowledge and use of WebCT.
Scholars (Mazza and Dimitrova 2004) have shown that data generated by learning
management systems was important, because it can be used to help instructors
become aware of their students' performance in online courses. Monitoring students'
learning is mandatory in order to ensure high quality education. Blackboard log file
data was found to be useful for instructors to quickly and more accurately grasp
information about the social, cognitive and behavioural aspects of students. This
information was provided in the form of tables, which was found to be helpful in
Chapter 5
73
clearly explaining problems with LMS, the log files used being a main source of data
that the study's results were based on.
Taking all the previously cited studies, the current study looks at e-learning platforms
and duly explores learner satisfaction and their behaviour and the effectiveness of the
LMS (Blackboard). Additionally, it undertakes to scrutinize the relationship, if any,
between students' use of e-learning platforms in general and this LMS in particular,
and their performances and attitudes towards both.
Understanding learners‟ attitudes towards e-learning is an important and critical step
in the path to increasing e-learning usage and positively improve its overall effects.
For this reason, the present study endeavours to investigate learners‟ attitudes towards
e-learning in general, to try to understand how to improve user satisfaction, to
understand their behavioural intentions, how to facilitate and increase accessibility
and how to enhance e-learning effectiveness. The LMS (Blackboard) adopted by Taif
University as an e-learning platform and the cohort of students using it will be the
subject of this investigation.
Following in the footsteps of a study carried out by (Liaw and Huang 2007), this
present study looked at the environmental characteristics such as the e-learning
system quality and multimedia instruction. Other characteristics like learner self-
efficacy and perceived satisfaction with Blackboard were also explored. This has
brought the researcher to formulate the following hypotheses:
H1: Satisfaction with the LMS Blackboard system is influenced by the LMS quality,
learning activities and the self-efficacy of learners.
H2: Usefulness of the LMS is influenced by its quality and also to instruction and
learners‟ self-efficacy.
H3: User behaviour is affected by how satisfied one is with the LMS in use; here the
LMS Blackboard
H4: Effectiveness of the Blackboard system is influenced by multimedia instruction,
learning activities and the LMS quality.

Chapter 5
74
5.2. Research Methodology
Similarly to the first study, the participants in this second study were undergraduate
students enrolled on traditional face-to-face courses supported by a learning
management system; in this study the Blackboard LMS. The study was conducted at
the University of Taif in The kingdom Saudi Arabia. The use of Blackboard was
mandatory for both students and academic staff. Considered as the most effective tool
for virtual learning across the world, Blackboard was chosen and adopted as the main
vehicle for student course information (lecture notes, timetables and study guides).
The sample for the study was made up of students taking an English language course.
It was selected in order to examine studies in three different subject areas with both
genders, simultaneously. The participating students, albeit chosen at random, were
split into three groups made up of second year undergraduate students in different
academic specializations.
5.3. Data collection instruments
A combination qualitative and quantitative approach was used to gauge how this LMS
faired in this newly introduced VLE at Taif University. This combined approach was
chosen to allow for the complexity of a web-based learning environment to be
captured and understood in greater detail by mixing methods, rather than using one
single research approach as stated by (Owston 2000).
A questionnaire was designed to measure students' attitudes towards using the
Blackboard system. A 5-pointer Likert scale was used in the design of the
questionnaire (ranging from 1 “strongly disagree” to 5 “strongly agree”). The
questionnaire consisted of two parts: demographics and statements. It was developed
to be valid and reliable after examining survey methods previously used such as in
studies by (Liaw 2008; Chang, Chen et al. 2011).

Chapter 5
75
Reliability Test:
The aim of carrying out the pilot study in this research is to increase confidence that
no essential issues have been missed by predicting the response rate and thus ensuring
the reliability and validity of the measures used to measure the variables of interest,
and to obtain valuable feedback regarding the wording and general appearance of the
questionnaire. The pilot study is performed in the same fashion as that used in the
main study. Thirty copies (30) were distributed to the undergraduates taking part.
They were from three majors (Sciences, Humanities and Health sciences) in a pilot
study at Taif University. Twenty one (21) questionnaires were completed. The study
tested for the reliability of each of the constructs using Cronbach‟s alpha. The data
was analysed using SPSS version 20. The values as shown in Table 5.1. Although the
results were not as high as those obtained in some prior studies, they were are above
0.70 and still in a range deemed acceptable, based on common values recommended
in the contemporary literature by Nunnally & Berstein, 1994 cited in (Moran, Hawkes
et al. 2010; Tagoe 2012). Hence, the results demonstrate that the questionnaire is a
reliable measurement instrument, and can be used in this research.
The students could add any comment or concerns they had regarding using the
Blackboard system as an answer to the open-ended question (Appendix 3). In addition,
the questions aimed at collecting information on the following areas:
The use of the Blackboard system in their courses.
Student-student interaction via the Blackboard system.
Student-information interaction via the Blackboard system.
Student-teacher interaction via the Blackboard system.
5.1: Alpha coefficients for constructs
constructs items Cronbach Alpha
Perceived self-efficacy 3 0.784
Perceived satisfaction 4 0.728
Perceived usefulness 3 0.752

Chapter 5
76
Behavioral intention 3 0.717
e-learning system quality 4 0.763
Interactive learning activities 3 0.728
E-learning effectiveness 3 0.711
Multimedia instruction 3 0.762
The Blackboard tracking system provides detailed information on the number of times
students visit a page using Blackboard and the amount of time they spend exploring it.
It also provides the number of hits or students' communications not only with their
peers, but also with their course leaders. All the data obtained from the tracking
system is gathered and analysed to gauge the actual use of the LMS by students, to
calculate accurately the amount of time spent using it and to find out if that has any
bearing on achievements and what activities enhance learning. The data is meant to
describe how students perform on Blackboard; in other words how many times they had
accessed each page, how much time they had spent, how many times they had used the
communication board, the home page, the content page, the assignment page, and read
or posted, etc. Data from one course term time which covers samples of students of
both genders and course leaders from three academic specializations is collected and
saved each week right through term time. The Log file data is essential to fully
understand student behaviour and performance on web-based courses and to obtain
information about how instructors are or are not using the LMS Blackboard to meet
their students' needs (Mazza and Dimitrova 2004)
Appendix 4 shows the open-ended structured interviews which the researcher has
endeavoured to conduct skilfully in order to obtain the information sought and
required (Hammoud 2010). Such interviews which focus on gathering pertinent
information about specific issues were designed to obtain background information on
the academic staff and their experience of using the LMS Blackboard for the delivery
of the modules to be studied. Moreover, these interviews were also aimed to gather
information about a number of variables:
Instructors' satisfaction and experience of using the Blackboard system after
applying e-learning.

Chapter 5
77
The effects of using Blackboard on the teaching-learning processes and its
influence on learners' behavioral intention
The communication between the learners and the instructors via the
Blackboard communication software.
5.4. Participants
A cohort of Taif University undergraduates took part and used the LMS Blackboard
as a learning tool. Questionnaires were randomly distributed to 135 of them. After
using the system for seven months, participants were asked to complete the
questionnaire that included demographic information covering age, gender and
academic specialization. Eight different constructs were tested (see Table 5.3)
Students in all specializations were to respond after they were guaranteed
confidentiality. All the 135 students filled the questionnaire, but 16 chose to miss
some answers and these were discarded, living of 119 students in three subjects,
namely: Scientific major N= 39, Humanities major N= 39, Health sciences major
N=41 and both genders: Male N= 58 (48.7%), Female N=61 (51.3%). In addition,
three lecturers were interviewed during the course.
5.5. Procedure
The population in the study consists of male and female undergraduate students at the
University of Taif chosen at random. Statistical data showing student use of the
Blackboard system were collected regularly using the on board tracking system. The
statistical data was mainly figures giving information about the number of times each
student has visited web pages of the course and the number of times each student has
read or posted something on the communication board. It also provided information
about how many times each page within a course was visited and how the time the
learner has spent on it. In order to measure student attitude to the Blackboard system,
questionnaires was given to the students during term time. These were submitted on
paper to all the students taking part during class time. Three course leaders were
interviewed, and their attitudes to the use of the LMS used on the courses were

Chapter 5
78
measured. The information was saved for each subject separately for both genders in
order to be able to compare the results later on in the study.
5.6. Data analysis
A descriptive statistical analysis method was used to reveal the means and standard
deviations in the demographic information that covered gender and field of study.
This method allowed for the means (average across items) and standard deviations for
the constructs to be included (using SPSS software). The ANOVA test was used to
measure whether the means of several groups were significantly different or not. A
post-hoc test to compare the different scores to a critical value was carried out to
gauge the differences between the means of all of the academic specializations in
order to find out if there were any significant differences.
To indicate the strength, significance and the direction of the relationship between the
independent variable (academic specialization and gender) and the dependent
variables (learners' attitude towards the Blackboard system, learners‟ use of
Blackboard and learners' achievements), the researcher opted for a Pearson‟s
correlation. Results of students' academic achievement on the courses were correlated
with the measures of Blackboard system in use (e.g. Blackboard hits and
communication board use). The relationship between the students' achievements and
their use of Blackboard was also analysed.
Frequency tests were used to analyse the numerical data given by the tracking system
log files. This data encompasses the figures giving the learner accurate details on the
use of Blackboard, for example: the number of messages that learners' read and
posted on the communication board.
As there were only three interviews in this study, a thematic analysis technique was
used to analyse them to explain the results obtained from the questionnaires and the
tracking system.

Chapter 5
79
5.7. Findings
5.7.1. Academic instructor behaviour
Instructors used the Blackboard system in a similar way for their observed courses
(three subjects and both genders). All of them were teaching English language course
in three subjects. One of them was teaching male and female students via a video link
from another room, while the others were just teaching male students. The education
system in Saudi is unique, because it is gender segregated. Some of these instructors
chose to publish lecture slides, course materials and various information and avoided
using the available LMS tools or any other functions on the Blackboard system to
design specific course materials. Notably, the attitudes of the instructors towards
using the Blackboard system were positive. They suggested that it was a useful
learning system, since it gave practical helped to shy students
One of them stated: "The Blackboard system is very helpful to shy people, to give
them a good opportunity to engage in the learning process ''. In addition, they stated
that students‟ use of Blackboard is still weak on their courses. A second respondent
said: "...but I noticed that the students do not use the Blackboard system lots in the
course throughout the semester''. Importantly, the instructors stated what the reasons
were behind that, one of them, who was teaching both genders, saying: ''I see that the
technical problems and the lack of training for using the Blackboard system by
students and instructors are one of the important problems which led to reduce the
motivation for the students at the University ''. Another instructor confirmed that,
saying: “There has been zero training. I am sure there are many useful tools, but
where is the training for teachers and students''. He added: '' ... Until then, the
university spent huge amount of money with no benefits like smart boards in rooms
with no working software''. A third one claimed:''… but because I cannot fully
understand some blackboard tools work, students do not get the feedback they need. I
am about to stop using them because it is too much work to figure out''.
The majority of instructors agreed that the LMS Blackboard was a great help for both
themselves and their students despite the fact that neither them nor learners had much
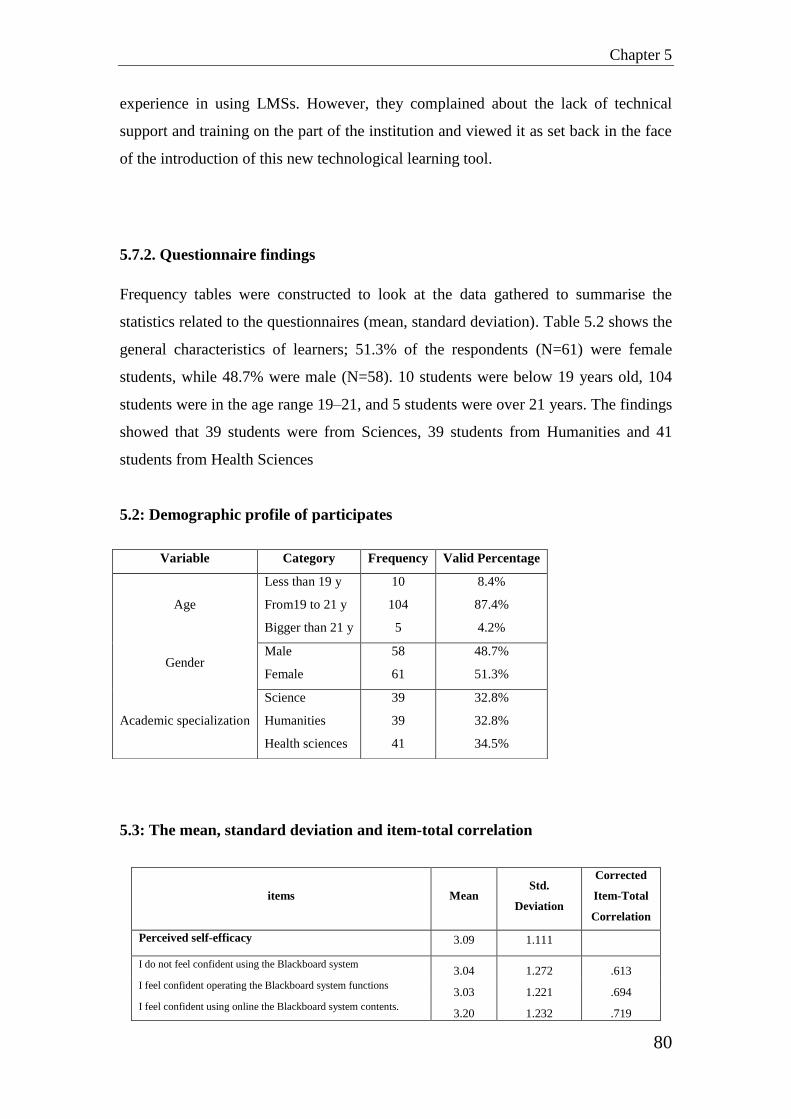
Chapter 5
80
experience in using LMSs. However, they complained about the lack of technical
support and training on the part of the institution and viewed it as set back in the face
of the introduction of this new technological learning tool.
5.7.2. Questionnaire findings
Frequency tables were constructed to look at the data gathered to summarise the
statistics related to the questionnaires (mean, standard deviation). Table 5.2 shows the
general characteristics of learners; 51.3% of the respondents (N=61) were female
students, while 48.7% were male (N=58). 10 students were below 19 years old, 104
students were in the age range 19–21, and 5 students were over 21 years. The findings
showed that 39 students were from Sciences, 39 students from Humanities and 41
students from Health Sciences
5.2: Demographic profile of participates
5.3: The mean, standard deviation and item-total correlation
items Mean Std.
Deviation
Corrected
Item-Total
Correlation
Perceived self-efficacy 3.09 1.111
I do not feel confident using the Blackboard system 3.04 1.272 .613
I feel confident operating the Blackboard system functions 3.03 1.221 .694
I feel confident using online the Blackboard system contents. 3.20 1.232 .719
Variable Category Frequency Valid Percentage
Age
Less than 19 y
From19 to 21 y
Bigger than 21 y
10
104
5
8.4%
87.4%
4.2%
Gender Male
Female
58
61
48.7%
51.3%
Academic specialization
Science
Humanities
Health sciences
39
39
41
32.8%
32.8%
34.5%

Chapter 5
81
Perceived satisfaction 3.04 1.060
I am dissatisfied with using the Blackboard system as a learning
assisted tool. 3.09 1.456 .733
I am satisfied with using the Blackboard system functions 3.03 1.245 .730
I am dissatisfied with the Blackboard system contents 2.93 1.240 .638
I am satisfied with multimedia instruction 3.12 1.373 .623
Perceived usefulness 3.31 1.090
I believe the Blackboard system contents are informative 3.29 1.151 .670
I believe the Blackboard system is a useful learning tool 3.44 1.332 .843
I do not believe the Blackboard system contents are useful 3.22 1.354 .672
Behavioral intention 3.04 1.071
I intend to use the Blackboard system to assist my learning 3.24 1.396 .785
I do not intend to use the Blackboard system content to assist my
learning 3.13
1.369 .721
I intend to use the Blackboard system as an autonomous learning
tool 2.74
1.218 .504
e-learning system quality 2.71 .939
I am dissatisfied with the Blackboard system functions 2.82 1.249 .621
I am satisfied the Internet speed 2.66 1.457 .452
I am satisfied with the Blackboard system content 3.07 1.280 .776
I am dissatisfied with the Blackboard system interaction 2.30 1.161 .404
Interactive learning activities 3.08 1.203
I would like to share my the Blackboard system experience 3.18 1.306 .756
I do not believe the Blackboard system can assist teacher-learner
interaction 2.99
1.476 .693
I believe the Blackboard system can assist learner-learner
interaction 3.08
1.462 .703
E-learning effectiveness 3.21 1.145
I believe the Blackboard system can assist learning efficiency 3.38 1.315 .726
I believe the Blackboard system can assist learning performance 3.25 1.329 .826
I do not believe the Blackboard system can assist learning
motivation 3.00
1.269 .767
Multimedia instruction 2.88 1.030
I like to use voice media instruction 2.74 1.224 .603
I like to use video media instruction 3.07 1.307 .576
I do not like to use multimedia instruction 2.82 1.332 .526

Chapter 5
82
In Table 5.3 above, descriptive statistics analysis reveals the mean and standard
deviation of items in each dimension; in other words the means for responses ranged
from 2.30 to 3.44. Question 9 being: “I believe the Blackboard system is a useful
learning tool'' scored the highest. The lowest scores were for question 17: „„I am
dissatisfied with the Blackboard system interaction'', while the means for the factors
were close to each other, ranging from 2.71 for e-learning system quality to 3.31 for
Perceived usefulness.
A Wilcoxon Test was carried out to single out any differences between males and
females as shown in Table 5.4 below. The findings indicated that the difference was
statistically significant (Z=3.989, p=000). The results also showed that female
students were more positive about using the Blackboard system than males.
5.4: Comparison of mean's across males and females using the Wilcoxon Test
N Mean Rank Sum of Ranks
Female - Male
Negative Ranks 5a 3.70 18.50
Positive Ranks 21b 15.83 332.50
Ties 0c
Total 26
a. Female < Male
b. Female > Male
c. Female = Male
Female - Male
Z -3.989-b
Asymp. Sig. (2-tailed) .000
a. Wilcoxon Signed Ranks Test
b. Based on negative ranks.
5.5: post-hoc tests across Sciences, Humanities and Health Sciences
Tukey HSD
Dependent Variable (I) Major (J) Major Mean Difference (I-J) Std. Error Sig. 95% Confidence Interval
Lower Bound Upper Bound
Perceived self-efficacy
Science Humanities -.44444- .24132 .161 -1.0174- .1285
Health sciences -.83782-* .23836 .002 -1.4037- -.2719-
Humanities Science .44444 .24132 .161 -.1285- 1.0174
Health sciences -.39337- .23836 .229 -.9593- .1725

Chapter 5
83
Health sciences Science .83782* .23836 .002 .2719 1.4037
Humanities .39337 .23836 .229 -.1725- .9593
Perceived satisfaction
Science Humanities -.44231- .23644 .152 -1.0037- .1190
Health sciences -.51986- .23354 .071 -1.0743- .0346
Humanities Science .44231 .23644 .152 -.1190- 1.0037
Health sciences -.07755- .23354 .941 -.6320- .4769
Health sciences Science .51986 .23354 .071 -.0346- 1.0743
Humanities .07755 .23354 .941 -.4769- .6320
Perceived usefulness
Science Humanities -.52137- .23810 .077 -1.0867- .0439
Health sciences -.76193-* .23518 .004 -1.3203- -.2036-
Humanities Science .52137 .23810 .077 -.0439- 1.0867
Health sciences -.24057- .23518 .564 -.7989- .3178
Health sciences Science .76193* .23518 .004 .2036 1.3203
Humanities .24057 .23518 .564 -.3178- .7989
Behavioral intention
Science Humanities -.52991- .23598 .068 -1.0902- .0303
Health sciences -.64353-* .23308 .018 -1.1969- -.0902-
Humanities Science .52991 .23598 .068 -.0303- 1.0902
Health sciences -.11361- .23308 .877 -.6670- .4398
Health sciences Science .64353* .23308 .018 .0902 1.1969
Humanities .11361 .23308 .877 -.4398- .6670
e-learning system quality
Science Humanities -.78205-* .20169 .001 -1.2609- -.3032-
Health sciences -.31848- .19921 .250 -.7914- .1545
Humanities Science .78205* .20169 .001 .3032 1.2609
Health sciences .46357 .19921 .056 -.0094- .9365
Health sciences Science .31848 .19921 .250 -.1545- .7914
Humanities -.46357- .19921 .056 -.9365- .0094
Interactive learning activities
Science Humanities -.82051-* .25962 .006 -1.4369- -.2041-
Health sciences -.84449-* .25643 .004 -1.4533- -.2357-
Humanities Science .82051* .25962 .006 .2041 1.4369
Health sciences -.02397- .25643 .995 -.6328- .5848
Health sciences Science .84449* .25643 .004 .2357 1.4533
Humanities .02397 .25643 .995 -.5848- .6328
E-learning effectiveness
Science Humanities -.52991- .25285 .095 -1.1302- .0704
Health sciences -.67626-* .24975 .021 -1.2692- -.0833-
Humanities Science .52991 .25285 .095 -.0704- 1.1302
Health sciences -.14634- .24975 .828 -.7393- .4466
Health sciences Science .67626* .24975 .021 .0833 1.2692
Humanities .14634 .24975 .828 -.4466- .7393
Multimedia instruction
Science Humanities -.72650-* .22349 .004 -1.2571- -.1959-
Health sciences -.63811-* .22075 .013 -1.1622- -.1140-
Humanities Science .72650* .22349 .004 .1959 1.2571
Health sciences .08839 .22075 .915 -.4357- .6125
Health sciences Science .63811* .22075 .013 .1140 1.1622
Humanities -.08839- .22075 .915 -.6125- .4357
*. The mean difference is significant at the 0.05 level.
To look for signs of any differences between academic specializations, a test was
carried out. Table 5.5 above shows that there are significant differences in terms of
Perceived self-efficacy, Perceived usefulness, Behavioural intention, e-learning
system quality, Interactive learning activities, E-learning effectiveness, Multimedia
instruction (p< 0.05), while no significant differences were found between the means
for Perceived satisfaction, at p> 0.05 to academic specializations. It is noted that
statistically significant differences were mostly between Science and Health science
subjects.
Table 5.6. indicates that most of variables correlate significantly with one another
and the correlations are less than 0.82.
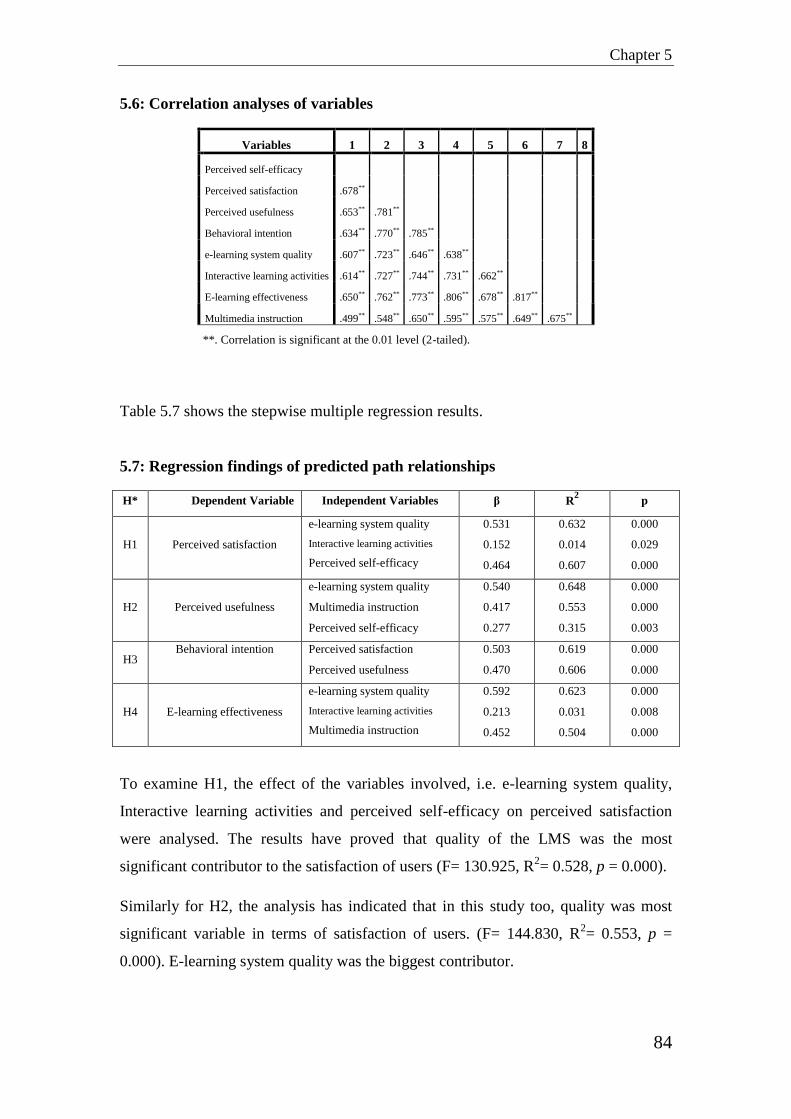
Chapter 5
84
5.6: Correlation analyses of variables
Variables 1 2 3 4 5 6 7 8
Perceived self-efficacy
Perceived satisfaction .678**
Perceived usefulness .653** .781**
Behavioral intention .634** .770** .785**
e-learning system quality .607** .723** .646** .638**
Interactive learning activities .614** .727** .744** .731** .662**
E-learning effectiveness .650** .762** .773** .806** .678** .817**
Multimedia instruction .499** .548** .650** .595** .575** .649** .675**
**. Correlation is significant at the 0.01 level (2-tailed).
Table 5.7 shows the stepwise multiple regression results.
5.7: Regression findings of predicted path relationships
H* Dependent Variable Independent Variables β R2
p
H1 Perceived satisfaction
e-learning system quality
Interactive learning activities
Perceived self-efficacy
0.531
0.152
0.464
0.632
0.014
0.607
0.000
0.029
0.000
H2 Perceived usefulness
e-learning system quality
Multimedia instruction
Perceived self-efficacy
0.540
0.417
0.277
0.648
0.553
0.315
0.000
0.000
0.003
H3 Behavioral intention
Perceived satisfaction
Perceived usefulness
0.503
0.470
0.619
0.606
0.000
0.000
H4 E-learning effectiveness
e-learning system quality
Interactive learning activities
Multimedia instruction
0.592
0.213
0.452
0.623
0.031
0.504
0.000
0.008
0.000
To examine H1, the effect of the variables involved, i.e. e-learning system quality,
Interactive learning activities and perceived self-efficacy on perceived satisfaction
were analysed. The results have proved that quality of the LMS was the most
significant contributor to the satisfaction of users (F= 130.925, R2= 0.528, p = 0.000).
Similarly for H2, the analysis has indicated that in this study too, quality was most
significant variable in terms of satisfaction of users. (F= 144.830, R2= 0.553, p =
0.000). E-learning system quality was the biggest contributor.

Chapter 5
85
To test H3, the results of the analysis have revealed that both factors perceived
satisfaction was the biggest contributing factor. (F= 187.323, R2= 0.616, p = 0.000).
To investigate H4, the biggest predictor on e-learning effectiveness was the LMS
quality (F = 135.133, R2= 0.536, p = 0.000).
The answers to the open-ended question have indicated most students had faced
technical problems and needed help using Blackboard in all subjects. Moreover, the
students stated that they were not given training on how to use the Blackboard system
by the University, except for some instructions in a hand-out. The only difference
noticed was that female learners liked the LMS Blackboard more than their male
counterparts and were more complementary about it.
5.7.3. The findings from the Blackboard tracking system
These results have indicated that students tended to use the LMS Blackboard
frequently in three subjects. Students visited the ''home page'', ''content page'',
''assignment page'', ''files page'' and board assigned for communication.
5.8: Summary of learners' use of Blackboard
N Minimum Maximum Mean Std. Deviation
Homepage 119 3 8 5.49 1.00105
Time 119 2.34 6.30 4.67 .85749
Read 119 3 8 5.67 1.06034
Post 119 0 1 .1712 .09186
Assignment submit 119 1 1 .7563 .10527
Content folder 119 2 4 3.25 .36352
Files 119 2 4 2.79 .43023
Learner use of Blackboard on the observed course is summarized in Table 5.8 above.
The following details explain that fully and clearly: “Homepage” is the number of
times a student accessed Blackboard on the observed course; “Time” is the total time,
in minutes, that each student spent using Blackboard; “Read” and “Post” is the
number of messages that students read and posted on the communication tool;
“Assignment submit” shows if the students submitted their assignment; “Content
folder” is the number of times students accessed the content folder containing all the

Chapter 5
86
lecture slides and other course materials; “Files” is the number of times that students
accessed or saved a file in the content folder.
5.9: Means of learner visits to each page on Blackboard. (The learners were
grouped based to gender)
Sum of Squares df Mean Square F Sig.
Homepage Between Groups 4.604 2 2.302 2.350 .100
Within Groups 113.645 116 .980
Total 118.249 118
Time Between Groups 7.044 2 3.522 5.125 .007
Within Groups 79.719 116 .687
Total 86.763 118
Read Between Groups 15.028 2 7.514 7.409 .001
Within Groups 117.642 116 1.014
Total 132.670 118
Post Between Groups .057 2 .028 3.489 .034 Within Groups .939 116 .008
Total .996 118
Assignment submit Between Groups .059 2 .029 2.719 .070 Within Groups 1.249 116 .011
Total 1.308 118
Content folder Between Groups .700 2 .350 2.726 .070 Within Groups 14.894 116 .128
Total 15.594 118
Files Between Groups 5.743 2 2.871 20.690 .000
Within Groups 16.099 116 .139
Total 21.842 118
An ANOVA test was used to determine if they were any differences between students'
use of Blackboard because of gender. Table 5.9 shows statistically significant
differences in time (F=5.125, p<0.05, read F=7.409, p<0.01, post F=3.489, p<0.05
and files F=20.690, p<0.001), whereas no significant differences were found for
homepage (F=2.350, p>0.05, assignment submit F=2.719, p>0.05 and content folder
F=2.726, p>0.05).
5.10: Means of learner visits to each page on Blackboard. (The learners were
grouped based to field of study)
Tukey HSD
Dependent Variable (I) Major (J) Major Mean Difference (I-J)
Std. Error
Sig. 95% Confidence Interval
Lower
Bound
Upper
Bound
Homepage
Science Humanities .23397 .22414 .551 -.2982- .7661
Health
Sciences
-.24578- .22139 .510 -.7714- .2799
Humanities Science -.23397- .22414 .551 -.7661- .2982
Health Sciences
-.47975- .22139 .081 -1.0054- .0459

Chapter 5
87
Health
Sciences
Science .24578 .22139 .510 -.2799- .7714
Humanities .47975 .22139 .081 -.0459- 1.0054
Time
Science Humanities -.02808- .18773 .988 -.4738- .4176 Health
Sciences
-.52547-* .18543 .015 -.9657- -.0852-
Humanities Science .02808 .18773 .988 -.4176- .4738 Health
Sciences
-.49739-* .18543 .023 -.9376- -.0572-
Health Sciences
Science .52547* .18543 .015 .0852 .9657 Humanities .49739* .18543 .023 .0572 .9376
Read
Science Humanities .83974* .22805 .001 .2983 1.3812
Health
Sciences
.20184 .22525 .644 -.3329- .7366
Humanities Science -.83974-* .22805 .001 -1.3812- -.2983-
Health
Sciences
-.63790-* .22525 .015 -1.1727- -.1031-
Health
Sciences
Science -.20184- .22525 .644 -.7366- .3329
Humanities .63790* .22525 .015 .1031 1.1727
Post
Science Humanities .00321 .02038 .986 -.0452- .0516
Health
Sciences
-.04417- .02013 .076 -.0920- .0036
Humanities Science -.00321- .02038 .986 -.0516- .0452 Health
Sciences
-.04737- .02013 .053 -.0952- .0004
Health Sciences
Science .04417 .02013 .076 -.0036- .0920 Humanities .04737 .02013 .053 -.0004- .0952
Assignment
submit
Science Humanities -.05449- .02350 .057 -.1103- .0013
Health Sciences
-.02228- .02321 .604 -.0774- .0328
Humanities Science .05449 .02350 .057 -.0013- .1103
Health Sciences
.03221 .02321 .351 -.0229- .0873
Health
Sciences
Science .02228 .02321 .604 -.0328- .0774
Humanities -.03221- .02321 .351 -.0873- .0229
Content folder
Science Humanities .13141 .08114 .242 -.0612- .3241 Health
Sciences
-.05058- .08015 .803 -.2409- .1397
Humanities Science -.13141- .08114 .242 -.3241- .0612
Health
Sciences
-.18199- .08015 .064 -.3723- .0083
Health Sciences
Science .05058 .08015 .803 -.1397- .2409 Humanities .18199 .08015 .064 -.0083- .3723
Files
Science Humanities .54167* .08436 .000 .3414 .7420
Health
Sciences
.29917* .08333 .001 .1013 .4970
Humanities Science -.54167-* .08436 .000 -.7420- -.3414-
Health Sciences
-.24250-* .08333 .012 -.4403- -.0447-
Health Sciences
Science -.29917-* .08333 .001 -.4970- -.1013-
Humanities .24250* .08333 .012 .0447 .4403
*. The mean difference is significant at the 0.05 level.
A post-hoc test was carried out to determine the differences between students' use of
the Blackboard system according to academic specialization. Table 5.10 indicates that
academic specialization does not impact significantly, (p>0.05), while there was a
significant effect between academic specializations in the total time that students
spend using Blackboard, (p<0.05), but this did not occur in all subjects.
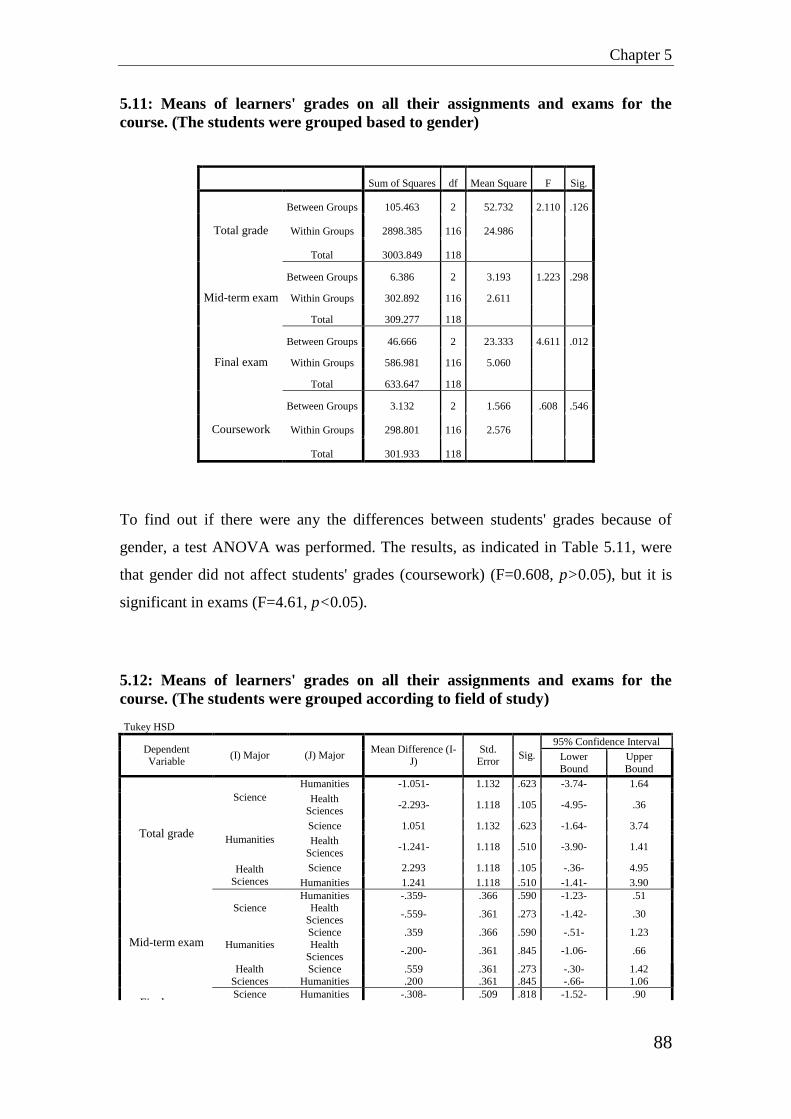
Chapter 5
88
5.11: Means of learners' grades on all their assignments and exams for the
course. (The students were grouped based to gender)
Sum of Squares df Mean Square F Sig.
Total grade
Between Groups 105.463 2 52.732 2.110 .126
Within Groups 2898.385 116 24.986
Total 3003.849 118
Mid-term exam
Between Groups 6.386 2 3.193 1.223 .298
Within Groups 302.892 116 2.611
Total 309.277 118
Final exam
Between Groups 46.666 2 23.333 4.611 .012
Within Groups 586.981 116 5.060
Total 633.647 118
Coursework
Between Groups 3.132 2 1.566 .608 .546
Within Groups 298.801 116 2.576
Total 301.933 118
To find out if there were any the differences between students' grades because of
gender, a test ANOVA was performed. The results, as indicated in Table 5.11, were
that gender did not affect students' grades (coursework) (F=0.608, p>0.05), but it is
significant in exams (F=4.61, p<0.05).
5.12: Means of learners' grades on all their assignments and exams for the
course. (The students were grouped according to field of study)
Tukey HSD
Dependent Variable
(I) Major (J) Major Mean Difference (I-
J) Std.
Error Sig.
95% Confidence Interval
Lower
Bound
Upper
Bound
Total grade
Science
Humanities -1.051- 1.132 .623 -3.74- 1.64
Health Sciences
-2.293- 1.118 .105 -4.95- .36
Humanities
Science 1.051 1.132 .623 -1.64- 3.74
Health
Sciences -1.241- 1.118 .510 -3.90- 1.41
Health
Sciences
Science 2.293 1.118 .105 -.36- 4.95
Humanities 1.241 1.118 .510 -1.41- 3.90
Mid-term exam
Science
Humanities -.359- .366 .590 -1.23- .51
Health Sciences
-.559- .361 .273 -1.42- .30
Humanities
Science .359 .366 .590 -.51- 1.23
Health Sciences
-.200- .361 .845 -1.06- .66
Health
Sciences
Science .559 .361 .273 -.30- 1.42
Humanities .200 .361 .845 -.66- 1.06
Final exam Science Humanities -.308- .509 .818 -1.52- .90

Chapter 5
89
Health
Sciences -1.445-* .503 .013 -2.64- -.25-
Humanities
Science .308 .509 .818 -.90- 1.52
Health
Sciences -1.138- .503 .066 -2.33- .06
Health
Sciences
Science 1.445* .503 .013 .25 2.64
Humanities 1.138 .503 .066 -.06- 2.33
Coursework
Science
Humanities -.385- .363 .542 -1.25- .48
Health
Sciences -.288- .359 .702 -1.14- .56
Humanities
Science .385 .363 .542 -.48- 1.25
Health
Sciences .096 .359 .961 -.76- .95
Health Sciences
Science .288 .359 .702 -.56- 1.14
Humanities -.096- .359 .961 -.95- .76
*. The mean difference is significant at the 0.05 level.
A post-hoc test was conducted if there were any significant differences between
students' grades linked to academic specialization. The findings in Table 5.12 suggest
that there were no statistically significant differences. However there was a slight the
only difference linked to Science subject and Health sciences in the exam ( p<0.05).
Student activities on Blackboard and achievements and the relationship or links
involved were then examined and Pearson correlations were undertaken to gauge the
relationship between student grades and the use of the different pages accessed using
this LMS. Here, no significant correlations were found, as indicated in Table 5.12
above.
5.13: Correlations between learners' use of Blackboard & their grades
Total grade Mid-term exam Exam coursework
Homepage
Pearson Correlation -.018- .004 -.029- -.019-
Sig. (2-tailed) .844 .968 .751 .840
N 119 119 119 119
Read
Pearson Correlation -.020- .003 .027 -.107-
Sig. (2-tailed) .825 .972 .770 .246
N 119 119 119 119
Content folder
Pearson Correlation .098 .119 .054 .111
Sig. (2-tailed) .288 .198 .559 .229
N 119 119 119 119
Files
Pearson Correlation -.107- -.110- -.138- -.028-
Sig. (2-tailed) .245 .234 .134 .765
N 119 119 119 119

Chapter 5
90
5.8. Discussion
The questionnaire results have shown that student overall attitude to the LMS was
positive. This result is congruent with that of those obtained by (Liaw 2008; Sun, Ray
et al. 2008; Hammoud 2010; Chang, Chen et al. 2011;Alkhalaf, Drewa et al. 2012).
The results in Table 5.4 indicated that female students were more positive towards
using the Blackboard system than males. This finding was confirmed by (Sandersa
and Morrison 2011). This can perhaps be explained by the fact that, in Saudi Arabia
higher education, males and females do receive their instruction in separate classes;
i.e. in segregation, for cultural and religious reasons. This puts further strains on the
limited facilities and human resources available, which explains why women are often
among the strongest supporters of e-Learning because it potentially facilitates their
access to higher education.
If one takes learner behavioural intention, Table 5.3 shows that learners have shown a
mild positive attitude to the use of the Blackboard LMS at a rate of (M = 3.04).
Indeed, they believed that the LMS used was useful (M = 3.31) and effective (M =
3.21) as learning tool. The quality of this LMS seemed to have had an important
effect on student satisfaction despite the fact this cohort of students were first time
users of such a learning tool. Their lack of experience has led them to be a mildly self-
efficient in using it. Some of these students however, seemed to have truly enjoyed
the Interactive learning activities made easy by the Blackboard system.
Based on the results in Table 5.7 the most important factors that positively affected
students‟ satisfaction in using Blackboard were system quality (β = 0.531), Interactive
learning activities (β= 0.152) and perceived self-efficacy (β = 0.464). As indicated
above, due to their lack of familiarity with the Blackboard system and lack of e -
earning experience, lower system quality and lower self-efficacy led to lower student
satisfaction. The result indicated that students‟ perceived usefulness was affected by
system quality (β= 0.540), perceived self-efficacy (β= 0.277) and multimedia
instruction (β= 0.417). Students‟ behavioural intention was affected by two important
factors, i.e. satisfaction (β= 0.503) and perceived usefulness (β= 0.470). It indicated
that the Blackboard system has to make the student feel satisfied and that the system
is useful; thus, they will intend to use it. On the other hand, Blackboard‟s
effectiveness was affected by system quality (β= 0.592), Interactive learning activities
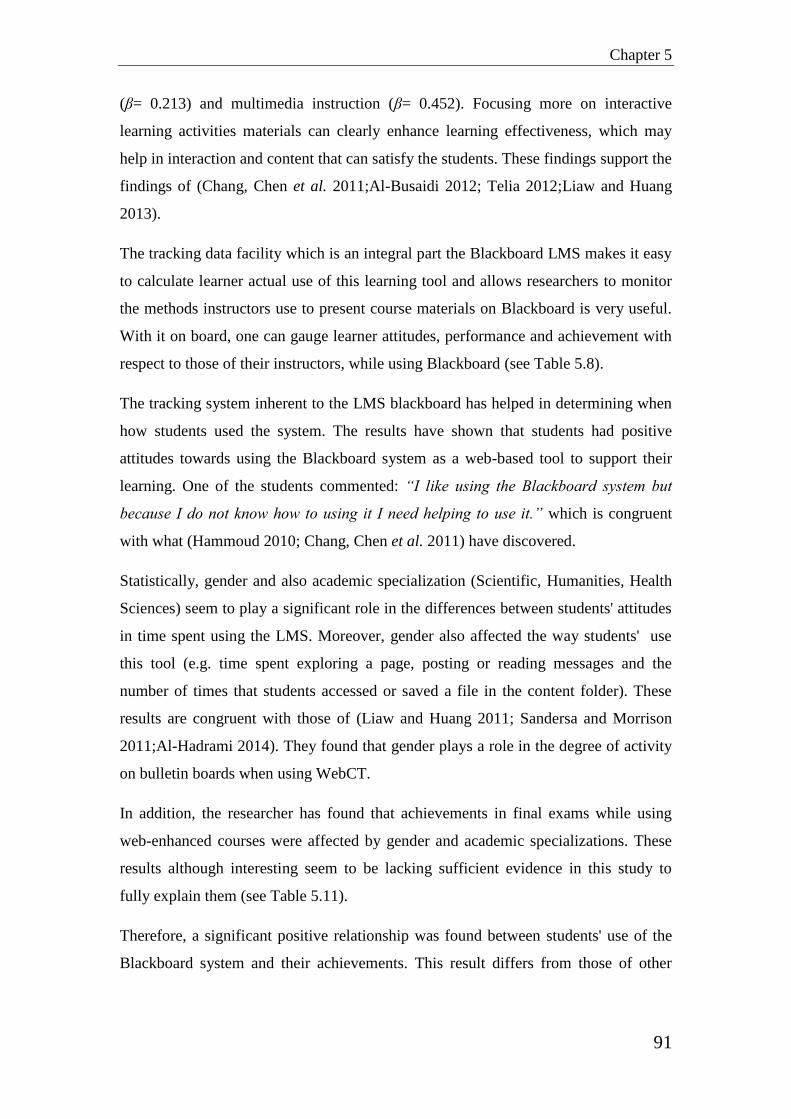
Chapter 5
91
(β= 0.213) and multimedia instruction (β= 0.452). Focusing more on interactive
learning activities materials can clearly enhance learning effectiveness, which may
help in interaction and content that can satisfy the students. These findings support the
findings of (Chang, Chen et al. 2011;Al-Busaidi 2012; Telia 2012;Liaw and Huang
2013).
The tracking data facility which is an integral part the Blackboard LMS makes it easy
to calculate learner actual use of this learning tool and allows researchers to monitor
the methods instructors use to present course materials on Blackboard is very useful.
With it on board, one can gauge learner attitudes, performance and achievement with
respect to those of their instructors, while using Blackboard (see Table 5.8).
The tracking system inherent to the LMS blackboard has helped in determining when
how students used the system. The results have shown that students had positive
attitudes towards using the Blackboard system as a web-based tool to support their
learning. One of the students commented: “I like using the Blackboard system but
because I do not know how to using it I need helping to use it.” which is congruent
with what (Hammoud 2010; Chang, Chen et al. 2011) have discovered.
Statistically, gender and also academic specialization (Scientific, Humanities, Health
Sciences) seem to play a significant role in the differences between students' attitudes
in time spent using the LMS. Moreover, gender also affected the way students' use
this tool (e.g. time spent exploring a page, posting or reading messages and the
number of times that students accessed or saved a file in the content folder). These
results are congruent with those of (Liaw and Huang 2011; Sandersa and Morrison
2011;Al-Hadrami 2014). They found that gender plays a role in the degree of activity
on bulletin boards when using WebCT.
In addition, the researcher has found that achievements in final exams while using
web-enhanced courses were affected by gender and academic specializations. These
results although interesting seem to be lacking sufficient evidence in this study to
fully explain them (see Table 5.11).
Therefore, a significant positive relationship was found between students' use of the
Blackboard system and their achievements. This result differs from those of other

Chapter 5
92
researchers, the likes of (Hammoud 2010; Daniel Strickera, Weibela et al. 2011;
Erdogan, Bayram et al. 2011;Wong 2013).
As the data collected for this study were from three groups of students on one course,
a comparison could be made between students' attitudes and behaviour. During the
semester, students had to use the Blackboard LMS regularly regardless of the
variation in their specialization. The differences in attitudes related to the use of the
LMS can‟t be explained by one single reason. However, the significant differences in
using it seem to be linked to the way course leaders use it and this, can perhaps be
considered as an essential factor for this student behaviour. Somehow, this could and
may be attributed to the nature of learner academic specialization as well as their
instructors‟ previous knowledge and experience of the system. This could be
considered as evidence to confirm that learner use has been affected by their course
leader's competence in using the system. This result supports the results obtained in
the first study.
This study‟s findings tend to suggest that students are able to use the Blackboard LMS
but unfortunately not quite efficiently. This can be attributed to the absence or the
lack of a prominent and effective institutional role that can provide technical support
and training to all users, learner and instructor alike, as well as the lack of ability to
take advantage of what the Blackboard LMS offers technically in the delivery of e-
learning. This result is similar to (Telia 2012). The focus should therefore be
concentrated on interactive learning activities materials to enhance learning
effectiveness, which, in turn, would affect e-learning quality in general.
The success of any learning management system, as for any other information system,
can be gauged in terms of user acceptance, usage and satisfaction. Learners‟
continuous acceptance and use is mandatory for the success of any LMS adoption and
deployment. Measuring user acceptance and satisfaction is a "basic marketing
element" in managing e-learning initiatives (Kelly and Bauer, 2004).
To gauge what critical factors affected web-enhanced courses, (Hammoud 2010) has
looked at some course supported by a course management system (WebCT) at Brunel
University in London. The study was conducted to check the impact of learner,
instructor and dimension technology elements on students' attitudes, performance and
achievements. The findings indicated that student attitude to using WebCT was found

Chapter 5
93
to have a positive relationship with all three elements. Student achievement was found
to have a positive relationship with the instructor and learner elements. In addition,
the technology and learner elements were found to have a close and positive link with
the students‟ use of WebCT. Regarding the instructor‟s technical knowledge,
competence, and the method of presentation and delivery of course materials, the
findings have indicated that there were no effects or bearing on the actual use of
WebCT. The results have also suggested that the above factors had no impact on the
learner perception of how useful, easy to use, flexible, and good the course
management system is, and this falls within the learner achievements element.
The issue of the critical factors that may have a great influence on the success of an
LMS in blended learning in terms of actual usage, perceived usefulness, perceived
ease of use, and user satisfaction from the learners‟ perspective were examined by
(Al-Busaidi 2012) at Sultan Qaboos University, Oman. Six dimensions were tested,
including the instructor dimension (attitude, teaching style, control and
responsiveness).The results indicated that the instructor‟s attitude towards the LMS
factor had a significant impact on learners‟ actual use.
Hammoud's study did not examine the university support factor either, which might
affect the success of learning management systems. "The university support factor is
the second wing of the technology factor" (Selim 2007). (Sumner and Hostetler 1999)
indicated that organizational factors, such as training, incentives, strategic alignment
and technical support might affect the adoption of technology in teaching. Likewise,
(Wan et al. 2007), in a theoretical study, proposed that the primary participants
(learners and instructors), technology quality and instructional design impacted
learning processes, and, consequently, learning outcomes.
Furthermore, in a confirmatory study, (Selim 2007) has categorized the critical factors
of LMS acceptance according to learner, instructor, technology and institution support
elements. It is common knowledge that e-learning in the Saudi Kingdom is still in its
infancy, especially in higher education and for this reason there is an urgent need for
learners and instructors to be familiar with the new and contemporary technologies
used in the delivery of distant or virtual learning processes (Aljabre 2012). As some
university students cannot use LMSs, or might face difficulties in trying to use them
effectively, there is a need to explore the factors that may have a bearing on students‟
Chapter 5
94
acceptance of such learning tools in order to be able to overcome the challenges that
face the adoption of new technologies in web-enhanced learning.
Following on from the results discussed in Chapters 4 and 5, the next chapter shall try
to examine and develop an understanding of the factors pertinent to a successful
adoption of contemporary technologies being used in web-enhanced teaching and
learning processes such as the LMS the Blackboard. In order to do that, one has to
endeavour to investigate whether instructor attitudes to LMSs affect actual use.
Hence, we intend to adopt and further develop Hammoud's framework, with Saudi
Arabia higher education institutions such as the University of Taif in mind.
5.9. Chapter summary
The LMS „Blackboard‟ is an prominent learning management tool that has known an
exponential increase in its use in higher education around the globe in recent years.
The study discussed in Chapter 5 was conducted to determine how effective this LMS
was and what impact, if any, it did have on issues such as learner satisfaction,
behavioural intentions after being introduced at the University of Taif. The researcher
has endeavoured to look at the relationships that may exist between this newly
adopted learning and teaching medium and the end user. By focusing not only on the
attitudes and the behaviours of both instructor and learner, but also on the role that the
institution offering it should play to make a success of the whole experience, the
researcher has explored the topic within the current pertinent literature to gauge what
effect or impact the use of LMS on students' performances and their achievements
based on gender and academic specializations.
The variables gender and academic specializations (Scientific, Humanities, Health
Sciences) of students were explored to look for any links or relationships that may
exist between them and the actual use of the Blackboard LMS, the attitudes of the
learners and their achievements. A significant relationship was found between student
gender, academic specializations and students' attitude to using the Blackboard
system, but none with their way of using the LMS under study. Indeed, across all the
different academic specializations, students have shown a positive attitude to the
Blackboard system and its use in their learning.

Chapter 5
95
On the basis of Chapters four and five findings, Chapter six will endeavour and seek
to develop and adopt a framework aiming at understanding the relationship between
the variables that relate to web-enhanced courses using the Blackboard LMS as a
learning support tool. This framework for will be based on Hammoud's study and will
consist of an advanced trellis of ideas that can be applied to web-enhanced courses for
undergraduate students (Hammoud 2010). It is somewhat a complex, but the
framework suitable for adoption in the present work. Variables from Chapters 4 and
the present chapter were found to have a significant impact on student attitudes and
performance while using the LMS. These variables were grouped under four
dimensions and added to some other demographic variables to form the main parts of
the framework that will put forward in the next chapter.

96
Chapter 6
A Framework for explaining the relationship between the main
success factors in web-based learning in developing countries
6.1. Introduction
The findings in Chapter 4 have indicated that a significant relationship existed
between learner attitude towards the use of the Blackboard LMS and that of the
instructor despite the fact that learners were more eager and more motivated in trying
this new mode of learning
In Chapter 5 the importance of the role of the institution through the provision of
technical support and training for both learner and instructor was highlighted. In
addition a significant relationship between learner academic specialization and the
LMS used was discovered. Moreover, the link between achievement and the use of
this tool was established.
On the basis of these previous findings a framework was developed. Chapter 6 looks
into some critical success factors (CSFs) that may possibly enhance e-learning. It has
provided suggestions on how web-enhanced learning in developing countries,
particularly Saudi Arabia, can be a success. The research framework for this work is
adopted from Hammoud's Brunel university study, UK, (2010).

Chapter 6
97
Hammoud's framework was drawn from the works of (Davis 1993; Selim 2003;Sun,
Ray et al. 2008). which focused on technology and previously tackled by (Sun,Ray et
al.2008). The framework has three dependent variables, namely, learner attitudes,
achievements and use of WebCT, as shown in Figure 6.1.
Various factors affect success in Technology. Both technical and non-technical issues
play an important role in whether or not such or such technology is successful and
useful. Measures such as user perception, intention, satisfaction, actual usage and
perceived usefulness are dealt with in the current literature. The technology
acceptance model (Davis 1986; Venkatesh and Davis 2000) and the information
system success model (DeLone and McLean 1992; DeLone and McLean 2003) are
two of the most popular models of user acceptance of information technologies.
For the scholars (Davis 1989) and (Venkatesh and Davis 2000), technology
acceptance should and must be assessed by not only, how learners feel and behave in
using it, but also by the degree of the resulting benefits (DeLone and McLean1992).
Several have an impact on the success of technology. (DeLone and McLean 2003)
indicate that variables such as information quality, system quality and service quality
are some of the success factors of an information system (IS). As for the use of
technology in learning and teaching environments, (Webster and Hackley 1997),
following in the footsteps of (Dillon and Guawardena 1995) recommendations, stated
that the success of technology-mediated teaching and learning might be influenced by
several issues, such as the expertise and knowledge of the instructor, the quality of the
course, the motivation of the learners and the cooperation of classmates. Management
issues and organizational matters also have an important influence on learning
management systems (Sumner and Hostetler 1999). They indicate that training,
incentives, strategic alignment and technical support are some of the organizational
factors that have a direct impact (or might affect) the adoption of technology in
teaching environments.
Similarly, (Wan, Fang et al. 2007) made a theoretical study, which found that
participants and other factors, such as technology quality and instructional design, do
impact on learning processes, and consequently on learning outcomes. Furthermore,
along the same lines of study, (Selim 2007) categorized the critical factors of LMS

Chapter 6
98
acceptance according to the variables involved, i.e. learners, instructors, technology,
and university support factors.
Various empirical studies were carried out to investigate and gauge the success of
LMSs in educational institutions from the learner‟s perspective. Among these we find
the work undertaken by (Arbaugh 2000), who explored the effect of instructor
characteristics on learners satisfaction with LMS. Similarly (Pituch and Lee 2006)
examined learner characteristics and system characteristics on how these LMSs are
used and how useful for their learning. (Roca, Chiu et al. 2006) similar work on those
same characteristics that could have a major impact completed on learning outcomes
in e-learning environments.
In similar fashion (Liaw 2008) looked at these same learner characteristics. However
(Lee 2008) chose to examine the effects of organizational factors on how easy are
these LMSs to use. Others, the likes of (Liaw 2008), turned their attention to
assessing the effects of perceived efficacy, system quality and multimedia instruction
on learners‟ perceived satisfaction with the usefulness of LMSs. Scholars (Raaij and
Schepers 2008) have also looked at learner characteristics and their impact on LMSs
usefulness. Works carried out by (Sun, Ray et al. 2008) looked at e-learning and the
impact of learner characteristics, instructor characteristics, course characteristics,
system quality and classmates‟ interaction on the satisfaction of users. Similarly (Al-
Busaidi 2009) examined the impact of learner characteristics and LMS characteristics
on LMS use, as did (Cheng 2011), to gauge the effects of this new mode of learning
on user satisfaction.
Other scholars like (Wang and Shen 2011) opted to concentrate on quality for learner
satisfaction. (Lee 2010; Limayem and Cheung 2011;Lin, Chen et al. 2011) examined
the predictors of intention to continue e-learning. (Al-Busaidi 2012), like many of his
contemporaries, spent time on gauging the effect of various characteristics, those of
participants, systems and the organization involved.
Few studies have been carried out on what the critical priority factors that could
influence LMSs success in developing countries are (Selim 2007; Masrom, Rahiman
et al. 2008). A few however, thought that it might be quite an upheaval task to do that
successfully in developing countries.
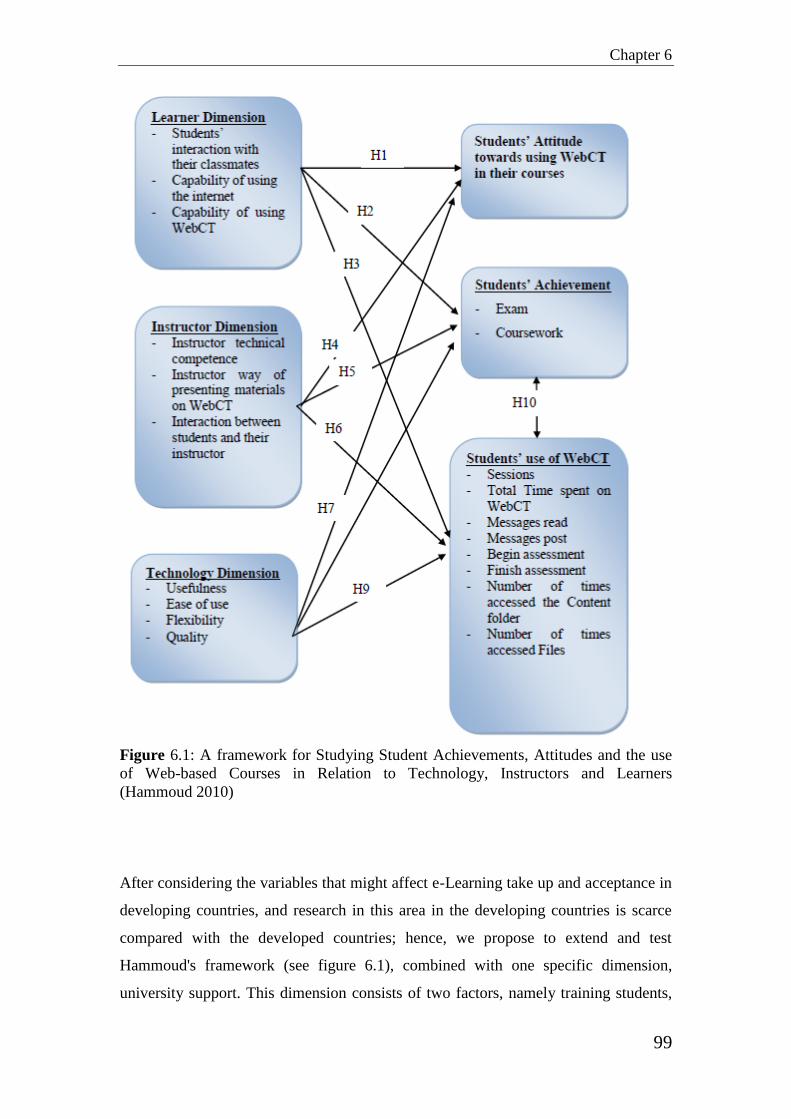
Chapter 6
99
Figure 6.1: A framework for Studying Student Achievements, Attitudes and the use
of Web-based Courses in Relation to Technology, Instructors and Learners
(Hammoud 2010)
After considering the variables that might affect e-Learning take up and acceptance in
developing countries, and research in this area in the developing countries is scarce
compared with the developed countries; hence, we propose to extend and test
Hammoud's framework (see figure 6.1), combined with one specific dimension,
university support. This dimension consists of two factors, namely training students,
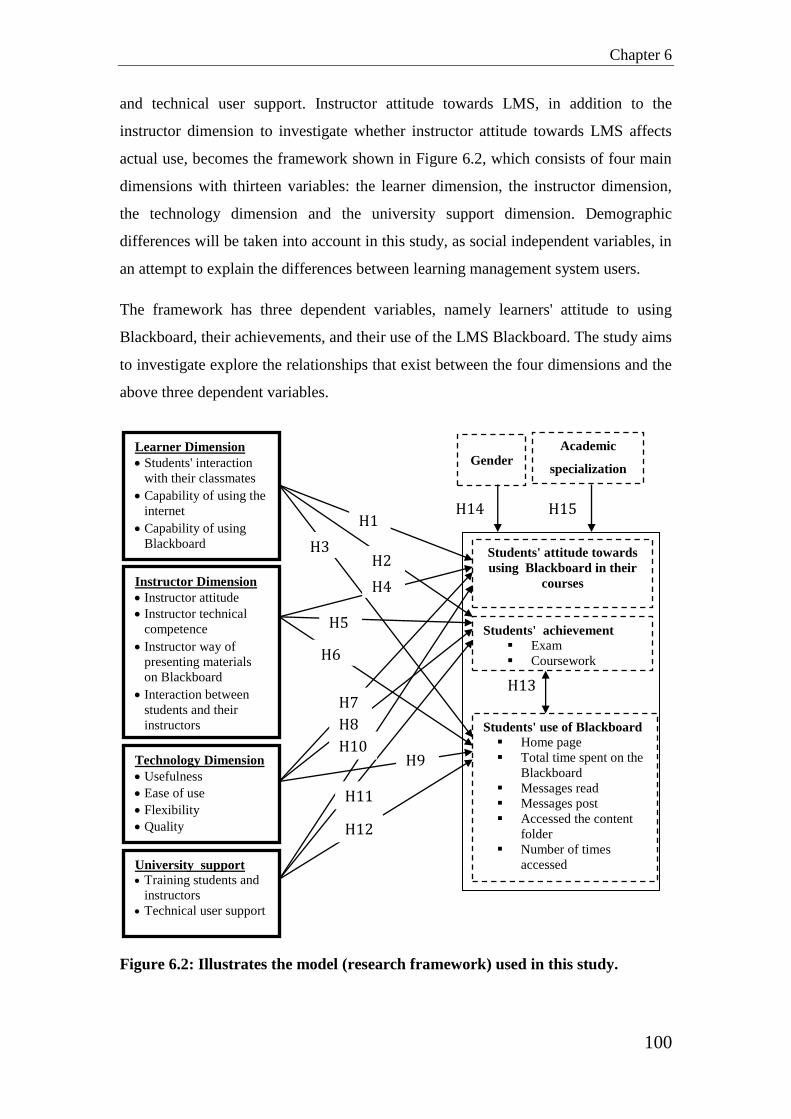
Chapter 6
100
and technical user support. Instructor attitude towards LMS, in addition to the
instructor dimension to investigate whether instructor attitude towards LMS affects
actual use, becomes the framework shown in Figure 6.2, which consists of four main
dimensions with thirteen variables: the learner dimension, the instructor dimension,
the technology dimension and the university support dimension. Demographic
differences will be taken into account in this study, as social independent variables, in
an attempt to explain the differences between learning management system users.
The framework has three dependent variables, namely learners' attitude to using
Blackboard, their achievements, and their use of the LMS Blackboard. The study aims
to investigate explore the relationships that exist between the four dimensions and the
above three dependent variables.
Figure 6.2: Illustrates the model (research framework) used in this study.
Learner Dimension
Students' interaction
with their classmates
Capability of using the
internet
Capability of using
Blackboard
Instructor Dimension
Instructor attitude
Instructor technical
competence
Instructor way of
presenting materials
on Blackboard
Interaction between
students and their
instructors
Technology Dimension
Usefulness
Ease of use
Flexibility
Quality
University support Training students and
instructors
Technical user support
Gender
H9
1
H1
11 H2
11
H3
11 H4
1 H5
1 H6
1 H7
1 H8
1
H15
1
H10
1
H11
1 H12
1
H13
1
H14
1
Academic
specialization
Students' attitude towards
using Blackboard in their
courses
Students' achievement
Exam
Coursework
Students' use of Blackboard
Home page
Total time spent on the
Blackboard
Messages read
Messages post
Accessed the content
folder
Number of times
accessed

Chapter 6
101
6.2. Research dimensions and hypotheses
6.2.1. The learner dimension
The learner dimension has three factors (Hammoud 2010). As shown in Figure 6.2
"Students' interaction with their classmates"
"Students' capability of using the internet"
"Students' capability of using the Blackboard system"
(Arbaugh 2000) indicated that researchers have noted a positive relationship between
learners when satisfied with LMS lead courses. Complete interaction in the classroom
(learner-learner and learner-instructor) increases motivation from all quarters,
increases take-up and therefore accelerates the learning progress (Piccoli, Ahmad et
al. 2001). An essential factor for learner satisfaction, and by the same token learner
success, was identified to be sound and interactive instruction design (Arbaugh 2000;
Hong 2002). Student-teacher, students-materials and student-student interactions were
found to be very important during learning activities (Moore 1989). These variables
must be scrutinised carefully, and the LMS design should seek to increase the
frequency, and the quality of such interactions in order to improve learner satisfaction
(Sun, Ray et al. 2008). For this study, the learners' interaction with peers variable was
measured by their perceptions of the number and the level (frequency and quality) of
learner-learner interactions.
Student satisfaction with this learning tool has been widely and academically
measured, using the evaluation of the impact of learning environments and activities
(Alavi 1994). Student satisfaction was found to be the main indicator for the
continuous acceptance and adoption of such tools (Arbaugh 2000). The influence of
prior knowledge and experience of online web-based learning was shown by scholars
to be an important area to be studied (Paris 2004).
In this study, we intend to explore web-based learning systems and their effects on
learning. By investigating the learner dimension and its relationship with the
dependent variables involved (students' attitude towards interactive boards and their

Chapter 6
102
use in general by learner and instructor alike), we propose to gauge the learning
outcomes and the level of learner achievement and any satisfaction that may or may
not result.
For that we need to formulate and test the following hypotheses:
H1: The learner dimension would impact positively on learners' attitude towards
using Blackboard in their courses.
H2: The learner dimension would impact positively on learners' achievements.
H3: The learner dimension would impact positively on the learners' way of using
Blackboard.
6.2.2. The instructor dimension
This dimension (Hammoud 2010; Al-Busaidi 2012) includes four factors:
Instructor's attitude towards the Blackboard system
"Instructor's technical competence"
"Instructor's way of presenting materials on the Blackboard system"
"Interaction between students and their instructor"
Learners' acceptance of ICT (information & communication technology) and learning
outcomes are more than closely related to, indeed they go hand in hand with, not only
instructors‟ attitude to technology, but also to their expertise in the subject (Dillon and
Guawardena 1995; Webster and Hackley 1997; Piccoli, Ahmad et al. 2001). The
instructor‟s attitude is also crucial to learners‟ perceptions, use of and satisfaction
with LMS (Al-Busaidi 2012; Taha 2014). In a virtual learning environment, social
influence impacts its acceptance positively (Keller 2009). Instructor attitude plays a
significantly important role and improves learners‟ technological self-efficacy and
their attitude towards its continuous use (Webster and Hackley 1997). Thus, the more
the instructor seems to have a good attitude towards LMS (views it as easy, useful
and satisfactory), the more the learners will adopt a similar attitude in their quest to
accept technology as a means for learning (Al-Busaidi and Al-Shihi 2010; Lee, Hsiao
et al. 2014).
Chapter 6
103
Teacher-student interaction was found to be a significant catalyst for, not only
acceptance of web-based courses by students, but also an increase in student
motivation, engendering successful learning outcomes (Mahdizadeh, Biemans et al.
2008). However, for this to occur, instructional and learning strategies related to
computer technology have to be thoroughly scrutinized before adoption, in order to
maximize ICT uptake and encourage learning outcomes (Lowerison, Sclater et al.
2006).
A host of researchers have highlighted various other influential factors governing user
attitudes to the use of ICT in the teaching-learning process. Assessing the impact of
technology is not only closely linked to, but also related to, the attitudes and
approaches of both teachers and learners, and the extent of their impact should be a
main focus (Brett and Nagra 2005). For (Lowerison, Sclater et al. 2006), learning
strategies and techniques are very important and truly effective variables in user
perceptions of how effective computer technology is. Sound teacher and instructor
knowledge and their prompt and timely response were found by a host of researchers
to be significantly influential in learners' satisfaction. Timely intervention and
assistance by instructors when learners face problems on-line does encourage them to
persevere with their e-learning. Belated or delayed intervention by instructors or their
failing to respond affects students confidence and eagerness, and thus impacts
negatively on their learning (Arbaugh 2002; Thurmond, Wambach et al. 2002) and,
similarly, (Soon, Sook et al. 2000). (Arbaugh 2002) agrees: thus, the ability of
instructors to set web-enhanced learning activities and respond to learner queries
promptly will in doubt improve user satisfaction.
Instructor response is defined as how swift it is and how learners perceive that (Sun,
Ray et al. 2008). Similarly, (Piccoli, Ahmad et al. 2001) found that, because of the
essential instructing, tutoring and teaching roles of instructors and their attitude
towards e-Learning, students results can be impacted positively or negatively.(Volery
and Lord 2000) have stated that the attitudes of instructors to distance remote learning
should be considered to gauge how learners have truly behaved because these
attitudes impact heavily on user perceptions in VLE situations.

Chapter 6
104
Consequently we propose the following hypotheses:
H4: The instructor dimension would have a positive effect on the learners' attitude
towards using Blackboard in their courses.
H5: The instructor dimension would have a positive effect on the learners'
achievements.
H6: The instructor dimension would have a positive effect on the learners' way of
using Blackboard.
6.2.3. The technology dimension
This dimension consists of the following:
"Usefulness"
"Ease of use"
"Flexibility"
"Quality" (Hammoud 2010)
Because of their nature, e-learning and VLE (virtual learning environment) courses
are naturally easy to handle and therefore easily accepted by learners, due to their
flexibility in time and location (Arbaugh 2000). (Salmon 2000) finds that VLEs are
god-sent teaching and learning media, as clashes of personalities and other barriers,
physical or otherwise are eliminated, and this facilitates dynamic interaction, and
increases opportunities for cooperative distance learning. (Bangert 2005) adds that,
because of the ease in instantaneous communication at any time day or night and
anywhere or on the move, because of hand-held smart devices, opportunities for
learning are extensively increased. Flexibility in e-Learning courses can increase
learners' perceptions of their efficiency, and often nudges them into accepting and
adopting e-Learning (Sun, Ray et al. 2008).
In addition to the above variables, good quality and sound design of e-Learning
programmes must be given high priority as important factors when considering e-
Learning. These factors are closely linked, and do impact, on learner satisfaction in
VLE environments (Piccoli, Ahmad et al. 2001). Harnessing all the capabilities of the
LMS is very important for VLE success. All the characteristics and variables involved

Chapter 6
105
should be scrutinized and responded to continuously (Piccoli, Ahmad et al. 2001). For
this to happen, technology and Internet quality alike, which are significant factors in
e-Learning, must be dynamically monitored and improved, indeed tailored and
targeted efficiently to improve take-up and learning outcomes (Piccoli, Ahmad et al.
2001). Hardware, i.e. microphones, earphones, electronic boards and smart devices,
added to application software and networks must be of sound quality, in order, not
only to satisfy learners, but also for learners to be seen to be well-motivated and
satisfied with their e-learning and making steady progress using IT.
Various firms and organizations moved for usability testing in the process of product
development in order to satisfy user needs. Hence usefulness is subjective. For (Davis
1989), usefulness is related to perception of the degree to which users believe that
using a particular system would enhance their motivation and job performance. He
also state that the less the effort needed by the user, the higher the perceived belief in
the ease of use of such or such IT system. The easier and the more useful a software
tool is, the more attached the user becomes to it. This in turn would engender positive
learning attitudes towards web-based courses and increase future ICT use (Arbaugh
2000; Arbaugh 2002;Pituch and Lee 2006).
Based on the above discussion, we have developed the following hypotheses:
H7: The technology dimension would have a positive impact on the learners' attitudes
towards using Blackboard in their courses.
H8: The technology dimension would have a positive impact on the learners'
achievements.
H9: The technology dimension would have a positive impact on the learners' way of
using Blackboard.
6.2.4. The university support dimension
In this study University supports dimension consists of two factors:
Training
Technical user support

Chapter 6
106
"The university support factor is the second wing of the technology factor" (Selim
2007). Institutional support is indicated as a very crucial variable for both e-learning
and traditional learning (Salmeron 2009). Technical assistance in the form of or a
help desk is more than essential (Selim 2007). It is mandatory for Higher Education
institutions such as universities and institutes to have an IT technical department
ready to support instructors and learners when they offer e-learning courses or
programmes as organisation is the key to the delivery of online courses (Masrom,
Rahiman et al. 2008; Parsazadeh, Megat et al. 2013). (Al-Busaidi and Al-Shihi 2010)
totally agree.
Higher Education institutions' support consists of various dimensions in the shape of
user training and support and network choices (Moore and Benbasat 1991; Park and
Chen 2007). Training is considered important for end users. This factor helps to
develop some of the online stakeholder group characteristics, especially those of
learners and instructors. Personal development, which enable all stakeholders to
become efficient in online learning (Bussakorn, Praweenya et al. 2012; Puri 2012;
Nisperos 2014).
Training is mandatory for all users. Without it, end users would lack the technological
skills and necessary know-how to use the system (Nelson and Cheney 1987). This
point is critical if learners and instructors alike are to, not only accept, but also master
technology in order to increase motivation and enhance user learning outcomes, and,
by the same token, help education officials reach their educational technology use
targets (Igbaria, Zinatelli et al. 1997). With continuous training updates, learners will
become more and more comfortable in e-learning environments and more skilful in
the use of technology for better learning outcomes (Al-Busaidi 2012). A study by
(ALhomod and Shafi 2013) found that Training, Organizational Commitment,
Management Support and Technical Support are considered important factors for the
success of e-learning.
Compelling evidence was provided by a host of eminent researchers regarding the
importance of student training in using technologies prior and post implementation of
e-learning programmes (Igbaria 1990; Igbaria 1993). The sounder and more thorough
the training is, the better the student take-up and the more positive the results and the
learning outcomes are, because the better their knowledge and awareness, the more

Chapter 6
107
the positive student attachment to technology and its use (Alkharang and Ghinea
2013; Parsazadeh, Megat et al. 2013). One of the reasons that e-learning is not yet
common currency could be the absence of sound training of end users. In such
situation, frustration creeps and this in turn would breed resistance to changes in the
teaching and learning process and even perhaps miss use of the LMS or a reduction in
its use (Solomon, Oludayo et al. 2013). (Tabak and Nguyen 2013) suggest that when
users are aware of the availability of technical support it encourages them to use the
LMS.
Continuous technical support and cyclical training in new products and systems have
been shown to enhance users ability to use LMSs and acceptance of the challenges
faced (Thompson, Higgins et al. 1991). Technical support for all users, students,
academic staff and administrators would improve student perceptions about Higher
Education institutions‟ commitment to invest in the modern resources and practices
that facilitate the usage of remote learning (Al-Busaidi and Al-Shihi 2010). This
would nudge students and other users to continue using the new ICT resources for,
and justify expenditure on and support for, newly introduced technologies and
technical aids in these HE institutions (Lopez. and Manson. 1997). Other scholars and
researchers, the likes of (Igbaria 1990) and (Akour 2009) have also highlighted the
benefits of technical support as important facilitators for users to, not only tackle new
technologies, but to accept them as part of modern learning life.
(Soong, Chan et al. 2001; Alshaher 2013) found that many e-learning projects did not
succeed because of the lack technical support, and stated that research carried out in
HE institutions showed that, with lack of technical support, the implementation of e-
learning systems and programmes is doomed to failure. Hence the availability of
technical support would in no doubt help learner cope with new technologies and in
the process encourage them to master online learning systems which would in turn
enhance their online course performances and achievements (Tabak and Nguyen
2013).
In University support, we have developed the following hypotheses:
H10: The University support dimension has a positive influence on the learners'
attitude towards using the Blackboard system in their courses.

Chapter 6
108
H11: The University support dimension has a positive influence on the learners'
achievements.
H12: The University support dimension has a positive influence on the learners' way
of using the Blackboard system.
Scholars (Webster and Hackley 1997) state that learner performance represents a key
aspect of how effective the leaning process was. The students' use of the LMS
"Blackboard" was gauged by a number of ways. The findings in Chapters 4 and 5
have shown that there was relationship between students' use of Blackboard and their
achievement.
To test these findings, we had to formulate the following hypotheses:
H13: There is relationship between learners' activities on Blackboard and their
achievement.
6.3. Demographic differences
The demographic variables are found to have some sort of role that links them to
perception of E-Learning, acceptance of technology and satisfaction (Okazaki and
Santos 2012; Taha 2014). Age, gender and academic specialization are included in the
research framework as independent variables. (Dwivedi and Lal 2007; Al-Shafi and
Weerakkody 2010;Alkhunaizan and Love 2013), who considered gender and age as
an independent social variables found them to be closely tied to satisfaction with the
LMS under scrutiny.
In the past few years, researchers have even suggested that the leaner‟s age and
gender do play much more important roles than previously thought, when examining
social factors (Dabaj 2009; Mazman 2011;Jan, Lu et al. 2012). The problems seem to
rise when systems are not designed without taking the learner perspective into
consideration, due to differences in terms of moderating variables like age, gender and
experience (Nawaz 2013).

Chapter 6
109
Since a majority of students in the first year fell within the same age group (18-22),
the effect of age was not tested. However, whether gender and academic
specialization, as well as students' way of using Blackboard and their attitude towards
the Blackboard system, would have an influence on their achievements was
investigated.
Gender
Gender has been the subject of much research. Numerous studies have looked at the
impact of this variable on e-learning, user acceptance and use of new technologies
(Cooper 2006; Islam, Rahim et al. 2011;Ashong and Commander 2012). These
scholars found that gender-based differences in education are now recognized as an
important variable in the e-learning process, and, consequently, research focus has
turned to exploring it over time, especially since the number of online female student
users seems to have soared, even overtaking male counterparts. Others on the other
hand, in reviewing gender-related studies, have found that the effects of this variable
were inconclusive on student experiences in distance learning.
A host of studies have shown that gender plays a major role in the acceptance new
technologies and males and females experience online environments differently and
as a result performance, motivation, perception and study habits do differ somewhat
(Chyung 2007; Tawei and Chang 2011). Other studies however, have suggested that
gender does not have any significant impact (Astleitner and Steinberg 2005;
Yukselturk and Bulut 2007;Asiri, Mahmud et al. 2012).
(Asiri, Mahmud et al. 2012) looked at the variables involved when using that the
Jusur Learning Management System (Jusur LMS) in state universities in Saudi Arabia
and discovered that found that three demographic factors play a critical role during
this LMS use. These are: gender , past experience in ICT and, user training.
(Tawei and Chang 2011) explored learning styles in VLEs and looked at the strategies
employed by students and what are factors that could affect these learning styles and
learning strategies in colleges in Taiwan. Their findings have indicated that female
students showed higher motivation than male counterparts.

Chapter 6
110
Similarly a study by (Tsai and Tsai 2010) found that female students were more active
on the internet and tended to interact more with their peers than boys. Males however
tended to be were more exploitative. Hence, this has led to girls experiencing a
richer, more connected and more valuable online learning experience than boys
(Johnson 2011). Additionally, (Rovai and Baker 2005) in looking at the same topic,
have discovered that female students tended to be more sociable online and this has
benefited them more than boys and has made them more satisfied with in using VLEs.
(González-Gómez, Guardiola et al. 2012) also tended to agree.
In conclusion, it seems that, owing to the various conflicting findings regarding
gender and other variables, such as perception, satisfaction, success, communication
behaviour in VLE/e-learning, the arguments cannot be accepted or refuted as more
decisive research needs to be carried out. As gender was found to be an important
social factor in VLEs, the researcher proposes the following hypothesis:
H14. Students' attitude: the Actual Use of Blackboard and their achievements will be
greater amongst males than females.
Discipline type
The relationship between academic practice variations in HE institutions and students‟
academic specialization types has not been thoroughly investigated as yet, and
research on the topic is meagre to say the least. However disciplinary differences
between academics have been broadly investigated. In investigating the topic, (Breen
and Lindsay 2002) discovered that students‟ achievement goals and motivators are
linked, but variety seems to be the key, especially in the realm of discipline area.
(Kemp and Jones 2007) found that one the most influential factors affecting ICT use
and usefulness in education at HE institutions was discipline and subject area. This
means that digital resources usage varies according to the types of disciplines and is
closely related to academic progression.
(Bush, Squire et al. 2008) also explored the subject, indicating that a host of scholars
have noted numerous differences in learning styles, in the academic disciplines in the
sphere of e-learning. Differences were also found to exist between the actual learning

Chapter 6
111
taking place and subjects‟ perceived learning. As VLE and e-learning techniques are
now embraced by many academic disciplines in HE institutions, the onus is on the
developers of digital courses, and the software used to facilitate and encourage take-
up and increase motivation, must take into consideration the varied and different
reactions and behaviours of students in the face of digital courseware, given the
diversity and the choice of academic disciplines offered to them.
Disciplinary differences were found to play a significant role in the matters of how
academic work is organized (Becher and Trowler 2001; Neuman 2001). These
differences seem, and have been shown, to have a significant impact on how
instructors view the ways of passing knowledge to their learners and how graduate
and undergraduate students view their instructors and the type of knowledge and
achievement outcomes sought in their respective discipline areas. Scholars (Kemp and
Jones 2007), have looked at the discipline (specialization) variable and have
concluded that the array and the variety of disciplines taught in HE institutions are
now thought be a contextual influence that affects the digital processes of teaching
and learning.
Research by (Islam, Rahim et al. 2011) looked into the effects, if any, of demographic
factors on the effectiveness of e-learning systems in a HE institutions. The findings
confirmed that age, programme of study and level of education had significant effects
on the effectiveness of E-learning.
A recent study by (Xu and Jaggars 2013) examined how well students coped with
LMSs and VLEs and found that Some have coped well while others struggled,
especially in the areas of English and the social sciences. They found that e-learning
is affected differently across academic subject areas and this may be due to intrinsic
characteristics that make some subjects (disciplines) better suited than others to online
learning. Thus the following hypothesis:
H15. There would have a significant difference between academic disciplines in terms
of students' attitude, students' use of Blackboard and their achievements.

Chapter 6
112
6.4. Methodology
Research design
This study used a combination of qualitative and quantitative approaches. The study
in this chapter was conducted at Taif University. The sample for the study comprised
students from one course (English language). The data was analysed using SPSS
software.
6.5. Data collection instruments
The study has intended to investigate the relationship between the four variables cited
above and students' attitudes to the use of the LMS Blackboard, and in the process test
the hypotheses put forward.
The Blackboard tracking system database was also used to collect part of the data in
similar fashion to that of previous works (Wellman and Marcinkiewicz 2004; Hoskins
and Hooff 2005; Johnson 2005; Hammoud 2010;Al-Busaidi 2012). A weekly
collection of data was made on Blackboard use by learners, about the students' use of
Blackboard starting at the beginning of term. The Blackboard tracking system
provided not only, information about page hits and the communication board use, but
also on the time spent by students using Blackboard.
Students' attitudes to using Blackboard are measured using the questionnaire.
Constructs are in the manner used by pertinent studies with changes in wording, such
as (Akour 2009; Hammoud 2010;Al-Busaidi 2012) (Appendix 5).

Chapter 6
113
6.6. Participants
A cohort of undergraduates took part in this study to gauge the Blackboard LMS that
has been used in conjunction with face-to-face courses at Taif University. The sample
was made up from three different subject areas: Sciences, Humanities and Health
sciences. The data collection took place during term time. Students were divided into
three groups according to what they were studying. Each group comprised 100
students from each gender. Out of the 300 students who received the questionnaire,
118 completed and returned it. Therefore the final sample size was approximately
39.3% of the original sample, as shown in Table 6.1.
6.1: The study sample
Total Health sciences
M F
Humanities
M F
Sciences
M F
Subject
Gender
300
50 50
50 50
50 50
Number of the
student in the
subject areas
118
20 22
17 20
20 19
Number of
student who
completed the
questionnaire
39.3%
35.6%
31.4%
33.1% Response rate %
6.7. Procedure
The LMS Blackboard was used in all subject areas. Students traditional classroom
lectures with access course materials using Blackboard which made communication
with each other and with instructors possible a click away. Assignments, workshops
and marking schemes for every course were available online at any time. Students
were monitored and tracked using the LMS.

Chapter 6
114
The English language course was chosen because it was the one that had been taught
to all students in all the three subject areas at the university. It was the only course
taught to all students at the university. The same LMS was used under the same
conditions and students could access all the information needed and do their
assignments online.
Although traditional lectures were also given weekly, students had to use Blackboard
for everything else: course materials, assessments, assignments, communications with
peers and instructors.
The tracking system information was saved on a weekly basis. The questionnaire was
filled in by students during one of their lectures and was supplemented by further
information collected from the tracking system. The questionnaire was administered
towards the end of the first semester before exam time. Students were asked to give
their ID numbers and not their names. Only questionnaires that had the student's
number were used. The aim was to match students' attitudes, achievements and their
use of the LMS Blackboard, in order to fully examine the relationships governing not
only the dependent variables, but also the students' perceptions of those independent
variables included in the study framework.
6.8. Data analysis
Data gathered at the end of the semester related to the three undergraduate level
courses supported by the Blackboard LMS. The pertinent information of interest to
the heart of the research was extracted from the course information, the Blackboard
tracking system, the end of course grade (performance) and the questionnaire data.
Students' general use of Blackboard was measured by the number of times each
student visited the course materials using Blackboard, the time they spent using
Blackboard and their use of the discussion boards. Student achievements were
measured by the grades they obtained for the observed subjects. Students' attitudes
towards Blackboard were measured using a 5-point Likert scale questionnaire. A 5
point Likert scale was used to measure the independent variables (learner dimension,

Chapter 6
115
instructor dimension, technology dimension, university support dimension) of the
study framework.
Reliability Test:
In this chapter, This study has used the reliability analysis suggested by (Cronbach‟s
alpha) with the aim of testing the internal consistency for dimensions. According to
scholars (Gliem and Gliem, 2003), when one decides to use Likert-type scales, it is
imperative that one tests and reports Cronbach‟s alpha coefficient for internal
consistency reliability.
A total number of 30 questionnaires were distributed. The questionnaire was
distributed to first-year students at Taif University. Three questionnaires were
discarded due to being incomplete. Cronbach‟s alpha coefficient for internal
consistency reliability for any scales or subscales used was then calculated. A value
that is “0.7 or higher suggests good reliability. Reliability between 0.6 and 0.7 may be
acceptable provided that other indicators of a model’s construct validity are good.”
(Hair, Black et al. 1998). The Cronbach‟s alpha values ranged from .717 to .826,
which are all above the 0.7 level. The results demonstrated that the questionnaire was
a reliable measurement instrument and could be used in the research, as shown in
Table 6.2 below.
6.2: Reliability of measurements
Constructs N number of items Cronbach’s Alpha(α)
Learner dimension 27 4 0.803
Instructor dimension 27 8 0.717
Technology dimension 27 8 0.734
University support 27 6 0.826
Students attitude 27 7 0.792

Chapter 6
116
Everything was done in complete anonymity and the study records were kept strictly
confidential. Identifying information about learners was not disclosed or referenced in
an identifiable way either verbally or in written form.
SPSS software was used for analysis. ANOVA and T-tests were carried out to identify
the effect of demographic factors on students' attitudes to Blackboard, actual use and
final achievements. The mean was measured for the independent demographic
variables and the T-test evaluated the differences in means between two groups.
ANOVA (post-hoc test) was used for academic specialization, whilst the T-test was
used for gender.
Correlation is one of the most important ways to explain the relationships between
variables (Bryman and Cramer 2005). Pearson’s Correlation Coefficient between
variables point out the direction, strength and the significance of a relationship. ( r)
value shows the direction of the linear relationship, significance and the strength
between variables to be evaluated. The significance of (p) gives us gives us the
confidence in if there is a relationship between two variables. Pearson’s correlation is
beneficial in understanding whether there is any correlation between the measured
variables. Also, we can use Pearson’s correlation to clarify any the fundamental
advantages of correlation; it displays the strength and the direction of the relationship.
Therefore, the gauges of learners' attitude to Blackboard use, their achievement and
use of Blackboard in the three specializations were correlated using Pearson’s
Coefficient with the gauges of instructor construct, learner construct, technology
construct, and university support construct. The Significant relationships are found
between the measured variables. As shown in (Tables 6-5, next).

Chapter 6
117
6.9. Findings
The English language courses in three subject areas were coded S1, S2, and S3, the
reason for that being confidentiality. S1 is a science specialization, S2 is a Humanities
specialization and S3 is a Health science specialization. To test the model proposed in
this study, only data from students who completed the questionnaire and provided
their ID numbers were used. This resulted in data for a total of 118 participants used.
Table 6.3 shows the mean and standard deviations of the five variables gauged by the
questionnaire.
6.3: Mean and SD of the variables measured by the questionnaire
Subject areas Attitude
M SD
Learner
dimension
M SD
Instructor
dimension
M SD
Technology
dimension
M SD
University
support
M SD
S1 (39) 3.58 0.94 3.41 0.78 3.95 0.49 3.39 0.72 3.18 0.70
S2 (37) 3.25 1.15 3.48 0.53 3.98 0.59 3.19 0.56 2.71 0.50
S3 (41) 3.13 1.08 3.14 0.73 3.95 0.47 3.32 0.66 2.89 0.46
An independent sample t-test was conducted to investigate the impact of gender on
learners' attitude towards using Blackboard, learners' actual use and their
achievements on Blackboard. The results in Table 6.4 indicate that males significantly
differed from females with respect to their attitude towards using Blackboard
(p<0.01). However, the impact of gender on learners' actual use of Blackboard and
their achievements was not significant, as can be seen in Tables 6.5 and 6.6.
6.4: Students’ attitudes toward the use of Blackboard with regard to gender
Area gender N Mean Std. Deviation t df Sig.
Attitude Male 57 3.81 0.86 5.219 114.71 .000
Female 61 2.89 1.06

Chapter 6
118
6.5: Results of the t-test for students' achievement with regard to gender
Area gender N Mean Std. Deviation t df Sig.
Coursework Male 57 11.98 1.747 0.937 109.58 .351
Female 61 11.71 1.465
Exam Male 57 20.86 2.279 1.651 115.57 .102
Female 61 20.16 2.296
6.6: Results of the t-test for students' actual use of Blackboard with regard to
gender
Area gender N Mean Std. Deviation t df Sig.
Homepage Male 57 2.95 1.11 .077 114.45 .939
Female 61 2.93 1.33
Time Male 57 1.65 0.73 .505 115.38 .614
Female 61 1.57 0.85
Read Male 57 1.27 0.94 .766 113.86 .964
Female 61 1.26 0.87
Post Male 57 0.25 0.30 .308 110.14 .289
Female 61 0.31 0.26
Content Male 57 3.20 1.37 .558 113.05 .123
Female 61 2.47 1.25
Files Male 57 1.60 0.68 .416 116.11 .235
Female 61 1.13 0.70
One way ANOVA: a post-hoc test was performed to examine the effect of academic
specialization on learners' attitude towards using Blackboard, their actual use and
their achievements on Blackboard. The findings in Table 6.9 reveal that academic
specialization had a significant effect on learners' actual use of Blackboard (p<0.05)
for all variables, while it did not have any effect on learners' attitude towards using
Blackboard or their achievements, as shown in Tables 6.7 and 6.8.
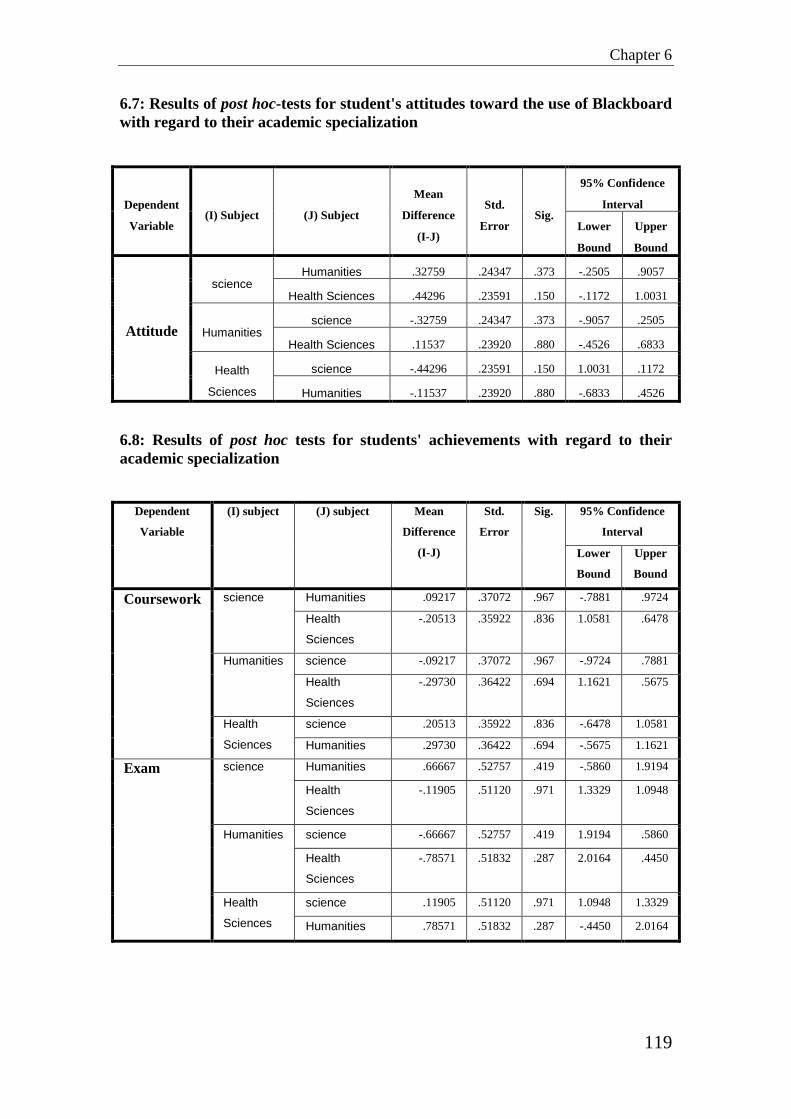
Chapter 6
119
6.7: Results of post hoc-tests for student's attitudes toward the use of Blackboard
with regard to their academic specialization
Dependent
Variable (I) Subject (J) Subject
Mean
Difference
(I-J)
Std.
Error Sig.
95% Confidence
Interval
Lower
Bound
Upper
Bound
Attitude
science Humanities .32759 .24347 .373 -.2505 .9057
Health Sciences .44296 .23591 .150 -.1172 1.0031
Humanities science -.32759 .24347 .373 -.9057 .2505
Health Sciences .11537 .23920 .880 -.4526 .6833
Health
Sciences
science -.44296 .23591 .150 1.0031 .1172
Humanities -.11537 .23920 .880 -.6833 .4526
6.8: Results of post hoc tests for students' achievements with regard to their
academic specialization
Dependent
Variable
(I) subject (J) subject Mean
Difference
(I-J)
Std.
Error
Sig. 95% Confidence
Interval
Lower
Bound
Upper
Bound
Coursework science Humanities .09217 .37072 .967 -.7881 .9724
Health
Sciences
-.20513 .35922 .836 1.0581 .6478
Humanities science -.09217 .37072 .967 -.9724 .7881
Health
Sciences
-.29730 .36422 .694 1.1621 .5675
Health
Sciences
science .20513 .35922 .836 -.6478 1.0581
Humanities .29730 .36422 .694 -.5675 1.1621
Exam science Humanities .66667 .52757 .419 -.5860 1.9194
Health
Sciences
-.11905 .51120 .971 1.3329 1.0948
Humanities science -.66667 .52757 .419 1.9194 .5860
Health
Sciences
-.78571 .51832 .287 2.0164 .4450
Health
Sciences
science .11905 .51120 .971 1.0948 1.3329
Humanities .78571 .51832 .287 -.4450 2.0164
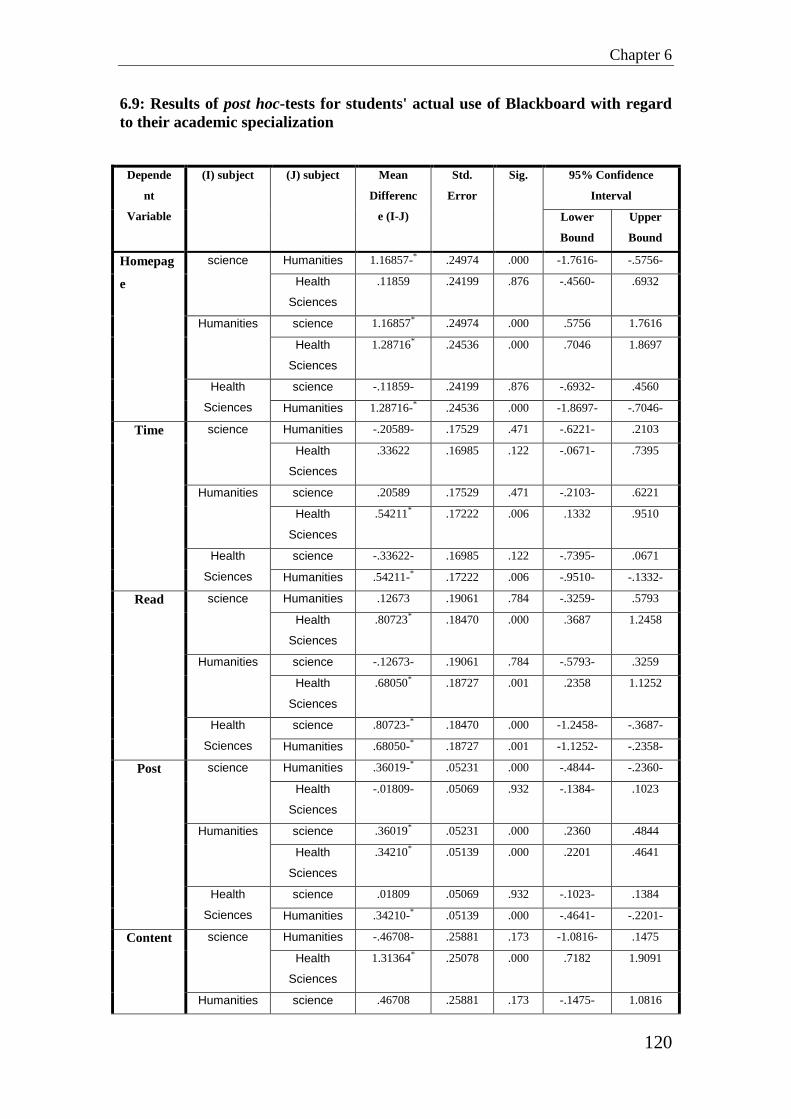
Chapter 6
120
6.9: Results of post hoc-tests for students' actual use of Blackboard with regard
to their academic specialization
Depende
nt
Variable
(I) subject (J) subject Mean
Differenc
e (I-J)
Std.
Error
Sig. 95% Confidence
Interval
Lower
Bound
Upper
Bound
Homepag
e
science Humanities 1.16857-* .24974 .000 -1.7616- -.5756-
Health
Sciences
.11859 .24199 .876 -.4560- .6932
Humanities science 1.16857* .24974 .000 .5756 1.7616
Health
Sciences
1.28716* .24536 .000 .7046 1.8697
Health
Sciences
science -.11859- .24199 .876 -.6932- .4560
Humanities 1.28716-* .24536 .000 -1.8697- -.7046-
Time science Humanities -.20589- .17529 .471 -.6221- .2103
Health
Sciences
.33622 .16985 .122 -.0671- .7395
Humanities science .20589 .17529 .471 -.2103- .6221
Health
Sciences
.54211* .17222 .006 .1332 .9510
Health
Sciences
science -.33622- .16985 .122 -.7395- .0671
Humanities .54211-* .17222 .006 -.9510- -.1332-
Read science Humanities .12673 .19061 .784 -.3259- .5793
Health
Sciences
.80723* .18470 .000 .3687 1.2458
Humanities science -.12673- .19061 .784 -.5793- .3259
Health
Sciences
.68050* .18727 .001 .2358 1.1252
Health
Sciences
science .80723-* .18470 .000 -1.2458- -.3687-
Humanities .68050-* .18727 .001 -1.1252- -.2358-
Post science Humanities .36019-* .05231 .000 -.4844- -.2360-
Health
Sciences
-.01809- .05069 .932 -.1384- .1023
Humanities science .36019* .05231 .000 .2360 .4844
Health
Sciences
.34210* .05139 .000 .2201 .4641
Health
Sciences
science .01809 .05069 .932 -.1023- .1384
Humanities .34210-* .05139 .000 -.4641- -.2201-
Content science Humanities -.46708- .25881 .173 -1.0816- .1475
Health
Sciences
1.31364* .25078 .000 .7182 1.9091
Humanities science .46708 .25881 .173 -.1475- 1.0816

Chapter 6
121
Health
Sciences
1.78073* .25427 .000 1.1770 2.3845
Health
Sciences
science -1.31364-* .25078 .000 -1.9091- -.7182-
Humanities -1.78073-* .25427 .000 -2.3845- -1.1770-
Files science Humanities .23545 .15813 .300 -.1400- .6109
Health
Sciences
.59364* .15323 .001 .2298 .9575
Humanities science -.23545- .15813 .300 -.6109- .1400
Health
Sciences
.35819 .15536 .059 -.0107- .7271
Health
Sciences
science -.59364-* .15323 .001 -.9575- -.2298-
Humanities -.35819- .15536 .059 -.7271- .0107
*. The mean difference is significant at the 0.05 level.
6.9.1. Findings from science specialization:
Learners' used Blackboard widely in this specialization (S1). Many of the learners'
used different pages, such as ''home page'', ''content page'', ''assignment page'' and the
''discussion board'', as shown in Table 6.10.
6.10: Descriptive statistics of learners' use of Blackboard for S1
Std. Deviation Mean Maximum Minimum N
25.47 24.85 118 2 39 Sessions
4:31 3:44 21:05 0 39 Total time
25.34 16.38 96 0 39 Read messages
1.47 34 11 0 39 Post messages
93.29 103.42 423 1 39 Content folder
31.17 43.36 132 0 39 files
This study investigated the correlation between the pertinent variables using the
Pearson's correlation test.
There was a significant positive correlation (r=0.291, p=0.01) between learners'
perception of the learner variable and their attitude to using Blackboard, as indicated
in Table 6.11. However, there was no significant correlation between the learner

Chapter 6
122
variable and learners' achievement or their use of Blackboard, as indicated in Table
6.12.
Similarly, a significant correlation (r=0.353, p=0.01) was found between learners'
perception of the instructor variable and their attitude to the LMS Blackboard, as
indicated in Table 6.11. Various other correlations were found to exist when the LMS
was used as indicated below: the number of times learners accessed Blackboard
(r=0.199, p=0.01), the total time learners spent using Blackboard (r=0.259, p=0.01),
the number of messages learners read on the discussion boards (r=0.188, p=0.05), as
indicated in Table 6.13.
However, there was no significant correlation between the instructor variable and
coursework grades (this is an indicator of learners' achievement), as indicated in Table
6.12.
6.11: Correlations across the four independent variables and the students'
attitudes towards Blackboard in S 1
Learner
dimension
Instructor
dimension
Technology
dimension
University
support
Attitude Pearson Correlation .291**
.353**
.244**
.172*
Sig. (2-tailed) .000 .000 .001 .024
N 39 39 39 39
**. Correlation is significant at the 0.01 level (2-tailed).
*. Correlation is significant at the 0.05 level (2-tailed).
6.12: Correlations across the four independent variables and the students'
achievement in S1
Learner
dimension
Instructor
dimension
Technology
dimension
University
support
Course
work
Pearson Correlation .109 .136 .081 .044
Sig. (2-tailed) .156 .076 .291 .565
N 119 119 119 119
exam
Pearson Correlation .148 .099 .050 .108 Sig. (2-tailed) .058 .195 .518 .157 N 39 39 39 39
**. Correlation is significant at the 0.01 level (2-tailed). *. Correlation is significant at the 0.05 level (2-tailed).

Chapter 6
123
There was a significant positive correlation (r=0.244, p=0.01) between learners'
perception of the technology variable and their attitude to the LMS Blackboard, as
shown in Table 6.11. Also, significant correlation was found between learners'
perception of the technology variable and the number of times learners' accessed
blackboard (r= 0.212, p= 0.01), the total time learners' spent using blackboard
(r=0.198, p=0.01), the number of messages learners' read on the discussion boards
(r=0.173, p=0.05), and the number of times students accessed the content folder
(r=0.163, p=0.05), as shown in Table 6.13, while there was no significant correlation
between the technology variable and their exam grades, as indicated in Table 6.12.
As for previously there was some significant correlations for some variables and none
for others as shown below. A correlation (r=0.172, p=0.05) between learners'
perception of the university support variable and their attitude to Blackboard (Table
6.11), but no significant correlation was to be found between the institutional support
variable and learner achievement or their use of Blackboard, as indicated in Tables
6.12 and 6.13.
6.13: Correlations across the four independent variables and the students' use of
Blackboard in S1
Sessions Total
Time
Messages
read
Messages
post
Submit
assessment
Content
folder Files
learner
dimension
Pearson
Correlation .054 .119 -.107- .027 .143 .044 .111
Sig. (2-tailed) .559 .198 .246 .770 .061 .565 .229
N 39 39 39 39 39 39 39 Instructor
dimension
Pearson
Correlation .199
** .259
** .188
* .067 .004 .003 .081
Sig. (2-tailed) .009 .001 .014 .381 .968 .972 .291 N 39 39 39 39 39 39 39
Technology
dimension
Pearson
Correlation .212
** .198
** .173
* .119 -.029- .163
* -.018-
Sig. (2-tailed) .005 .009 .023 .198 .751 .033 .844 N 39 39 39 39 39 39 39
University
support
Pearson
Correlation .096 .145 .104 .126 -.019- .073 .030
Sig. (2-tailed) .211 .058 .173 .100 .840 .339 .698 N 39 39 39 39 39 39 39
**. Correlation is significant at the 0.01 level (2-tailed).
*. Correlation is significant at the 0.05 level (2-tailed).

Chapter 6
124
Table 6.14 displays the significant positive correlations between learners'
achievement and their use of Blackboard in science specialization.
6.14: Correlations across learners' grades and their use of Blackboard in S 1
Sessions
Total
Time
Messages
read
Messages
post
Submit
assessment
Content
folder Files
Course
work
Pearson
Correlation .301
** .383
** .213
** .202
** .078 .166
* .407
**
Sig. (2-
tailed) .000 .000 .005 .008 .307 .030 .000
N 39 39 39 39 39 39 39
exam
Pearson
Correlation .421
** .451
** .289
** .272
** .198
** .225
** .342
**
Sig. (2-
tailed) .000 .000 .000 .000 .009 .003 .000
N 39 39 39 39 39 39 39
**. Correlation is significant at the 0.01 level (2-tailed). *. Correlation is significant at the 0.05 level (2-tailed).
6.9.2. Findings from Humanities specialization:
Blackboard was extensively used in this specialization (S2), as shown in Table 6.15.
6.15: Descriptive statistics concerning learners' use of Blackboard for S2
Std. Deviation Mean Maximum Minimum N
41.83 67.72 232 19 37 Sessions
5:52 12:53 23:39 0:31 37 Total time
40.36 44.51 129 0 37 Read messages
1 .44 6 0 37 Post messages
54.73 96.17 269 42 37 Content folder
71.09 145.28 312 51 37 files
A significant correlation was found only between the learner variable and the learners'
use of Blackboard: the number of times learners' accessed blackboard (r=0.236, p<
0.01) and the total time learners' spent using Blackboard (r=0.196, p>0.05), as
indicated in Table 6.18.

Chapter 6
125
There was no correlation between instructor and any of the other variables.
There was only a significant correlation between the technology variable and learners'
attitude towards using Blackboard (r=0.371, p<0.01), as shown in Table 6.16.
6.16: Correlations across the four independent variables and the students'
attitudes towards Blackboard in S2
Learner
dimension
Instructor
dimension
Technology
dimension
University
support
Attitude Pearson Correlation .073 .047 .371**
.251**
Sig. (2-tailed) .342 .539 .000 .001
N 37 37 37 37
**. Correlation is significant at the 0.01 level (2-tailed). *. Correlation is significant at the 0.05 level (2-tailed).
6.17: Correlations across the four independent variables and the students'
achievement in S2
Learner
dimension
Instructor
dimension
Technology
dimension
University
support
Course
work
Pearson Correlation .145 .027 .078 .090
Sig. (2-tailed) .058 .770 .311 .242
N 37 37 37 37
exam
Pearson Correlation .126 .083 .139 .106 Sig. (2-tailed) .100 .277 .069 .166 N 37 37 37 37
**. Correlation is significant at the 0.01 level (2-tailed). *. Correlation is significant at the 0.05 level (2-tailed).
There was a positive significant correlation (r=0.251, p>0.01) between learners'
perception of the university support variable and their attitude towards using
Blackboard, as shown in Table 6.16. Also, there was a significant positive correlation
between the university support variable and the learners' use of Blackboard, as
follows: the number of times learners' accessed Blackboard (r=0.266, p< 0.01), the
total time learners' spent using Blackboard (r=0.214, p<0.01), the number of
messages learners' read on the discussion boards (r= 0.191, p<0.05), and the number

Chapter 6
126
of messages learners' posted on the discussion boards (r=0.164, p<0.05), as shown in
Table 6.18.
6.18: Correlations across the four independent variables and the students' use of
Blackboard in S2
Sessions Total
Time
Messages
read
Messages
post
Submit
assessment
Content
folder Files
learner
dimension
Pearson
Correlation .236
** .196
* .065 .099 -.020- .040 .098
Sig. (2-
tailed) .002 .010 .398 .198 .825 .606 .288
N 37 37 37 37 37 37 37 Instructor
dimension
Pearson
Correlation .090 .107- .054 .027 .003 .003 .119
Sig. (2-
tailed) .242 .246 .559 .770 .972 .972 .198
N 37 37 37 37 37 37 37 Technology
dimension
Pearson
Correlation .108 .149 .065 .100 .083 .139 .004
Sig. (2-
tailed) .160 .050 .398 .194 .277 .069 .968
N 37 37 37 37 37 37 37 University
support
Pearson
Correlation .266
** .214
** .191
* .164
* .003 .098 .111
Sig. (2-
tailed) .000 .005 .012 .031 .972 .288 .229
N 37 37 37 37 37 37 37
**. Correlation is significant at the 0.01 level (2-tailed). *. Correlation is significant at the 0.05 level (2-tailed).
Table 6.19 displays a significant positive correlation between learners' achievement
and their use of Blackboard (just in exam) in Humanities specialization.
6.19: Correlations across the learners' grades and their use of Blackboard in S2
Sessions
Total
Time
Messages
read
Messages
post
Submit
assessment
Content
folder Files
Course
work
Pearson
Correlation .112 .064 .135 .135 .108 .053 .118
Sig. (2-
tailed) .144 .404 .077 .077 .160 .487 .122
N 37 37 37 37 37 37 37

Chapter 6
127
exam
Pearson
Correlation .357
** .409
** .220
** .189
* .152
* .240
** .264
**
Sig. (2-
tailed) .000 .000 .004 .013 .047 .002 .000
N 37 37 37 37 37 37 37
**. Correlation is significant at the 0.01 level (2-tailed). *. Correlation is significant at the 0.05 level (2-tailed).
6.9.3. Findings from Health science specialization:
Blackboard was widely used in this specialization (S3), as shown in Table 6.20.
6.20: Descriptive statistics of learners' use of Blackboard for S3
Std. Deviation Mean Maximum Minimum N
33.91 68.74 175 21 42 Sessions
5:38 9:06 24:22 2:04 42 Total time
22 45 105 0 42 Read messages
2.41 .79 14 0 42 Post messages
116.46 286.24 445 76 42 Content folder
26.23 78.81 139 19 42 files
Positive significant correlations were for some variables and none were found for
others as shown in Table 6.21 below. The figures are as follows: learner variable and
their coursework (r=0.222, p>0.01) and exam grades (r=0.171, p>0.05), as shown in
Table 6.22. There was also a positive significant correlation between students'
perception of the learner variable and the students' use of Blackboard, namely the
number of times learners accessed Blackboard (r= 0.282, p>0.01), the total time
learners spent using Blackboard (r=0.202, p>0.01), the number of messages that
learners read on the discussion boards (r=0.193, p>0.05), the number of messages
learners posted on the discussion boards (r=0.185, p<0.05) and the number of times
that learners accessed or saved a file (r=0.192, p>0.05), as shown in Table 6.23.

Chapter 6
128
There was a significant correlation between students' perceptions of instructor
variable and their attitude to the LMS Blackboard (r=0.453, p>0.01), as shown in
Table 6.21. A significant correlation was also found between students' perceptions of
the instructor variable and coursework grades (r=0.201, p>0.01), as shown in Table
6.22. A significant correlation was found between students' perception of the
instructor variable and the number of times Blackboard was accessed (r= 0.218,
p>0.01) and the number of messages that students read on the discussion boards
(r=0.161, p>0.05), as shown in Table 6.23.
6.21: Correlations across the four independent variables and the students'
attitudes towards Blackboard in S3
Learner
dimension
Instructor
dimension
Technology
dimension
University
support
Attitude Pearson Correlation .168* .453
** .381
** .078
Sig. (2-tailed) .027 .000 .000 .311
N 42 42 42 42
**. Correlation is significant at the 0.01 level (2-tailed). *. Correlation is significant at the 0.05 level (2-tailed).
6.22: Correlations across the four independent variables and the students'
achievements in S3
Learner
dimension
Instructor
dimension
Technology
dimension
University
support
Course
work
Pearson Correlation .222**
.201**
.064 -.019
Sig. (2-tailed) .003 .008 .404 .803
N 42 42 42 42
exam
Pearson Correlation .171* .135 .111 .098
Sig. (2-tailed) .025 .077 .145 .202 N 42 42 42 42
**. Correlation is significant at the 0.01 level (2-tailed). *. Correlation is significant at the 0.05 level (2-tailed).
There was only a significant correlation between the technology variable and
learners' attitude towards using Blackboard (r=0.381, p<0.01), as shown in Table
6.21.

Chapter 6
129
The university support variable was found to only correlate with students‟ use of
Blackboard, as follows: the number of times students accessed Blackboard (r= 0.266,
p>0.01), the total time students spent using Blackboard (r=0.197, p>0.01) and the
number of messages that students read on the discussion boards (r=0.152, p>0.05), as
shown in Table 6.23.
6.23: Correlations across the four independent variables and the students' use of
Blackboard in S3
Sessions Total
Time
Messages
read
Messages
post
Submit
assessment
Content
folder Files
learner
dimension
Pearson
Correlation .282
** .202
** .193
* .185
* .098 -.020- .192
*
Sig. (2-
tailed) .000 .008 .011 .015 .288 .825 .012
N 42 42 42 42 42 42 42 Instructor
dimension
Pearson
Correlation .218
** .111 .135 .161
* .119 .044 .109
Sig. (2-
tailed) .004 .229 .077 .035 .198 .565 .156
N 42 42 42 42 42 42 42 Technology
dimension
Pearson
Correlation .098 .003 -.138- .004 .054 .027 -.110-
Sig. (2-
tailed) .288 .972 .134 .968 .559 .770 .234
N 42 42 42 42 42 42 42 University
support
Pearson
Correlation .266
** .197
** .152
* -.028- .078 .136 -.107-
Sig. (2-
tailed) .000 .010 .046 .765 .311 .076 .245
N 42 42 42 42 42 42 42
**. Correlation is significant at the 0.01 level (2-tailed). *. Correlation is significant at the 0.05 level (2-tailed).
Table 6.24 displays a significant positive correlation between learners' achievement
and their use of Blackboard in Health science specialization.
6.24: Correlations across learners' grades and their use of Blackboard in S3
Sessions
Total
Time
Messages
read
Messages
post
Submit
assessment
Content
folder Files
Course
work
Pearson
Correlation .391
** .247
** .373
** .153
* .190
* .186
* .179
*
Sig. (2-
tailed) .000 .001 .000 .044 .012 .014 .019
N 42 42 42 42 42 42 42
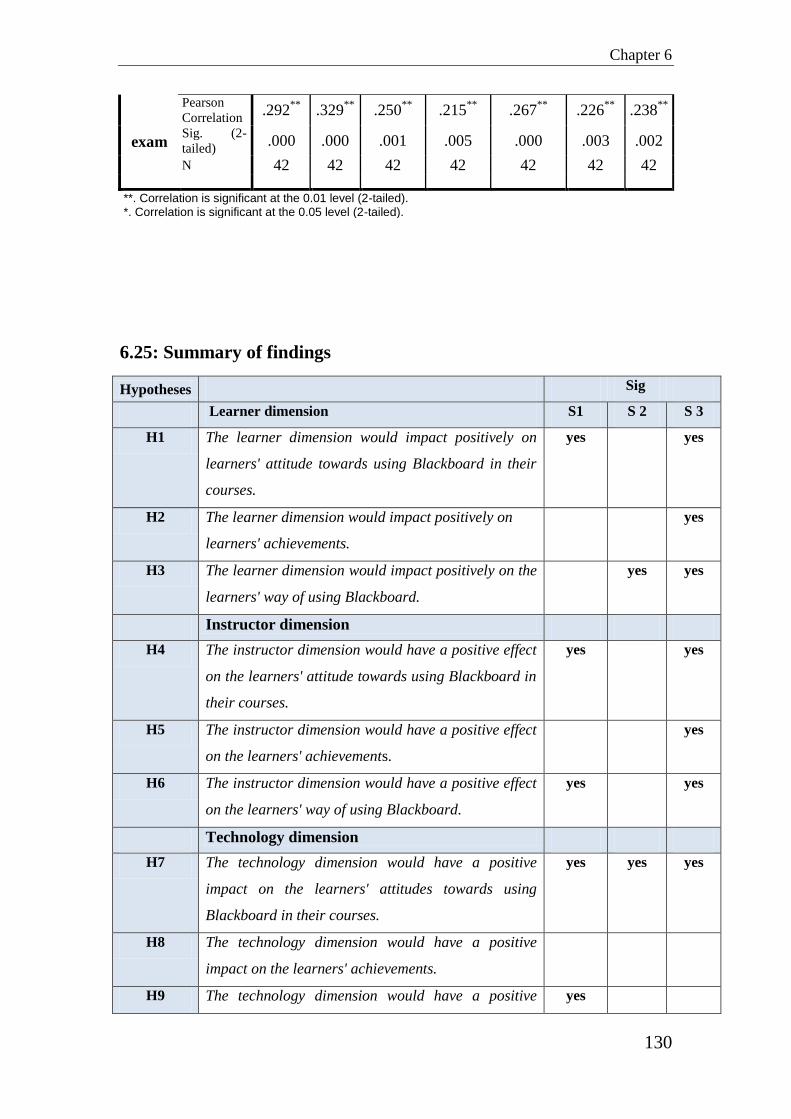
Chapter 6
130
exam
Pearson
Correlation .292
** .329
** .250
** .215
** .267
** .226
** .238
**
Sig. (2-
tailed) .000 .000 .001 .005 .000 .003 .002
N 42 42 42 42 42 42 42
**. Correlation is significant at the 0.01 level (2-tailed). *. Correlation is significant at the 0.05 level (2-tailed).
6.25: Summary of findings
Hypotheses Sig
Learner dimension S1 S 2 S 3
H1 The learner dimension would impact positively on
learners' attitude towards using Blackboard in their
courses.
yes yes
H2 The learner dimension would impact positively on
learners' achievements.
yes
H3 The learner dimension would impact positively on the
learners' way of using Blackboard.
yes yes
Instructor dimension
H4 The instructor dimension would have a positive effect
on the learners' attitude towards using Blackboard in
their courses.
yes yes
H5 The instructor dimension would have a positive effect
on the learners' achievements.
yes
H6 The instructor dimension would have a positive effect
on the learners' way of using Blackboard.
yes yes
Technology dimension
H7 The technology dimension would have a positive
impact on the learners' attitudes towards using
Blackboard in their courses.
yes yes yes
H8 The technology dimension would have a positive
impact on the learners' achievements.
H9 The technology dimension would have a positive yes

Chapter 6
131
impact on the learners' way of using Blackboard.
University support dimension
H10 The University support dimension has a positive
influence on the learners' attitude towards using the
Blackboard system in their courses.
yes yes
H11 The University support dimension has a positive
influence on the learners' achievements.
H12 The University support dimension has a positive
influence on the learners' way of using the Blackboard
system.
yes yes
H13 H13: There is relationship between learners'
activities on Blackboard and their achievement.
yes yes yes
6.10. Discussion
This research was carried out to develop a framework in order to explore the factors
critical to the use of the LMS „Blackboard‟ by a cohort of undergraduate students in
the University of Taif in the kingdom of Saudi Arabia. The aim was to examine what
links and relationships are in play between the framework independent variables
(learner, instructor, technology and university support dimensions) and the dependent
variables (student attitudes to the LMS use, their achievements, and their actual use of
Blackboard). The results were presented in two sections:
An analysis of the demographic differences, namely gender and subject areas as social
variables were put under a one-way ANOVA and t- tests. The results indicated that
there are significant differences in terms of gender in their attitudes to the use of the
LMS. In addition, there are significant differences as for the achievements between
the genders.
A discussion on the relation between all framework variables is mainly based on the
correlation relationships that were found to be positive between the variables, as
shown in Figure 6.3 below.

Chapter 6
132
Figure 6.3: The significant relationships in the framework
6.10.1. Attitudes
The findings have indicated that learners have generally shown a positive attitude
when using the LMS (Blackboard) in all subject areas. Regarding the learner
dimension there was a significant positive correlation with respect to learner attitudes
towards in two of the observed specializations (S1 and S3). The learner construct
consisted of three variables, in the form of interaction with one other, learner ability to
use the internet and the LMS itself. This greater is the use, the more is the learner
attitude is positive. Internet experience seems to be the key in shaping attitudes. This
finding are congruent with the results of previous research carried out by (Hammoud
2010; Al-Busaidi 2012). (Paris 2004) who states web know how does influence
student attitudes positively. Similarly, (Ando, Takahira et al. 2004) has also
concluded that an increase in the daily use of the web does in fact increase learner
motivation to study, their interest and self-confidence.
Learner
dimension
Instructor
dimension
Technology
dimension
University
support
dimension
Students attitude
towards
Blackboard
Students'
achievements
Students' use of
Blackboard
S2, S3
S1
S3
1
S1, S3
S1, S3
S3
1 S1,S2,S3
S1, S2
S2, S3
S1, S3

Chapter 6
133
The instructor dimension saw a significant positive correlation with respect to learner
attitude to the use of Blackboard in two of the observed specializations (S1 and S3).
The technical competence of instructors, the way of providing materials on
Blackboard and their interaction with learners made up the instructor construct.
Previous studies suggested that instructor interaction with students is considered an
important factor. (Swan 2001; Ali and Ahmad 2011) found that instructor interaction
with students had quite an impact on online learning.
The study findings do illustrate that the way of providing material on Blackboard and
the technical competence of the instructor and their interaction with learners do affect
students' attitudes to the LMS. (Sun, Ray et al. 2008) found that instructor activity in
online learning does impact on students' attitude to the system used and this in turn
affects learner satisfaction and motivation. Online courses run by active and
motivated and experienced instructors tend to breed learners satisfaction and increase
their motivation (Kim and Moore 2005; Hammoud 2010).
The technology dimension had a significant positive correlation with students'
attitudes towards using Blackboard in the three specializations (S1, S2, S3) that were
observed. The technology construct included four factors: namely students' perception
of the usefulness, ease of use, the LMS flexibility and quality used to support their
courses. A similar finding were obtained by a study by (Hammoud 2010), which have
indicated that a positive correlation meant higher grades which in turn brought about
a more positive attitude to using Blackboard.
A study by (Bangert 2005) has found that students appreciated the flexibility in
accessing web-based courses anytime anywhere. This finding has also suggested that
the more the LMS is found useful and easy to use by learners, the more positive their
attitude is keeping with it. This result means that students would be using the LMS
Blackboard more and more when they realize that it is an easy system where all sort
of information is easy to access. This is in agreement with previous studies findings
(Chi-Hong and Yuen-Yan 2003; Minton and Willett 2003; Jurczyk, Kushner-Benson
et al. 2004; Hammoud 2010;Al-Busaidi 2012).
As for the university support dimension, it was found that there was a significant
correlation regarding learners' attitude to the LMS Blackboard in two of the observed

Chapter 6
134
specializations (S1 and S2). Two factors make up this construct: students' perception
of training and technical support when using Blackboard. This result means that
students who have received good training in how to use Blackboard and receive
technical support in using any system will in doubt have a positive attitude when
using it for their learning. This finding is in agreement with previous research
(Alkharang and Ghinea 2013; Solomon, Oludayo et al. 2013). This indicates that
technical support in using any LMS and being well trained would make learners more
aware that such system cannot be but an aid or more exactly a valuable facilitator.
This result also supports the findings of (Hammoud 2010; Al-Busaidi 2012;
Parsazadeh, Megat et al. 2013;Nisperos 2014).
6.10.2. Use of the Blackboard system
The learner dimension: a significant positive correlation between this construct and
the learner use of the said LMS for two of the specializations (S2 and S3). This
indicates that learner experience is a key variable here because the more experienced
learners are in using the web, the longer they keep with the LMS Blackboard and
continue to use it. Peer interactions using the LMS Blackboard was found to enhance
learner perception of how useful Blackboard is therefore make them more satisfied.
Thus, students who liked interaction with others via Blackboard used it more than
students who did not. A study by (Chi-Hong and Yuen-Yan 2003) suggested that
computer skills play a significant role in learner progress and achievement when using
e-learning. Furthermore, (Kalifa and Lam 2002) have indicated that learner interaction
in web-based learning was one of the most significant variables in the learning
process.
The instructor dimension showed a significant correlation when Blackboard is used in
two of the observed specializations (S1 and S3). This indicates that, if instructors have
a positive attitude towards Blackboard, then students will also have the same attitude;
thus, they become satisfied with it, and use it. This is in agreement with (Al-Busaidi
and Al-Shihi 2010; Al-Busaidi 2012;Taha 2014), who found that the instructor‟s
attitude is a significant factor in students' actual use. A well-designed course, the way
instructors present the material on Blackboard, their technical competence and
Chapter 6
135
student-instructor interaction enable students to realize the usefulness of Blackboard,
and help improve their satisfaction with it, which has a significant impact on their
actual use. This study confirmed the findings of some previous studies (Sun, Ray et
al. 2008; Lee, Hsiao et al. 2014), who have stated that a good online course must have
the means for learners to communicate with their peers and instructors anytime
anywhere and to be able to collaborate, share course materials and engage in
discussions and be able to do presentations using the LMS.
Regarding the technology dimension there was a significant and positive correlation
with students' use of Blackboard in sciences specialization (S1). This means that the
attributes known to the LMS Blackboard such as its flexibility, quality and ease of use
do impact on learners' use of it. More precisely, good quality and more flexibility
engender more use on the part of learners. Good system quality has been shown
empirically to be positively linked to leaner satisfaction (DeLone and McLean 1992),
as has flexibility, usefulness and ease of use (Roca, Chiu et al. 2006; Liaw 2008;Aixia
and Wang 2011).
The university support dimension: there was a positively and significantly correlation
between university support and the use of the LMS Blackboard for two of the
specializations under scrutiny (S2 and S3). Such result gives an indication that it is
with good training and technical user support learners would perceive this construct to
be easy to use and very useful, which in turn would make them more satisfied and
would continue to use it. Therefore, university support assures learners that
Blackboard and new technologies are inherent to the institution forward thinking
culture which should consequently encourage them to adopt and use the system. This
is consistent with (Igbaria 1990; Alkharang and Ghinea 2013), who state that learners‟
acceptance, use and satisfaction with Blackboard may be associated with university
support to end users, and significantly improves computer usage.
In the e-learning context, technical support has impacted significantly on student
satisfaction. The findings of (Al-Busaidi 2012; ALhomod and Shafi 2013) support
this result. Like for anything else in life, training does significantly influence the
acceptance of any new tool, in this case, technology. In their work on the topic (Tabak
and Nguyen 2013) seem to agree.
Chapter 6
136
6.10.3. Achievements
The learner dimension was found to have a significant correlation with learner
achievements in S3. This means that learners who had web and LMSs experience are
able to attain higher and more encouraging scores than those who had not and
students who liked to interact with their peers tended to obtain higher marks/grades
than the others. This indicates that student achievement can be affected by student-
student interaction. This is in agreement with previous research by (Picciano 2002;
Hammoud 2010), who found that a relationship between student interaction and
student achievement in VLEs does exist.
The instructor dimension in turn was known to have a correlation positively
significant with student achievement in S3, which means that instructors' interaction
with the students and their course leaders' way of using Blackboard affected student
achievement. This supports the findings of (Hammoud 2010). Moreover, (Chi-Hong
and Yuen-Yan 2003) suggest that how information is made available by course
leaders affects student achievement.
An important aspect of this study is that the tracking system data analysis has
illustrated the close link between the LMS Blackboard use and learner achievement.
A significant positive link between the continuous use of the LMS and learner
learning outcome was found, which indicates that students who visited Blackboard
frequently have obtained higher grades. Moreover, the findings have also illustrated a
significant link between the number of discussion board hits and learner learning
outcome, which indicated the more the discussion board is hit the better the outcomes
for both exams and coursework. One can safely suggest that higher number of
discussion board hits causes a positive effect on learner learning achievements. It can
be concluded from these findings that students who used the discussion board more
frequently tended to be better achievers than those who did not.
This is in agreement with findings of (Hammoud 2010), who has obtained found that
frequent use of the LMS Blackboard brought about similar results. The findings of
(Hoskins and Hooff 2005) work have also indicated that peer- peer and learner-
instructor dialogue can seriously affect learner achievements in assessed coursework.

Chapter 6
137
(Sayers, Nicell et al. 2004) have found in their study that the use of this LMS students
of the LMS produced better learning outcomes compared to the previous years where
no LMSs were used.
Based on all of the above, the study illustrated that success in adopting LMS in
learning positively impacts students' attitude to continuously using LMS. Once
students use LMS, they perceive it to be easy and useful, and are satisfied with it, and
they will continue to use it. Users‟ satisfaction and acceptance of LMS is an important
element for its survival. Thus, all major entities of LMS adoption (students,
instructors, LMS, course, classmates and organization) are critical to the success and
survival of LMS. Owing to the importance of the role of instructors as a crucial
variable or factor in the e-learning process, instructors must not only be
knowledgeable and very experienced and well trained in web-based course delivery,
but must also show a keen and positive attitude to their learners regarding the use of
new technologies; in our case, the use of the Blackboard LMS to keep their learners
constantly motivated and obtain the maximum out of them in matter of learning
outcomes.
Any LMS acceptance is closely linked to how effective institutional support is.
Universities must make sure that technical and support for all those stakeholders
concerned is readily available and must update any available training to all users to
keep up with user problems and demands. Training and technical support are indeed
very crucial to any successful implementation of any e-learning programmes, a user
base well trained and well supported is a happier and well satisfied user base. Hence,
institutions must ensure that the implementation of any online learning processes must
go hand in hand with sound technical support constantly and readily available to end
users to facilitate their mission.
Few studies have made such investigations in the Middle East, and studies of this sort
are indeed scarce to say the least in the Saudi kingdom . For this reason my research
aims to increase governmental and institutional awareness of the potential technical
and social hurdles faced by educational institutions when they chose or decide to
adopt and implement online learning programmes. A thorough scrutiny and weighing
of all the potential crucial factors involved in such processes for smooth, efficient and
successful outcomes for both user and institution are mandatory. Indeed this applies to

Chapter 6
138
all Saudi HE institutions in general and to Taif University in particular. A well
thought out framework can provide universities with the necessary data that would
allow them to choose and adopt the right LMS to improve learner performance.
Hence, the current study may be thought of as the first corner stone on which to build
a new technical revolution in the way teaching and learning processes ought to be
conducted in Saudi from now on, to try and emulate western and Far-East countries.
6.11. Chapter summary
Learning management systems do play increasingly an important role in the
development of teaching and learning processes in higher education. Owing to the
lack of studies carried out on the critical success factors affecting e-Learning success
in developing countries, it was not only important, but also necessary to design a
framework to undertake such research, in order to enhance the effectiveness of these
LM systems. Many studies have identified variables dealing with LMS and a host of
LM systems have been studied over recent years and to my knowledge the
Blackboard LMS is one of the most used among them.
In order to understand the relationship that exist between different variables related to
web-enhanced courses when the LMS Blackboard is being used as a supporting tool, a
framework has been presented in this chapter. It starts with a brief review of the
several factors which might impact on the success of technology in academic
institutions, as well as an explanation of the models and frameworks this study
depended on. It then presents a new model framework. This new framework consists
of four constructs: a learner construct, an instructor construct, a technology construct
and a university support construct. These constructs were measured by a questionnaire
submitted to students at Taif University in Saudi Arabia. The framework also consists
of three dependent variables: learner attitude towards using Blackboard, their
achievements and actual use of Blackboard. learner attitude towards using Blackboard
was measured by a questionnaire. Information about the learners' use of Blackboard
was collected from the Blackboard tracking system and learners' achievements were
measured by their grades in coursework and exams. This study used information on

Chapter 6
139
one course (English language) in different academic specializations (Sciences,
Humanities, and Health sciences).
As shown in this chapter, the findings of hypotheses were different in the three
specializations (S1,S2,S3); however, there is not enough evidence in this study to
explain what caused these differences.
The relationships among the four constructs and the dependent variables were tested.
Learner attitudes towards using Blackboard were found to have a positive relationship
with the four constructs of the framework. The learners' use of Blackboard was also
found to have a positive relationship with the four constructs. Learners' achievements
were found to have a positive relationship with the learner and instructor constructs.
Overall, the positive findings obtained in this study could lead to the development of a
more comprehensive and new framework that could be used to explain the
complicated relationships governing success factors of web-enhanced courses. Hence,
this study may be the first step in providing organizations with useful insights into the
critical factors for adoption of learning management systems in academic institutions,
at least those in developing countries.
The next chapter will be a summary of the research work findings in this thesis. It will
also state the research contributions, limitations and proposals for future work.

140
Chapter 7
Discussion and conclusions
7.1. Introduction
E-learning is a new development in the teaching and learning processes, Education as
we know, is no longer confined by time and space. The majority of educational
institutions around the world and particularly in the developed countries are now
offering web-based courses using sophisticated learning management systems such as
Blackboard or WebCT. As interactions (student-student, student-instructor and
learner-content interactions) are a central tenet in the teaching-learning process, it is
mandatory to look at its many facets in order to understand its impact on the whole
process of this technology lead course delivery.
We already know that in recent years the internet has enhanced communication and
collaboration between learners and instructors no end. learners' attitudes to web-based
education are significant in gauging the effectiveness of web-based courses. The body
of literature on web-based education, although already extensive is growing all the
time. Despite that, research dealing with factors that affect the success of web-
enhanced courses and the relationships that govern these factors is limited,
particularly in the developing countries. Most of the studies in the contemporary
literature are based on comparing learner performance and attitude when the LMS
Blackboard is being used and when it is not. Although, some studies have recently
examined online environments and VLEs with regard to student achievements, the
effectiveness of web-based education remains to be investigated in the developing
countries. Therefore, research is needed to find out if a relationship between specific
aspects of the online environment and student achievements exists and if it does, what
sort of relationship it is.

Chapter 7
141
The objective of this research is to examine a web-based tool – here the LMS
Blackboard – on undergraduate courses in developed countries, specifically the
Kingdom of Saudi Arabia and to try and investigate what factors could influence
learners' attitudes and performances across a variety of subjects in order to find what
relationship, if any, does exist between these factors. Three studies were conducted to
achieve this research thesis stated aim. Three separate studies were conducted, in
which one course and different groups of students were observed for each study to
determine what influence or impact the use of Blackboard has in different subject
areas. With regard to the methodology adopted, a mixed method approach was used in
order to try and increase the richness of the data to be gathered for a truly
comprehensive – and hopefully a sound - outcome to this thesis results. A study by
(Owston 2000) suggested that the richness and complexity of a web-based education
environment can be captured and understood to greater extend if a blended
methodological approach was adopted. This is what the researcher opted for and
carried out. Data from participants was gathered via a number of instruments
(questionnaires, interviews, and numerical data from the Blackboard tracking system).
The following is a summary of the three studies obtained results.
7.2. Summary of the studies' results
Three studies were conducted as reported in below.
7.2.1. learners’ perceptions on integrating e-learning into Teaching and Learning
at Taif University
The work presented in Chapter four of the thesis has examined undergraduate
students' perceptions to the use of the Blackboard LMS the learning management at
the University of Taif. It took into consideration the effects of using e-learning on
both gender and academic specialization. The key result from this study was that the
attitudes shown by course instructors to the use of Blackboard do have a significant
effect on those of their students to its use. The more positive the attitude of the
instructor is, the more positive is that of the learner. Students' gender and academic
specialization had no effect on students‟ attitudes to the LMS. These results suggest
Chapter 7
142
that the academics' perspective may affect students' attitudes to Blackboard and their
actual use of the LMS. Similar results can be found in a previous study by (Sun, Ray
et al. 2008). It suggested that instructors' attitudes to e-learning have a significant
impact on e-learners' satisfaction. (Mahdizadeh, Biemans et al. 2008) also have stated
that instructors' attitudes and opinions about web-based learning activities are very
effective in shaping those of their learners' attitude to the e-learning environment.
They noted that the instructors' perception of e-learning directly affects the whole
atmosphere of the e-learning environment.
In this study, a comparative data was gathered from both genders of a cohort of
undergraduate students on an English language courses across three academic
specializations.
7.2.2. The relationship between learners' use of Blackboard, their performance
on a Blackboard course and students' attitudes towards it
As the target of this research was to investigate factors that influence learner attitude
and performance on web-enhanced courses, other factors were explored as part of the
work undertaken. These are learners‟ satisfaction and behavioural intentions when
using the LMS under investigation.
The second study investigated learners‟ satisfaction, behavioural intentions and the
effectiveness of the Blackboard system. Additionally, the relationship between the
learners‟ use of Blackboard, their performances and attitudes towards it were also
scrutinised. Data was collected from undergraduate learners during semester time.
The use of this LMS was measured using the numerical data from the tracking
system. Learners‟ satisfaction, behavioural intentions and other factors were measured
using a questionnaire. The study also took into account the effects of gender and
academic specialization. This study benefited from the integrated tracking data
designed into the LMS, which gives accurate information on both the learners‟ actual
use of it, their achievements on a web - enhanced courses and the instructors' attitudes
regarding its use. The findings have shown that learners were able to use the
Blackboard but not efficiently. In other words, they have faced difficulties in using it
effectively because on one hand it is this a very recent technology and on the lack of
Chapter 7
143
training of the educational institution on the other, irrespective of gender or academic
specialization. In addition, the results have confirmed that the instructor‟s attitude
towards using Blackboard had a significant impact on learners‟ actual use. These
results support the findings from a study by (Telia 2012), who recommended that the
university needs to increase and improve the support services provided to end users.
A study carried out by (Al-Busaidi 2012) stated that instructors‟ attitudes to LMSs are
considered as one of the significant factors affecting learners‟ actual usage. There
were differences between learners‟ attitudes to the use of Blackboard with respect to
gender. Female students were more positive about using the LMS than their male
counterparts. Similarly, (Sandersa and Morrison 2011) have found that the attitude of
female students on the Web-based learning was found to be significantly more
positive than that of males. This finding suggests that the reason lies in the nature of
Saudi higher education, where men and women receive instruction in classes
separately, for religious and cultural reasons. Naturally this puts further strains on the
limited facilities and human resources available and because of this segregation
women are often among the strongest supporters of e-Learning, which potentially
facilitates not only their access to higher education, but also to lucrative future
careers.
Moreover, significant differences were found between students' attitudes regarding
the issues of „time‟, „read‟ „files‟ on the Blackboard system, with respect to gender
and academic specialization (Scientific, Humanities & Health Sciences). Gender and
academic specialization were found to influence learners' way of using the
Blackboard system (e.g. time spent exploring a page, posted or read messages and the
number of times that learners accessed or saved a file in the content folder). A similar
conclusion can be found in previous studies (Liaw and Huang 2011; Sandersa and
Morrison 2011;Al-Hadrami 2014). These authors have found that gender played a role
in the degree of activity on bulletin boards when using the learning management
system.
Chapter 7
144
7.2.3. The relationships among the main success factors in web-enhanced
learning
The third and final study was developed and tested as a result of the findings of the
first and second studies (reported in Chapters 4 and 5). The aim of the study was to
develop a framework for the critical factors affecting the use of the Blackboard LMS
by undergraduates by examining what relationships exist within the framework
variables. The variables were determined generally from background research in the
field, and specifically from the findings of the first two studies carried out as part of
this thesis. The study framework had four main dimensions or constructs with thirteen
variables that include learner, instructor, the technology and the institution support
dimensions. The learner construct consists of three factors, namely, learners'
interaction with their classmates, their ability to use the web and their capability to
operate Blackboard.
The instructor construct has four factors, namely, instructors‟ attitude to the use of
Blackboard, their technical competence, the way materials are presented on
Blackboard and student-instructor interactions. The technology construct had the
following factors: usefulness, ease of use, flexibility, and quality. The university
support dimension consisted of two factors, namely: end-user training and technical
user support. The study has examined the relationship between the framework's four
constructs and learners' attitudes to Blackboard, their achievements in the observed
course and their use of Blackboard tools. In order to achieve the aim of the study, one
course provided to three groups of students from different specializations of both
genders was observed. The findings have indicated that learners' attitude to using
Blackboard and learners' use of Blackboard were found to have a positive relationship
with the four constructs of the framework. learners' achievements were found to have
a positive relationship with the learner and instructor constructs. A detailed
explanation of the main findings is given below.
Chapter 7
145
7.2.3.1. Attitude
The findings have indicated that learners have not only shown a positive attitude
throughout to using the LMS Blackboard for their courses, but have also found it
beneficial in all subject areas. What has had mostly a positive significant correlation
with learners' attitudes to using Blackboard was the learner dimension. The learner
construct consists of three factors: learners' interaction with each other, learners'
ability to use the web, and their capability of using Blackboard. The more positive
attitudes towards Blackboard are, the more the amount of internet and LMS use is and
vice versa. These findings tally with the results of previous research (Hammoud 2010;
Al-Busaidi 2012). (Paris 2004) stated that internet use engenders a positive attitude in
students. Similarly, (Ando, Takahira et al. 2004) concluded that not only students‟
motivation seems to soar when using the internet daily, but also their interest in
learning education and their self- confidence seems to follow suit.
The instructor construct or dimension has indeed had a positively significant
correlation with learners' attitudes to the use of Blackboard. This construct which
consists of the three factors: technical competence of the instructor, the instructor's
way of providing materials on Blackboard and the interaction between learners and
instructors proved to be of great significance too. Previous studies are congruent with
these findings which indicates that instructor interaction with students is seen as an
important factor which has a significant impact on the success of online courses
(Swan 2001; Ali and Ahmad 2011).
This study's findings have illustrated that a host of factors are involved. Factors like
the provision of material by course leaders on Blackboard and their technical
competence, student-instructor interaction and learners' attitudes toward the use of the
LMS. (Sun, Ray et al. 2008) have found that web-based courses impact on learners'
attitudes regarding the use of LMSs and are also affected by instructors' activities and
behaviours. They also stated that instructors' attitudes are closely linked to learner
satisfaction toward e-Learning activities. This indicates, the negative the attitudes and
the lower the enthusiasm of the instructor are, the lower the motivation and the
negative satisfaction of the learner are. More interaction of students with each other

Chapter 7
146
and with their instructors tends to increase students satisfaction with Web courses
(Kim and Moore 2005; Hammoud 2010).
It was found that the technology dimension has a positive significant correlation with
students' attitudes to the use of the Blackboard LMS. As we have previously
mentioned this dimension has four variables, namely, learners' perception of the
usefulness, ease of use, flexibility, and the quality of the LMS used to support their
courses. Similar findings were obtained following a Study carried out by (Hammoud
2010). This positive correlation can only demonstrate that the higher the technology
grade, i.e. the more practical and easy to use, the positive the attitude toward using
Blackboard is. In a study by (Bangert 2005) it was found that accessing web-based
courses at anytime from anywhere, i.e. the flexibility that e-courses offer, was much
appreciated by students, which seems to engender a positive attitude to LMS use and
by the same token the continuous using of this type of learning. This is congruent with
previous studies findings (Chi-Hong and Yuen-Yan 2003; Minton and Willett 2003;
Jurczyk, Kushner-Benson et al. 2004; Hammoud 2010;Al-Busaidi 2012)
As for the institution support dimension it was found that there was a close and
positive significant correlation with students‟ attitudes to the use of Blackboard. This
dimension which has two variables: students' perception of the training and the
technical support when using Blackboard, indicated that students who had received
good training on the use of the LMS Blackboard and received the technical support
needed, tended to have a more positive attitude to using Blackboard as a tool in their
learning. These findings are congruent with previous research. (Alkharang and Ghinea
2013; Solomon, Oludayo et al. 2013) have indicated that training on the use of LMSs
and continuous technical support, do indeed enhance students the awareness of
students and consequently could be looked upon as an important facilitator for user
attitudes. This result is also supported by the findings of (Hammoud 2010; Al-Busaidi
2012; Parsazadeh, Megat et al. 2013;Nisperos 2014).
Chapter 7
147
7.2.3.2. Use of the Blackboard system
Learner dimension: there exists a positively significant correlation between this
variable and the students' use of Blackboard. This indicates that the more students use
the internet, the more they interact with the LMS Blackboard and the more
experienced they become. This makes them use it even more, in contrast with their
peers who are not. The interaction with this LMS was found to enhance students‟
perception of its usefulness and stimulate students use and their satisfaction. In
conclusion students who interacted with their peers via Blackboard were found to use
it more often than those who didn't. A study carried out by scholars (Chi-Hong and
Yuen-Yan 2003) suggest that computer and internet navigation skills do play a
significant role in learners' improvement in web-based courses. Furthermore, (Kalifa
and Lam 2002) suggested that this variable was one of the most significant factor in
the education process.
As for the instructor dimension; this variable was found to correlate significantly and
positively with the learners‟ use of Blackboard. The more enthusiastic and motivated
the instructors are the more positive students‟ attitude is in using Blackboard. This is
congruent with (Al-Busaidi 2012; Taha 2014) findings. These scholars have looked at
the instructor‟s attitude and have found it to be a significant motivating factor in
students' actual use of the LMS. Instructor's input is a valuable asset if it is well
thought and well applied. If courses are well designed by instructors with students
needs in mind, adoption of LMSs can be easily administered and their use be accepted
and taken up by students. The more competent the instructor is, the more successful
the outcome will be. The present study also confirms the findings of previous studies
undertaken by (Piccoli, Ahmad et al. 2001; Sun, Ray et al. 2008;Lee, Hsiao et al.
2014). These scholars have stated that well thought out and well- designed online
courses must provide a rich environment for online communication, collaboration,
and sharing of course materials. Specifically, interactive online interactions in the
form of presentation of course materials through multimedia presentations and
discussions must be an integral part of any LMS alongside the management of the any
learning processes.
Chapter 7
148
Similarly the technology construct was also found to correlate significantly and
positively with learners' use of the LMS Blackboard. All those variables related with
it such as its usefulness, ease of use, flexibility and quality all do influence the
learners' use of it. More precisely, the more the positive feeling and attitude to this
LMS is, the more the students will stick with it. Good system quality was found
empirically to be positively related to system use and user satisfaction (DeLone and
McLean 1992). One can therefore safely assume that flexibility, ease of use and
usefulness of the e-learning system do have a significant impact on students‟
satisfaction with e-learning systems (Roca, Chiu et al. 2006; Liaw 2008;Aixia and
Wang 2011).
Higher Education institutions, i.e. universities and institutes, support construct was
found to correlate closely, significantly and positively with the learners' use of the
LMS Blackboard. This is a very clear indication that students' continuous use of this
LMS and their satisfaction with it depends greatly on good training and technical user
support on one hand and student perception that this technology is not only easy to
use, but also useful on the other. By their constant support universities will assure
students that using Blackboard is indeed an integral part of their mission statement
and indeed their educational culture and that they are totally committed to it and its
success and this would surely engender assurance and confidence with students which
in the long term would increase their reliability of such systems and e-learning in
general. This is consistent with the findings of (Igbaria 1990; Alkharang and Ghinea
2013), who have stated that learners‟ acceptance, use, and satisfaction with the
Blackboard LMS is closely associated with the institutions constant support to end
users. They have noticed that this support does indeed significantly improve computer
usage. In the e-learning context, knowing that there is support available in form of
'Help desks' or 'Technical department' students and other end users will persevere in
using LMSs and by the same token, desk top or laptop computers and various other
multimedia devices for their learning, remote or on site, and this can only increase
their satisfaction and their acceptance of such LMSs and the technology associated
with them (Tabak and Nguyen 2013).

Chapter 7
149
7.2.3.3. Achievement
Students‟ achievements were found to be closely associated with the learner
dimension. Significant positive correction between the two cannot be denied or
discarded. This can only indicate that those learners who had more experience and
expertise in using the internet and Blackboard would achieve better results and higher
scores that those who had not. In addition, learners who liked learner-learner
interactions tended to perform much better than those who did not, which may link
their achievement to such interactions. This is in agreement with previous research
(Picciano 2002; Hammoud 2010), who have found that there is a relationship between
learner interaction and learner achievement on a web-based course.
Similarly instructor dimension was found to have a positive significant correlation
with the students' achievement. Students' achievements were found to be affected by
how instructors and course leaders used the LMS within the web. This confirms and
supports the results obtained in (Hammoud 2010) study. Moreover, (Chi-Hong and
Yuen-Yan 2003) suggested the way information and instructions were dispatched and
posted online played a considerable role and therefore can be looked upon as an
important factor affecting students' achievements.
7.2.4. The relationship between learners’ use of Blackboard and their
achievement
One of the important aspects and facets of this study is the way a tracking system was
used to analyze and illustrate the relationship between learners' use of Blackboard and
their achievements. This endeavour has led this researcher, like many before him, to
safely assume that there definitely is a positive significant relationship between the
continuous use of Blackboard and students' grades. The more the use and the greater
the expertise are, the better the grades will be. The relationship seems to grow
stronger and more positive, the greater the exchange of messages are read or
exchanged between students, and this is reflected on their level of achievement and
their grades in exams and coursework too. Obviously these correlations do suggest
that interactions between students using the discussion board have a positive effect on
students‟ achievements. One can safely conclude from these findings that students

Chapter 7
150
who use the discussion boards more often, do indeed obtain better grades than those
peers who do not. This is congruent with (Hammoud 2010) findings. This researcher
has found that learners who used Blackboard got slightly better grades than those who
did not. These results do also tally with the findings of (Hoskins and Hooff 2005)
who stated that interaction and dialogue over the discussion board can affect students'
achievement in assessed coursework. In a piece of research carried out by (Sayers,
Nicell et al. 2004) discovered that using Blackboard did not have a negative effect on
written exam performance. These scholars have also noticed that students who have
used Blackboard have achieved slightly better results than before using this LMS.
In recent years, LMSs have, by and large, seen a sharp rate of increase in their use,
especially in developing countries‟ HE institutions and other educational
establishments. Continuous technological innovations in communications and a drop
in the cost of computer hardware and software packages, added to the availability of
various competing LMSs on the market and the ever-increasing cost of traditional
face-to-face learning, have made it easier for e-learning to grow across the world.
Therefore, it is very important to establish an appropriate framework for research to
enhance the effectiveness of the LMS systems in use. A host of researchers have
looked at the various learning management systems and have identified a number of
variables that could sway users towards their adoption. The LMS Blackboard has
emerged lately as one of the most accepted and used systems.
7.3. Limitations of the study
Despite the fact that this thesis has mixed qualitative and quantitative methodologies,
in the form of questionnaires, interviews and field study, for the sole purpose of real
participants direct response and involvement (Coolican 2004).
No relationship linking the technology in the third study reported in chapter 6 and
institutional support dimensions to students' achievements was found. As this
relationship was said to be significant by the corpora and this present endeavour lacks
the necessary comprehensive data to properly gauge the true significance of the
relationship in questionnaire, we cannot but admit that it has its limitations despite the

Chapter 7
151
fact that the latter can be overcome by carrying out some interviews with both
students and instructors.
Student performance was measured using only one indicator, the student‟s overall
grade awarded at the end of the semester. Using other measures (e.g., added
knowledge, skill building, course withdrawals and successful completion of a course)
may lead to more powerful results.
The size of the sample used for this research gives rise to questions and therefore to
limitations. Had it been a bigger and wider sample, it may have provided a more
comprehensive data. In addition because the studies that were undertaken in this
research were limited to only a tiny sample of courses, it can never be generalized.
Were the research to embrace a greater number of courses across a considerable array
of academic subjects and specializations and were it to be carried out over a
substantial period of time, it may have benefited from a wider array of results and
consequently more comprehensive findings.
As only the LMS Blackboard has been scrutinized as the e-learning tool in this thesis,
doubt in generalizing the results into other LMSs would be high in scholarly circles.
Nevertheless the present results can be seen or considered as few preliminary forward
steps in the diagnosis of LMSs as an alternative approach to teaching and learning in
HE institutions, especially in Arab world where HE lacks far behind its world
counterparts.
Another limitation of this study is that its scope is confined to one public University
in the Western area of Saudi Arabia, a geographical area that is different in its
population and some cultural aspects from the other more homogeneous and
conservative areas in the country. Therefore, the results may not be generalised to the
population of Saudi University students.
My research into the LMS Blackboard can be considered an encouraging step forward
in the quest to raise awareness regarding the benefits of such methodologies and
technologies in order to try and nudge education officials into looking at ways of
rolling out similar systems to the rest of the country.
Chapter 7
152
7.4. Future work
Further research is therefore needed to confirm the findings of this study. Perhaps
some sort of cooperation between advanced and developing countries would be of
benefits to both. Large and varied samples have to be targeted in order to arrive to
some comprehensive outcomes and results that can be generalised.
This research mainly focused on one university in Saudi Arabia Future researchers
may consider all state universities by applying the study framework to an increased
sample, and including several universities. Additional areas of study could include
comparing a variety of majors to investigate if some majors are more likely to accept
new technology as part of the LMS system.
7.5. Chapter summary
The last chapter of this PhD research thesis discussed the key results of the research
carried out to achieve the aims of the thesis. A thorough discussion of key results was
presented. In addition, the contributions of this research were discussed, as well as
limitations and future work.

153
References
Abbad, M., D. Morris, et al. (2009). "Looking under the Bonnet: Factors Affecting
Student Adoption of E-Learning Systems in Jordan." International Review of
Research in Open and Distance Learning 10(2): 1-25.
Abouchedid, K. and G. Eid (2004). "E-learning challenges in the Arab World:
Evaluations from a case study profile. Quality in Education." 12(1): 15-27.
AbuSneineh, W. and M. Zairi (2010). "An Evaluation Framework for E-Learning
Effectiveness in the Arab World." Elsevier Ltd: 521-535.
Agboola, A. (2013). "A Study of Sociodemographics Effects on E-Learning Adoption
among Lecturers." International Journal of Emerging Technology and
Advanced Engineering 3(4).
Ahmed, H. (2010). "Hybrid E-Learning Acceptance Model: Learner Perceptions."
Decision Sciences Journal of Innovative Education 8(2): 313-346.
Aixia, D. and D. Wang (2011). "Factors Influencing Learner Attitudes Toward E-
learning and Development of E-learning Environment Based on the Integrated
E-learning Platform." International Journal of e-Education, e-Business, e-
Management and e-Learning 1.
Akour, H. (2009). "Determinants of mobile learning acceptance: an empirical
investigation in higher education." Submitted to the Faculty of the Graduate
College of Oklahoma State University.
AL- Ammary, J. and S. Hamad (2008). "Factors Influencing the Adoption of E-
learning at UOB." Proceeding of the Second International Conference and
Exhibition for Zain E-learning Center, Manama, Bahrain, 28-30 April.
AL- Fadhli, S. (2008). "Students‟ Perceptions of E-learning in Arab Society: Kuwait
University as a case study." http:// www.wwwords.co.uk/ELEA.
154
AL- Fadhli, S. (2008). "Students‟ Perceptions of E-learning in Arab Society: Kuwait
University as a case study. E-Learning." http:// www.wwwords.co.uk/ELEA.
Al-Busaidi, K. (2009). "The Impact of Learning Management System Characteristics
and User Characteristics on the Acceptance of E-Learning." International
Journal of Global Management Studies 1: 75–91.
Al-Busaidi, K. (2012). "Learners‟ Perspective on Critical Factors to LMS Success in
Blended Learning: An Empirical Investigation." Communications of the
Association for Information Systems 30(2): 11-34.
Al-Busaidi, K. and H. Al-Shihi (2010). "Instructors' Acceptance of Learning
Management Systems: A Theoretical Framework." Communications of the
IBIMA.
AL-Fadhli, S. (2011). "Factors Influencing the Acceptance of Distance-Learning: A
Case Study of Arab Open University in Kuwait." International Journal of
instructional Media 38(2): 147-158.
Al-fahad, F. (2009). "Students' attitudes and perceptions towards the effectiveness of
mobile learning in King Saud University, Saudi Arabia." The Turkish Online
Journal of Educational Technology 8(2).
Al-Hadrami, A. (2012). "Factors that affect learners' performance in web-based
courses: the case of the accounting courses at the Hashemite University."
CURVE is the Institutional Repository for Coventry University.
Al-Hadrami, A. (2014). "The impact of demographic variables on accounting
students‟ performance in blended learning." International Journal of Research
in IT & Management 4(4).
Al-Harbi, K. (2010). "Investigating Factors Influencing the Adoption of E-learning:
Saudi Students Perspective." PhD thesis, (Thesis Submitted for the Degree of
Doctor of Philosophy at the University of Leicester), University of Leicester,
School of Education.
155
Al-Harbi, K. (2011). "e-Learning in the Saudi tertiary education: Potential and
challenges." King Saud University Applied Computing and Informatics 9,31-
46.
Al-Homod, S. and M. Shafi (2013). "Success Factors of E-learning Projects: A
Technical Perspective." The Turkish Online Journal of Educational
Technology 12(2).
Al-Shafi, S. and V. Weerakkody (2010). "Factors affecting e-government adoption in
the state of qatar."
Al-Shboul, M. (2013). "The Level of E-Learning Integration at the University of
Jordan: Challenges and Opportunities." Canadian Center of Science and
Education 6(1913-9039).
Alaugab, A. (2007). "Benefits, Barriers, and Attitudes of Saudi Faculty and Students
Toward Online Learning in Higher Education." Unpublished doctoral
dissertation, University of Kansas.
Alavi, M. (1994). "Computer-Mediated Collaborative Learning: An Empirical
Evaluation." MIS Quarterly 18: 159-174.
Alexander, s., J. McKenzie, et al. (1998). "An evaluation of information technology
projects for university learning."
ALhomod, S. and M. Shafi (2013). "Success factors of e-learning projects: a technical
perspective." TOJET: The Turkish Online Journal of Educational Technology
12(2): 247-253.
Ali, A. and I. Ahmad (2011). "Key factors for determining students‟ satisfaction in
distance learning courses: A study of AllamaIqbal Open University."
Contemporary Educational Technology 4(4): 118-134.
Alias, N. and A. Zainuddin (2005). "Innovation for Better Teaching and Learning:
Adopting the Learning Management System." Malaysian Online Journal of
Instructional Technology 2(2): 27-40.

156
Alkhalaf, S., S. Drewa, et al. (2012). "E-Learning system on higher education
institutions in KSA: attitudes and perceptions of faculty members." Procedia -
Social and Behavioral Sciences 47- 1199 – 1205.
Alkharang, M. and G. Ghinea (2013). "E-learning in Higher Educational Institutions
in Kuwait: Experiences and Challenges." (IJACSA) International Journal of
Advanced Computer Science and Applications 4(4): 1-6.
Alkhunaizan, A. and S. Love (2013). "What drives mobile commerce? An empirical
evaluation of the revised UTAUT model." International Journal of
Management and Marketing Academy 2(1): 82-99.
Allen, E. and J. Seaman (2014). "Grade change: Tracking online education in the
United States." Babson Survey Research Group and Quahog Research Group
http://www.onlinelearningsurvey.com/reports/gradechange.pdf.
Alobiedat, A. and R. Saraierh (2010). "The Student's Attitude toward Use Platform as
Learning Resources at University of Granada." Review of European Studies
E-ISSN 1918-7181.
Alobiedat, A. and R. Saraierh (2010). "The Student's Attitude toward Use Platform as
Learning Resources at University of Granada." Review of European Studies 2.
Alshaher, A. (2013). "The mckinsey 7s model framework for e-learning system
readiness assessment." International Journal of Advances in Engineering &
Technology ©IJAET 6(5): 1948-1966.
Altun, A., y. Gulbahar, et al. (2008). "Use of a Content Management System For
Blended Learning: Perceptions of Pre-Service Teacher." Turkish Online
Journal of Distance Education 9(4).
Alwraikat, M. (2012). "Graduate Students‟ Attitudes Towards the Use of Electronic-
Portfolios in the College of Educational Sciences at the University of Jordan."
International Journal of Humanities and Social Science 2.
Alzamil, Z. (2006). "Students' Perception Towards the E-Learning at The GOTEVOT
and the Arab Open University in Riyadh." Journal of King Saud University:
Educational Sciences and Islamic Studies 18(2): 655-698.
157
Ando, R., M. Takahira, et al. (2004). "Effects of the Internet Use on Elementary
School Students of Attitude toward Learning." World Conference on
Educational Multimedia, Hypermedia and Telecommunications 1: 979-984.
Arbaugh, J. (2000). "Virtual Classroom Characteristics and Student Satisfaction with
Internet-Based MBA Courses." Journal of Management Education 24: 32-54.
Arbaugh, J. (2002). "Managing the on-line classroom: A study of technological and
behavioral characteristics of web-based MBA courses." The Journal of High
Technology Management Research 13: 203-223.
Ashong, C. and N. Commander (2012). "Ethnicity, Gender, and Perceptions of Online
Learning in Higher Education." MERLOT Journal of Online Learning and
Teaching 8(2): 98-110.
Asiri, M., R. Mahmud, et al. (2012). "Factors Influencing the Use of Learning
Management System in Saudi Arabian Higher Education: A Theoretical
Framework." Canadian Center of Science and Education 2(2): 125-137.
Astleitner, H. and R. Steinberg (2005). "Are there gender differences in web-based
learning? An integrated model and related effect sizes." AACE Journal 13: 47-
63.
Bacsich, P., T. Bastiaens, et al. (2009). "Reviewing the virtual campus phenomenon:
The rise of large-scale e-Learning initiatives worldwide."
http://revica.europace.org/Re.ViCa%20Online%20Handbook.pdf.
Bame, S., N. Petersen, et al. (1993). "Variation in hemodialysis patient compliance
according to demographic characteristics." Social Science & Medicine, 37(8),
1035-1043.
Bangert, A. (2005). "The seven principles of effective teaching: a framework for
designing, delivering, and evaluating an internet-based assessment course for
nurse educators." Nurse Educator 30: 221-225.
Becher, T. and P. Trowler (2001). "Academic Tribes and Territories." (2nd Ed.),
Oxford: Oxford University Press.

158
Bolliger, D. and O. Wasilik (2009). "Factors influencing faculty satisfaction with
online teaching and learning in higher education." Distance Education 30(1):
103–116.
Boser, R., J. Palmer, et al. (1998). "Student's attitudes toward technology in selected
technology education programs." Journal of Technology Education, 10(1), 4-
19.
Braun, V. and V. Clarke (2006). "Using thematic analysis in psychology." Qualitative
Research in Psychology, 3 (2). pp. 77-101. ISSN 1478-0887.
Breakwell, G., S. Hammond, et al. (1995). "Research methods in Psychology."
London.
Breen, R. and R. Lindsay (2002). "Different disciplines require different motivations
for student success." Research in Higher Education 43: 693-725.
Brett, P. and J. Nagra (2005). "An investigation into students' use of a computer-based
social learning space: lessons for facilitating collaborative approaches to
learning." British Journal of Educational Technology 36: 281-292.
Bryman, A. and D. Cramer (2005). "Quantitative data analysis with SPSS 12 and 13,
Routledge."
Bush, F., J. Squire, et al. (2008). "An Investigation Of The Effect Of Network
Latency On Pedagogic Efficacy: A Comparison Of Disciplines."
Contemporary Issues In Education Research 1.
Bussakorn, Praweenya, et al. (2012). "Critical Success Factors for Online Distance
Learning in Higher Education: A Review of the Literature." Published Online
in SciRes (http://www.SciRP.org/journal/ce) 3: 61-66.
Cakir, H. (2013). "Use of blogs in pre-service teacher education to improve student
engagement." Computers & Education: 244-252.
Carbone, E. (1998). "Teaching large classes tools and strategies." USA.

159
Chang, C. (2008). "Faculty Perceptions and Utilization of a Learning Management
System in Higher Education." Unpublished doctoral dissertation, Ohio
University, USA.
Chang, Y., C. Chen, et al. (2011). "Investigating students‟ perceived satisfaction,
behavioral intention, and effectiveness of English learning using augmented
reality." the Central Taiwan University of Science and Technology 978-1-
61284-350-6/11 IEEE.
Chen, F., C. Liao, et al. (2009). "Adults Education Students‟ Perspective on Critical
Success Factors of e-Learning." Available at:
doi.ieeecomputersociety.org/10.1109/ETT.2009.85.
Chen, H. and J. Huang (2012). "Exploring learner attitudes toward web-based
recommendation learn-ing service system for interdisciplinary applications."
Educational Technology & Society 15(2): 89-100.
Cheng, C. and J. Yen (1998). "Virtual Learning Environment (VLE): A Web-Based
Collaborative Learning System." International Conference on System
Sciences, January, 6-9, 1998, Hawaii. IEEE: 480-491.
Cheng, Y. (2011). "Antecedents and Consequences of E-Learning Acceptance."
Information Systems Journal, 18(5), 529-557 21: 269–299.
Chi-Hong and Yuen-Yan (2003). "Mobile Learning : A New Paradigm in Electronic
Learning Faculty of Education , The Chinese University of Hong Kong ,
Yuen-Yan CHAN The Chinese University of Hong Kong , 2 : Mobile learning
framework." Learning.
Chokri, B. (2012). "Factors Influencing the Adoption of the E-Learning Technology
in Teaching and Learning by Students of a University Class." European
Scientific Journal 8(28): 165-190.
Chung, C., L. Pasquini, et al. (2013). "Web-based learning management system
considerations for higher education." Learning and Performance Quarterly
1(4): 24-37.
160
Chyung, S. (2007). "Age and gender differences in online behavior, self-efficacy and
academic performance." Quarterly Review of Distance Education 8: 213-222.
Clark, R. and R. Mayer (2008). "E-learning and the Science of Instruction: Proven
Cuidelines for Consumers and Designers of Multimedia Learning." San
Francisco: Pfeiffer An Imprint of Wiley.
Coates, H. (2007). "A model of online and general campus-based student
engagement." Assessment & Evaluation in Higher Education 32(2), 121-141.
Coldwell, J., A. Craig, et al. (2008). "Online students: Relationships between
participation, demographics and academic performance." The Electronic
Journal of e-Learning 6(1): 19-30.
Coolican, H. (1994). "Research Methods and Statistics in Psychology." 3rd ed.
London.
Coolican, H. (2004). "Research Methods and Statistics in Psychology." 4th ed.
London, Hodder & Stoughton.
Cooper, J. (2006). "The digital divide: The special case of gender." Journal of
Computer Assisted Learning 22: 320-334.
Creswell, J. (2003). "Research design, qualitative, quantitative and mixed methods
approaches." 2nd ed. London.
Cruz, A. (2010). "Key success factors for eLearning implementation resulting from
proper planning." http://www.shiftelearning.com/key-success-factors-for-
elearning-imp.
Dabaj, F. (2009). "The role of gender and age on students‟ perceptions towards online
education Case study: Sakarya University, vocational high school." The
Turkish Online Journal of Educational Technology, 8(2),120-123.
Daniel Strickera, b., D. Weibela, et al. (2011). "Efficient learning using a virtual
learning environment in a university class." Computers & Education 56(2):
495-504.
161
Davis, F. (1993). "User acceptance of information technology: system characteristics,
user perceptions and behavioral impacts." International Journal of Man-
Machine Studies 38: 475-487.
Davis, F. (1986). "A technology acceptance model for empirically testing new end-
user information systems:Theory and results." Unpublished Doctoral
dissertation, Massachusetts Institute of Technology.
Davis, F. (1989). "Perceived usefulness, perceived ease of use, and user acceptance of
information technology." MIS Quarterly 319-340.
DeLone and McLean (1992). " Information Systems Success: The Quest for the
Dependent Variable." Information Systems Research, 3, 1 60-90.
DeLone and McLean (2003). "The Delone and Mclean Model of Information Systems
Success: A Ten-Year Update." Journal of Management Information Systems
(19:4), pp 9-30.
Dillon, C. and C. Guawardena (1995). "A framework for the evaluation of
telecommunications-based distance education." 17th Congress of the
International Council for Distance Education, Open University, Milton
Keynes.
Dix, A., J. Finlay, et al. (2003). "(2003) Human-Computer Interaction." 3rd ed.,
Prentice Hall.
Dwivedi, Y. and B. Lal (2007). "Socio-economic determinants of broadband
adoption." Industrial Management & Data Systems 107: 654-671.
Erdogan, y., s. Bayram, et al. (2011). "Factors that influence academic achievement
and attitudes in web based education." International Journal of Instruction
1(1).
Ettinger, A., V. Holton, et al. (2006). "E-learner Experiences: What is The Future of
E-learning." Journal of Commercial and Commercial Training, 38 (4), pp.208–
212.

162
Frederickson, N., P. Reed, et al. (2005). "Evaluating web-supported learning versus
lecture-based teaching: Quantitative and qualitative perspectives." Higher
Education 50: 645–664.
Friedrich, H. and A. Hron (2010). "Factors Influencing Pupils‟ Acceptance of an E-
Learning System for Secondary Schools." Journal Educational Computing
Research 42: 63-78.
Frimpon, M. (2012). "A Re-Structuring of the Critical Success Factors for E-Learning
Deployment." American International Journal of Contemporary Research 2(3):
115-123.
Garrison, D. and T. Anderson (2003). "E-Learning in the 21st Century: A Framework
for Research and Practice." http://dx.doi.org/10.4324/9780203166093.
Gasaymeh, A. (2009). "A study of faculty attitudes toward internet-based distance
education: A survey of two Jordanian public universities." PhD Thesis, the
College of Education, Ohio University, Ohio, USA.
George, D. and P. Mallery (2003). "SPSS for Windows step by step: A simple guide
and reference." 4th ed. Boston: Allyn & Bacon.
Gil, H. (2008). "The challenge of the transition from online delivery to online
teaching and learning." Society for Information Technology and Teacher
Education International: 2589-2594.
Goi, C. and P. Ng (2009). "E-learning in Malaysia: Success Factors in Implementing
E-learning." http://www.isetl.org/ijtlhe/articleView.cfm?id=357.
González-Gómez, F., J. Guardiola, et al. (2012). "Gender differences in e-learning
satisfaction." Computers & Education 58(1): 283-290.
Green, K. (2013). "Campus computing, 2013, the national survey of computing and
information technology in U.S. higher education."
http://www.campuscomputing.net/sites/www.campuscomputing.net/files/Cam
pusComputing2013.pdf.
Hair, J., B. Black, et al. (1998). "Multivariate data analysis." 7th ed, Englewood
Cliffs: Prentice Hall.

163
Hammoud, L. (2010). "Factors affecting students‟ attitude and performance when
using a web-enhanced learning environment." Department of Information
Systems and Computing, Brunel University.
Hammoud, L., S. Love, et al. (2008). "Evaluating WebCT Use in Relation to
Students‟ Attitudes and Performance." International Journal of Information
and Communication Technology Education 4(2).
Heywood, J. (2000). "Assessment in Higher Education." Jessica Kingsley Publishers.
Hill, P. (2014). "New LMS market data: Edutechnica provides one-year update."
http://mfeldstein.com/new-lms-market-data-edutechnica-one-year-update/.
Hisham, N., P. Campton, et al. (2004). "A tale of two cities: A study on the
satisfaction of asynchronous e-learning system in two Australian universities."
Proceedings of the 21st ASCILITE conference, December 5-8, 2004, Perth,
Western Australia, pp. 395-402.
Hong, K. (2002). "Relationships between students' and instructional variables with
satisfaction and learning from a Web-based course." The Internet and Higher
Education 5: 267-281.
Hong, K., K. Lai, et al. (2003). "Students' Satisfaction and Perceived Learning with a
Web-based Course." Educational Technology & Society 6(1): 116-124.
Hoskins, S. and J. Hooff (2005). "Motivation and ability: which students use online
learning and what influence does it have on their achievement." British
Journal of Educational Technology, 36, 2, p177-192.
Hussain, I. (2007). "A study of student‟s attitude towards virtual education in
Pakistan." Turkish Journal of Distance Learning 8(2): 69-79.
Igbaria, M. (1990). "End-user computing effectiveness: A structural equation model."
Omega 18: 637-652.
Igbaria, M. (1993). "User acceptance of microcomputer technology: An empirical
test." Omega 21: 73-90.

164
Igbaria, M., N. Zinatelli, et al. (1997). "Personal Computing Acceptance Factors in
Small Firms: A Structural Equation Model." MIS Quarterly 21: 279–305.
Islam, A., A. Rahim, et al. (2011). "Effect of Demographic Factors on E-Learning
Effectiveness in A Higher Learning Institution in Malaysia." International
Education Studies 4(1): 112-121.
Jafar, Y., M. Iraj, et al. (2008). "Virtual students' perceptions of e-learning in Iran."
The Turkish Online Journal of Educational Technology 1303-6521(3).
Jan, A. and V. Contreras (2011). "Technology acceptance model for the use of
information technology in universities." Computers in Human Behavior 27:
845–851.
Jan, T., P. Lu, et al. (2012). "The adoption of e-learning: an institutional theory
perspective." The Turkish Online Journal of Educational Technology 11(3).
Johnson, G. (2005). "Student alienation, academic achievement, and WebCT use."
Educational technology and Society 8: 179-189.
Johnson, R. (2011). "Gender differences in e-learning: Communication, social
presence, and learning outcomes." Journal of Organizational and End User
Computing 23(1): 79-94.
Johnson, R. (2012). "Community college first-year business student online course
motivation." (Doctoral dissertation). Kansas State University.
Jones, G. and B. Jones (2005). "A comparison of teacher and student attitudes
concerning use and effectiveness of web-based course management software."
Educational Technology & Society 8(2): 125-135.
Junco, R., G. Heiberger, et al. (2011). "The effect of Twitter on college student
engagement and grades." Journal of Computer Assisted Learning 27(2): 1365-
2729.
Jurczyk, J., S. Benson, et al. (2004). "Measuring student perceptions in web-based
courses: A standards-based approach." Online Journal of Distance Learning
Administration
http://www.westga.edu/~distance/ojdla/winter74/jurczyk74.htm.

165
Jurczyk, J., S. Kushner-Benson, et al. (2004). "Measuring student perceptions in web-
based courses: A standards-based approach." Online Journal of Distance
Learning Administration 7.
Kalifa, M. and R. Lam (2002). "Web-Based learning: Effects on learning process and
outcomes." IEEE Transaction on Education(4): 350-356.
Kamarulzaman, Y., A. Madun, et al. (2011). "Attitude towards E-learning Among
Students: Evidence from A Malaysian Public University." British Journal of
Arts and Social Sciences 3(2).
Keller, C. (2009). "User Acceptance of Virtual Learning Environments: A Case Study
from Three Northern European Universities." Communications of the
Association for Information Systems 25: 465–486.
Kemp, B. and C. Jones (2007). "Academic Use of Digital Resources: Disciplinary
Differences and the Issue of Progression revisited." Educational Technology
& Society 10: 52-60.
Khan, B. (2005). "Learning features in an open, flexible, and distributed
environment."
http://www.editlib.org/files/paper_5987.pdf?fuseaction=Readerjsp?id=5163id.
Kim, K. and J. Moore (2005). "Web–based learning: Factors affecting students‟
satisfaction and learning experience." 10,11.
Klobas, J. and T. McGill (2010). "The role of involvement in learning management
system success." Journal of Computer High Education 22: 112-134.
Lee, M. (2010). "Explaining and Predicting Users‟ Continuance Intention Toward E-
Learning: An Extension of the Expectation–Confirmation Model." Computers
& Education 54: 506–516.
Lee, Y., C. Hsiao, et al. (2014). "An empirical examination of individual and system
characteristics on enhancing e-learning acceptance." Australasian Journal of
Educational Technology 30(5).
Lee, Y. (2008). "The Role of Perceived Resources in Online Learning Adoption."
Computers & Education 50: 1423–1438.

166
Lei, X., C. Pahl, et al. (2003). "An Evaluation Technique for Content Interaction in
Web-based Teaching and Learning Environments." IEEE International
Conference on Advanced Learning Technologies: 294- 295.
Liaw, S. and H. Huang (2011). "A study of investigating learners attitudes toward e-
learning." International Conference on Distance Learning and Education 12.
Liaw, S. (2008). "Investigating Students‟ Perceived Satisfaction, Behavioral Intention,
and Effectiveness of ELearning: A Case Study of the Blackboard System."
Computers & Education 51: 864–873.
Liaw, S. and H. Huang (2007). "Developing a Collaborative e-learning System Based
on Users‟ Perceptions." Lecture Notes inbnComputer Science, 4402, 751–759.
Liaw, S. and H. Huang (2013). "Perceived satisfaction, perceived usefulness and
interactive learning environments as predictors to self-regulation in e-learning
environments." Computers & Education 60(1): 14-24.
Likert, R. (1932). "A technique for the measurement of attitudes, Archives of
Psychology." Quoted in: Coolican, H. (2004) Research Methods and Statistics
in Psychology. 4th ed. London.
Limayem, M. and C. Cheung (2011). "Predicting the Continued Use of Internet-Based
Learning Technologies: The Role of Habit." Behaviour & Information
Technology 30: 91–99.
Lin, K., N. Chen, et al. (2011). "Understanding E-Learning Continuance Intention: A
Negative Critical Incidents Perspective." Behaviour & Information
Technology 30: 77–89.
Lin, Y., G. Lin, et al. (2008). "Building a social and motivational framework for
understanding satisfaction in online learning." Journal of Educational
Computing Research 389(1): 1-27.
Lopez. and Manson. (1997). "A study of individual computer self-efficacy and
perceived usefulness of the empowered desktop information system." Journal
of Interdisciplinary Studies 10.
167
Lowerison, G., J. Sclater, et al. (2006). "Student perceived effectiveness of computer
technology use in post-secondary classrooms." Computers & Education 47:
465-489.
Mahdizadeh, H., H. Biemans, et al. (2008). "Determining factors of the use of e-
learning environments by university teachers." Computers & Education. 51(1),
142-154.
Malik, M. (2010). "Factors Effecting Learner‟s Satisfaction Towards E-Learning: A
Conceptual Framework." International Journal of Sustainable Development
2(3): 77-82.
Martin-Blas, T. and A. Serrano-Fernandez (2009). "The role of new technologies in
the learning process: Moodle as a teaching tool in Physics." Computers &
Education, 52, pp.35-44.
Masoumi, D. (2006). "Critical factors for effective E-learning." [Online] accessed at:
http://www.e-quality-eu.org/pdf/seminar/e-Quality_WS3_DMasoumi.pdf.
Masrom, M. (2007). "Technology Acceptance Model and E-learning." Proceedings of
the 12th International Conference on Education 21-24 May 2007.
Masrom, M., R. Rahiman, et al. (2008). "Critical success in e-learning: An
examination of technological and institutional support factors." International
Journal of Cyber Society and Education, 1(2), 131›142.
Masrom, M., O. Zainon, et al. (2008). "E-learning critical success factors: institutional
and technological aspects." E-Learning Issues in Malaysian Higher Education:
49-63.
Mazi, A. and A. Obuamh (2002). "The reality of the quantitative growth of the faculty
members in Saudi universities and its future in King Saud University: case
study. Frrom King Saud University, Faculty of Education."
http://colleges.ksu.edu.sa/Arabic20Colleges/CollegeOfEducation/Pages/COE_
Conferences_Faculty_Development.aspx.
Mazman, S. (2011). "Gender differences in using social networks." The Turkish
Online Journal of Educational Technology, 10(2), 133-139.

168
Mazza, R. and V. Dimitrova (2004). "Visualising Student Tracking Data to Support
Instructors in Web-Based Distance Education." 9th IEEE Conference on
Information Visualisation IV05, London, UK.
Mazza, R. and V. Dimitrova (2004). "Visualising Student Tracking Data to Support
Instructors in Web-Based Distance Education." 9th IEEE Conference on
Information Visualisation IV05, London, UK, 6-8 July 2005.
Mbarek, R. and F. Zaddem (2013). "The examination of factors affecting e-learning
effectiveness." International Journal of Innovation and Applied Studies 2(4).
Minton, T. and L. Willett (2003). "Student Preferences for Academic Structure and
Content in a Distance Education Setting." Online Journal of Distance Learning
Administration 6(1).
Mishra, S. and S. Panda (2007). "Development and factor analysis of an instrument to
measure faculty atti-tude towards e-learning." Asian Journal of Distance
Education 5(1): 27-33.
Moore, G. and I. Benbasat (1991). "Development of an instrument to measure the
perceptions of adopting an information technology innovation." Information
Systems Research 2: 192-222.
Moore, M. (1989). "Three types of interaction." The American Journal of Distance
Education 3: 1-6.
Moran, M., M. Hawkes, et al. (2010). "Tablet computer integration in higher
education: Applying the unified theory of acceptance and use of technology
model to understand supporting factors." Journal of Educational Computer
Research, 42, 1, 79-101.
Mosakhani, M. and M. Jamporazmey (2010). "Introduce Critical Success Factors
(CSFs) of e-learning for Evaluating E-Learning Implementation Success."
Proceeding of the International Conference on Educational and Information
Technology (ICEIT 2010).
Mosakhani, M. and M. Jamporazmey (2010). "Introduce Critical Success Factors
(CSFs) of elearning for Evaluating e-Learning Implementa-tion Success."

169
International Coriference on Educational and Informa-tion Technology: 224-
228.
Musa, A. and M. Othman (2012). "Critical Success Factors in E-Learning: An
Examination of Technology and Students Factors." International Journal of
Advances in Engineering and Technology (IJAET) 3(2): 140-148.
Nawaz, A. (2013). "Using e-learning as a tool for„education for all‟ in developing
states." International Journal of Science and TechnologyEducational
Researcher 4(3): 38-46.
Neuman, R. (2001). "Disciplinary Differences and University Teaching." Studies in
Higher Education 26: 135-146.
Ngai, E., J. Poon, et al. (2007). " Empirical Examination of the Adoption of WebCT
Using TAM." Computers & Education 48(2): 250- 267.
Nisperos, L. (2014). "Assessing the E-Learning Readiness of Selected Sudanese
Universities." Asian Journal of Management Sciences & Education 3(4).
Nunnaly, J. (1978). " Psychometric theory." New York: McGraw-Hill.
Odunaike, S., O. Olugbara, et al. (2013). "E-learning Implementation Critical Success
Factors." Proceedings of the International MultiConference of Engineers and
Computer Scientists 2013 13 - 15March, 2013, Hong Kong.
Okazaki, S. and L. Santos (2012). "Understanding E-Learning Adoption in Brazil:
Major Determinants and Gender Effects." The International Review of
Research in Open and Distance Learning (IRRODL) 13(4): 91-106.
Okiki, C. (2011). "Information Communication Technology Support for an E-
Learning Environment at the University of Lagos, Nigeria."
http://digitalcommons.unl.edu/libphilprac/610.
Omidinia, S., M. Masrom, et al. (2011). "Review of e-learning and ICT infrastructure
in develop-ing countries (Case study of Iran)." American Journal of
Economics and Business Administration 3(1): 120-125.

170
Osgood, C., G. Suci, et al. (1957). "The Measurement of Meaning." Quoted in:
Coolican, H. (2004) Research Methods and Statistics in Psychology. 4th ed.
London.
Owens, J. and L. Price (2010). "Is E-Learning replacing the traditional Lecture?"
Education and Training Journal 52(2): 28-139.
Owston, R. (2000). "Evaluating web-based learning environments: Strategies and
Insights." CyberPsychology and Behaviour, pp. 79-87.
Oye, N., A. Iahad, et al. (2012). "The impact of e-learning on students performance in
tertiary institutions." IRACST – International Journal of Computer Networks
and Wireless Communications (IJCNWC) 2.
Paris, P. (2004). "E-Learning: A study on secondary students‟ attitudes towards
online web assisted learning." International Education Journal 5: 98-112.
Park, S. (2009). "An Analysis of the Technology Acceptance Model in Understanding
University Students‟ Behavioral Intention to Use e-Learning." Educational
Technology & Society, 12 (3), 150–162.
Park, Y. and J. Chen (2007). "Acceptance and adoption of the innovative use of
smartphone." Industrial Management and Data Systems 107: 1349-1365.
Parker, K., A. Lenhart, et al. (2011). "The digital revolution and higher education:
College presidents, public differ on value of online learning."
http://www.pewsocialtrends.org/2011/08/28/the-digital-revolution-and-
highereducation/2/.
Parsazadeh, N., N. Megat, et al. (2013). "A review on the success factors of e-
learning." Universiti Teknologi Malaysia, Kuala Lumpur, Malaysia: 42-49.
Peltier, J., J. Schibrowsky, et al. (2007). "The interdependence of the factors
influencing the perceived quality of the online learning experience: A causal
model." Journal of Marketing Education 29(2): 140-153.
Picciano, G. (2002). "Beyond student perceptions issues interaction presence
performance online course." Journal for Asynchronous Learning Networks
JALN 6: 21-40.
171
Piccoli, G., R. Ahmad, et al. (2001). "Web-Based Virtual Learning Environments: A
Research Framework and a Preliminary Assessment of Effectiveness in Basic
IT Skills Training." MIS Quarterly 40: 401-426.
Pituch, K. and Y. Lee (2006). "The Influence of System Characteristics on E-
Learning Use." Computers & Education 47: 838–852.
Preece, J., Y. Rogers, et al. (2002). "Interaction Design: Beyond Human-Computer
Interaction."
Presley, A. and T. Presley (2009). "Factors influencing student acceptance and use of
academic portals." Journal of computing in higher education 21(3): 167-182.
Puri, G. (2012). "Critical success Factors in e-Learning – An empirical study."
International Journal of Multidisciplinary 1(2): 149-161.
Raaij, E. and J. Schepers (2008). "The Acceptance and Use of a Virtual Learning
Environment in China." Computers & Education 50: 838–852.
Rahamat, R., P. Shah, et al. (2012). "Measuring learners‟ perceived satisfaction
towards e-learning material and environment." WSEAS Transactions on
Advances in Engineering Education 3(9): 72-83.
Reisetter, M., L. Lapointe, et al. (2007). "The impact of altered realties: Implications
of online delivery for learners‟ interactions, expectations, and learning skills."
International Journal on E-learning 6(1): 55-80.
Riddell, R. (2013). "12 learning management system providers and what they bring to
classrooms."http://www.educationdive.com/news/12-learnin
gmanagementsystem-providers-and-what-they-bring-to-classrooms/97613/.
Rivera, J., M. McAlister, et al. (2002). "A comparison of student outcomes &
satisfaction between traditional & web based course offerings." Journal of
Distance Learning Administration 5(2).
Robson, C. (2002). "Real World Research." Oxford: Blackwell Publishing.
172
Roca, J., C. Chiu, et al. (2006). "Understanding E-Learning Continuous Intention: An
Extension of the Technology Acceptance Model." International Journal of
Human–Computer Studies 64: 683–696.
Rosenthal, R. and R. Rosnow (1975). "The volunteer subject." New York.
Rovai, A. and J. Baker (2005). "Gender differences in online learning: Sense of
community, perceived learning and interpersonal interactions." Quarterly
Review of Distance Education 6(1): 31- 44.
Sallum, S. (2008). "Learning Management System Implementation:Building Strategic
Change."http://findarticles.com/p/articles/mi_hb5835/is_200801/ai_n3228167
7/?tag=content;col1.
Salmeron, J. (2009). "Augmented fuzzy cognitive maps for modelling LMS critical
success factors." Knowledge-Based Systems 22: 275–278.
Salmon, G. (2000). "Computer Mediated Conferencing for Management Learning at
the Open University." Management Learning 31: 491-502.
Salter, G. (2003). "Comparing online and traditional teaching- a different approach."
Campus-Wide Information System 20(4): 137-145.
Sandersa, D. and A. Morrison (2011). "Student Attitudes toward Web-Enhanced
Instruction in an Introductory Biology Course." Journal of Research on
Computing in Education 33(3): 251-262.
Santhanam, R., S. Sasidharan, et al. (2008). "Using self-regulatory learning to
enhance e-learning-based information technology training." Information
Systems Research 19(1): 26–47.
Sayers, H., M. Nicell, et al. (2004). "Supporting and assessing first year
programming: the use of WebCT." Italics eJournal, January 3(1).
Schartz, S. (2014). "The interrelationships of university student characteristics and the
Keller Arcs motivation model in a blended digital literacy course." KANSAS
STATE UNIVERSITY Manhattan, Kansas.
173
Selim, H. (2003). "An Empirical Investigation of Student Acceptance of Course
Websites." Computers & Education, 40(4), 343-60.
Selim, H. (2005). "E-Learning Critical Success Factors: An Exploratory Investigation
of Student Perceptions." Proceedings of Information Resources Management
Association International Conference, USA: 340-346.
Selim, H. (2007). "Critical success factor for e-learnnig acceptance: confirmatory
factor models." computers & Education: 396-413.
Serhan, D. (2010). "Online learning: Through their eyes." International Journal of
Instructional Media 37(1): 19-24.
Siragusa, L. and K. Dixon (2008). "Planned behaviour: Student attitudes towards the
use of ICT interactions in higher education." Proceedings ascilite Melbourne
2008.RetrievedMay3,2013,fromhttp://www.swaraunib.com/indra/Sistem%20i
nformasi/TPB/siragusa.pdf
Sivo, S., C. Pan, et al. (2007). "Combined longitudinal effects of attitude and
subjective norms on student outcomes in a web-enhanced course: A structural
equation modelling approach." British Journal of Educational Technology
38(5): 861-875.
So, H. and T. Brush (2008). "Student perceptions of collaborative learning, social
presence and satisfaction in a blended learning environment: Relationships
and critical factors." Computers & Education 51(1): 318–336.
Solomon, Oludayo, et al. (2013). "E-learning Implementation Critical Success
Factors." Proceedings of the International MultiConference of Engineers and
Computer Scientists Vol I.
Soon, K., K. Sook, et al. (2000). "The effects of Internet-based distance learning in
nursing." Computers in Nursing 18: 19-25.
Soong, B., H. Chan, et al. (2001). "Critical success factors for on-line course
resources." Computers & Education 36: 101-120.
Storey, M., B. Phillips, et al. (2002). "Evaluating the usability of web-based learning
tools." Educational Technology & Society 5(3): 91-100.

174
Sumner, M. and D. Hostetler (1999). "Factors Influencing the Adoption of
Technology in Teaching." The Journal of Computer Information Systems 40:
81.
Sun, P., J. Ray, et al. (2008). "What drives a successful e-Learning? An empirical
investigation of the critical factors influencing learner satisfaction." Institute
of Information and Computer Education, National Kaohsiung Normal
University, 116 Ho-Ping First Road, Kaohsiung 802, Taiwan, ROC.
Suri, G. and S. Sharma (2013). "The Impact of Gender on Attitude Towards
Computer Technology and ELearning: An Exploratory Study of Punjab
University, India." International Journal of Engineering Research 2(2).
Swan, K. (2001). "Virtual Interaction: Design Factors Affecting Student Satisfaction
and Perceived Learning in Asynchronous Online Courses." Distance
Education 22: 306-311.
Tabak, F. and N. Nguyen (2013). "Technology Acceptance and Performance in
Online Learning Environments: Impact of Self-Regulation." MERLOT
Journal of Online Learning and Teaching 9(1).
Tagoe, M. (2012). "Students‟ perceptions on incorporating e-learning into teaching
and learning at the University of Ghana." International Journal of Education
and Development using Information and Communication Technology
(IJEDICT) 8(1): 91-103.
Taha, M. (2013). "Investigating Critical Factors Influencing the Success of E-
Learning." Paper presented at PwD Doctoral Symposium Brunel University
and Ahlia University, Bahrain, 28- 29, May, 2013.
Taha, M. (2014). "Investigating the Success of E-Learning in Secondary Schools: The
Case of the Kingdom of Bahrain." Brunel University.
Tawei, D. and C. Chang (2011). "The effect of academic discipline and gender
difference on taiwanese college students‟ learning styles and strategies in web-
based learning environments." TOJET: The Turkish Online Journal of
Educational Technology 10(3): 265-272.

175
Telia, A. (2012). "System-related Factors that Predict Students' Satisfaction with the
Blackboard Learning System at the University of Botswana." Library and
Information Science 22.
Thompson, R., C. Higgins, et al. (1991). "Personal computing: Toward a conceptual
model of utilization." MIS Quarterly 15: 125-143.
Thurmond, V., K. Wambach, et al. (2002). "Evaluation of Student Satisfaction:
Determining the Impact of a Web-Based Environment by Controlling for
Student Characteristics." American Journal of Distance Education 16: 169.
Thurstone, L. (1931). "The measurement of social attitude. Journal of Abnormal and
Social Psychology." Quoted in: Coolican, H. (2004) Research Methods and
Statistics in Psychology. 4th ed. London.
Trevino, L. and J. Webster (1992). "Flow in computer-mediated communication."
Communication Research 19: 539-573.
Tsai, M. and C. Tsai (2010). "Junior high school students' Internet usage and self-
efficacy: A reexamination of the gender gap." Computers & Education 4:
1182-1192.
Venkatesh, V. (1999). "Creation of favourable user perceptions: Exploring the role of
intrinsic motivation." MIS Quarterly 23: 239-260.
Venkatesh, V. and F. Davis (2000). "A theoretical extension of the technology
acceptance model: Four longitudinal field studies." Management Science,
46(2), 186-204.
Vilela-Malabanan (2014). "Investigating Academics‟ Voluntary Usage of a Learning
Management System." School of Business I.T. and Logistics. RMIT
University.
Volery, T. and D. Lord (2000). "Critical success factors in online education." The
International Journal of EducationManagement 14(5), 216-223.
Vrana, V., G. Fragidis, et al. (2013). "Analysing academic staff and students‟ attitudes
towards the adoption of e-learning." Retrieved May 5, 2013 from
http://asiapacific-odl.oum.edu.my/C70/F275.pdf.

176
Wan, Z., Y. Fang, et al. (2007). "The Role of Information Technology in Technology-
Mediated Learning: A Review of the Past for the Future." Journal of
Information Systems Education 40: 183-192.
Wang, M. and R. Shen (2011). "Message design for mobile learning: Learning
theories, human cognition and design principles _1214 1..15." British Journal
of Educational Technology.
Watters, M. and P. Roberston (2009). "Online delivery of accounting courses: Student
perceptions." Academy of Educational Leadership Journal 13(3): 51-57.
Webster, J. and P. Hackley (1997). "Teaching Effectiveness in Technology-Mediated
Distance Learning." Academy of Management Journal 40: 1282-1309.
Wellman, G. and H. Marcinkiewicz (2004). "Online learning and time-on-task:
impact of proctored vs. un-proctored testing." Journal of Asynchronous
Learning Networks 8: 93-104.
Wells, J. (2000). "Effects Of An On-Line Computer-Mediated Communication
Course, Prior Computer Experience and Internet Knowledge, and Learning
Styles On Students' Internet Attitudes Computer-Mediated Technologies and
New Educational Challenges." Journal of Industrial Teacher Education 37(3):
22-53.
Wen, J. and W. Shih (2008). "Exploring the information literacy competence
standards for elementary and high school teachers." Computers & Education
50(3): 787-806.
Wong, L. (2013). "Student Engagement with Online Resources and Its Impact on
Learning Outcomes." Journal of Information Technology Education 12.
Worrall, M. (2011). "Australian Flexible Learning Framework " 2011 E-learning
Benchmarking Survey Website: flexiblelearning.net.au.
Wu, J., R. Tennyson, et al. (2010). "A study of student satisfaction in a blended e-
learning system environment." Computers & Education 55(1): 155–164.
Xaymoungkhoun, O., W. Bhuasiri, et al. (2012). "The Critical Success Factors of e-
Learning in Developing Countries." Computers & Education 58, 843–855.

177
Xu, D. and S. Jaggars (2013). "Adaptability to Online Learning: Differences Across
Types of Students and Academic Subject Areas." CCRC Community College
Research Center.
Yang, F. and C. Tsai (2008). "Investigating university student preferences and beliefs
about learning in the web-based context." Comput. Educ 50(4): 1284-1303.
Yukselturk, E. and S. Bulut (2007). "Predictors for Student Success in an Online
Course." Educational Technology & Society 10: 71-83.
Zewayed, N., S. Maynard, et al. (2011). "Factors Influencing Students‟ Acceptance of
E-Learning at Secondary Schools." Proceedings of World Conference on E-
Learning in Corporate, Government, Healthcare, and Higher Education 2011
http://www.editlib.org/p/38840.
Zhu, C. (2012). "Student satisfaction, performance and knowledge construction in
online collaborative learning." Educational Technology and Society 15(1):
127-136.
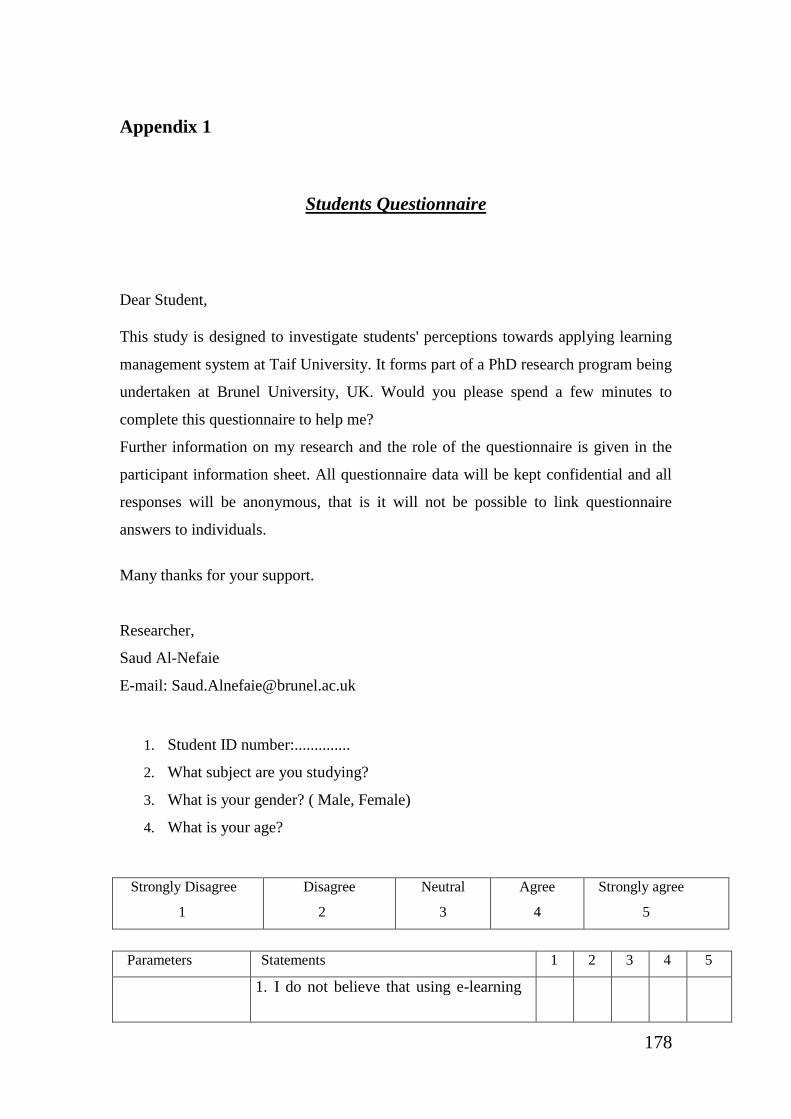
178
Appendix 1
Students Questionnaire
Dear Student,
This study is designed to investigate students' perceptions towards applying learning
management system at Taif University. It forms part of a PhD research program being
undertaken at Brunel University, UK. Would you please spend a few minutes to
complete this questionnaire to help me?
Further information on my research and the role of the questionnaire is given in the
participant information sheet. All questionnaire data will be kept confidential and all
responses will be anonymous, that is it will not be possible to link questionnaire
answers to individuals.
Many thanks for your support.
Researcher,
Saud Al-Nefaie
E-mail: [email protected]
1. Student ID number:..............
2. What subject are you studying?
3. What is your gender? ( Male, Female)
4. What is your age?
Strongly agree
5
Agree
4
Neutral
3
Disagree
2
Strongly Disagree
1
Parameters Statements 1 2 3 4 5
1. I do not believe that using e-learning

179
Attitude
requires technical ability.
2. I do not believe that using e-learning
will help me to obtain good grades.
3. E-learning will help me to achieve the
learning outcomes required for my
studies.
4. Using e-learning in my studies will
help me to learn the subject
thoroughly.
e-learning self-
efficacy
5. I would not feel confident using e-
leaning.
6. I would feel confident using online
learning content.
7. I have the necessary skills for using an e-
learning system.
Perceived
usefulness
8. I do not believe e-learning content is
informative.
9. E-learning would not increase my
academic productivity.
10. E-learning would not make it easier to
study course content.
11. The e-learning in my course will in the
future help me to get a better job.
12. E-learning will improve my learning
performance.
Behavioural
intention
13. I am going to use e-learning content to
assist my learning.
14. I am not going to use e-learning as an
autonomous learning tool.
15. I am not going to be a heavy user of an e-
learning system.
Interactive learning
activities
16. I would like to share my knowledge
through e-learning tools.
17. I do not believe e-learning can assist

180
teacher-learner interaction.
Confidence in using
technology
18. Using e-learning in my course will not
increase my confidence in using
computers and technology.
19. I feel the information technologies used
in e-Learning have many useful functions
20. Having e-learning to support face-to-face
lectures will improve the quality of the
learning.
21. Using e-learning is only advisable for people with a lot of patience. (please
explain your answer)
....................................................................................................................................
....................................................................................................................................
22. How you will be able to be in control of your learning because of using e-learning?
(please explain your answer)
....................................................................................................................................
..........................................................................................................................................
Tank you

181
Appendix 2
Interview questions: Academic staff
1. Do you have experiences of using e-learning in your teaching? (If No, please go
to second section.)
2. Would you please tell me about your experience of using e-learning in your
teaching? Are you satisfied with it? Why?
3. Was the use of e-learning helpful (for you as teacher and for the students as
learners)? Why?
4. Which e-learning tools did you like to use for this module and which ones did you
not like to use?
5. If you wanted to change something on the e-learning environment for your
module what would it be?
6. Did you have problems/difficulties using the e-learning environment? If so, whom
did you ask for help?
7. What do you think might affect the students learning in face-to-face classes that
could be supported by e-learning software?
8. Do you think that the availability of e-learning software could help you to provide
all necessary learning materials to the students?
9. As all of the module material available online, do you think that the students have
the opportunity to pass the exam even if they miss the lectures?
If you have no experience using e-learning in your teaching and
e-learning software.
1. Do you think the use of e-learning will be helpful (for you as teacher and for the
students as learners)? Why?
2. Would you like to use e-learning with your current students?
3. How many years have you been teaching this course without e-learning software?
4. What do you think might affect students learning in face-to-face classes that
cannot be supported by e-learning software?
5. Do you think that the availability of e-learning software could help you to provide
all the necessary materials to the students?
6. As all of the module material available online, do you think that the students have
the opportunity to pass the exam even if they miss the lectures?
7. Do you think you will achieve the course outcomes by using the e-learning
software or do you think it will not affect the learning outcomes of the course?

182
Appendix 3
Students Questionnaire
Dear Student,
This study is designed to investigate learners‟ satisfaction, behavioral intentions, and
the effectiveness of the Blackboard system at Taif University. It forms part of a PhD
research program being undertaken at Brunel University, UK. Would you please
spend a few minutes to complete this questionnaire to help me?
Further information on my research and the role of the questionnaire is given in the
participant information sheet. All questionnaire data will be kept confidential and all
responses will be anonymous, that is it will not be possible to link questionnaire
answers to individuals.
Many thanks for your support.
Researcher,
Saud Al-Nefaie
E-mail: [email protected]
1. Student ID number:..............
2. What is your age?
3. What is your gender? (Male, Female)?
4. What subject are you studying?

183
Strongly agree
5
Agree
4
Neutral
3
Disagree
2
Strongly Disagree
1
constructs Statements 1 2 3 4 5
Perceived self-efficacy
1. I do not feel confident using the Blackboard system
2. I feel confident operating the Blackboard system functions
3. I feel confident using online the Blackboard system
contents.
Perceived satisfaction
4. I am dissatisfied with using the Blackboard system as a
learning assisted tool.
5. I am satisfied with using the Blackboard system functions
6. I am dissatisfied with the Blackboard system contents
7. I am satisfied with multimedia instruction
Perceived usefulness
8. I believe the Blackboard system contents are informative
9. I believe the Blackboard system is a useful learning tool
10. I do not believe the Blackboard system contents are useful
Behavioral intention
11. I intend to use the Blackboard system to assist my learning
12. I do not intend to use the Blackboard system content to
assist my learning
13. I intend to use the Blackboard system as an autonomous
learning tool
e-learning system
quality
14. I am dissatisfied with the Blackboard system functions
15. I am satisfied the Internet speed
16. I am satisfied with the Blackboard system content
17. I am dissatisfied with the Blackboard system interaction
Interactive learning
activities
18. I would like to share my the Blackboard system experience
19. I do not believe the Blackboard system can assist teacher-
learner interaction
20. I believe the Blackboard system can assist learner-learner
interaction
E-learning
effectiveness
21. I believe the Blackboard system can assist learning
efficiency
22. I believe the Blackboard system can assist learning
performance
23. I do not believe the Blackboard system can assist learning
motivation
Multimedia instruction
24. I like to use voice media instruction
25. I like to use video media instruction
26. I do not like to use multimedia instruction

184
27. Please use the space below to write down any comments you have about your
Blackboard system experience that was not covered in this survey.
………………………………………………………………………………………
………………………………………………………………………………………
………………
Tank you
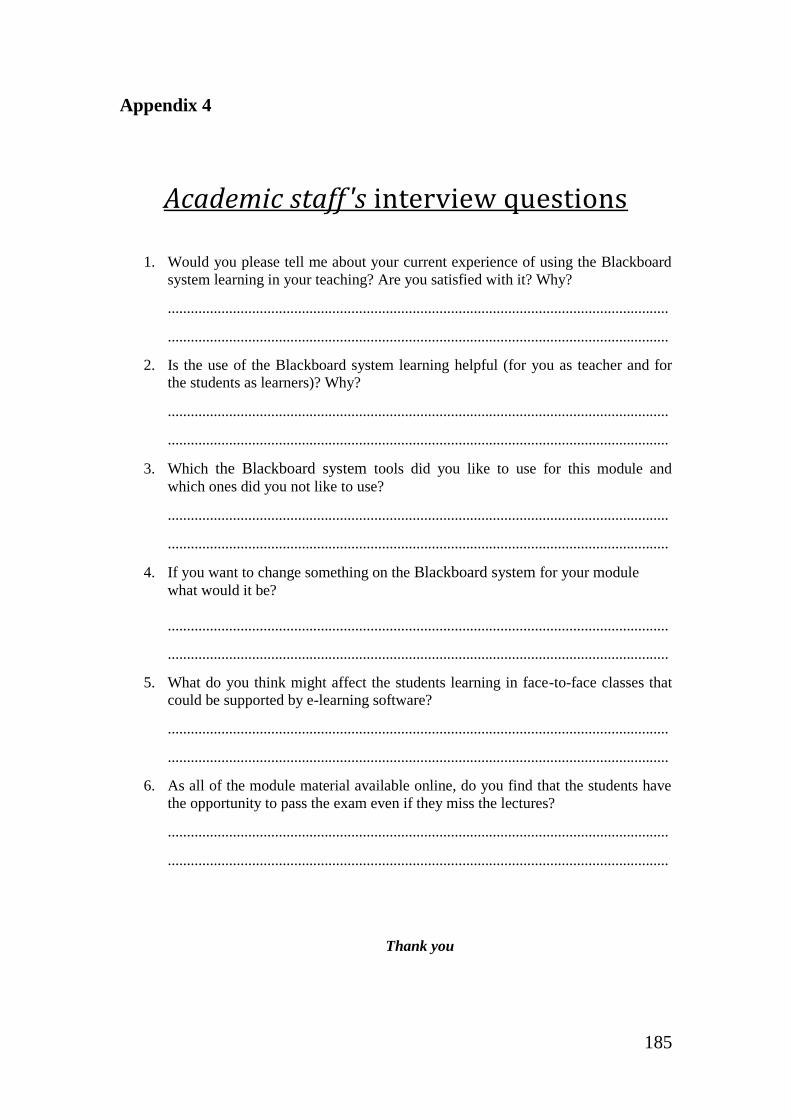
185
Appendix 4
Academic staff 's interview questions
1. Would you please tell me about your current experience of using the Blackboard
system learning in your teaching? Are you satisfied with it? Why?
...................................................................................................................................
...................................................................................................................................
2. Is the use of the Blackboard system learning helpful (for you as teacher and for
the students as learners)? Why?
...................................................................................................................................
...................................................................................................................................
3. Which the Blackboard system tools did you like to use for this module and
which ones did you not like to use?
...................................................................................................................................
...................................................................................................................................
4. If you want to change something on the Blackboard system for your module
what would it be?
...................................................................................................................................
...................................................................................................................................
5. What do you think might affect the students learning in face-to-face classes that
could be supported by e-learning software?
...................................................................................................................................
...................................................................................................................................
6. As all of the module material available online, do you find that the students have
the opportunity to pass the exam even if they miss the lectures?
...................................................................................................................................
...................................................................................................................................
Thank you

186
Appendix 5
Students Questionnaire
Dear Student,
This study is designed to investigate the factors that affect use of learning
management system (Blackboard) by undergraduate students at Taif University. It
forms part of a PhD research program being undertaken at Brunel University, UK.
Would you please spend a few minutes to complete this questionnaire to help me?
Further information on my research and the role of the questionnaire is given in the
participant information sheet. All questionnaire data will be kept confidential and all
responses will be anonymous, that is it will not be possible to link questionnaire
answers to individuals.
Many thanks for your support.
Researcher,
Saud Al-Nefaie
E-mail: [email protected]
1. Student ID number :.................
2. What is your gender? (Male, Female)?
3. What subject are you studying?
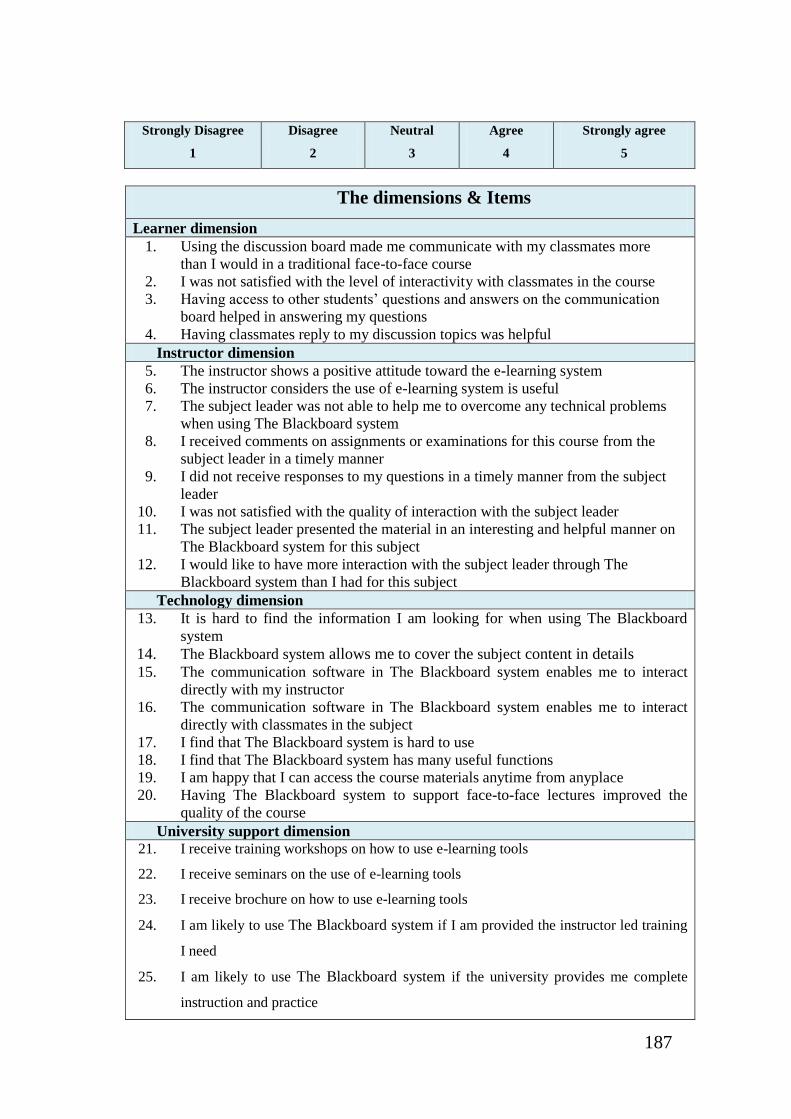
187
Strongly agree
5
Agree
4
Neutral
3
Disagree
2
Strongly Disagree
1
The dimensions & Items
Learner dimension
1. Using the discussion board made me communicate with my classmates more
than I would in a traditional face-to-face course
2. I was not satisfied with the level of interactivity with classmates in the course
3. Having access to other students‟ questions and answers on the communication
board helped in answering my questions
4. Having classmates reply to my discussion topics was helpful
Instructor dimension
5. The instructor shows a positive attitude toward the e-learning system
6. The instructor considers the use of e-learning system is useful
7. The subject leader was not able to help me to overcome any technical problems
when using The Blackboard system
8. I received comments on assignments or examinations for this course from the
subject leader in a timely manner
9. I did not receive responses to my questions in a timely manner from the subject
leader
10. I was not satisfied with the quality of interaction with the subject leader
11. The subject leader presented the material in an interesting and helpful manner on
The Blackboard system for this subject
12. I would like to have more interaction with the subject leader through The
Blackboard system than I had for this subject
Technology dimension
13. It is hard to find the information I am looking for when using The Blackboard
system
14. The Blackboard system allows me to cover the subject content in details 15. The communication software in The Blackboard system enables me to interact
directly with my instructor
16. The communication software in The Blackboard system enables me to interact
directly with classmates in the subject
17. I find that The Blackboard system is hard to use
18. I find that The Blackboard system has many useful functions
19. I am happy that I can access the course materials anytime from anyplace
20. Having The Blackboard system to support face-to-face lectures improved the
quality of the course
University support dimension
21. I receive training workshops on how to use e-learning tools
22. I receive seminars on the use of e-learning tools
23. I receive brochure on how to use e-learning tools
24. I am likely to use The Blackboard system if I am provided the instructor led training
I need
25. I am likely to use The Blackboard system if the university provides me complete
instruction and practice

188
26. I am likely to use The Blackboard system if the university provides good technical
support
Students attitude towards the Blackboard system
27. I would not recommend using The Blackboard system for other students
28. find that using The Blackboard system helps me to obtain good grades
29. I enjoy using The Blackboard system on my course
30. Using The Blackboard system in this subject increased my ability to pass this
subject‟s coursework assessment
31. Using The Blackboard system in this subject kept my interest engaged in the
subject.
32. Using The Blackboard system in this subject helped me to learn the subject
thoroughly.
33. Using The Blackboard system cost me time but improved my engagement and
commitment to the subject