investigating fruit juice authenticity using ms - waters corporation food research
TRANSCRIPT
©2015 Waters Corporation 1
Investigating Fruit Juice Authenticity using
MS and ‘Omics approaches
©2015 Waters Corporation 2
Presentation overview
Project Background
Workflow
Results o UV
o MS
Sample Comparison o Visual inspection
o Software interpretation
Why are they different? o Are there any marker compounds?
o Can we ID marker compounds?
Ion mobility for discovery of natural compounds
©2015 Waters Corporation 3
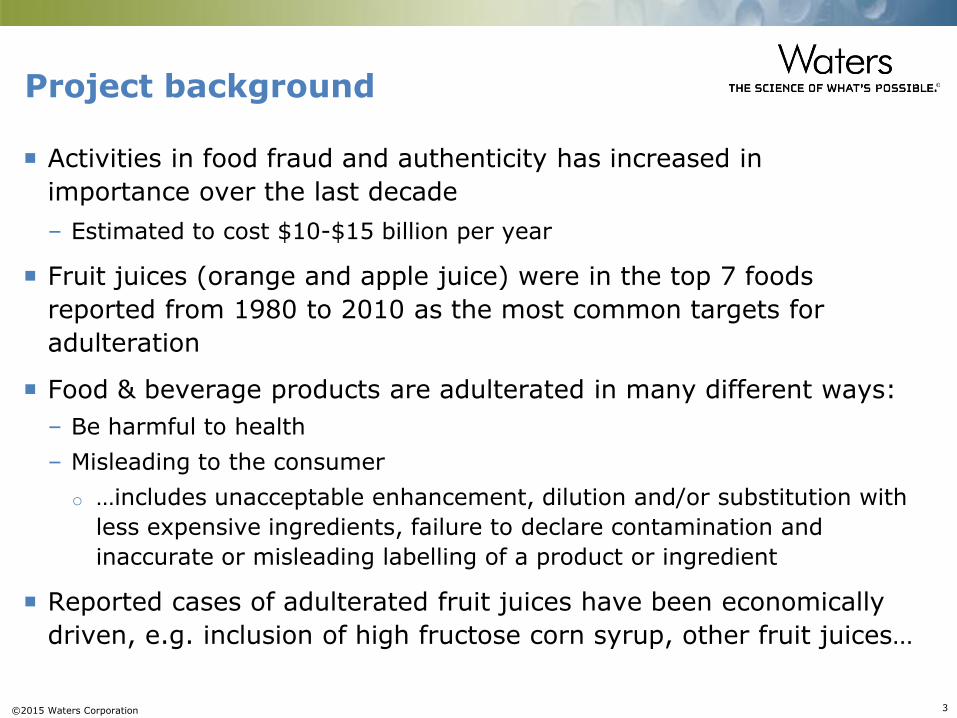
Project background
Activities in food fraud and authenticity has increased in
importance over the last decade
– Estimated to cost $10-$15 billion per year
Fruit juices (orange and apple juice) were in the top 7 foods
reported from 1980 to 2010 as the most common targets for
adulteration
Food & beverage products are adulterated in many different ways:
– Be harmful to health
– Misleading to the consumer
o …includes unacceptable enhancement, dilution and/or substitution with
less expensive ingredients, failure to declare contamination and
inaccurate or misleading labelling of a product or ingredient
Reported cases of adulterated fruit juices have been economically
driven, e.g. inclusion of high fructose corn syrup, other fruit juices…
©2015 Waters Corporation 4
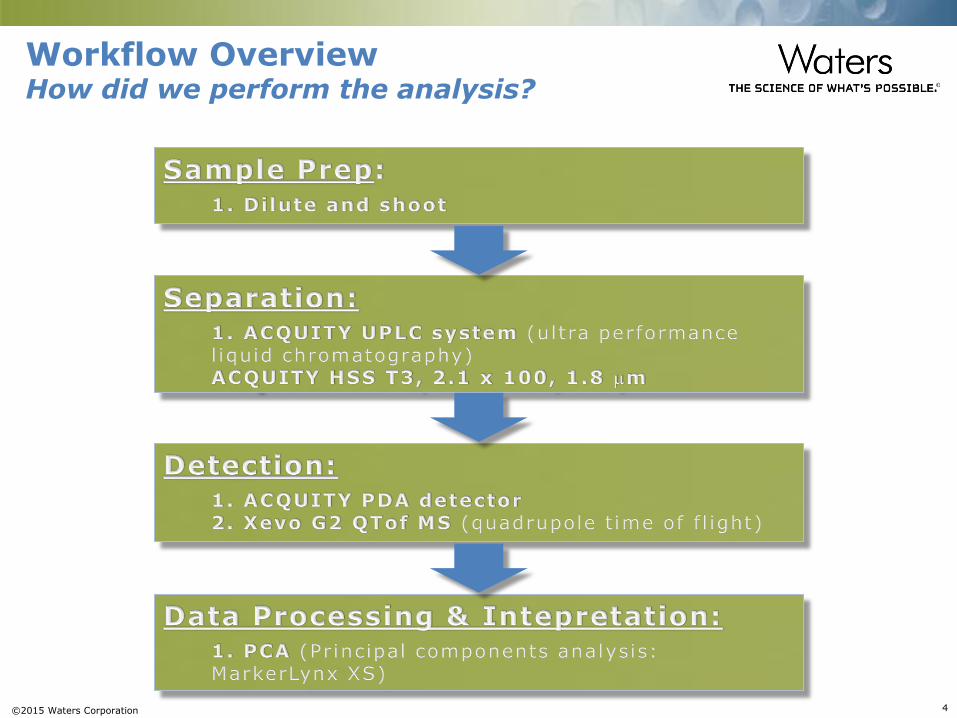
Workflow Overview How did we perform the analysis?
©2015 Waters Corporation 5
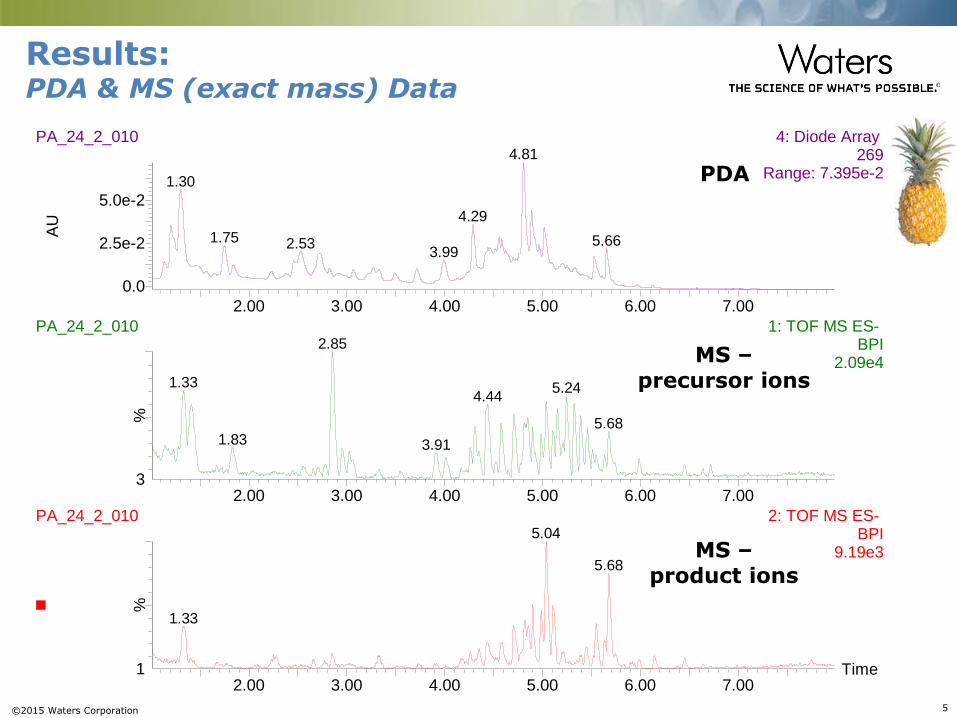
Results: PDA & MS (exact mass) Data
Time2.00 3.00 4.00 5.00 6.00 7.00
%
1
2.00 3.00 4.00 5.00 6.00 7.00
%
3
2.00 3.00 4.00 5.00 6.00 7.00
AU
0.0
2.5e-2
5.0e-2
PA_24_2_010 4: Diode Array 269
Range: 7.395e-2
4.81
1.30
4.29
1.75 2.533.99
5.66
PA_24_2_010 1: TOF MS ES- BPI
2.09e4
2.85
1.33
1.83
5.244.44
3.91
5.68
PA_24_2_010 2: TOF MS ES- BPI
9.19e3
5.04
1.33
5.68MS –
product ions
MS – precursor ions
PDA
©2015 Waters Corporation 6
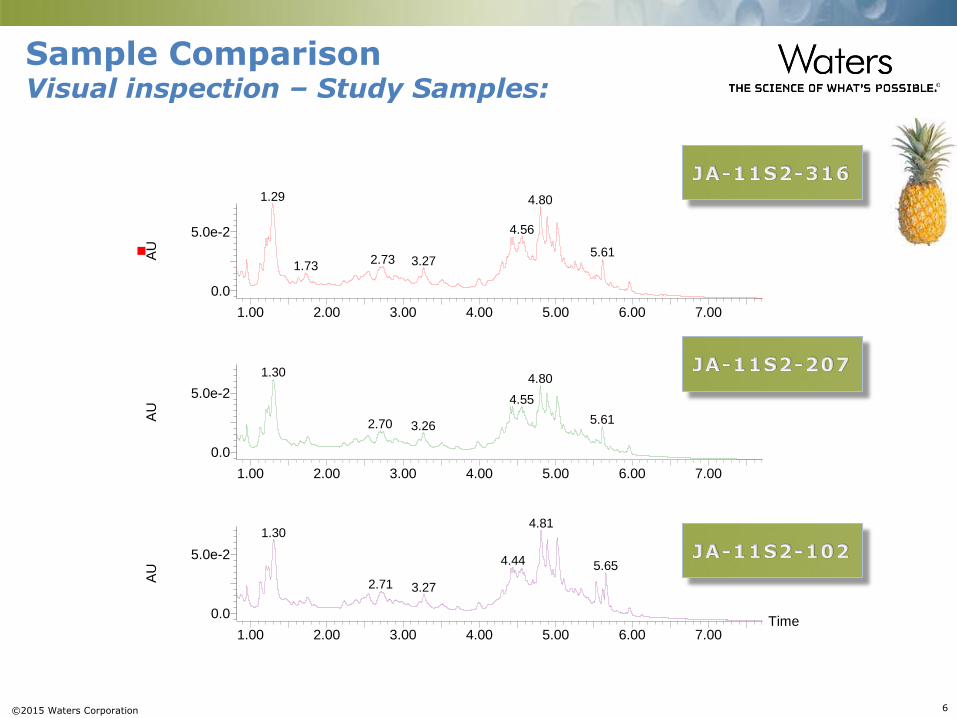
Sample Comparison Visual inspection – Study Samples:
Time1.00 2.00 3.00 4.00 5.00 6.00 7.00
AU
0.0
5.0e-2
1.00 2.00 3.00 4.00 5.00 6.00 7.00
AU
0.0
5.0e-2
1.00 2.00 3.00 4.00 5.00 6.00 7.00
AU
0.0
5.0e-2
1.29 4.80
4.56
2.731.73 3.27
5.61
1.304.80
4.55
2.70 3.265.61
4.811.30
4.44
2.71 3.27
5.65
©2015 Waters Corporation 7
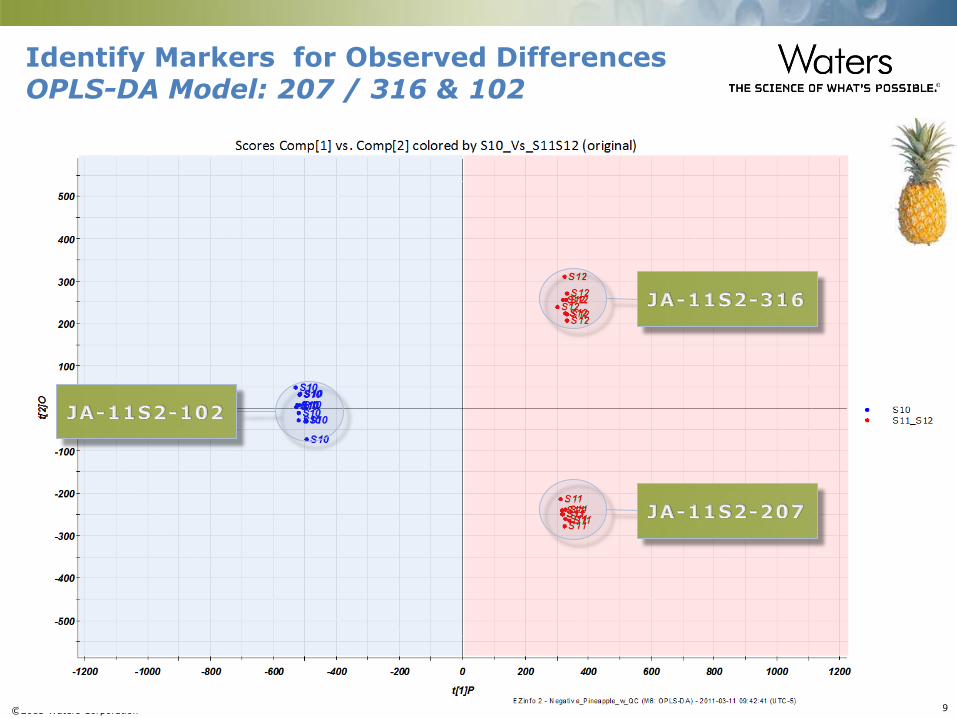
-600
-500
-400
-300
-200
-100
0
100
200
300
400
500
600
-1200 -1000 -800 -600 -400 -200 0 200 400 600 800 1000 1200
t[2]
t[1]
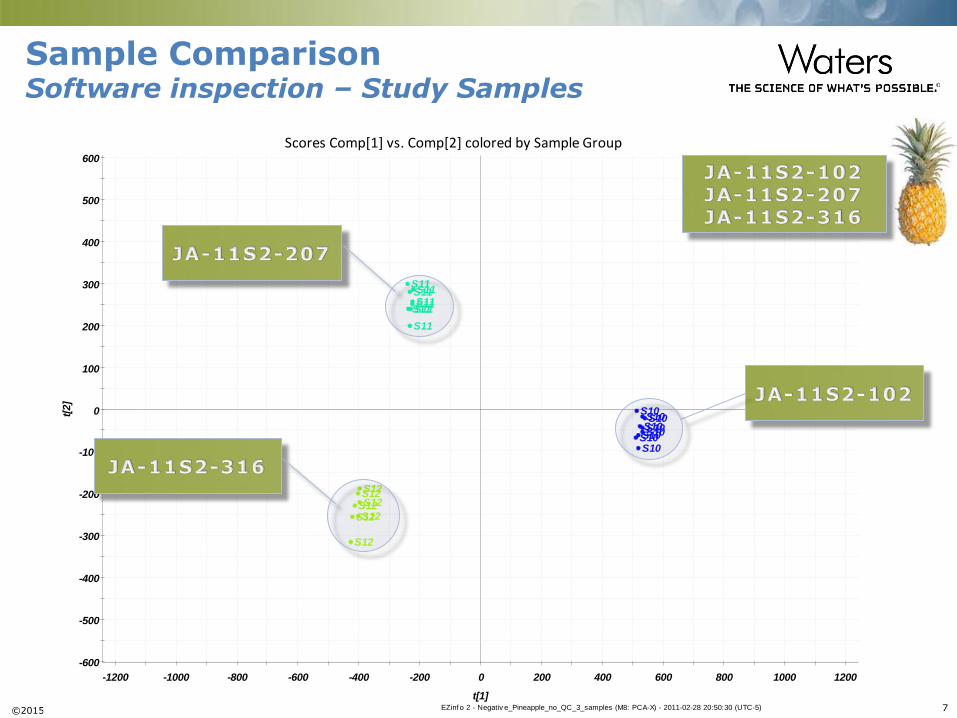
Scores Comp[1] vs. Comp[2] colored by Sample Group
S10S11S12
S12
S12
S12
S12
S12
S12S12
S11
S11S11S11S11S11S11S11
S10
S10S10S10S10
S10
S10
S10S10
EZinf o 2 - Negativ e_Pineapple_no_QC_3_samples (M8: PCA-X) - 2011-02-28 20:50:30 (UTC-5)
Sample Comparison Software inspection – Study Samples
©2015 Waters Corporation 8
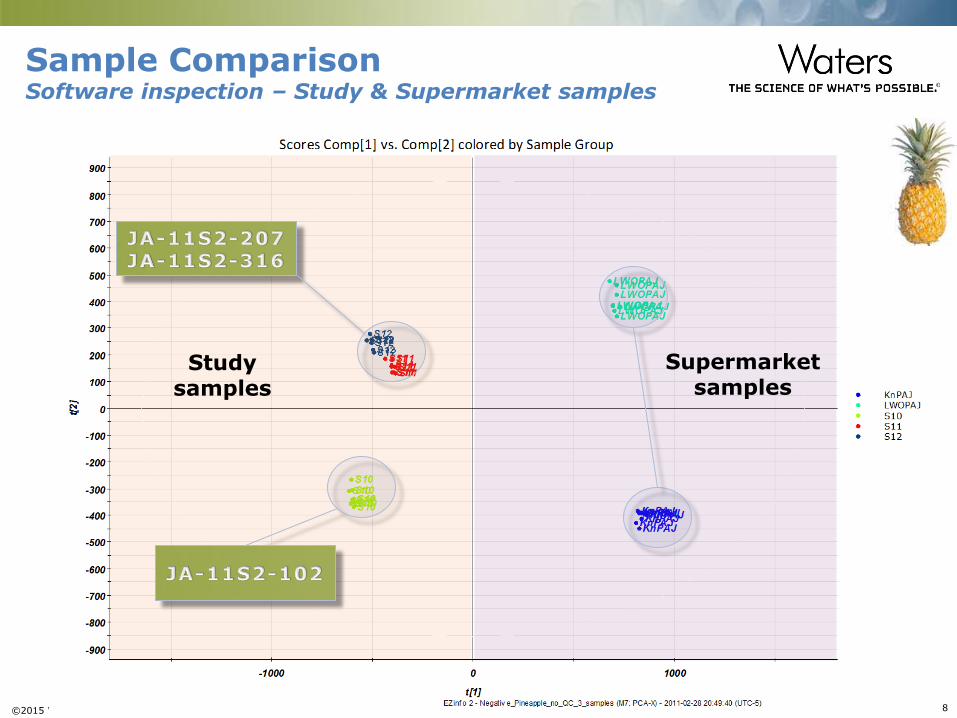
Sample Comparison Software inspection – Study & Supermarket samples
Supermarket samples
Study samples
©2015 Waters Corporation 9
Identify Markers for Observed Differences OPLS-DA Model: 207 / 316 & 102
©2015 Waters Corporation 10
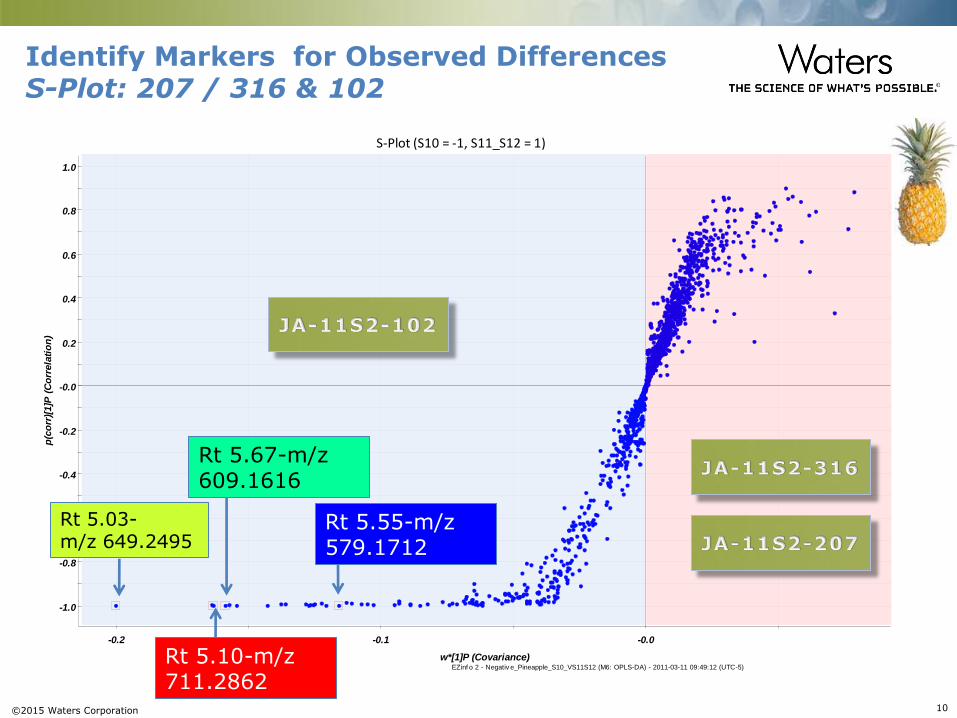
Identify Markers for Observed Differences S-Plot: 207 / 316 & 102
-1.0
-0.8
-0.6
-0.4
-0.2
-0.0
0.2
0.4
0.6
0.8
1.0
-0.2 -0.1 -0.0
p(c
orr
)[1]P
(C
orr
ela
tio
n)
w*[1]P (Covariance)
S-Plot (S10 = -1, S11_S12 = 1)
EZinf o 2 - Negativ e_Pineapple_S10_VS11S12 (M6: OPLS-DA) - 2011-03-11 09:49:12 (UTC-5)
Rt 5.03- m/z 649.2495
Rt 5.55-m/z 579.1712
Rt 5.67-m/z 609.1616
Rt 5.10-m/z 711.2862
©2015 Waters Corporation 11
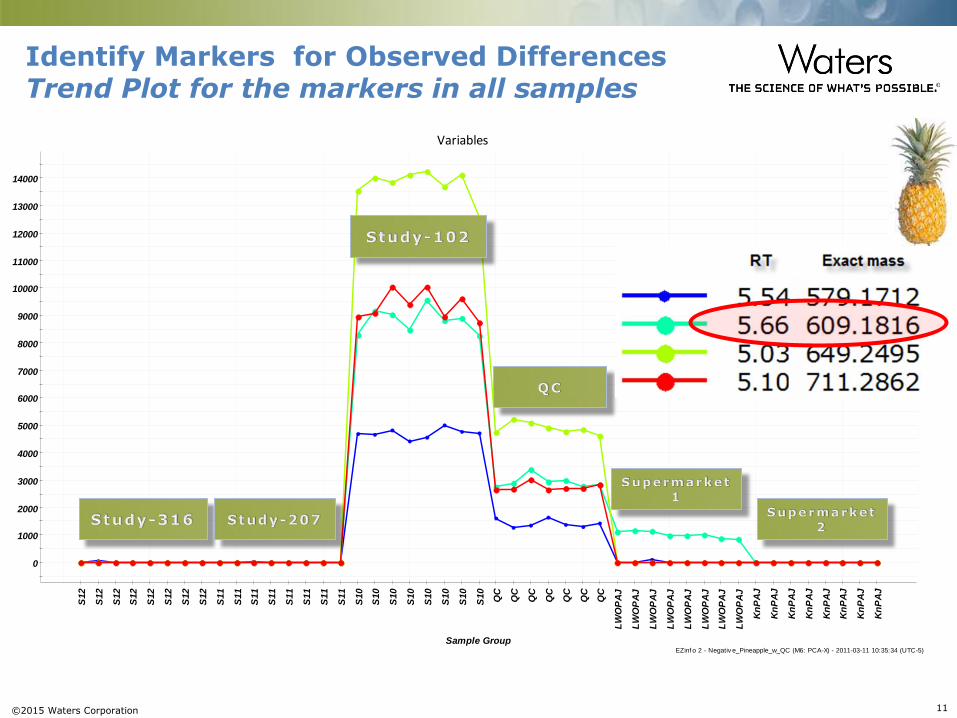
Identify Markers for Observed Differences Trend Plot for the markers in all samples
0
1000
2000
3000
4000
5000
6000
7000
8000
9000
10000
11000
12000
13000
14000
S12
S12
S12
S12
S12
S12
S12
S12
S11
S11
S11
S11
S11
S11
S11
S11
S10
S10
S10
S10
S10
S10
S10
S10
QC
QC
QC
QC
QC
QC
QC
LW
OP
AJ
LW
OP
AJ
LW
OP
AJ
LW
OP
AJ
LW
OP
AJ
LW
OP
AJ
LW
OP
AJ
LW
OP
AJ
Kn
PA
J
Kn
PA
J
Kn
PA
J
Kn
PA
J
Kn
PA
J
Kn
PA
J
Kn
PA
J
Kn
PA
J
Sample Group
Variables
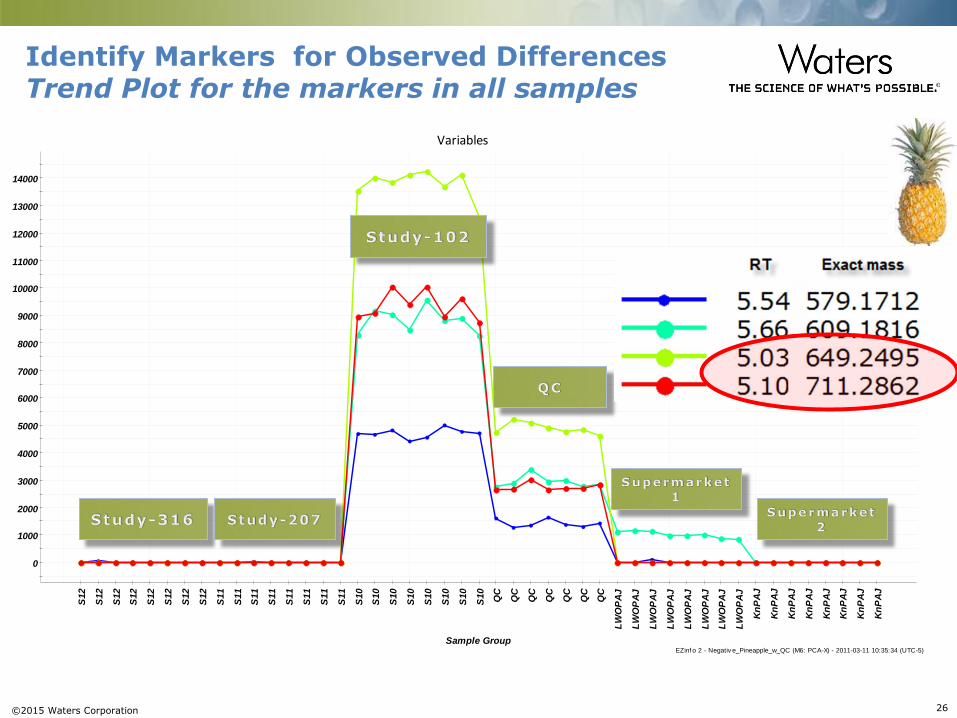
DS1: 5.55_579.1712DS1: 5.67_609.1816DS1: 5.03_649.2495DS1: 5.10_711.2862
EZinf o 2 - Negativ e_Pineapple_w_QC (M6: PCA-X) - 2011-03-11 10:35:34 (UTC-5)

©2015 Waters Corporation 12
Why are there differences?
©2015 Waters Corporation 13
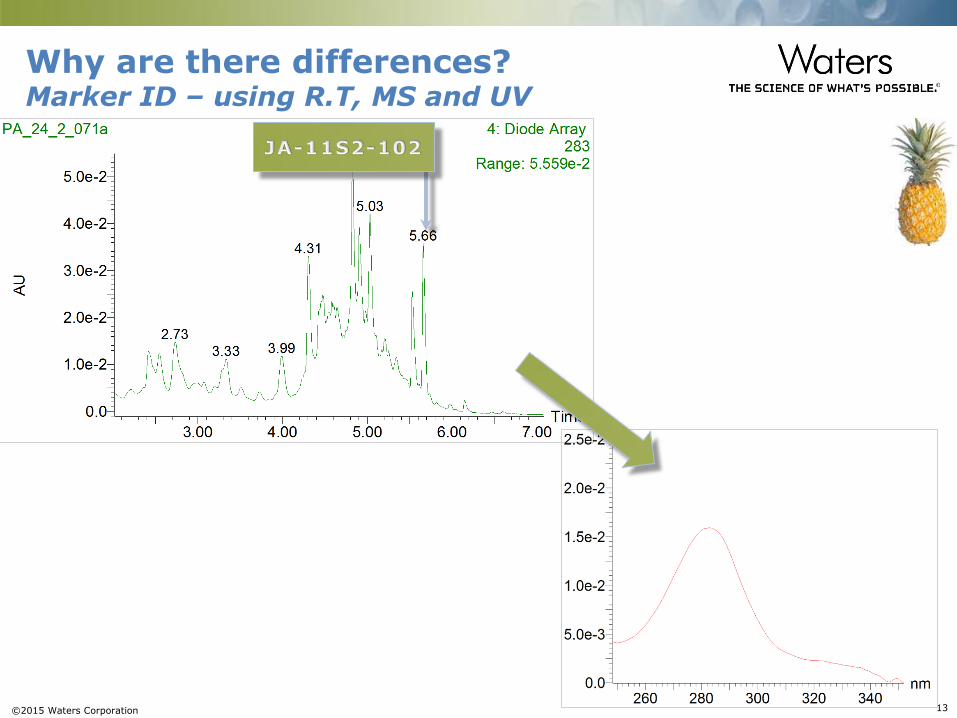
Why are there differences? Marker ID – using R.T, MS and UV
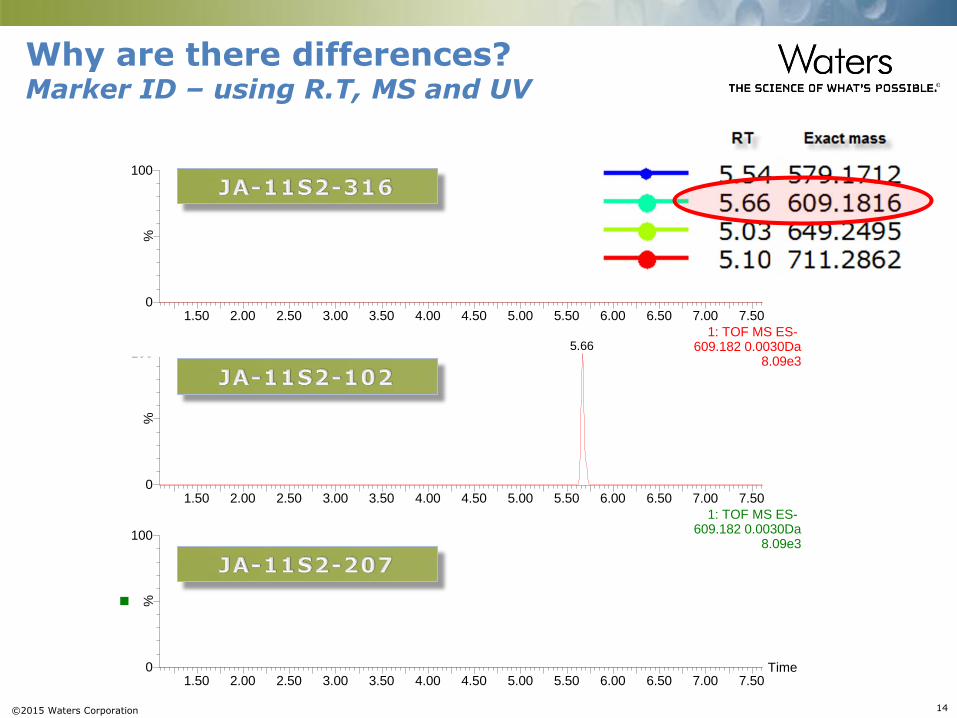
©2015 Waters Corporation 14
Time1.50 2.00 2.50 3.00 3.50 4.00 4.50 5.00 5.50 6.00 6.50 7.00 7.50
%
0
100
1.50 2.00 2.50 3.00 3.50 4.00 4.50 5.00 5.50 6.00 6.50 7.00 7.50
%
0
100
1.50 2.00 2.50 3.00 3.50 4.00 4.50 5.00 5.50 6.00 6.50 7.00 7.50
%
0
100
PA_24_2_063a 1: TOF MS ES- 609.182 0.0030Da
8.09e3
PA_24_2_062a 1: TOF MS ES- 609.182 0.0030Da
8.09e3
5.66
PA_24_2_061a 1: TOF MS ES- 609.182 0.0030Da
8.09e3
Why are there differences? Marker ID – using R.T, MS and UV
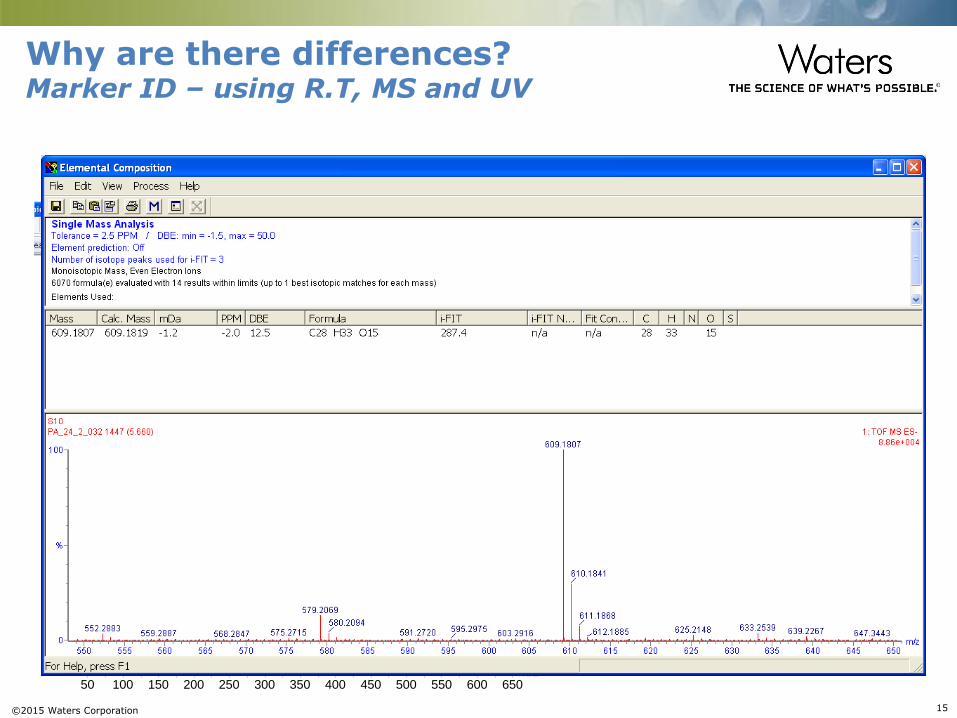
©2015 Waters Corporation 15
Why are there differences? Marker ID – using R.T, MS and UV
m/z50 100 150 200 250 300 350 400 450 500 550 600 650
%
0
100301.0706
609.1822
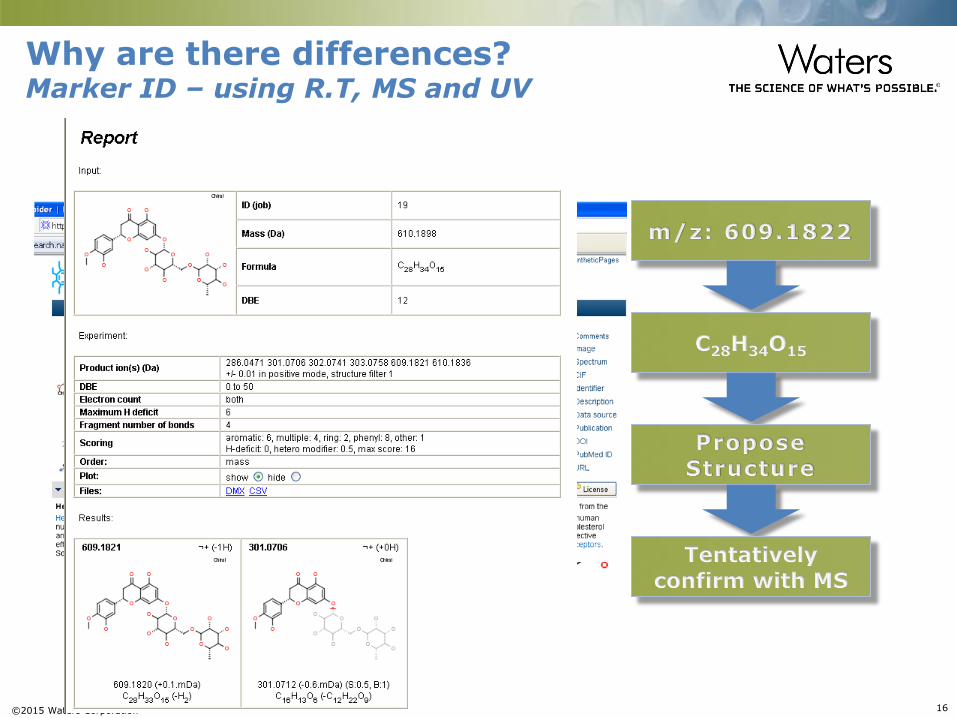
©2015 Waters Corporation 16
Why are there differences? Marker ID – using R.T, MS and UV
m/z50 100 150 200 250 300 350 400 450 500 550 600 650
%
0
100301.0706
609.1822
©2015 Waters Corporation 17
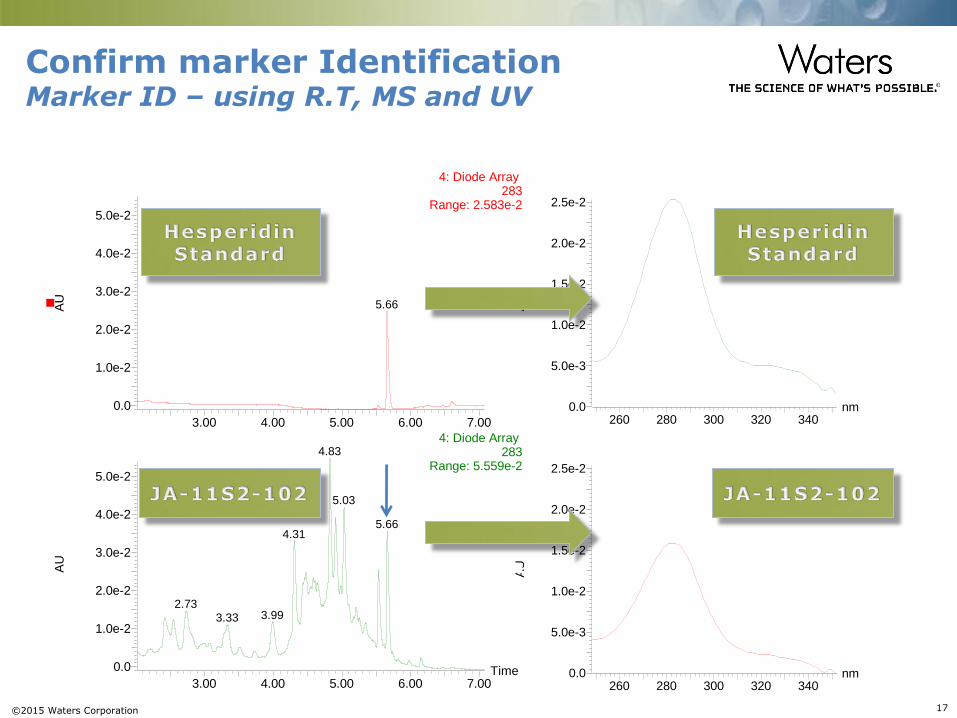
nm260 280 300 320 340
AU
0.0
5.0e-3
1.0e-2
1.5e-2
2.0e-2
2.5e-2
nm260 280 300 320 340
AU
0.0
5.0e-3
1.0e-2
1.5e-2
2.0e-2
2.5e-2
Time3.00 4.00 5.00 6.00 7.00
AU
0.0
1.0e-2
2.0e-2
3.0e-2
4.0e-2
5.0e-2
3.00 4.00 5.00 6.00 7.00
AU
0.0
1.0e-2
2.0e-2
3.0e-2
4.0e-2
5.0e-2
PA_24_2_096a 4: Diode Array 283
Range: 2.583e-2
5.66
PA_24_2_071a 4: Diode Array 283
Range: 5.559e-2
4.83
4.31
2.733.993.33
5.03
5.66
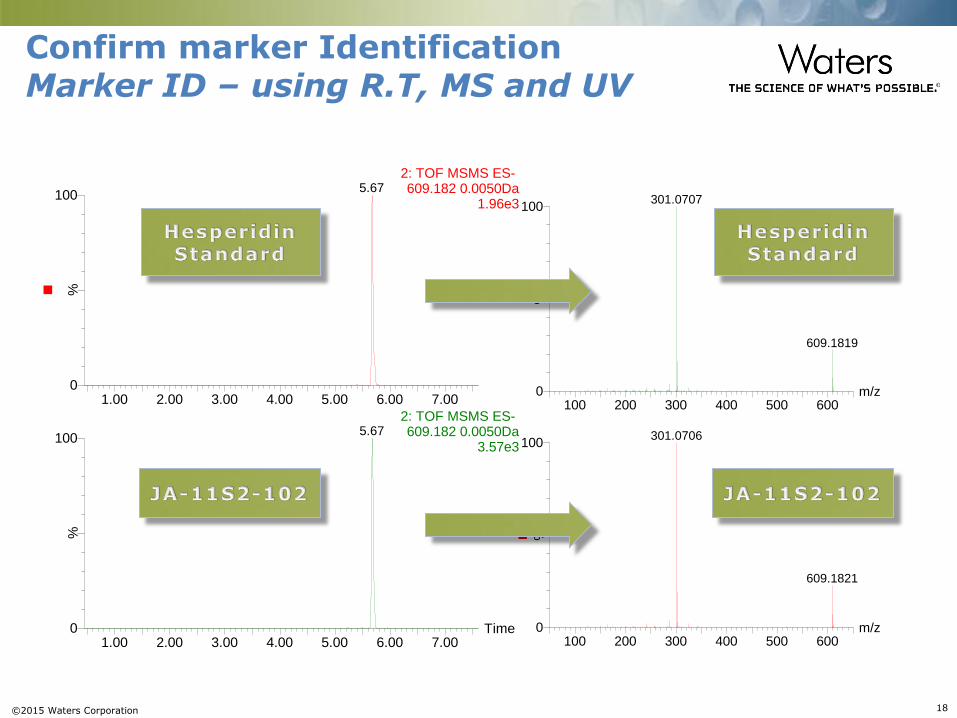
Confirm marker Identification Marker ID – using R.T, MS and UV
©2015 Waters Corporation 18
Confirm marker Identification Marker ID – using R.T, MS and UV
Time1.00 2.00 3.00 4.00 5.00 6.00 7.00
%
0
100
1.00 2.00 3.00 4.00 5.00 6.00 7.00
%
0
100
PA_24_2_098a 2: TOF MSMS ES- 609.182 0.0050Da
1.96e3
5.67
PA_24_2_093a 2: TOF MSMS ES- 609.182 0.0050Da
3.57e3
5.67
m/z100 200 300 400 500 600
%
0
100
m/z100 200 300 400 500 600
%
0
100301.0707
609.1819
301.0706
609.1821

©2015 Waters Corporation 19
Hesperidin Sources
©2015 Waters Corporation 20
Identifying other markers highlighted....
©2015 Waters Corporation 21
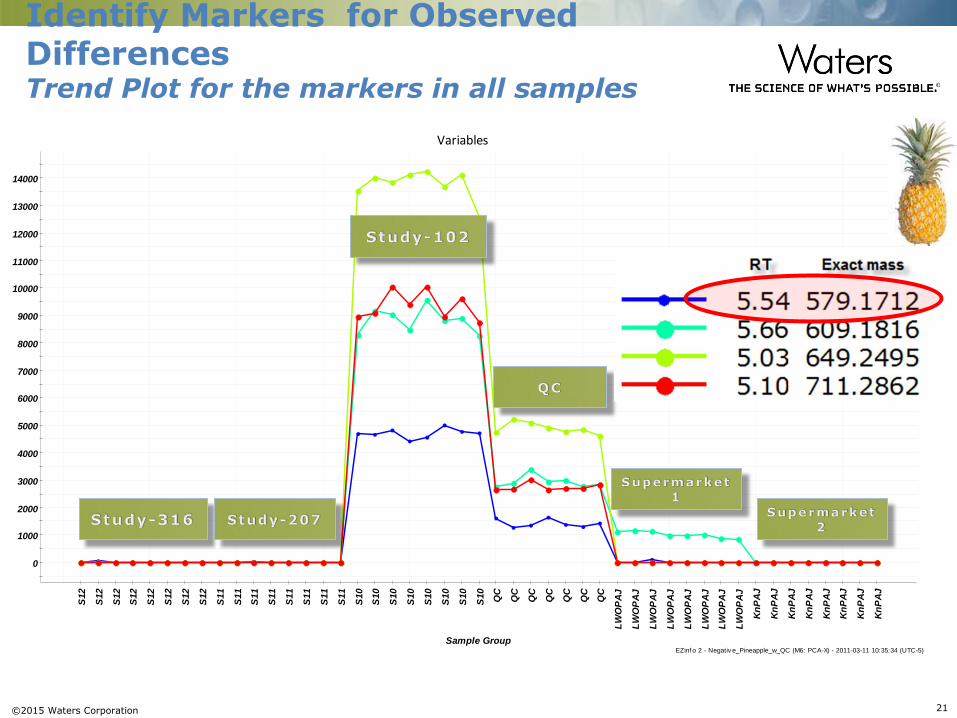
Identify Markers for Observed Differences Trend Plot for the markers in all samples
0
1000
2000
3000
4000
5000
6000
7000
8000
9000
10000
11000
12000
13000
14000
S12
S12
S12
S12
S12
S12
S12
S12
S11
S11
S11
S11
S11
S11
S11
S11
S10
S10
S10
S10
S10
S10
S10
S10
QC
QC
QC
QC
QC
QC
QC
LW
OP
AJ
LW
OP
AJ
LW
OP
AJ
LW
OP
AJ
LW
OP
AJ
LW
OP
AJ
LW
OP
AJ
LW
OP
AJ
Kn
PA
J
Kn
PA
J
Kn
PA
J
Kn
PA
J
Kn
PA
J
Kn
PA
J
Kn
PA
J
Kn
PA
J
Sample Group
Variables
DS1: 5.55_579.1712DS1: 5.67_609.1816DS1: 5.03_649.2495DS1: 5.10_711.2862
EZinf o 2 - Negativ e_Pineapple_w_QC (M6: PCA-X) - 2011-03-11 10:35:34 (UTC-5)
©2015 Waters Corporation 22
Time2.00 3.00 4.00 5.00 6.00 7.00
%
0
100
2.00 3.00 4.00 5.00 6.00 7.00
%
0
100
2.00 3.00 4.00 5.00 6.00 7.00
%
0
100
PA_24_2_070a 1: TOF MS ES- 579.171 0.0030Da
4.12e3
PA_24_2_071a 1: TOF MS ES- 579.171 0.0030Da
4.12e3
5.54
PA_24_2_072a 1: TOF MS ES- 579.171 0.0030Da
4.12e3
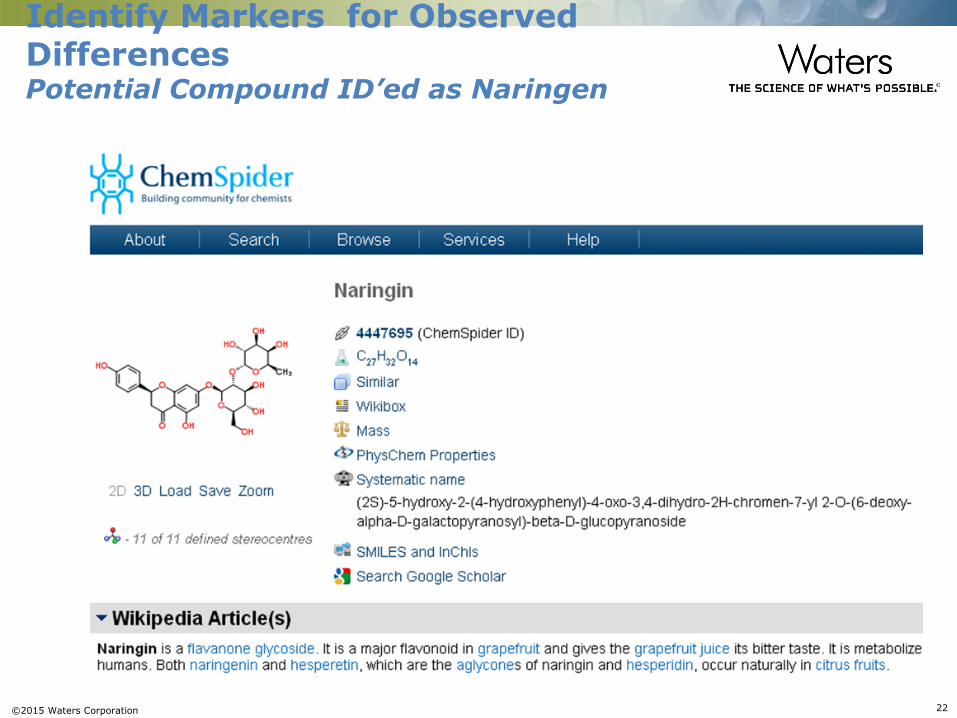
Identify Markers for Observed Differences Potential Compound ID’ed as Naringen
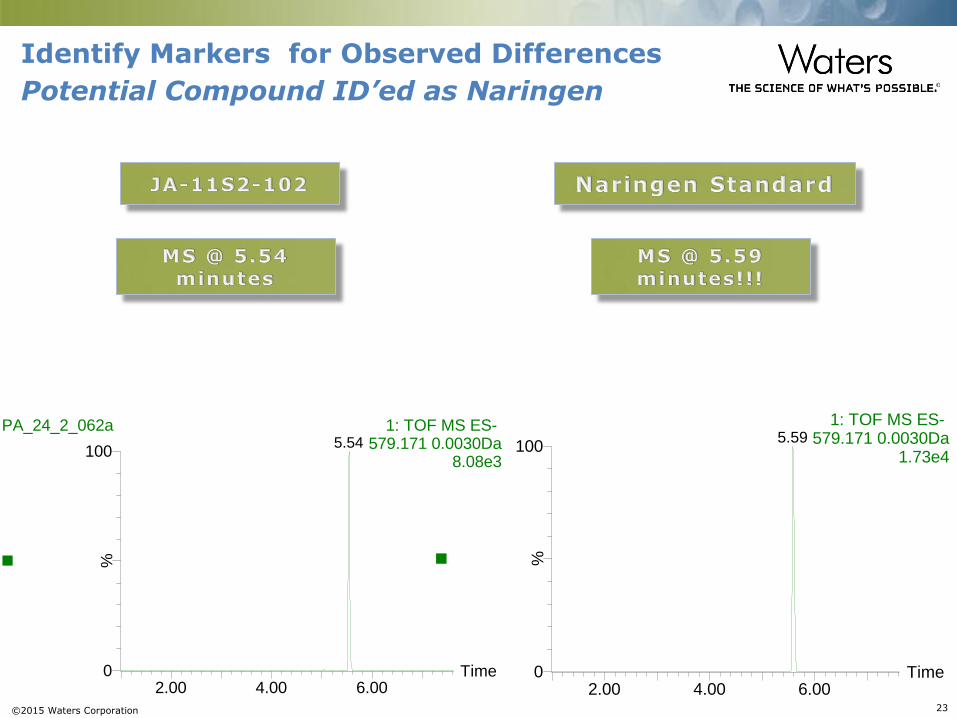
©2015 Waters Corporation 23
Time2.00 4.00 6.00
%
0
100
2.00 4.00 6.00
AU
0.0
1.0e-2
2.0e-2
PA_24_2_097a 4: Diode Array 280
Range: 3.084e-2
5.57
PA_24_2_097a 1: TOF MS ES- 579.171 0.0030Da
1.73e4
5.59
Identify Markers for Observed Differences
Potential Compound ID’ed as Naringen
Same elemental composition C27H31O14
Time2.00 4.00 6.00
%
0
100
2.00 4.00 6.00
AU
0.0
2.0e-2
4.0e-2
6.0e-2
PA_24_2_062a 4: Diode Array 280
Range: 6.675e-2
1.314.80
4.28
2.703.95
3.31
5.64
PA_24_2_062a 1: TOF MS ES- 579.171 0.0030Da
8.08e3
5.54
©2015 Waters Corporation 24
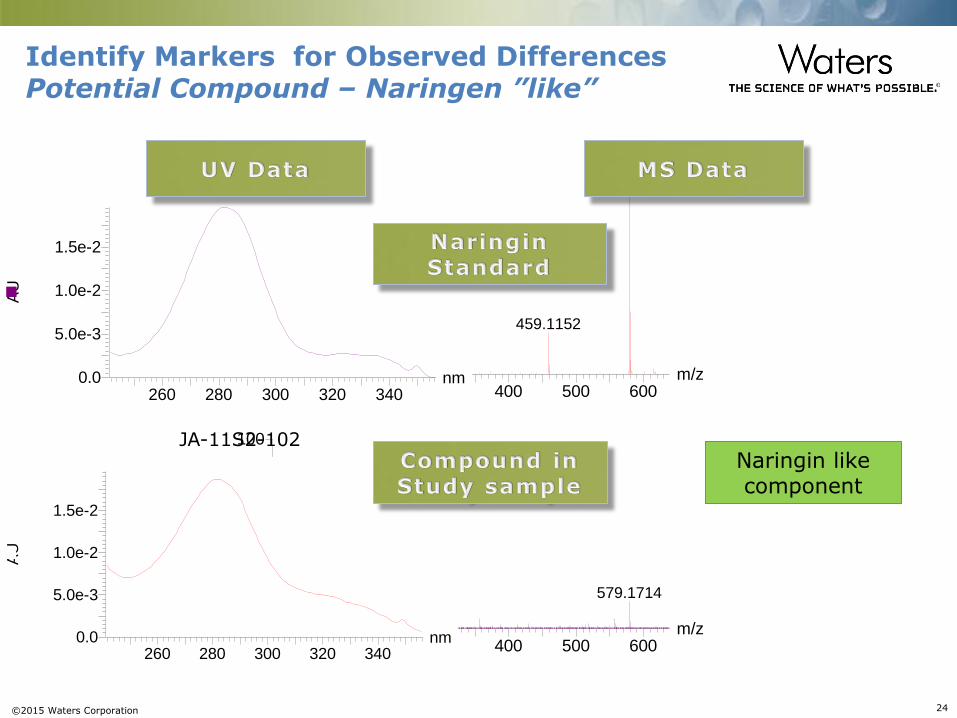
Identify Markers for Observed Differences Potential Compound – Naringen ”like”
m/z100 200 300 400 500 600
%
0
100
m/z100 200 300 400 500 600
%
0
100579.1720
271.0604
151.0029
459.1152
271.0603
151.0029 579.1714
Naringin like component
nm260 280 300 320 340
AU
0.0
5.0e-3
1.0e-2
1.5e-2
nm260 280 300 320 340
AU
0.0
5.0e-3
1.0e-2
1.5e-2
nm260 280 300 320 340
AU
0.0
5.0e-3
1.0e-2
1.5e-2
nm260 280 300 320 340
AU
0.0
5.0e-3
1.0e-2
1.5e-2
JA-11S2-102
©2015 Waters Corporation 25
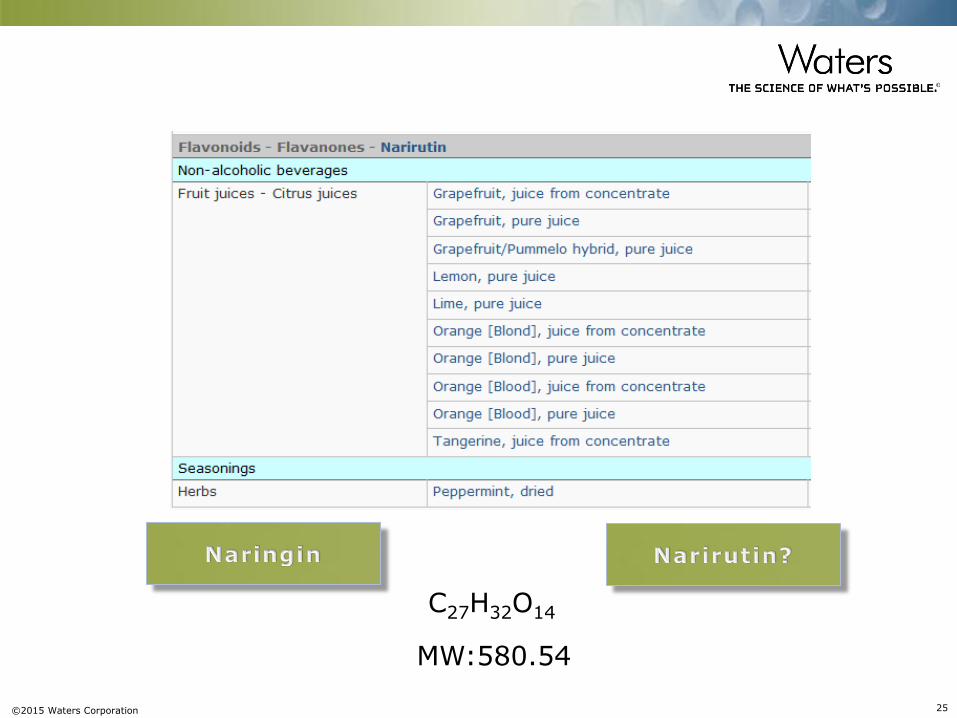
C27H32O14
MW:580.54
©2015 Waters Corporation 26
Identify Markers for Observed Differences Trend Plot for the markers in all samples
0
1000
2000
3000
4000
5000
6000
7000
8000
9000
10000
11000
12000
13000
14000
S12
S12
S12
S12
S12
S12
S12
S12
S11
S11
S11
S11
S11
S11
S11
S11
S10
S10
S10
S10
S10
S10
S10
S10
QC
QC
QC
QC
QC
QC
QC
LW
OP
AJ
LW
OP
AJ
LW
OP
AJ
LW
OP
AJ
LW
OP
AJ
LW
OP
AJ
LW
OP
AJ
LW
OP
AJ
Kn
PA
J
Kn
PA
J
Kn
PA
J
Kn
PA
J
Kn
PA
J
Kn
PA
J
Kn
PA
J
Kn
PA
J
Sample Group
Variables
DS1: 5.55_579.1712DS1: 5.67_609.1816DS1: 5.03_649.2495DS1: 5.10_711.2862
EZinf o 2 - Negativ e_Pineapple_w_QC (M6: PCA-X) - 2011-03-11 10:35:34 (UTC-5)
©2015 Waters Corporation 27
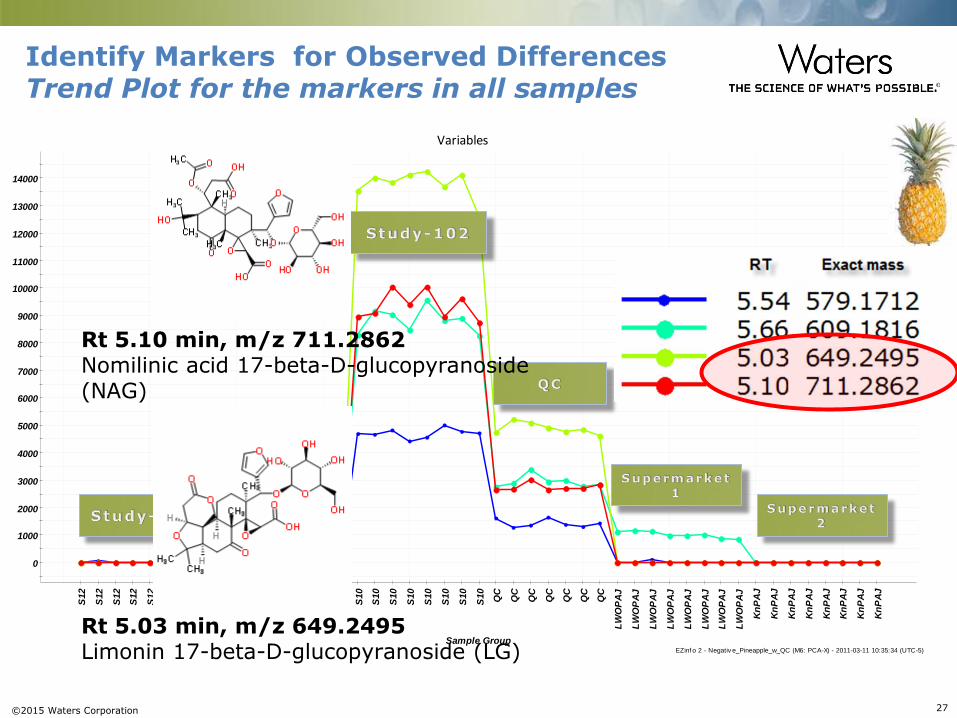
Identify Markers for Observed Differences Trend Plot for the markers in all samples
0
1000
2000
3000
4000
5000
6000
7000
8000
9000
10000
11000
12000
13000
14000
S12
S12
S12
S12
S12
S12
S12
S12
S11
S11
S11
S11
S11
S11
S11
S11
S10
S10
S10
S10
S10
S10
S10
S10
QC
QC
QC
QC
QC
QC
QC
LW
OP
AJ
LW
OP
AJ
LW
OP
AJ
LW
OP
AJ
LW
OP
AJ
LW
OP
AJ
LW
OP
AJ
LW
OP
AJ
Kn
PA
J
Kn
PA
J
Kn
PA
J
Kn
PA
J
Kn
PA
J
Kn
PA
J
Kn
PA
J
Kn
PA
J
Sample Group
Variables
DS1: 5.55_579.1712DS1: 5.67_609.1816DS1: 5.03_649.2495DS1: 5.10_711.2862
EZinf o 2 - Negativ e_Pineapple_w_QC (M6: PCA-X) - 2011-03-11 10:35:34 (UTC-5)
Rt 5.10 min, m/z 711.2862 Nomilinic acid 17-beta-D-glucopyranoside (NAG)
Rt 5.03 min, m/z 649.2495 Limonin 17-beta-D-glucopyranoside (LG)
©2015 Waters Corporation 28
Conclusions
©2015 Waters Corporation 29
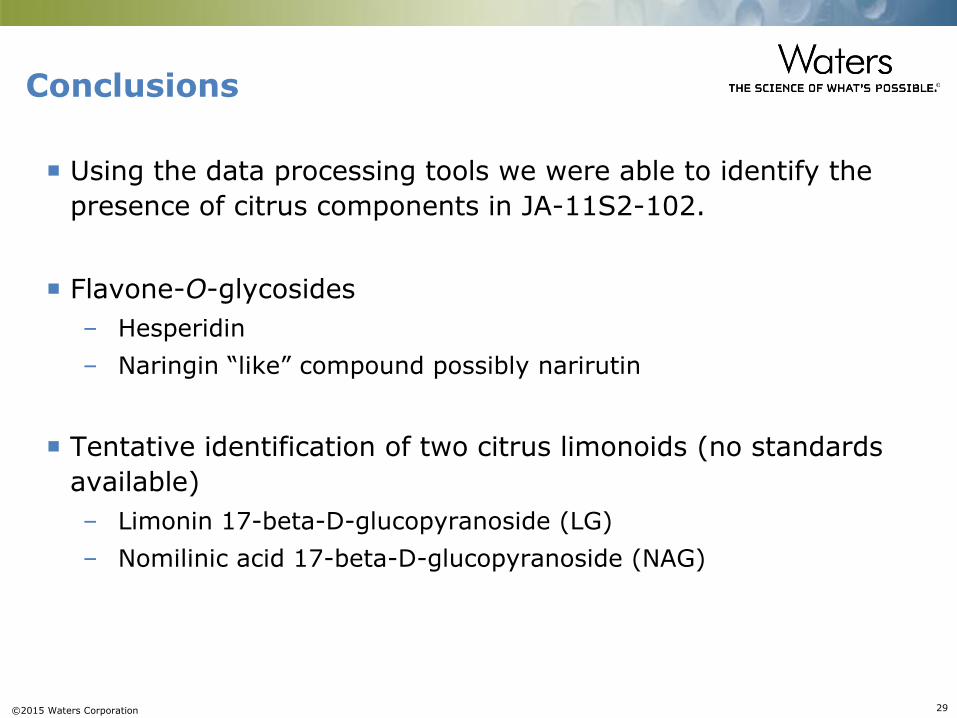
Conclusions
Using the data processing tools we were able to identify the
presence of citrus components in JA-11S2-102.
Flavone-O-glycosides
– Hesperidin
– Naringin “like” compound possibly narirutin
Tentative identification of two citrus limonoids (no standards
available)
– Limonin 17-beta-D-glucopyranoside (LG)
– Nomilinic acid 17-beta-D-glucopyranoside (NAG)