investigating perceptions concerning the adoption of
TRANSCRIPT

Investigating Perceptions Concerning the Adoption of
International Financial Reporting Standards (IFRS)
Among College Students
by
Hyun-Pyo Kim, M.S.
A THESIS
In
INTERDISCIPLINARY STUDIES
Submitted to the Graduate Faculty
of Texas Tech University in
Partial Fulfillment of
the Requirements for
the Degree of
MASTER OF SCIENCE
Approved
Dr. Young-Kyu Moh
Chair of Committee
Dr. Jessica Yuan
Dr. Dakshina G. De Silva
Peggy Gordon Miller
Dean of the Graduate School
May, 2011

Copyright 2011, Hyun-Pyo Kim

Texas Tech University, Hyun-Pyo Kim, May 2011
ii
ACKNOWLEDGMENTS
This research would not have been possible without the help of several
individuals who in one way or another contributed and extended their valuable
assistance in the preparation and completion of this study. I really appreciated every
kind of assistance they gave to me.
First and foremost, my greatest gratitude to Dr. Young-Kyu Moh, whose
sincerity and support I will never forget. He helped me to make my thesis accurate
with his passion and great effort. I also offer my sincere appreciation to my committee
members, Dr. Jessica Yuan and Dr. Dakshina G. De-Silva. I appreciate their kind
concern and consideration regarding my academic requirements. I would also like to
say how much I admire Dr. Wendell Aycock, Dr Ben Goh and Dr. Deborah Fowler.
They have always supported and trusted me. I could not have finished this great thesis
without their help. I would also like to acknowledge Dr. Do-Jin Jung who was my
master’s advisor when I was a graduate student in South Korea.
I would like to express my gratitude to my good friend and English teacher,
Barbara Werden, for her help and consideration. I could not have finished this thesis
without her assistance. It has been my honor to meet you here in Lubbock, Texas. I
also want to thank many other friends who contributed to the success of this study. To
my best friends: Dong-Soo Lee, Hyuk-Ki Lee, Han-Mo Oh, Hyo-Jin Kim, Hyun-Oh
Kang, Sang-Mook Lee, Joo Ahn, Yong-Ho Cho, Hyun-Woo Joung and Eun-Kyung
Choi, thank you for your contributions to this study.

Texas Tech University, Hyun-Pyo Kim, May 2011
iii
Finally, I want to thank my parents: Jong-Ku Kim and Mal-Yeon Lee, and
family: Bo-Hyang Kim, Tae-Bum Ryu, Hyun-Woo Ryu and Hyun-Oh Ryu. Without
their financial and emotional support, this thesis would have been impossible to finish.
I love them so much, and you all “make my life.” I want to dedicate this thesis to them.
Thank you, again.

Texas Tech University, Hyun-Pyo Kim, May 2011
iv
TABLE OF CONTENTS
ACKNOWLEDGMENTS ............................................................................................. ii
ABSTRACT .................................................................................................................. vi
LIST OF TABLES ...................................................................................................... viii
LIST OF FIGURES ...................................................................................................... ix
I. INTRODUCTION ...................................................................................................... 1
II. LITERATURE REVIEW ........................................................................................ 15
Part 1. A comparison between the IFRS and a country’s own GAAP ............. 15
Part 2. Adopting the IFRS voluntarily and mandatorily .................................. 18
Part 3. Education system for accounting .......................................................... 18
Research questions ........................................................................................... 20
III. METHODOLOGY ................................................................................................. 22
Data and sample ............................................................................................... 22
Data analysis .................................................................................................... 23
Definition of variables and research model ..................................................... 24
IV. RESULTS AND DISCUSSION ............................................................................ 28
Descriptive analysis ......................................................................................... 28
T-test and ANOVA (Analysis of Variance) ..................................................... 31
Correlation........................................................................................................ 34

Texas Tech University, Hyun-Pyo Kim, May 2011
v
Regression ........................................................................................................ 37
Additional analyses with business major students ........................................... 39
Descriptive analysis ......................................................................................... 39
T-test and ANOVA (Analysis of Variance) ..................................................... 42
Correlation........................................................................................................ 43
Regression ........................................................................................................ 43
V. CONCLUSIONS AND LIMITATIONS ................................................................ 46
REFERENCES ............................................................................................................. 49
APPENDICES
A. QUESTIONNAIRE ................................................................................................. 52
B. IRB APPROVAL LETTER .................................................................................... 54

Texas Tech University, Hyun-Pyo Kim, May 2011
vi
ABSTRACT
As capital markets become increasingly global, many investors have a great
interest in international investment opportunities. Also, many countries use dissimilar
standards when they create financial statements for their stakeholders. In the United
States, the SEC (Securities and Exchange Commission) has long expressed its support
for a single set of high-quality global accounting standards as an important means of
enhancing comparability and unification. IFRS as a single set of global accounting
standards has the potential to best provide the common platform on which companies
can report, and stakeholders can compare, corporate financial information. The goal
with IFRS is to make international comparisons as easy as possible.
Although the standards have a critical impact on capital markets, students and
investors know very little about this standard. Therefore, by investigating the
perception of the IFRS among college students, this study could determine the status
of preparation for the standards and help colleges and universities with decisions
regarding offering classes about these standards. The primary objective of this study is
to investigate perceptions and knowledge concerning the adoption of International
Financial Reporting Standards (IFRS) among college students.
The findings are as follows; first, I found there was a difference in knowledge
about IFRS between male and female respondents. While it is difficult to generalize
these results to all college or university student populations, universities or colleges
should consider evaluating students to determine their level of knowledge about IFRS

Texas Tech University, Hyun-Pyo Kim, May 2011
vii
and then have provisions in place for extra classes or assignments in order to raise the
extent of knowledge of IFRS for any group of students (male and female) who show
deficiencies in basic knowledge of these standards. Second, there were no differences
in knowledge about IFRS for each age group and each school year among respondents.
Third, I found a difference in knowledge about IFRS between students majoring in
business and students who were non-business majors. This implies that in this
population of respondents business major students are taking more classes about
financial events such as the adoption of IFRS in U.S. than are non-business major
students. Therefore, business major students have more knowledge of IFRS than do
non-business major students. Fourth, I found a correlation between the perception
about evaluating the positive effect of IFRS on capital markets and the intention to
take classes about IFRS. This means that students who believe there will be a positive
effect on capital markets by the adoption of IFRS will take classes concerning IFRS.
Also, these students will take more classes in order to analyze their perceptions about
the IFRS. Finally, the results predicted that students who showed a great interest in
IFRS are more likely to take these courses if colleges or universities offer classes.
These results mean that interest is a very critical determinant for taking classes
concerning IFRS among college students. The more students have an interest about
IFRS, the more they will take classes. There are also similar results shown in the
additional analyses section pertaining to business major respondents.

Texas Tech University, Hyun-Pyo Kim, May 2011
viii
LIST OF TABLES
1. Frequencies of the respondents (N=246) ................................................... 29
2. Descriptive statistics (N=246) .................................................................... 30
3. t-test result for knowledge of IFRS ........................................................... 32
4. Results of ANOVA demographics and knowledge of IFRS ..................... 33
5. t-test result for knowledge of IFRS ........................................................... 34
6. Correlation of the respondents within business majors............................. 35
7. Correlation of the respondents within non-business majors ..................... 36
8. Regression analysis among variables ........................................................ 39
9. Frequencies for the respondents with business majors ............................ 40
10. Descriptive statistics with business majors .............................................. 41
11. t-test result for knowledge of IFRS with business majors ....................... 42
12. Results of ANOVA and knowledge of IFRS for business majors ........... 43
13. Regression analysis among variables for business majors ....................... 45

Texas Tech University, Hyun-Pyo Kim, May 2011
ix
LIST OF FIGURES
1. SEC (Securities and Exchange Commission) Time line ............................................ 7
2. The Global Move Towards IFRS ............................................................................. 16

Texas Tech University, Hyun-Pyo Kim, May 2011
1
CHAPTER I
INTRODUCTION
As capital markets become increasingly global, many investors have a great
interest in international investment opportunities. The world of investing is fascinating
and complex and investors in the United States could gain economically from an
enhanced ability to compare financial statements such as balance sheets or income
statements between U.S. companies using the U.S. GAAP (Generally Accepted
Accounting Principle) and non-U.S. companies using different accounting principles
such as IFRS (International Financial Reporting Standards) or their own country’s
GAAP. The fact is, many countries use dissimilar standards when they create financial
statements for their stakeholders.
In the United States, the SEC 1 (Securities and Exchange Commission) is a
federal agency which holds primary responsibility for enforcing the federal securities
laws and regulating the securities industry, the nation’s stock and options exchanges,
and other electronic securities markets. The primary reason for creating the SEC was
to regulate the stock market and prevent corporate abuses relating to the offering and
sale of securities and corporate reporting. The mission of the U.S. SEC (Securities and
Exchange Commission) is to protect investors, maintain fair, orderly, and efficient
markets, and facilitate capital formation. The SEC has long expressed its support for a
1. The organization was formed by the United States Congress in June 1934. There are five departments
in the SEC. 1) Corporation Finance, 2) Trading and Markets, 3) Investment Management, 4)
Enforcement, and 5) Risk, Strategy, and Financial Innovation.

Texas Tech University, Hyun-Pyo Kim, May 2011
2
single set of high-quality global accounting standards as an important means of
enhancing comparability and unification.
IFRS as a single set of global accounting standards has the potential to best
provide the common platform on which companies can report, and stakeholders can
compare, corporate financial information. It is a set of international accounting
standards stating how particular types of transactions and other events should be
reported in financial statements such as balance sheets. These standards are issued by
the IASB (International Accounting Standards Board). The goal with IFRS is to make
international comparisons as easy as possible. Currently, this is difficult because, to a
large extent, each country has its own set of rules. For example, U.S. GAAP is
different from the Canadian GAAP (http://www.investopedia.com/terms/i/ifrs.asp,
2010).
According to proponents of International Financial Reporting Standards
(IFRS), publicly traded companies must apply a single set of high quality accounting
standards in the preparation of their consolidated financial statements, in order to
contribute to improved functioning capital markets (Quigley, 2007). Also, IFRS has
the potential to facilitate cross-border comparability, increase reporting transparency,
decrease information costs, reduce information asymmetry and thereby increase the
liquidity, competition, and efficiency of markets (Ball, 2006). As a result of examining
the economic consequences of mandatory IFRS reporting around the world, it was
shown that market liquidity increases around the time of the introduction of IFRS.
Also, firms’ cost of capital decreased and equity valuations which were measured with

Texas Tech University, Hyun-Pyo Kim, May 2011
3
Tobin’s Q2 increased (Daske, Hail, Leuz, & Verdi, 2008). Accordingly, because of the
importance of IFRS in the capital market, the SEC announced in 2005 plans for a
roadmap towards requiring the use of IFRS as issued by the IASB (International
Accounting Standards Board) by U.S. issuers as part of its consideration of the role a
single set of high-quality accounting standards plays in investor protection and the
efficiency and effectiveness of capital formation and allocation in the U.S.
Up until now, use of the IFRS has been developing in the capital markets of
the U.S. There are three phases in this evolution. Some of which have been completed.
The following description of the three phases is documented ("US GAAP vs. IFRS,"
2009).
1. Phase I — 2001 and prior
1973: International Accounting Standards Committee (IASC) formed. The
IASC was founded to formulate and publish International Accounting
Standards (IAS) that would improve financial reporting and that could be
accepted worldwide.
1994: IOSCO (International Organization of Securities Commissions)
completed its review of current IASC standards and communicated its findings
to the IASC. The review identified areas that required improvement before
IOSCO could consider recommending IAS for use in cross-border listings and
offerings.
2 . Tobin’s q was developed by James Tobin (Tobin, 1969) as the ratio between the market value and
replacement value of the same physical asset. If the market value reflected solely the recorded assets of
a company, Tobin’s q would be 1.0.

Texas Tech University, Hyun-Pyo Kim, May 2011
4
1995: IASC developed its Core Standards Work Program. IOSCO’s Technical
Committee agreed that the Work Program would result, upon successful
completion, in IAS comprising a comprehensive core set of standards. The
European Commission (EC) supported this agreement between IASC and
IOSCO and associated itself with the work of the IASC in order to foster a
broader international harmonization of accounting standards.
1999: IASC Board approved a restructuring that resulted in the current
International Accounting Standards Board (IASB). The newly constituted
IASB structure comprises: 1) the IASC Foundation, an independent
organization with 22 trustees who appoint the IASB members, exercise
oversight, and raise the funds needed; 2) the IASB (Board) which has 12 full-
time, independent board members and two part-time board members with sole
responsibility for setting accounting standards; 3) the Standards Advisory
Council; ,and 4) the International Financial Reporting Interpretations
Committee (IFRIC) that replaced the SIC (Standing Interpretations Committee)
and was mandated with interpreting existing IAS and IFRS standards, and
providing timely guidance on matters not addressed by current standards.
2000: IOSCO recommended that multinational issuers be allowed to use IAS
in cross-border offerings and listings.
April 2001: IASB assumed standard-setting responsibility from the IASC. The
IASB met with representatives from eight national standard-setting bodies to

Texas Tech University, Hyun-Pyo Kim, May 2011
5
begin coordinating agendas and discussing convergence and adopted the
existing IAS standards and SIC Interpretations.
February 2002: IFRIC assumed responsibility for interpretation of IFRS.
2. Phase II — 2002 to 2005
July 2002: EC (European Commission is the executive body of the European
Union) required EU-listed companies to prepare their consolidated financial
statements in accordance with IFRS as endorsed by the EC, generally from
2005 onward. This was a critically important milestone that acted as a primary
driver behind the expanded use of IFRS.
September 2002: Norwalk Agreement executed between the FASB and the
IASB.
December 2004: EC issued its Transparency Directive. This directive would
require non-EU companies with listings on an EU exchange to use IFRS unless
the Committee of European Securities Regulators (CESR) determined that the
national GAAP was “equivalent” to IFRS. Although CESR advised in 2005
that the U.S. GAAP was “equivalent” subject to certain additional disclosure
requirements, the final decision as to U.S. GAAP equivalency, and what
additional disclosures, if any, will be required, has not yet been reached.
April 2005: SEC published the “Roadmap.” An article published by then SEC
Chief Accountant discussed the possible elimination of the U.S. GAAP
reconciliation for foreign, private issuers that use IFRS. This Roadmap laid out

Texas Tech University, Hyun-Pyo Kim, May 2011
6
a series of milestones, which if achieved, would result in the elimination of the
U.S. GAAP reconciliation by 2009, if not sooner.
3. Phase III — 2006 to present
February 2006: The FASB and IASB published a Memorandum of
Understanding (MOU). The MOU reaffirmed the Boards’ shared objective to
develop high quality, common accounting standards for use in the world’s
capital markets and further elaborated on the Norwalk Agreement. According
to the agreement, the Boards would proceed along two tracks for convergence:
1) a series of short-term standard setting projects designed to eliminate major
differences in focused areas, and 2) the development of new common
standards.
November 2007: the SEC eliminated the U.S. GAAP reconciliation for foreign,
private issuers. After hosting a roundtable discussion in March 2007 to discuss
the effects that the acceptance of IFRS would have on investors, issuers, and
capital raising in U.S. capital markets and issuing a summary of its
observations regarding foreign, private issuers that adopted IFRS for the first
time in 2005, the SEC determined that the milestones on its 2005 Roadmap
had been sufficiently met so as to eliminate the reconciliation requirement.
Mid-2007, continuing into 2008: the SEC explored the future use of IFRS by
U.S. companies. Also in August 2007, the SEC issued a Concept Release
asking the public to comment on the possible use of IFRS by U.S. domestic

Texas Tech University, Hyun-Pyo Kim, May 2011
7
registrants. In December 2007, and August 2008, the SEC held three additional
roundtables on the topic of IFRS, with the roundtables focusing on the
potential use of IFRS for U.S. issuers. Further, in August 2008, the SEC
approved for public issuance an updated Roadmap which anticipated
mandatory reporting under IFRS beginning in 2014, 2015 or 2016, depending
on the size of the company.
Looking ahead: The future remains uncertain, but momentum continues to
build for a single set of high quality, global standards. The possible use of
IFRS by U.S. domestic registrants is a topic that remains active on the SEC’s
agenda. The updated proposed Roadmap identifies certain milestones to be
considered in determining whether reporting under IFRS should be mandated
for U.S. companies, and calls for future SEC action in 2011 to make that
assessment.
Figure 1: SEC (Securities and Exchange Commission) Time line

Texas Tech University, Hyun-Pyo Kim, May 2011
8
The roadmap of adoption of IFRS first addresses the basis for considering the
mandatory use of IFRS by U.S. issuers. It then sets forth seven milestones which, if
achieved, could lead to the use of IFRS by U.S. issuers in their filings with the SEC.
The SEC will judge progress on these milestones as a prerequisite for moving forward
with a mandate for IFRS adoption. In 2011, the SEC will determine whether to
proceed with rulemaking to require that U.S. issuers use IFRS beginning in 2014, if it
is in the public interest and for the protection of investors. The seven milestones are as
follows (Henson, 2011).
1. Improving specific accounting standards
2. Improving the structure and funding of the IASB
3. Facilitating the use of interactive data (XBRL) under IFRS
4. Updating the education and licensing of U.S. accountants
5. Evaluating the early adoption experiences of a limited group of companies
6. Timing of future rulemaking
7. Sequencing of companies required to use IFRS
The first four milestones are conditions precedent to the adoption of IFRS in
the United States. The remaining three milestones pertain to the experience of
adopting IFRS and how IFRS should be adopted in the United States.
Milestone 1: Improving specific accounting standards
The FASB (Financial Accounting Standards Board) and the IASB are
continuing their progress on accounting standard convergence. They hope to complete

Texas Tech University, Hyun-Pyo Kim, May 2011
9
their convergence plan by the end of 2011. Their objective is a set of common, high
quality reporting standards for companies around the world. The FASB and IASB
have made significant progress on some important standards, but still have work to do
in order to reach their goal. The FASB and IASB are working hard on convergence
and are trying to complete their work by the end of 2011 at which time somewhat of a
moratorium on modifying standards is expected in order to give companies a chance to
transition to IFRS with a stable set of accounting standards.
Milestone 2: Improving the structure and funding of the IASB
The second milestone involves progress on improving the structure and
funding of the IASB. The International Accounting Standards Board (IASB) is trying
to improve its structure and funding. To date they have made progress, but still need to
continue to work on establishing a structure and funding an approach that global
securities regulators will support. The most significant area left to be addressed is
funding.
Milestone 3: Facilitating the use of interactive data (XBRL) under IFRS
The International Accounting Standards Committee Foundation (IASC
Foundation) released the 2009 IFRS Taxonomy for comment. Development and
approval of an IFRS Taxonomy is essential for being able to utilize XBRL for IFRS
reporting. Taxonomies describe in detail the contextual information related to data
tags used to describe and report business information. XBRL is an open standard that
is used to store and transport business information. It is clear that the IASC
Texas Tech University, Hyun-Pyo Kim, May 2011
10
Foundation is trying to facilitate the use of XBRL for IFRS reporting. The IASC
foundation is beginning to enable XBRL use for IFRS reporting.
Milestone 4: Updating the education and licensing of U.S. accountants
University professors are beginning to analyze global accounting convergence
and the potential adoption of IFRS by the United States. A few IFRS textbooks are
also becoming available including: IFRS 2008: Interpretation and Application of
International Accounting and Financial Reporting Standards 2008 by Barry J. Epstein
and Eva K. Jermakowicz and Applying International Accounting Standards by Keith
Alfredson, Ken Leo, Ruth Picker, Paul Pacter and Jennie Radford. Universities are
beginning to prepare for inclusion of IFRS in their accounting curricula. Students are
also beginning to realize that they will need to learn more about IFRS because it will
be important in the future, even though it is expected that this will add significantly to
their required courses.
In February 2009, a major CPA firm announced the awarding of $700,000 in
grants to 26 colleges and universities to accelerate the preparedness of U.S. accounting
students for eventual adoption of IFRS. Major CPA firms are also making a significant
amount of information on IFRS available in the form of online materials and free
webcasts.
Milestone 5: Evaluating the early adoption experiences of a limited group of
companies

Texas Tech University, Hyun-Pyo Kim, May 2011
11
The fifth IFRS milestone involved the SEC’s evaluation of the IFRS adoption
experience of companies that elected early adoption of the IFRS. The SEC established
rules that would allow some companies to adopt IFRS as early as fiscal years ending
after December 15, 2009. Early adoption required that a company met both of the
following criteria:
1. IFRS would have to be the most-often-used set of standards by the 20 largest
companies in an entity’s industry
2. The entity must be among the largest 20 public companies by market
capitalization in its industry. Industries are defined by a company’s two digit
SIC code.
Qualifying companies were permitted to file financial statements based on
IFRS for fiscal years ending after December 15, 2009. Whether the early adoption
experience was positive or negative, might influence the decision to mandate the use
of IFRS for U.S. companies. If a company chose early adoption of the IFRS, the
commissioner anticipated that they might have needed to return to the U.S. GAAP if
necessary, an obvious disincentive to early adoption.
Milestone 6: Timing of future rulemaking
The SEC decision on when to migrate to IFRS has been the topic of much
speculation. The SEC was a strong advocate of moving to IFRS, and their draft
Roadmap envisioned migrating to IFRS beginning in 2014 with some companies
eligible for early adoption for the fiscal period ending after December 15, 2009.

Texas Tech University, Hyun-Pyo Kim, May 2011
12
When the SEC issued its draft Roadmap for public comment, they based the
transition to IFRS on seven milestones. The SEC is analyzing the results of early
adopter experiences. A favorable outcome on early adopter experiences would be a
harbinger for earlier (“on-time”2014 adoption); however, adoption of IFRS and
unfavorable experiences could point toward a delay in adoption.
There are risks to both adopting IFRS and to not adopting IFRS. The risks of
adopting IFRS are relatively intuitive such as cost of adoption, adoption error or
omission risk, risk of limited or no ROI (Return on Investment) on adoption, lack of
expertise risk, and so on. The risks for not adopting IFRS include: lack of access to
global capital markets, lack of comparability with international competitors, and/or
lack of cost reduction through international efficiencies.
Most people agree that having a single global accounting and reporting
standard would be a very good thing. With about 120 countries using IFRS and one
country using U.S. GAAP, it is clear that the only one way a global accounting
standard will be achieved is if the U.S. adopts IFRS. By 2011, the U.S will be the only
major nation in the world not using IFRS. It seems clear that U.S. adoption of IFRS is
ultimately inevitable.
Milestone 7: Sequencing of companies required to use IFRS
The eventual adoption of IFRS in the United States is certain. What is not
certain is when IFRS will be adopted here and whether IFRS adoption will be
sequenced as proposed in the SEC’s preliminary IFRS Roadmap. It would surprise no

Texas Tech University, Hyun-Pyo Kim, May 2011
13
one in the finance industry if the United States elected to defer mandatory adoption for
some additional years due to current economic pressures. This seventh roadmap
milestone involves the SEC’s decision on whether, when, and how to sequence the
adoption of IFRS.
The SEC proposed its IFRS Roadmap on November 14, 2008 and the
comment period for the proposed Roadmap ended April 20, 2009. Under the proposed
Roadmap, the SEC envisioned a sequenced approach to adoption according to which a
limited number of U.S. filers would be permitted, at their option, to adopt IFRS early
beginning with fiscal periods ending after December 15, 2009. The mandatory
adoption of IFRS was expected to follow with large accelerated filers implementing
IFRS for fiscal years ending on or after December 15, 2014, accelerated filers
implementing IFRS for years ending on or after December 15, 2015, and non-
accelerated filers implementing IFRS for years ending on or after December 15, 2016.
This timetable is thought to allow filers time to implement IFRS books, records and
internal accounting controls for the fiscal year end reporting periods from 2012 to
2014 for large accelerated filers, 2013 to 2015 for accelerated filers, and 2014 to 2016
for non-accelerated filers.
This staged approach is based on the premise that larger SEC filers would be
better able to allocate resources to the IFRS transition more quickly than smaller filers.
By staging or sequencing IFRS adoption, the SEC would also allow later adopters the
ability to learn from the adoption experiences of larger filers. In addition, a staged
transition may also help manage resource demands on consultants and other market

Texas Tech University, Hyun-Pyo Kim, May 2011
14
participants. While sequenced adoption of IFRS permits some transition cost
avoidance, sequencing would result in non-comparability of financial information due
to application of the IFRS transition provisions at differing dates. Staging the
transition would temporarily create a “two GAAP” system in the United States for at
least three years. Further, it would require investors to be familiar with IFRS and U.S.
GAAP as well as how each affects the financial statements of target companies when
comparing investment alternatives.
As you can see in Milestone 4, education about the IFRS is very important
now, and in the future, at college or universities. Many researchers are evaluating the
global accounting convergence, the adoption of IFRS, and the importance of offering
classes in the U.S. Also, some students have realized the importance of IFRS on their
own. Although the standards have a critical impact on capital market, students and
investors know very little about this standard. Therefore, by investigating the
perception of the IFRS among college students, this study could determine the status
of preparation for the standards and help colleges and universities with decisions
regarding offering classes about these standards. The primary objective of this study is
to investigate perceptions and knowledge concerning the adoption of International
Financial Reporting Standards (IFRS) among college students.
The remainder of the thesis is organized as follows. Chapter II reviews the
literature. Chapter III describes the research design. Chapter IV presents the results,
and Chapter V states the conclusion including limitations.

Texas Tech University, Hyun-Pyo Kim, May 2011
15
CHAPTER II
LITERATURE REVIEW
There are many empirical studies about the IFRS, focusing mainly on Europe,
because these standards have been mandatory since 2005 in the European Union. To
organize my review of the literature, I categorized the empirical studies into three
parts: 1) a comparison between the IFRS and each country’s own GAAP; 2) adoption
of the IFRS voluntarily and mandatorily; and 3) research on the education system for
accounting after the adoption of IFRS.
Part 1. A comparison between the IFRS and a country’s own GAAP
Some countries such as Australia, South Africa, and the EU (European Union)
were mandated to use the IFRS for traded companies in their capital markets after
2005. South Korea will use the IFRS beginning in 2011. The United States also has a
timeline for adoption of the IFRS for companies trading in the U.S. The rate of use for
the IFRS is increasing in many countries as shown in Figure 2: The Global Move
Towards IFRS (Deloitte, 2008).

Texas Tech University, Hyun-Pyo Kim, May 2011
16
Figure 2: The Global Move Towards IFRS
By investigating whether and how managerial incentives influence the
decision to elect optional exemptions when first adopting International Financial
Reporting Standards (IFRS) in France, there were three major findings: 1) managerial
incentives influenced the decision to strategically elect one or more optional
exemptions; 2) mandatory equity adjustments were more valued than in the French
GAAP; and 3) the first-time adoption of IFRS by French firms was perceived as a
signal of an increase in the quality of each firm’s financial statements (Comier,
Demaria, Lapointe-Antunes, & Teller, 2009). For the economic and policy factors
related to the potential adoption of IFRS in the U.S., there were three conclusions in
this research showing that the decision to adopt IFRS mainly involved a cost-benefit
tradeoff that were: 1) recurring, albeit modest, comparability benefits for investors; 2)
recurring future cost savings that will largely accrue to multinational companies, and 3)
one-time transition costs borne by all firms and the U.S. economy as a whole (Hail,
Leuz, & Wysocki, 2009).

Texas Tech University, Hyun-Pyo Kim, May 2011
17
Daske, et al., determined that the decision to adopt IFRS was a good strategic
method to increase a company’s overall transparency (Daske, et al., 2008). Examining
application of International Accounting Standards and accounting quality showed that
firms applying IAS from 21 countries generally evidenced less earnings management,
more timely loss recognition, and more value relevance of accounting amounts than do
a matched sample of firms applying non-U.S. domestic standards, and showed an
improvement in the accounting quality between the pre- and post-adoption periods
(Barth, Landsman, & Lang, 2007).
In addition to this research, Flynn outlined the advantages to the United States
of changing from its own GAAP to IFRS: 1) the use of IFRS as the single, common
language of financial reporting to make true comparisons; 2) the IFRS require a strong
international standards body to assure consistency, and 3) this change also offers the
potential for reduced complexity by offering a high-quality global set of standards
(Flynn, 2008).
However, changing from GAAP to IFRS also has potential disadvantages.
Companies without operations in other countries have no incentive to follow the
standards. Also, many countries claiming to convert to IFRS never get to full
compliance, and the IFRS could lead to incompatibility (Olson, 2008). Another
disadvantage relates to financial statements. Financial statements prior to conversion
will need to be maintained on both standards, GAAP and IFRS, for at least two years
in order to meet the requirement that financial statements contain three years of
financial data.

Texas Tech University, Hyun-Pyo Kim, May 2011
18
The adoption of IFRS among countries and companies creates different results.
These results are due to different entities’ situations such as their economic status and
their capital markets. Also, all countries have differing timetables and preparations for
adoption of IFRS.
Part 2. Adopting the IFRS voluntarily and mandatorily
Adoption of the IFRS separates into two possibilities: voluntary adoption or
mandatory adoption. Based on a company’s circumstances, it might choose either
voluntary or mandatory adoption of the new standards. By examining the determinants
and consequences of voluntary adoption of non-local accounting principles (non-local
GAAP) by firms listed in the European Union, research by Cuijpers and Buijink
showed that 133 non-financial firms in the EU voluntarily used non-local GAAP in
1999 suggesting that the majority of listed EU firms does not expect to benefit from
non-local GAAP adoption (Cuijpers & Buijink, 2005). When comparing mandatory
and voluntary adopters, Daske, et al., found that capital market effects were most
pronounced for firms that voluntarily switched to IFRS (Daske, et al., 2008).
Part 3. Education system for accounting
The adoption of IFRS will have a large impact on colleges and universities.
Although this is a very important step forward, the education associations in some
countries and professors of accounting are not yet fully prepared to incorporate IFRS
into their curricula.

Texas Tech University, Hyun-Pyo Kim, May 2011
19
Preparations have begun to incorporate IFRS and IAS (International
Accounting Standards) into accounting curricula; as a result several problems need to
be addressed. The research shows that in Ukraine, for example, the first problem is the
lack of good course materials and the second is out-of-date of textbooks due to the
rapid changes in Ukrainian national accounting standards that adoption of IFRS will
require. Also, some of the most prestigious universities in Ukraine still do not have a
course devoted solely to IFRS (McGee & Preobragenskaya, 2005). However, when we
look at the U.S academic community (accounting and auditing students and professors)
as well as practitioners (auditors, accountants, CPAs, and financial analysts), the
United States appears ready to converge to IFRS.
There are three results revealed in this research: 1) auditors, accountants, and
accounting students are ready for the convergence to IFRS; 2) convergence to IFRS
can increase global comparability; 3) a proper plan to transition all U.S. companies to
IFRS requires IFRS training for investors, management, auditors, and IFRS education
in the accounting curriculum (Moqbel & Bakay, 2010).
With conversion to IFRS likely but not certain, many professors are having
difficulty discerning the “how, when, and what” of incorporating IFRS into today’s
accounting curriculum (Nilsen, 2008). A 2008 study identified some problems in the
accounting curricula of business information at the high school level and suggested
improvements needed in the accounting textbooks. The suggestions for revision were
developed after comparing the current U.S. curriculum with K-IFRS (Korean IFRS).
That study itemized some ways to improve accounting education curriculum as

Texas Tech University, Hyun-Pyo Kim, May 2011
20
follows: 1) the concepts and the need for introduction of K-IFRS should be reflected
in the new courses; 2) the contents of the consolidated financial statements should be
reflected in the new courses, and 3) the contents of the textbooks should be
reorganized (Kim & Chung, 2008).
An associate professor of accounting at Butler University in Indianapolis,
Indiana was quoted as saying that “he is going to have to basically replace his
understanding and relearn it based on IFRS (International Financial Reporting
Standards).” Also, he stated that because students are already being taught U.S.
standards, the transition may be more difficult, and that the adoption of IFRS is
probably the biggest accounting change in his professional life (Olson, 2008). The
adoption of IFRS is a very powerful event in the capital market. Many researchers cite
the lack of stability in accounting curricula as one of the reasons for their concern.
Research questions
Although the standards have a critical impact on the capital market, not all of
the associations, colleges, and universities offer new classes covering IFRS to their
students. By investigating the perception of the IFRS among college students, this
study will determine the status of preparation for the standards and help business
departments offer high quality classes about the IFRS (International Financial
Reporting Standards).
Based on the above discussion, I address the following research hypotheses:

Texas Tech University, Hyun-Pyo Kim, May 2011
21
H 1: There is a difference in knowledge about IFRS between male and female
college students.
H 2: There are differences in knowledge about IFRS for each age group among
college students.
H 3: There are differences in knowledge about IFRS for each school year group
among college students.
H 4: Students who are majoring in business will have more information about IFRS
than non-business students.
H 5: There is a relationship between the perception about evaluating the positive
effect of IFRS on capital markets and the intention to take classes about IFRS.
H 6: Students who have an interest in IFRS are more likely to take classes
concerning IFRS if colleges or universities offer them.

Texas Tech University, Hyun-Pyo Kim, May 2011
22
CHAPTER III
METHODOLOGY
Data and sample
The data were collected using a questionnaire during spring 2011. The
researchers distributed the survey to college students. A survey was distributed to
freshman, sophomore, junior, senior, and graduate-level students. Three hundred
questionnaires were distributed, and 246 questionnaires were collected in February
2011. It took participants about 10 minutes to complete this questionnaire.
During the recruitment procedure, students were informed that participation
was voluntary and that they could stop completing the survey at anytime. The study
measured this population of student’s perceptions and knowledge of the International
Financial Reporting Standards (IFRS). The findings from this study will be a good
reference for college students and future researchers, and will help business
departments offer high-quality classes about the IFRS (International Financial
Reporting Standards). College students attending TTU (Texas Tech University) and
participants for this study were recruited at the SUB (Student Union Building) at
Texas Tech University in Lubbock, Texas. This study asked students in the SUB
(Student Union Building) to complete an anonymous survey. Their participation in
this study was purely voluntary. All students were over the age of 18.

Texas Tech University, Hyun-Pyo Kim, May 2011
23
1. Data collection was conducted at Texas Tech University in the SUB
(Student Union Building) during the spring semester 2011.
2. The researcher approached college students in the SUB (Students Union
Building) requesting their participation in a research study.
3. An information sheet was affixed as a cover page on the survey. The
survey was distributed in a paper handout or affixed to a clipboard.
Directions were provided about how to complete the survey.
4. The questionnaire was distributed by the researcher at the SUB (Student
Union Building) at Texas Tech University who used an oral script for
consistency of presentation.
5. Participants were asked to fill out the questionnaire.
Data analysis
Data were compiled and analyzed by using the PASW (Predictive Analytics
Software) Statistics 18.
The data was analyzed in four steps.
1. The descriptive statistics
2. The t-test and analysis of variance (ANOVA)
3. The correlation (Pearson and Spearman)
4. The regression.

Texas Tech University, Hyun-Pyo Kim, May 2011
24
Definition of variables and research model
In order to investigate the perception of adoption of IFRS among college
students, I used many variables in this study. However, there are 6 main variables in
this research model. To test for the intention to take classes about IFRS among college
students, I used the following research design:
INTENT = a0 + a1 MAJOR + a2 KNOWLEDGE + a3 INTEREST +
a4 PERCEPTION1 + a5 PERCEPTION2 + a6 PERCEPTION3 + e (1)
I defined the above variables as follows:
1. INTENT: This variable is about the intent among college students to take class or
classes about the IFRS.
2. MAJOR: This variable was divided into two groups: 1) Business major and 2) Non-
business major. I used this variable as the dummy variable to analyze in research
(Business=1 and Non-business=0).
3. KNOWLEDGE: I collected this variable from students, by asking about some
keywords that are shared or differ between U.S. GAAP and IFRS. I measured this
variable as proxy for a degree of knowledge of IFRS.
The adoption of IFRS is a critical event for the business department in many
colleges and universities. In order to evaluate the amount and accuracy of student
respondents’ knowledge and/or information about IFRS, I selected some
Texas Tech University, Hyun-Pyo Kim, May 2011
25
keywords/concepts that are shared or differ between the U.S. GAAP and IFRS with
which to compare this knowledge. I have described these differences below.
For the present, companies in the United States are allowed to use LIFO (Last-
In, First-Out), an inventory valuation method in the U.S. GAAP, that also enables
them to use LIFO for U.S. tax purposes. However, IFRS does not allow the use of
LIFO (Last-In, First-Out). A company in accordance with IFRS must use a method of
accounting for inventory that is acceptable under IFRS, such as First-In, First-Out or
FIFO ("US GAAP vs. IFRS," 2009).
IFRS permits the revaluation of certain assets to fair value, whereas U.S.
GAAP generally does not. Fair value is the amount for which an asset could be
exchanged or a liability settled (IAS39, 2008).
Under IFRS, adjustments are permitted to be made to financial statements for
significant transactions that occur in the gap period. However, adjustments are
generally not made for transactions that occur in the gap period in the U.S. GAAP
(Kaiser, 2010).
By utilizing IFRS, companies will have more flexibility for applying
accounting principles because these standards are more principles based, whereas
GAAP is more rules based. Kaiser suggested that the IFRS should be confined to
principles and not become detailed rules. As a result of this, IFRS was justified by the
same experts as principles-based accounting standards, in contrast to FASB’s rules-based
standards (Kaiser, 2010).

Texas Tech University, Hyun-Pyo Kim, May 2011
26
As another example, let’s look at the differences in testing for the potential
impairment of long-lived assets held for use that might lead to earlier impairment
recognition under IFRS. IFRS requires the use of entity-specific discounted cash flows
or a fair value measure in tests for the recoverability of an asset. By comparison, the
U.S. GAAP uses a two-step model that begins with undiscounted cash flows. This
fundamental distinction between the impairment models can make a difference in
whether an asset is considered impaired ("US GAAP vs. IFRS," 2009).
As mentioned above, there are specific differences between IFRS and U.S.
GAAP standards:
1) LIFO prohibition
2) Fair market measurement
3) Financial periods
4) Principle-based accounting
5) Impairment
4. INTEREST: This variable is about the interest in IFRS among college students.
5. PERCEPTION 1: To develop this variable, I asked students whether they had a
perception about how the adoption of IFRS would affect financial performance.
6. PERCEPTION 2: To develop this variable, I asked students whether they had a
perception that the adoption of IFRS would have an effect on operating performance.

Texas Tech University, Hyun-Pyo Kim, May 2011
27
7. PERCEPTION 3: To develop this variable, I asked students whether they had a
perception about how the adoption of IFRS would affect stakeholders such as
investors or shareholders.

Texas Tech University, Hyun-Pyo Kim, May 2011
28
CHAPTER IV
RESULTS AND DISCUSSION
Descriptive analysis
Descriptive analyses have frequencies, measures of maximum, mean, median,
and minimum, and dispersions of standard deviation based on gender, age, school year,
race, and major.
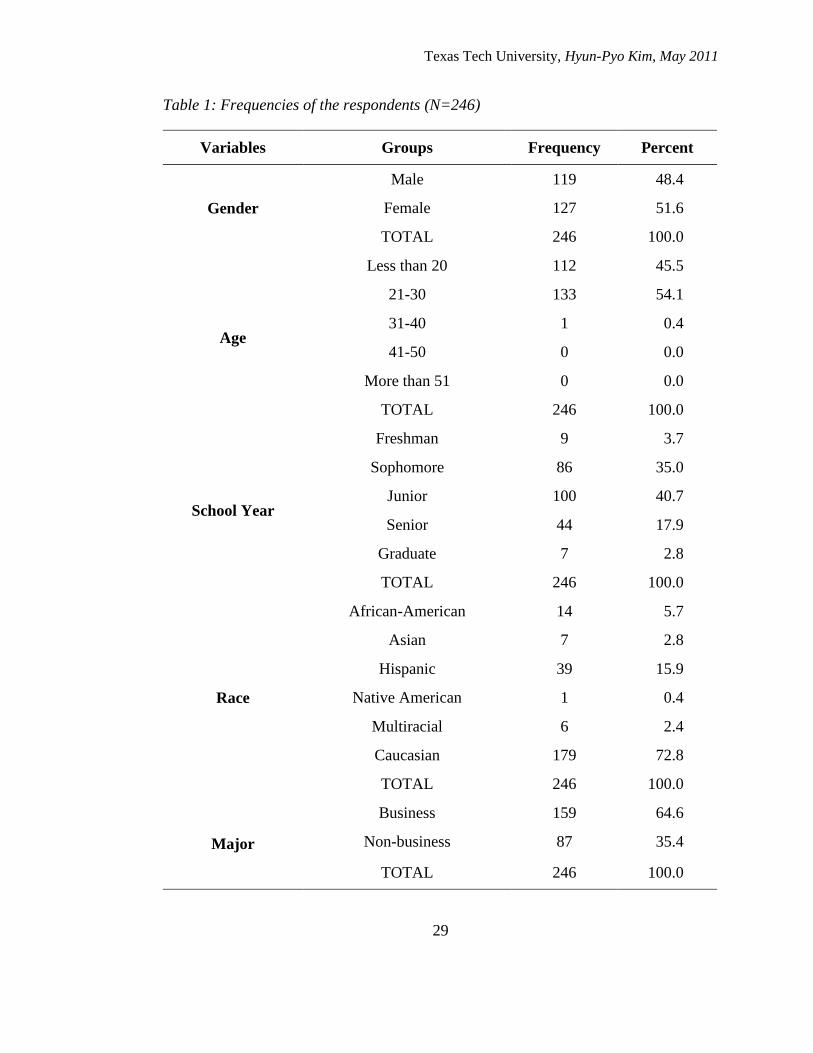
Table 1 addresses the demographic characteristics of the sample of respondents.
The respondents’ socio-demographic were profiled in frequencies and percentages. As
clearly shown, a majority of the sample was composed of young people (99.6% who
reported being less than 30 years old). In this category, 48.4% of respondents were
male and 51.6% were female. 45.5% of the respondents were less than 20 years of age
and 54.1% were between the ages of 21 and 30. Finally, 0.4% of respondents were
more than 30 years old. The most frequently occurring classification group was junior
(40.7%), followed by sophomore (35.0%), senior (17.9%), freshman (3.7%), and
graduate (2.8%). About 72.8% of the respondents were Caucasian, 15.9%, 5.7%, 2.8%,
2.4%, and 0.4% were Hispanic, African-American, Asian, Multiracial, and Native
American, respectively. 64.6% of the respondents were students who noted having a
business major, such as accounting, marketing, and/or finance. 35.6% of the
respondents were non-business majors.
Texas Tech University, Hyun-Pyo Kim, May 2011
29
Table 1: Frequencies of the respondents (N=246)
Variables Groups Frequency Percent
Gender
Male 119 48.4
Female 127 51.6
TOTAL 246 100.0
Age
Less than 20 112 45.5
21-30 133 54.1
31-40 1 0.4
41-50 0 0.0
More than 51 0 0.0
TOTAL 246 100.0
School Year
Freshman 9 3.7
Sophomore 86 35.0
Junior 100 40.7
Senior 44 17.9
Graduate 7 2.8
TOTAL 246 100.0
Race
African-American 14 5.7
Asian 7 2.8
Hispanic 39 15.9
Native American 1 0.4
Multiracial 6 2.4
Caucasian 179 72.8
TOTAL 246 100.0
Major
Business 159 64.6
Non-business 87 35.4
TOTAL 246 100.0

Texas Tech University, Hyun-Pyo Kim, May 2011
30
Table 2 also addresses the demographic characteristics of the sample of
respondents based on measures and dispersions. In the section pertaining to gender,
1.52 was the mean, 0.5, 2, 2, and 1 were standard deviation, maximum, median, and
minimum measures, respectively. The mean, 1.52, shows that there were more females
than males in the sample. The mean of the age of the respondents was 1.55. This
measure confirmed that a great portion of respondents were below age 30. Because the
maximum value is 3, there were no respondents in two of the age groups: 41-50 and
more than 51. A score of 2.82 showed that most of the respondents were between their
sophomore and junior years at the university. However, since 2.82 is closer to 3 than
to 2, this shows that there were more respondents participating from the junior class.
The maximum value was 5; this means that few respondents reported being in a
graduate course. In the major category, 1.35 was the mean, 0.48, 2, 1, and 1 were
standard deviation, maximum, median, and minimum measures, respectively. Because
the median was 1, this shows that business students were over 50% of the respondents.
Table 2: Descriptive statistics (N=246)
Variables Mean STD Max 75% Median 25% Min
Gender 1.52 0.50 2 2 2 1 1
Age 1.55 0.51 3 2 2 1 1
School Year 2.81 0.87 5 3 3 2 1
Race 5.09 1.59 6 6 6 4.75 1
Major 1.35 0.48 2 2 1 1 1

Texas Tech University, Hyun-Pyo Kim, May 2011
31
The definition of variables
1) Gender: Male=1 and Female=2
2) Age: Less than 20=1, 21-30=2, 31-40=3, 41-50=4, and More than 51=5
3) School Year: Freshman=1, Sophomore=2, Junior=3, Senior=4, and Graduate=5
4) Race: African-American=1, Asian=2, Hispanic=3, Native American=4,
Multiracial=5, and Caucasian=6
5) Major: Business=1 and Non-business=2
T-test and ANOVA (Analysis of Variance)
Comparing the means of two populations such as gender and major, I used the
t-test method. To extend this method to problems involving more than two populations,
I used the ANOVA (Analysis of Variance). I computed a two-sample t statistic and its
P-value to assess the statistical significance of the difference in the sample means.
However, ANOVA uses an F statistic and its P-value to evaluate the null hypothesis
that all of several population means are equal.
As you can see in Table 3, there is a difference in the knowledge of IFRS
between male and female respondents. The extent of knowledge of IFRS for male
students (M=3.48, SD=1.48) is significantly higher than for female students (M=3.11,
SD=1.28) with t-value of 2.029 and p-value < .05. Although the study was conducted
at one university in the American Southwest, these results suggest that there may be a
difference in knowledge about IFRS between men and women. While it is difficult to
generalize these results to all college or university student populations, universities or
colleges should consider evaluating students to determine their level of knowledge

Texas Tech University, Hyun-Pyo Kim, May 2011
32
about IFRS and then have provisions in place for extra classes or assignments in order
to raise the extent of knowledge of IFRS for any group of students (male and female)
who show deficiencies in basic knowledge of these standards.
Table 3: t-test result for knowledge of IFRS between male and female respondents
Gender of respondents N Mean SD t-value
Male 112 3.48 1.48
2.029*
Female 112 3.11 1.28
* P < 0.05.
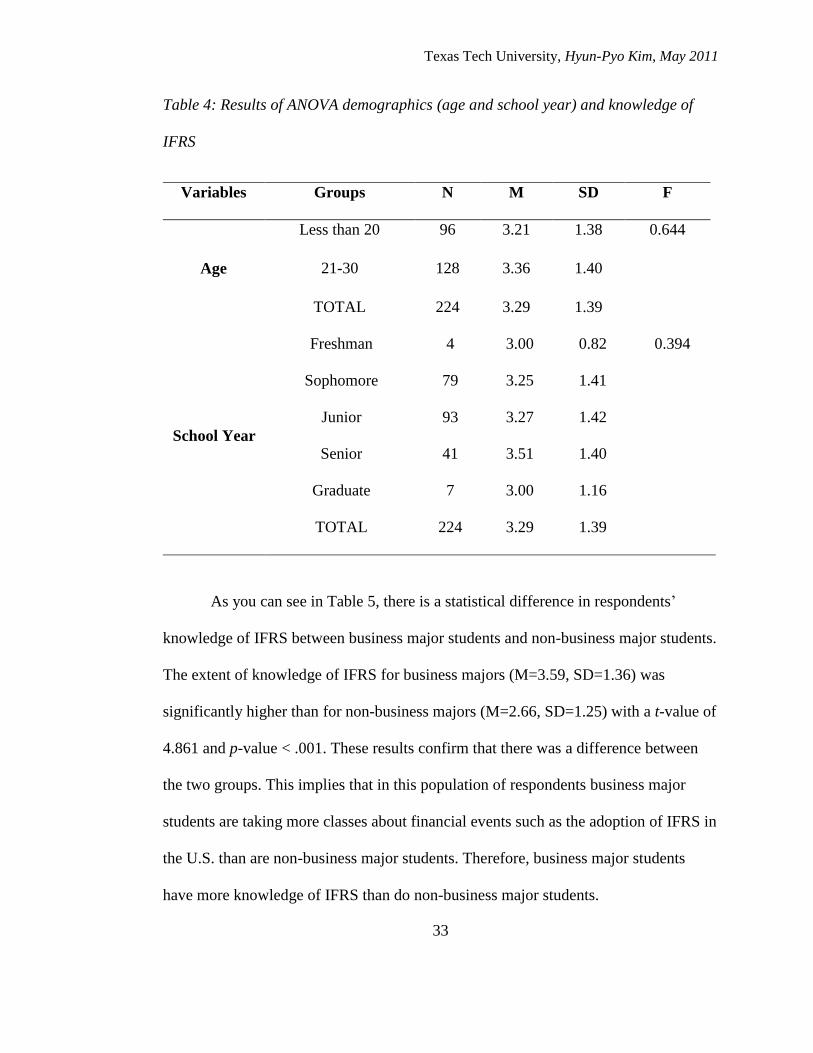
In Table 4, with the F value of 0.644 and the corresponding p value of 0.423,
no significance was found in ANOVA between the age groups. There are no
differences between the age groups regarding their knowledge of IFRS that were
evaluated as proxy because the F is 0.644 associated probability value (0.423) does
not meet the criterion for statistical significance (that is, p < .05). Also, there are no
differences between each school year group among respondents pertaining to their
knowledge of IFRS. With the F value of 0.394 and the corresponding p value of 0.813,
no significance was found in ANOVA within the school year groups. These results
show that there were no differences in knowledge of IFRS for age groups and school
year groups among respondents.
Texas Tech University, Hyun-Pyo Kim, May 2011
33
Table 4: Results of ANOVA demographics (age and school year) and knowledge of
IFRS
Variables Groups N M SD F
Age
Less than 20 96 3.21 1.38 0.644
21-30 128 3.36 1.40
TOTAL 224 3.29 1.39
School Year
Freshman 4 3.00 0.82 0.394
Sophomore 79 3.25 1.41
Junior 93 3.27 1.42
Senior 41 3.51 1.40
Graduate 7 3.00 1.16
TOTAL 224 3.29 1.39
As you can see in Table 5, there is a statistical difference in respondents’
knowledge of IFRS between business major students and non-business major students.
The extent of knowledge of IFRS for business majors (M=3.59, SD=1.36) was
significantly higher than for non-business majors (M=2.66, SD=1.25) with a t-value of
4.861 and p-value < .001. These results confirm that there was a difference between
the two groups. This implies that in this population of respondents business major
students are taking more classes about financial events such as the adoption of IFRS in
the U.S. than are non-business major students. Therefore, business major students
have more knowledge of IFRS than do non-business major students.

Texas Tech University, Hyun-Pyo Kim, May 2011
34
Table 5: t-test result for knowledge of IFRS between business students and non-
business students
Major of respondents N Mean SD t-value
Business 153 3.59 1.36
4.861***
Non-business 71 2.66 1.25
*** P < 0.001
Correlation
The Pearson correlation (PANEL A) test and the Spearman correlation
(PANEL B) test were performed using variables such as intention, knowledge, and
interest. I separated the results into two groups: business majors and non-business
majors. The results for the first group (business major) are presented in Table 6. The
results for collation among variables for non-business majors are presented in Table 7.
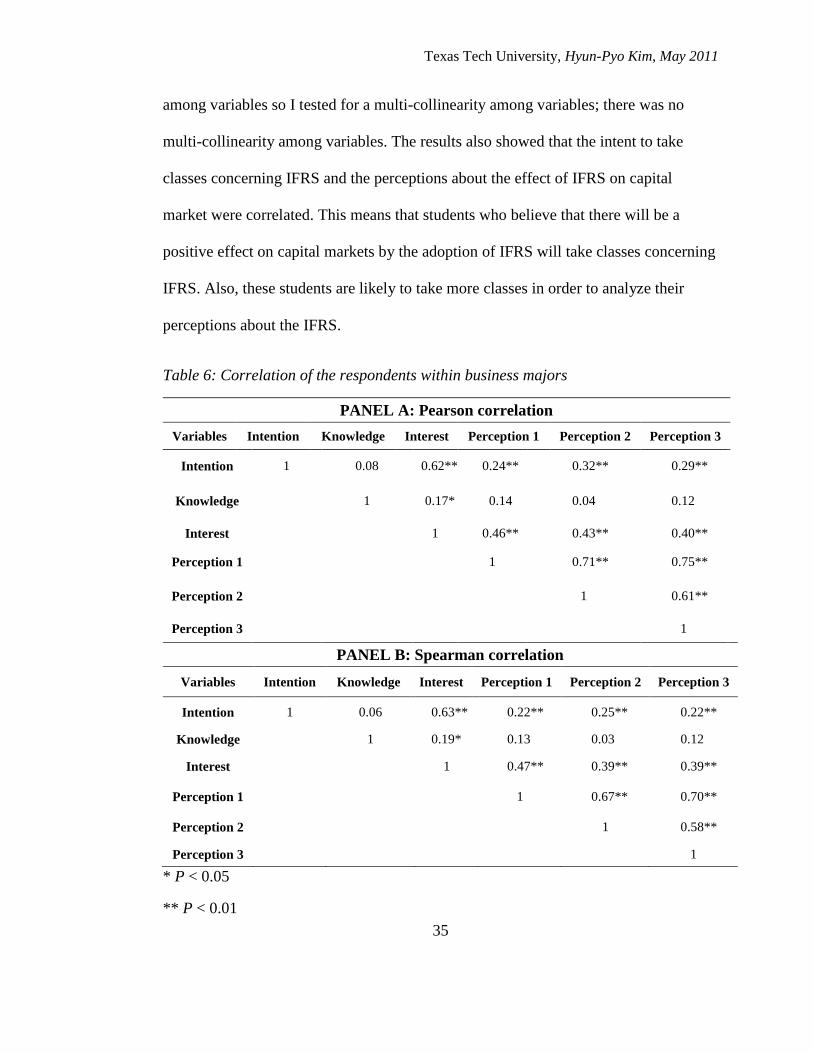
As it is shown in Table 6, there are correlations among the variables. The relationships
between INTENTION and INTEREST, PERCEPTION1, 2, and 3 are significantly
correlated (γ = 0.62, P < 0.01, γ = 0.24, P < 0.01, γ = 0.32, P < 0.01, and γ = 0.29, P <
0.01 in Panel A and γ = 0.63, P < 0.01, γ = 0.22, P < 0.01, γ = 0.25, P < 0.01, and γ =
0.22, P < 0.01 in Panel B, respectively) and all directions were positive. The
INTEREST variable also had a positive correlation to others variables such as
PERCEPTION1, 2, and 3 in Panel A and B. Among PERCEPTION variables, there
was a strong correlation. However, the KNOWLEDGE variable showed correlation
with only the INTEREST variable (γ = 0.17, P < 0.05 in Panel A and γ = 0.19, P <
0.05 in Panel B) and the directions were positive. Many correlations were very high
Texas Tech University, Hyun-Pyo Kim, May 2011
35
among variables so I tested for a multi-collinearity among variables; there was no
multi-collinearity among variables. The results also showed that the intent to take
classes concerning IFRS and the perceptions about the effect of IFRS on capital
market were correlated. This means that students who believe that there will be a
positive effect on capital markets by the adoption of IFRS will take classes concerning
IFRS. Also, these students are likely to take more classes in order to analyze their
perceptions about the IFRS.
Table 6: Correlation of the respondents within business majors
PANEL A: Pearson correlation
Variables Intention Knowledge Interest Perception 1 Perception 2 Perception 3
Intention 1 0.08 0.62** 0.24** 0.32** 0.29**
Knowledge 1 0.17* 0.14 0.04 0.12
Interest 1 0.46** 0.43** 0.40**
Perception 1 1 0.71** 0.75**
Perception 2 1 0.61**
Perception 3 1
PANEL B: Spearman correlation
Variables Intention Knowledge Interest Perception 1 Perception 2 Perception 3
Intention 1 0.06 0.63** 0.22** 0.25** 0.22**
Knowledge 1 0.19* 0.13 0.03 0.12
Interest 1 0.47** 0.39** 0.39**
Perception 1 1 0.67** 0.70**
Perception 2 1 0.58**
Perception 3 1
* P < 0.05
** P < 0.01
Texas Tech University, Hyun-Pyo Kim, May 2011
36
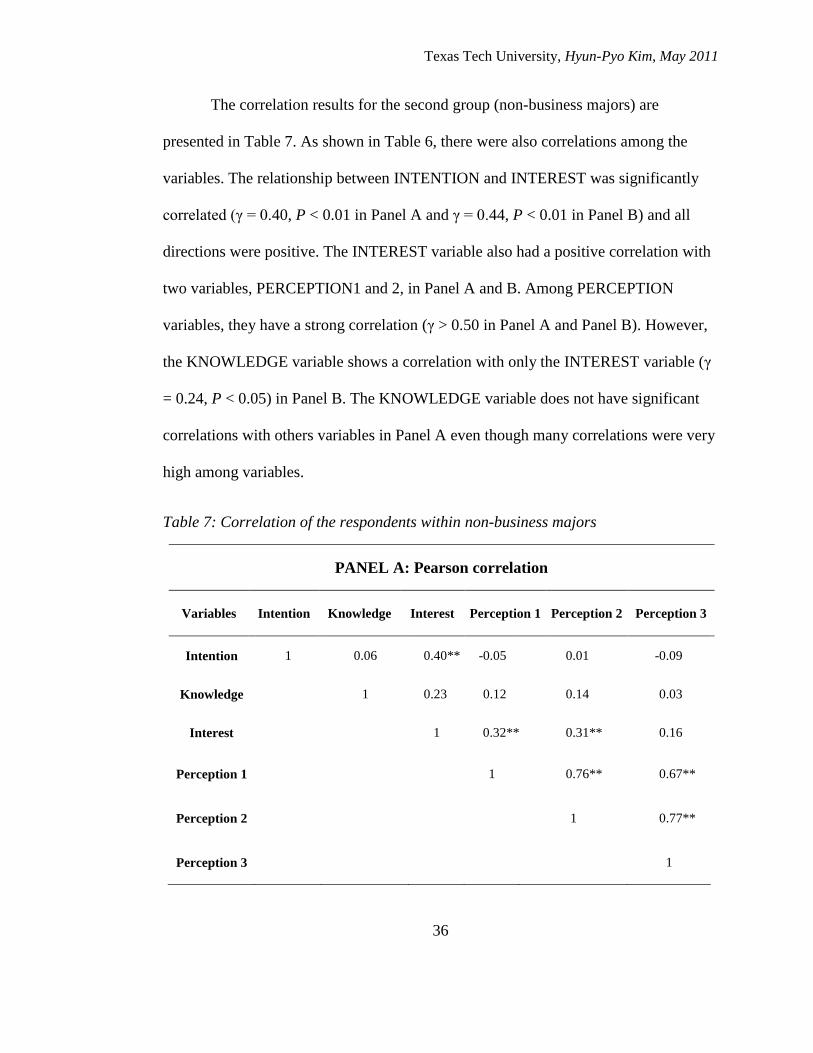
The correlation results for the second group (non-business majors) are
presented in Table 7. As shown in Table 6, there were also correlations among the
variables. The relationship between INTENTION and INTEREST was significantly
correlated (γ = 0.40, P < 0.01 in Panel A and γ = 0.44, P < 0.01 in Panel B) and all
directions were positive. The INTEREST variable also had a positive correlation with
two variables, PERCEPTION1 and 2, in Panel A and B. Among PERCEPTION
variables, they have a strong correlation (γ > 0.50 in Panel A and Panel B). However,
the KNOWLEDGE variable shows a correlation with only the INTEREST variable (γ
= 0.24, P < 0.05) in Panel B. The KNOWLEDGE variable does not have significant
correlations with others variables in Panel A even though many correlations were very
high among variables.
Table 7: Correlation of the respondents within non-business majors
PANEL A: Pearson correlation
Variables Intention Knowledge Interest Perception 1 Perception 2 Perception 3
Intention 1 0.06 0.40** -0.05 0.01 -0.09
Knowledge 1 0.23 0.12 0.14 0.03
Interest 1 0.32** 0.31** 0.16
Perception 1 1 0.76** 0.67**
Perception 2 1 0.77**
Perception 3 1

Texas Tech University, Hyun-Pyo Kim, May 2011
37
Table 8(Continued): Correlation of the respondents within non-business majors
PANEL B: Spearman correlation
Variables Intention Knowledge Interest Perception 1 Perception 2 Perception 3
Intention 1 0.09 0.44** -0.02 0.06 -0.12
Knowledge 1 0.24* 0.06 0.13 0.06
Interest 1 0.25* 0.29** 0.09
Perception 1 1 0.75** 0.66**
Perception 2 1 0.69**
Perception 3 1
* P < 0.05
** P < 0.01
Regression
I analyzed variables in order to investigate, empirically, the intent of college
students (H6). Also, to test this hypothesis, I utilized the following research design:
INTENT = a0 + a1 MAJOR + a2 KNOWLEDGE + a3 INTEREST +
a4 PERCEPTION1 + a5 PERCEPTION2 + a6 PERCEPTION3 + e (1)
In this research design, the three variables (PERCEPTION 1, 2, and 3) that measured
students’ perception of adoption of IFRS on capital markets, should have high
correlation value among these variables. However, high correlation among variables

Texas Tech University, Hyun-Pyo Kim, May 2011
38
did not yield reliable data. Therefore, I tested for multi-collinearity. Also, in this
model, respondents’ major was a critical variable. To control the effect of respondents’
major, I used this variable as dummy variable.
Table 8 presents the estimated coefficients from multivariate regression for the
sample. As with the expectation of H 6, I found that INTEREST improved the intent
to take classes, significantly. This is significant at the 0.1% level for students. The
regression model I used significant with 3 variables. In particular, we can use the level
of interest about the IFRS to predict the intent to take classes of IFRS (t = 9.553 and p
< .001). Also, the results for PERCEPTION 1 (financial performance) of IFRS
predicted the intent to take classes about IFRS (t = -2.644 and p < .01).
These results showed that respondents who have an interest about IFRS will
take classes, if classes about the IFRS are offered by the college or university.
Therefore, respondents’ level of interest and level of perception about financial
performance can be used to predict their intention to take classes from their college or
university. These results mean that interest is a very critical determinant among
college students for taking classes concerning IFRS. This showed that the more
students have an interest about IFRS, the more they will take classes.

Texas Tech University, Hyun-Pyo Kim, May 2011
39
Table 9: Regression analysis among variables
Variables Beta coefficient Standard error t
Intercept 1.261 0.317 3.978***
Major 0.077 0.121 0.635
Knowledge -0.006 0.041 -0.150
Interest 0.623 0.065 9.553***
Perception 1 -0.343 0.130 -2.644**
Perception 2 0.169 0.127 1.333
Perception 3 0.147 0.121 1.214
Adjusted R2 0.337
F 19.813***
** P < 0.01
*** P < 0.001
Additional analyses with business major students
Descriptive analysis
Table 9 addresses the demographic characteristics of the sample of respondents
with business major. The respondents’ socio-demographic were profiled in
frequencies and percentages. As clearly shown, a majority of the sample was
composed of young people (99.4% who reported being less than 30 years old). In this
category, 59.1% of respondents were male and 40.9% were female. 44.7% of the
respondents were less than 20 years of age and 54.7% were between the ages of 21

Texas Tech University, Hyun-Pyo Kim, May 2011
40
and 30. Finally, 0.6% of respondents were more than 30 years old. The most
frequently occurring classification group was junior (41.5%), followed by sophomore
(37.7%), senior (15.7%), freshman (3.1%), and graduate (1.9%). About 70.4% of the
respondents were Caucasian, 18.9%, 6.3%, 1.9%, and 0.6% were Hispanic, African-
American, Asian and Multiracial, and Native American, respectively.
Table 10: Frequencies for the respondents with business majors (N=159)
Variables Groups Frequency Percent
Gender
Male 94 59.1
Female 65 40.9
TOTAL 159 100.0
Age
Less than 20 71 44.7
21-30 87 54.7
31-40 1 0.6
41-50 0 0.0
More than 51 0 0.0
TOTAL 159 100.0
School Year
Freshman 5 3.1
Sophomore 60 37.7
Junior 66 41.5
Senior 25 15.7
Graduate 3 1.9
TOTAL 159 100.0
Race
African-American 10 5.7
Asian 3 2.8
Hispanic 30 15.9
Native American 1 0.4
Multiracial 3 2.4
Caucasian 112 72.8
TOTAL 159 100.0

Texas Tech University, Hyun-Pyo Kim, May 2011
41
Table 10 also addresses the demographic characteristics of the sample of
respondents with business major based on measures and dispersions. In the section
pertaining to gender, 1.41 was the mean, 0.49, 2, 1, and 1 were standard deviation,
maximum, median, and minimum measures, respectively. The mean, 1.41, shows that
there were more males than females in the sample. The mean of the age of the
respondents was 1.56. This measure confirmed that a great portion of respondents
were below age 30. Because the maximum value is 3, there were no respondents in
two of the age groups: 41-50 and more than 51. A score of 2.75 showed that most of
the respondents were between their sophomore and junior years at the university.
However, since 2.75 is closer to 3 than to 2, this shows that there were more
respondents participating from the junior class. The maximum value was 5; this means
that few respondents reported being in a graduate course.
Table 11: Descriptive statistics with business majors (N=159)
Variables Mean STD Max 75% Median 25% Min
Gender 1.41 0.49 2 2 1 1 1
Age 1.56 0.51 3 2 2 1 1
School Year 2.75 0.83 5 3 3 2 1
Race 5.01 1.63 6 6 6 3 1

Texas Tech University, Hyun-Pyo Kim, May 2011
42
T-test and ANOVA (Analysis of Variance)
As you can see in Table 11, there is no difference in the knowledge of IFRS
between male and female respondents with business major. The extent of knowledge
of IFRS for male students (M=3.62, SD=1.44) is not significantly higher than for
female students (M=3.55, SD=1.28).
Table 12: t-test result for knowledge of IFRS between male and female respondents
with business majors
Gender of respondents N Mean SD t-value
Male 91 3.62 1.44
0.298
Female 62 3.55 1.24
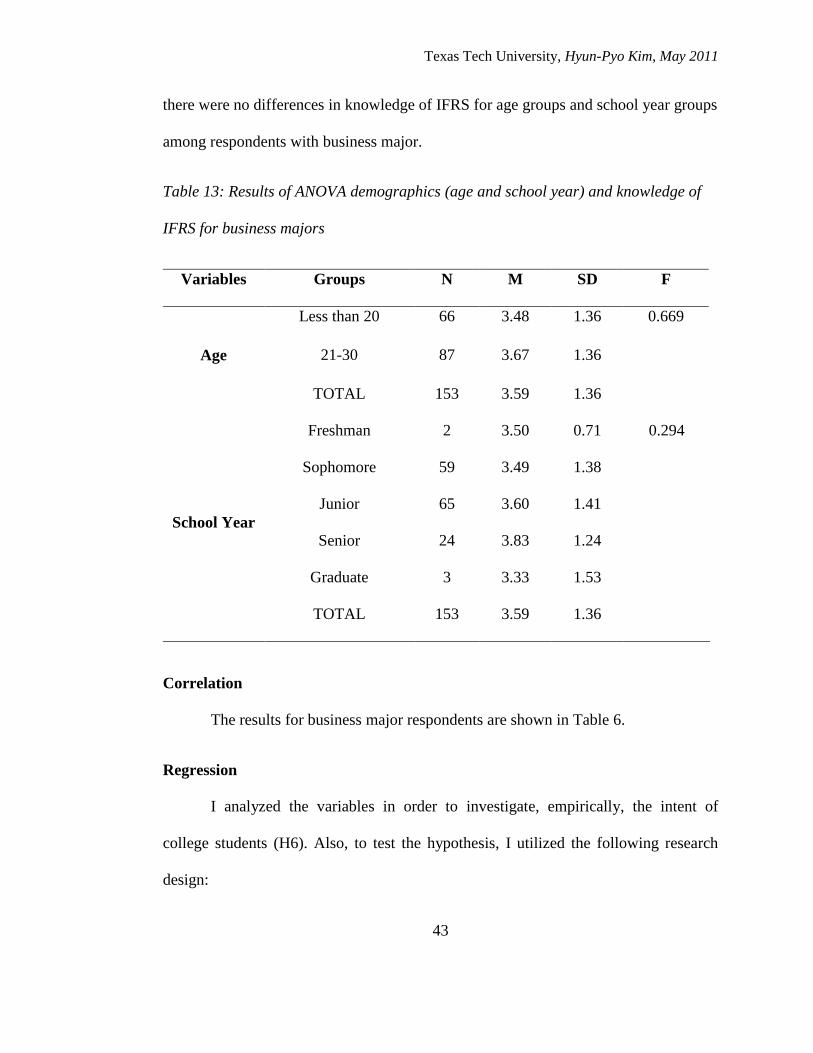
In Table 12, with the F value of 0.669 and the corresponding p value of 0.415,
no significance was found in ANOVA between the age groups with business major.
There are no differences between the age groups with business major regarding their
knowledge of IFRS that were evaluated as proxy because the F is 0.669 associated
probability value (0.415) does not meet the criterion for statistical significance (that is,
p < .05). Also, there are no differences between each school year group among
respondents with business major pertaining to their knowledge of IFRS. With the F
value of 0.294 and the corresponding p value of 0.882, no significance was found in
ANOVA within the school year groups with business major. These results show that
Texas Tech University, Hyun-Pyo Kim, May 2011
43
there were no differences in knowledge of IFRS for age groups and school year groups
among respondents with business major.
Table 13: Results of ANOVA demographics (age and school year) and knowledge of
IFRS for business majors
Variables Groups N M SD F
Age
Less than 20 66 3.48 1.36 0.669
21-30 87 3.67 1.36
TOTAL 153 3.59 1.36
School Year
Freshman 2 3.50 0.71 0.294
Sophomore 59 3.49 1.38
Junior 65 3.60 1.41
Senior 24 3.83 1.24
Graduate 3 3.33 1.53
TOTAL 153 3.59 1.36
Correlation
The results for business major respondents are shown in Table 6.
Regression
I analyzed the variables in order to investigate, empirically, the intent of
college students (H6). Also, to test the hypothesis, I utilized the following research
design:

Texas Tech University, Hyun-Pyo Kim, May 2011
44
INTENT = a0 + a1 KNOWLEDGE + a2 INTEREST + a3 PERCEPTION1 +
a4 PERCEPTION2 + a5 PERCEPTION3+ e (2)
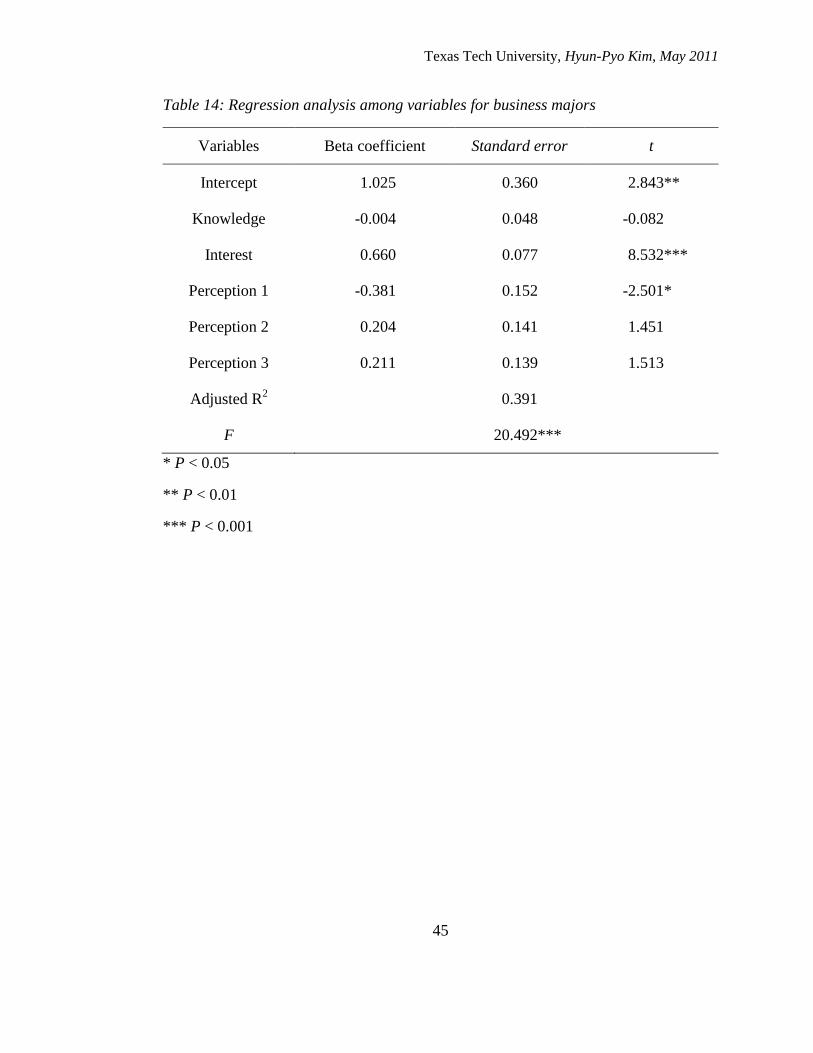
Table 13 presents the estimated coefficients from multivariate regression for
the sample respondents with a business major. As with the expectation of H 6, I found
that INTEREST improved the intent to take classes, significantly. This was significant
at the 0.1% level for business students. In particular, we can use the level of interest
about the IFRS to predict the intent to take classes of IFRS (t = 8.532 and p < .001).
Also, the results for PERCEPTION 1 (financial performance) of IFRS predicted the
intent to take classes of IFRS (t = -2.501 and p < .05).
These results showed that respondents with a business major who have an
interest about IFRS will take classes, if classes about the IFRS are offered by the
college or university. Therefore, business major respondents’ level of interest and
level of perception about financial performance can be used to predict their intention
to take classes from their college and university.
Texas Tech University, Hyun-Pyo Kim, May 2011
45
Table 14: Regression analysis among variables for business majors
Variables Beta coefficient Standard error t
Intercept 1.025 0.360 2.843**
Knowledge -0.004 0.048 -0.082
Interest 0.660 0.077 8.532***
Perception 1 -0.381 0.152 -2.501*
Perception 2 0.204 0.141 1.451
Perception 3 0.211 0.139 1.513
Adjusted R2 0.391
F 20.492***
* P < 0.05
** P < 0.01
*** P < 0.001

Texas Tech University, Hyun-Pyo Kim, May 2011
46
CHAPTER V
CONCLUSIONS AND LIMITATIONS
The primary objective of this study was to investigate perceptions concerning
the adoption of International Financial Reporting Standards (IFRS) among college
students. The study measured a population of students’ perceptions and knowledge of
IFRS at a large university in the American Southwest. By utilizing the results of this
study, we can see college students’ perceptions concerning the status of preparation
for the standards, and these results could help colleges and universities with decisions
regarding offering classes about these standards.
The findings are as follows; first, I found there was a difference in knowledge
about IFRS between male and female respondents. While it is difficult to generalize
these results to all college or university student populations, universities and colleges
should consider evaluating students to determine their level of knowledge about IFRS
and then have provisions in place for extra classes or assignments in order to raise the
extent of knowledge of IFRS for any group of students (male and female) who show
deficiencies in basic knowledge of these standards. Second, there were no differences
in knowledge about IFRS for each age group and each school year among respondents.
Third, I found a difference in knowledge about IFRS between students majoring in
business and students who were non-business majors. This implies that in this
population of respondents, business major students are taking more classes about
financial events such as the adoption of IFRS in the U.S. than are non-business major
students. Therefore, business major students have more knowledge of IFRS than do

Texas Tech University, Hyun-Pyo Kim, May 2011
47
non-business major students. Fourth, I found a correlation between the perception
about evaluating the positive effect of IFRS on capital markets and the intention to
take classes about IFRS. This means that students who believe there will be a positive
effect on capital markets by the adoption of IFRS are more likely to take classes
concerning IFRS. Also, these students will take more classes in order to analyze their
perceptions about the IFRS. Finally, the results predicted that students who showed a
great interest in IFRS are more likely to take these courses if colleges or universities
offer classes. These results mean that interest is a very critical determinant among
college students for taking classes concerning IFRS. The more that students have an
interest about IFRS; the more they will take classes. There are also similar results
shown in the additional analyses section pertaining to business major respondents.
These findings regarding college students’ perceptions about the adoption of
IFRS supply many direct implications for business departments in colleges and
universities. According to the literature review, while the corporate adoption of IFRS
is not decreasing costs, there have been increased economic benefits in capital markets.
It makes economic sense that accounting information from financial statements should
be comparable among countries and companies and that users of accounting
information be allowed to assess the similarities and/or differences among different
entities; this includes business departments in colleges and universities. By adopting
IFRS in the U.S., the comparability of the framework for accounting will be increased,
and this reliability will improve the transparency of financial statements.

Texas Tech University, Hyun-Pyo Kim, May 2011
48
Because of the planned adoption of IFRS, courses about the standards should
be considered or installed at all levels of the education system in the U.S., particularly
in colleges and universities because the adoption of IFRS will be a critical event in the
capital market. However, because the IFRS are not currently in use in the United
States totally, this research concerning the standards was conducted and analyzed
indirectly by examining college students’ perception of IFRS. Additionally, this study
was conducted with participants attending a university in the U.S. Southwest, so it
might not be possible to generalize these findings to all areas of the United States. I
recommend that further research be conducted, among several populations, regarding
adoption and execution of IFRS, while the standards and organization of classes about
the IFRS are offered in colleges or universities over the next few years.

Texas Tech University, Hyun-Pyo Kim, May 2011
49
REFERENCES
Ball, R. (2006). International Financial Reporting Standards (IFRS): Pros and Cons for
Investors. Accounting and Business Research.
Barth, M. E., Landsman, W. R., & Lang, M. H. (2007). International Accounting
Standards and Accounting Quality. Stanford University Graduate School of
Business Research, No. 1976.
Comier, D., Demaria, S., Lapointe-Antunes, P., & Teller, R. (2009). First-Time
Adoption of IFRS, Managerial Incentives, and Value-Relevance: Some French
Evidence. Journal of International Accounting Research, 8(2), 22.
Cuijpers, R., & Buijink, W. (2005). Voluntary adoption of Non-Local GAAP in the
European Union: A study of Determinants and Consequences. European
Accounting Review, 14(No.3), 487-524.
Daske, H., Hail, L., Leuz, C., & Verdi, R. S. (2008). Mandatory IFRS Reporting
Around the World: Early Evidence on the Economic Consequences. Working
paper.
Deloitte. (2008). IFRS Insights (Achieving a global standard). IFRS Solutions Center,
www.deloittee.com/us/ifrs.

Texas Tech University, Hyun-Pyo Kim, May 2011
50
Flynn, T. (2008). US warming to IFRS as it moves on from
GAAP(http://www.ft.com/cms/s/0/e944709e-7a19-11dd-bb93-
000077b07658.html#axzz1EM1Et03n)
Hail, L., Leuz, C., & Wysocki, P. D. (2009). Global Accounting Convergence and the
Potential Adoption of IFRS by the United States: An analysis of Economic and
Policy factors. Working paper.
Henson, J. (2011). IFRS USA(http://ifrsusa.wordpress.com/)
IAS39. (2008). IAS 39 Financial Instruments: Recognition and Measurement.
Kaiser, J. G. (2010). IFRS and US GAAP similarities and differences
Kim, I., & Chung, Y. (2008). A Study on Improvement of Accounting Curriculum in
Commercial Information High School by Introducing K-IFRS. The Korean
Research Association for the Business Education, 22.
McGee, R. W., & Preobragenskaya, G. G. (2005). Accounting Education in Ukraine.
Working paper.
Moqbel, M., & Bakay, A. (2010). Are US Academics and Professionals Ready for
IFRS? Working paper.
Nilsen, K. (2008). On the verge of an academic revolution: how IFRS is affecting
accounting education.(IFRS). Journal of Accountancy, 206(6), 82(84).
Olson, S. (2008). Firms preparing for new standards. Indianapolis Business Journal.

Texas Tech University, Hyun-Pyo Kim, May 2011
51
Quigley, J. (2007). Deloitte & Touche World Meeting, Berlin, Germany.
Tobin, J. (1969). A General Equilibrium Approach To Monetary Theory. Journal of
Money, Credit and Banking, 1(1), 15-29.
US GAAP vs. IFRS. (2009). E. Young (Ed.)

Texas Tech University, Hyun-Pyo Kim, May 2011
52
APPENDIX A
QUESTIONNAIRRE

Texas Tech University, Hyun-Pyo Kim, May 2011
53

Texas Tech University, Hyun-Pyo Kim, May 2011
54
APPENDIX B
IRB APPROVAL LETTER