investigating pharmaceutical co-crystals as a means …
TRANSCRIPT

INVESTIGATING PHARMACEUTICAL CO-CRYSTALS AS A MEANS TO
IMPROVE THE SOLUBILITY OF A DRUG
BY
Rebecca Brown
Submitted to the graduate degree program in
Pharmaceutical Chemistry and the Graduate Faculty
of the University of Kansas in partial fulfillment of the
requirements for the degree of Master’s of Science
______________________
Chairperson
Committee Members* ______________________*
______________________*
______________________*
______________________*
______________________*
Date defended: May 11, 2012

ii
The Thesis Committee for Rebecca Brown certifies
that this is the approved version of the following thesis:
INVESTIGATING PHARMACEUTICAL CO-CRYSTALS AS A MEANS TO
IMPROVE THE SOLUBILITY OF A DRUG
Committee:
______________________
Chairperson
______________________
______________________
______________________
______________________
______________________
Date approved: May 11, 2012

iii
Abstract
Recently co-crystals have emerged as a potential approach to improve the solubility,
dissolution, and bioavailability of active pharmaceutical ingredients (API). Often co-crystal
formation is studied in the development stage in order to solve an issue (with solid form or
formulation) or to expand intellectual property. However, co-crystals may have the potential of
enhancing the developability of a poorly soluble lead candidate in the discovery stage. In this
study, piroxicam, a BCS (Biopharmaceutical Classification System) Class II compound with low
solubility, was chosen as a model drug to explore this possibility. The solution phase reaction
crystallization method was chosen over slow evaporation as a way to make co-crystals because it
can produce pure co-crystals that can be scaled by simply using the solubility data of the parent
and coformer. A screen of carboxylic acid coformers yielded six piroxicam co-crystals which
were characterized. Co-crystal aqueous solubility was measured and models were used to
calculate co-crystal pH dependent solubility. Intrinsic dissolution rates of the co-crystals were
measured in biorelevant media. Co-crystals were found to be more soluble and the dissolution
rates were lower than the parent. Piroxicam oral exposure in rat from the co-crystals was
determined and was similar to free piroxicam.

iv
Acknowledgements
I would like to thank my on site research advisor, Dr. Deborah Galinis, for her guidance
and encouragement throughout this research project. I am very grateful for the support and
flexibility afforded to me from Cephalon and Teva Pharmaceuticals to pursue this masters
program as well as the enthusiasm from my directors Dr. Mehran Yazdanian and Dr. Rob
McKean, and vice president Dr. Craig Heacock. I am appreciative of the University of Kansas
Pharmaceutical Chemistry Department for offering this distance masters program and am
especially thankful for my KU advisor, Dr. Valentino Stella, for his guidance and scientific
discussions. I am extremely grateful to Dr. Nair Rodríguez-Hornedo for personally sharing her
expertise with me on solution phase reaction crystallization and co-crystal solubility. Much of
this work would not have been possible without the help from several of my colleagues including
Dr. Laurent Courvoisier, Steve Bierlmaier, and Curtis Haltiwanger for their help with solid state
analysis techniques, Dr. Lisa Aimone for sharing her in-vivo knowledge and suggestions, and
Damaris Rolon-Steele and Kelli Zeigler for performing in-vivo pharmacokinetic studies. Lastly,
I would like to thank my husband and family for their love, support, and patience while I pursued
this degree.

v
Table of Contents
Chapter 1. Introduction
Pharmaceutical Interest in Co-crystals 1
Co-crystal Synthesis Methods 3
Piroxicam as a Model Compound 4
References 6
Chapter 2. Piroxicam Co-crystals by Slow Evaporation
Introduction 8
Experimental 9
Results and Discussion 14
Conclusions 19
References 20
Chapter 3. Piroxicam Co-crystals by Reaction Crystallization
Introduction 21
Experimental 23
Results and Discussion 26
Conclusions 33
References 34
Chapter 4. Co-crystal Solubility
Introduction 35
Experimental 36
Results and Discussion 38
Conclusions 45
References 46
Chapter 5. Intrinsic Dissolution and Pharmacokinetics
Introduction 47
Experimental 48
Results and Discussion 50
Conclusions 60
References 61
Chapter 6. Final Conclusions and Future Considerations 63
Chapter 7. Appendix
Slow Evaporation Solid State Data 65
Reaction Crystallization Solid State Data 83
Co-crystal Solubility 93
Intrinsic Dissolution 99
Pharmacokinetic Data 119

1
CHAPTER 1. Introduction
Purpose of the Research Performed
The purpose of the research covered in this thesis was to explore the use of co-crystal
formation to alter the physical/chemical properties of the non-steroidal drug, piroxicam, in order
to improve drug solubility, dissolution, and bioavailability.
Pharmaceutical Interest in Co-crystals
In the past decade, drug candidates have evolved toward compounds with increasing
molecular weight and lipophilicity often resulting in poorly water soluble drugs.1 This has
remained a key issue for pharmaceutical candidates with drugs often failing in development due
to their low aqueous solubility.2 Limited solubility often causes poor and variable oral absorption
because the dissolution rate or solubility is insufficient to completely dissolve the drug in the
gastrointestinal tract.3
Recently pharmaceutical co-crystals have emerged as a promising solid state technique to
improve API (active pharmaceutical ingredient) properties such as solubility, dissolution rate,
bioavailability, and stability.4-8
A review by Schultheiss and Newman on pharmaceutical co-
crystals and their physiochemical properties lists several definitions of a co-crystal such as a
solid molecular complex at room temperature containing a neutral, ionic, or zwitterionic
molecule of the API and one or more complementary molecules (coformers) including excipients
(non-toxic ingredients) or other APIs.8 However, the FDA guidance that was recently released
on pharmaceutical co-crystals specifies that the co-crystal components exist in their neutral states
2
and interact via non-ionic interactions, as opposed to ionic interactions, which would classify this
crystalline solid as a salt form.9
The API and coformer can interact through hydrogen bonding,
π-stacking, or van der Waals forces.10
In theory, all types of drug molecules have the capability
to form co-crystals; therefore, co-crystals have advantages over traditional solid-state
modification techniques (e.g., salts, solvates, hydrates, and polymorphs). For example, co-
crystals provide an alternative for APIs that are unable to form salts due to lack of ionization
moieties.
Pharmaceutical co-crystals provide a means to increase API solubility, dissolution rate,
and bioavailability. For example, the aqueous solubility of seven carbemazepine co-crystals
measured by Good and Rodiguez-Hornedo was approximately 2 to 152 times greater than the
solubility of the stable carbamazepine dihydrate form.11
In a study by Stanton et. al., AMG 517
co-crystals paired with cinnamic acid, benzoic acid, cinnamamide, and benzamide gave
significant increases in dissolution rate and oral exposure compared to the free base form.12
Jung
et. al. created indomethacin-saccharin co-crystals that produced higher in vitro dissolution rates
at pH 1.2 and 7.4 as well as higher bioavailability in dogs than indomethacin.13
However, this
improvement was not significantly different from the marketed product, Indomee®. In another
study, an increase in bioavailability in dogs was also demonstrated using glutaric acid co-
crystals.14
Co-crystals have also been used to overcome API stability issues such as polymorphism
and hydroscopicity.7-8
An example where co-crystals were used to reduce hydroscopicity was
with caffeine. It is well known that caffeine is subject to hydrate formation.1 Caffeine-
dicarboxylic acid co-crystals resisted hydrate formation, even when prepared from the hydrated
3
drug form.15
Furthermore, caffeine co-crystals with oxalic acid were non-hydroscopic and stable
over several weeks when maintained at 43-98% relative humidity.15
In a similar case, Trask et.
al. found that theophylline co-crystals with oxalic, malonic, maleic, and glutaric acid did not
hydrate at high relative humidity.16
A carbamazepine/saccharin co-crystal created by Hickey et.
al. is a case where co-crystallization reduced the incidence of polymorphism compared to pure
carbamazepine, which has four known polymorphs and several solvates.17
The physical and
chemical stability as well as the oral bioavailability of the carbamazepine co-crystal was proven
to be quantitatively similar to the pure drug in the marketed product, Tegretol®.
Co-crystal Synthesis Methods
It is relatively straight forward for the medicinal chemist to create a salt form based on
the pKa value(s) of a lead molecule and that of the intended acid or base used to form the salt.7
However, several different methods have been reported to screen and make co-crystals including
wet cogrinding, sonic slurry, and slow evaporation.2, 5, 18
These studies are generally carried out
in ternary systems (API, coformer, and solvent) and phase diagrams are generated that describe
the conditions for thermodynamic stability and provide insight into the experimental conditions
that may lead to co-crystal formation.18
With these methods, solvent or solvent mixtures with
similar solubilities for reactants are chosen and stoichiometric amounts of the reactants are used.
Often times, slow evaporation experiments are performed in a high throughput screening mode
in which small quantities of co-crystals are identified in a 96 well plate.19
Slow evaporation
accounts for approximately 40% of the co-crystallization techniques appearing in the literature.20

4
Reaction crystallization is another strategy used to identify and generate co-crystals. This
method is also based on the solubilities of the reactants; however, nonstoichiometric reactant
solution concentrations are used.18
Co-crystals are generated via supersaturation with respect to
the co-crystal in a liquid phase that is ideally saturated or undersaturated with respect to the
reactants.21, 22
In other words, a saturated solution of the reactants is made with the intention of
creating an environment where the co-crystal form is supersaturated and precipitates out of
solution.
These methods afford a variety of options but also make it difficult to decide which
approach will be the most successful. Ideally the method used will identify and produce co-
crystals relatively quickly so that the co-crystals can be tested to determine if they have an
advantage over the API itself. It is also important that the co-crystal synthesis method chosen is
reproducible and scalable in order to produce the significant amount of material required for
solubility, intrinsic dissolution, and in vivo studies. Finally and most importantly, the method
has to yield pure co-crystal material so that accurate conclusions can be made when the co-
crystals are tested.
Piroxicam as a Model Compound
Piroxicam was chosen as a model compound to explore co-crystal formation in this
research because it is a Biopharmaceutics Classification System (BCS) Class II compound,
which by definition has low solubility and high permeability. It is a nonsteroidal anti-
inflammatory drug used in the symptomatic treatment of rheumatoid arthritis and osteoarthritis.23
Solubility and permeability are the fundamental properties determining the bioavailability of an
5
orally active drug; therefore, poor oral absorption is often an issue for BCS Class II drug.24
Co-
crystals of Class II compounds have been shown to increase bioavailability in some cases.10
When dosed orally, it takes more than two hours for piroxicam to reach maximum concentration
which indicates the oral exposure is limited by solubility.25-27
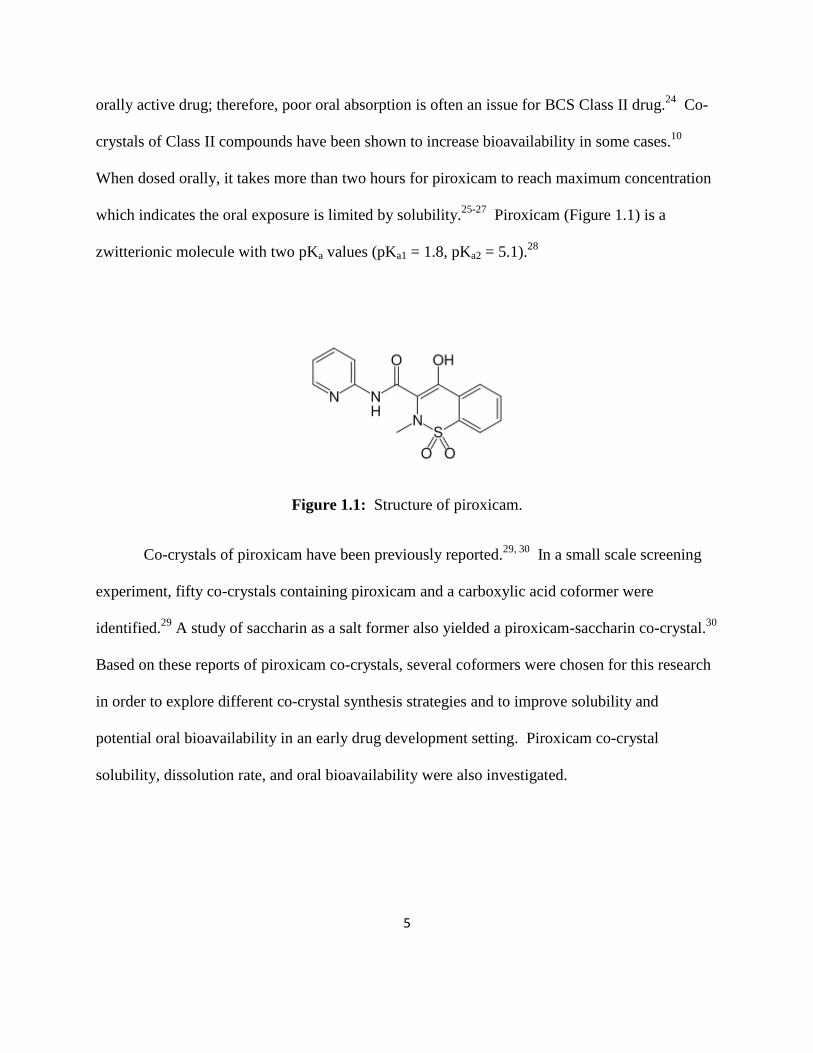
Piroxicam (Figure 1.1) is a
zwitterionic molecule with two pKa values (pKa1 = 1.8, pKa2 = 5.1).28
Figure 1.1: Structure of piroxicam.
Co-crystals of piroxicam have been previously reported.29, 30
In a small scale screening
experiment, fifty co-crystals containing piroxicam and a carboxylic acid coformer were
identified.29
A study of saccharin as a salt former also yielded a piroxicam-saccharin co-crystal.30
Based on these reports of piroxicam co-crystals, several coformers were chosen for this research
in order to explore different co-crystal synthesis strategies and to improve solubility and
potential oral bioavailability in an early drug development setting. Piroxicam co-crystal
solubility, dissolution rate, and oral bioavailability were also investigated.
6
References
1. Meanwell NA. 2008. The emerging utility of co-crystals in drug discovery and development.
Annual Reports in Med Chem 43(8):373-404.
2. Qiao N, Li M, Schlindwein W, Malek N, Davies A, Trappitt G. 2011. Pharmaceutical co-
crystals: An overview. Int J Pharm 419(1-2):1-11.
3. Varma MVS, Khandavilli S, Ashokraj Y, Jain A, Dhanikula A, Sood A, Thomas NS, Pillai
O, Sharma P, Gandhi R, Agrawal S, Nair V, Panchagnula R. 2004. Biopharmaceutic
classification system: A scientific framework for pharmacokinetic optimization in drug
research. Current Drug Metabolism 5(5):375-388.
4. Blagden N, de Matas M, Gavan PT, York P. 2007. Crystal engineering of active
pharmaceutical ingredients to improve solubility and dissolution rates. Adv Drug Deliv Rev
59(7):617-630. 5. Miroshnyk I, Mirza S, Sandler N. 2009. Pharmaceutical co-cyrstals: An opportunity for drug
product enhancement. Expert Opin Drug Deliv 6(4):333-341.
6. Rodríguez-Hornedo N, Nehm SJ, Jayasankar A. 2007. Cocrystals: Design, Properties and
Formation Mechanisms. Encyclopedia of Pharm Technology 615-635.
7. Peterson ML, Hickey M.B, Zaworotko MJ, Almarsson O. 2006. Expanding the scope of
crystal form evaluation in pharmaceutical science. J Pharm Sci 9(3):317-326.
8. Schultheiss N, Newman A. 2009. Pharmaceutical co-crystals and their physiochemical
properties. Cryst Growth Des 9(6):2950-2967.
9. Draft Guidance for Industry 2011. Regulatory Classification of Pharmaceutical Co-crystals.
http://www.fda.gov/Drugs/GuidanceComplianceRegulatoryInformation.htm.
10. Sekhon BS. 2009. Pharmaceutical co-crystals – a review. Ars Pharm 50(3):99-117.
11. Good DJ, Rodríguez-Hornedo N 2009. Solubility advantage of pharmaceutical cocrystals.
Cryst Growth Des 9(5):2252-2264.
12. Stanton MK, Kelly RC, Colletti A, Kiang YH, Langley M, Munson EJ, Peterson ML,
Roberts J, Wells M. 2010. Improved pharmacokinetics of AMG 517 through co-
crystallization part 1: Comparison of two acids with corresponding amide co-crystals. J
Pharm Sci 99(9):3769-3778.
13. Jung MS, Kim JS, Kim MS, Alhalaweh A, Cho W, Hwang SJ, Velaga SP. 2010.
Bioavailability of indomethacin-saccharin co-crystals. J Pharmacy and Pharmacology
62(11):1560-1568.
14. McNamara DP, Childs SL, Giordano J, Iarriccio A, Cassidy J, Shet MS, Mannion R,
O’Donnell E, Park A. 2006. Use of a Glutaric acid co-crystal to improve oral bioavailability
of a low solubility API. Pharm Res 23(8):1888-1897.
15. Trask AV, Motherwell WDS, Jones W. 2005. Pharmaceutical co-crystallization:
Engineering a remedy for caffeine hydration. Crys Growth Des 5(3):1013-1021. 16. Trask AV, Motherwell WDS, Jones W. 2006. Physical stability enhancement of theophylline
via co-crystallization. Int J Pharm 320(1-2):114-123. 17. Hickey MB, Peterson ML, Scoppettuolo LA, Morrisette SL, Vetter A, Guzmán H, Remenar
JF, Zhang Z, Tawa MD, Haley S, Zaworotko MJ, Almarsson Ö. 2007. Performance
comparison of a co-crystal of carbamazepine with marketed product. Euro J Pharm Biopharm
67:112-119.

7
18. Childs SL, Rodríguez-Hornedo N, Reddy LS, Jayasankar A, Maheshwari C, McCausland L,
Shipplett R, Stahly BC. 2008. Screening strategies based on solubility and solution
composition generate pharmaceutically acceptable cocrystals of carbamazepine. Cryst Eng
Comm 7(10):856-864.
19. Morissette SL, Almarsson Ö, Peterson ML, Remenar JF, Read MJ, Lemmo AV, Ellis S,
Cima MJ, Gardner CR. 2004. High-throughput crystallization: polymorphs, salts, co-crystals
and solvates of pharmaceutical solids. Adv Drug Deliv Rev 56(3):275-300.
20. Sheikh AY, Rahim SA, Hammond RB, Roberts KJ. 2008. Scalable solution co-
crystallization: case of carbamazepine-nicotinamide I. Cryst Eng Comm 11:501-509.
21. Rodríguez-Hornedo N, Nehm SJ, Seefeldt KF, Pagán-Torres Y, Falkiewicz CJ. 2005.
Reaction crystallization of pharmaceutical molecular complexes. Molecular Pharm 3(3):362-
367.
22. Nehm SJ, Rodríguez-Spong B, Rodríguez-Hornedo N. 2006. Phase solubility diagrams of
cocrystals are explained by solubility product and solution complexation. Cryst Growth Des
6(2):592-600.
23. Gwak H, Choi J, Choi H. 2005. Enhanced bioavailability of piroxicam via salt formation
with ethanolamines. Int J Pharm 297(1-2):156-161.
24. Varma MVS, Khandavilli S, Ashokraj Y, Jain A, Dhanikula A, Sood A, Thomas NS, Pillai
O, Sharma P, Gandhi R, Agrawal S, Nair V, Panchagnula R. 2004. Biopharmaceutic
classification system: A scientific framework for pharmacokinetic optimization in drug
research. Current Drug Metabolism 5(5):375-388.
25. Fernandez S, Chevrier S, Ritter N, Mahler B, Demarne F, Carrière F, Jannin V. 2009. In
Vitro gastrointestinal lipolysis of four formulations of piroxicam and cinnarizine with the self
emulsifying excipients labrasol® and gelucire® 44/14. Pharm Res 26(8):1901-1910.
26. Kimura E, Bersani-Amado CA, Sudo LS, Santos SR, Oga S. 1997. Pharmacokinetic profile
of piroxicam ß-cyclodextrin in rat plasma and lymph. Gen Pharmac 28(5):695-698.
27. Tagliati CA, Kimura E, Nothenberg MS, Santos SR, Oga S. 1999. Pharmacokinetic profile
and adverse gastric effect of zinc-piroxicam in rats. Gen Pharm 33(1):67-71.
28. Cheong HA, Choi HK. 2002. Enhanced percutaneous absorption of piroxicam via salt
formation with ethanolamines. Pharm Res 19(9):1375-1380.
29. Childs SL, Hardcastle KI. 2007. Cocrystals of Piroxicam with Carboxylic Acids. Cryst
Growth Des 7(7):1291-1304.
30. Bhatt PM, Ravindra NV, Banerjee R, Desiraju GR. 2005. Saccharin as a salt former.
Enhanced solubilities of saccharinates of active pharmaceutical ingredients. Chem Commun
1073-1075.

8
CHAPTER 2. Piroxicam Co-crystals by Slow Evaporation
Purpose of the Research Performed
The purpose of the research performed in this chapter was to explore the feasibility of
creating scale-up batches of co-crystals by slow evaporation.
Introduction
Childs and Hardcastle performed an extensive small scale co-crystal screen with
piroxicam and 23 carboxylic acids using solution based and solid-state grinding methods.1 The
solution based screen was done in a 96-well format with stoichiometric amounts of piroxicam
and the carboxylic acids and various solvent mixtures. These solutions were allowed to slowly
evaporate to dryness at room temperature. Solid-state grinding screening methods were also
utilized to study physical mixtures of piroxicam and 20 carboxylic acids in 1:1 and 1:2
API/coformer combinations. Raman spectroscopy and X-ray powder diffraction (XRPD) were
used to characterize the solids. Single piroxicam co-crystals were also grown by slow
evaporation with 10 carboxylic guest compounds and four different solvent combinations. From
these experiments, single crystal data was reported for nine piroxicam/carboxylic acid co-
crystals.
Five of these acid/solvent combinations were used in this thesis in order to determine the
feasibility of growing co-crystals by slow evaporation on a larger scale (50 mg – 2 g). The
structures of the coformers used as well as the ratio of piroxicam to coformer are listed in Table
2.1. The solids were characterized by XRPD, differential scanning calorimetry (DSC), and

9
thermal gravimetric analysis (TGA). XRPD patterns were compared to the single crystal data
reported by Childs and Hardcastle1 to determine whether or not the solid was in fact a co-crystal.
XRPD and DSC data were also obtained for piroxicam, each acid, and physical mixtures of
piroxicam and each acid. The solid XRPD patterns were also compared to other known forms of
piroxicam.2
Table 2.1: Coformer structures and co-crystal ratio.
Coformer Structure Piroxicam / Coformer Ratio
1-hydroxy, 2-Naphthoic acid
1:1
Malonic acid
1:1 and 2:1
4-hydroxy Benzoic Acid
1:1
Succinic Acid
1:1 and 2:1
Benzoic Acid
1:1
Experimental
The materials listed in this chapter as well as the XRPD, DSC, and thermogravimetric analysis
methods were used throughout the entirety of this research.

10
Materials
Piroxicam was obtained from 3B Pharmachem International Co. Ltd. (China). Gentisic
acid was obtained from MP Biomedicals (Solon, OH). Saccharin was purchased from Spectrum
Chemicals (New Brunswick, NJ). Benzoic acid, fumaric acid, maleic acid, malonic acid,
tetrahydrofuran, and 2,2,2, trifluoroethanol were purchased from Alfa Aesar (Lancashire, UK).
4-hydroxy benzoic acid was obtained from TCI America (Portland, OR). Salicylic acid and
monobasic potassium phosphate were purchased from J.T. Baker (Phillipsburg, NJ). Sodium
chloride, 1-hydroxy 2-naphthoic acid, alprenolol, and mandelic acid was obtained from Sigma-
Aldrich (St. Louis, MO). Succinic acid and tetrahydrofuran were purchased from EMD
Chemicals (Cincinnati, OH). Water, 0.1% trifluoroacetic acid in water, acetonitrile, isopropanol,
and methanol were all HPLC grade and purchased from J.T. Baker (Phillipsburg, NJ).
X-ray Powder Diffraction (XRPD)
Powder XRD patterns were recorded on a PANalytical X Pert Pro diffractometer
equipped with an X celerator detector using Cu K radiation at 45 kV and 40 mA. K1 radiation
is obtained with a highly oriented crystal (Ge111) incident beam monochromator. A 10 mm
beam mask, and fixed (1/4) divergence and anti-scatter (1/8) slits were inserted on the incident
beam side. A fixed 5 mm receiving slit was inserted on the diffracted beam side. The X-ray
powder pattern scan was collected from ca. 2 to 40° 2θ with a 0.0080° step size and 96.06 sec
counting time which resulted in a scan rate of approximately 0.5°/min. The sample was spread
on a silicon zero background (ZBG) plate for the measurement. The sample was rotated at 15
revolutions/min on a PANalytical PW3065/12 Spinner.

11
Differential Scanning Calorimetry (DSC)
Thermal curves were acquired using a Perkin-Elmer Sapphire DSC unit equipped with an
autosampler running Pyris software version 6.0 calibrated with Indium prior to analysis. Solid
samples of 1-10 mg were weighed into 20 µL aluminum sample pans with pin hole lids. The
DSC cell was then purged with nitrogen and the temperature heated from 0 to 375°C at 10°C /
min. Indium (Tm = 156.6ºC; ∆HFUS = 28.45 J g−1
) was used for calibration.
Thermogravimetric Analysis (TGA)
Thermal curves were acquired using a Perkin-Elmer Pyris 1 TGA unit running Pyris
software version 6.0 calibrated with alumel (95% nickel, 2% manganese, 2% aluminum and 1%
silicon), nickel and calcium oxalate monohydrate. TGA samples between 1-5 mg were monitored
for percent weight loss as heated from 25 to 250°C at 10°C/min in a furnace purged with Helium
at ca. 50 mL/min.
High Performance Liquid Chromatography (HPLC)
The purity of the co-crystal components was assessed by HPLC. The HPLC-UV
instrument used was an Agilent 1200 series (Palo Alto, CA) equipped with a UV diode array
detector (Agilent Technologies, Palo Alto, CA) and contained an Agilent Zorbax Bonus RP 4.6 x
150mm, 3.5 micron column. Concentrations were determined using a gradient method from 5%
solvent B (acetonitrile containing 0.1% trifluoroacetic acid) in solvent A (water containing 0.1%
trifluoroacetic acid) to 95% solvent B in solvent A in 25 minutes, isocratic at 100% solvent B for
1.5 minutes, then equilibrate for 5 minutes at 5% solvent B in solvent A. The flow rate was 1
mL/min. Calibration curve standards were prepared in methanol at 1, 10, 100, and 250 µg/mL.

12
The wavelengths of absorbance monitored for piroxicam and 4-hydroxy benzoic acid were 325
and 254 nm respectively. All other acids were monitored at 210 or 220 nm.
Co-crystal Slow Evaporation Method
Crystals were grown by slow evaporation at room temperature using the methods and
solvents described by Childs and Hardcastle.1 The amount of piroxicam and coformer required
for the desired co-crystal yield (e.g. 50 mg, 100 mg, etc.) was calculated based on the molecular
weight of the co-crystal. Piroxicam and coformers were weighed into a glass vial and solvent
was then added until all the solid was dissolved. The vials were sealed with paraffin wax paper
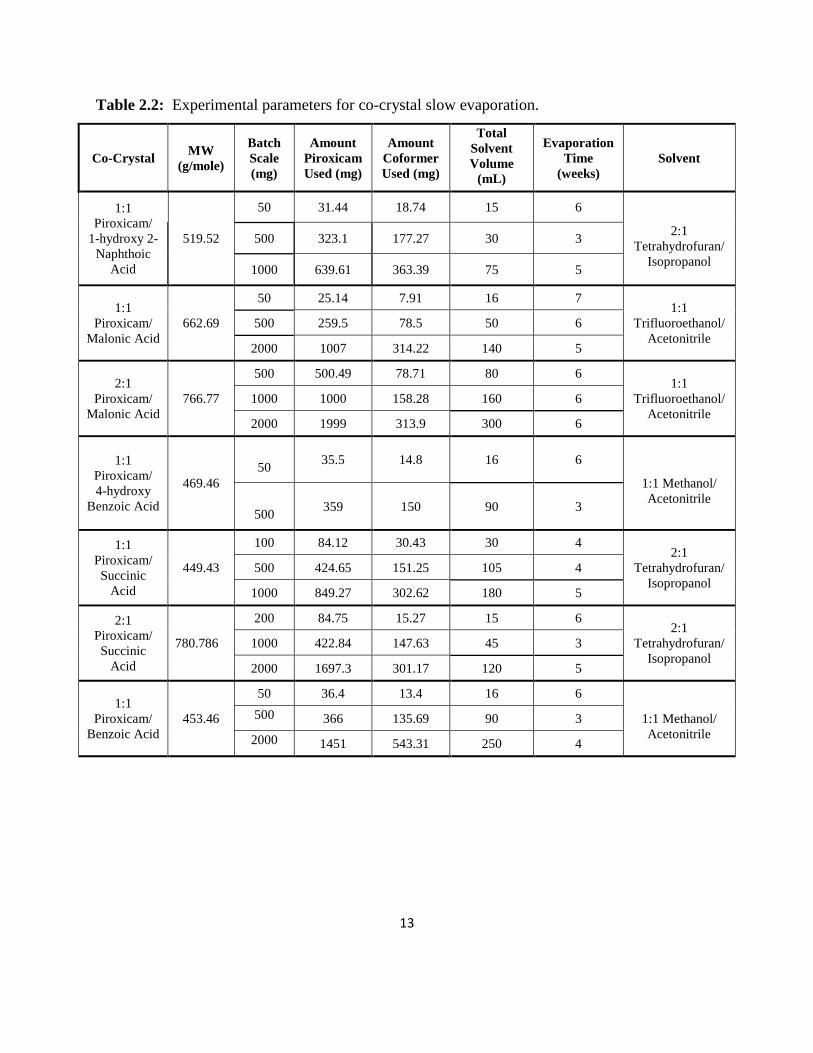
and a small hole was punched in the paper and then set to evaporate. Table 2.2 lists the
experimental details for each co-crystal.
13
Table 2.2: Experimental parameters for co-crystal slow evaporation.
Co-Crystal MW
(g/mole)
Batch
Scale
(mg)
Amount
Piroxicam
Used (mg)
Amount
Coformer
Used (mg)
Total
Solvent
Volume
(mL)
Evaporation
Time
(weeks)
Solvent
1:1
Piroxicam/
1-hydroxy 2-
Naphthoic
Acid
519.52
50 31.44 18.74 15 6
2:1
Tetrahydrofuran/
Isopropanol
500 323.1 177.27 30 3
1000 639.61 363.39 75 5
1:1
Piroxicam/
Malonic Acid
662.69
50 25.14 7.91 16 7 1:1
Trifluoroethanol/
Acetonitrile
500 259.5 78.5 50 6
2000 1007 314.22 140 5
2:1
Piroxicam/
Malonic Acid
766.77
500 500.49 78.71 80 6 1:1
Trifluoroethanol/
Acetonitrile
1000 1000 158.28 160 6
2000 1999 313.9 300 6
1:1
Piroxicam/
4-hydroxy
Benzoic Acid
469.46
50 35.5 14.8 16 6
1:1 Methanol/
Acetonitrile
500 359 150 90 3
1:1
Piroxicam/
Succinic
Acid
449.43
100 84.12 30.43 30 4 2:1
Tetrahydrofuran/
Isopropanol
500 424.65 151.25 105 4
1000 849.27 302.62 180 5
2:1
Piroxicam/
Succinic
Acid
780.786
200 84.75 15.27 15 6 2:1
Tetrahydrofuran/
Isopropanol
1000 422.84 147.63 45 3
2000 1697.3 301.17 120 5
1:1
Piroxicam/
Benzoic Acid
453.46
50 36.4 13.4 16 6
1:1 Methanol/
Acetonitrile
500 366 135.69 90 3
2000 1451 543.31 250 4

14
Results and Discussion
In the piroxicam co-crystal study by Childs1, more detailed experimental synthesis
methods were given for the nine single crystal co-crystals reported. Out of these nine, the five
piroxicam/acid/solvent sets used in this thesis were chosen because did not require
heating/cooling or produce a mixture of co-crystal forms. Co-crystal XRPD results for the
batches of co-crystals made in this research could then be directly compared to the single crystal
data reported by Childs.
A total of seven slow evaporation experiments with piroxicam and five carboxylic acid
coformers in either 1:1 or 2:1 piroxicam/acid stoichiometric ratios were performed. A summary
of the data collected for each batch of co-crystal is listed in Table 2.3. Coformer melting points
are also included in this table as a reference. The melting point of the piroxicam material used
was 207ºC. The remaining solids after evaporation were analyzed by HPLC to assess the purity
of piroxicam and the coformers. No chemical degradation was observed. A stability study of
piroxicam in all the solvent combinations proved piroxicam to be stable at room temperature for
at least 42 days. XRPD patterns and DSC thermograms not shown in this chapter can be found in
the appendix.

15
Table 2.3: Summary of co-crystal recovery and characterization.
Co-Crystal
Batch
Scale
(mg)
Pure Co-crystal?
Weight Loss by
TGA
(%)
Co-crystal MP
by DSC
(ºC)
Coformer MP
by DSC
(ºC)
1:1
Piroxicam/
1-hydroxy 2-
Naphthoic
Acid
50 Maybe <1 195
200.8 500 Maybe 1.6 195
1000 Maybe <1 188, 196
1:1
Piroxicam/
Malonic Acid
50 No 7.2 145, 162, 191
95.5, 139.6 500 No 11.0 85, 140, 143,
160, 199
2000 No 15.8 88, 139, 142
2:1
Piroxicam/
Malonic Acid
500 No 16.9 110, 160, 204
95.5, 139.6 1000 No 8.6 157, 203
2000 No 10.4 87, 160, 205
1:1
Piroxicam/
4-hydroxy
Benzoic Acid
50 No <1 186, 197
217.9
500 No 1.4 188, 197
1:1
Piroxicam/
Succinic
Acid
100 No <1 156, 170, 180
193.3 500 No 1.3 155, 170, 180
1000 No 1.3 155, 170, 177
2:1
Piroxicam/
Succinic
Acid
200 No <1 170, 180
193.3 1000 No <1 47, 81, 170, 188
2000 No <1 155, 170, 204,
234, 245
1:1
Piroxicam/
Benzoic Acid
50 No 13.1 122, 141, 168,
198
124.7 500 No 18.3 135, 168, 198
2000 No 10.2 118, 169
1:1 Piroxicam/1-hydroxy 2-Naphthoic Acid. XRPD results (Figure 2.1) were
reproducible for the 50 mg, 500 mg and 1 g scales made. The XRPD data mostly matched the
single crystal data in the literature with the exception of a few peaks, which could be small

16
impurities or other crystalline forms. The co-crystals had very little weight loss (< 1 %) when
heated up to 250°C and DSC (Figure 2.2) gave one endotherm at 195°C for the 50 and 500 mg
batches suggesting that the material was mostly pure. A small endotherm at 188°C was observed
for the 1 g batch. Based on these results, it is possible that the material is a co-crystal.
Figure 2.1: XRPD patterns for 1:1 piroxicam/1-hydroxy 2-naphthoic acid and starting materials.
5 10 15 20 25 30 35 40 2Theta (°)
0
2500
10000
22500
Intensity (counts)
500 mg scale
1 g scale
50 mg scale
Literature Single Crystal Data
1:1 Piroxicam / 1-Hydroxy 2-Naphthoic Acid
1-Hydroxy 2-Naphthoic Acid
Starting Material
Piroxicam Starting Material

17
Figure 2.2: DSC thermograms for 1:1 piroxicam/1-hydroxy 2-naphthoic acid and starting
materials.
1:1 and 2:1 Piroxicam/Malonic Acid. The 1:1 crystals had a few peaks that matched
the literature single crystal data as well as peaks that matched the malonic acid starting material.
Water and excess malonic acid were observed in the DSC data. A broad endotherm at 160°C
matched the DSC results for the physical mixture. This endotherm could also represent a
solvate, which would correlate with the large weight loss by TGA (7-15%). Due to the excess
malonic acid observed in the DSC data, an attempt was made to make a 2:1 co-crystal. XRPD
patterns of 1:1 and 2:1 piroxicam/malonic acid crystals did not compare. The 1 g and 2 g scales
for the 2:1 crystals produced large crystals so a crystal was submitted for single crystal analysis.
Single crystal data proved the crystal to be piroxicam monohydrate and not a co-crystal. The
XRPD pattern also correlated with the malonic acid starting materials. DSC data had multiple
1 g scale
50 & 500 mg scale

18
endotherms suggesting water and piroxicam. Like the 1:1 crystals, the 2:1 also had a broad
endotherm at 160°C. About 10-17% weight loss was observed. From this data it was concluded
that the 2:1 crystals were not co-crystals and most likely a mixture of piroxicam monohydrate,
piroxicam, and malonic acid. The 1:1 crystals appear to be a mixture of co-crystal and malonic
acid.
1:1 Piroxicam/4-hydroxy Benzoic Acid: XRPD results for the 50 mg and 500 mg 1:1
piroxicam/4-hydroxy benzoic acid crystals were reproducible. Only a few peaks matched the
literature single crystal data. Some of the peaks matched the physical mixture pattern. DSC
results had one split endotherm with peaks at 187 and 197°C. There was very little weight loss
by TGA. It is possible that the crystals could be a mixture of co-crystals along with the starting
materials.
1:1 and 2:1 Piroxicam/Succinic Acid: Results for the 1:1 and 2:1 piroxicam/succinic
acid crystals were confusing. The 2:1 XRPD patterns did not correlate with the literature single
crystal data. The 1:1 and 2:1 patterns were very similar with the exception of a few peaks. Both
patterns also had a few peaks that compared with the starting materials. There were multiple
endotherms in the DSC data for the crystals. The DSC data for the 1:1 crystals were
reproducible for all the batches made. However, the 2:1 DSC results were not reproducible, with
the number of endotherms increasing as the scale increased. The largest endotherm, which was
present in all of the 1:1 and 2:1 crystals, was at 170°C. In all of the DSC data, the endotherms
were sharp peaks which suggests, along with the small weight loss by TGA, that no solvates
were present. Overall, there appeared to be multiple substances in the crystals which may or
may not include co-crystals.

19
1:1 Piroxicam/Benzoic Acid: The XRPD patterns for all three scales were not
consistent. Some of the peaks from each batch matched the literature single crystal data;
however, many also compared with the physical mixture patterns as well. The 50 and 500 mg
DSC data was similar with endotherms at 168 and 198ºC. The 2 gram scale had an endotherm at
168ºC but not at 198ºC. All three scales had endotherms within the 118-140ºC region which
could correspond to the melt of benzoic acid (melting point at 124ºC). This theory was also
supported by the weight loss (10-18%) observed within this temperature region. It is possible
that the endotherm at 168ºC could correspond to a co-crystal. Based on these results, the crystals
were most likely a mixture of the reactants and possibly some co-crystal material.
Conclusions
Out of seven slow evaporation experiments with five carboxylic acid coformers, only the
1:1 piroxicam/1-hydroxy, 2-napthoic acid crystals appeared to be co-crystals. All of the other
crystals produced were physical mixtures of the reactants that may or may not have also
contained co-crystals. The Childs reference did not report the concentrations of piroxicam and
coformer used as well the solution volume and the exact rate of evaporation.1 It is possible that
the scale-up batches did not contain the ideal ternary system of API, coformer, and solvent to
make the co-crystal form. 3
While the slow evaporation method works well for identifying co-crystals on a small
scale, it does not appear to be ideal for scale-up without further method development. The long
evaporation time required for large batches of co-crystals is not practical to identify and test new
API forms. Obtaining a pure batch of co-crystals was also a major issue for most, if not all, of

20
the slow evaporation experiments conducted. Without a significant amount of pure material, co-
crystal performance cannot be accurately tested in dissolution, solubility, and in vivo studies.
References
1. Childs SL, Hardcastle KI. 2007. Cocrystals of Piroxicam with Carboxylic Acids. Cryst
Growth Des 7(7):1291-1304.
2. Vrečer F, Vrbinc M, Meden A. 2003. Characterization of piroxicam crystal modifications.
International J Pharm 256:3-15.
3. Childs SL, Rodríguez-Hornedo N, Reddy LS, Jayasankar A, Maheshwari C, McCausland L,
Shipplett R, Stahly BC. 2008. Screening strategies based on solubility and solution
composition generate pharmaceutically acceptable cocrystals of carbamazepine. Cryst Eng
Comm 7(10):856-864.

21
CHAPTER 3. Piroxicam Co-crystals by Reaction Crystallization
Purpose of the Research Performed
The purpose of the research performed in this chapter was to investigate co-crystal
formation by reaction crystallization and to determine if this method was applicable for making
small and large scale batches of co-crystals.
Introduction
Preliminary attempts to create large scale batches of co-crystals by slow evaporation
proved unsuccessful. The reactions were difficult to control and produced a mixture of products
containing little, if any, co-crystal. Therefore, this method was abandoned in favor of a less time
consuming and more controlled technique to create co-crystals.
The mechanisms of the reaction co-crystallization method have been extensively studied
by Rodríguez-Hornedo and Nehm et. al. using carbamazepine/nicotinamide co-crystals as a
model.1, 2
These experiments are performed by adding reactant B to a saturated or close to
saturated solution of reactant A, thus supersaturating the solution with respect to co-crystal AB.3
The idea being that once the solution is supersaturated with co-crystal, pure co-crystal will
precipitate out of solution. The solubilities of the reactants are used to determine the
concentration regions required to potentially form a co-crystal, rather than the stoichiometry of
the co-crystal.4 It should be noted that these techniques were explored as early as the 1950’s by
Higuchi and coworkers.5-7
However, his work was more focused on improving the aqueous

22
solubility of poorly soluble compounds via solution complexation and less on the insoluble
complexes that formed.
The advantages of the reaction crystallization method are that it can be used in a high
throughput mode to screen for co-crystals, it is transferable to larger scale co-crystallization
processes, it affords co-crystal formation at ambient temperature, and can produce pure co-
crystals.1 Childs et. al. used reaction crystallization as a screening strategy to identify 11
carbamezipine co-crystal forms with nine carboxylic acid coformers.8 In a study by Li et. al.,
reaction crystallization was used to scale up glutaric acid co-crystals that were originally
identified in a small scale screen using co-grinding methods.9 Co-crystals formed via reaction
crystallization are often visibly observed quickly. Reddy et. al. observed co-crystallization of
gabapentin with several carboxylic acids within minutes.10
Carbamezipine co-crystals with
malonic acid, glutaric acid, saccharin, oxalic acid, succinic acid, and salicylic acid have also
been reported using this technique.11
Piroxicam carboxylic acid coformers explored by Childs et. al.12
including benzoic acid,
salicylic acid, 4-hydroxy benzoic acid, malonic acid, mandelic acid, succinic acid, gentisic acid,
fumaric acid, and maleic acid were used in this research to study the reaction crystallization
method. Saccharin was also chosen as a coformer to try with this method because a piroxicam
co-crystal with saccharin has also been reported in the literature.13
Piroxicam and coformer
solubilities in several solvents were measured to determine co-crystal experimental parameters.
Co-crystals were characterized by XRPD, DSC, TGA, and HPLC.

23
Experimental
Solubility of Piroxicam and Coformers in Organic Solvents
Equilibrium solubility of piroxicam and acid coformers in various organic solvents
(Table 3.2) was determined at room temperature by shaking samples with excess solid overnight
on an orbital shaker (Lab-Line Instruments, Melrose Park, IL). Samples were then filtered using
a 0.45 µm polyvinylidene fluoride membrane (Whatman, Piscataway, NJ). If necessary, samples
were diluted in methanol prior to analysis. Saturated solution concentrations were determined by
high performance liquid chromatography (HPLC). The HPLC-UV instrument used was an
Agilent 1200 series (Palo Alto, CA) equipped with a UV diode array detector (Agilent
Technologies, Palo Alto, CA) and contained an Agilent Zorbax Bonus RP 4.6 x 150mm 3.5
micron column. Concentrations were determined using a gradient method from 5% solvent B
(acetonitrile containing 0.1% trifluoroacetic acid) to 95% solvent B in 25 minutes, isocratic at
100% solvent B for 1.5 minutes, then equilibrate for 5 minutes at 5% solvent B. Solvent A was
water containing 0.1% trifluoroacetic acid. The flow rate was 1 mL/min. Calibration curve
standards were prepared in methanol at 1, 10, 100, and 250 µg/mL. The wavelengths of
absorbance monitored for piroxicam and 4-hydroxy benzoic acid were 325 and 254 nm
respectively. All other acids were monitored at 210 or 220 nm.
Piroxicam Co-crystal Synthesis
Table 3.1 lists the coformers and solvents tried using the reaction crystallization method.
For co-crystals that were successful, the experimental parameters (also summarized in Table 3.4)
are as follows: Benzoic acid, gentisic acid, salicylic acid, 4-hydroxy benzoic acid, and saccharin

24
co-crystals were made in 2,2,2 trifluoroethanol. Approximately 80 – 500 mg of piroxicam was
added to 1 – 8 mL of presaturated solutions of benzoic acid, salicylic acid, and 4-hydroxy
benzoic acid coformers. The amount of piroxicam added was based on its solubility limit in
2,2,2 trifluoroethanol (Table 3.2). Solutions were shaken on an orbital shaker. Benzoic acid and
salicylic acid co-crystals were observed within minutes. 4-hydroxy benzoic acid co-crystals
were apparent after three days. Gentisic acid and saccharin co-crystals were made by suspending
200 – 450 mg of the acids in 6 – 12 mL of presaturated piroxicam solutions and shaken over
night. Succinic acid co-crystals were made by adding approximately 90 mg of piroxicam to 3
mL of a saturated succinic acid solution in 2:1 tetrahydrofuran (THF) / 2-propanol (IPA). The
solution was shaken overnight. Succinic acid co-crystals were observed after 2 – 3 hours. Co-
crystals were collected by vacuum filtration to remove excess solvent and dried in a hood. Co-
crystals were characterized by XRPD, DSC, and TGA. The piroxicam/acid co-crystal ratio was
determined by HPLC. Approximately the same ratios of piroxicam and coformer concentrations
were used for scale up batches.

25
Table 3.1: Coformers and solvents tried using reaction crystallization.
Carboxylic Acid Structure Solvent Co-Crystal
Apparent?
Benzoic Acid
Trifluoroethanol Yes
Mandelic Acid
Trifluoroethanol No
Malonic Acid
Trifluoroethanol
1:1 THF/IPA
2:1 THF/IPA
No
No
No
Salicylic Acid
Trifluoroethanol Yes
Maleic Acid
Trifluoroethanol No
Fumaric Acid
Trifluoroethanol
1:1 TFE/MeOH
2:1 TFE/MeOH
1:1 THF/IPA
2:1 THF/IPA
No
No
No
No
No
Succinic Acid
Trifluoroethanol
1:1 THF/IPA
2:1 THF/IPA
No
Yes
Yes
4-hydroxy Benzoic
Acid
Trifluoroethanol Yes
Gentisic Acid
Trifluoroethanol Yes
Saccharin
Trifluoroethanol Yes

26
Results and Discussion
Based on a small library of solubility data generated for piroxicam in organic solvents
(Table 3.2), trifluoroethanol was chosen as the preferred solvent to screen for co-crystals because
it had the highest piroxicam solubility (100 mg/mL). High piroxicam solubility was thought to
be desirable because the aim was to produce a high yield of co-crystal using a minimal amount
of solvent (1-10 mL). The solubilities of the co-crystal coformers in the solvents used are listed
in Table 3.3.
Table 3.2: Piroxicam solubility in organic solvents.
Solvent Piroxicam Solubility (mg/mL)
Trifluoroethanol (TFE) 100
Tetrahydrofuran (THF) 51
Methanol (MeOH) 2.3
Acetonitrile (ACN) 8.3
Isopropanol (IPA) 1
1:1 TFE/MeOH 6.1
1:1 TFE/ACN 11.8
2:1 TFE/MeOH 9.1
1:1 THF/IPA 17.5
2:1 THF/IPA 29.3
Table 3.3: Coformer solubilities in solvents used to screen and make co-crystals.
Coformer TFE 1:1
TFE/MeOH
2:1
TFE/MeOH
1:1
THF/IPA
2:1
THF/IPA
Benzoic Acid 35 - - - -
Mandelic Acid 84 - - - -
Salicylic Acid 11 - - - -
Malonic Acid 38 - - 460 490
Maleic Acid 43 - - - -
Fumaric Acid 0.2 4.7 2.3 74 80
Succinic Acid 6.3 - - 121 112
4-hydroxy Benzoic Acid 3.0 - - - -
Gentisic Acid 3.3 - - - -
*ND = Not Determined

27
In the screening experiments, saturated solutions of the least soluble component
(coformer) were made, filtered, and then the more soluble component (piroxicam) was added in
an amount just under its solubility limit. The goal was to not have any excess piroxicam or acid
in the starting solutions that could be confused as a co-crystal in the initial screening
experiments. Furthermore, by not exceeding the solubility limits of the components, the co-
crystal that precipitated out of solution was pure. Solution concentrations were monitored by
HPLC throughout the crystallization process to evaluate whether the solid observed appeared to
be a complex of the reactants (co-crystal). The solid precipitate was also collected and analyzed
by HPLC to determine the stoichiometry of the complex. If the solid appeared to be a co-crystal
(i.e. had a 1:1 or 2:1 stoichiometry) based the HPLC results, it was further characterized by
XRPD, DSC, and TGA.
A summary of the piroxicam and coformer concentrations used to make the co-crystals as
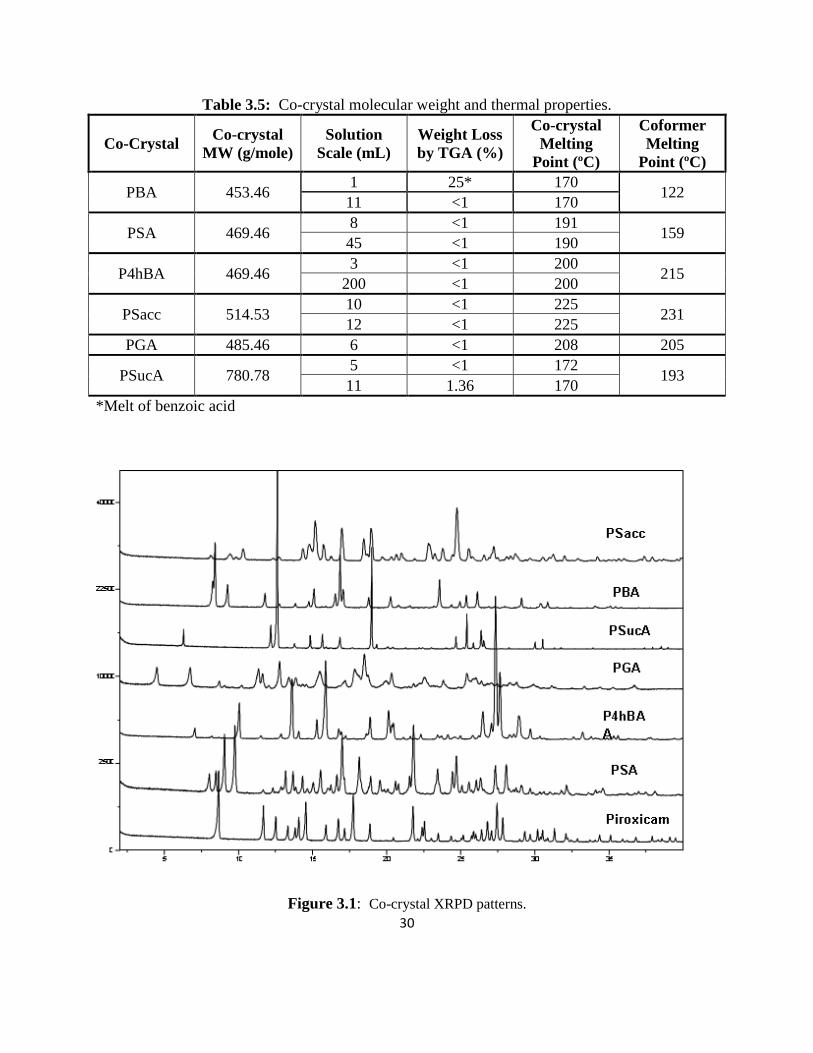
well as the solution scale, yield, and stoichiometry of the co-crystals are listed in Table 3.4. Co-
crystal molecular weight and thermal properties are in Table 3.5. Co-crystal formation was
successful in trifluoroethanol with all of the aromatic acids. Succinic acid was the only aliphatic
acid that formed a co-crystal with piroxicam and it only formed in 1:1 and 2:1 THF/IPA. Both
the 1:1 and 2:1 THF/IPA solutions gave the same co-crystal form. The 2:1 THF/IPA solution
had a higher co-crystal yield because it had greater piroxicam solubility; therefore, this solvent
was used to make the scale-up batches. All co-crystals formed a 1:1 complex with the exception
of succinic acid, which produced a 2:1 piroxicam/succinic acid co-crystal. XRPD patterns
(Figure 3.1) for the co-crystals confirmed unique crystalline forms compared to the starting

28
materials and other known piroxicam forms.14
XRPD and thermal data not presented in this
chapter can be found in the appendix.
Crystals for the 4-hydroxy benzoic acid co-crystal were large enough to generate single
crystal X-ray data (Figure 3.2). It appears as if the co-crystal is comprised of piroxicam in the
zwitterionic form. The phenolic hydroxyl group on 4-hydroxy benzoic acid forms a hydrogen
bond to the enolate oxygen. The carboxylic acid forms a hydrogen bond to the sulfonyl group on
piroxicam as well as accepts a hydrogen bond from a protonated pyridine on a neighboring
piroxicam molecule. These results are identical to single crystal data previously generated by
Childs et. al.12
The benzoic acid and succinic acid co-crystal XRPD patterns also compare with
single crystal data previously reported.12

29
Table 3.4: Co-crystal experimental parameters, yield, and thermal properties.
Coformer
(Co-crystal
Abbreviation)
Solution
Scale
(mL)
Coformera or
Piroxicamb
Solution
Concentration
(mg/mL)
Coformera
or
Piroxicamb
Added
(mg)
Recovery
(mg)
Yield
(%)
Piroxicam/
Coformer
Ratio by
HPLC
Benzoic Acid
(PBA)
1 35a 70
b 60 63
1:1
11 35a 1020
b 1064 76
Salicylic Acid
(PSA)
8 11a 500
b 155 52
1:1
45 11a 3200
b 1350 80
4-hydroxy
Benzoic Acid
(P4hBA)
3 3a 250
b 15 49
1:1
200 3a 15500
b 1480 73
Saccharin
(PSacc)
10 73b 447
a 741 65
1:1
12 85b 450
a 960 76
Gentisic Acid
(PGA) 6 83
b 200
a 353 56 1:1
Succinic Acid
(PSucA)
5 112a 93
b 50 46
2:1
11 112a 343
b 164 41
30
Table 3.5: Co-crystal molecular weight and thermal properties.
Co-Crystal Co-crystal
MW (g/mole)
Solution
Scale (mL)
Weight Loss
by TGA (%)
Co-crystal
Melting
Point (ºC)
Coformer
Melting
Point (ºC)
PBA 453.46 1 25* 170
122 11 <1 170
PSA 469.46 8 <1 191
159 45 <1 190
P4hBA 469.46 3 <1 200
215 200 <1 200
PSacc 514.53 10 <1 225
231 12 <1 225
PGA 485.46 6 <1 208 205
PSucA 780.78 5 <1 172
193 11 1.36 170
*Melt of benzoic acid
Figure 3.1: Co-crystal XRPD patterns.

31
Figure 3.2: 1:1 Piroxicam/4-hydroxy benzoic acid single crystal structure.
Coformers with low solubility required a higher solution volume to produce the desired
amount of co-crystal. This was observed for the P4hBA co-crystal, where the solubility limit of
4-hydroxy benzoic acid in trifluoroethanol was only 3 mg/mL. The scale up batch required 200
mL of saturated 4-hydroxy benzoic acid and 15.5 g of piroxicam to yield only 1.5 g of co-crystal
thus leaving a large amount of unreacted piroxicam. This was also an issue in the original
screening experiments for the PGA co-crystals, where excess piroxicam left in the solution
produced confounding co-crystal stoichiometry when the co-crystals were analyzed by HPLC
(Table 3.4). The formation of the piroxicam gentisic acid co-crystals produced a “paste-like”

32
solution which was difficult to filter off the excess solution. The unreacted piroxicam solution
that was not completely removed from the co-crystals by filtration resulted in excess piroxicam
in the co-crystals. To overcome this issue, the PGA co-crystal scale-up batch (Table 3.3) was
made by suspending the least soluble component (gentisic acid) in a saturated solution of the
more soluble component (piroxicam). This was also done for the PSacc co-crystals.
Table 3.4: Piroxicam/gentisic acid co-crystal preliminary screening parameters.
Co-
crystal
Acid
Concentration
Piroxicam
Added
(mg)
Solution
Scale
(mL)
Recovery
(mg)
Yield
(%)
Piroxicam/Coformer
Ratio by HPLC
PGA #1 3.5 mg/mL 270 3 25 76 3:1
PGA #2 3.5 mg/mL 135 2 11 50 2:1
PGA #3 3.5 mg/mL 6600 75 752 91 1.6:1
Optimizing the experimental parameters to give the best co-crystal yield was not the focus of this
research and a large amount of unreacted piroxicam was discarded when the co-crystal solutions
were filtered. This large amount of API used was not an issue for this research. This would
most likely not be acceptable for a pre-development candidate where material may be limited.
However, it is possible to adjust the experimental conditions of the reaction crystallization
process to optimize co-crystal yield if needed.
For some of the coformers that did not precipitate piroxicam co-crystals, solution
complexation was observed. This phenomenon was comprehensively studied in the 1950’s by
Higuchi et. al. and demonstrated how the solubility of poorly water soluble drugs can increase
via solution complexation with a more soluble ligand (or coformer).5-7
Piroxicam solubility
doubled in saturated 1:1 and 2:1 THF/IPA solutions of malonic acid. In saturated succinic acid
trifluoroethanol solution, piroxicam solubility increased by 20 %. The possibility of solution

33
complexation reveals the importance of generating solubility data for the API and coformers in
the solvents chosen for co-crystal screening. It also demonstrates the value of monitoring the
solution concentration of the reactants during co-crystal screening in order to gain a better
understanding of the reaction crystallization process.
Conclusions
Based on the solubility data for piroxicam and nine carboxylic acids in a variety of
solvents, experiments were carried out at room temperature using the reaction crystallization
method that resulted in piroxicam co-crystals with six of the coformers. This study was not
meant to be an exhaustive co-crystal screen; therefore, it is possible that the three coformers that
did not form piroxicam co-crystals might be successful using this method with other solvents
and/or temperatures not explored in this research.
HPLC analysis of the piroxicam and coformer solution concentrations as well as any
solid that precipitated out of the solution was helpful in determining whether the co-crystal
synthesis was successful. If the HPLC results suggested that the solid was a co-crystal, it was
further characterized by XRPD, DSC, and TGA. Monitoring the solution concentrations of the
reactants was also useful because it helped identify any unexpected results such as solution
complexation.
The reaction crystallization method proved to have many advantages over co-crystal
formation by slow evaporation because it produced pure co-crystals that were easily scalable.
Furthermore, co-crystal formation could be visibly observed and the co-crystals often formed
quickly in as little as a few minutes to a couple hours.
34
References
1. 1. Rodríguez-Hornedo N, Nehm SJ, Seefeldt KF, Pagán-Torres Y, Falkiewicz CJ. 2005.
Reaction crystallization of pharmaceutical molecular complexes. Molecular Pharm 3(3):362-
367.
2. Nehm SJ, Rodríguez-Spong B, Rodríguez-Hornedo N. 2006. Phase solubility diagrams of
cocrystals are explained by solubility product and solution complexation. Cryst Growth Des
6(2):592-600.
3. Qiao N, Li M, Schlindwein W, Malek N, Davies A, Trappitt G. 2011. Pharmaceutical co-
crystals: An overview. Int J Pharm 419(1-2):1-11.
4. Sekhon BS. 2009. Pharmaceutical co-crystals – a review. Ars Pharm 50(3):99-117.
5. Higuchi T, Zuck DA. 1952. Solubilizing action of caffeine on benzoic acid. J Amer Pharm
Assoc 41(1):10-13.
6. Kostenbauder HB, Higuchi T. 1956. Formation of molecular complexes by some water-
soluble amides I 45(8):518-522.
7. Poole JW, Higuchi T. 1959. Complexes formed in aqueous solutions by sarcosine anhydride;
interactions with organic acids, phenols, and aromatic alcohols. J Amer Pharm Assoc
48(10):592-601.
8. Childs SL, Rodríguez-Hornedo N, Reddy LS, Jayasanka A, Maheshwari C, McCausland L,
Shipplett R, Stahly BC. 2008. Screening strategies based on solubility and solution
composition generate pharmaceutically acceptable co-crystals of carbamazepine. Cryst Eng
Comm 10(7):856-864.
9. Zhibin L, Yang BS, Jiang M, Eriksson M, Spinelli E, Yee N, Senanayake C. 2009. A
practical solid form screen approach to identify a pharmaceutical glutaric acid cocrystal for
development. Organic Process Res & Dev 13(9):1307-1314.
10. Reddy SL, Bethune SJ, Kampf JW, Rodríguez-Hornedo N. 2009. Co-crystals and salts of
gabapentin: pH dependent co-crystal stability and solubility. Cryst Growth Des 9(1):378-
385.
11. Good DJ, Rodríguez-Hornedo N. 2009. Solubility advantage of pharmaceutical cocrystals.
Cryst Growth Des 9(5):2252-2264.
12. Childs SL, Hardcastle KI. 2007. Cocrystals of Piroxicam with Carboxylic Acids. Cryst
Growth Des 7(7):1291-1304.
13. Bhatt PM, Ravindra NV, Banerjee R, Desiraju GR. 2005. Saccharin as a salt former.
Enhanced solubilities of saccharinates of active pharmaceutical ingredients. Chem Commun
1073-1075.
14. Vrečer F, Vrbinc M, Meden A. 2003. Characterization of piroxicam crystal modifications.
International J Pharm 256:3-15.

35
CHAPTER 4. Co-crystal Solubility
Purpose of the Research Performed
The purpose of the research performed in this chapter was to measure the aqueous
equilibrium solubility of the piroxicam co-crystals and predict co-crystal pH – solubility
behavior.
Introduction
As a BCS Class II compound, piroxicam oral absorption is solubility limited. Co-crystals
have been shown to improve drug solubility;1, 2
therefore, measuring co-crystal solubility is
desirable in order to determine whether the co-crystal form is more soluble than the free form
and thus have greater bioavailability. Most co-crystal solubility measurements reported in the
literature are kinetic solubility measurements of dissolution and not the true equilibrium
solubility of the co-crystal form.3, 4
Often times during these experiments, the co-crystal will
dissociate, in which case what is being measured is really the solubility of the free form of the
API. In fact, most relevant pharmaceutical co-crystals are more soluble than pure API and
therefore are more prone to transformation when exposed to pure solvent.1 For co-crystals
composed of ionizable compounds, solubility increases seen during kinetic measurements could
be due to a pH-solubility effect caused by the acid/base properties of the coformer and/or API
and not the overall solubility of the co-crystal.
Good and Rodríguez-Hornedo have developed methods to determine co-crystal
equilibrium solubility that are experimentally accessible and reproducible.1 The dissociation of a

36
co-crystal in solution can be described by the solubility product (Ksp), which is defined as a
product of drug and coformer solution concentrations.5, 6
For co-crystals that are stable or
metastable when exposed to a pure solvent, the equilibrium co-crystal solubility (SCC) can be
determined from a single measurement of solution in equilibrium with solid drug and co-crystal.1
Furthermore, based on the Ksp measured in aqueous solution, the pH-solubility behavior of the
co-crystal can be predicted.7
In this chapter, phase diagram experiments as described by Higuchi et. al.8 were
conducted in trifluoroethanol to confirm the stoichiometry of the PBA co-crystal. This work led
to a better understanding of the theories behind co-crystal formation by reaction crystallization6
and equilibrium co-crystal solubility measurements1. These methods were applied to measure
the equilibrium aqueous solubility of the piroxicam co-crystals. The pH-dependent solubility of
the co-crystals was also investigated.
Experimental
PBA Phase Diagram Experiments
Individual saturated solutions of benzoic acid in trifluoroethanol were made with the total
volume and benzoic acid content the same (0.49 M) for each solution. Increments of piroxicam
ranging from 0 - 150 mg/mL were added to each solution. The solutions were shaken for 24
hours at room temperature. After 24 hours, the solutions were filtered using a 0.45 µm
polyvinylidene fluoride membrane and the benzoic acid and piroxicam solution concentrations
were analyzed by HPLC.

37
Equilibrium Co-crystal Solubility
Piroxicam co-crystal equilibrium solubilities in water were determined at room
temperature by suspending excess co-crystal in HPLC grade water. The solutions were shaken
on an orbital shaker for approximately 24 hours. Solutions were filtered using a 0.45 µm
polyvinylidene fluoride membrane and analyzed by HPLC. If necessary, samples were diluted in
methanol prior to analysis. The pH of the filtered solution was also measured. Piroxicam
solubility was also measured as a control. The remaining solid phase was collected by vacuum
filtration, dried at room temperature, and analyzed by XRPD to verify that the solid phase was
the co-crystal. Equations 1 and 2 were used to calculate the measured solubilities of the 1:1
piroxicam/acid co-crystals. The fraction of nonionized piroxicam (FP) and acid (FA) were
calculated using the Henderson-Hasselbalch equation. Equations 3 and 4 were used to predict
co-crystal solubility at various pH values. It is important to note that these equations assume
ideal behavior with concentrations replacing activities in the equilibrium constants.
)100/*]([)100/*]([ FAAcidFPPiroxicamK eqeqsp (1)
spCC KS (2)
][
][1
][][1
,2
,1
2
,2,1,1
H
K
K
H
H
KK
H
KKspS
piroxa
piroxa
acidaacidaacida (3)
][
][1
][1
,2
,1
,1
H
K
K
H
H
KKspS
piroxa
piroxa
acida (4)

38
Piroxicam and Coformer Aqueous Solution Concentrations by HPLC
Solution concentrations were determined using the HPLC experimental procedure
described in Chapter 3.
Results and Discussion
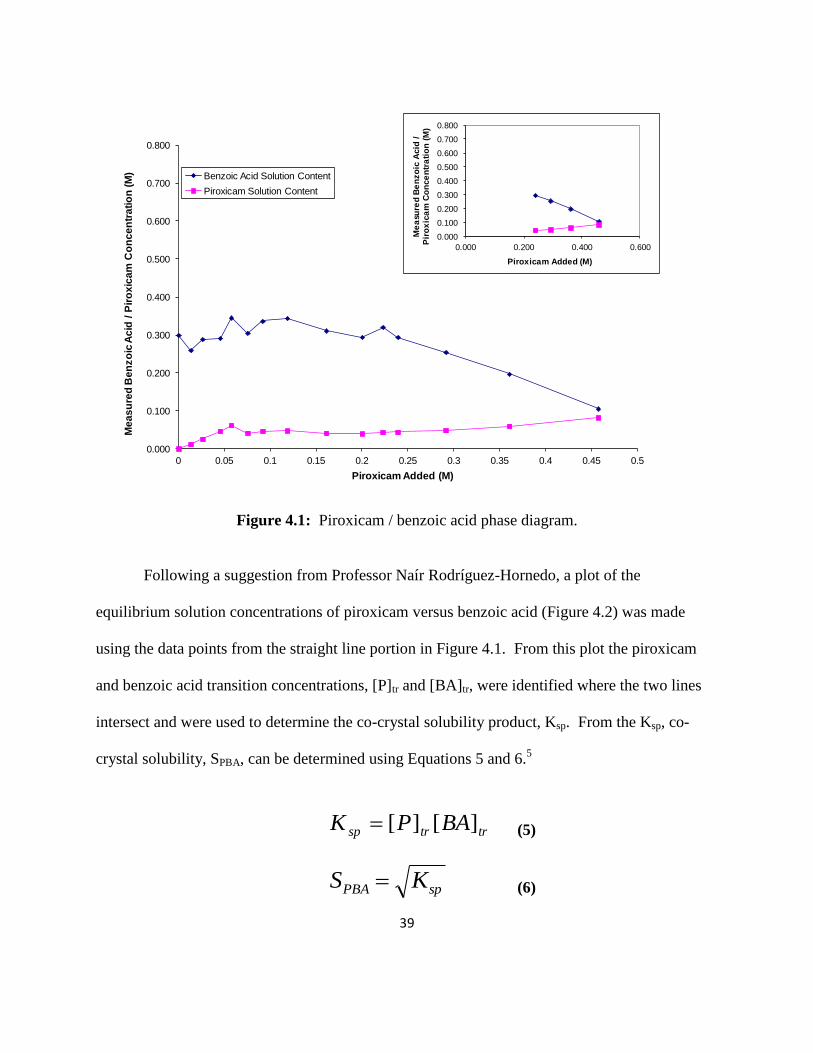
The results from the PBA phase diagram experiments can be seen in Figures 4.1 – 4.3.
Figure 4.1 is a plot of the measured benzoic acid solution concentration at equilibrium versus the
amount of piroxicam added. Each data point represents an individual solution. From the straight
line portion of this plot (inset plot in Figure 4.1), the co-crystal stoichiometry was determined by
calculating how much piroxicam and benzoic acid precipitated out of solution (initial
acid/piroxicam concentration minus the solution concentration at equilibrium). A 1:1 co-crystal
will have the same molar amount for each component. These results confirmed that the
piroxicam / benzoic acid co-crystal stoichiometry was 1:1.
39
0.000
0.100
0.200
0.300
0.400
0.500
0.600
0.700
0.800
0 0.05 0.1 0.15 0.2 0.25 0.3 0.35 0.4 0.45 0.5
Me
as
ure
d B
en
zo
ic A
cid
/ P
iro
xic
am
Co
nc
en
tra
tio
n (
M)
Piroxicam Added (M)
Benzoic Acid Solution Content
Piroxicam Solution Content
0.000
0.100
0.200
0.300
0.400
0.500
0.600
0.700
0.800
0.000 0.200 0.400 0.600
Me
asu
red
Be
nzo
ic A
cid
/
Pir
ox
ica
m C
on
ce
ntr
ati
on
(M
)
Piroxicam Added (M)
Figure 4.1: Piroxicam / benzoic acid phase diagram.
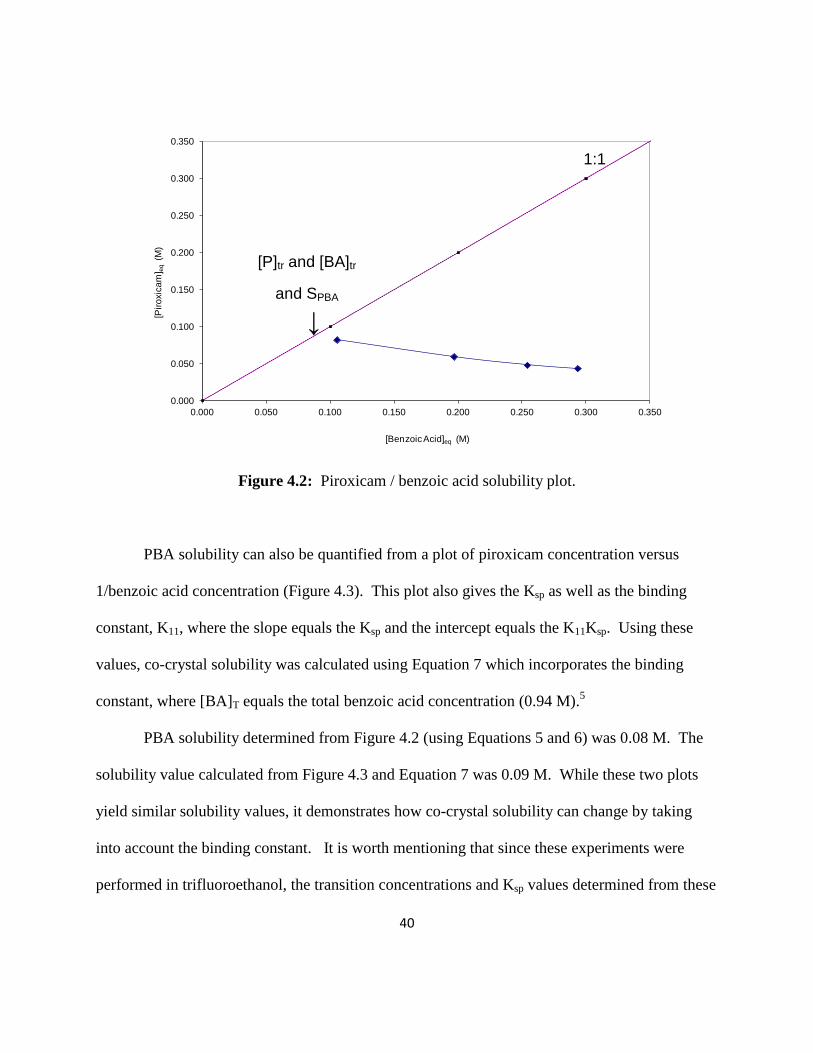
Following a suggestion from Professor Naír Rodríguez-Hornedo, a plot of the
equilibrium solution concentrations of piroxicam versus benzoic acid (Figure 4.2) was made
using the data points from the straight line portion in Figure 4.1. From this plot the piroxicam
and benzoic acid transition concentrations, [P]tr and [BA]tr, were identified where the two lines
intersect and were used to determine the co-crystal solubility product, Ksp. From the Ksp, co-
crystal solubility, SPBA, can be determined using Equations 5 and 6.5
trtrsp BAPK ][][ (5)
spPBA KS (6)
40
0.000
0.050
0.100
0.150
0.200
0.250
0.300
0.350
0.000 0.050 0.100 0.150 0.200 0.250 0.300 0.350
[Pir
oxic
am
] eq
(M
)
[Benzoic Acid]eq (M)
Figure 4.2: Piroxicam / benzoic acid solubility plot.
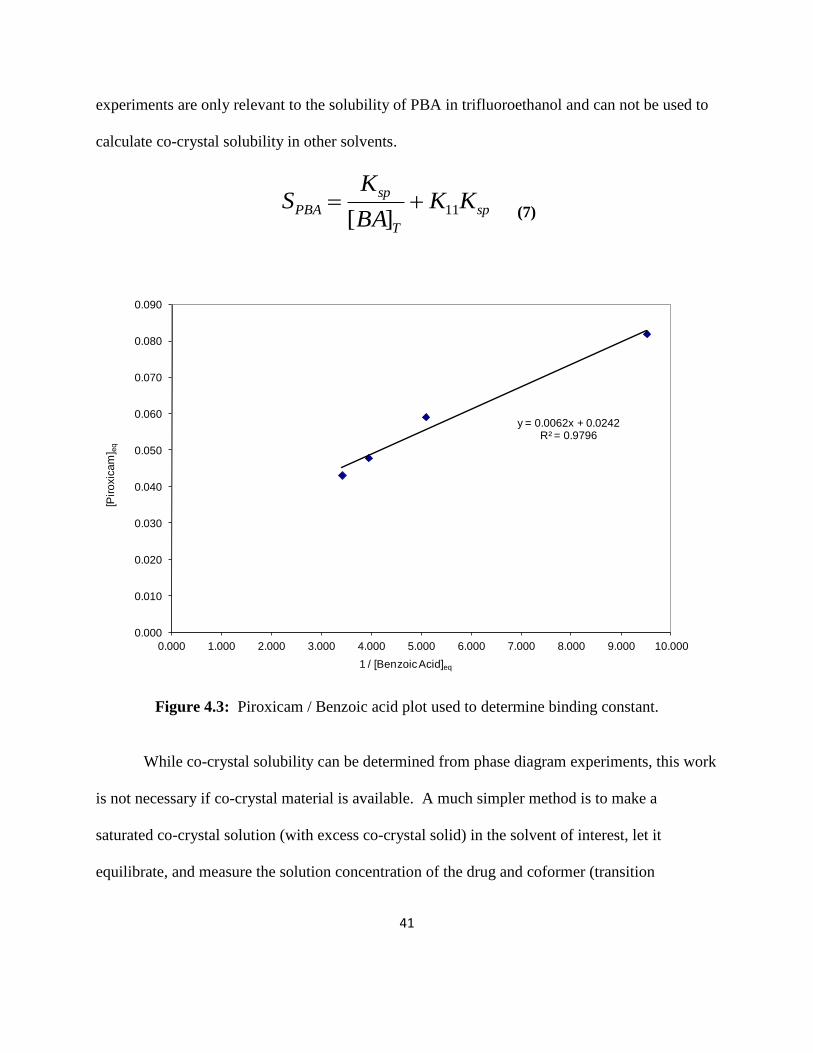
PBA solubility can also be quantified from a plot of piroxicam concentration versus
1/benzoic acid concentration (Figure 4.3). This plot also gives the Ksp as well as the binding
constant, K11, where the slope equals the Ksp and the intercept equals the K11Ksp. Using these
values, co-crystal solubility was calculated using Equation 7 which incorporates the binding
constant, where [BA]T equals the total benzoic acid concentration (0.94 M).5
PBA solubility determined from Figure 4.2 (using Equations 5 and 6) was 0.08 M. The
solubility value calculated from Figure 4.3 and Equation 7 was 0.09 M. While these two plots
yield similar solubility values, it demonstrates how co-crystal solubility can change by taking
into account the binding constant. It is worth mentioning that since these experiments were
performed in trifluoroethanol, the transition concentrations and Ksp values determined from these
[P]tr and [BA]tr
and SPBA
↓
1:1
41
experiments are only relevant to the solubility of PBA in trifluoroethanol and can not be used to
calculate co-crystal solubility in other solvents.
sp
T
sp
PBA KKBA
KS 11
][
(7)
y = 0.0062x + 0.0242R² = 0.9796
0.000
0.010
0.020
0.030
0.040
0.050
0.060
0.070
0.080
0.090
0.000 1.000 2.000 3.000 4.000 5.000 6.000 7.000 8.000 9.000 10.000
[Pir
oxic
am
] eq
1 / [Benzoic Acid]eq
Figure 4.3: Piroxicam / Benzoic acid plot used to determine binding constant.
While co-crystal solubility can be determined from phase diagram experiments, this work
is not necessary if co-crystal material is available. A much simpler method is to make a
saturated co-crystal solution (with excess co-crystal solid) in the solvent of interest, let it
equilibrate, and measure the solution concentration of the drug and coformer (transition

42
concentrations).1 This method was used to determine the aqueous solubility of the piroxicam co-
crystals.
The measured solubilities of the piroxicam co-crystals in water at room temperature after
24 hours are listed in Table 4.1 along with the final solution pH values. Co-crystal solubility was
dependent on the intrinsic solubility of the coformer (Table 4.1) and solution pH. It was
observed that the greater the coformer solubility, the greater the co-crystal solubility. Coformers
with higher aqueous solubility (benzoic acid, 4-hydroxy benzoic acid, and gentisic acid) resulted
in piroxicam co-crystals with greater solubility than those made with coformers with lower
solubility (salicylic acid and saccharin). XRPD patterns of the solid phase after 24 hours
confirmed that the remaining solid form was co-crystal and traces of piroxicam monohydrate
(XPRD patterns can be found in the appendix). The equilibrium aqueous solubility of PSucA
could not be measured because the co-crystal components quickly dissociated when suspended in
solution indicating that the co-crystal form was not thermodynamically stable in water. This
result is not unexpected given the high aqueous solubility of succinic acid relative to piroxicam
(Table 4.1). Co-crystal solubility has been shown to be dependent on the solubility of co-crystal
components with coformer solubility about 10-fold higher than drug leading to a co-crystal that
is more soluble than drug.1 Therefore, one could speculate that PSucA is more soluble than
piroxicam. This information is also useful for designing a co-crystal that is more soluble.
43
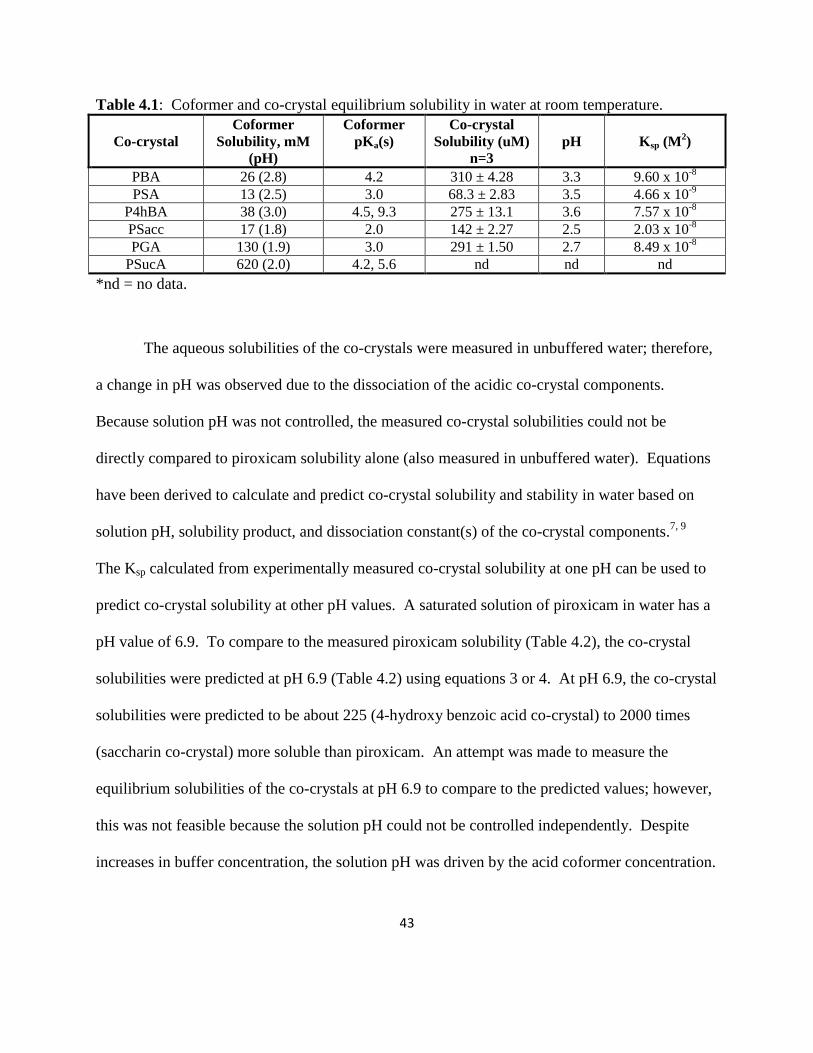
Table 4.1: Coformer and co-crystal equilibrium solubility in water at room temperature.
Co-crystal
Coformer
Solubility, mM
(pH)
Coformer
pKa(s)
Co-crystal
Solubility (uM)
n=3
pH Ksp (M2)
PBA 26 (2.8) 4.2 310 ± 4.28 3.3 9.60 x 10⁻⁸
PSA 13 (2.5) 3.0 68.3 ± 2.83 3.5 4.66 x 10⁻⁹
P4hBA 38 (3.0) 4.5, 9.3 275 ± 13.1 3.6 7.57 x 10⁻⁸
PSacc 17 (1.8) 2.0 142 ± 2.27 2.5 2.03 x 10⁻⁸
PGA 130 (1.9) 3.0 291 ± 1.50 2.7 8.49 x 10⁻⁸
PSucA 620 (2.0) 4.2, 5.6 nd nd nd
*nd = no data.
The aqueous solubilities of the co-crystals were measured in unbuffered water; therefore,
a change in pH was observed due to the dissociation of the acidic co-crystal components.
Because solution pH was not controlled, the measured co-crystal solubilities could not be
directly compared to piroxicam solubility alone (also measured in unbuffered water). Equations
have been derived to calculate and predict co-crystal solubility and stability in water based on
solution pH, solubility product, and dissociation constant(s) of the co-crystal components.7, 9
The Ksp calculated from experimentally measured co-crystal solubility at one pH can be used to
predict co-crystal solubility at other pH values. A saturated solution of piroxicam in water has a
pH value of 6.9. To compare to the measured piroxicam solubility (Table 4.2), the co-crystal
solubilities were predicted at pH 6.9 (Table 4.2) using equations 3 or 4. At pH 6.9, the co-crystal
solubilities were predicted to be about 225 (4-hydroxy benzoic acid co-crystal) to 2000 times
(saccharin co-crystal) more soluble than piroxicam. An attempt was made to measure the
equilibrium solubilities of the co-crystals at pH 6.9 to compare to the predicted values; however,
this was not feasible because the solution pH could not be controlled independently. Despite
increases in buffer concentration, the solution pH was driven by the acid coformer concentration.

44
Furthermore, the co-crystals completely dissociated to piroxicam monohydrate and coformer. In
other words, the co-crystals were not thermodynamically stable at pH 6.9.
Table 4.2 Co-crystal predicted solubility at pH 6.9.
Compound Solubility (mM) Co-crystal/Piroxicam
Solubility Ratio
Piroxicam 0.16 --
PBA 55 344
PSA 50 313
P4hBA 36 225
PSacc 320 2000
PGA 220 1375
The pH-dependency of the solubility of pharmaceutical acids and bases has been well
established.10
As a zwitterionic drug, piroxicam solubility is higher at pH values below its pKa1
(1.8) and above its pKa2 (5.1). In its neutral form, between pH 1.8 and 5.1, piroxicam has its
lowest solubility. Since piroxicam solubility is affected by pH, piroxicam equilibrium solubility
was measured at pH 2, 3, and 4 in order to compare to the equilibrium co-crystal solubilities
(measured at pH 2.5 – 3.3). The results can be seen in Figure 4.4. With the exception of the
PSA co-crystal, all co-crystals had a significant solubility advantage over piroxicam between pH
2-4.

45
PBA
PSA
P4hBA
PSacc
PGA
0
50
100
150
200
250
300
350
400
450
500
550
600
650
700
750
0 1 2 3 4 5 6 7 8
Pir
oxi
cam
Co
nce
ntr
atio
n (u
M)
pH
Piroxicam
Co-crystals
Figure 4.4: Piroxicam pH-dependent solubility and measured co-crystal solubility, n=3.
Conclusions
A method developed by Rodríguez-Hornedo et. al.1, 5, 6
to measure co-crystal equilibrium
solubility was applied to determine piroxicam co-crystal solubility in water at room temperature.
Further research builds on these principles and allows one to measure and predict co-crystal
solubility and stability as a function of pH, 7, 10
These methods were applied to predict piroxicam
co-crystal solubility at pH 6.9, a region in which the piroxicam co-crystals were not stable.
Except for the PSA co-crystal at low pH, all co-crystals had a solubility advantage over
piroxicam at pH 2 - 4 and 6.9.
46
Equilibrium solubility measurement and solubility prediction methods applied in this
research are extremely useful because (1) they enable co-crystal solubility and pH dependent
solubility to be measured and predicted from a single experiment using very little material
(approximately 30 – 50 mg in this study) and (2) they allow co-crystal solubility to be predicted
in pH regions where the co-crystal and/or co-crystal components are not stable.10
References
1. Good DJ, Rodríguez-Hornedo N. 2009. Solubility advantage of pharmaceutical cocrystals.
Cryst Growth Des 9(5):2252-2264.
2. Blagden N, de Matas M, Gavan PT, York P. 2007. Crystal engineering of active
pharmaceutical ingredients to improve solubility and dissolution rates. Adv Drug Deliv Rev
59(7):617-630. 3. Basavoju S, Boström D, Velaga P. 2006. Pharmaceutical cocrystals and salts of norfloxacin.
Cryst Growth Des 6(12):2699-2708.
4. Stanton MK, Bak A. 2008. Physiochemical properties of pharmaceutical co-crystals: A case
study of ten AMG 517 co-crystals. Cryst Growth Des 8(10):3856-3862.
5. Nehm SJ, Rodríguez-Spong B, Rodríguez-Hornedo N. 2006. Phase solubility diagrams of
cocrystals are explained by solubility product and solution complexation. Cryst Growth Des
6(2):592-600.
6. Rodríguez-Hornedo N, Nehm SJ, Seefeldt KF, Pagán-Torres Y, Falkiewicz CJ. 2005.
Reaction crystallization of pharmaceutical molecular complexes. Molecular Pharmaceutics
3(3):362-367.
7. Bethune SJ, Huang N, Jayasanka A, Rodríguez-Hornedo N. 2009. Understanding and
predicting the effect of cocrystal components and pH on cocrystal solubility. Cryst Growth
Des 9(9):3976-3988.
8. Haddad AF, Sciarron BJ, Higuchi T. 1959. Formation of complexes by N,N’-dimethyl-
diketobenzodiazines in nonaqueous solutions. J Amer Pharm Assoc 48(10):588-591.
9. Reddy SL, Bethune SJ, Kampf JW, Rodríguez-Hornedo N. 2009. Co-crystals and salts of
gabapentin: pH dependent co-crystal stability and solubility. Cryst Growth Des 9(1):378-
385.
10. Stahl PH, Wermuth CG. 2002. Handbook of Pharmaceutical Salts: Properties, Selection, and
Use. Wiley-VCH, Weinheim.

47
CHAPTER 5. Co-crystal Intrinsic Dissolution and Rat Pharmacokinetics
Purpose of the Research Performed
The purpose of the research performed in this chapter was to measure the dissolution
rates of the piroxicam co-crystals at physiological pH, to determine co-crystal in-vivo
bioavailability, and to establish possible correlations between dissolution and pharmacokinetic
data.
Introduction
Dissolution testing is used by formulation scientists to assist in choosing among drug
candidate solid state forms and formulations as well as to establish possible in vivo / in vitro
correlations between release of the drug from the dosage form and drug absorption.1, 2
Evaluation of dissolution profiles is especially important for Class II drugs since dissolution for
these substances is assumed to be rate limiting step to in vivo absorption.3, 4
Intrinsic dissolution studies are often carried out using a Woods Apparatus comprised of
rotating disks of compacted powder of the API immersed in dissolution test media.5 This
method affords advantages over powder dissolution methods because the exposed area of the
disk is constant and thus dissolution variability from particle size is eliminated during the
dissolution period.
The solubility advantage of co-crystals has been shown to correlate with increased
dissolution and bioavailability.6-8
Piroxicam co-crystal solubility was significantly greater than
piroxicam. Therefore, in order to assess whether this solubility advantage correlates with

48
increased dissolution and oral exposure, intrinsic dissolution profiles for the co-crystals were
generated in biorelevant media at pH 1.2 and 6.8. The effect of buffer concentration on co-
crystal dissolution rate was also evaluated. Finally, co-crystals were dosed orally in rat to
determine co-crystal bioavailability and draw correlations, if any, between the in vivo results and
in vitro dissolution data.
Experimental
Instrinsic Dissolution
A miniature Wood’s Apparatus (Distek 2100C, North Brunswik, NJ) was used to
measure the dissolution rate of the co-crystals in US Pharmacopeia buffers at pH 1.2 (0.07 M
HCl/ 0.03 M NaCl) and 6.8 (0.05 M monobasic potassium phosphate/0.03 M NaOH).9
Dissolution rates were also measured in 0.1 M monobasic potassium phosphate at pH 6.8.
Approximately 10 - 15 mg of co-crystal was compressed in a punch die at 400 psi for one
minute. All dissolution studies were preformed in 100 mL of solution at 37°C. Paddle rotation
speed was 100 rpm. Time points were collected for up to 2 hours and piroxicam concentrations
were analyzed by HPLC (see Chapter 3 experimental for HPLC method). Piroxicam dissolution
rates were calculated by plotting the cumulative amount of piroxicam dissolved per unit area
(Equation 8) versus time. The piroxicam reference standard dissolution profile was also
determined as a control. Bulk solution pH was measured at the end of the experiments and the
left over pellet was analyzed by XRPD to verify that the solid state of each co-crystal was the
same as the starting material.

49
aceAreaPelletSurfmeSampleVoluAreaStdAve
SampleAreaConcStdDissolvedAmt
..
... (8)
*Std. Conc. = 0.1 mg/mL
*Sample Area = HPLC Peak Area Response
*Ave. Std. Area = Std. Conc. HPLC Peak Area Response
*Sample Volume = 100 mL
*Pellet Surface Area = 0.031 cm2
Rat Pharmacokinetics
Adult male Sprague Dawley (Charles River, Kingston, New York) rats were used in all
experiments. The rats were fasted overnight prior to oral dose administration. Intravenous
administration was via the lateral tail vein and oral doses were administered by gavage.
Piroxicam and piroxicam co-crystals were orally dosed in capsules at 5 mg/kg piroxicam
equivalents. Piroxicam was also dosed intravenously at 1 mg/kg in DMSO/Solutol®/PBS
(3/30/67) in order to calculate bioavailability. For blood collection, each rat (unanesthetized)
was placed in a clear Plexiglas® restraining tube and blood samples (approximately 0.25 mL)
were drawn from a lateral tail vein into heparinized collection tubes. Blood samples were
collected out to six hours. The blood samples were placed on wet ice until centrifuged to
separate plasma. The plasma fraction was transferred into clean dry tubes, frozen on dry ice and
stored at approximately -20oC pending analysis.
Piroxicam plasma concentration was determined by LC/MS/MS (an integrated Cohesive
Technologies LX-2 series liquid chromatography system coupled with an Applied Biosystems
MDS-SCIEX 4000 Qtrap mass spectrometer, Foster City, CA). Plasma proteins were

50
precipitated with acetonitrile containing an internal standard (alprenolol). Calibration standards
were prepared in rat plasma ranging from 10 – 10000 ng/mL. WinNonLin® was used to
calculate pharmacokinetic parameters.
Statistics
A one-way analysis of variance (ANOVA) test was performed to demonstrate statistical
significance. p < 0.05 was considered statistically significant.
Results and Discussion
Intrinsic Dissolution
The dissolution profiles for piroxicam and the co-crystals at pH 6.8 and at pH 1.2 are
shown in Figures 5.1-5.5. Dissolution rates were determined from the slopes of the linear
regression lines and are listed in Table 5.1. The piroxicam reference standard dissolution rates
measured were in agreement with previous reports.2
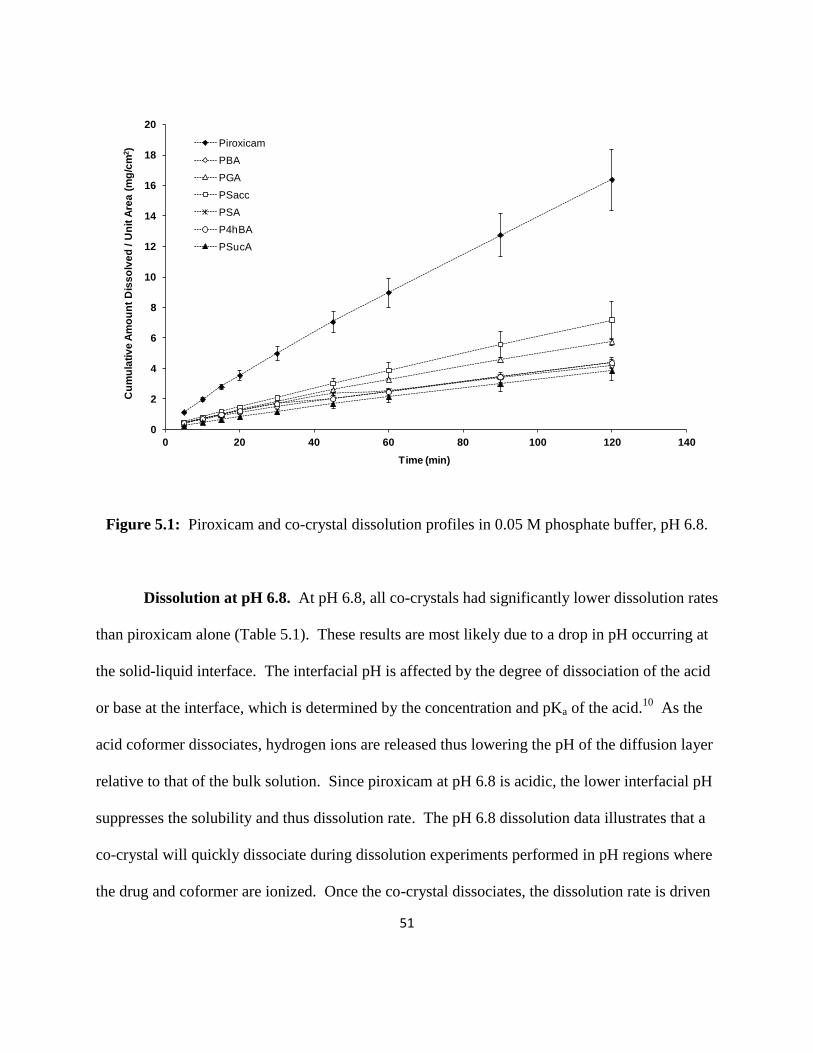
51
0
2
4
6
8
10
12
14
16
18
20
0 20 40 60 80 100 120 140
Cu
mu
lati
ve
Am
ou
nt
Dis
so
lve
d / U
nit
Are
a (
mg
/cm
2)
Time (min)
Piroxicam
PBA
PGA
PSacc
PSA
P4hBA
PSucA
Figure 5.1: Piroxicam and co-crystal dissolution profiles in 0.05 M phosphate buffer, pH 6.8.
Dissolution at pH 6.8. At pH 6.8, all co-crystals had significantly lower dissolution rates
than piroxicam alone (Table 5.1). These results are most likely due to a drop in pH occurring at
the solid-liquid interface. The interfacial pH is affected by the degree of dissociation of the acid
or base at the interface, which is determined by the concentration and pKa of the acid.10
As the
acid coformer dissociates, hydrogen ions are released thus lowering the pH of the diffusion layer
relative to that of the bulk solution. Since piroxicam at pH 6.8 is acidic, the lower interfacial pH
suppresses the solubility and thus dissolution rate. The pH 6.8 dissolution data illustrates that a
co-crystal will quickly dissociate during dissolution experiments performed in pH regions where
the drug and coformer are ionized. Once the co-crystal dissociates, the dissolution rate is driven

52
by the intrinsic solubility of the drug as function of pH.10
These results reveal the importance of
understanding the acid/base properties of both drug and coformer and how they can impact the
overall dissolution rate of the drug. Furthermore, it emphasizes the need to stabilize the co-
crystal to prevent dissociation and achieve the solubility and dissolution advantages of the co-
crystal form11
.
Table 5.1: Piroxicam dissolution rates at pH 1.2 and 6.8 at 37°C (µg/min/cm2).
Compound pH 1.2a
pH 6.8 (0.05M)b
Piroxicam 54 ± 7.0 130 ± 17
PBA 62 ± 7.5 32 ± 1.5
PSA 48 ± 18 34 ± 2.1
P4hBA 66 ± 5.1 33 ± 3.2
PSacc 42 ± 12 59 ± 11
PGA 40 ± 3.6 46 ± 2.1
PSucA 25 ± 7.9 31 ± 5.0 a 30 minute dissolution rate.
b 2 hour dissolution rate.
Previous research has shown that dissolution behavior can be affected by buffer
concentration.12
Therefore, in an attempt to dampen pH changes within the diffusion layer,
potassium phosphate buffer concentration was doubled to 0.1 M. The dissolution profiles are
shown in Figure 5.2. While the dissolution rates of the co-crystals were still significantly lower
than piroxicam alone, the increased buffer concentration appeared to give a small boost to the
dissolution rates (Figure 5.3), which was significant for the PBA and PSA co-crystals. The
pKa(s) and intrinsic solubility of the acid as well as the pKa of the buffer are important to take
into account when interpreting the dissolution data; therefore, the equilibrium solubilities of
piroxicam and the acids were measured in the dissolution media and are listed along with their
pKa(s) in Table 5.2. Solubility in 0.1 M potassium phosphate buffer was not determined due to

53
limited material for some of the acids but one would expect the solubility to be comparable to
0.05 M. The PSucA co-crystal dissolution rate in these buffer conditions was not determined
because based on the results for the other co-crystals, it was concluded that the dissolution
behavior of PSucA would be similar.
0
5
10
15
20
25
0 20 40 60 80 100 120 140
Cu
mu
lati
ve A
mo
unt
Dis
solv
ed /
Un
it A
rea
(mg/
cm2 )
Time (min)
Piroxicam
PSA
PBA
Psacc
PGA
P4hBA
Figure 5.2: Piroxicam and co-crystal dissolution profiles in 0.1 M phosphate buffer, pH 6.8.

54
0
0.02
0.04
0.06
0.08
0.1
0.12
0.14
0.16
0.18
Piroxicam PBA PGA PSac PSA P4hBA
IDR
(m
g/m
in/c
m2)
Compound
0.1M SIF
0.05M SIF
Figure 5.3: Dissolution rate comparison in 0.05 M and 0.1 M buffer, pH 6.8.
Table 5.2: Piroxicam and coformer solubility in biorelevant media (mM).
Compound pH 1.2 pH 6.8 (0.05M) pKa(s)
Piroxicam 0.36 1.20 1.8, 5.1
Gentisic Acid* 118.43 129.76 3.0
4-hydroxy Benzoic Acid 54.75 85.64 4.5, 9.3
Salicylic Acid 13.88 48.25 3.0
Saccharin 9.93 59.33 2.0
Benzoic Acid 42.78 67.23 4.2
*Solution not completely saturated due to limited material.
No significant changes in piroxicam dissolution rate were observed for the PGA and
P4hBA co-crystals with an increase in buffer concentration. This can be explained by
dissolution rate dependency on the intrinsic solubility of the acids and pH. Acids with higher
solubilities, i.e. gentisic acid and 4-hydroxy benzoic acid, are less sensitive to buffer
concentration and pH because they are so soluble that they “self-buffer” the pH in the diffusion
55
layer.12
In other words, high concentrations of hydrogen ions are released in solution from these
acids which consume all the unprotonated form of the buffer. Benzoic acid and salicylic acid
have lower solubilities and therefore are less able to self-buffer the diffusion layer pH. The co-
crystals with these acid coformers (PBA and PSA) have piroxicam dissolution rates that are
affected more by an increase in buffer concentration.
Dissolution at pH 1.2. Dissolution experiments were also conducted at pH 1.2. The
results are shown in Figure 5.3. After 45 minutes, there was a great deal of variability between
the three pellets for each co-crystal so it was difficult to draw conclusions for the complete two
hour dissolution period; however, differences were observed within the first 30 minutes (Figure
5.4). In the first 30 minutes for the PBA and P4hBA co-crystals, the cumulative amount of
piroxicam dissolved per unit area for each individual time point was significantly greater than
piroxicam (Figure 5.5). The piroxicam dissolution rate for these co-crystals (Table 5.1) also
appeared to be slightly improved; however, it was not statistically different at the 95%
confidence interval (PBA, p = 0.2 and P4hBA, p = 0.07).

56
0
1
2
3
4
5
6
7
0 20 40 60 80 100 120 140
Cu
mu
lati
ve
Am
ou
nt D
iss
olv
ed
/ U
nit
Are
a (m
g/c
m2)
Time (min)
Piroxicam Reference Standard
PSA
PBA
Psacc
PGA
P4hBA
PSucA
Figure 5.3: Piroxicam and co-crystal 2 hour dissolution profiles at pH 1.2.
0
0.5
1
1.5
2
2.5
0 5 10 15 20 25 30 35
Cu
mu
lati
ve
Am
ou
nt D
iss
olv
ed
/ U
nit
Are
a (m
g/c
m2)
Time (min)
Piroxicam Reference Standard
PSA
PBA
Psacc
PGA
P4hBA
PSucA
Figure 5.4: Piroxicam and co-crystal 30 minute dissolution profiles at pH 1.2.

57
0
0.5
1
1.5
2
2.5
0 5 10 15 20 25 30 35
Cu
mu
lati
ve
Am
ou
nt D
iss
olv
ed
/ U
nit
Are
a (m
g/c
m2)
Time (min)
Piroxicam Reference Standard
PBA
P4hBA
Figure 5.5: Piroxicam, PBA, and P4hBA 30 minute dissolution profiles at pH 1.2
The dissolution results at pH 1.2 can be explained by examining the solubility and pKa of
the acid coformers. Benzoic acid and 4-hydroxy benzoic acid have pKa values over four and in a
solution at pH 1.2, all the acid species should be in the unionized form. Saccharin, gentisic acid,
and salicylic acid, however, have lower pKa values around 2 - 3 which are much closer to pH
1.2. It is possible that there was a small percentage of these acids in the ionized form. As
previously stated, dissociation of the acid liberates hydrogen ions and therefore lowers the pH of
the diffusion layer relative to the bulk solution pH. The intrinsic solubilities of the acids also
contribute to dissolution rate. Benzoic acid and 4-hydroxy benzoic acid were about five times
more soluble than salicylic acid and saccharin in the dissolution media. Gentisic acid and
succinic acid were the most soluble of all the acid coformers; however, the gentisic acid and
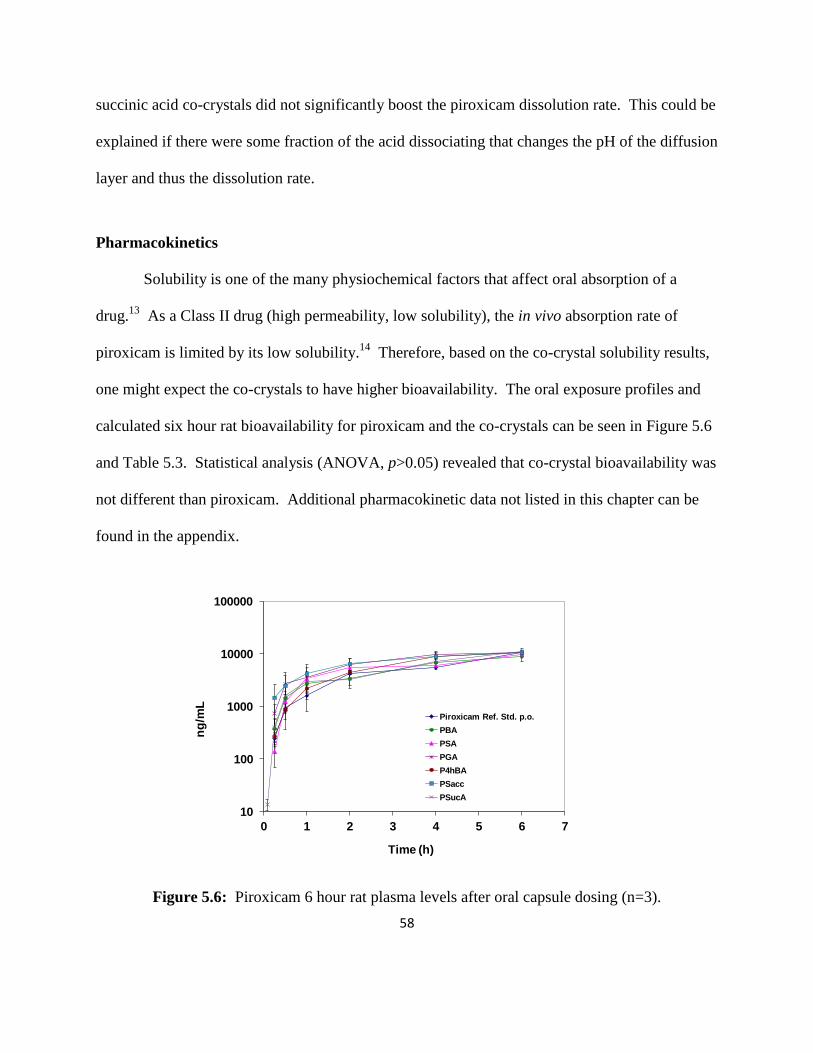
58
succinic acid co-crystals did not significantly boost the piroxicam dissolution rate. This could be
explained if there were some fraction of the acid dissociating that changes the pH of the diffusion
layer and thus the dissolution rate.
Pharmacokinetics
Solubility is one of the many physiochemical factors that affect oral absorption of a
drug.13
As a Class II drug (high permeability, low solubility), the in vivo absorption rate of
piroxicam is limited by its low solubility.14
Therefore, based on the co-crystal solubility results,
one might expect the co-crystals to have higher bioavailability. The oral exposure profiles and
calculated six hour rat bioavailability for piroxicam and the co-crystals can be seen in Figure 5.6
and Table 5.3. Statistical analysis (ANOVA, p>0.05) revealed that co-crystal bioavailability was
not different than piroxicam. Additional pharmacokinetic data not listed in this chapter can be
found in the appendix.
10
100
1000
10000
100000
0 1 2 3 4 5 6 7
ng
/mL
Time (h)
Piroxicam Ref. Std. p.o.
PBA
PSA
PGA
P4hBA
PSacc
PSucA
Figure 5.6: Piroxicam 6 hour rat plasma levels after oral capsule dosing (n=3).

59
Table 5.3: Piroxicam and co-crystal 6 hour bioavailability (n=3).
Compound Bioavailability (%) ± sem
Piroxicam Reference Standard 30 ± 2
PBA 31 ± 5
PSA 34 ± 1
PGA 44 ± 7
P4hBA 38 ± 3
PSacc 44 ± 9
PSucA 40 ± 6
The gentisic acid and saccharin co-crystals appeared to possibly give a slight boost to
piroxicam plasma levels within the first hour. Therefore, a one hour PK study with additional
time points was conducted for piroxicam and the gentisic acid and saccharin co-crystals to
confirm these results. These results are shown in Figure 5.7. No significant differences were
observed compared to piroxicam for the saccharin co-crystal. Piroxicam exposure from the
gentisic acid co-crystal appeared to be greater within the first 30 minutes but was not
significantly different (p=0.3).
1
10
100
1000
10000
100000
0 0.25 0.5 0.75 1 1.25
ng
/mL
Time (h)
Piroxicam Ref. Std.
PGA
PSacc
Figure 5.7: Piroxicam 1 hour rat plasma levels after oral capsule dosing (n=6).

60
Overall the pharmacokinetic data was variable and no significant differences were
observed between the co-crystals and piroxicam. It is likely that the co-crystals quickly
dissociated as the capsules dissolved in the stomach. Improved oral exposure has been reported
for co-crystals that have been formulated to stabilize the co-crystal form.15
It is possible that
stabilizing the piroxicam co-crystals with a formulation could result in increased oral exposure.
Conclusions
Piroxicam dissolution rates appeared to be most dependent on interfacial pH, which was
driven by the intrinsic solubility and dissociation constant(s) of the coformer. This effect was
most apparent at pH 6.8 with piroxicam co-crystal dissolution rates significantly lower than
piroxicam alone. At pH 1.2, piroxicam co-crystal dissolution rates were similar to free
piroxicam. In this pH region ionization of the co-crystal components was negligible so as the co-
crystal dissociates, one would expect the piroxicam dissolution rate from the co-crystals to be
similar to free piroxicam.
Overall, the in vivo data correlated well with the in vitro intrinsic dissolution results at pH
1.2. This is not unexpected given that the capsules were dosed directly into the stomach, which
has a presumed pH of 1 - 2. Physiological factors including the site of absorption,
gastrointestinal blood flow, and gastric emptying also play an important role in oral absorption.
These variables make it difficult to completely understand the absorption processes occurring in
vivo for the co-crystals. Furthermore, it is probable that the co-crystals quickly dissociated in
vivo which would hinder any potential increases in bioavailability from the co-crystal form. In

61
future studies formulation strategies to stabilize a co-crystal should be studied in order to fully
utilize the solubility advantage of co-crystals.
References
1. Dressman JB, Amidon GL, Reppas C, Shah VP. 1998. Dissolution testing as a prognostic
tool for oral drug absorption: Immediate release dosage forms. Pharm Res 15(1):11-22.
2. Yu LX, Carlin AS, Amidon GL, Hussain AS. 2004. Feasibility studies of utilizing disk
intrinsic dissolution rate to classify drugs. International J Pharm 270:221-227.
3. Varma MVS, Khandavilli S, Ashokraj Y, Jain A, Dhanikula A, Sood A, Thomas NS,
Pillai O, Sharma P, Gandhi R, Agrawal S, Nair V, Panchagnula R. 2004.
Biopharmaceutic classification system: A scientific framework for pharmacokinetic
optimization in drug research. Current Drug Metabolism 5(5):375-388.
4. Galia E, Nicolaides E, Hörter D, Löbenberg R, Reppas C, Dressman JB. 1998.
Evaluation of various dissolution media for predicting in vivo performance of class I and
II drugs. Pharm Res 15(5):698-705.
5. Wood JH, Syarto JE, Letterman H. 1965. Improved holder for disk intrinsic dissolution
rate studies. J Pharm Sci 54(7):1068.
6. Blagden N, de Matas M, Gavan PT, York P. 2007. Crystal engineering of active
pharmaceutical ingredients to improve solubility and dissolution rates. Adv Drug Deliv
Rev 59(7):617-630. 7. Stanton MK, Kelly RC, Colletti A, Kiang YH, Langley M, Munson EJ, Peterson ML,
Roberts J, Wells M. 2010. Improved pharmacokinetics of AMG 517 through co-
crystallization part 1: Comparison of two acids with corresponding amide co-crystals. J
Pharm Sci 99(9):3769-3778.
8. Jung MS, Kim JS, Kim MS, Alhalaweh A, Cho W, Hwang SJ, Velaga SP. 2010.
Bioavailability of indomethacin-saccharin co-crystals. J Pharmacy and Pharmacology
62(11):1560-1568.
9. Avdeef AT, Tsinman O. 2008. Miniaturized rotating disk intrinsic dissolution rate
measurement: Effects of buffer capacity in comparisons to traditional Wood’s apparatus.
Pharm Research 25(11):2613-2627.
10. Mooney KG, Mintun MA, Himmelstein KJ, Stella VJ. 1981. Dissolution kinetics of
carboxylic acids I: Effect of pH under unbuffered conditions. J Pharm Sci 70(1):13-22.
11. Shiraki K, Takata N, Takano R, Hayashi Y, Terada K. 2008. Dissolution improvement
and the mechanism of the improvement from cocrystallization of poorly water-soluble
compounds. Pharm Res 25(11):2581-2592.
12. Mooney KG, Mintun MA, Himmelstein KJ, Stella VJ. 1981. Dissolution kinetics of
carboxylic acids II: Effect of buffers. J Pharm Sci 70(1):22-32.
13. Rogge MC, Taft DR. 2005. Preclinical Drug Development (Drugs and the
Pharmaceutical Sciences). 1st ed.: Taylor and Francis Group, Florida.

62
14. Takamatsu N, Welage LS, Idkaidek NM, Liu D, Lee PI, Hayashi Y, Rhie JK, Lennernäs
H, Barnett JL, Shah VP, Lesko L, Amidon GL. 1997. Human intestinal permeability of
piroxicam, propranolol, phenylalanine, and PEG 400 determined by Jejunal perfusion.
Pharm Res 14(9):1127-1132.
15. Stanton MK, Kelly RC, Colletti A, Kiang YH, Langley M, Munson EJ, Peterson ML,
Roberts J, Wells M. 2010. Improved pharmacokinetics of AMG 517 through co-
crystallization part 1: Comparison of two acids with corresponding amide co-crystals. J
Pharm Sci 99(9):3769-3778.
63
CHAPTER 6. Final Conclusions and Future Considerations
In this thesis, co-crystal methodology and behavior was explored to better understand co-
crystal technology and assess the feasibility of creating co-crystals in an early development
setting to address API solubility issues. Slow evaporation methods to create co-crystals on a
large scale were quickly abandoned because the method proved to be too time consuming and
often produced a mixture of products and not pure co-crystal. However, slow evaporation
methods are still useful for discovering new co-crystal forms on a small scale.
Reaction crystallization proved to the method of choice for this project to produce
scalable batches of pure co-crystals. Using this method, co-crystal formation could be visibly
observed and co-crystals often formed very quickly. The reaction process was also easily
controlled and the results were reproducible for small and large batches of co-crystals. It was
discovered that co-crystal yield could be optimized while conserving API and coformer material
by suspending the least soluble component in a saturated solution of the more soluble
component.
Equilibrium co-crystal solubility measurement techniques developed by Nair Rodríguez-
Hornedo and colleagues were successfully applied to measure co-crystal solubility. Measuring
co-crystal equilibrium solubility is very useful as a means to screen for a co-crystal that is more
soluble than the API. Additionally, this information can be used to estimate co-crystal
solubilities in pH regions where the co-crystal may not be stable. It is also valuable knowledge
that can be used to both formulate the co-crystal and/or assess whether it is necessary to stabilize
the co-crystal through formulation techniques.

64
The intrinsic dissolution results for the piroxicam co-crystals demonstrated the need to
understand the pH solubility and stability of the co-crystal and the co-crystal components and
how this data will affect the overall dissolution rate of the API. Any rapid dissociation of the co-
crystal is likely to reduce the solubility advantage and may cause suppression of the dissolution
of the API due to the acid/base properties of the co-crystal components. Both intrinsic
dissolution and PK results reiterate the fact that the piroxicam co-crystals created herein will
dissociate within targeted in vivo pH regions; therefore, formulation work is likely required to
stabilize these co-crystals in order to achieve an increase in bioavailability.
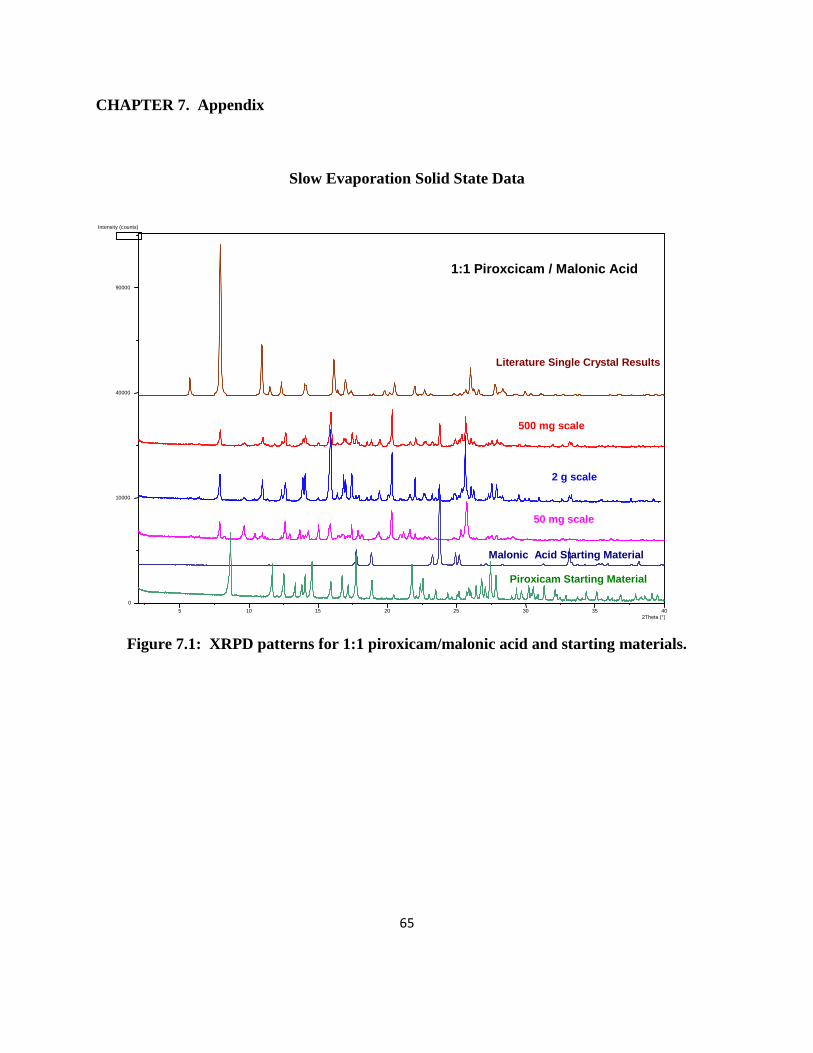
65
CHAPTER 7. Appendix
Slow Evaporation Solid State Data
Figure 7.1: XRPD patterns for 1:1 piroxicam/malonic acid and starting materials.
Intensity (counts)
5 10 15 20 25 30 35 40 2Theta (°)
0
10000
40000
90000
500 mg scale
1:1 Piroxcicam / Malonic Acid
2 g scale
50 mg scale
Literature Single Crystal Results
Malonic Acid Starting Material
Piroxicam Starting Material

66
Figure 7.2: XRPD patterns for 2:1 piroxicam/malonic acid and starting materials.
2Theta (°)
Intensity (counts)
5 10 15 20 25 30 35 0
40000
160000
360000
640000
1000000
2:1 Piroxicam/Malonic Acid
500mg Scale
2g Scale
1g Scale
Malonic Acid Starting Material
Piroxicam Monohydrate Single Crystal Calculation

67
Figure 7.3: 1:1 and 2:1 piroxicam/malonic acid XRPD comparison.
2Theta (°)
Intensity (counts)
5 10 15 20 25 30 35 0
40000
160000
360000
640000
1000000
1:1 and 2:1 Piroxicam/Malonic Acid Comparison
2:1 500mg Scale
2:1 2g Scale
2:1 1g Scale
1:1 500mg Scale
1:1 50mg Scale
1:1 2g Scale

68
Figure 7.4: 2:1 piroxicam/malonic acid DSC thermograms.

69
Figure 7.5: 1:1 piroxicam/malonic acid DSC thermograms (50 and 500 mg scales).
50 mg scale
500 mg scale

70
Figure 7.6: 1:1 piroxicam/malonic acid DSC thermogram (1 gram scale).
1 g scale

71
Figure 7.7: XRPD patterns for 1:1 piroxicam/4-hydroxy benzoic acid and physical
mixture.
5 10 15 20 25 30 35 2Theta (°)
Intensity (counts)
0
400
1600
3600
6400
1:1 Piroxicam/4-hydroxy Benzoic Acid
500mg Scale
50mg Scale
Physical Mixture

72
Figure 7.8: XRPD patterns for 1:1 piroxicam/4-hydroxy benzoic acid and starting
materials.
5 10 15 20 25 30 35 40 2Theta (°)
Intensity (counts)
4-Hydroxy Benzoic Acid
Starting Material
0
2500
10000
22500
40000
62500
500mg scale
50 mg scale
1:1 Piroxicam / 4-Hydroxy Benzoic Acid
Literature Single Crystal
Data - Monoclinic
Literature Single Crystal
Data - Triclinic
Piroxicam Starting Material

73
Figure 7.9: 1:1 piroxicam/4-hydroxy benzoic acid DSC thermograms.
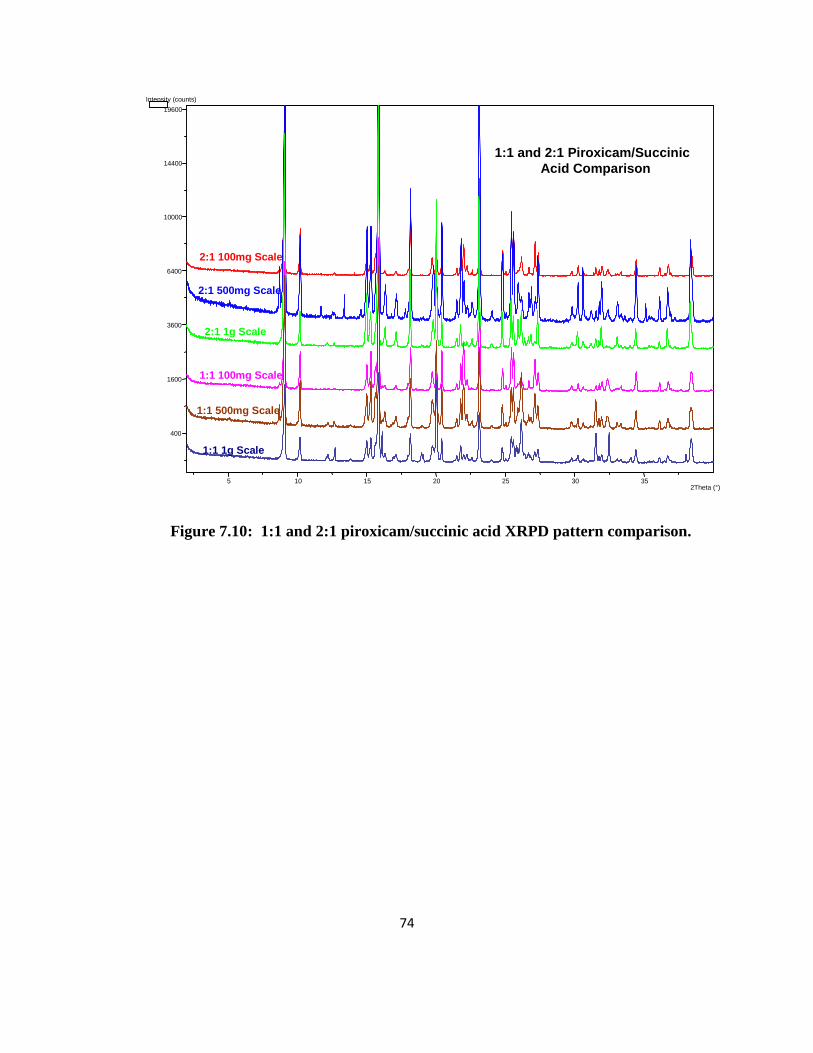
74
Figure 7.10: 1:1 and 2:1 piroxicam/succinic acid XRPD pattern comparison.
2Theta (°)
Intensity (counts)
5 10 15 20 25 30 35
400
1600
3600
6400
10000
14400
19600
1:1 and 2:1 Piroxicam/Succinic
Acid Comparison
2:1 100mg Scale
2:1 500mg Scale
2:1 1g Scale
1:1 100mg Scale
1:1 500mg Scale
1:1 1g Scale

75
Figure 7.11: XRPD patterns for 2:1 piroxicam/succinic acid and starting materials.
5 10 15 20 25 30 35 2Theta (°)
Intensity (counts)
0
400
1600
3600
6400
10000
14400
19600
2:1 Piroxicam/Succinic Acid Comparison
2:1 100mg Scale
2:1 500mg Scale
2:1 1g Scale
2:1 Literature Calculated
Single Crystal
Piroxicam Starting
Materials
Succinic Acid Starting Materials

76
Figure 7.12: XRPD patterns for 1:1 piroxicam/succinic acid and starting materials.
5 10 15 20 25 30 35 2Theta (°)
Intensity (counts)
0
400
1600
3600
6400
10000
14400
19600
1:1 Piroxicam/Succinic Acid Comparison
1:1 100mg Scale
1:1 500mg Scale
1:1 1g Scale
2:1 Literature Calculated
Single Crystal
Piroxicam Starting
Materials
Succinic Acid Starting Materials

77
Figure 7.13: 1:1 piroxicam/succinic acid DSC thermograms.
50 mg scale
500 mg scale

78
Figure 7.14: 2:1 piroxicam/succinic acid DSC thermograms.
200 mg
1 g
2 g

79
Figure 7.15: XRPD patterns for 1:1 piroxicam/benzoic acid and starting materials.
5 10 15 20 25 30 35 40 2Theta (°)
Intensity (counts)
0
2500
10000
22500
40000
62500 1:1 Piroxicam / Benzoic Acid
Literature Single
Crystal Data
500 mg scale
50mg scale
2 g scale
Benzoic Acid Starting Material
Piroxicam Starting Material

80
Figure 7.16: XRPD patterns for 1:1 piroxicam/benzoic acid and physical mixture.
Intensity (counts)
5 10 15 20 25 30 35 2Theta (°)
0
250000
1000000
2250000
1:1 Piroxicam/Benzoic Acid
500mg Scale
50mg Scale
2g Scale
Physical Mixture

81
Figure 7.17: 1:1 piroxicam/benzoic acid DSC thermograms (50 mg and 2 g scales).
50 mg scale
2 g scale

82
Figure 7.18: 1:1 piroxicam/benzoic acid DSC thermograms (500 mg scale).
1:1 Piroxicam / Benzoic Acid 500 mg scale

83
Reaction Crystallization Solid State Data
Figure 7.19: 2:1 piroxicam/succinic acid co-crystal DSC thermogram (2:1 THF/IPA
solvent).

84
Figure 7.20: 2:1 piroxicam/succinic acid co-crystal DSC thermogram (1:1 THF/IPA
solvent).
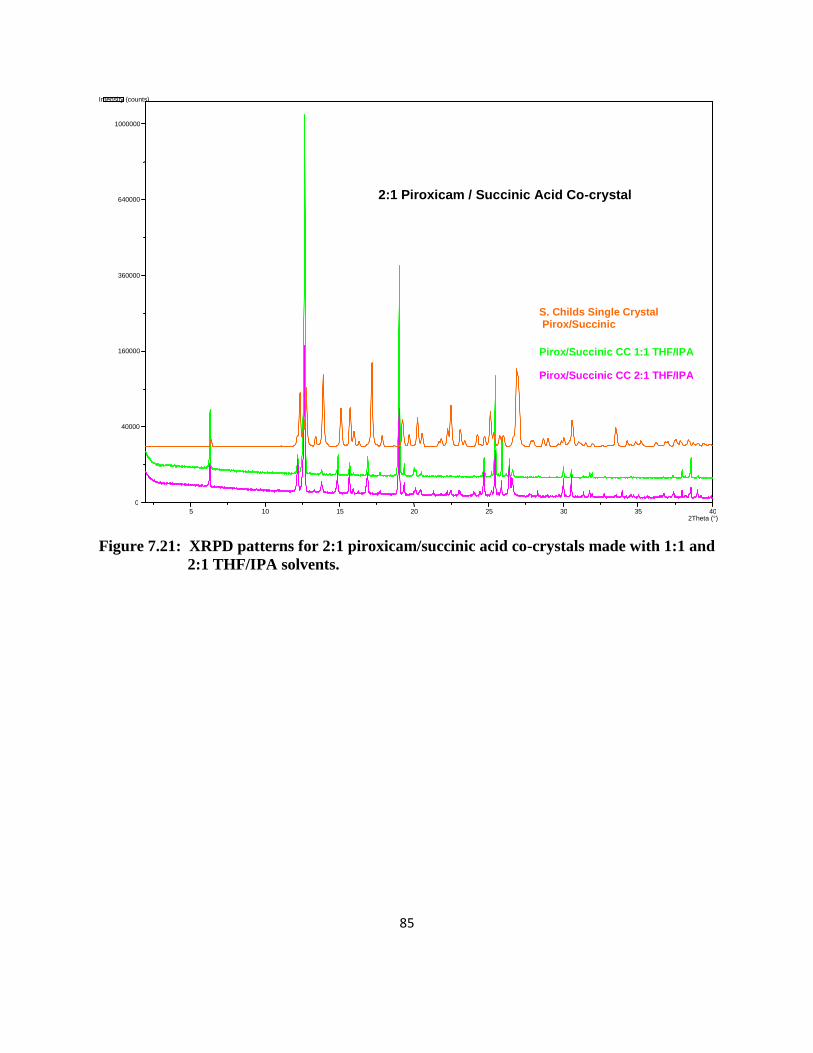
85
Figure 7.21: XRPD patterns for 2:1 piroxicam/succinic acid co-crystals made with 1:1 and
2:1 THF/IPA solvents.
5 10 15 20 25 30 35 40 2Theta (°)
Intensity (counts)
0
40000
160000
360000
640000
1000000
2:1 Piroxicam / Succinic Acid Co-crystal
Pirox/Succinic CC 1:1 THF/IPA
Pirox/Succinic CC 2:1 THF/IPA
S. Childs Single Crystal Pirox/Succinic
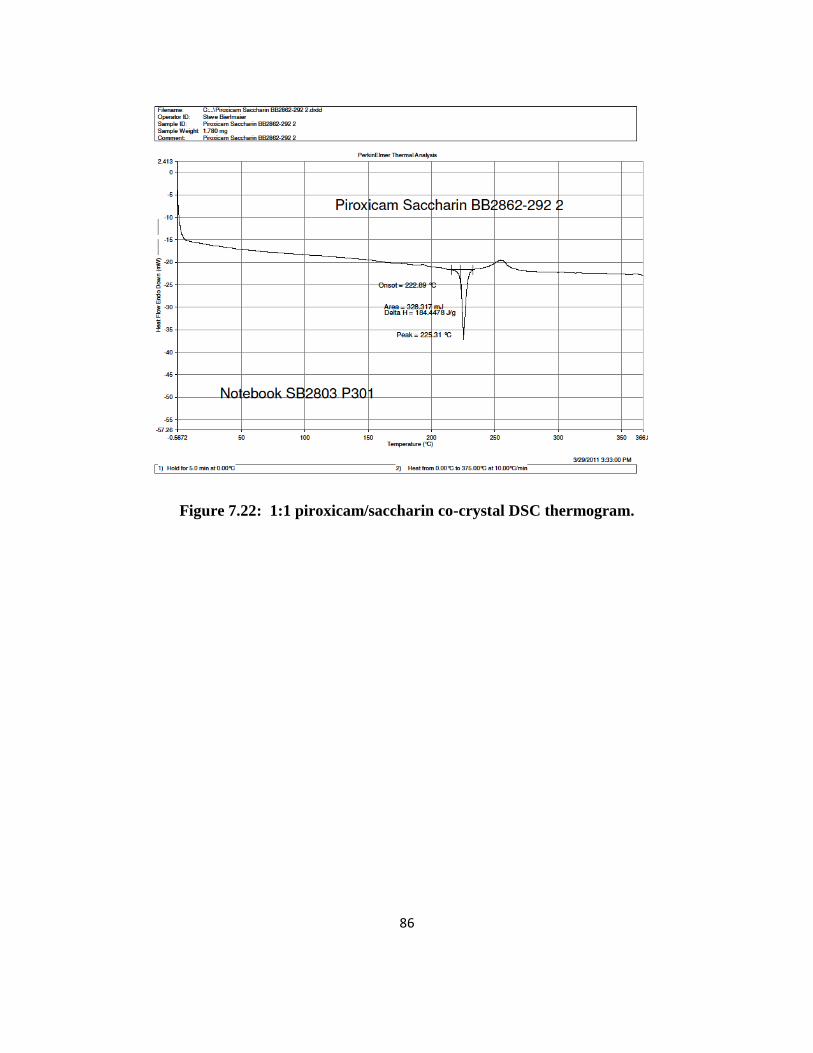
86
Figure 7.22: 1:1 piroxicam/saccharin co-crystal DSC thermogram.

87
Figure 7.23: 1:1 piroxicam/gentisic acid co-crystal DSC thermogram.

88
Figure 7.24: 1:1 piroxicam/salicylic acid co-crystal DSC thermogram and TGA
overlay.
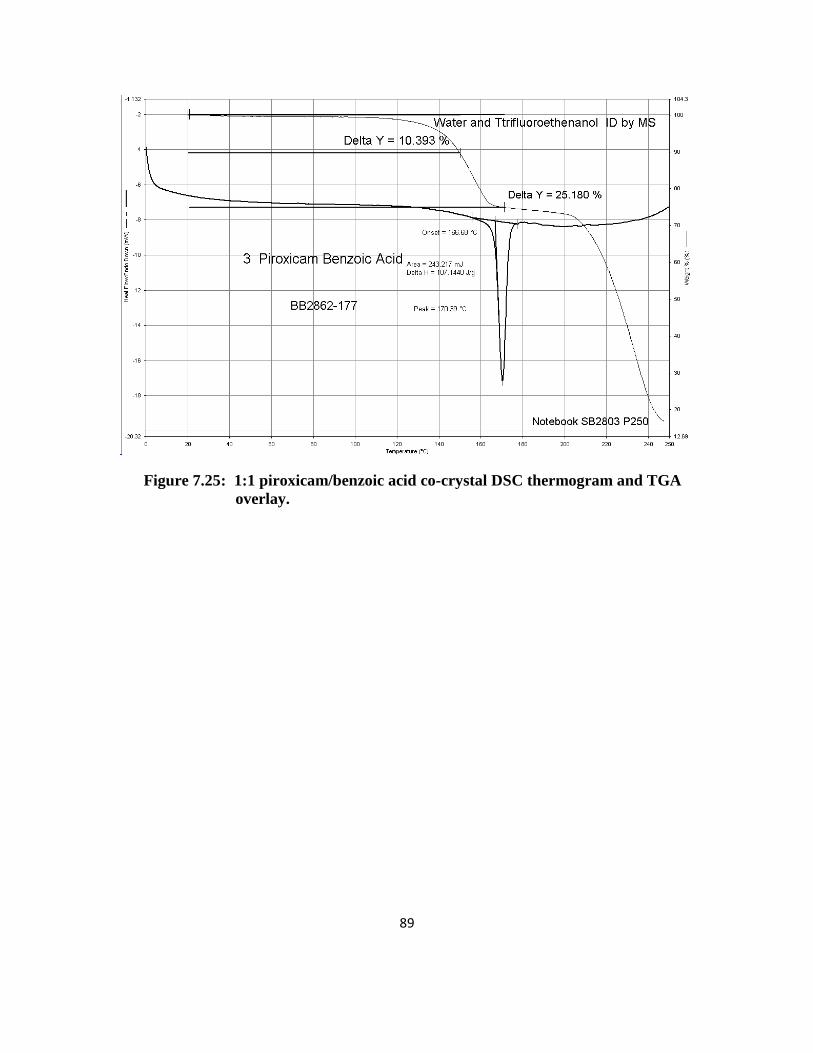
89
Figure 7.25: 1:1 piroxicam/benzoic acid co-crystal DSC thermogram and TGA
overlay.

90
Figure 7.26: 1:1 piroxicam/benzoic acid co-crystal XRPD pattern comparison with
Childs reference co-crystal.
2Theta (°)
Intensity (counts)
5 10 15 20 25 30 35 40 0
25
100
225
400
625
900
Piroxicam / Benzoic Acid Co-crystal
B. Brown Co-crystal XRPD
S. Childs Co-crystal Single Crystal

91
Figure 7.27: 1:1 piroxicam/4-hydroxy benzoic acid co-crystal DSC thermogram and
TGA overlay.

92
Figure 7.28: 1:1 piroxicam/4-hydroxy benzoic acid co-crystal XRPD pattern
comparison with Childs reference co-crystal.
5 10 15 20 25 30 35 40 2Theta (°)
Intensity (counts)
0
2500
10000
22500 Piroxicam / 4-hydroxy Benzoic Acid
B. Brown Co-crystal XRPD
S. Childs Co-crystal Single Crystal

93
Co-crystal Solubility XRPD Patterns
Figure 7.29: 1:1 piroxicam/gentisic acid co-crystal XRPD pattern
after aqueous solubility experiments.
2Theta (°) 5 10 15 20 25 30 35 40 0
2500
10000
22500
40000
Intensity (counts)
Piroxicam Monohydrate
Piroxicam Starting Material
Monoclinic Piroxicam
Piroxicam Gentisic Acid Cocrystal Solubility
Gentisic Acid Starting Material
P/GA Solid H20 Solvent
P/GA Cocrystal Starting Material

94
Figure 7.30: 1:1 piroxicam/salicylic acid co-crystal XRPD pattern
after aqueous solubility experiments.
5 10 15 20 25 30 35 40 2Theta (°)
0
2500
10000
22500
40000
62500
Intensity (counts)
Piroxicam Monohydrate
Piroxicam Starting Material
Monoclinic Piroxicam
Salicylic Acid Starting Material
P/SA Cocrystal Starting Material
P/SA Solid H20 Solvent
Piroxicam Salicylic Cocrystal Solubility

95
Figure 7.31: 1:1 piroxicam/benzoic acid co-crystal XRPD pattern
after aqueous solubility experiments.
5 10 15 20 25 30 35 40 2Theta (°)
0
10000
40000
90000
160000
Piroxicam / Benzoic Acid Cocrystal H2O Solubility
Piroxicam Monohydrate
Piroxicam Starting Material
PBA Solid
PBA Starting Material

96
Figure 7.32: 1:1 piroxicam/saccharin co-crystal XRPD pattern
after aqueous solubility experiments.
5 10 15 20 25 30 35 40 0
1000000
4000000
9000000
16000000
Saccharin Starting Material
Monoclinic Piroxicam
Piroxicam Starting Material
Piroxicam Monohydrate
PS Cocrystal Starting Material
PS Solid H2O solvent
Piroxicam / Saccharin Cocrystal Solubility in H2O

97
Figure 7.33: 1:1 piroxicam/4-hydroxy benzoic acid co-crystal XRPD pattern
after aqueous solubility experiments.
5 10 15 20 25 30 35 2Theta (°)
0
10000
40000
90000
Piroxicam Monohydrate
Piroxicam Starting Material
Monoclinic Piroxicam
Piroxicam 4-hydroxy Benzoic Acid Cocrystal Solubility
P/4hBA Cocrystal Starting Material
P/4hBA solid H20 Solvent
4-hydroxy Benzoic Acid Starting Material

98
Figure 7.34: 1:1 piroxicam/succinic acid co-crystal XRPD pattern after
aqueous solubility experiments.
0
400
1600
3600
6400
10000
Piroxicam/Succinic Acid H2O Solubility
Remaining Solid
Piroxicam Monohydrate

99
Co-crystal Intrinsic Dissolution XRPD Patterns
Figure 7.35: 1:1 piroxicam/benzoic acid co-crystal XRPD pattern after
intrinsic dissolution experiments (0.05M buffer, pH 6.8).
5 10 15 20 25 30 35 40 2Theta (°)
0
100
400
900
1600
2500
Piroxicam Starting Material
Piroxicam Monohydrate
PBA Starting Material
PBA uIDR pellet
Piroxicam / Benzoic Acid uIDR in 0.05M, pH = 6.8

100
Figure 7.36: 1:1 piroxicam/gentisic acid co-crystal XRPD pattern after
intrinsic dissolution experiments (0.05M buffer, pH 6.8).
5 10 15 20 25 30 35 40 2Theta (°)
0
100
400
900
1600
2500
3600
Piroxicam Starting Material
Piroxicam Monohydrate
PGA Starting Material
PGA uIDR pellet
Piroxicam / Gentisic Acid uIDR in 0.05M, pH = 6.8

101
Figure 7.37: 1:1 piroxicam/saccharin co-crystal XRPD pattern after
intrinsic dissolution experiments (0.05M buffer, pH 6.8).
5 10 15 20 25 30 35 40 2Theta (°)
0
400
1600
3600
Piroxicam Starting Material
Piroxicam / Saccharin uIDR in 0.05M, pH = 6.8
Piroxicam Monohydrate
PSacc Starting Material
PSacc uIDR pellet
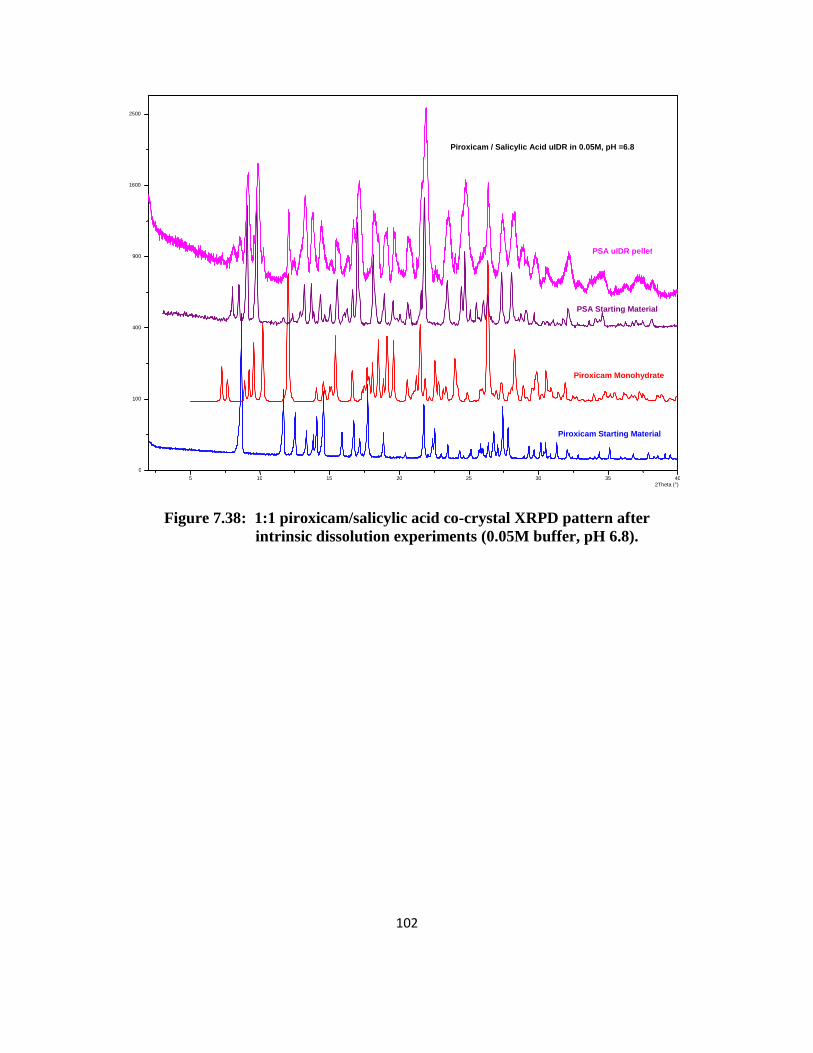
102
Figure 7.38: 1:1 piroxicam/salicylic acid co-crystal XRPD pattern after
intrinsic dissolution experiments (0.05M buffer, pH 6.8).
5 10 15 20 25 30 35 40 2Theta (°)
0
100
400
900
1600
2500
Piroxicam Starting Material
Piroxicam Monohydrate
PSA Starting Material
PSA uIDR pellet
Piroxicam / Salicylic Acid uIDR in 0.05M, pH =6.8

103
Figure 7.39: 1:1 piroxicam/4-hydroxy benzoic acid co-crystal XRPD pattern after
intrinsic dissolution experiments (0.05M buffer, pH 6.8).
5 10 15 20 25 30 35 40 2Theta (°)
0
2500
10000
22500
Piroxicam Starting Material
Piroxicam Monohydrate
P4hBA Starting Material
P4hBA uIDR pellet
Piroxicam / 4-hydroxy Benzoic Acid uIDR in 0.05M, pH =6.8

104
Figure 7.40: Piroxicam reference standard XRPD pattern after intrinsic
dissolution experiments (0.05M buffer, pH 6.8).
5 10 15 20 25 30 35 2Theta (°)
0
25
100
225
400
625
900
Piroxicam Starting Material
Piroxicam uIDR pellet
Piroxicam uIDR in 0.05M, pH = 6.8

105
Figure 7.41: 2:1 piroxicam/succinic acid co-crystal XRPD pattern after
intrinsic dissolution experiments (0.1M buffer, pH 6.8).
5 10 15 20 25 30 35 40 2Theta (°)
0
1000000
4000000
9000000
16000000
2:1 Piroxicam / Succinic Acid uIDR 0.05M, pH 6.8
PSucA Starting Material
PSucA uIDR Pellet
Piroxicam Monohydrate
Piroxicam Starting Material
Succinic Acid Starting Material

106
Figure 7.42: Piroxicam reference standard XRPD pattern after intrinsic
dissolution experiments (0.1M buffer, pH 6.8).
5 10 15 20 25 30 35 0
2500
10000
22500
Piroxicam uIDR in 0.1M , pH = 6.8
Piroxicam Starting Material
Piroxicam uIDR pellet

107
Figure 7.43: 1:1 piroxicam/saccharin co-crystal XRPD pattern after
intrinsic dissolution experiments (0.1M buffer, pH 6.8).
0
400
1600
3600
Piroxicam Starting Material
PSacc Starting Material
Piroxicam Monohydrate
PSacc uIDR Pellet
Piroxicam / Saccharin uIDR in 0.1M, pH = 6.8
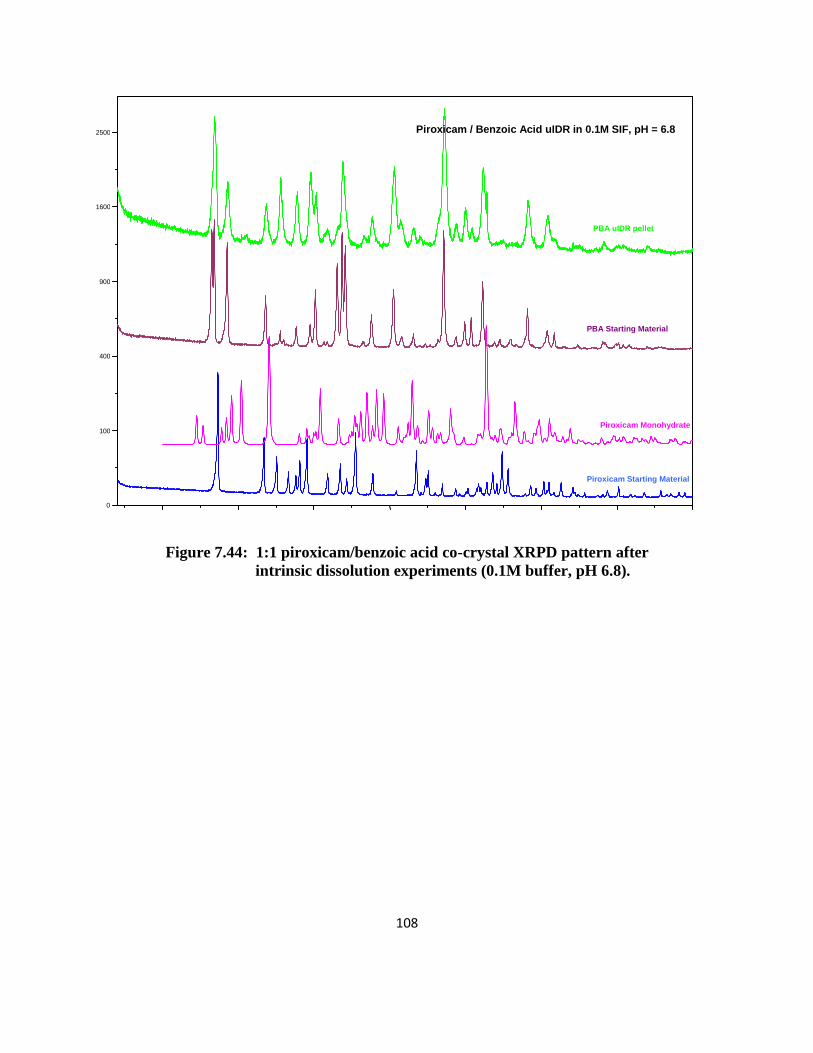
108
Figure 7.44: 1:1 piroxicam/benzoic acid co-crystal XRPD pattern after
intrinsic dissolution experiments (0.1M buffer, pH 6.8).
0
100
400
900
1600
2500
Piroxicam Starting Material
PBA Starting Material
Piroxicam Monohydrate
PBA uIDR pellet
Piroxicam / Benzoic Acid uIDR in 0.1M SIF, pH = 6.8

109
Figure 7.45: 1:1 piroxicam/gentisic acid co-crystal XRPD pattern after
intrinsic dissolution experiments (0.1M buffer, pH 6.8).
5 10 15 20 25 30 35 40 0
100
400
900
Piroxicam Starting Material
PGA Starting Material
Piroxicam Monohydrate
PGA uIDR pellet
Piroxicam / Gentisic Acid uIDR in 0.1M, pH =6.8

110
Figure 7.46: 1:1 piroxicam/4-hydroxy benzoic acid co-crystal XRPD pattern after
intrinsic dissolution experiments (0.1M buffer, pH 6.8).
5 10 15 20 25 30 35 40 0
400
1600
3600
6400
10000
14400 Piroxicam / 4-hydroxy Benzoic Acid uIDR in 0.1M, pH = 6.8
Piroxicam Starting Material
P4hBA Starting Material
Piroxicam Monohydrate
P4hBA uIDR pellet

111
Figure 7.47: 1:1 piroxicam/salicylic acid co-crystal XRPD pattern after
intrinsic dissolution experiments (0.1M buffer, pH 6.8).
5 10 15 20 25 30 35 40 0
100
400
900
1600
2500
Piroxicam Starting Material
Piroxicam Monohydrate
PSA Starting Material
PSA uIDR pellet
Piroxicam / Salicylic Acid uIDR in 0.1M, pH = 6.8

112
Figure 7.48: Piroxicam reference standard XRPD pattern after intrinsic
dissolution experiments (pH 1.2).
5 10 15 20 25 30 35 0
2500
10000
22500
Piroxicam uIDR, pH = 1.2
Piroxicam Starting Material
Piroxicam uIDR pellet

113
Figure 7.49: 1:1 piroxicam/saccharin co-crystal XRPD pattern after
intrinsic dissolution experiments (pH 1.2).
5 10 15 20 25 30 35 40 2Theta (°)
0
100
400
900
1600
2500
3600
Piroxicam Starting Material
PSacc Starting Material
Piroxicam Monohydrate
PSacc uIDR Pellet
Piroxicam / Saccharin uIDR, pH = 1.2

114
Figure 7.50: 1:1 piroxicam/gentisic acid co-crystal XRPD pattern after
intrinsic dissolution experiments (pH 1.2).
5 10 15 20 25 30 35 40 2Theta (°)
0
100
400
900
Piroxicam Starting Material
PGA Starting Material
Piroxicam Monohydrate
PGA uIDR pellet
Piroxicam / Gentisic Acid uIDR, pH = 1.2

115
Figure 7.51: 1:1 piroxicam/benzoic acid co-crystal XRPD pattern after
intrinsic dissolution experiments (pH 1.2).
5 10 15 20 25 30 35 40 0
100
400
900
1600
2500
Piroxicam Starting Material
PBA Starting Material
Piroxicam Monohydrate
PBA uIDR pellet
Piroxicam / Benzoic Acid uIDR, pH = 1.2

116
Figure 7.52: 1:1 piroxicam/4-hydroxy benzoic acid co-crystal XRPD pattern after
intrinsic dissolution experiments (pH 1.2).
5 10 15 20 25 30 35 40 0
400
1600
3600
6400
10000
Piroxicam / 4-hydroxy Benzoic Acid uIDR, pH = 1.2
Piroxicam Starting Material
P4hBA Starting Material
Piroxicam Monohydrate
P4hBA uIDR pellet

117
Figure 7.53: 2:1 piroxicam/succinic acid co-crystal XRPD pattern after
intrinsic dissolution experiments (pH 1.2).
5 10 15 20 25 30 35 40 0
1000000
4000000
9000000
16000000
2:1 Piroxicam / Succinic Acid uIDR, pH 1.2
PSucA Starting Material
PSucA uIDR Pellet
Piroxicam Monohydrate
Piroxicam Starting Material
Succinic Acid Starting Material

118
Figure 7.54: 1:1 piroxicam/salicylic acid co-crystal XRPD pattern after
intrinsic dissolution experiments (pH 1.2).
5 10 15 20 25 30 35 40 2Theta (°) 0
25
100
225
400
Piroxicam Starting Material
Piroxicam Monohydrate
PSA Starting Material
PSA uIDR pellet
Piroxicam / Salicylic Acid uIDR, pH =1.2

119
Pharmacokinetic Data
10
100
1000
10000
100000
0 1 2 3 4 5 6 7
ng
/mL
Time (h)
Plasma Levels of Piroxicam in Rat1 mg/kg i.v., 5 mg/kg p.o. Capsules
Piroxicam Ref. Std. i.v.
Piroxicam Ref. Std. p.o.
Figure 7.55: Piroxicam six hour plasma levels after intravenous and oral dosing.
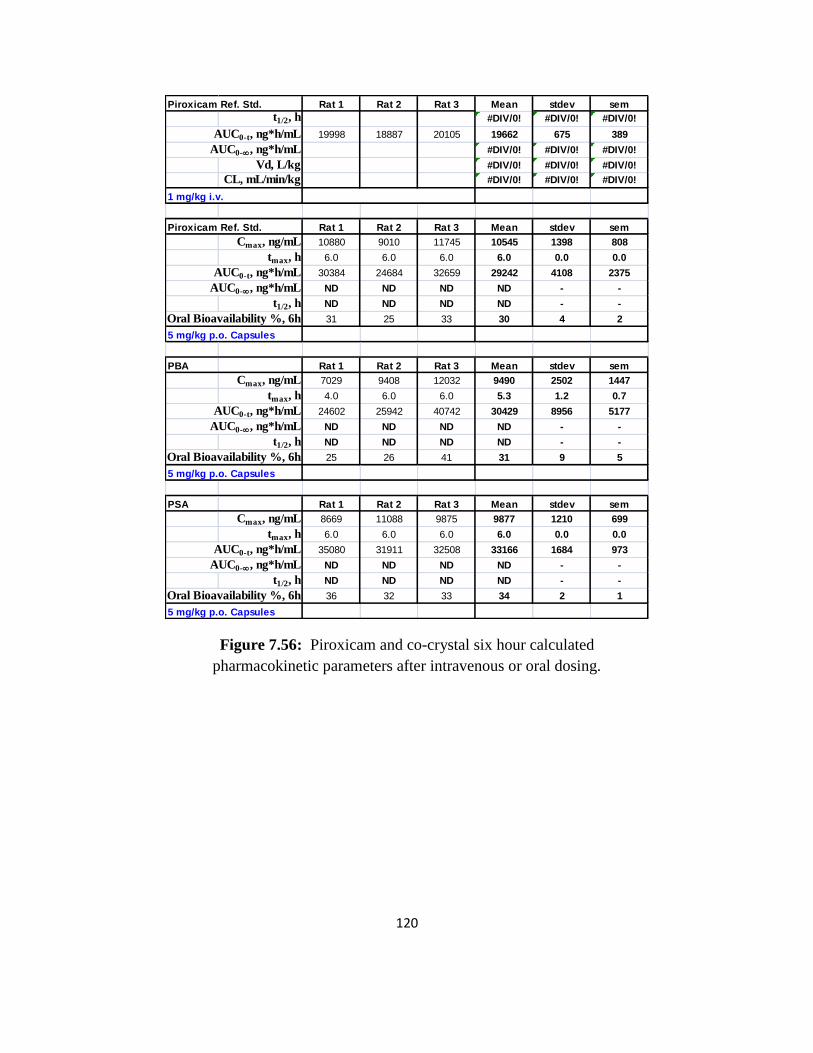
120
Piroxicam Ref. Std. Rat 1 Rat 2 Rat 3 Mean stdev sem
t1/2, h #DIV/0! #DIV/0! #DIV/0!
AUC0-t, ng*h/mL 19998 18887 20105 19662 675 389
AUC0-, ng*h/mL #DIV/0! #DIV/0! #DIV/0!
Vd, L/kg #DIV/0! #DIV/0! #DIV/0!
CL, mL/min/kg #DIV/0! #DIV/0! #DIV/0!
1 mg/kg i.v.
Piroxicam Ref. Std. Rat 1 Rat 2 Rat 3 Mean stdev sem
Cmax, ng/mL 10880 9010 11745 10545 1398 808
tmax, h 6.0 6.0 6.0 6.0 0.0 0.0
AUC0-t, ng*h/mL 30384 24684 32659 29242 4108 2375
AUC0-, ng*h/mL ND ND ND ND - -
t1/2, h ND ND ND ND - -
Oral Bioavailability %, 6h 31 25 33 30 4 2
5 mg/kg p.o. Capsules
PBA Rat 1 Rat 2 Rat 3 Mean stdev sem
Cmax, ng/mL 7029 9408 12032 9490 2502 1447
tmax, h 4.0 6.0 6.0 5.3 1.2 0.7
AUC0-t, ng*h/mL 24602 25942 40742 30429 8956 5177
AUC0-, ng*h/mL ND ND ND ND - -
t1/2, h ND ND ND ND - -
Oral Bioavailability %, 6h 25 26 41 31 9 5
5 mg/kg p.o. Capsules
PSA Rat 1 Rat 2 Rat 3 Mean stdev sem
Cmax, ng/mL 8669 11088 9875 9877 1210 699
tmax, h 6.0 6.0 6.0 6.0 0.0 0.0
AUC0-t, ng*h/mL 35080 31911 32508 33166 1684 973
AUC0-, ng*h/mL ND ND ND ND - -
t1/2, h ND ND ND ND - -
Oral Bioavailability %, 6h 36 32 33 34 2 1
5 mg/kg p.o. Capsules
Figure 7.56: Piroxicam and co-crystal six hour calculated
pharmacokinetic parameters after intravenous or oral dosing.

121
PGA Rat 1 Rat 2 Rat 3 Mean stdev sem
Cmax, ng/mL 10488 12000 10545 11011 857 495
tmax, h 6.0 6.0 4.0 5.3 1.2 0.7
AUC0-t, ng*h/mL 30915 45344 54122 43460 11717 6773
AUC0-, ng*h/mL ND ND ND ND - -
t1/2, h ND ND ND ND - -
Oral Bioavailability %, 6h 31 46 55 44 12 7
5 mg/kg p.o. Capsules
P4hBA Rat 1 Rat 2 Rat 3 Mean stdev sem
Cmax, ng/mL 10710 10622 10507 10613 102 59
tmax, h 4.0 6.0 6.0 5.3 1.2 0.7
AUC0-t, ng*h/mL 42074 32763 36451 37096 4689 2710
AUC0-, ng*h/mL ND ND ND ND - -
t1/2, h ND ND ND ND - -
Oral Bioavailability %, 6h 43 33 37 38 5 3
5 mg/kg p.o. Capsules
PSacc Rat 1 Rat 2 Rat 3 Mean stdev sem
Cmax, ng/mL 8722.00 11659 11770 10717 1729 999
tmax, h 6.0 6.0 6.0 6.0 0.0 0.0
AUC0-t, ng*h/mL 25465 56624 46711 42933 15919 9202
AUC0-, ng*h/mL ND ND ND ND - -
t1/2, h ND ND ND ND - -
Oral Bioavailability %, 6h 26 58 48 44 16 9
5 mg/kg p.o. Capsules
PSucA Rat 1 Rat 2 Rat 3 Rat 4 Rat 5 Rat 6 Mean stdev sem
Cmax, ng/mL 10853 15080 8947 9483 15434 7585 11230 3292 1349
tmax, h 6.0 6.0 6.0 6.0 6.0 6.0 6.0 0.0 0.0
AUC0-t, ng*h/mL 36705 60448 41923 36533 45161 17364 39689 14022 5747
AUC0-¥, ng*h/mL ND ND ND ND ND ND ND
t1/2, h ND ND ND ND ND ND ND
Oral Bioavailability %, 6h 37 61 43 37 46 18 40 14 6
5 mg/kg p.o. Capsules
Figure 7.57: Co-crystal six hour calculated pharmacokinetic
parameters after intravenous or oral dosing.
Co-Crystal ng*h/mL sem
Piroxicam Ref. Std. 2115 707
PGA 2192 550
PSacc 1850 294
AUC ( 0 - 1h )
Figure 7.58: Piroxicam and co-crystal calculated one hour AUC after oral dosing.