investigating reliability of power distribution system
TRANSCRIPT
GSJ: Volume 8, Issue 3, March 2020, Online: ISSN 2320-9186
www.globalscientificjournal.com
INVESTIGATING RELIABILITY OF POWER DISTRIBUTION SYSTEM USING FAULT TREE ANALYSIS (FTA).
D. C. Idoniboyeobu1, S.L. Braide2 and Y. Songo3 1,2&3(Department of Electrical Engineering, Rivers State University, Nigeria)
ABSTRACT: The aim of this research work is to investigate the reliability of a power distribution system using Fault Tree Analysis (FTA) technique. The objective of the research is to evaluate or assess the reliability of the 33/11kv injection substation of Rivers State University as the case study. The data used for the study was obtained from the university substation. The reliability analysis includes assessing the failed power components of the substation in terms of the frequency and durations of their failures. The physical translation of the substation line diagram into the reliability block diagram or fault tree diagram was constructed. The FTA diagram showed the logical arrangement of the power equipment and fault path leading to the system failure. With the FTA diagram, the qualitative analysis was carried out using logic symbols AND-GATE and OR-GATE to determine the minimal cut sets that indicate the root-cause of the system failure and obtain the Boolean algebra. The quantitative analysis was also carried out to determine the reliability parameters such as Mean Time Between Failures (MTBF), Mean Time To Repair (MTTR) and Unavailability of each the power equipment in the substation by using reliability indices. Through the Fault Tree Analysis (FTA) technique in the research, it was identified that the substation feeders such as 11kv UST Feeder, 11kv Federal Feeder and especially 11kv Wokoma Feeder were the power equipment that contributed majorly to the system failure of the substation.
Keywords – Power distribution system, distribution substation, fault tree analysis,
I. INTRODUCTION
Being one of the economic sectors upon which the economy of a nation hinges, a power sector plays a vital role in the economic development of a country. Thus, power system is fundamentally set up to supply steady and reliable electricity to its end-users. An electric power system is reliable when the electricity delivered is sufficient and economical both to the end-users and suppliers. Another parameter that determines the reliability of a power system or distribution system is the quality of power delivered. In furtherance, the power industry of a nation becomes a paramount economic factor to the economic development of the nation if the industrial and domestic demands of electricity are satisfied without power shortage or interruption.
In Nigeria today, the unreliable and poor nature of the power supply has imposed significant cost on the economy. According to [1], often end-users are the most affected by the power shortage as they don’t have the finance to pay for the backup power necessary to overcome the problems of power shortage. Power shortages have deeply affected the drive for economic growth and technological growth of Nigeria. Therefore, it is very necessary to take the issue of reliability of our power distribution systems serious.
An electric power system is made up of three subsystems: generation, transmission and distribution. From the generation station, electricity is generated and transmitted to the distribution stations. From distribution substations, electricity is delivered to consumers and through distribution lines to the consumersi.e 11kv to 0.415kv [2]. Reliable and safe supply of electricity to the consumers should be ensured by a reliable and performing distribution system but not by the redundant or failing type and this is what this study seeks to achieve.
Today in Nigeria, the power industry lacks automation, its competitiveness and creditability before the populace due to the endemic nature of power outage. The ills of the nation’s power sector are many despite heavy investments from the Federal Government in the sector. Our existing distribution networks are plagued by many constraints and problems such as overloading of transformers and feeders, poor maintenance, haphazard layouts, and wrong load connections. According to [3], no load discipline and
GSJ: Volume 8, Issue 3, March 2020 ISSN 2320-9186 663
GSJ© 2020 www.globalscientificjournal.com
the distribution networks are being exposed to several operational and environmental distortions. According to NEPA report in 2015, the present structure of the distribution networks in Nigeria is not equipped with quick fault detection system and isolation of faulty components and quick restoration of service to the end-users. Hence at this junction, due to these problems in the power sector, reliability and availability in the power sector, the Nigerian Electricity Supply Industry (NEST) was departmentalized into eighteen power companies consisting of six Generating Companies (GENCOs), one Transmission Company (TRANSYSCO) and eleven Distribution Companies (DISCOs). According to [3], the reason behind this was to ensure robust system performance and reliability. The issues of repair and maintenance of power equipment in the distribution substations should then be given serious attention.
The electric power distribution substations are important parts of power system not because they are an interface with the consumers only but they connect also the consumers to the power grid. With reference to [4] reports, a substation reliability analysis entails the assessment or evaluation of the power equipment in the substation.
With the increasing demand for electric power supply, the distribution companies have to attain a reliable level of acceptability, quality, flexibility and safety before they can gain consumers loyalty and expectations.
Analysis of the customer failure statistics of most electricity companies shows that the distribution system makes the greatest contribution to the unavailability of power supply to the customers [5] In effect, the purpose of establishing generating stations and the hurdles overcome to transmit electricity is defeated when it does not get to the user end as a result of distribution system failure. This makes distribution system to be highly important. The distribution systems account for up to 90% of all customers’ reliability problems, improving distribution reliability is the key to improving customer reliability [6].
In this research study, the Fault Tree Analysis (FTA) technique will be applied to system reliability assessment. In the process, the system reliability will be derived from the components’ reliability assessments in finding out the major component that caused the system unavailability or failure. Fault Tree Analysis (FTA) is a predictive technique for analysing a system down to its component to uncover the failure path of the system and improve the system functionality. FTA is a top-down deductive method by which the root- cause of the failure or event is deduced. It translates the physical diagram of the system into a block diagram using Boolean Logic or symbols, AND-GATE and OR-GATE to combine lower level events and represent the paths of the system failure. “Fault Tree Analysis (FTA) focuses on the critical failure causing top event such as the loss of the system functionality” [7]. According to Julwan, FTA deals in “failure space”. Om the same vein, the benefit of generating FTA is to detect the root-cause of the system breakdown and provide room for improvements and system maintenance [8].
The importance of this study is to investigate the reliability of a Power Distribution substation using the 33kv/11kv distribution substation of Rivers State University as a case study. This will entail quantitative and qualitative assessments of the major power equipment of the substation and uncovering the causes of the system failure through the application of the technique of FTA.
II. LITERATURE REVIEWS
2.1 Overview
Electrical power system is a complicated and complex system whose main function is to provide and transfer electrical energy to consumers. Power equipment in the distribution system can result to system failure and poor power delivery. The significance and the functionality of a distribution system therefore hinge on the functionalities of individual components of the distribution substation system. When the system fails, it means that the components or the power equipment fail as well, and as a result there will be power failure.
Hence, this chapter will look at the principle behind reliability analysis and explain how the method of FTA can be employed by other researchers to carry out the reliability assessment of the power distribution system and paving the way for automation in the distribution.
2.1.1 The Reliability Principle
Reliability of an electrical power system is the probability that the system will continuously deliver electricity to its consumers without compromise on the quality of the power being delivered [9]. It is simply also the measure of whether users have electricity when it is needed[10]. Therefore, the power system reliability is the direct measure of safe and reliable operations of a distribution substation.
GSJ: Volume 8, Issue 3, March 2020 ISSN 2320-9186 664
GSJ© 2020 www.globalscientificjournal.com
Equipment breakdown and power interruption are the main focus of the distribution reliability study. In normal operational conditions, all the components in a power distribution substation are energized and in the process all connected loads are also energized.
Furthermore, according to IEE, system reliability is defined as the ability of the system, subsystem or component to perform its original intended purpose under specific operational conditions for a given period of time. Power reliability can therefore be defined as the degree to which the performance of the entire system resulting in electricity being delivered to consumers within the accepted standards and the amount delivered [11].
Unscheduled and planned breakdowns in the system can disrupt normal operational conditions and lead to power outages in the system. The unscheduled failures, can be as a result of maintenance operation failure, overloading, line losses, and wrong load connections.
2.1.2 Historical Background of Fault Tree Analysis
The Fault Tree Analysis (FTA) technique is a modelling technique that can be used to analyze the failure path of engineering systems. FTA is essentially composed of logic symbols and diagrams that show the operational or redundant state of system and is constructed through the physical translation of the system using the logic symbols. Ordinarily, reliability engineers were first responsible for the development of Fault Tree Analysis technique as a creative and predictive method of studying the reliability of a system. FTA is mostly regarded as a model of reliability engineering.
Fault Tree Analysis normally applied to a failed hardware system, a material failure and the malfunctions of a redundant or a component. The fault tree technique is applicable to a hardware system but not to a software system because software is vital and inclusive of the system operation. It is an instruction sent to the hardware for the system to perform its normal operation. There’s nothing like software failure rate hence a software does not fail in the practical and physical sense, tying to predict or analyze the manifestation of software failures and coding errors with any reliability principles or parameter is not possible. Mere prediction of the cause of human errors or the root cause of the system breakdown is not the primary objective of the Fault Tree Analysis (FTA) technique but the purpose is to find out what actually in the system with the human error and gain knowledge of it.
FTA technique originally initiated for engineering projects where implementation mistakes are not tolerable (a mistake in a reactor is not tolerable). Bell Telephone Laboratories began the idea of FTA technique in 60's for the United States Air Force's Minuteman System (Intercontinental Ballistic Missiles and Bombers). Years later, the technique used scientifically by US Nuclear Power Plants and the Boeing Company.
On the other hand, the development of automation in power distribution system started in the year 1970s. The objective at that moment was to employ the advancement in Information Technology upgrade the performance of the distribution systems. Since that time, the development of automated distribution system has been hastened by the progress in monitoring and control technologies. However, being the most important part of power system, technological improvement in distribution system is recent compared to advancements in transmission and generation. With the development of automation in distribution systems, large projects became easy and simple to accomplish by many electric utilities.
The historical stages of Fault-Tree analysis are summarized below
The starting years of FTA (1960-1970)
• H. Watson of Bell Labs and A. Mearns used FTA as a technique to develop US Air Force equipment and for the assessment of Minuteman Launch Control System (1960).
• It was used by Dave Haasl of Boeing as an operational system safety evaluating technique (1963).
• FTA got the major application in Boeing for the Minuteman system for safety evaluation (1964-1967, 1968-1999)
• Technical Papers were also presented on FTA at the first System Safety Conference held in Seattle (June 1965).
• Boeing started applying the FTA technique in the design and evaluation or assessment of the commercial aircraft (1966).
GSJ: Volume 8, Issue 3, March 2020 ISSN 2320-9186 665
GSJ© 2020 www.globalscientificjournal.com
• With FTA, Boeing came up with a 12-phase Fault Tree Simulation Program, and a Fault Tree Plotting Program on a Calcomp roll plotter.
• This FTA technique was later applied by the Aerospace Industry (aircraft and weapons.)
The Early Years of (1971-1980)
• FTA was also used in Nuclear Power Industry.
• Electric Power Industry also developed algorithms based on FTA technique.
Mid Years of (1981-1999)
• Its applications became international through its usage in Nuclear Power plants.
• A lot of evaluation algorithms and codes were enacted.
• Uncountable technical papers were written on this subject of algorithm due to FTA.
• FTA was adopted in the Chemical industry.
From 2000 till date
• Continual use of FTA on many systems in several areas of study
• High quality of commercial codes have been developed which could be used on PC’s.
• FTA was also immensely employed in Robotics and Software engineering.
2.2.4 Primary ideas about FTA.
FTA technique is simply viewed or described as a deductive and analytical tool for analysing an unwanted event occurring in the system, that is, a component breakdown or determining the cause of the failure taking into consideration of the operational environment of the system. The Fault Tree technique is a graphical model itself taking care of the sequential occurrence of the faults in the system. The faults can fundamentally be associated with component hardware failures or human errors that may lead to overall system failure or system unavailability. The application of FTA reveals in the process the logical arrangement of the components of the system and interrelationship of the faults (basic events) which cause the top event of FTA (system failure).
2.2.5 The Concept of Minimal cut set
Minimal cut set is a set of subsystems or components which by failing fail the system. It is the path of the failure through the tree between the fault (basic event) and initiator of the fault. The cut set can also be viewed as the shortest way through the tree from the failure to the initiating cause. A cut set is taken as a minimal it can be reduced without affecting its status. In the same vein, there can be several minimal set cuts in the block diagram of FTA.
2.2.6 Elements of FTA
The FTA diagram basically consists of Logic symbols and Gates.
The Logic Symbols consist of:
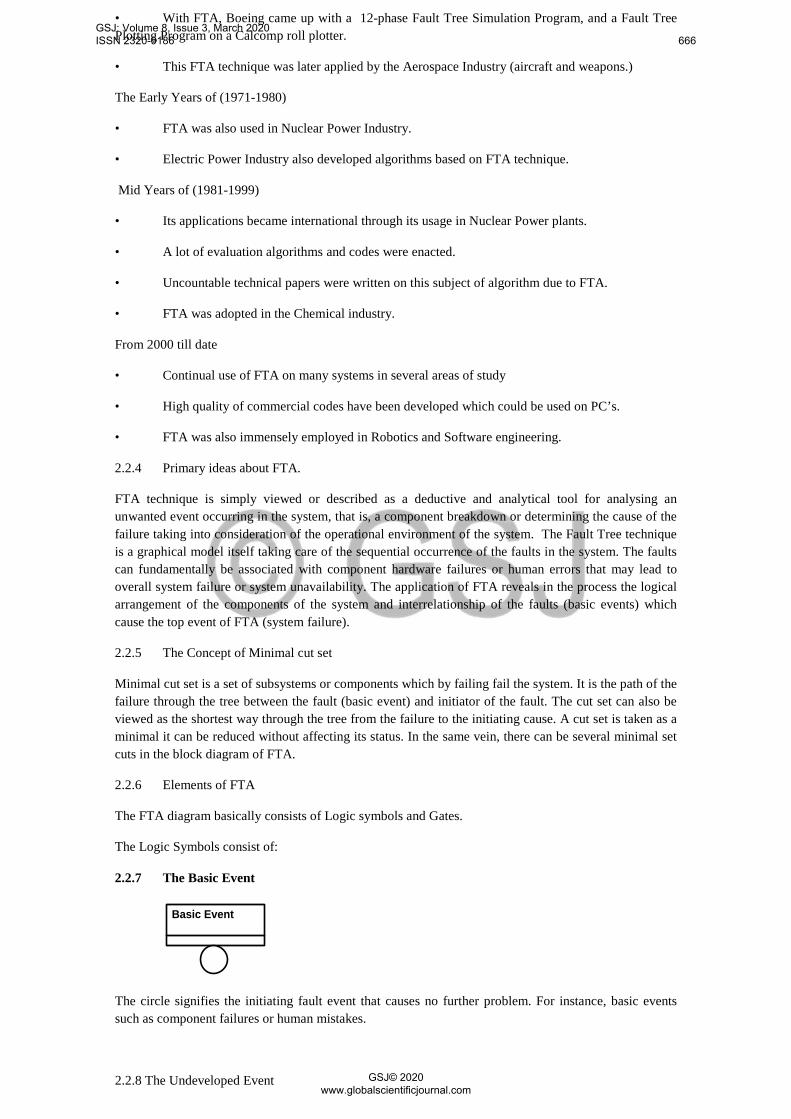
2.2.7 The Basic Event
Basic Event
The circle signifies the initiating fault event that causes no further problem. For instance, basic events such as component failures or human mistakes.
2.2.8 The Undeveloped Event
GSJ: Volume 8, Issue 3, March 2020 ISSN 2320-9186 666
GSJ© 2020 www.globalscientificjournal.com
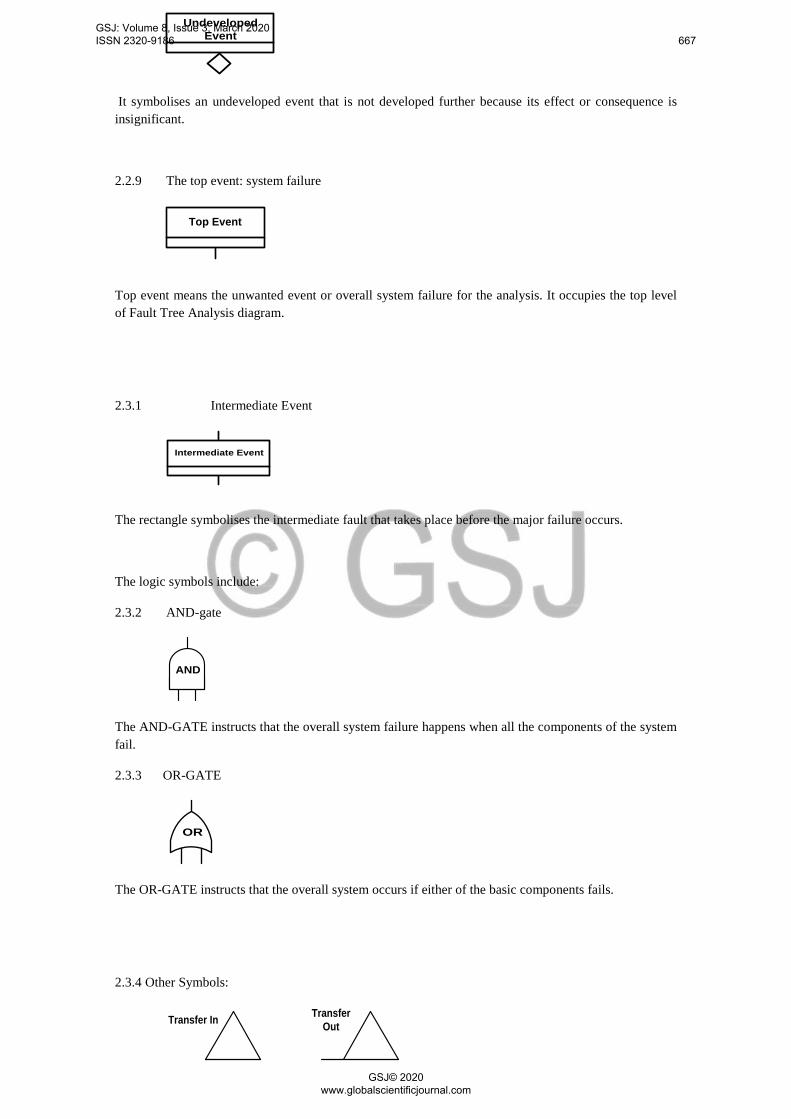
Undeveloped Event
It symbolises an undeveloped event that is not developed further because its effect or consequence is insignificant.
2.2.9 The top event: system failure
Top Event
Top event means the unwanted event or overall system failure for the analysis. It occupies the top level of Fault Tree Analysis diagram.
2.3.1 Intermediate Event
Intermediate Event
The rectangle symbolises the intermediate fault that takes place before the major failure occurs.
The logic symbols include:
2.3.2 AND-gate
AND
The AND-GATE instructs that the overall system failure happens when all the components of the system fail.
2.3.3 OR-GATE
OR
The OR-GATE instructs that the overall system occurs if either of the basic components fails.
2.3.4 Other Symbols:
Transfer In Transfer Out
GSJ: Volume 8, Issue 3, March 2020 ISSN 2320-9186 667
GSJ© 2020 www.globalscientificjournal.com
The two triangles above are transfer symbols on the FTA diagram. The triangle with no line means “transfer in”, and the triangle with line means “transfer out”. On the diagram the “transfer in” links to the corresponding “transfer out” which depicts the input to the gate.
2.3.5 Construction of FTA.
The building of the FTA diagram begins with the top event (major failure). The next level is the basic intermediate events that are further developed, connected to the top event through the logic gate. The top event is the first level of the FTA structure. So in that order, the construction of the FTA diagram can be proceeded stage by stage till all the fault events developed are presented on the resolution diagram. This deductive approach continues logically and repeatedly in accordance with the question “What are the reasons for this fault event?”
To construct FTA diagram the basic steps have to be respected. The fault event can be basic event or top event on the tree.
2.3.6 Specific detail of the Fault Event:
The fault events should attentively be described on how, where and when they occur specifically. An experienced power engineer who has an expertise in the design of a system should be able to detect and predict the kind of unwanted events that can occur on the system. Unwanted or undesired events can now be used to build the FTA diagram one fault event after the other; no two events can be used to make FTA.
2.3.7 Evaluation of fault events:
The moment the fault event is detected, the root causes leading to the probability of occurrence determined and analysed. Obtaining exact numeric values of the probability of occurrence of the fault event is practically difficult because it’s time consuming. Using computer software system to analyse the probabilities of the fault events should be more preferable because it takes no too much time.
System assessment or analysis helps in understanding the functionalities of the overall system. The system engineers, having the required knowledge should flop in their expertise to uncover the cause of the fault event or the undesired event. Having located the causes of the events, they should be numbered sequentially in order of occurrence. The fault events can be of different types such as technical faults, human faults, environmental factors...etc. These fault events will be attentively assessed and evaluated.
2.3.8 Building of the FTA:
Having selected all the fault events or undesired events and analysed the system in order to know causing effects (maybe their probabilities), we can then construct the FTA diagram. All the input fault events to any of the gates would be studied totally before moving to next gate. The FTA diagram should be in stages or levels and each stage should be completed before proceeding to next stage.
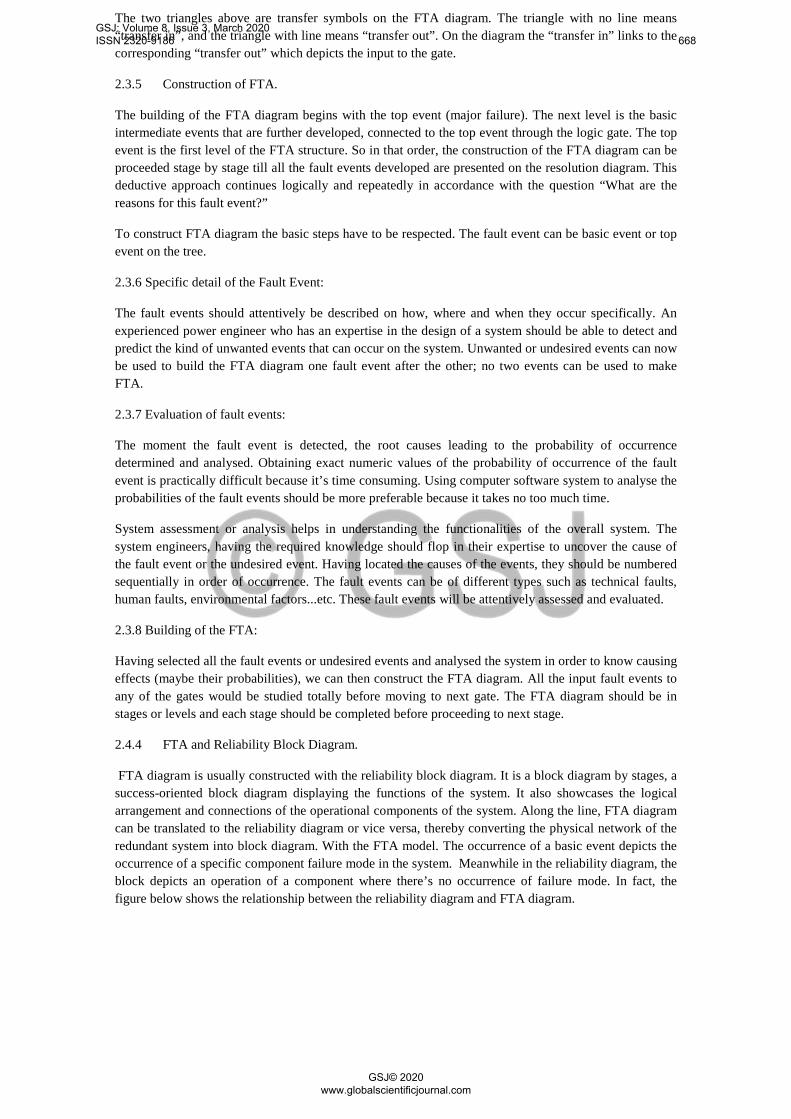
2.4.4 FTA and Reliability Block Diagram.
FTA diagram is usually constructed with the reliability block diagram. It is a block diagram by stages, a success-oriented block diagram displaying the functions of the system. It also showcases the logical arrangement and connections of the operational components of the system. Along the line, FTA diagram can be translated to the reliability diagram or vice versa, thereby converting the physical network of the redundant system into block diagram. With the FTA model. The occurrence of a basic event depicts the occurrence of a specific component failure mode in the system. Meanwhile in the reliability diagram, the block depicts an operation of a component where there’s no occurrence of failure mode. In fact, the figure below shows the relationship between the reliability diagram and FTA diagram.
GSJ: Volume 8, Issue 3, March 2020 ISSN 2320-9186 668
GSJ© 2020 www.globalscientificjournal.com
1
TOP
OR
32
1
TOP
AND
32
1
TOP
OR
AND
32
Intermediate Event
1
3
2
1 32
1
3
2
Fig 2.2: Relationship between simple Reliability Block diagram and Fault
Tree
III. METHODOLOGY
3.1 Overview
In this chapter, reliability analysis and assessment of the 33kv/11kv distribution substation of Rivers State University applying the FTA technique for the evaluation. The qualitative reliability evaluation of the individual power components of the substation, which involves data collection, will be conducted in the course of this project.
The substation’s diagram will be shown as well as the logical arrangement of its components. The FTA diagram will be constructed through physical translation of the line diagram of the substation using Boolean logics. For the quantitative assessment of the substation’s power equipment, reliability parameters of the system such as MTBF, MTTR, Availability, unavailability shall be evaluated by making use of the collected data from the substation. The indices or parameters of reliability will be defined and used for the manual calculations.
System failure to some extent could be unavoidable but nevertheless, impacts or effects of the failure should be lowered and the reliability of the system can also be enhanced through the application of FTA technique the mitigate the cause of the failure.
3.2 The Objectives.
The objective of this study is to carry out the reliability assessment or analysis of the o 33/11kv injection substation of RSU (Rivers State University) as the case study. This will help improve the efficiency of the substation in terms of the electricity delivery. Thus, this reliability study will assist the reliability engineers and power engineers in conceptualizing good distribution system design and suitable system planning for higher system adequacy and security. However, the major individual power equipment of the substation will also be assessed both qualitatively and quantitatively so that high flexibility and quality of the supply system can be improved.
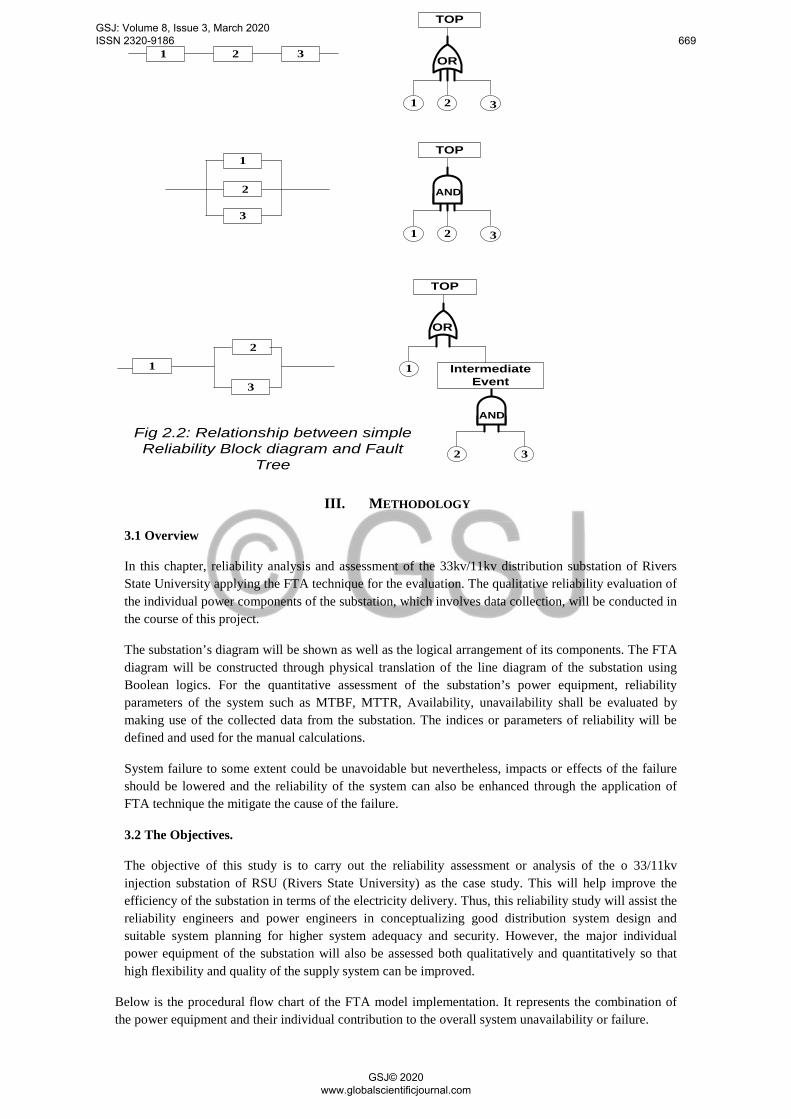
Below is the procedural flow chart of the FTA model implementation. It represents the combination of the power equipment and their individual contribution to the overall system unavailability or failure.
GSJ: Volume 8, Issue 3, March 2020 ISSN 2320-9186 669
GSJ© 2020 www.globalscientificjournal.com
Below is the procedural flow chart of the FTA model implementation. It represents the combination of the power equipment and their individual contribution to the overall system unavailability or failure.
Figure 3.3: Outlined procedures of FTA implementation of the 33kv/11Kv Injection distribution substation of RSU.
3.2: Data Collection
The data sourced out from the substation was of the year 2015. The data was as a result of the records from the substation’s logbook which contains the periods of outages with their durations and frequencies. RSU’s substation, just like every other distribution substation in Nigeria, does have a robust network structure for quick fault detection and isolation and quick restoration of service in terms of breakdown. In the course of research work, it is records of power shortages or interruptions during the year 2015 that taken into consideration. Power interruptions due to load shedding were not taken into account because these were forced power shortages. In power system, load shedding is a scheduled outage. It is intentional and purposeful. It is not attributable to the distribution system failure or any power equipment failure in the substation. Through the reliability analysis of the distribution substation research work seeks to uncover the major component failure that causes power failure in the system in a situation where there’s available power for distribution
3.3 Reliability indices for assessment
In power system, it is only the distribution system that stands as an interface between the distribution companies and the end-users. In the process, the reliability evaluation will take on how reliable the
Start
Collection of durations and frequencies of failures of power equipment.
Construction of the Network diagram of the 33kv/11kv distribution substation.
Construction of Fault Tree diagram of the distribution substation
Qualitative Fault Tree Analysis of the distribution substation
Quantitative Fault Tree Analysis of the distribution substation
End
GSJ: Volume 8, Issue 3, March 2020 ISSN 2320-9186 670
GSJ© 2020 www.globalscientificjournal.com
electricity supplied is and to what extent the electricity consumers are being served. The reliability of a distribution substation is the capability of the substation to perform its intended functions under some given conditions for a specific period of time[12].
Moreover, in the course of the reliability analysis of a distribution system one of the difficult aspects of the analysis is the individual physical analysis of the power equipment in the substation because it is time consuming process.
The reliability parameters in terms of statistics are reliability aggregation of a good performing power equipment in the distribution system. The reliability parameters are the evaluating measures for the reliability analysis of a functional distribution network or an active power component. These reliability parameters reflect the ability of the distribution system to produce or deliver a sufficient amount of electricity to the electricity consumers [13].
In the course of the reliability evaluation of power distribution substation, the parameters considered most are the duration and frequency of the power outage. The reliability indices are basically calculated based on the durations and frequencies of the components failures in the substation. The most important of all the indices used in evaluation of power system reliability are duration of outage and frequency of the outage. For the assessment, the reliability indices used the most are as follows:
• MTBF (Mean Time Between Failure)
• MTTR (Mean Time to Repair)
• MTTF (Mean Time to Failure)
• Unavailability and Reliability.
• In our dissertation, the above reliability indices will be computed based on the duration and frequency of the components failures in the substation in the year (2015).
3.3.1 Probability for Analytical Treatment
The function of a system is probabilistic in nature because it depends on the function of individual components of the system. thus, the reliability evaluation or assessment of the system performance should be carried out using methods involving probabilistic technique. The assessment of the system takes into consideration not only the system state or failure and its effect on the system operation and behaviour but also the probability of occurrence of the system failure.
The probabilistic approach is essential in the application of Fault Tree Analysis technique because entails analytical and numerical assessment of the fault events occurring in the system, and faults are the basic events and fundamental elements on the Fault Tree Diagram.
By probability, n stands as the number of the basic events on the FTA diagram. It also determines the order or number of the levels on the FTA diagram. The n fault events are numbered and the variables below are introduced:
}10
If basic event i occurs at time t
Otherwise i = 1,2,...nYi (t) =
3.1
Let Y(t) = [ Y1(t), Y2(t), …. Yn(t)] denotes the state vector of the structure of the diagram at a time t.The objective of the quantitative assessment is to determine the probability of occurrence of the system failure (TOP event).The state of the system failure or Top event is denoted by the variable ѱY(t).
}10
If TOP event occurs at time t
OtherwiseѱYi (t) =
3.2
GSJ: Volume 8, Issue 3, March 2020 ISSN 2320-9186 671
GSJ© 2020 www.globalscientificjournal.com
From equation above, it is considered that the fault events determine the system state or the Top event. The function below is the structure function of the FTA model.
ψY(t) =ΨY1 (t), Y2 (t), …. Yn (t) 3.3
The function qi (t) is the probability of the basic event i occurring at time t, for i = 1, 2, …, n.
qi(t) = Pr(Y) i (t ) = 1 = EY i (t) for i =1, 2,…, n 3.4
Assuming the basic event I denotes the failure state of the component i in the system for i =1, 2… n, then p(i) will mean the probability of the component i in the state of functioning at a time t. The function q i (t) is then assumed to be the probability of unreliability of the component i at time t.
Pr(Y i (t ) =1) = q i(t) = 1 - pi(t) for i =1, 2,…, n 3.5
LetQ0(t) be the function of the system failure or the TOP event occurring at time t.
Q0 (t) = Pr(Ψ(Y(t)) = 1) = E(Ψ(Y(t))). 3.6 The applications of the above statements of probability theorem to the FTA diagram are shown below.
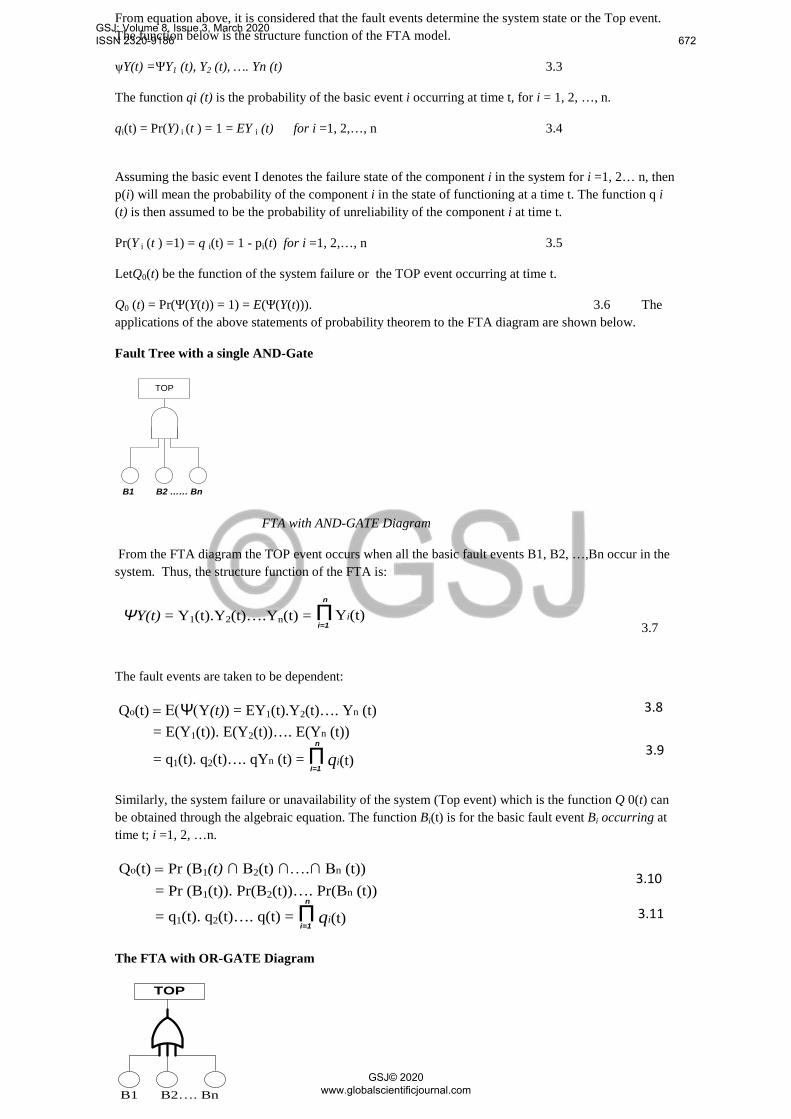
Fault Tree with a single AND-Gate
TOP
B1 B2 …… Bn
FTA with AND-GATE Diagram
From the FTA diagram the TOP event occurs when all the basic fault events B1, B2, …,Bn occur in the system. Thus, the structure function of the FTA is:
ΨY(t) = Y1(t).Y2(t)….Yn(t) = Π n
i=1Yi(t)
3.7
The fault events are taken to be dependent:
Qo(t) = Ε(Ψ(Y(t)) = EY1(t).Y2(t)…. Yn (t) = E(Y1(t)). E(Y2(t))…. E(Yn (t))
= q1(t). q2(t)…. qYn (t) = Π n
i=1qi(t)
Similarly, the system failure or unavailability of the system (Top event) which is the function Q 0(t) can be obtained through the algebraic equation. The function Bi(t) is for the basic fault event Bi occurring at time t; i =1, 2, …n.
Qo(t) = Pr (B1(t) ∩ B2(t) ∩….∩ Bn (t)) = Pr (B1(t)). Pr(B2(t))…. Pr(Bn (t))
= q1(t). q2(t)…. q(t) = Π n
i=1qi(t)
The FTA with OR-GATE Diagram
B1
TOP
B2…. Bn
3.8
3.9
3.11
3.10
GSJ: Volume 8, Issue 3, March 2020 ISSN 2320-9186 672
GSJ© 2020 www.globalscientificjournal.com
FTA with OR-GATE diagram.
Consider the fault tree in Figure3.5, From the diagram, the system failure (Top event) when any of the basic fault events B1,
B2… Bn occurs in the system. The basic structure function of the occurrence is determined as:
ΨY(t) = 1 – (1-Y1(t))(1-Y2(t)….(1-Yn(t)) =1- (1-Yi(t))n
i=1Π
The occurrence of the events is independent:
Qo(t) = E(Ψ(Y(t))) = 1 – E(1-Yi(t)) = (1- (1-E(Yi(t))) = 1- (1 - q1(t))n
i=1Π
n
i=1Π
n
i=1Π
Let ( ) i B t means that the basic fault event Bi occurring at time t and the function *( ) i B t means the failure of Bi to occur at time t. Below are the Boolean algebraic equations.
Pr (B1*(t)) = 1 - Pr(B1(t)) = 1 – q1(t) for i =1, 2,….n
Qo(t) = Pr (B1(t) U B2(t) U….U Bn (t)) = 1 - Pr(B*
1(t) ∩ B*2(t) ∩….∩ Bn
*(t)) = 1 - Pr(B*
1(t)). Pr(B*2(t)) ….Pr Bn
*(t)) n
i=1Π = 1 – (1 - q1(t))
3.3.2 Reliability Parameters
1-MTBF: Mean Time between Failures
MTBF can be viewed as one of the reliability measures of power equipment in the power distribution system in power industry. The reliability indices MTBF is taken as the time the power component functions or operates under specific operational conditions before it breaks down or fails. It also means the total operational durations of the component[5]
2-MTTR: Mean Time to Repair.
The parameter MTTR is the total taken to identify or locate the faulty component in the system and restore back the system to service or operation. It also means the total time taken to repair the failed component for normal operation.
3-Availability: It is the reliability parameter that denotes all the time the component has been in operation at any given time and condition. It also means the total durations of operation of the system without failing.
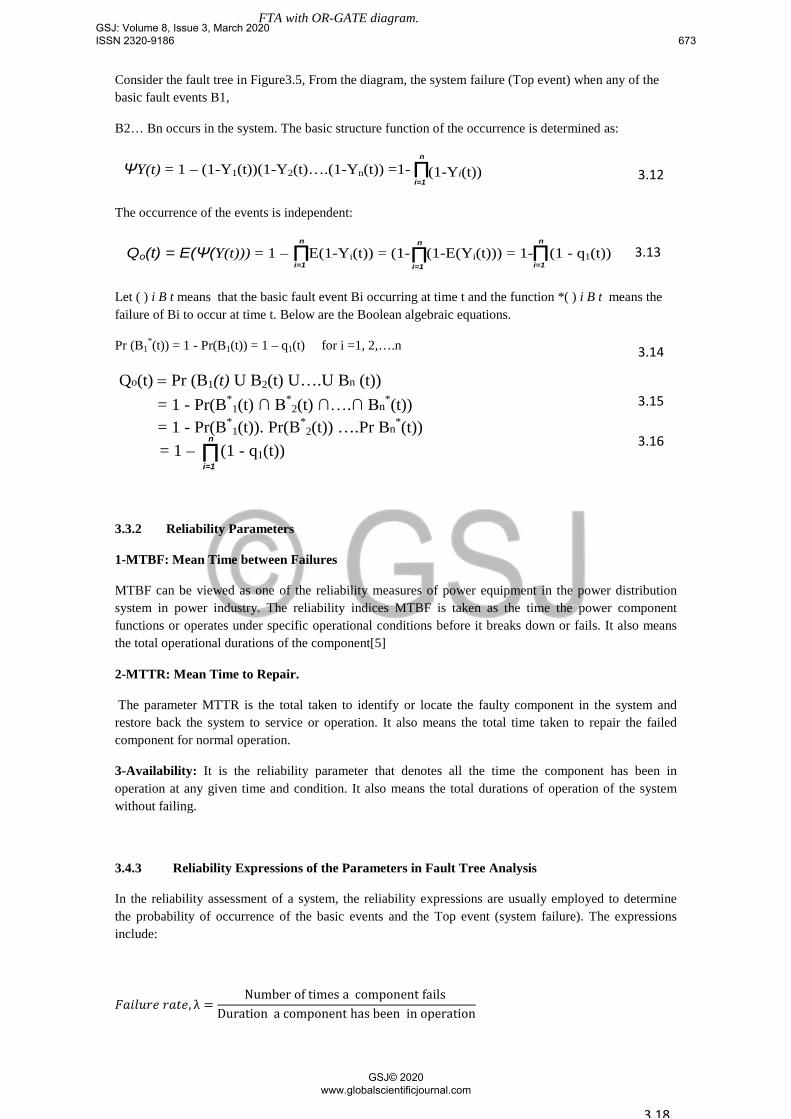
3.4.3 Reliability Expressions of the Parameters in Fault Tree Analysis
In the reliability assessment of a system, the reliability expressions are usually employed to determine the probability of occurrence of the basic events and the Top event (system failure). The expressions include:
𝐹𝐹𝐹𝐹𝐹𝐹𝐹𝐹𝐹𝐹𝐹𝐹𝐹𝐹 𝐹𝐹𝐹𝐹𝑟𝑟𝐹𝐹, λ =Number of times a component fails
Duration a component has been in operation
3.12
3.13
3.14
3.15
3.16
3.18
GSJ: Volume 8, Issue 3, March 2020 ISSN 2320-9186 673
GSJ© 2020 www.globalscientificjournal.com
R(t) = e–λT R(t)+ Q(t) = 1 Q(t) = 1 – R(t) = 1- e–λT 𝑄𝑄(𝐹𝐹) = λT = T
MTBF 3.21
MTBF = Total duration of system operationNumber of failures
3.22
MTTR = Total duration of failureNumber of failures
3.23
Failure frequency, f = 1MTBF + MTTR
3.24
Availability, A = MTBFMTBF + MTTR
3.25
Unavailability, U = MTTRMTBF + MTTR
= 𝐹𝐹×𝑀𝑀𝑀𝑀𝑀𝑀𝑀𝑀8760
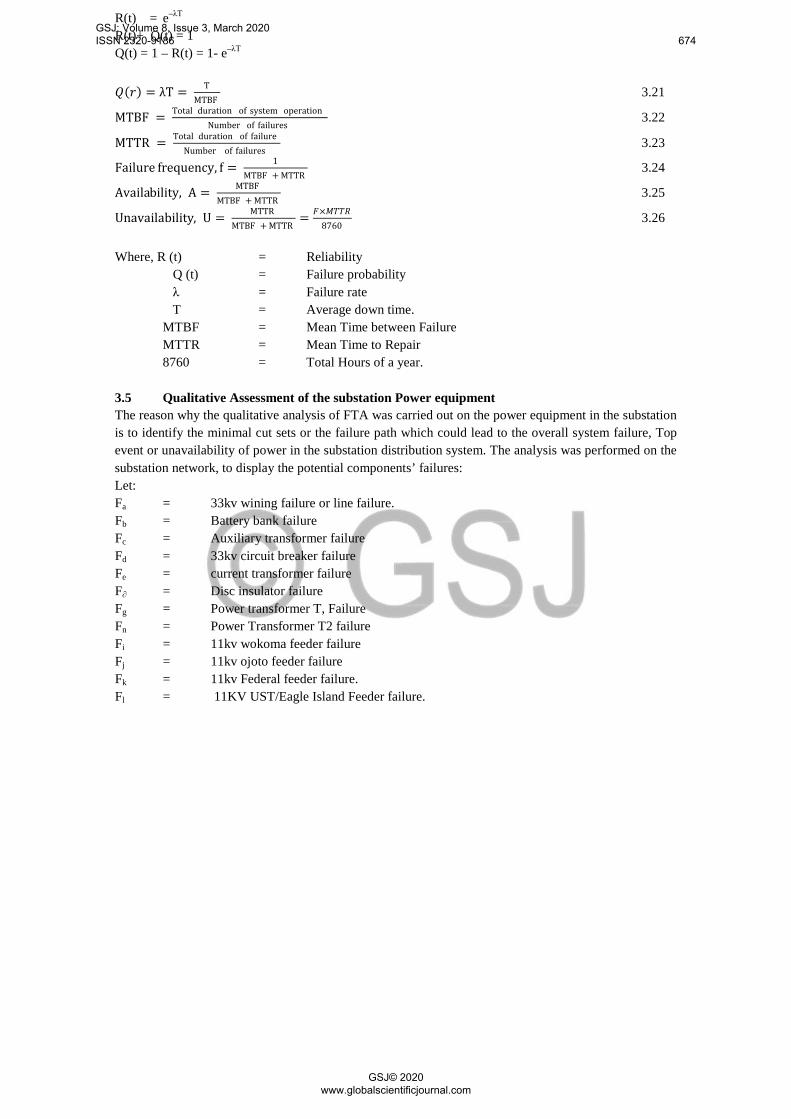
3.26 Where, R (t) = Reliability Q (t) = Failure probability λ = Failure rate T = Average down time. MTBF = Mean Time between Failure MTTR = Mean Time to Repair 8760 = Total Hours of a year. 3.5 Qualitative Assessment of the substation Power equipment The reason why the qualitative analysis of FTA was carried out on the power equipment in the substation is to identify the minimal cut sets or the failure path which could lead to the overall system failure, Top event or unavailability of power in the substation distribution system. The analysis was performed on the substation network, to display the potential components’ failures: Let: Fa = 33kv wining failure or line failure. Fb = Battery bank failure Fc = Auxiliary transformer failure Fd = 33kv circuit breaker failure Fe = current transformer failure F∂ = Disc insulator failure Fg = Power transformer T, Failure Fn = Power Transformer T2 failure Fi = 11kv wokoma feeder failure Fj = 11kv ojoto feeder failure Fk = 11kv Federal feeder failure. Fl = 11KV UST/Eagle Island Feeder failure.
GSJ: Volume 8, Issue 3, March 2020 ISSN 2320-9186 674
GSJ© 2020 www.globalscientificjournal.com
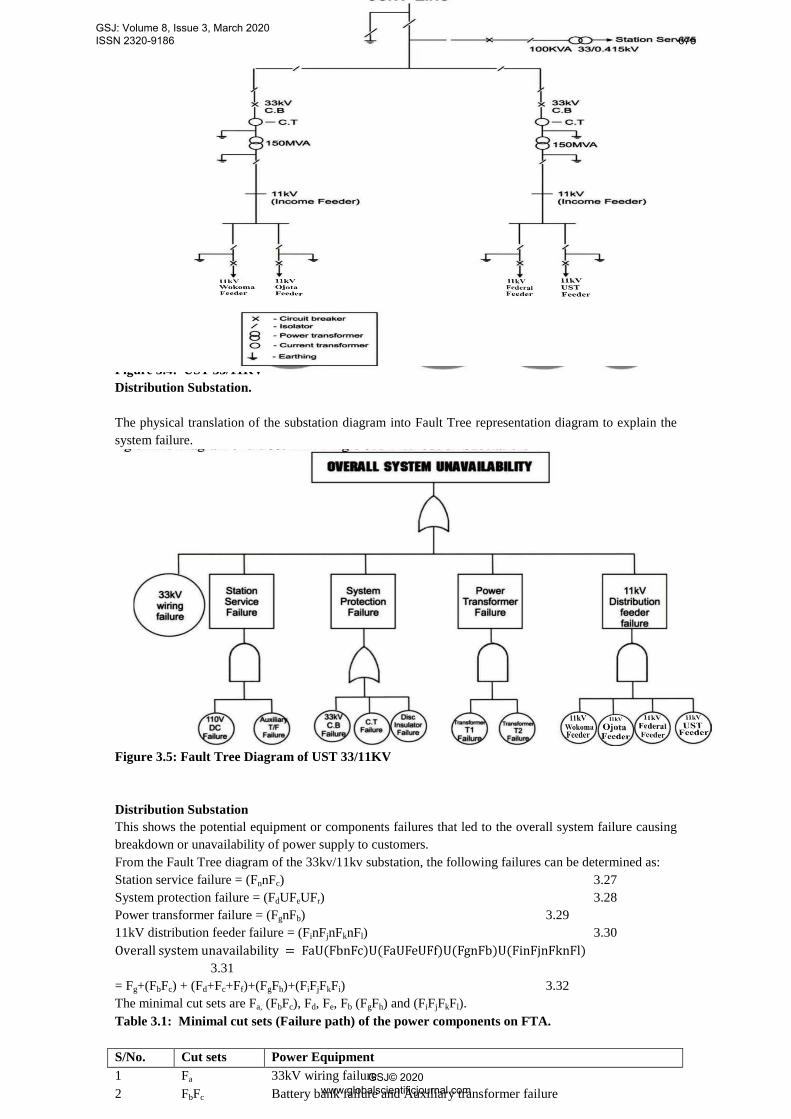
The diagram of the substation’s network. Figure 3.4: UST 33/11KV Distribution Substation. The physical translation of the substation diagram into Fault Tree representation diagram to explain the system failure. Figure 3.5: Fault Tree Diagram of UST 33/11KV Distribution Substation This shows the potential equipment or components failures that led to the overall system failure causing breakdown or unavailability of power supply to customers. From the Fault Tree diagram of the 33kv/11kv substation, the following failures can be determined as: Station service failure = (FnnFc) 3.27 System protection failure = (FdUFeUFr) 3.28 Power transformer failure = (FgnFb) 3.29 11kV distribution feeder failure = (FinFjnFknFl) 3.30 Overall system unavailability = FaU(FbnFc)U(FaUFeUFf)U(FgnFb)U(FinFjnFknFl) 3.31 = Fg+(FbFc) + (Fd+Fc+Ff)+(FgFh)+(FiFjFkFi) 3.32 The minimal cut sets are Fa, (FbFc), Fd, Fe, Fb (FgFh) and (FiFjFkFl). Table 3.1: Minimal cut sets (Failure path) of the power components on FTA. S/No. Cut sets Power Equipment 1 Fa 33kV wiring failure 2 FbFc Battery bank failure and Auxiliary transformer failure
GSJ: Volume 8, Issue 3, March 2020 ISSN 2320-9186 675
GSJ© 2020 www.globalscientificjournal.com
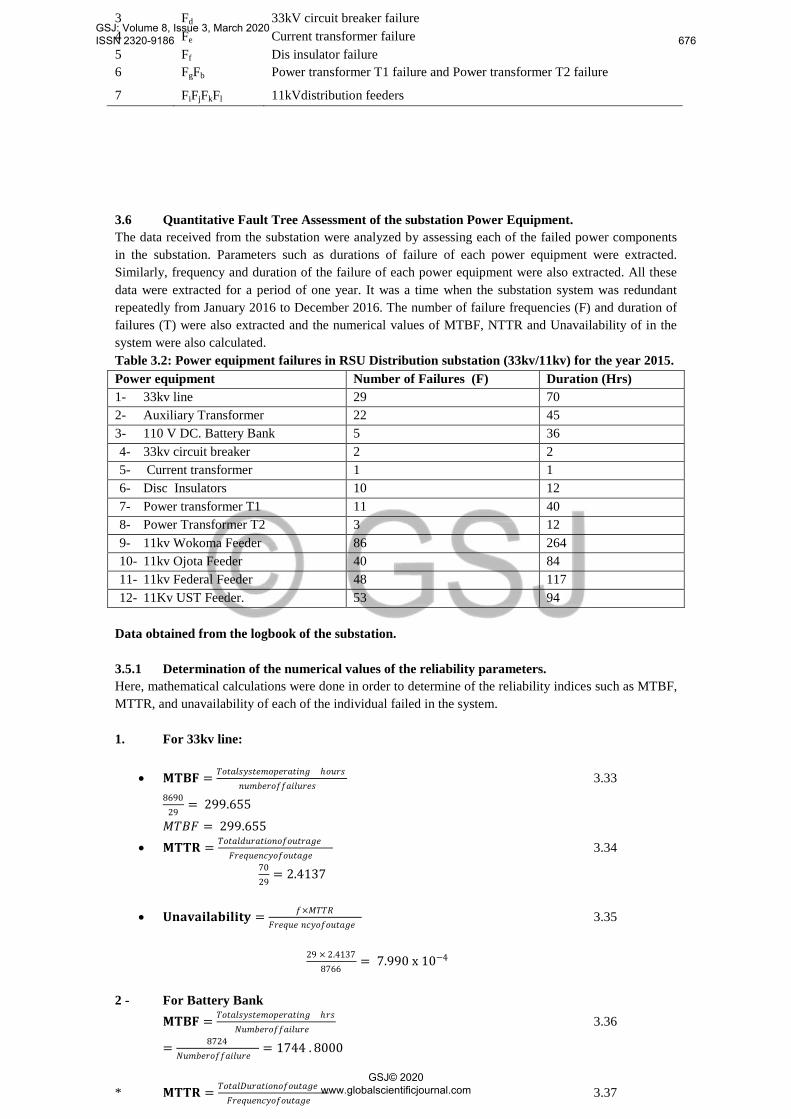
3 Fd 33kV circuit breaker failure 4 Fe Current transformer failure 5 Ff Dis insulator failure 6 FgFb Power transformer T1 failure and Power transformer T2 failure
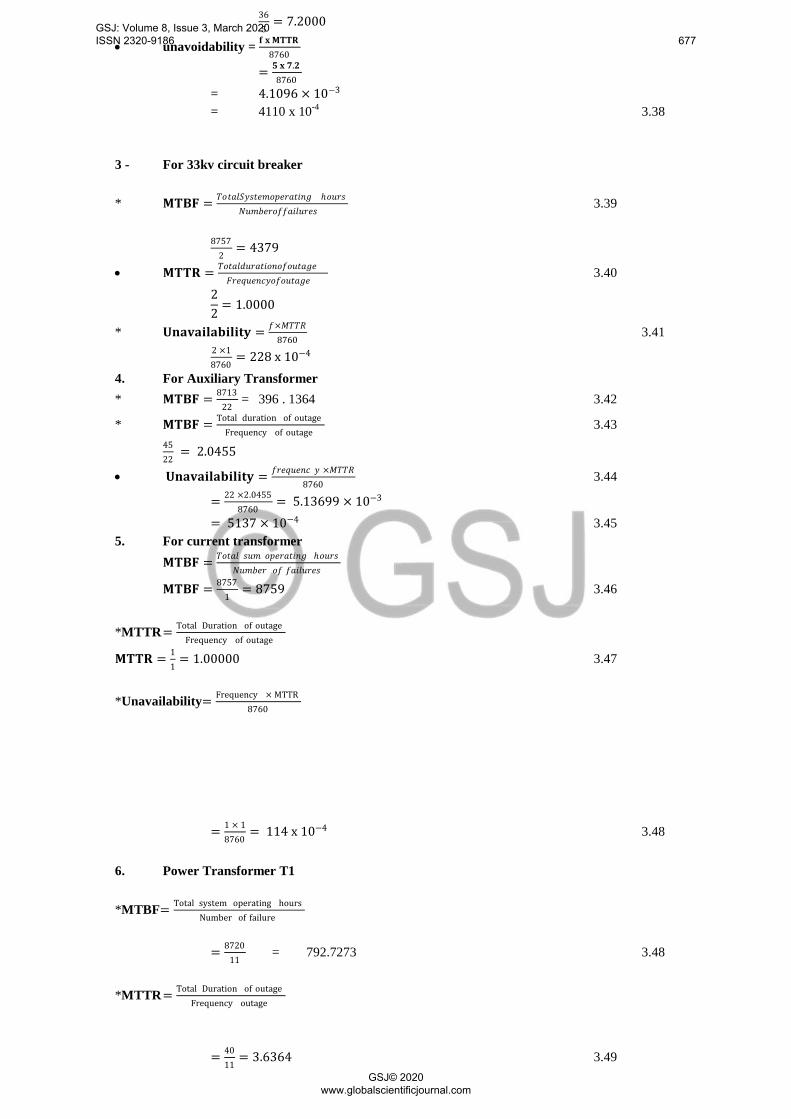
7 FiFjFkFl 11kVdistribution feeders 3.6 Quantitative Fault Tree Assessment of the substation Power Equipment. The data received from the substation were analyzed by assessing each of the failed power components in the substation. Parameters such as durations of failure of each power equipment were extracted. Similarly, frequency and duration of the failure of each power equipment were also extracted. All these data were extracted for a period of one year. It was a time when the substation system was redundant repeatedly from January 2016 to December 2016. The number of failure frequencies (F) and duration of failures (T) were also extracted and the numerical values of MTBF, NTTR and Unavailability of in the system were also calculated. Table 3.2: Power equipment failures in RSU Distribution substation (33kv/11kv) for the year 2015.
Data obtained from the logbook of the substation. 3.5.1 Determination of the numerical values of the reliability parameters. Here, mathematical calculations were done in order to determine of the reliability indices such as MTBF, MTTR, and unavailability of each of the individual failed in the system. 1. For 33kv line:
• 𝐌𝐌𝐌𝐌𝐌𝐌𝐌𝐌 = 𝑀𝑀𝑇𝑇𝑟𝑟𝐹𝐹𝐹𝐹𝑇𝑇𝑇𝑇𝑇𝑇𝑟𝑟𝐹𝐹𝑇𝑇𝑇𝑇𝑇𝑇𝐹𝐹𝐹𝐹𝐹𝐹𝑟𝑟𝐹𝐹𝑇𝑇𝑇𝑇 ℎ𝑇𝑇𝐹𝐹𝐹𝐹𝑇𝑇𝑇𝑇𝐹𝐹𝑇𝑇𝑛𝑛𝐹𝐹𝐹𝐹𝑇𝑇𝑛𝑛𝑛𝑛𝐹𝐹𝐹𝐹𝐹𝐹𝐹𝐹𝐹𝐹𝐹𝐹𝑇𝑇
3.33 8690
29= 299.655
𝑀𝑀𝑀𝑀𝑀𝑀𝐹𝐹 = 299.655 • 𝐌𝐌𝐌𝐌𝐌𝐌𝐌𝐌 = 𝑀𝑀𝑇𝑇𝑟𝑟𝐹𝐹𝐹𝐹𝑇𝑇𝐹𝐹𝐹𝐹𝐹𝐹𝑟𝑟𝐹𝐹𝑇𝑇𝑇𝑇𝑇𝑇𝑛𝑛𝑇𝑇𝐹𝐹𝑟𝑟𝐹𝐹𝐹𝐹𝑇𝑇𝐹𝐹
𝐹𝐹𝐹𝐹𝐹𝐹𝐹𝐹𝐹𝐹𝐹𝐹𝑇𝑇𝐹𝐹𝑇𝑇𝑇𝑇𝑛𝑛𝑇𝑇𝐹𝐹𝑟𝑟𝐹𝐹𝑇𝑇𝐹𝐹 3.34
7029
= 2.4137
• 𝐔𝐔𝐔𝐔𝐔𝐔𝐔𝐔𝐔𝐔𝐔𝐔𝐔𝐔𝐔𝐔𝐔𝐔𝐔𝐔𝐔𝐔𝐔𝐔𝐔𝐔𝐔𝐔 = 𝑛𝑛×𝑀𝑀𝑀𝑀𝑀𝑀𝑀𝑀𝐹𝐹𝐹𝐹𝐹𝐹𝐹𝐹𝐹𝐹𝐹𝐹 𝑇𝑇𝐹𝐹𝑇𝑇𝑇𝑇𝑛𝑛𝑇𝑇𝐹𝐹𝑟𝑟𝐹𝐹𝑇𝑇𝐹𝐹
3.35
29 × 2.4137
8766= 7.990 x 10⁻⁴
2 - For Battery Bank
𝐌𝐌𝐌𝐌𝐌𝐌𝐌𝐌 = 𝑀𝑀𝑇𝑇𝑟𝑟𝐹𝐹𝐹𝐹𝑇𝑇𝑇𝑇𝑇𝑇𝑟𝑟𝐹𝐹𝑇𝑇𝑇𝑇𝑇𝑇𝐹𝐹𝐹𝐹𝐹𝐹𝑟𝑟𝐹𝐹𝑇𝑇𝑇𝑇 ℎ𝐹𝐹𝑇𝑇𝑁𝑁𝐹𝐹𝑇𝑇𝑛𝑛𝐹𝐹𝐹𝐹𝑇𝑇𝑛𝑛𝑛𝑛𝐹𝐹𝐹𝐹𝐹𝐹𝐹𝐹𝐹𝐹𝐹𝐹
3.36
= 8724𝑁𝑁𝐹𝐹𝑇𝑇𝑛𝑛𝐹𝐹𝐹𝐹𝑇𝑇𝑛𝑛𝑛𝑛𝐹𝐹𝐹𝐹𝐹𝐹𝐹𝐹𝐹𝐹𝐹𝐹
= 1744 . 8000
* 𝐌𝐌𝐌𝐌𝐌𝐌𝐌𝐌 = 𝑀𝑀𝑇𝑇𝑟𝑟𝐹𝐹𝐹𝐹𝑇𝑇𝐹𝐹𝐹𝐹𝐹𝐹𝑟𝑟𝐹𝐹𝑇𝑇𝑇𝑇𝑇𝑇𝑛𝑛𝑇𝑇𝐹𝐹𝑟𝑟𝐹𝐹𝑇𝑇𝐹𝐹
𝐹𝐹𝐹𝐹𝐹𝐹𝐹𝐹𝐹𝐹𝐹𝐹𝑇𝑇𝐹𝐹𝑇𝑇𝑇𝑇𝑛𝑛𝑇𝑇𝐹𝐹𝑟𝑟𝐹𝐹𝑇𝑇𝐹𝐹 3.37
Power equipment Number of Failures (F) Duration (Hrs) 1- 33kv line 29 70 2- Auxiliary Transformer 22 45 3- 110 V DC. Battery Bank 5 36 4- 33kv circuit breaker 2 2 5- Current transformer 1 1 6- Disc Insulators 10 12 7- Power transformer T1 11 40 8- Power Transformer T2 3 12 9- 11kv Wokoma Feeder 86 264 10- 11kv Ojota Feeder 40 84 11- 11kv Federal Feeder 48 117 12- 11Kv UST Feeder. 53 94
GSJ: Volume 8, Issue 3, March 2020 ISSN 2320-9186 676
GSJ© 2020 www.globalscientificjournal.com
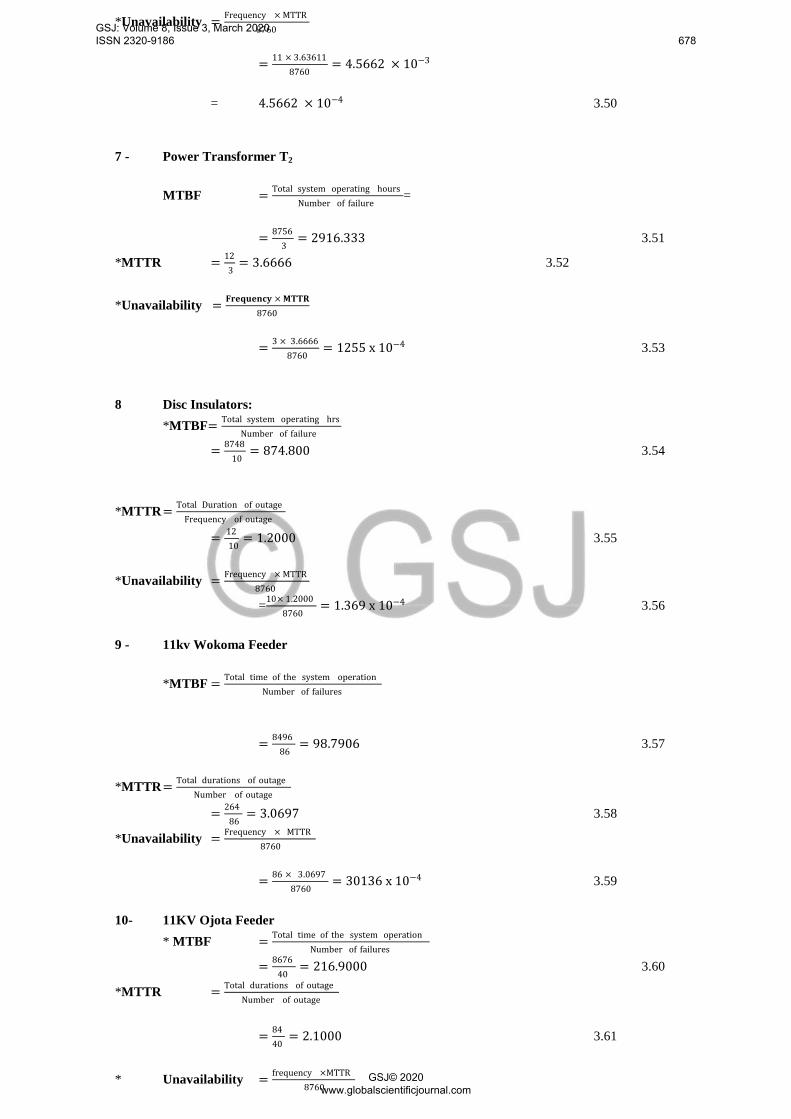
365
= 7.2000
• unavoidability = 𝐟𝐟 𝐱𝐱 𝐌𝐌𝐌𝐌𝐌𝐌𝐌𝐌 8760
= 𝟓𝟓 𝐱𝐱 𝟕𝟕.𝟐𝟐 8760
= 4.1096 × 10−3
= 4110 x 10-4 3.38
3 - For 33kv circuit breaker * 𝐌𝐌𝐌𝐌𝐌𝐌𝐌𝐌 = 𝑀𝑀𝑇𝑇𝑟𝑟𝐹𝐹𝐹𝐹𝑡𝑡𝑇𝑇𝑇𝑇𝑟𝑟𝐹𝐹𝑇𝑇𝑇𝑇𝑇𝑇𝐹𝐹𝐹𝐹𝐹𝐹𝑟𝑟𝐹𝐹𝑇𝑇𝑇𝑇 ℎ𝑇𝑇𝐹𝐹𝐹𝐹𝑇𝑇
𝑁𝑁𝐹𝐹𝑇𝑇𝑛𝑛𝐹𝐹𝐹𝐹𝑇𝑇𝑛𝑛𝑛𝑛𝐹𝐹𝐹𝐹𝐹𝐹𝐹𝐹𝐹𝐹𝐹𝐹𝑇𝑇 3.39
8757
2= 4379
• 𝐌𝐌𝐌𝐌𝐌𝐌𝐌𝐌 = 𝑀𝑀𝑇𝑇𝑟𝑟𝐹𝐹𝐹𝐹𝑇𝑇𝐹𝐹𝐹𝐹𝐹𝐹𝑟𝑟𝐹𝐹𝑇𝑇𝑇𝑇𝑇𝑇𝑛𝑛𝑇𝑇𝐹𝐹𝑟𝑟𝐹𝐹𝑇𝑇𝐹𝐹𝐹𝐹𝐹𝐹𝐹𝐹𝐹𝐹𝐹𝐹𝐹𝐹𝑇𝑇𝐹𝐹𝑇𝑇𝑇𝑇𝑛𝑛𝑇𝑇𝐹𝐹𝑟𝑟𝐹𝐹𝑇𝑇𝐹𝐹
3.40 22
= 1.0000
* 𝐔𝐔𝐔𝐔𝐔𝐔𝐔𝐔𝐔𝐔𝐔𝐔𝐔𝐔𝐔𝐔𝐔𝐔𝐔𝐔𝐔𝐔𝐔𝐔𝐔𝐔𝐔𝐔 = 𝑛𝑛×𝑀𝑀𝑀𝑀𝑀𝑀𝑀𝑀8760
3.41
2 ×18760
= 228 x 10−4 4. For Auxiliary Transformer * 𝐌𝐌𝐌𝐌𝐌𝐌𝐌𝐌 = 8713
22 = 396 . 1364 3.42
* 𝐌𝐌𝐌𝐌𝐌𝐌𝐌𝐌 = Total duration of outageFrequency of outage
3.43 4522
= 2.0455
• 𝐔𝐔𝐔𝐔𝐔𝐔𝐔𝐔𝐔𝐔𝐔𝐔𝐔𝐔𝐔𝐔𝐔𝐔𝐔𝐔𝐔𝐔𝐔𝐔𝐔𝐔𝐔𝐔 = 𝑛𝑛𝐹𝐹𝐹𝐹𝐹𝐹𝐹𝐹𝐹𝐹𝑇𝑇𝐹𝐹 𝑇𝑇 ×𝑀𝑀𝑀𝑀𝑀𝑀𝑀𝑀8760
3.44
= 22 ×2.04558760
= 5.13699 × 10−3 = 5137 × 10−4 3.45 5. For current transformer 𝐌𝐌𝐌𝐌𝐌𝐌𝐌𝐌 = 𝑀𝑀𝑇𝑇𝑟𝑟𝐹𝐹𝐹𝐹 𝑇𝑇𝐹𝐹𝑇𝑇 𝑇𝑇𝑇𝑇𝐹𝐹𝐹𝐹𝐹𝐹𝑟𝑟𝐹𝐹𝑇𝑇𝑇𝑇 ℎ𝑇𝑇𝐹𝐹𝐹𝐹𝑇𝑇
𝑁𝑁𝐹𝐹𝑇𝑇𝑛𝑛𝐹𝐹𝐹𝐹 𝑇𝑇𝑛𝑛 𝑛𝑛𝐹𝐹𝐹𝐹𝐹𝐹𝐹𝐹𝐹𝐹𝐹𝐹𝑇𝑇
𝐌𝐌𝐌𝐌𝐌𝐌𝐌𝐌 = 87571
= 8759 3.46 *MTTR = Total Duration of outage
Frequency of outage
𝐌𝐌𝐌𝐌𝐌𝐌𝐌𝐌 = 11
= 1.00000 3.47 *Unavailability= Frequency × MTTR
8760
= 1 × 1
8760= 114 x 10−4 3.48
6. Power Transformer T1 *MTBF= Total system operating hours
Number of failure
= 8720
11 = 792.7273 3.48
*MTTR = Total Duration of outage
Frequency outage
= 40
11= 3.6364 3.49
GSJ: Volume 8, Issue 3, March 2020 ISSN 2320-9186 677
GSJ© 2020 www.globalscientificjournal.com
*Unavailability = Frequency × MTTR8760
= 11 × 3.63611
8760= 4.5662 × 10−3
= 4.5662 × 10⁻⁴ 3.50 7 - Power Transformer T2
MTBF = Total system operating hours
Number of failure=
= 8756
3= 2916.333 3.51
*MTTR = 12 3
= 3.6666 3.52 *Unavailability = 𝐌𝐌𝐅𝐅𝐅𝐅𝐅𝐅𝐅𝐅𝐅𝐅𝐔𝐔𝐅𝐅𝐔𝐔 × 𝐌𝐌𝐌𝐌𝐌𝐌𝐌𝐌
8760
= 3 × 3.6666
8760= 1255 x 10−4 3.53
8 Disc Insulators: *MTBF= Total system operating hrs
Number of failure
= 8748 10
= 874.800 3.54 *MTTR = Total Duration of outage
Frequency of outage
= 12 10
= 1.2000 3.55 *Unavailability = Frequency × MTTR
8760
=10× 1.2000 8760
= 1.369 x 10⁻⁴ 3.56 9 - 11kv Wokoma Feeder *MTBF = Total time of the system operation
Number of failures
= 8496
86 = 98.7906 3.57
*MTTR = Total durations of outage
Number of outage
= 264 86
= 3.0697 3.58
*Unavailability = Frequency × MTTR 8760
= 86 × 3.0697
8760 = 30136 x 10−4 3.59
10- 11KV Ojota Feeder * MTBF = Total time of the system operation
Number of failures
= 8676 40
= 216.9000 3.60
*MTTR = Total durations of outage Number of outage
= 84
40 = 2.1000 3.61
* Unavailability = frequency ×MTTR
8760
GSJ: Volume 8, Issue 3, March 2020 ISSN 2320-9186 678
GSJ© 2020 www.globalscientificjournal.com
= 40 x 2.1
8760 = 9589 × 10−4 3.62
11- 11KV Federal Feeder * MTBF = Total time of the system operation
Number of failures
= 8643 48
= 180 . 0625 3.63 * MTTR = Total durations of outage
Number of outage
117
48 = 2.4375 3.64
* Unavailability = = Frequency × MTTR
8760
= 48 × 2.4375
8760 = 13356 × 10−4 3.65
12- 11KV UST FEEDER * MTBF = Total system operating hrs
Number of failure
= 8666 53
= 163.5094 3.66 *MTTR = Total Duration of Outage
Frequency of outage
= 94 53
= 1.7735 3.67 * Unavailability = = Frequency × MTTR 1
8760
= 53 × 1.7735 8760
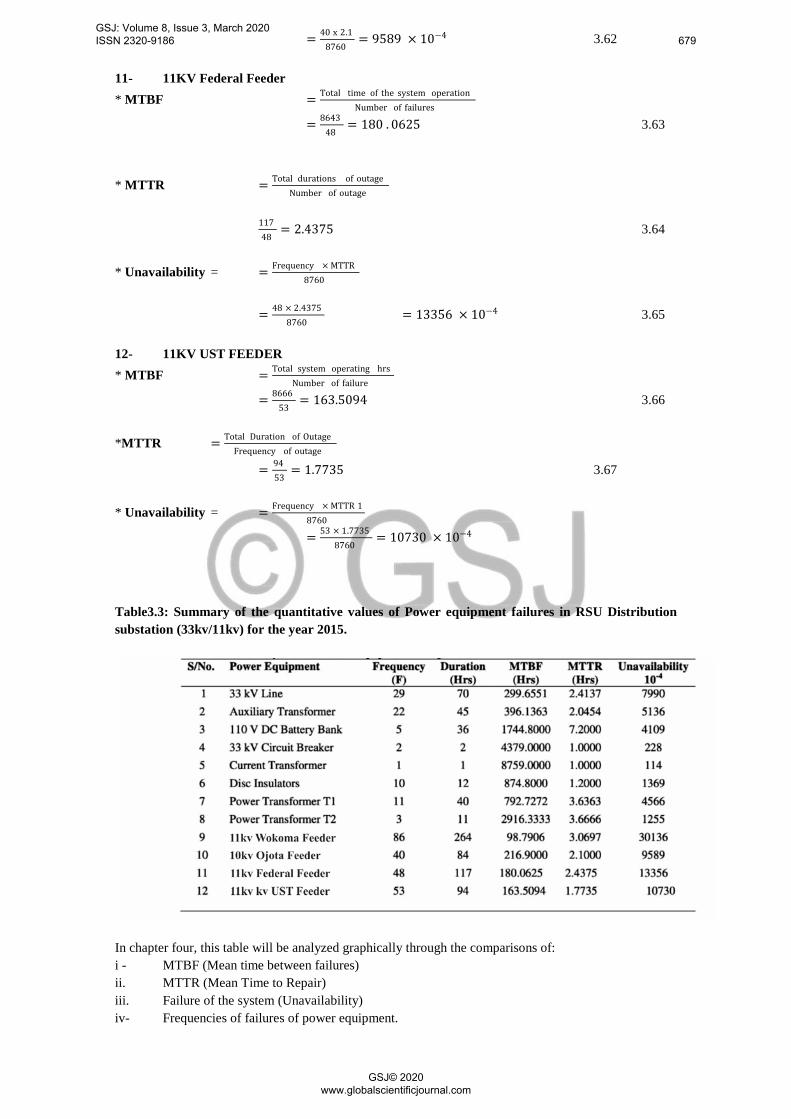
= 10730 × 10−4 Table3.3: Summary of the quantitative values of Power equipment failures in RSU Distribution substation (33kv/11kv) for the year 2015.
In chapter four, this table will be analyzed graphically through the comparisons of: i - MTBF (Mean time between failures) ii. MTTR (Mean Time to Repair) iii. Failure of the system (Unavailability) iv- Frequencies of failures of power equipment.
GSJ: Volume 8, Issue 3, March 2020 ISSN 2320-9186 679
GSJ© 2020 www.globalscientificjournal.com
IV. RESULTS AND DISCUSSIONS.
4.1 Overview
In this chapter, the reliability assessment or evaluation of the distribution system will be done in details,
whereby the FTA technique will be employed to carry out the quantitative analysis of the 33/11kv
distribution substation of RSU. The logbooks of the substation were used as data received. The
quantitative fault tree analysis was done using Boolean algebra, the probability expression and reliability
indices such as MTBF, MTTR, and unavailability of a power in the system based on the durations and
frequencies of the outages, as shown in chapter three.
A table of values was obtained based on the reliability parameters and graphical representations were
carried out in form of bar charts to explain the results.
4.2 Data Collected from Rivers State University Distribution Substation (33/11KV)
The data was collected from the substation logbook. These following components of the substation were
the power equipment on which the data was collected for the year 2015.
i) 33KV line
ii) 110 V.D.C Battery Bank
iii) Auxiliary Transformer
iv) Current transformer
v) 33. V Circuit Breakers
vi) Disc Insulators
vii) Power Transformer T1
viii) Power Transformer T2
ix) 11kv Wokoma Feeder
x) 11kv Ojota Feeder
xi) Federal Feeder
xii) 11KV RSU / Eagle Island Feeder.
These components were the potential component failures in the substation causing the system
unavailability or failure. The outages frequencies and durations shown in the table 3.
The table reflects the outages in the power supply of the substation as a result of the breakdown in the
system. The table also shows the frequency duration of each of the failed components.
GSJ: Volume 8, Issue 3, March 2020 ISSN 2320-9186 680
GSJ© 2020 www.globalscientificjournal.com
4.3 The major Causes of power failure in a distribution system
Through a survey study over the operations of power equipment of the distribution system in order to
uncover the root-cause of the system failure, it is discovered that there are usually three types of failures
in power system: teething failure, random failure and aging failure[15] . Electrical failure caused by
external factors such as lightning, environmental factors like a falling of tree is called random failure.
Aging failure is the failure caused by the aging of power equipment in the substation.
Installation error of the equipment, manufacturing mistake or transportation damage and improper
handling of the power equipment can also cause the teething failing of the equipmentl[16]. Aging
problems of power components of substation can be caused by the reduction in strength of the
component both electrically and mechanically.
Before embarking on the reliability analysis of the distribution substation, it is therefore important that
the root-causes of the faults or failures are well understood.
4.3.1 Line Faults
Power sector in Nigeria has a myriad of problems, line faults are inclusive too. By transmission,
overhead lines usually feed the substations and also deliver power to the end-users. The lines are also
used as underground cables for conduit. The lines are protected by insulating material for underground
cables. Air is the insulator for overhead lines, which makes the lines to more vulnerable to environmental
hazards. There three types of line faults in transmission: line to line fault, line to ground fault and double
lines to ground fault.
Temperature has little or no impact on the overhead lines due to the air, which makes them to withstand
the flow of high currents. Nevertheless, the reliability assessment of the overhead lines can greatly be
influenced by high currents in every aspect of power transmission[17] Since electrical conductors have
specific dielectric strengths with thermal limits, sometimes they fail to clear heavy fault currents. As
result of that, the conductors are often heated up to the point of melting due high currents. And this can
be caused by overloading of the conductors.
The conductors can melt and burn up by the heat. In addition, there is the increasing chance of phase
conductors swinging into contact when lines say due to high current that may be as a result of
overloading.
Because of the overheating, the electrical wires will lose their tensile strength and get broken up in the
process. Sometimes, higher currents make the wires to break as a result of reduced tensile strength. This,
phenomenon will eventually lesson the reliability of the overhead lines, auxiliary power components will
be cut out, switches will be blown out…etc[16].
GSJ: Volume 8, Issue 3, March 2020 ISSN 2320-9186 681
GSJ© 2020 www.globalscientificjournal.com
4.3.7 Electric Pole Faults
Electrical Poles are of two types, concrete type and wooden type. Being part of the power system,
structurally they serve in the transmission and distribution of electricity. The overhead lines and the
distribution lines are carried by the poles from location to location. Falling of electrical pole either by
accident or environmental occurrences like a tree falling and tornado, can cause in the distribution
system. The safety and conditions of the conductors carried by the poles can also contribute to reliability
of the distribution system. When poles are faulty or deteriorated by usage, replacement should be made
quickly as soon as possible before the conductors will fall on bare floor. This can pose a danger to the
environment in terms of electrocution. When electric poles are bent by the wind force, or the wires are
damaged or getting weak, this at times leads to power outage in the system. Therefore, in the reliability
assessment of a distribution substation, the electric poles have to be put into consideration as well as
other power equipment in the substation.
4.3.3 Transformers failure
There are different types of transformers: power transformer, current transformer and voltage
transformer. These transformers are important and major power equipment in a substation. They play a
major role in power sector. From transmission or distribution, lines, they step up or step down the
incoming power in order to regulate the power to be distributed to the end-users. Hence, a transformer
failure can cause a potential breakdown in the entire distribution system. With our distribution substation
systems here in Nigeria, whenever a transformer fails it takes weeks or months before it will be fixed or
replaced; such a situation often creates a distortion in the system. Transformer faults can come from the
windings or the core coils, insulation breakdown, or oil leakage from the oil tank. These faults can be
generated by overloading, overheating and also by the failure of the protection system of the transformer.
In same vein, the external faults which, due to lack maintenance, will finally end up getting into interior
parts and cause a damage. Other faults such as mechanical parts being loose, failure of the load tap
changer can also cause a damage transformer. Since transformer failures can impair the performance of
the distribution system, the reliability evaluation of the system should be inclusive of the reliability
assessment of the power equipment like transformers.
The maintenance and repair scheme should be available in our substations to enhance the performance of
the transformers thereby mitigating the transformer failures due to overloads, regulating the temperature
rise that can cause overheating. Improving the performance of transformers through maintenance and
replacement scheme, Nigeria engineers may end up having a reliable distribution system.
4.3.4 Circuit Breaker (CB) Faults
GSJ: Volume 8, Issue 3, March 2020 ISSN 2320-9186 682
GSJ© 2020 www.globalscientificjournal.com
CB, in power distribution system, serves as a switching and protective device which can make and close
the system under normal operating conditions but can also open or break the system under abnormal
conditions for specified period of time. In other words, CB is a protective device that clears faults
occurring in the system without damaging the system. As one of the critical power equipment in the
distribution substation, a circuit breaker is deemed to function appropriately whenever the system in
operation. In terms of a problem, circuit breakers should be sensitive and fast enough to trip off without
disturbing the operation of the system., When CB are exposed to faults, there would be failure to open
the circuit and clear the fault immediately, failure to close the circuit after the fault was cleared. These
failures can be caused by the loosing of the tripping contacts or the wearing of the mechanical parts due
to aging. The reliability analysis of the individual power components should also be extended to the
circuit breakers in order to determine to what extent their failures impact the reliability of the distribution
system.
Maintenance and repair activities can be carried out to fix the faulty circuit breakers. Also the protective
relays be checked constantly for the whole system to work well. Even wrong wiring can cause CBs to
fail, which in turn will lead to the system failure.
4.3.5 Lightening Strike
As a natural phenomenon occurrence, lightning has a negative impact on the power distribution system
by striking through the power contacts of the system or objects in close range with the power contacts. It
is a phenomenon that when happening evolves a travelling voltage wave called a surge. When lightning
strike, it can blow off some power equipment and cause a sudden rise of voltage which affects the
distribution system. The distribution system can be protected against the lightning effect by using surge
arrestors which can be on the poles carrying the cables. Sometimes, induced high voltage is as result of
the surge which may cause a serious damage to the distribution system.
4.4 Graphical (Bar Chart) Evaluation and Analysis of the Distribution System
In the course of the reliability assessment of the power equipment in the distribution substation, the
reliability parameters such as MTBF, MTTF and unavailability have been calculated using the reliability
expressions as displayed in the previous chapter. At the end of the qualitative and quantitative
assessment of the individual power components, the reliability parameters were calculated based on each
component’s frequency and duration of the failure. The computed values were contained in a
comprehensive table and a graphical representation of each of the component was displayed in form of
bar chat.
GSJ: Volume 8, Issue 3, March 2020 ISSN 2320-9186 683
GSJ© 2020 www.globalscientificjournal.com
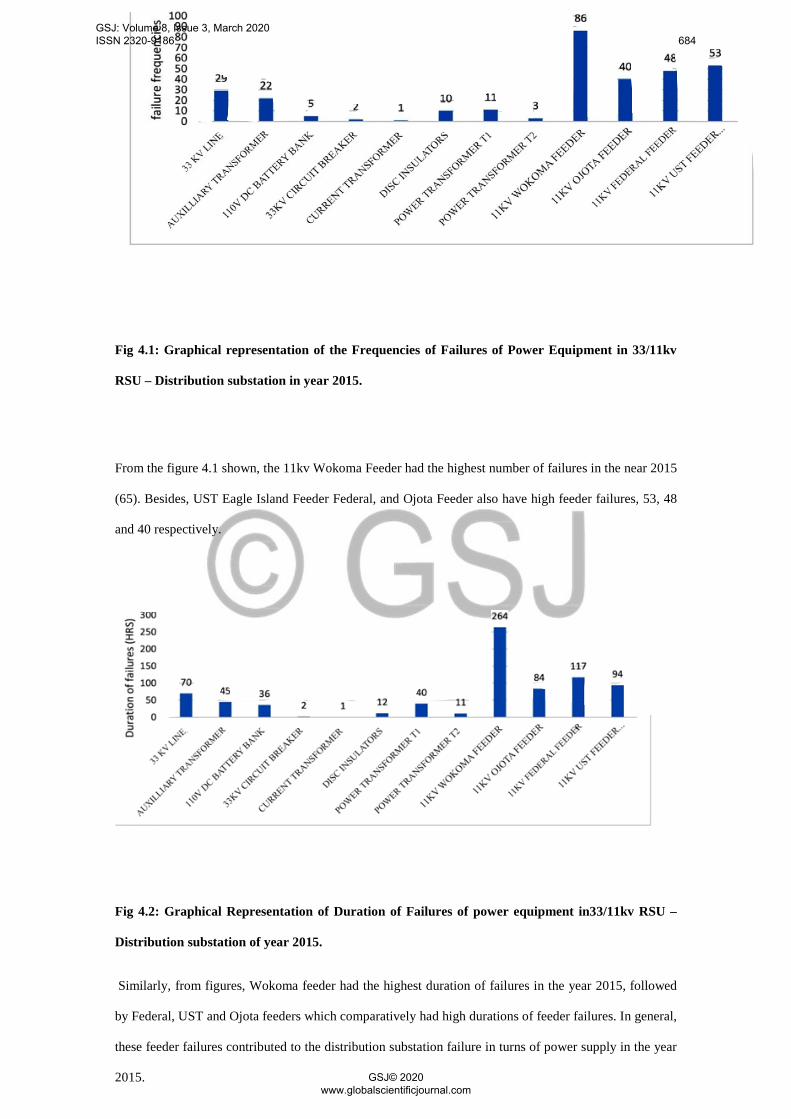
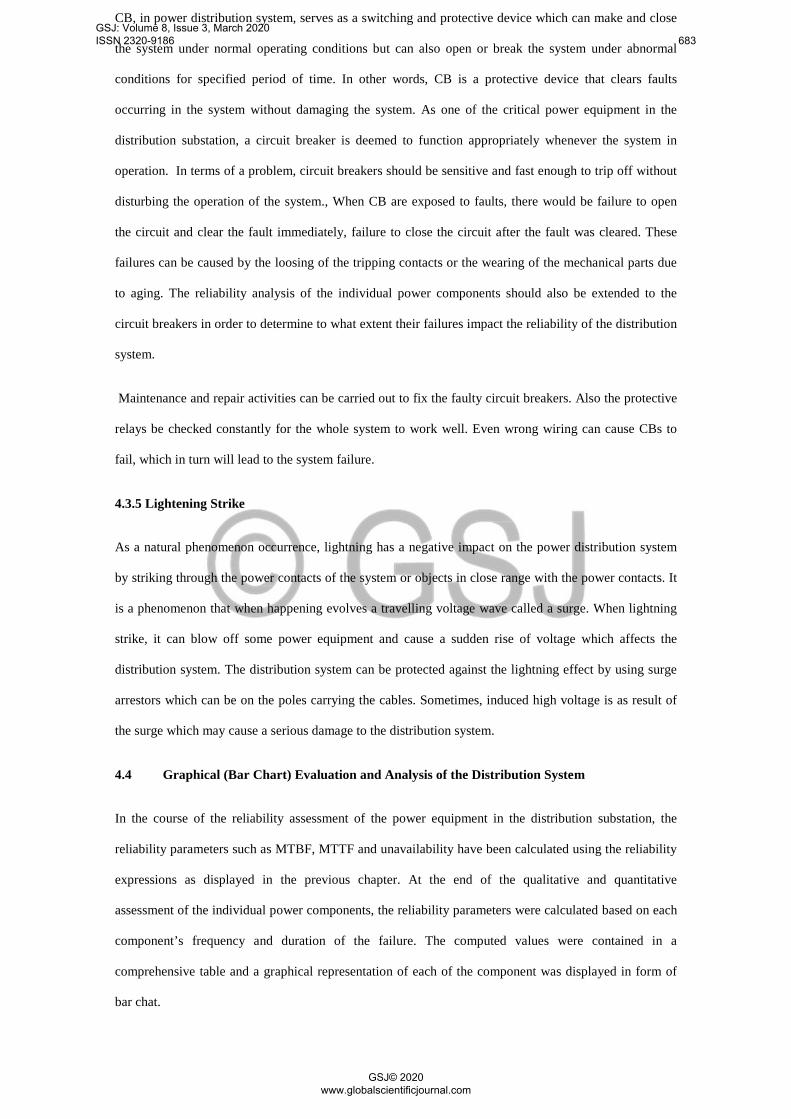
Fig 4.1: Graphical representation of the Frequencies of Failures of Power Equipment in 33/11kv
RSU – Distribution substation in year 2015.
From the figure 4.1 shown, the 11kv Wokoma Feeder had the highest number of failures in the near 2015
(65). Besides, UST Eagle Island Feeder Federal, and Ojota Feeder also have high feeder failures, 53, 48
and 40 respectively.
Fig 4.2: Graphical Representation of Duration of Failures of power equipment in33/11kv RSU –
Distribution substation of year 2015.
Similarly, from figures, Wokoma feeder had the highest duration of failures in the year 2015, followed
by Federal, UST and Ojota feeders which comparatively had high durations of feeder failures. In general,
these feeder failures contributed to the distribution substation failure in turns of power supply in the year
2015.
GSJ: Volume 8, Issue 3, March 2020 ISSN 2320-9186 684
GSJ© 2020 www.globalscientificjournal.com
The causes of the feeder breakdown can be linked to exposure to environmental hazards and also to
aging or insulation failure. It is hence important to work on the faulty feeders and improve their
performance, thereby enhance the reliability of the system.
4.4.1 Graphical (bar chart) Representation of the MTBF of the substation power equipment.
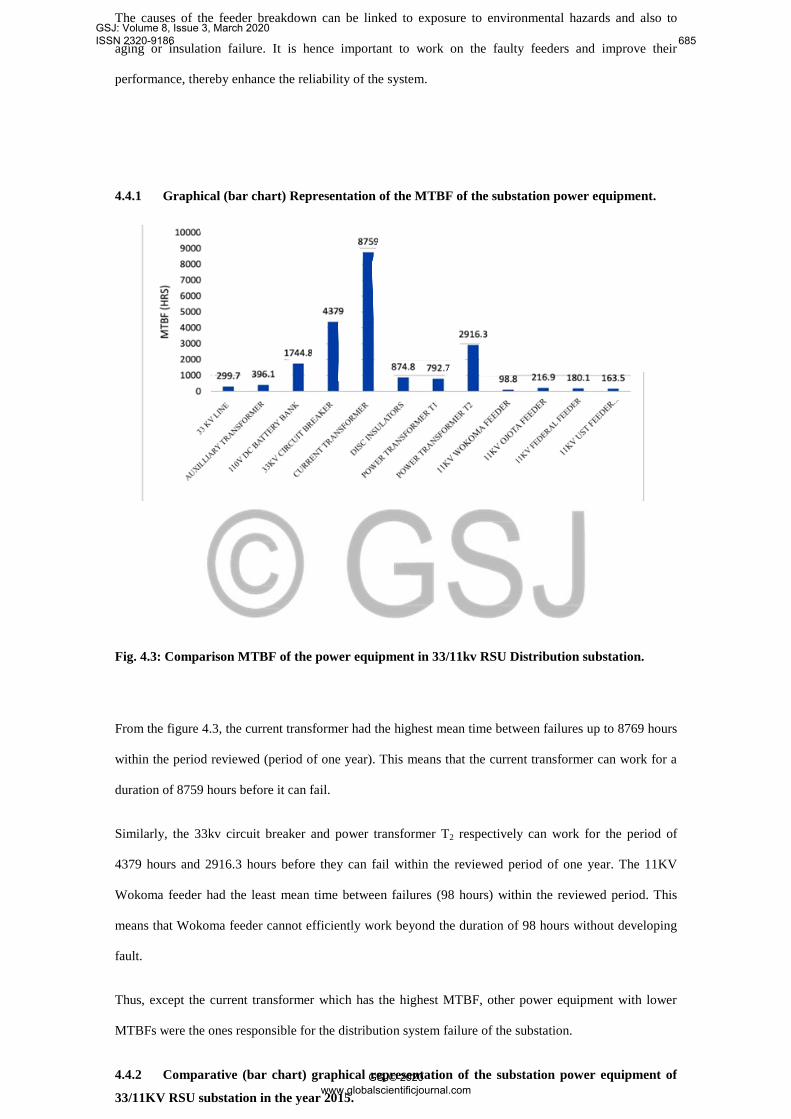
Fig. 4.3: Comparison MTBF of the power equipment in 33/11kv RSU Distribution substation.
From the figure 4.3, the current transformer had the highest mean time between failures up to 8769 hours
within the period reviewed (period of one year). This means that the current transformer can work for a
duration of 8759 hours before it can fail.
Similarly, the 33kv circuit breaker and power transformer T2 respectively can work for the period of
4379 hours and 2916.3 hours before they can fail within the reviewed period of one year. The 11KV
Wokoma feeder had the least mean time between failures (98 hours) within the reviewed period. This
means that Wokoma feeder cannot efficiently work beyond the duration of 98 hours without developing
fault.
Thus, except the current transformer which has the highest MTBF, other power equipment with lower
MTBFs were the ones responsible for the distribution system failure of the substation.
4.4.2 Comparative (bar chart) graphical representation of the substation power equipment of
33/11KV RSU substation in the year 2015.
GSJ: Volume 8, Issue 3, March 2020 ISSN 2320-9186 685
GSJ© 2020 www.globalscientificjournal.com
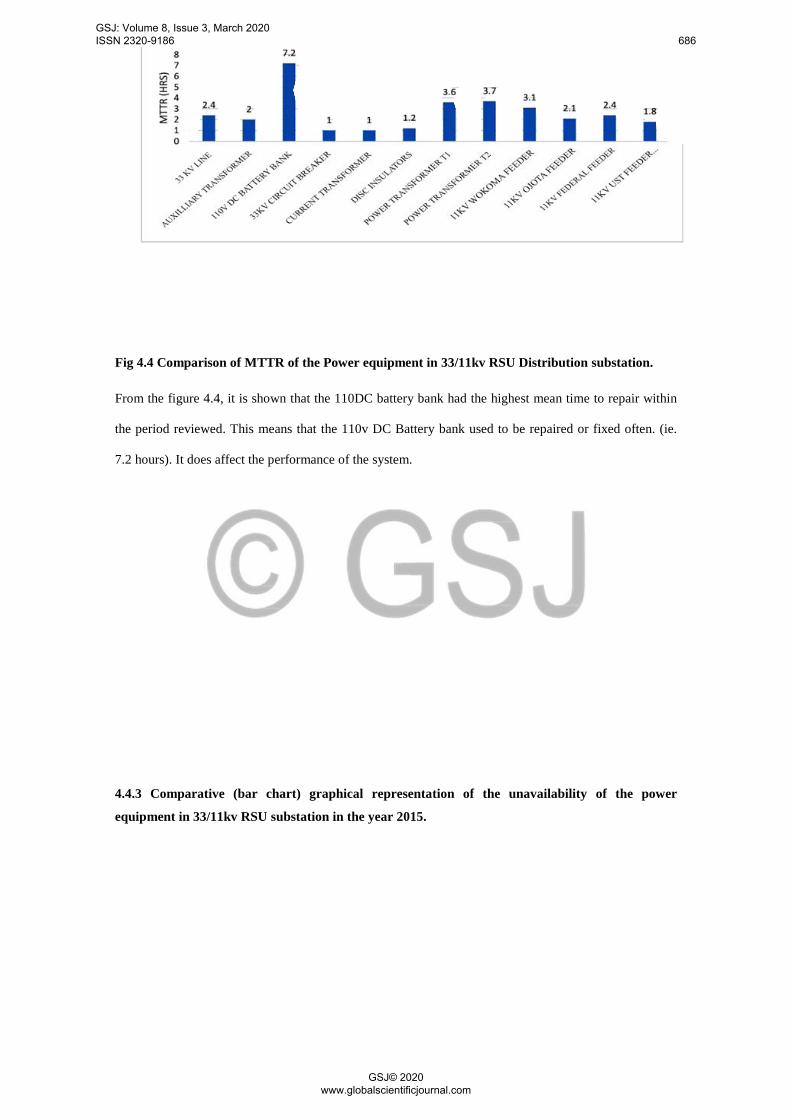
Fig 4.4 Comparison of MTTR of the Power equipment in 33/11kv RSU Distribution substation.
From the figure 4.4, it is shown that the 110DC battery bank had the highest mean time to repair within
the period reviewed. This means that the 110v DC Battery bank used to be repaired or fixed often. (ie.
7.2 hours). It does affect the performance of the system.
4.4.3 Comparative (bar chart) graphical representation of the unavailability of the power
equipment in 33/11kv RSU substation in the year 2015.
GSJ: Volume 8, Issue 3, March 2020 ISSN 2320-9186 686
GSJ© 2020 www.globalscientificjournal.com
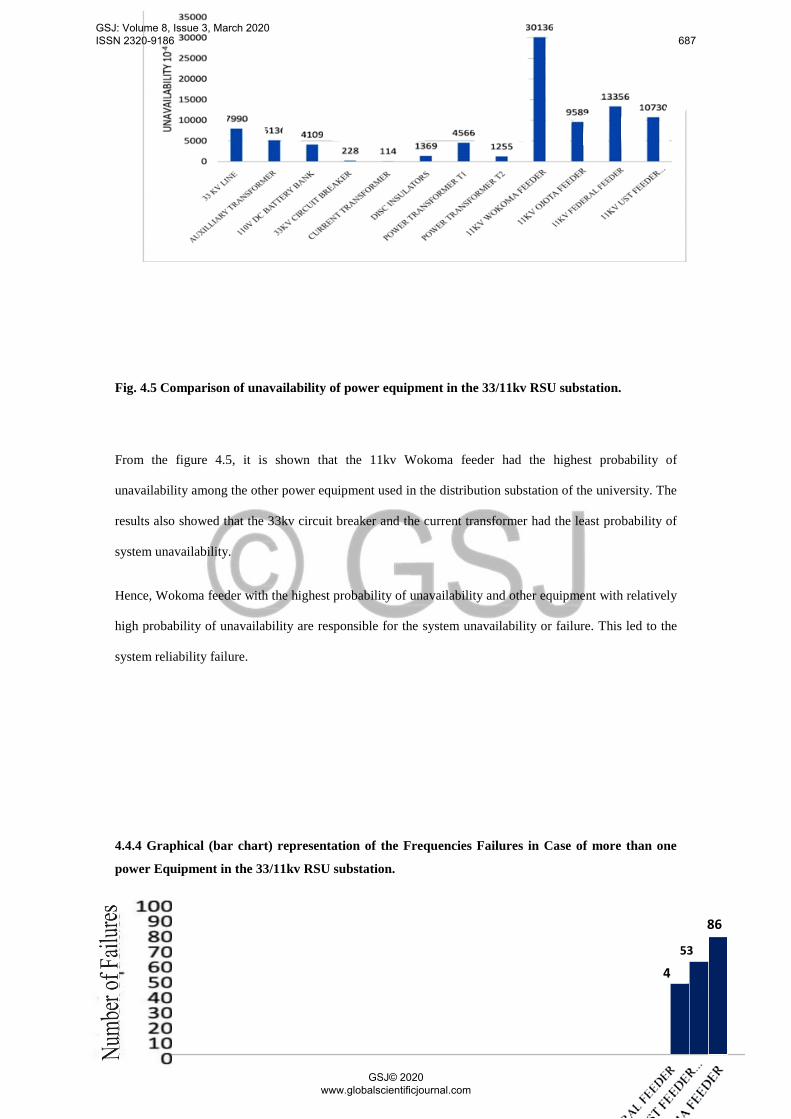
Fig. 4.5 Comparison of unavailability of power equipment in the 33/11kv RSU substation.
From the figure 4.5, it is shown that the 11kv Wokoma feeder had the highest probability of
unavailability among the other power equipment used in the distribution substation of the university. The
results also showed that the 33kv circuit breaker and the current transformer had the least probability of
system unavailability.
Hence, Wokoma feeder with the highest probability of unavailability and other equipment with relatively
high probability of unavailability are responsible for the system unavailability or failure. This led to the
system reliability failure.
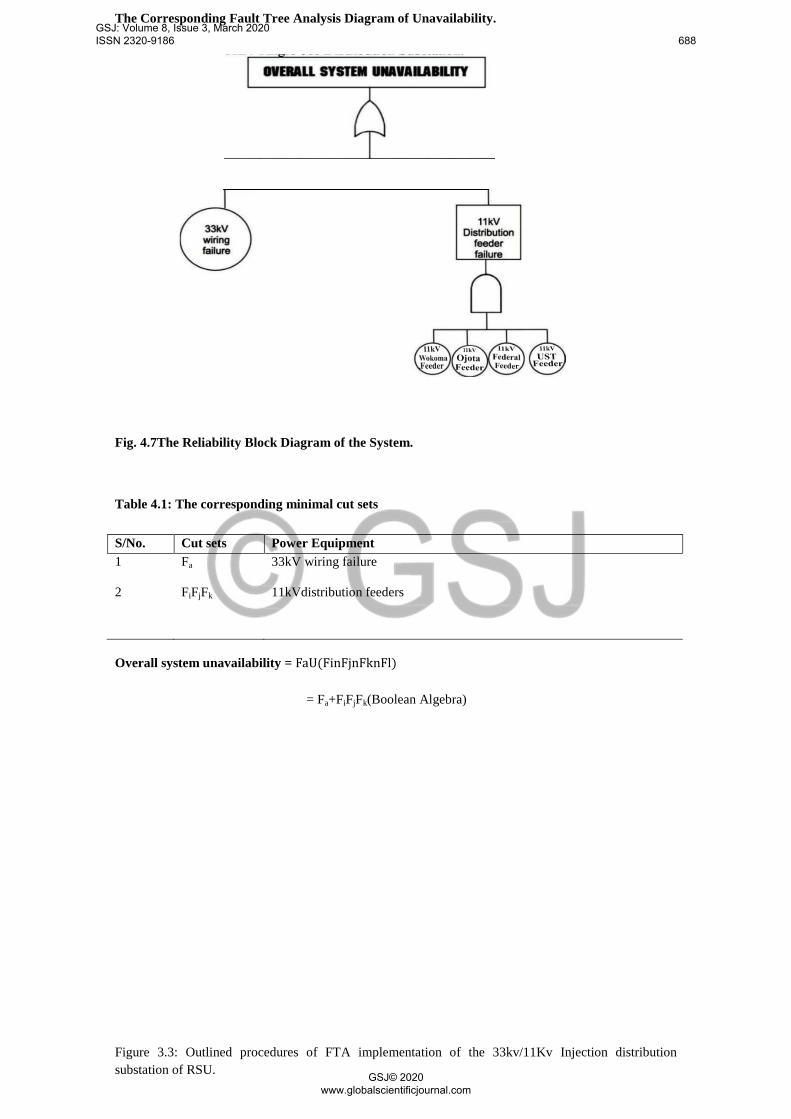
4.4.4 Graphical (bar chart) representation of the Frequencies Failures in Case of more than one
power Equipment in the 33/11kv RSU substation.
86 53
4
GSJ: Volume 8, Issue 3, March 2020 ISSN 2320-9186 687
GSJ© 2020 www.globalscientificjournal.com
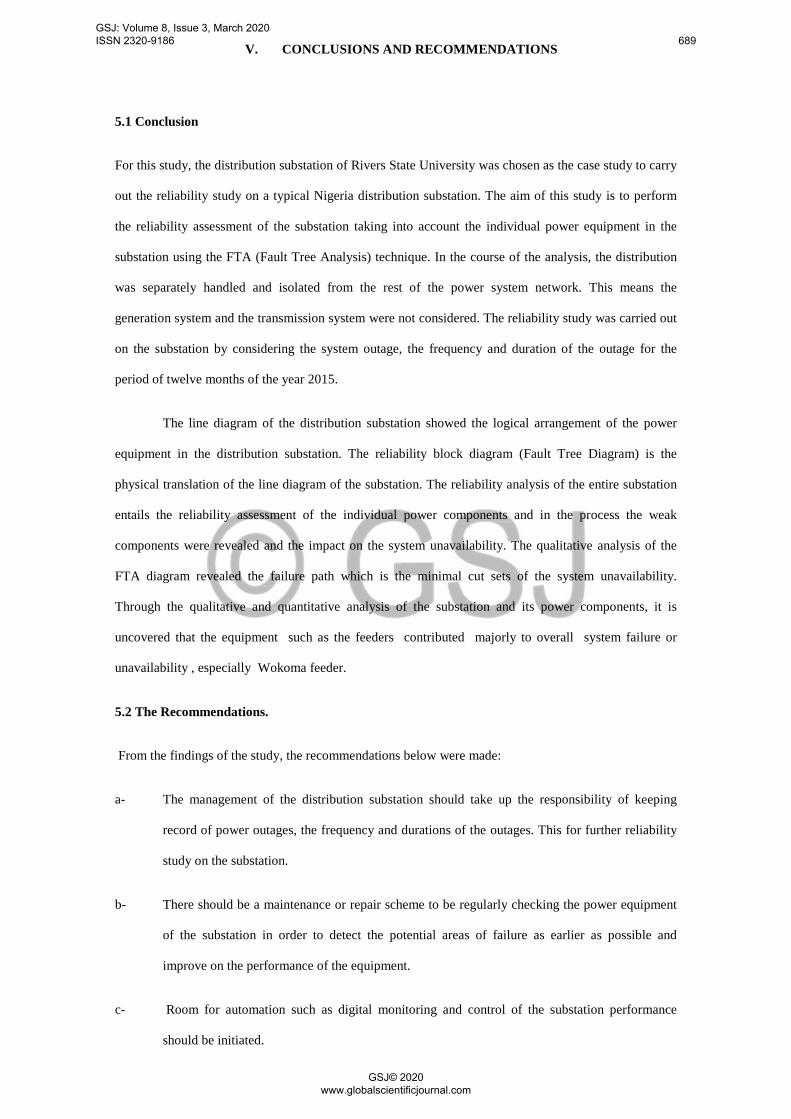
The Corresponding Fault Tree Analysis Diagram of Unavailability.
Fig. 4.7The Reliability Block Diagram of the System.
Table 4.1: The corresponding minimal cut sets
S/No. Cut sets Power Equipment 1 Fa 33kV wiring failure
2 FiFjFk 11kVdistribution feeders Overall system unavailability = FaU(FinFjnFknFl)
= Fa+FiFjFk(Boolean Algebra)
Figure 3.3: Outlined procedures of FTA implementation of the 33kv/11Kv Injection distribution substation of RSU.
GSJ: Volume 8, Issue 3, March 2020 ISSN 2320-9186 688
GSJ© 2020 www.globalscientificjournal.com
V. CONCLUSIONS AND RECOMMENDATIONS
5.1 Conclusion
For this study, the distribution substation of Rivers State University was chosen as the case study to carry
out the reliability study on a typical Nigeria distribution substation. The aim of this study is to perform
the reliability assessment of the substation taking into account the individual power equipment in the
substation using the FTA (Fault Tree Analysis) technique. In the course of the analysis, the distribution
was separately handled and isolated from the rest of the power system network. This means the
generation system and the transmission system were not considered. The reliability study was carried out
on the substation by considering the system outage, the frequency and duration of the outage for the
period of twelve months of the year 2015.
The line diagram of the distribution substation showed the logical arrangement of the power
equipment in the distribution substation. The reliability block diagram (Fault Tree Diagram) is the
physical translation of the line diagram of the substation. The reliability analysis of the entire substation
entails the reliability assessment of the individual power components and in the process the weak
components were revealed and the impact on the system unavailability. The qualitative analysis of the
FTA diagram revealed the failure path which is the minimal cut sets of the system unavailability.
Through the qualitative and quantitative analysis of the substation and its power components, it is
uncovered that the equipment such as the feeders contributed majorly to overall system failure or
unavailability , especially Wokoma feeder.
5.2 The Recommendations.
From the findings of the study, the recommendations below were made:
a- The management of the distribution substation should take up the responsibility of keeping
record of power outages, the frequency and durations of the outages. This for further reliability
study on the substation.
b- There should be a maintenance or repair scheme to be regularly checking the power equipment
of the substation in order to detect the potential areas of failure as earlier as possible and
improve on the performance of the equipment.
c- Room for automation such as digital monitoring and control of the substation performance
should be initiated.
GSJ: Volume 8, Issue 3, March 2020 ISSN 2320-9186 689
GSJ© 2020 www.globalscientificjournal.com
d- The workforce of the substation should be trained on power distribution system and have
specific knowledge of the functionality of individual power components in the substation and in
terms the breakdown of the system, the workers should be able to detect which component is the
main root-cause of the system failure.
e- Proper communications and report channels should be initiated between the substation and the
consumers connected to it.
f- The single radial system of the substation should be upgraded to a double-end fed radial system
in order to guarantee a stable and reliable power supply to the end-users.
g- The maintenance and inspection activities in the substation should be carried out with respect to
the application of the FTA (Fault Tree Analysis) technique to enhance the flexibility, reliability
and quality of the electricity delivered.
5.3 Contribution to Knowledge
In the course of this study, i was able to apply the FTA technique:
1- To carry out the reliability analysis of the distribution system of RSU 33kV injection
substation.
2- To also assess the reliability of the individual power components of the substation which lead to
the discovery of the major components (feeders) that caused the overall system failure of the
substation.
GSJ: Volume 8, Issue 3, March 2020 ISSN 2320-9186 690
GSJ© 2020 www.globalscientificjournal.com
REFERENCES
[1].Nnanna, I., Uzorh, A. (2016|). The impact of power outages on Nigeria Manufacturing sector, Nigeria institute of Industrial Engineers 1(2).
[2].Theraja R. L., Theraja A. K., (2005). A Textbook of Electrical Technology. New Delhi. S. Chand & Company Ltd.
[3].Awosope, C. A., (2014). Nigeria electricity Industry: Issues, Challenges and Solutions, Public Lecture at Covenant Diversity, Series, 3,(2).
[4]. Zapata C., Rios M., (2010). Reliability Assessment of substations using stochastic point process and Monte Carlo simulations.IEE International Conference on Power System Technology.
[5]. Gonen, T. (2014). Electric Power Distribution Engineering Boca Raton: CRC Press, Taylor and Francis Group.
[6]. Billiton, R., Jonnavithula S., (1996). A test system for Teaching overall power system reliability Assessment. IEE Transactions on power systems, 11(4), 1670 – 1676
[7].Julwan, R. P., Srivasta. S. C., (2011). Development and implementation for Power Distribution Automation 61(4) 40 – 7.
[8].Liggsemeye V., Rothfelder S., (1998). Electric Power System Hohoken, New Jersey: John Wiley & Sons Inc.
[9].Bhavaraju, M. P. et al, (2005). IEE tutorial on Electric Delivery System Reliability Evaluation. IEE Power Engineering Society (PES)
[10]. Wang, T. and Y. Wu (2012), The Reliability Evaluating Method Considering Component Aging for Distribution Network. 2012 International Conference on Future Energy, Environmental and Materials (1613– 1618) Elsevier B. C.
[11].Kueck J. D et al (2004). Measurement particles for reliability and Power quality: Tennessee; Oak Ridge National Laboratory.
[12.] Krish G., Short T. (2008). Handbook of power quality. England: John Wiley and sons Ltd.
[13].Omorogiuwa E., Uhunmwangho, R. (2014). Reliability Prediction of Port Harcourt Electricity Distribution Network using NEPLAN. The International Journal of Engineering and Science (IJS) 3(12), 68 – 79.
[14]. Zhang, X. et al, (2007). Estimation of the lifetime of the Electrical Component in Distribution Network. IEE Transaction on power delivery 22(1), 515 – 522.
[15]. Brown R. E., (2009). Electric Power Distribution Reliability Boca Raton. Florida. CRC Press.
[16]. Andrej, J., Franc J., (2000). Effect of Elevated Temperatures on Mechanical Properties of overhead Conductors under steady state and short-circuit conditions. IEE Transactions on power delivery, 15(1). 242–246.
GSJ: Volume 8, Issue 3, March 2020 ISSN 2320-9186 691
GSJ© 2020 www.globalscientificjournal.com