investigating sea level rise in the hudson valley
TRANSCRIPT
1
Included in this curriculum packet:
ENGAGE: Climate Change True/False ActivityThis brief true/false activity is aimed at activating students’ prior knowledge and allowing you to gauge their previous
knowledge and misconceptions
EXPLORE: Sea Level Rise Mapper WebquestThe PowerPoint and guided notes (both provided) help explain how climate change is affecting the Hudson Valley as
well as the general concept of sea level rise and why it’s occurring. With Scenic Hudson’s computer-based Sea Level Rise
Mapper, students will look at the effects of rising sea levels on specific communities and neighborhoods.
EXPLAIN: What Can We Do?Start with a carousel activity—let students share what they think can be done to mitigate and adapt to climate change.
Then a PowerPoint presentation and guided notes (both provided) will explain the actions students and communities can
take and what currently is being done.
ELABORATE: Letter Writing to an Elected OfficialStudents will write a letter to an elected official outlining their knowledge, ideas and concerns.
EVALUATE: Rubrics and Teacher KeysTeachers can evaluate student understanding and learning using the provided rubrics and teacher keys.
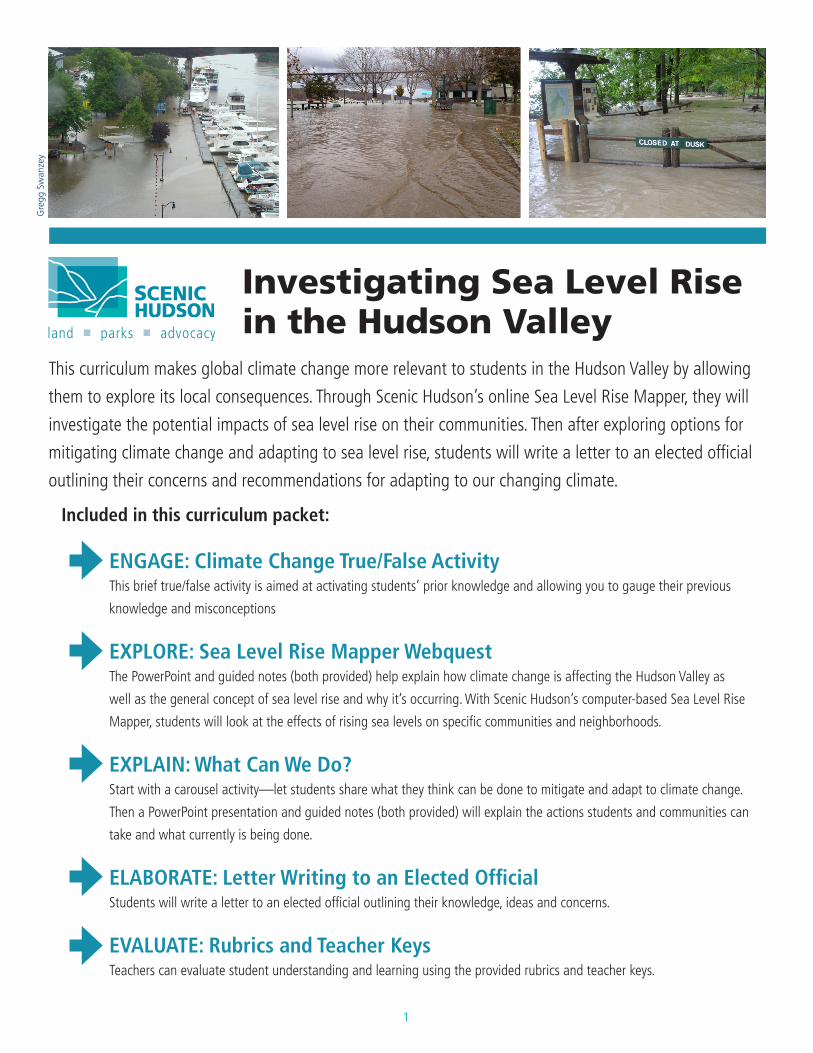
Gre
gg S
wan
zey
Investigating Sea Level Rise in the Hudson Valley
This curriculum makes global climate change more relevant to students in the Hudson Valley by allowing
them to explore its local consequences. Through Scenic Hudson’s online Sea Level Rise Mapper, they will
investigate the potential impacts of sea level rise on their communities. Then after exploring options for
mitigating climate change and adapting to sea level rise, students will write a letter to an elected official
outlining their concerns and recommendations for adapting to our changing climate.
2
TABLE OF CONTENTS
ENGAGE: Climate Change True/False Activity 3
Lesson Plan 3
Climate Change True/False Student Worksheet 6
Climate Change True/False Teacher Key 7
EXPLORE: Sea Level Rise in the Hudson Valley 8
Lesson Plan 8
Sea Level Rise in the Hudson Valley Guided Note Sheet 11
Sea Level Rise in the Hudson Valley Guided Note Sheet Teacher Key 12
Sea Level Rise in the Hudson Valley Web Quest 13
Sea Level Rise in the Hudson Valley Web Quest Teacher Key 17
City of Kingston Sea Level Rise Summary 21
EXPLAIN: What Can We Do? 23
Lesson Plan with Carousel Activity 23
What Can We Do? Guided Note Sheet 26
What Can We Do? Guided Note Sheet Teacher Key 27
ELABORATE: Letter to an Elected Official 28
Lesson Plan 28
Instructions for Writing a Letter to an Elected Official 30
Rubric for Writing a Letter to an Elected Official 31
Sample Letter to an Elected Official 32
Correlation to State Standards 33
Additional Materials Available*
Sea Level Rise in Hudson Valley PowerPoint Presentation*
What Can We Do? PowerPoint Presenation*
Word Documents of Student Worksheets*
*To obtain additional materials contact Kate Brill at [email protected] or 845 473 4440, Ext. 238
3
ENGAGE: Climate Change True/False Activity
Objectives: • To activate students’ prior knowledge of climate change
• For teachers to assess students’ prior knowledge and identify existing misconceptions
Grades: 7-12
Time frame: (15 minutes) Climate Change True/False Activity
Introduction:Adapted from the WWF “Your Climate, Your Future” curriculum, this activity begins by looking at climate science and climate change on a global scale and then becomes locally focused. It is meant to be conducted at the beginning of your climate change unit and can serve as an excellent pre-assessment. The goal is to activate students’ prior knowledge of climate change and help teachers gauge where students are in terms of this knowledge. This true/false quiz hits on many common misconceptions about climate change and is a great way to understand what topics might need extra attention.
Background Information:
What is the difference between climate and weather?
Weather defines atmospheric conditions over a short period of time, such as day-to-day or week-to-week. Climate refers to the average weather conditions over a long period of time, decades or longer.
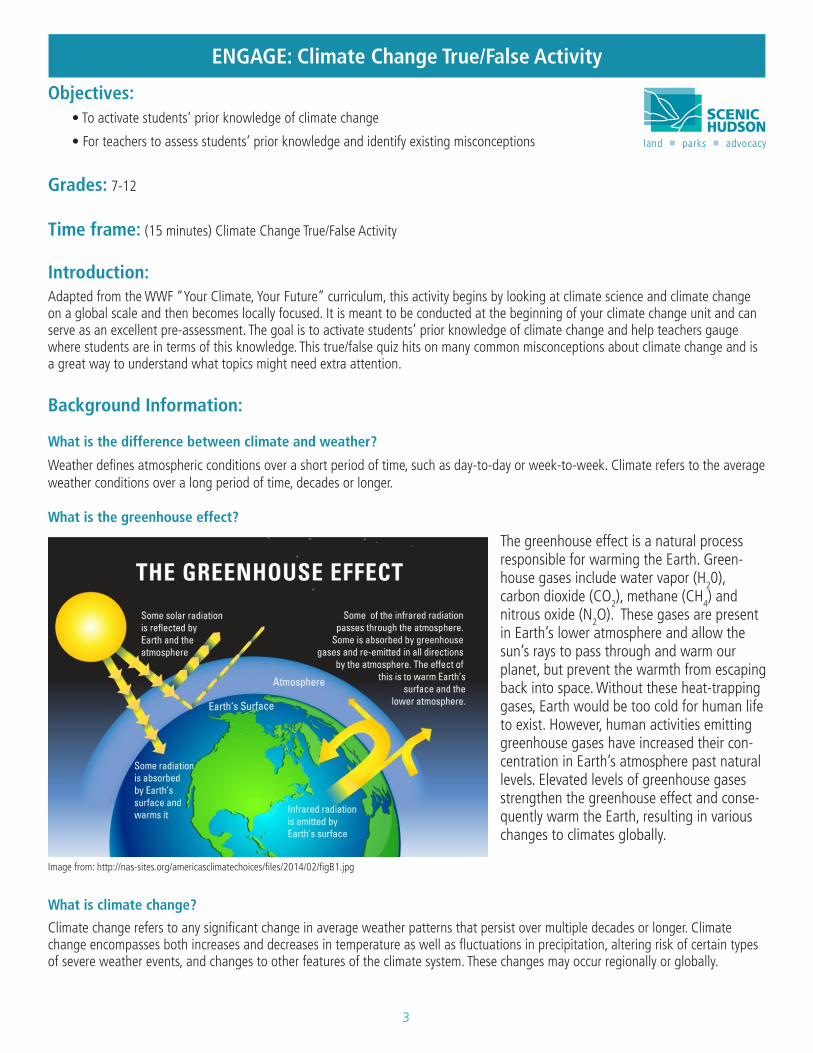
What is the greenhouse effect?
The greenhouse effect is a natural process responsible for warming the Earth. Green-house gases include water vapor (H20), carbon dioxide (CO2), methane (CH4) and nitrous oxide (N2O). These gases are present in Earth’s lower atmosphere and allow the sun’s rays to pass through and warm our planet, but prevent the warmth from escaping back into space. Without these heat-trapping gases, Earth would be too cold for human life to exist. However, human activities emitting greenhouse gases have increased their con-centration in Earth’s atmosphere past natural levels. Elevated levels of greenhouse gases strengthen the greenhouse effect and conse-quently warm the Earth, resulting in various changes to climates globally.
What is climate change?
Climate change refers to any significant change in average weather patterns that persist over multiple decades or longer. Climate change encompasses both increases and decreases in temperature as well as fluctuations in precipitation, altering risk of certain types of severe weather events, and changes to other features of the climate system. These changes may occur regionally or globally.
Image from: http://nas-sites.org/americasclimatechoices/files/2014/02/figB1.jpg
4
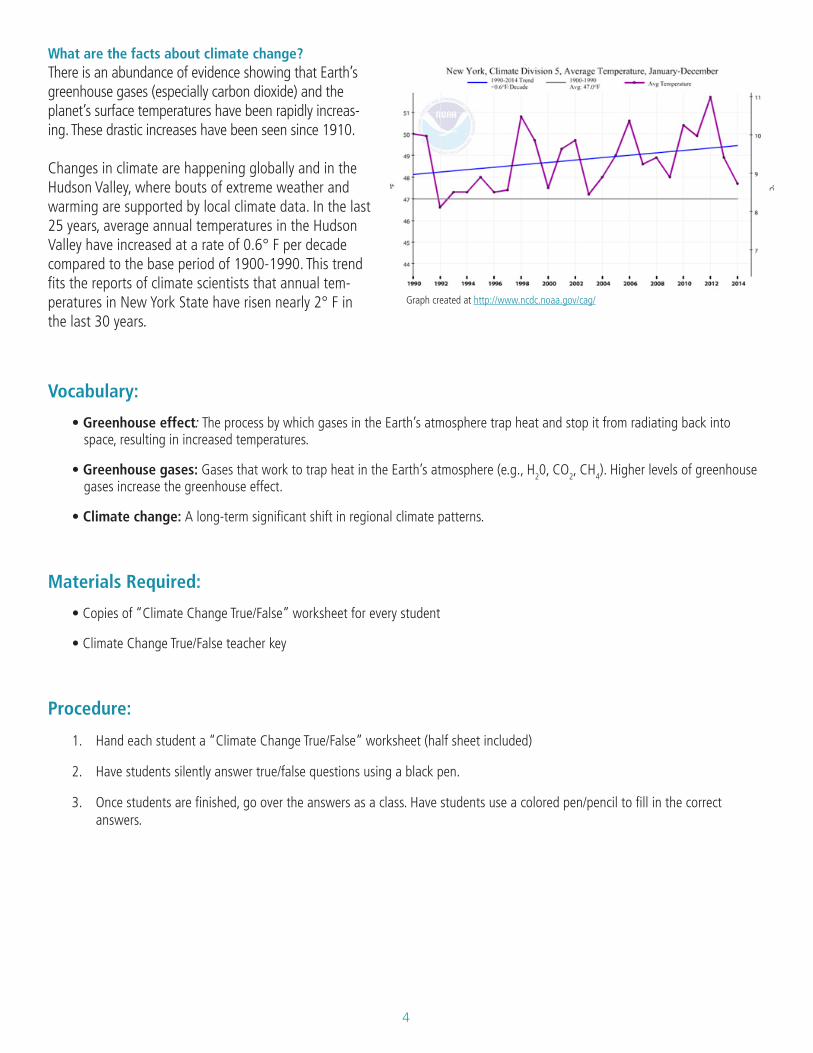
What are the facts about climate change?There is an abundance of evidence showing that Earth’s greenhouse gases (especially carbon dioxide) and the planet’s surface temperatures have been rapidly increas-ing. These drastic increases have been seen since 1910.
Changes in climate are happening globally and in the Hudson Valley, where bouts of extreme weather and warming are supported by local climate data. In the last 25 years, average annual temperatures in the Hudson Valley have increased at a rate of 0.6° F per decade compared to the base period of 1900-1990. This trend fits the reports of climate scientists that annual tem-peratures in New York State have risen nearly 2° F in the last 30 years.
Vocabulary:
• Greenhouse effect: The process by which gases in the Earth’s atmosphere trap heat and stop it from radiating back into space, resulting in increased temperatures.
• Greenhouse gases: Gases that work to trap heat in the Earth’s atmosphere (e.g., H20, CO2, CH4). Higher levels of greenhouse gases increase the greenhouse effect.
• Climate change: A long-term significant shift in regional climate patterns.
Materials Required:
• Copies of “Climate Change True/False” worksheet for every student
• Climate Change True/False teacher key
Procedure:
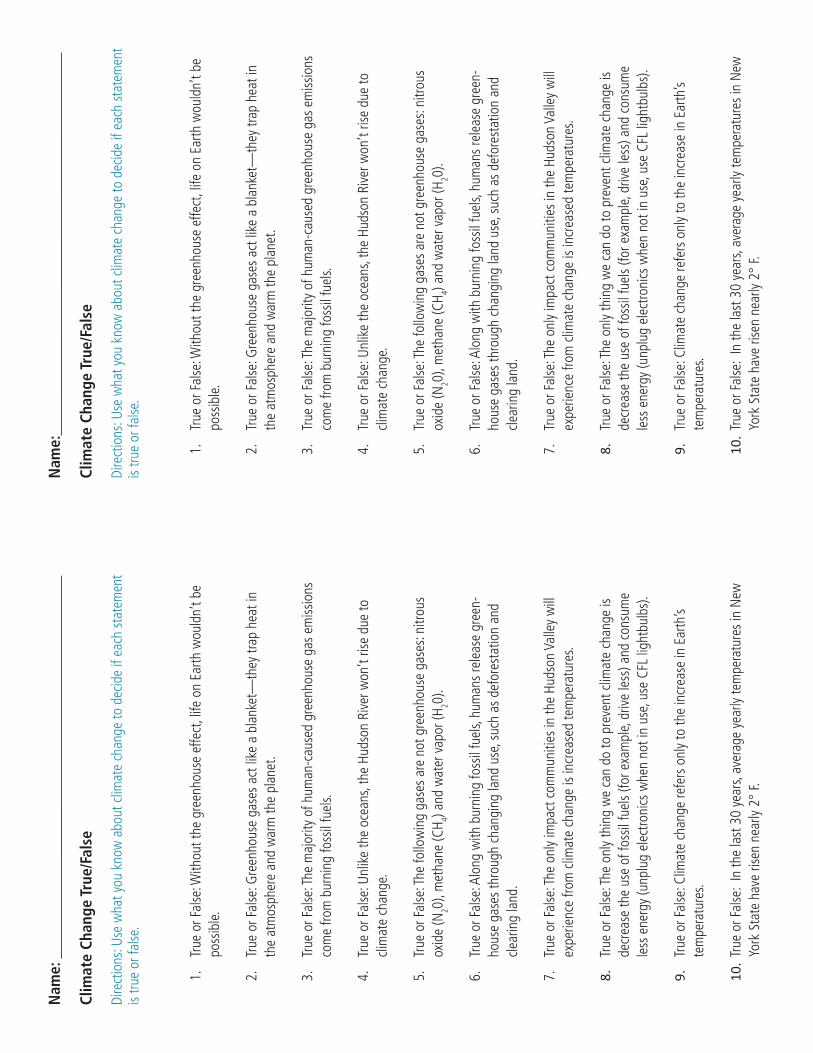
1. Hand each student a “Climate Change True/False” worksheet (half sheet included)
2. Have students silently answer true/false questions using a black pen.
3. Once students are finished, go over the answers as a class. Have students use a colored pen/pencil to fill in the correct answers.
Graph created at http://www.ncdc.noaa.gov/cag/
5
Extensions:
To delve deeper into students’ understanding, ask them what other “rumors” they’ve heard about climate change. When a student brings something up, ask the class to raise their hand if they think it is true/false. This is a good way to gauge what information is getting to students about climate change and to catch any other misconceptions.
Sources:
• Graves, Kate and Levine, Elliot. (September 2007). “Your Climate, Your Future. An interdisciplinary approach to integrating cli-mate change into your classroom.” Retrieved from http://www.wwfblogs.org/climate/sites/default/files/WWFBinaryitem5977.pdf
• DeGaetano, A., Chatrchyan, A., Wolfe, D., Beem-Miller, J., Chambliss, L., & Menninger, H. (2011). CLIMATE CHANGE FACTS, NEW YORK’S CHANGING CLIMATE. Retrieved from http://www.nrcc.cornell.edu/climate_change/climate_ny.pdf
• NYS DEC. Climate Change in the Hudson Valley Fact Sheet. Retrieved from http://www.dec.ny.gov/docs/remediation_hudson_pdf/hreccfs.pdf
• US EPA. (March 2014) Climate Change: Basic Information. Retrieved from http://www.epa.gov/climatechange/basics/
Nam
e:__
____
____
____
____
____
____
____
____
____
____
____
__
Clim
ate
Chan
ge T
rue/
Fals
e
Dire
ctio
ns: U
se w
hat y
ou k
now
abo
ut c
limat
e ch
ange
to d
ecid
e if
each
sta
tem
ent
is tru
e or
false
.
1.
True
or F
alse
: With
out t
he g
reen
hous
e ef
fect
, life
on
Earth
wou
ldn’
t be
poss
ible
.
2.
True
or F
alse
: Gre
enho
use
gase
s ac
t lik
e a
blan
ket—
they
trap
hea
t in
the
atm
osph
ere
and
war
m th
e pl
anet
.
3.
True
or F
alse
: The
maj
ority
of h
uman
-cau
sed
gree
nhou
se g
as e
miss
ions
co
me
from
bur
ning
foss
il fu
els.
4.
True
or F
alse
: Unl
ike
the
ocea
ns, t
he H
udso
n Ri
ver w
on’t
rise
due
to
clim
ate
chan
ge.
5.
True
or F
alse
: The
follo
win
g ga
ses
are
not g
reen
hous
e ga
ses:
nitro
us
oxid
e (N
20),
met
hane
(CH 4)
and
wat
er v
apor
(H20
).
6.
True
or F
alse
: Alo
ng w
ith b
urni
ng fo
ssil
fuel
s, hu
man
s re
leas
e gr
een-
hous
e ga
ses
thro
ugh
chan
ging
land
use
, suc
h as
def
ores
tatio
n an
d cle
arin
g la
nd.
7.
True
or F
alse
: The
onl
y im
pact
com
mun
ities
in th
e Hu
dson
Val
ley
will
ex
perie
nce
from
clim
ate
chan
ge is
incr
ease
d te
mpe
ratu
res.
8.
True
or F
alse
: The
onl
y th
ing
we
can
do to
pre
vent
clim
ate
chan
ge is
de
crea
se th
e us
e of
foss
il fu
els
(for e
xam
ple,
driv
e le
ss) a
nd c
onsu
me
less
ene
rgy
(unp
lug
elec
troni
cs w
hen
not i
n us
e, u
se C
FL li
ghtb
ulbs
).
9.
True
or F
alse
: Clim
ate
chan
ge re
fers
onl
y to
the
incr
ease
in E
arth
’s te
mpe
ratu
res.
10. T
rue
or F
alse
: In
the
last
30
year
s, av
erag
e ye
arly
tem
pera
ture
s in
New
Yo
rk S
tate
hav
e ris
en n
early
2°
F.
Nam
e: _
____
____
____
____
____
____
____
____
____
____
____
___
Clim
ate
Chan
ge T
rue/
Fals
e
Dire
ctio
ns: U
se w
hat y
ou k
now
abo
ut c
limat
e ch
ange
to d
ecid
e if
each
sta
tem
ent
is tru
e or
false
.
1.
True
or F
alse
: With
out t
he g
reen
hous
e ef
fect
, life
on
Earth
wou
ldn’
t be
poss
ible
.
2.
True
or F
alse
: Gre
enho
use
gase
s ac
t lik
e a
blan
ket—
they
trap
hea
t in
the
atm
osph
ere
and
war
m th
e pl
anet
.
3.
True
or F
alse
: The
maj
ority
of h
uman
-cau
sed
gree
nhou
se g
as e
miss
ions
co
me
from
bur
ning
foss
il fu
els.
4.
True
or F
alse
: Unl
ike
the
ocea
ns, t
he H
udso
n Ri
ver w
on’t
rise
due
to
clim
ate
chan
ge.
5.
True
or F
alse
: The
follo
win
g ga
ses
are
not g
reen
hous
e ga
ses:
nitro
us
oxid
e (N
20),
met
hane
(CH 4)
and
wat
er v
apor
(H20
).
6.
True
or F
alse
: Alo
ng w
ith b
urni
ng fo
ssil
fuel
s, hu
man
s re
leas
e gr
een-
hous
e ga
ses
thro
ugh
chan
ging
land
use
, suc
h as
def
ores
tatio
n an
d cle
arin
g la
nd.
7.
True
or F
alse
: The
onl
y im
pact
com
mun
ities
in th
e Hu
dson
Val
ley
will
ex
perie
nce
from
clim
ate
chan
ge is
incr
ease
d te
mpe
ratu
res.
8.
True
or F
alse
: The
onl
y th
ing
we
can
do to
pre
vent
clim
ate
chan
ge is
de
crea
se th
e us
e of
foss
il fu
els
(for e
xam
ple,
driv
e le
ss) a
nd c
onsu
me
less
ene
rgy
(unp
lug
elec
troni
cs w
hen
not i
n us
e, u
se C
FL li
ghtb
ulbs
).
9.
True
or F
alse
: Clim
ate
chan
ge re
fers
onl
y to
the
incr
ease
in E
arth
’s te
mpe
ratu
res.
10. T
rue
or F
alse
: In
the
last
30
year
s, av
erag
e ye
arly
tem
pera
ture
s in
New
Yo
rk S
tate
hav
e ris
en n
early
2°
F.
7
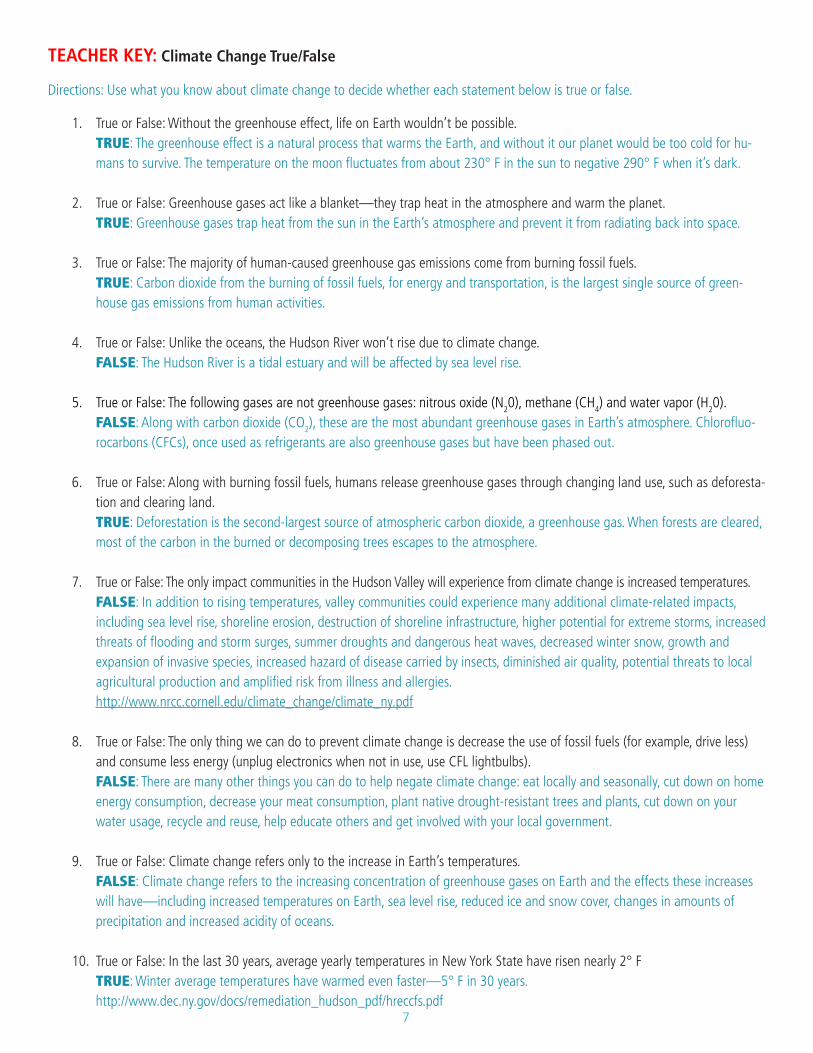
TEACHER KEY: Climate Change True/False
Directions: Use what you know about climate change to decide whether each statement below is true or false.
1. True or False: Without the greenhouse effect, life on Earth wouldn’t be possible.TRUE: The greenhouse effect is a natural process that warms the Earth, and without it our planet would be too cold for hu-mans to survive. The temperature on the moon fluctuates from about 230° F in the sun to negative 290° F when it’s dark.
2. True or False: Greenhouse gases act like a blanket—they trap heat in the atmosphere and warm the planet.TRUE: Greenhouse gases trap heat from the sun in the Earth’s atmosphere and prevent it from radiating back into space.
3. True or False: The majority of human-caused greenhouse gas emissions come from burning fossil fuels.TRUE: Carbon dioxide from the burning of fossil fuels, for energy and transportation, is the largest single source of green-house gas emissions from human activities.
4. True or False: Unlike the oceans, the Hudson River won’t rise due to climate change.FALSE: The Hudson River is a tidal estuary and will be affected by sea level rise.
5. True or False: The following gases are not greenhouse gases: nitrous oxide (N20), methane (CH4) and water vapor (H20).FALSE: Along with carbon dioxide (CO2), these are the most abundant greenhouse gases in Earth’s atmosphere. Chlorofluo-rocarbons (CFCs), once used as refrigerants are also greenhouse gases but have been phased out.
6. True or False: Along with burning fossil fuels, humans release greenhouse gases through changing land use, such as deforesta-tion and clearing land.TRUE: Deforestation is the second-largest source of atmospheric carbon dioxide, a greenhouse gas. When forests are cleared, most of the carbon in the burned or decomposing trees escapes to the atmosphere.
7. True or False: The only impact communities in the Hudson Valley will experience from climate change is increased temperatures. FALSE: In addition to rising temperatures, valley communities could experience many additional climate-related impacts, including sea level rise, shoreline erosion, destruction of shoreline infrastructure, higher potential for extreme storms, increased threats of flooding and storm surges, summer droughts and dangerous heat waves, decreased winter snow, growth and expansion of invasive species, increased hazard of disease carried by insects, diminished air quality, potential threats to local agricultural production and amplified risk from illness and allergies. http://www.nrcc.cornell.edu/climate_change/climate_ny.pdf
8. True or False: The only thing we can do to prevent climate change is decrease the use of fossil fuels (for example, drive less) and consume less energy (unplug electronics when not in use, use CFL lightbulbs).FALSE: There are many other things you can do to help negate climate change: eat locally and seasonally, cut down on home energy consumption, decrease your meat consumption, plant native drought-resistant trees and plants, cut down on your water usage, recycle and reuse, help educate others and get involved with your local government.
9. True or False: Climate change refers only to the increase in Earth’s temperatures.FALSE: Climate change refers to the increasing concentration of greenhouse gases on Earth and the effects these increases will have—including increased temperatures on Earth, sea level rise, reduced ice and snow cover, changes in amounts of precipitation and increased acidity of oceans.
10. True or False: In the last 30 years, average yearly temperatures in New York State have risen nearly 2° FTRUE: Winter average temperatures have warmed even faster—5° F in 30 years. http://www.dec.ny.gov/docs/remediation_hudson_pdf/hreccfs.pdf
8
EXPLORE: Sea Level Rise in the Hudson Valley
Objectives: • Students will understand how climate change will affect waterfronts in the Hudson Valley
• Students will be able to explain the predicted effects of sea level rise on a Hudson Valley community
Grades: 7-12
Time frame: • (20 minutes) Sea Level Rise in the Hudson Valley PowerPoint Presentation with guided notes
• (60 minutes) Sea Level Rise Mapper Activity
Introduction:In this activity, students will use Scenic Hudson’s online Sea Level Rise Mapper to investigate the impacts of sea level rise on a Hudson Valley community. The PowerPoint presentation (provided) will give a good introduction to sea level rise causes, effects in the Hudson Valley and how to use the SLR Mapper.
Teacher notes:
1. Some places on the map that are below sea level will show up in the 100-year floodplain but shouldn’t. If an area is not connected to the estuary or its tributaries, it can be assumed it won’t be affected by sea level rise.
2. Good sites to send students to look for more noticeable potential changes:
1. Your local waterfront!
2. Poughkeepsie waterfront: Waryas Park (Dutchess County)
3. Beacon waterfront: Riverfront Park, Long Dock Park and Denning’s Point (Dutchess County)
4. Catskill/Catskill Creek (Greene County)
5. Newburgh waterfront (Orange County)
6. Cold Spring (Putnam County)
7. Stony Point to Haverstraw (Rockland County)
8. Sleepy Hollow to Tarrytown (Westchester County)
9. Yonkers (Westchester County)
Background Information for Teachers:
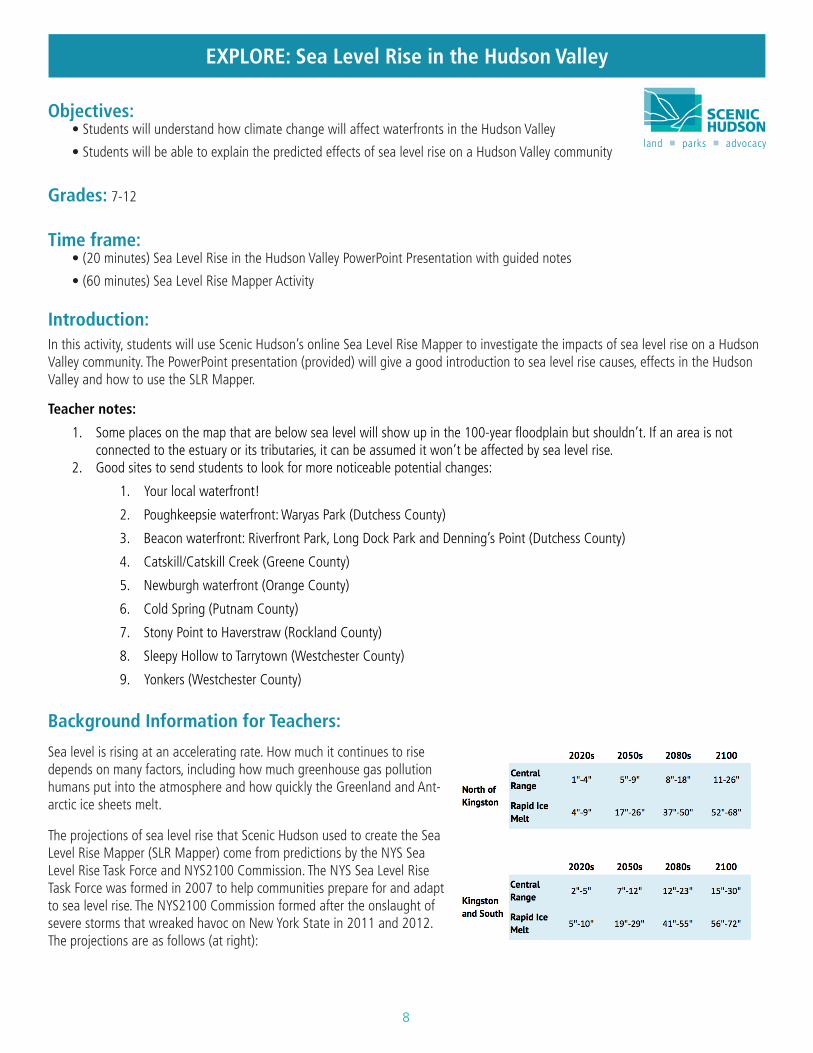
Sea level is rising at an accelerating rate. How much it continues to rise depends on many factors, including how much greenhouse gas pollution humans put into the atmosphere and how quickly the Greenland and Ant-arctic ice sheets melt.
The projections of sea level rise that Scenic Hudson used to create the Sea Level Rise Mapper (SLR Mapper) come from predictions by the NYS Sea Level Rise Task Force and NYS2100 Commission. The NYS Sea Level Rise Task Force was formed in 2007 to help communities prepare for and adapt to sea level rise. The NYS2100 Commission formed after the onslaught of severe storms that wreaked havoc on New York State in 2011 and 2012. The projections are as follows (at right):
9
It is still uncertain just how much sea level will rise and how quickly it will happen. The central range represents the low end of predic-tions; this would be a scenario where measures are taken to cut greenhouse gases, Earth’s temperature doesn’t rise as quickly and ice sheets don’t melt as rapidly. The second scenario is at the high end of predictions; it could occur if the temperature rises quickly, not much action is taken to cut greenhouse gas emissions and the ice caps melt rapidly.
Vocabulary:
• Estuary: Area where freshwater from a river meets saltwater from the ocean. Because of it’s connection to the ocean, an estuary has a mixing of fresh and salt water and is also affected by tides. The Hudson River is an estuary with the salt front reaching up into the lower Hudson Valley and is affected by tides all the way up to Troy, NY.
• 100-year floodplain: An area that has a 1% chance of being flooded in a given year.
• Inundation: Areas that will be covered in water at high tides.
• Brownfields: An area once used for industrial or commercial use that may be contaminated by hazardous waste or pollution.
• Hazmat sites: An area where hazardous materials are stored or disposed of.
• Hazardous materials: Any substance or material that could adversely affect the health and safety of people or the environment (e.g., gasoline, paint, pool chemicals, batteries).
• GIS: Geographical Information Systems allow you to store, analyze and present spatial and geographical information. GIS puts together different layers of data to create a map that represents the information as a whole.
• Municipal assets: Buildings and structures provided for public use by local governments (e.g., roads, libraries, schools, sewage treatment facilities).
• Hard shoreline: Areas where structural methods have been employed to stabilize the shoreline (e.g., rip rap, jetties, retaining walls).
• Natural shoreline: Areas of shoreline that have been left natural or where natural methods have been used exclusively to stabilize it (e.g., trees, plants, rocky shoreline).
• Resilience: The ability of a system to withstand shocks and stresses while maintaining its essential functions.
Materials Required:
• Sea Level Rise in the Hudson Valley PowerPoint Presentation
• Copies of guided notes for every student
• Class set of computers or tablets with internet connection
• Copies of the student worksheet for every student
Procedure:
1. Go through the “Sea Level Rise in the Hudson Valley” PowerPoint presentation to prepare students
2. Give each student a copy of the “Sea Level Rise Mapper” activity worksheet
3. Using a classroom set of computers, have students conduct the activity online
4. Teacher should stand by to assist students with any questions and help troubleshoot
10
Extensions:
Visit a local waterfront before the Sea Level Rise Mapper activity. Choose a nearby place that will be impacted by sea level rise. At the site, study the Hudson River estuary, investigate the shoreline and make note of noticeable features. Back in the classroom use the location your class visited as a second location for your students to investigate using the SLR Mapper.
Visit a local waterfront area and bring tablets enabled with wireless internet capabilities to use the Sea Level Rise Mapper on site and investigate further how the shoreline will change. Have students make note of interesting features that might be inundated and those that will be changed. Have the students create an art piece representing the changes they will see at the park.
Visit a local waterfront area and conduct a lab exercise measuring how much the shoreline will change. I recommend Lesson 9 New York Explores Sea Level Rise - A Field Based Activity from the New York State Sea Grant’s “Hudson River Estuary Climate Change Lesson Project” available at http://www.seagrant.sunysb.edu/hriver/pdfs/climatechange/HRCC_Lesson9.pdf.
Sources:
• NYS 2100 Commission. (2013). Recommendations to Improve the Strength and Resilience of the Empire State’s Infrastruc-ture. Retrieved from http://www.governor.ny.gov/sites/governor.ny.gov/files/archive/assets/documents/NYS2100.pdf
• New York State Sea Level Rise Task Force. (December 13, 2010). Report to the Legislature. Retrieved from http://www.dec.ny.gov/docs/administration_pdf/slrtffinalrep.pdf
• The City of New York. (June 2013). COASTAL CLIMATE RESILIENCE: Urban Waterfront Adaptive Strategies. Retrieved from http://www.nyc.gov/html/dcp/pdf/sustainable_communities/urban_waterfront_print.pdf
• Holochuck, Noridca. (November 2014) Hudson River Estuary Climate Change Lesson Project, Grades 5-8. Retrieved from http://www.seagrant.sunysb.edu/articles/t/hudson-river-estuary-climate-change-lesson-project-hudson-river-estuary-news
11
Name: ________________________________________________________________________
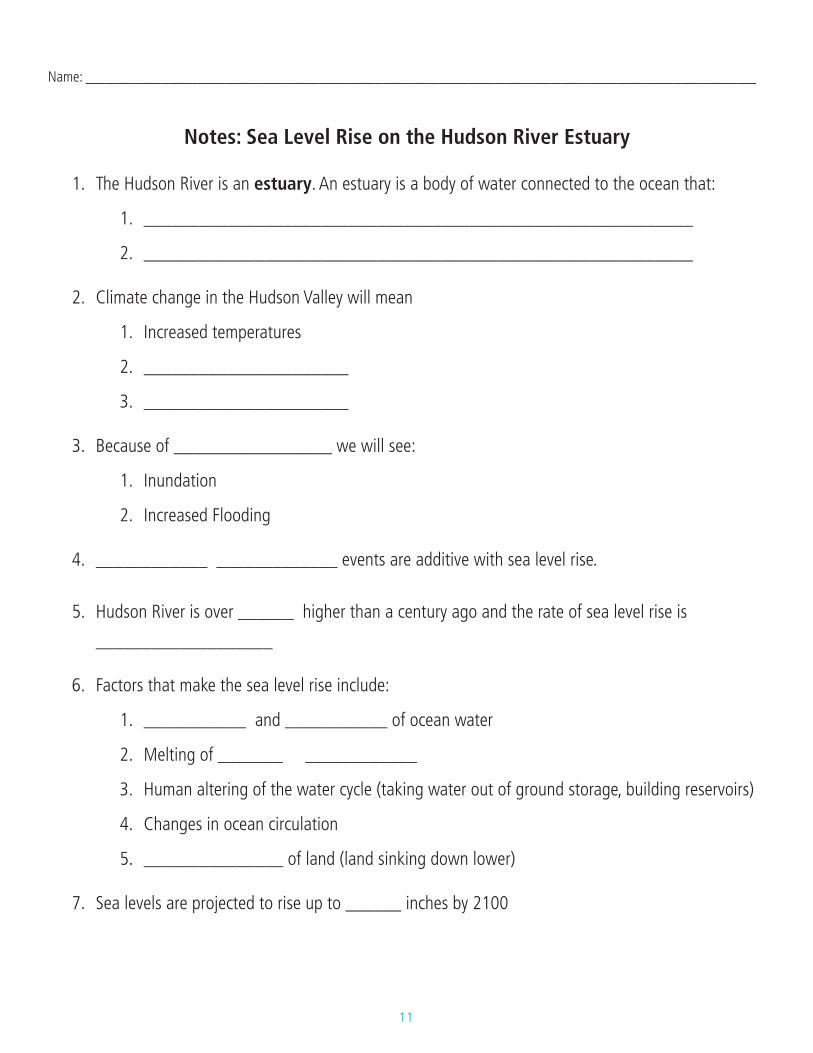
Notes: Sea Level Rise on the Hudson River Estuary
1. The Hudson River is an estuary. An estuary is a body of water connected to the ocean that:
1. ___________________________________________________________
2. ___________________________________________________________
2. Climate change in the Hudson Valley will mean
1. Increased temperatures
2. ______________________
3. ______________________
3. Because of _________________ we will see:
1. Inundation
2. Increased Flooding
4. ____________ _____________ events are additive with sea level rise.
5. Hudson River is over ______ higher than a century ago and the rate of sea level rise is
___________________
6. Factors that make the sea level rise include:
1. ___________ and ___________ of ocean water
2. Melting of _______ ____________
3. Human altering of the water cycle (taking water out of ground storage, building reservoirs)
4. Changes in ocean circulation
5. _______________ of land (land sinking down lower)
7. Sea levels are projected to rise up to ______ inches by 2100
12
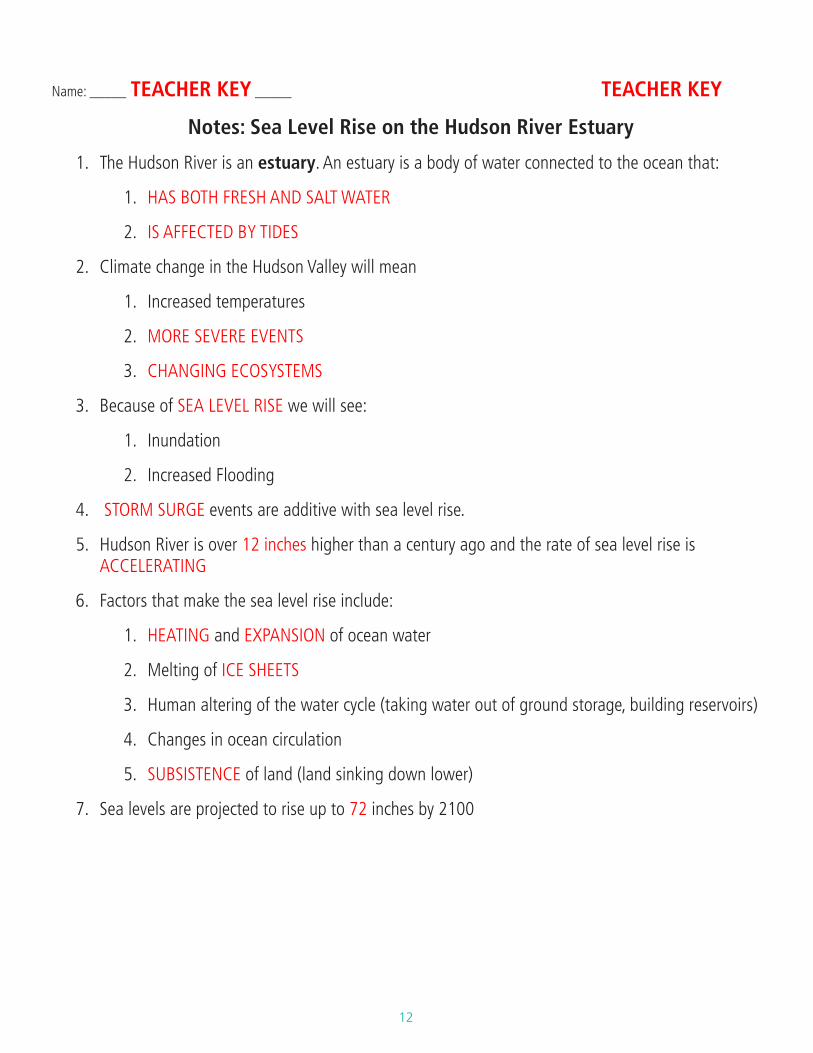
Name: _____ TEACHER KEY _____ TEACHER KEY
Notes: Sea Level Rise on the Hudson River Estuary
1. The Hudson River is an estuary. An estuary is a body of water connected to the ocean that:
1. HAS BOTH FRESH AND SALT WATER
2. IS AFFECTED BY TIDES
2. Climate change in the Hudson Valley will mean
1. Increased temperatures
2. MORE SEVERE EVENTS
3. CHANGING ECOSYSTEMS
3. Because of SEA LEVEL RISE we will see:
1. Inundation
2. Increased Flooding
4. STORM SURGE events are additive with sea level rise.
5. Hudson River is over 12 inches higher than a century ago and the rate of sea level rise is ACCELERATING
6. Factors that make the sea level rise include:
1. HEATING and EXPANSION of ocean water
2. Melting of ICE SHEETS
3. Human altering of the water cycle (taking water out of ground storage, building reservoirs)
4. Changes in ocean circulation
5. SUBSISTENCE of land (land sinking down lower)
7. Sea levels are projected to rise up to 72 inches by 2100
13
Name:____________________________________________________________________________________
Sea Level Rise in the Hudson Valley Webquest
In this webquest you will use Scenic Hudson’s Sea Level Rise Mapper to investigate the effects of climate change on areas along the Hudson River. Follow the instructions and answer the questions. If you can’t figure out an answer based on the page you are on, you might need to use the internet to research.
PART 1
1) Go to: www.scenichudson.org/slr/mapper
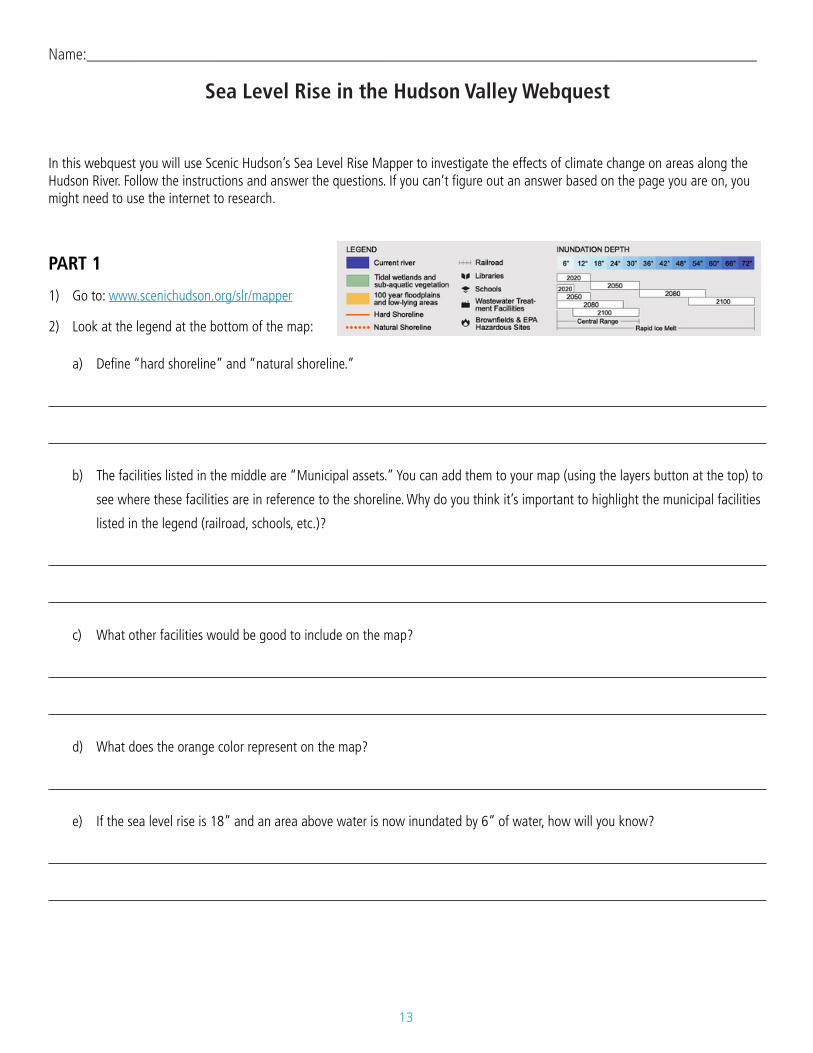
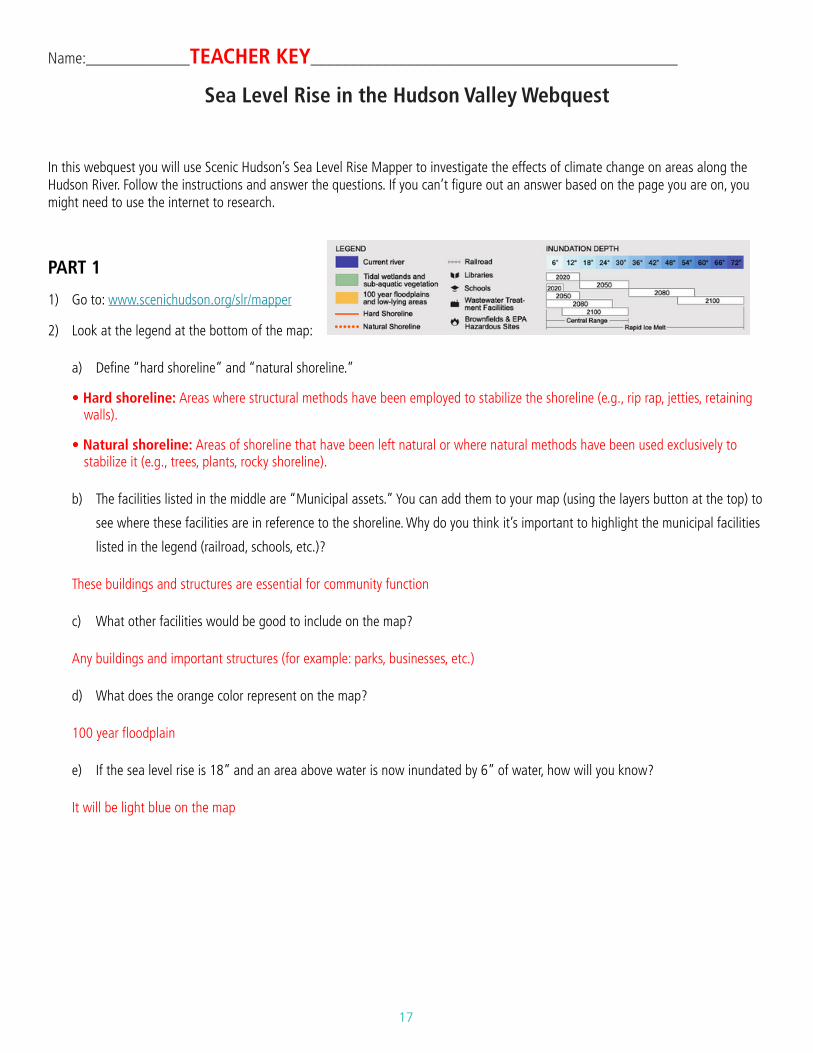
2) Look at the legend at the bottom of the map:
a) Define “hard shoreline” and “natural shoreline.”
b) The facilities listed in the middle are “Municipal assets.” You can add them to your map (using the layers button at the top) to
see where these facilities are in reference to the shoreline. Why do you think it’s important to highlight the municipal facilities
listed in the legend (railroad, schools, etc.)?
c) What other facilities would be good to include on the map?
d) What does the orange color represent on the map?
e) If the sea level rise is 18” and an area above water is now inundated by 6” of water, how will you know?
14
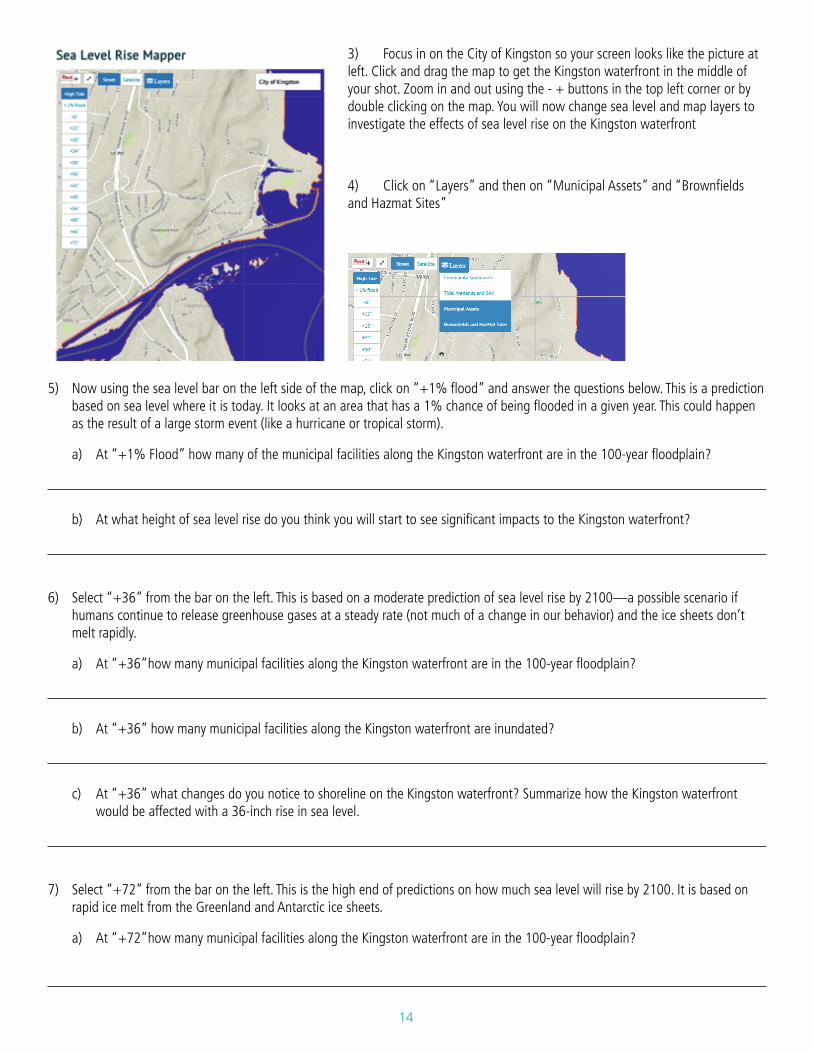
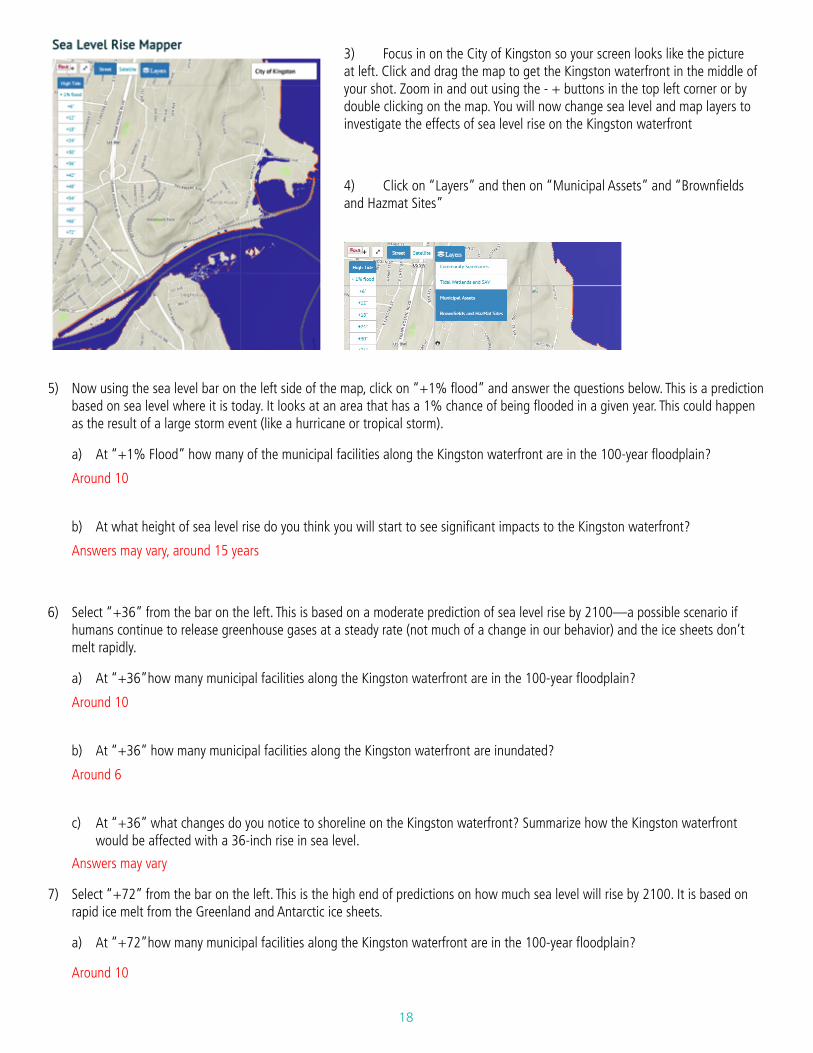
3) Focus in on the City of Kingston so your screen looks like the picture at left. Click and drag the map to get the Kingston waterfront in the middle of your shot. Zoom in and out using the - + buttons in the top left corner or by double clicking on the map. You will now change sea level and map layers to investigate the effects of sea level rise on the Kingston waterfront
4) Click on “Layers” and then on “Municipal Assets” and “Brownfields and Hazmat Sites”
5) Now using the sea level bar on the left side of the map, click on “+1% flood” and answer the questions below. This is a prediction based on sea level where it is today. It looks at an area that has a 1% chance of being flooded in a given year. This could happen as the result of a large storm event (like a hurricane or tropical storm).
a) At “+1% Flood” how many of the municipal facilities along the Kingston waterfront are in the 100-year floodplain?
b) At what height of sea level rise do you think you will start to see significant impacts to the Kingston waterfront?
6) Select “+36” from the bar on the left. This is based on a moderate prediction of sea level rise by 2100—a possible scenario if humans continue to release greenhouse gases at a steady rate (not much of a change in our behavior) and the ice sheets don’t melt rapidly.
a) At “+36”how many municipal facilities along the Kingston waterfront are in the 100-year floodplain?
b) At “+36” how many municipal facilities along the Kingston waterfront are inundated?
c) At “+36” what changes do you notice to shoreline on the Kingston waterfront? Summarize how the Kingston waterfront would be affected with a 36-inch rise in sea level.
7) Select “+72” from the bar on the left. This is the high end of predictions on how much sea level will rise by 2100. It is based on rapid ice melt from the Greenland and Antarctic ice sheets.
a) At “+72”how many municipal facilities along the Kingston waterfront are in the 100-year floodplain?
15
b) At “+72” how many municipal facilities along the Kingston waterfront are inundated?
c) At “+72” what changes do you notice to shoreline on the Kingston waterfront? Summarize how the Kingston waterfront would be affected with a 72-inch rise in sea level.
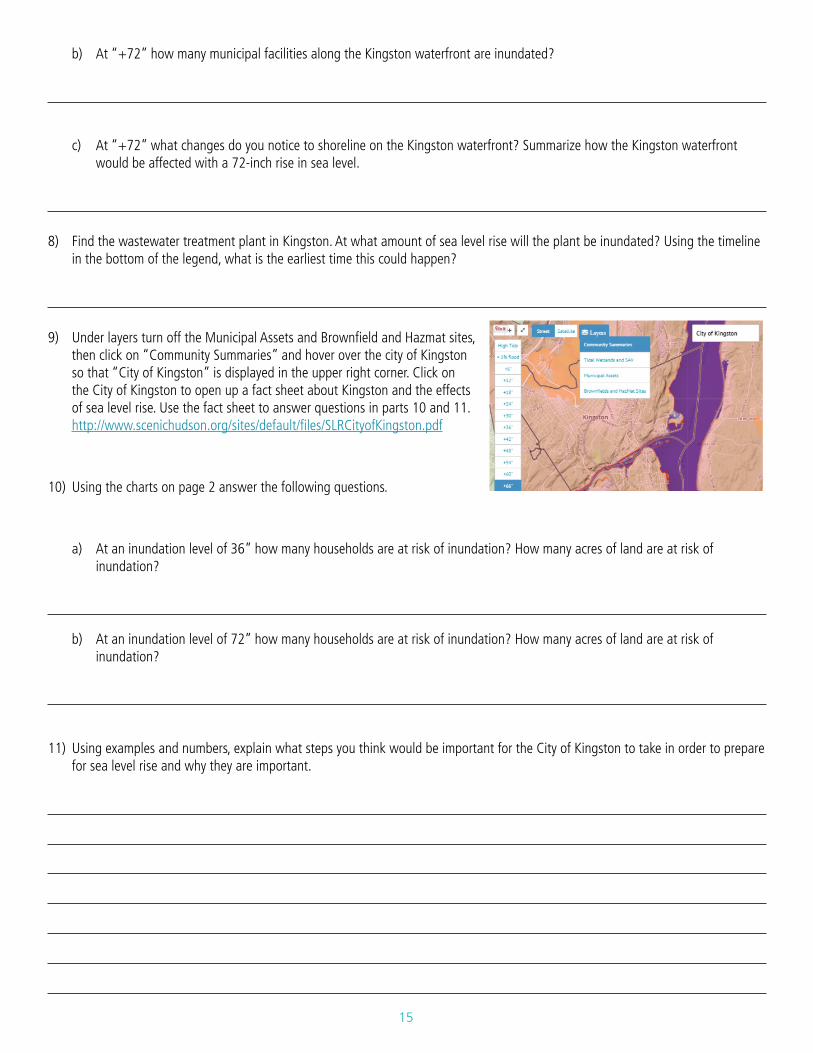
8) Find the wastewater treatment plant in Kingston. At what amount of sea level rise will the plant be inundated? Using the timeline in the bottom of the legend, what is the earliest time this could happen?
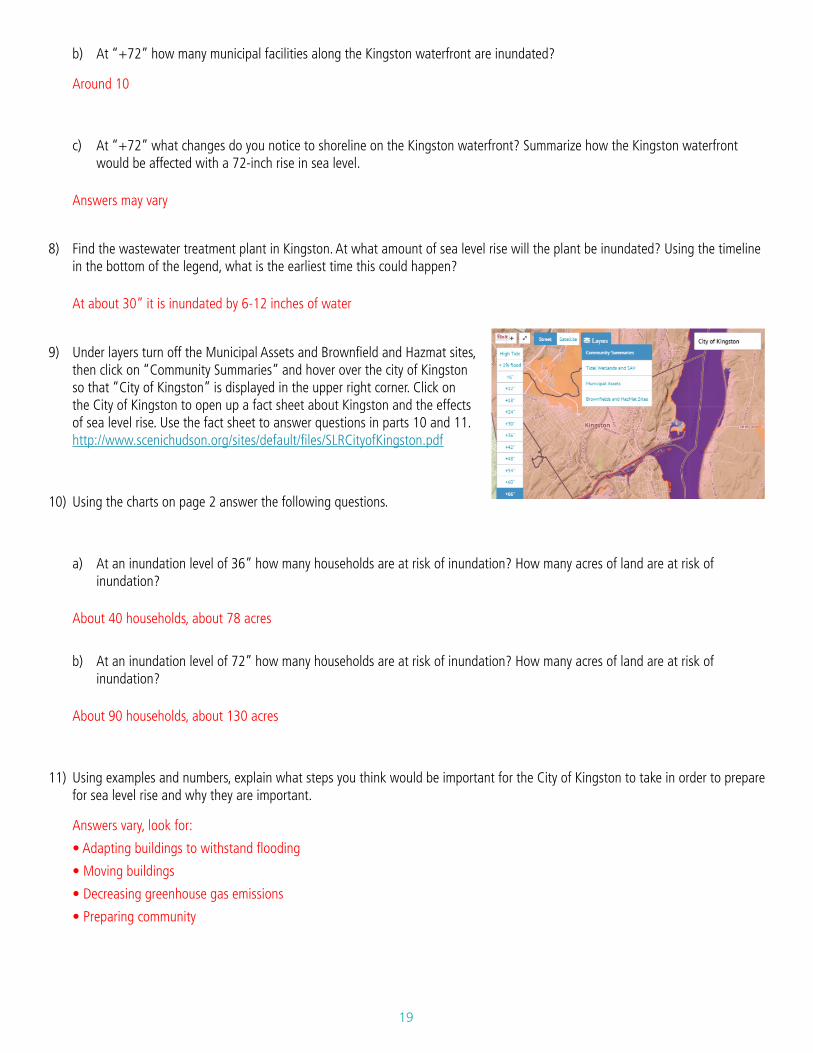
9) Under layers turn off the Municipal Assets and Brownfield and Hazmat sites, then click on “Community Summaries” and hover over the city of Kingston so that “City of Kingston” is displayed in the upper right corner. Click on the City of Kingston to open up a fact sheet about Kingston and the effects of sea level rise. Use the fact sheet to answer questions in parts 10 and 11. http://www.scenichudson.org/sites/default/files/SLRCityofKingston.pdf
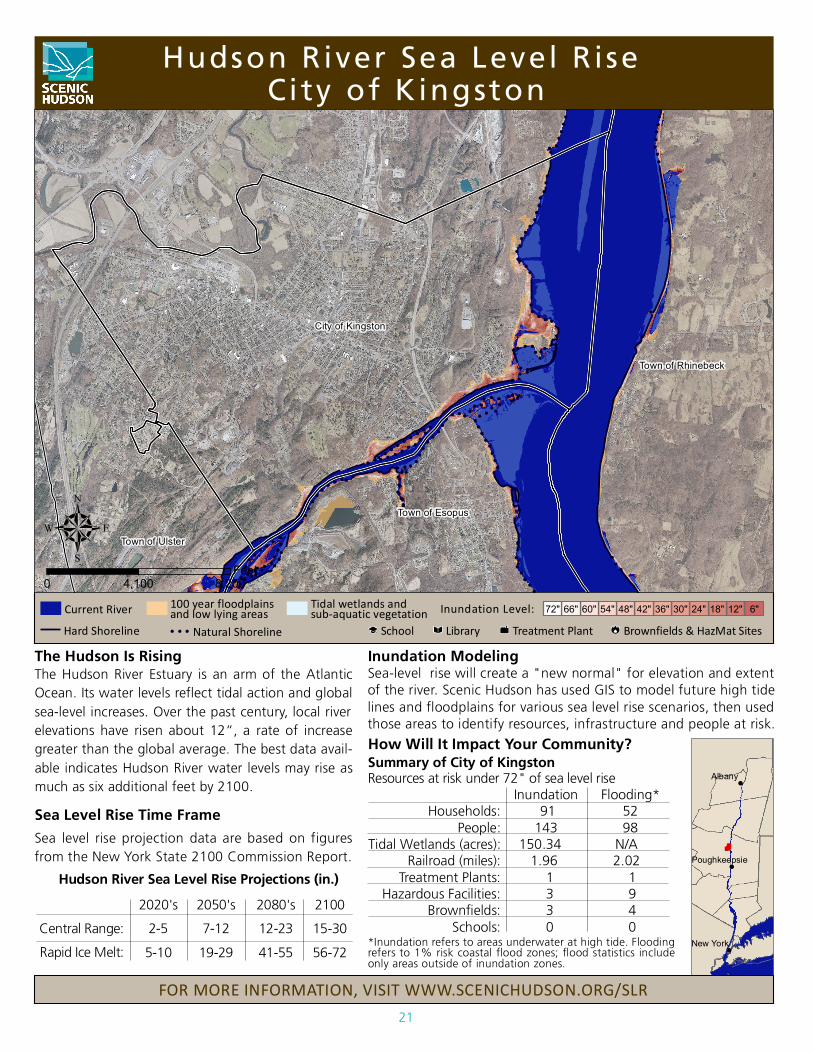
10) Using the charts on page 2 answer the following questions.
a) At an inundation level of 36” how many households are at risk of inundation? How many acres of land are at risk of inundation?
b) At an inundation level of 72” how many households are at risk of inundation? How many acres of land are at risk of inundation?
11) Using examples and numbers, explain what steps you think would be important for the City of Kingston to take in order to prepare for sea level rise and why they are important.
16
PART 2
1) Go to: http://www.scenichudson.org/slr/mapper
2) Locate and zoom into the location specified by your teacher on the map.
3) Similar to what you did in PART 1, investigate this area and a one page long summary of what effects it will experience—and how you think the community could prepare for sea level rise.
17
Name:_____________TEACHER KEY______________________________________________
Sea Level Rise in the Hudson Valley Webquest
In this webquest you will use Scenic Hudson’s Sea Level Rise Mapper to investigate the effects of climate change on areas along the Hudson River. Follow the instructions and answer the questions. If you can’t figure out an answer based on the page you are on, you might need to use the internet to research.
PART 1
1) Go to: www.scenichudson.org/slr/mapper
2) Look at the legend at the bottom of the map:
a) Define “hard shoreline” and “natural shoreline.”
• Hard shoreline: Areas where structural methods have been employed to stabilize the shoreline (e.g., rip rap, jetties, retaining walls).
• Natural shoreline: Areas of shoreline that have been left natural or where natural methods have been used exclusively to stabilize it (e.g., trees, plants, rocky shoreline).
b) The facilities listed in the middle are “Municipal assets.” You can add them to your map (using the layers button at the top) to
see where these facilities are in reference to the shoreline. Why do you think it’s important to highlight the municipal facilities
listed in the legend (railroad, schools, etc.)?
These buildings and structures are essential for community function
c) What other facilities would be good to include on the map?
Any buildings and important structures (for example: parks, businesses, etc.)
d) What does the orange color represent on the map?
100 year floodplain
e) If the sea level rise is 18” and an area above water is now inundated by 6” of water, how will you know?
It will be light blue on the map
18
3) Focus in on the City of Kingston so your screen looks like the picture at left. Click and drag the map to get the Kingston waterfront in the middle of your shot. Zoom in and out using the - + buttons in the top left corner or by double clicking on the map. You will now change sea level and map layers to investigate the effects of sea level rise on the Kingston waterfront
4) Click on “Layers” and then on “Municipal Assets” and “Brownfields and Hazmat Sites”
5) Now using the sea level bar on the left side of the map, click on “+1% flood” and answer the questions below. This is a prediction based on sea level where it is today. It looks at an area that has a 1% chance of being flooded in a given year. This could happen as the result of a large storm event (like a hurricane or tropical storm).
a) At “+1% Flood” how many of the municipal facilities along the Kingston waterfront are in the 100-year floodplain?
Around 10
b) At what height of sea level rise do you think you will start to see significant impacts to the Kingston waterfront?
Answers may vary, around 15 years
6) Select “+36” from the bar on the left. This is based on a moderate prediction of sea level rise by 2100—a possible scenario if humans continue to release greenhouse gases at a steady rate (not much of a change in our behavior) and the ice sheets don’t melt rapidly.
a) At “+36”how many municipal facilities along the Kingston waterfront are in the 100-year floodplain?
Around 10
b) At “+36” how many municipal facilities along the Kingston waterfront are inundated?
Around 6
c) At “+36” what changes do you notice to shoreline on the Kingston waterfront? Summarize how the Kingston waterfront would be affected with a 36-inch rise in sea level.
Answers may vary
7) Select “+72” from the bar on the left. This is the high end of predictions on how much sea level will rise by 2100. It is based on rapid ice melt from the Greenland and Antarctic ice sheets.
a) At “+72”how many municipal facilities along the Kingston waterfront are in the 100-year floodplain?
Around 10
19
b) At “+72” how many municipal facilities along the Kingston waterfront are inundated?
Around 10
c) At “+72” what changes do you notice to shoreline on the Kingston waterfront? Summarize how the Kingston waterfront would be affected with a 72-inch rise in sea level.
Answers may vary
8) Find the wastewater treatment plant in Kingston. At what amount of sea level rise will the plant be inundated? Using the timeline in the bottom of the legend, what is the earliest time this could happen?
At about 30” it is inundated by 6-12 inches of water
9) Under layers turn off the Municipal Assets and Brownfield and Hazmat sites, then click on “Community Summaries” and hover over the city of Kingston so that “City of Kingston” is displayed in the upper right corner. Click on the City of Kingston to open up a fact sheet about Kingston and the effects of sea level rise. Use the fact sheet to answer questions in parts 10 and 11. http://www.scenichudson.org/sites/default/files/SLRCityofKingston.pdf
10) Using the charts on page 2 answer the following questions.
a) At an inundation level of 36” how many households are at risk of inundation? How many acres of land are at risk of inundation?
About 40 households, about 78 acres
b) At an inundation level of 72” how many households are at risk of inundation? How many acres of land are at risk of inundation?
About 90 households, about 130 acres
11) Using examples and numbers, explain what steps you think would be important for the City of Kingston to take in order to prepare for sea level rise and why they are important.
Answers vary, look for:
• Adapting buildings to withstand flooding
• Moving buildings
• Decreasing greenhouse gas emissions
• Preparing community

20
PART 2
1) Go to: http://www.scenichudson.org/slr/mapper
2) Locate and zoom into the location specified by your teacher on the map.
3) Similar to what you did in PART 1, investigate this area and a one page long summary of what effects it will experience—and how you think the community could prepare for sea level rise.
Answers will vary depending on second location of investigation
21
âÑâÑâÑ
âÑ
âÑ
âÑâÑ
âÑâÑ âÑ
âÑ
âÑâÑâ Ñ
âÑ
âÑâÑ
âÑâÑ
âÑâÑâÑ
âÑ
âÑ âÑâÑ
âÑ
âÑ
âÑ
âÑâÑâÑ
âÑ
âÑâÑ
âÑ âÑ
âÑ
âÑâÑ
âÑâ Ñ
âÑ âÑ
âÑ
âÑ
âÑâÑâÑ
âÑâÑ
âÑâÑ
âÑâÑ
âÑâ Ñ
â ÑâÑ
âÑ
âÑâÑ
âÑ
âÑ
âÑâÑ
âÑâ Ñâ Ñ âÑ
âÑ
âÑ
â ÑâÑ
â Ñâ ÑâÑ
âÑâÑ
âÑâÑ
âÑ
âÑâÑ âÑ
âÑ
âÑ
âÑ
âÑâÑâÑ
âÑ âÑ
âÑ
âÑâÑâÑ
âÑâÑ
â Ñ
âÑâÑ
âÑâÑ
âÑâÑ
âÑâÑ
â Ñ
âÑ
âÑâÑ
âÑâÑ
â ÑâÑ
âÑâÑ
âÑâÑ
âÑâÑ
âÑ
â Ñ
âÑ
âÑ
âÑâÑâ Ñ
â Ñ
âÑ
âÑ
âÑ
âÑ
âÑâÑ
â ÑâÑâÑ
âÑâÑâÑ
âÑâÑ
âÑ
â Ñ âÑâÑ âÑ
âÑ
âÑ
âÑ
âÑ
âÑâÑ
âÑ âÑ
âÑ âÑ
âÑâÑ
âÑâ ÑâÑâÑ
âÑâ Ñ
âÑ âÑâÑ âÑ
âÑ
âÑâÑâÑ
âÑâÑ
âÑ
âÑâÑâÑ
âÑâÑâÑâÑâÑâÑ
âÑâÑ
âÑâÑâÑ
âÑâÑâÑ
âÑâÑâÑ â Ñ
âÑ
â ÑâÑ
â Ñ
âÑ
âÑ
âÑ
âÑâÑâÑâÑâÑ
âÑâÑ
âÑâÑ â Ñ
âÑ
âÑâÑâÑ
âÑ âÑâÑâÑ
âÑâÑ
âÑ
âÑâÑâÑâÑ
âÑâÑâÑâ Ñ
âÑâÑ
âÑâÑ âÑ
âÑâÑâÑâÑ
âÑâÑ
âÑ
âÑâÑ
âÑ
âÑ
âÑâÑ
âÑâÑ
âÑâÑ
âÑâÑ
âÑ âÑâÑâÑ
â ÑâÑ
â Ñâ Ñ
âÑ
â Ñâ Ñ
â Ñâ Ñ
âÑâÑâ Ñ
â ÑâÑ
â Ñ
âÑâÑ
âÑ
âÑ
âÑ
âÑâÑ
âÑâÑâÑâÑ
âÑ
âÑ
âÑ
âÑâ Ñâ Ñ
âÑâÑâÑ
â Ñâ Ñ
âÑâÑ
âÑ
âÑâÑâÑ
âÑâ Ñ
âÑâÑ
âÑ
âÑâÑ
âÑ
âÑâÑâÑ
âÑ
âÑâÑâÑâÑâÑ
âÑ
City of Kingston
Town of Ulster
Town of Rhinebeck
Town of Esopus
50 8,2004,100
Feet
!
!
!
Albany
New York
Poughkeepsie
Summary of City of KingstonHow Will It Impact Your Community?
Hudson River Sea Level Rise Ci ty of Kingston
Inundation ModelingThe Hudson Is Rising
Sea Level Rise Time Frame
Hudson River Sea Level Rise Projections (in.)
FOR MORE INFORMATION, VISIT WWW.SCENICHUDSON.ORG/SLR
Current River Inundation Level: 6"12"18"24"30"36"42"48"54"60"66"72"Tidal wetlands andsub-aquatic vegetation
100 year floodplainsand low lying areasâÑ âÑ âÑ Natural ShorelineHard Shoreline Library Brownfields & HazMat SitesSchool Treatment Plant

22
Grant funding provided by the DeCoizart Foundation, the Whitney Foundation, Sean Eldridge andthe Wildlife Conservation Society. Project data or technical assistance provided by the NYS Department of EnvironmentalConservation Hudson River Estuary Program, Dr. Roger Flood of Stony Brook University and the NOAA Coastal Services Center.
Hudson River Sea Level Rise City of Kingston
FOR MORE INFORMATION, VISIT WWW.SCENICHUDSON.ORG/SLR
Adaptation:Defense
Adaptation:Relocate
Adaptation:Accommodate
Acknowledgements:
Coastal defense: Solutions thatprotect existing critical infrastruc-ture - including sea walls, rip rap,
levies and hardened shorelines
Strategic accommodation: Solutions that permit flooding - including
raised infrastructure, adaptive designstrategies and compatible land uses
Managed relocation: Solutions that allowfor inundation and flooding while pro-moting the migration of tidal wetlandsand other important natural resources
With significant challenges ahead, communities have an opportunity to begin planningand implementing long-range solutions that will increase resilience and maintain the vitality of Hudson Riverwaterfronts. A range of innovative approaches to planning, architecture, infrastructure, and natural resourceconservation are available to create locally-appropriate solutions that reduce risk to people, property and naturewhile opening up new possibilities for taking advantage of our region's greatest asset - the Hudson River.
Planning for Resilience:
Adaptation Options: We must find solutions that protect critical infrastructure and ensure the viability of importantnatural resources. The best plans will provide locally specific tactics that balance options for coastal defense, strategicaccommodation and managed relocation.
City of Kingston At risk of inundationAt risk of flooding
People at Risk Land at risk (acres)Households at Risk
Inundation Level Inundation Level Inundation Level
23
EXPLAIN: What Can We Do?
Objectives:
• Students will be able to explain mitigation and adaptation strategies that communities and individuals can undertake to prepare for climate change and sea level rise
• Students will understand how communities can plan for resiliency
Grades: 7-12
Time frame:
• (20-35 minutes) What can we do about climate change and sea level rise? Carousel Activity
• (20 minutes) What can we do? PowerPoint
Introduction:Now that students have had a chance to investigate the impacts of climate change and sea level rise in the Hudson Valley, give them some time to explore the best strategies to mitigate and adapt to these impacts. In addition to brainstorming ways to combat climate change, they will learn how valley communities are making their riverfronts more resilient to rising waters and the likelihood of more frequent flooding.
Background Information for Teachers:Looking to the Future
Learning about the impacts of climate change and sea level rise is the first step in a process of preparing for the future, with a goal of developing climate-resilient communities. A resilient community plans ahead for rising sea levels and severe weather events—investi-gating and implementing strategies that mitigate flooding and other potential damage, allowing it to bounce back more quickly.
There are two ways we can respond to the threat of climate change and prepare for the future—mitigation and adaptation. Mitiga-tion involves attempts to slow climate change and sea level rise; it usually involves decreasing the output of greenhouse gases. Exam-ples of mitigation include using public transportation and reducing deforestation. Adaptation is taking steps to minimize the impacts of climate change and sea level rise. Examples include retrofitting buildings to withstand floodwaters and moving riverfront buildings and infrastructure that eventually will be underwater.
Waterfront Flooding Task Forces
Kingston, Catskill, Piermont and Stony Point established Waterfront Flooding Task Forces to assess threats they face from sea level rise and flooding—and take steps to confront these challenges. Each group started by envisioning what they wanted their community to be in the future. Then using tools like Scenic Hudson’s Sea Level Rise Mapper, they assessed vulnerable neighborhoods, natural assets and infrastructure, and investigated the costs of mitigation and adaptation strategies to protect them. The work of each task force culmi-nated with a report offering recommendations and strategies to make their community more resilient. Visit http://www.dec.ny.gov/energy/93950.html to view the reports.
Kingston Waterfront Case Study
Between 2012 and 2013, the Kingston Waterfront Flooding Task Force met seven times, with about 25 stakeholders (local officials; leaders of environmental, cultural and business organizations; and concerned citizens) at each meeting. Their work was guided by the following principles: preserving the history and sense of community on the waterfront, promoting economic revitalization, prioritizing health and safety, using natural systems to reduce flood risk, securing infrastructure, and promoting Kingston’s Climate Action Plan. They looked at the future of the waterfronts along the Hudson River and Rondout Creek and assessed their vulnerability to inundation from rising sea levels and storms. After prioritizing the city’s assets, the task force found that the water treatment facility near the creek
24
was the most valuable at-risk asset. The group’s final report outlined 24 recommendations—both short- and long-term adaptation and mitigation strategies. Mitigation included implementing Kingston’s Climate Action Plan to reduce the city’s greenhouse gas emissions. Adaptation included using natural buffers and green shoreline infrastructure to reduce flooding and exploring the use of amphibious or floating structures and elevated rights of way. The report also emphasized the need for education and emergency planning to prepare for future severe weather events. The City Council unanimously approved the task forces’ report and has begun to implement some of its strategies.
Vocabulary:
• Resilience: The ability to plan for, withstand and recover from severe events without suffering permanent loss of functions, devastating damage, reduced productivity or diminished quality of life.
• Mitigation: Attempts to slow the process of global climate change, usually by lowering the level of greenhouse gases in the atmosphere.
• Adaptation: Actions or steps taken to minimize impacts from stresses, extreme events or changing conditions.
Materials Required:
• 4-6 Large pieces of paper (butcher paper, poster paper, chart paper)
• Markers
• What can we do? PowerPoint
• What can we do? Guided Notes for each student
Procedure:
1. For the carousel activity: On the 4-6 large pieces of paper, write questions to get students thinking about the future of climate change and sea level rise. Questions could include:
a. How can you decrease carbon pollution at home?
b. How can businesses/schools mitigate climate change?
c. What choices can you make each day to decrease your contribution to carbon pollution?
d. What steps can communities take to prepare for sea level rise?
e. Besides changing your personal habits, what can you do to make a difference when it comes to climate change?
2. Post the papers on walls around the room so there is adequate space around each for students to stand, write and discuss.
3. Divide students into groups, with one group per poster. Give each group a different colored marker to write with.
4. Tell students they are to review/discuss the question and then write down their thoughts on the paper.
5. After students have had time to talk and record their ideas (4-5 minutes should be sufficient), signal that it’s time for them to move clockwise to the next poster.
6. Repeat this procedure until the groups have provided their input on all posters.
7. Have each group return to the initial question they answered and synthesize information contributed by the rest of the class. They should highlight important details, recurring ideas or anything else they find interesting.
25
8. Each group then reports out to the class with a brief summary of the responses.
9. You can then go through the What Can We Do? PowerPoint to discuss further and elicit new ideas
Extensions:
Get students involved in teaching others about how to live a more eco-friendly life.
1. Start a recycling campaign if your school doesn’t have one.
2. Have students come up with ways your school can decrease its carbon emissions. They can make presentations to other class-es about ways to be more eco-friendly.
3. Go on a field trip to plant trees or clean up your local park/schoolyard.
4. Have an Earth Day celebration (April 22) to increase awareness about climate change and mitigation techniques.
5. Have students come up with their own project to help curb greenhouse gas emissions.
Sources:
• Klein, R.J.T., S. Huq, F. Denton, T.E. Downing, R.G. Richels, J.B. Robinson, F.L. Toth, 2007: Inter-relationships between adaptation and mitigation. Climate Change 2007: Impacts, Adaptation and Vulnerability. Contribution of Working Group II to the Fourth Assessment Report of the Intergovernmental Panel on Climate Change, M.L. Parry, O.F. Canziani, J.P. Palutikof, P.J. van der Linden and C.E. Hanson, Eds., Cambridge University Press, Cambridge, UK, 745-777. Retrieved from http://www.ipcc.ch/pdf/assess-ment-report/ar4/wg2/ar4-wg2-chapter18.pdf
• UCAR. (2011). Climate Mitigation and Adaptation. Retrieved from http://scied.ucar.edu/longcontent/climate-mitigation-and-ad-aptation
• United Nations Environment Programme. Climate Change Mitigation. Retrieved from http://www.unep.org/climatechange/miti-gation/Waste/tabid/104349/Default.aspx
• New York State Department of Environmental Conservation. (2015). Hudson River Climate Resilience Case Studies. Retrieved from http://www.dec.ny.gov/energy/93950.html
• Village of Piermont. 2014. Resilience Roadmap: Planning for Piermont’s Future. Report of the Piermont Waterfront Resilience Task Force. Retrieved from http://www.scenichudson.org/ourwork/riverfrontcommunities/waterfrontresiliencetaskforces/piermont
• Churchill, Chris. (2014, February 9). Troy sea wall repair project in line for FEMA funding. Times Union. Retrieved from http://www.timesunion.com/local/article/Troy-sea-wall-repair-project-in-line-for-FEMA-5219642.php
• The City of New York. (June 2013). COASTAL CLIMATE RESILIENCE: Urban Waterfront Adaptive Strategies. Retrieved from http://www.nyc.gov/html/dcp/pdf/sustainable_communities/urban_waterfront_print.pdf
• City of Kingston Tidal Waterfront Flooding Task Force, 2013. Planning for Rising Waters: Final Report of the City of Kingston Tidal Waterfront Flooding Task Force. Published by the City of Kingston 420 Broadway Kingston, NY 12401. Retrieved from http://www.dec.ny.gov/docs/remediation_hudson_pdf/ktowntffr.pdf
26
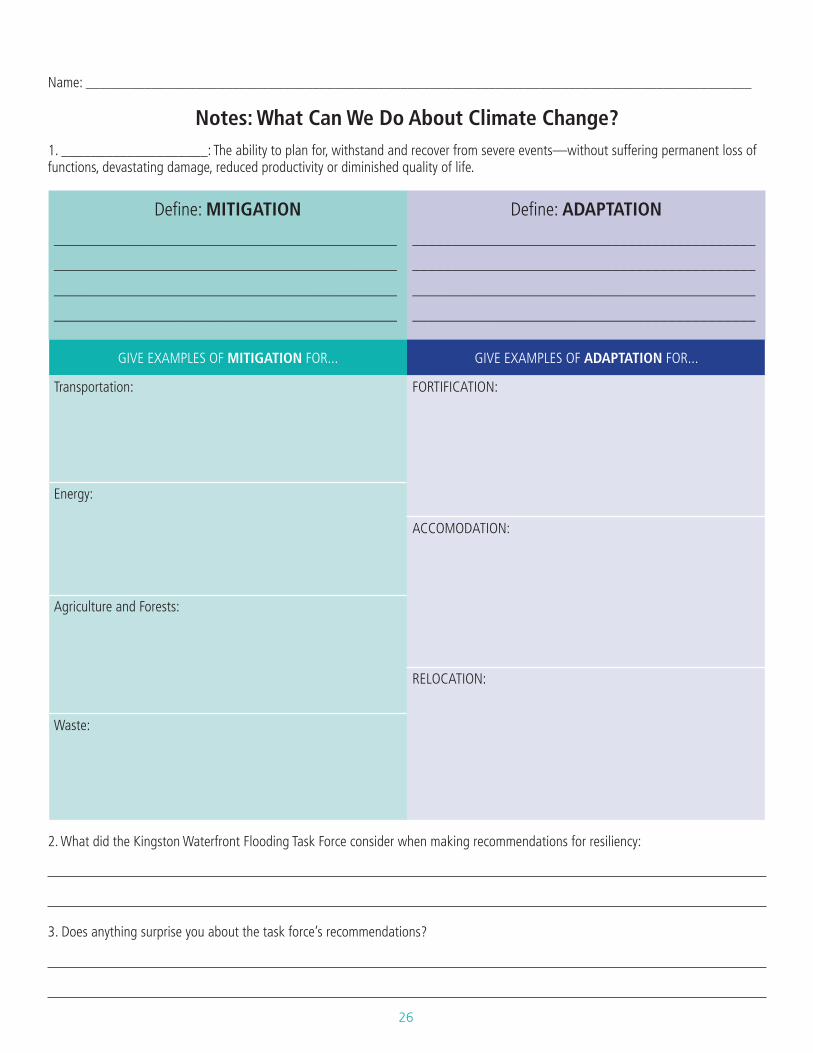
Name: ___________________________________________________________________________________________
Notes: What Can We Do About Climate Change?1. ____________________: The ability to plan for, withstand and recover from severe events—without suffering permanent loss of functions, devastating damage, reduced productivity or diminished quality of life.
Define: MITIGATION Define: ADAPTATION
___________________________________________
___________________________________________
___________________________________________
___________________________________________
___________________________________________
___________________________________________
___________________________________________
___________________________________________
GIVE EXAMPLES OF MITIGATION FOR... GIVE EXAMPLES OF ADAPTATION FOR...
Transportation: FORTIFICATION:
Energy:
ACCOMODATION:
Agriculture and Forests:
RELOCATION:
Waste:
2. What did the Kingston Waterfront Flooding Task Force consider when making recommendations for resiliency:
3. Does anything surprise you about the task force’s recommendations?

27
Name: _______________TEACHER KEY__________________________________________________
Notes: What Can We Do About Climate Change?
1. _RESILIENCE___: The ability to plan for, withstand and recover from severe events—without suffering permanent loss of func-tions, devastating damage, reduced productivity or diminished quality of life.
Define: MITIGATION Define: ADAPTATION
Attempts to slow the process of global climate change,
usually by lowering the level of greenhouse gases in the
atmosphere
Developing ways to protect people and places by reducing
their vulnerability to climate impacts
GIVE EXAMPLES OF MITIGATION FOR... GIVE EXAMPLES OF ADAPTATION FOR...
Transportation:
• hybrid/electric vehicles• public transportation• bicycling
FORTIFICATION:
• sea wall• levee• living shoreline
Energy:
• energy efficiency appliances• alternative energy (solar, wind, etc.)• green building practices
ACCOMODATION:
• floodproofing• elevate on piles• protect/move building systems• floating structures• amphibious structures
Agriculture and Forests:
• organic farming• stopping deforestation• buy local RELOCATION:
• relocate/demolishWaste:
• compost• recycling• buy less stuff
2. What did the Kingston Waterfront Flooding Task Force consider when making recommendations for resiliency:
Vision for the city, health and safety of community, vulnerability of different areas/assets, need to act in short or long term, value of assets, cost of adaptation strategies
3. Does anything surprise you about the task force’s recommendations?
answers may vary
28
ELABORATE: Persuasive Letter to an Elected Official
Objectives:
• Students will use facts and information gathered to write a persuasive letter to an elected official outlining their concerns and ideas about climate change
• Students will demonstrate their knowledge of the effects of climate change on the Hudson River Valley
Grades: 7-12
Time frame:
• (30 minutes) Introduction and explaining how to write a letter to a government official
• (45 minutes or at home) Writing letter
Introduction:
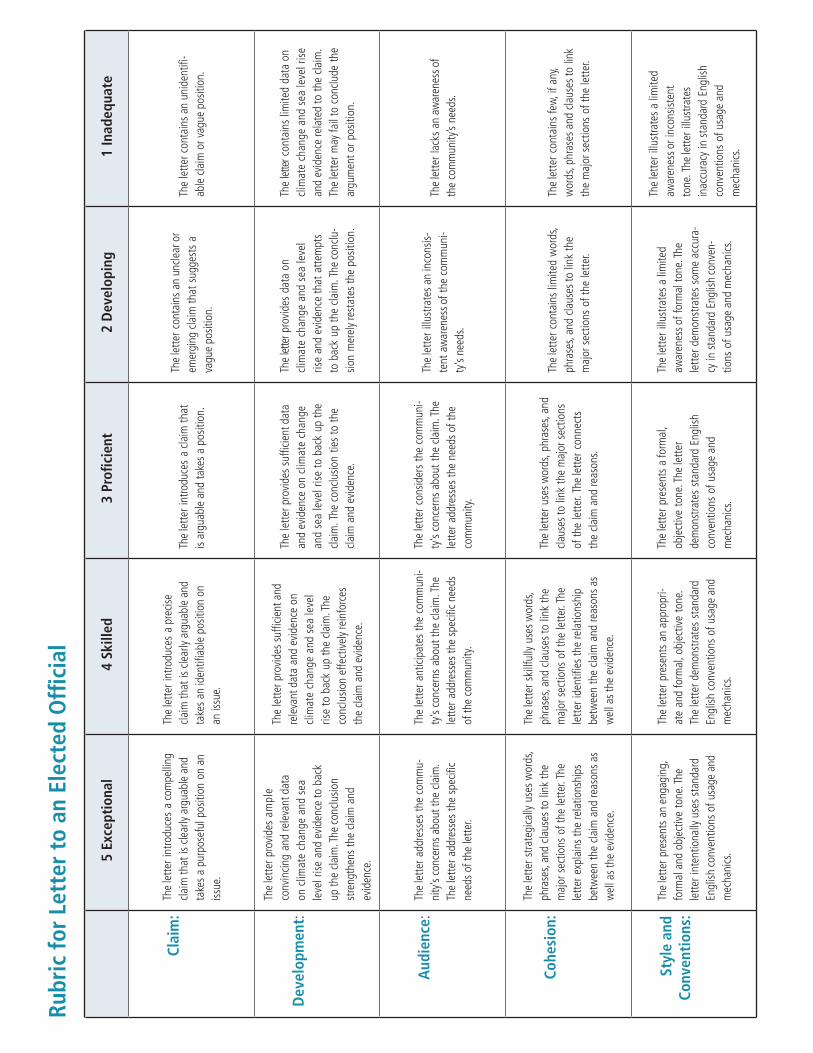
Using information learned in class, including data from Scenic Hudson’s online Sea Level Rise Mapper, students will write a letter to an elected official outlining the risk of sea level rise and explaining proposed solutions. This is a great way to sum up a climate change unit and can serve as a post-assessment of students’ understanding of the topic. The included rubric aligns with Common Core standards.
Background Information for Teachers:
As we have seen in the “EXPLAIN: What Can We Do?” portion of this curriculum, Hudson Valley municipalities have begun making preparations to mitigate the effects of climate change and sea level rise. In many cases, it only takes one concerned citizen speaking up to make changes happen in society. Students’ letters to local officials in their community could ask for specific actions to be taken or simply increase awareness about this pressing issue—the first step in organizing an advocacy campaign. An advocacy campaign begun by concerned citizens is often referred to as a grassroots campaign.
Before writing to an elected official, it is important to outline talking points and determine the goal of your letter. Once you have done research and have solid facts to back up your position, you are ready to explain your concerns and ask the official to take action.
Vocabulary:
• Advocacy: Active promotion of a cause or principle. Taking actions aimed at influencing decisions in support of a given cause.
• Grassroots campaign: A citizen-generated movement to make a change. It relies on the general public to sway political decisions, unlike advocacy done by paid lobbyists.
• Talking Points: Succinct and clear facts to support the side of your argument.
Materials Required:
• Instructions for students on writing a letter to an elected official
Procedure:
1. Give students the instructions for “Writing a Letter to an Elected Official”
2. Go over the format and structure of writing the letter
3. Project the “Sample Letter” up on the board and go through it with students, pointing out the strong points and where the letter could be made stronger. Use the rubric to grade the sample letter.
4. Give students class time to write their letters or assign as a take home assignment.

29
Extensions:
Have students research local agencies and non-profits that are working on the issue of climate change and sea level rise in the Hudson Valley. Students can learn more about what local organizations are doing to promote climate change preparedness. Encourage students to attend meetings, lectures, town hall meetings, conferences, etc. that focus on the issue.
Sources:
• KU Work Group for Letter Health and Development. (2014). Chapter 33, Section 1: Writing Letters to Elected Officials. Lawrence, KS: University of Kansas. Retrieved from http://ctb.ku.edu/en/table-of-contents/advocacy/direct-action/letters-to-elected-officials/main
30
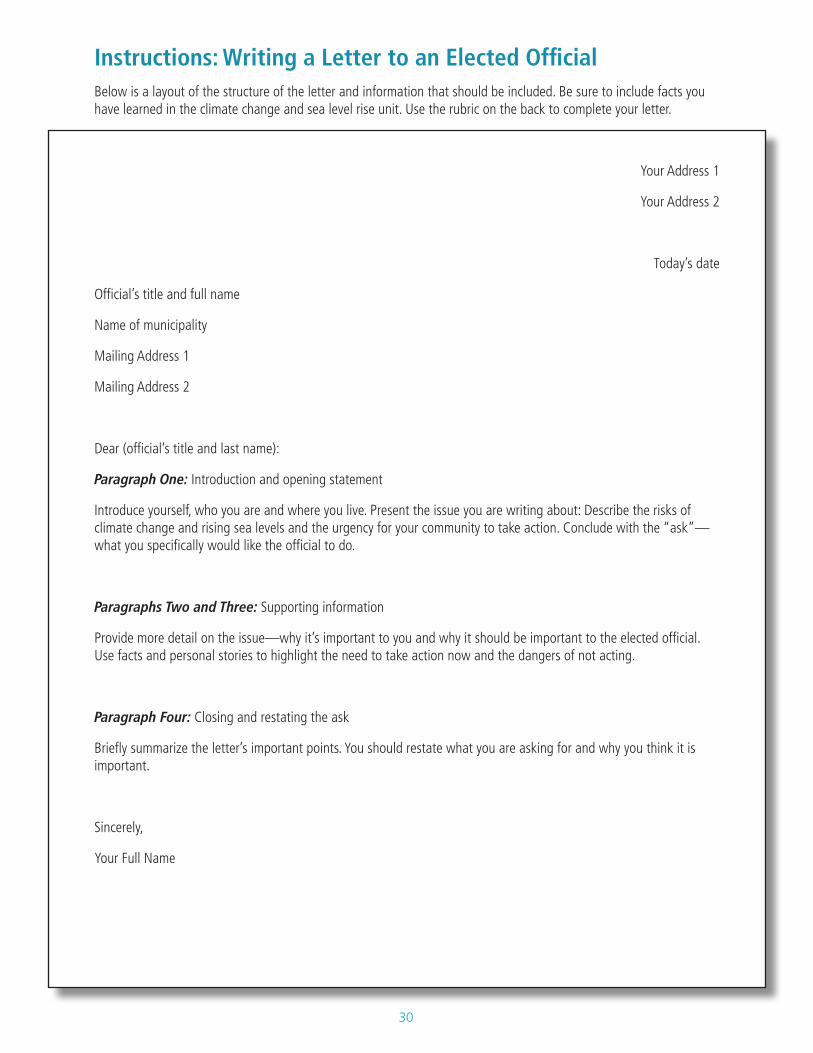
Instructions: Writing a Letter to an Elected OfficialBelow is a layout of the structure of the letter and information that should be included. Be sure to include facts you have learned in the climate change and sea level rise unit. Use the rubric on the back to complete your letter.
Your Address 1
Your Address 2
Today’s date
Official’s title and full name
Name of municipality
Mailing Address 1
Mailing Address 2
Dear (official’s title and last name):
Paragraph One: Introduction and opening statement
Introduce yourself, who you are and where you live. Present the issue you are writing about: Describe the risks of climate change and rising sea levels and the urgency for your community to take action. Conclude with the “ask”—what you specifically would like the official to do.
Paragraphs Two and Three: Supporting information
Provide more detail on the issue—why it’s important to you and why it should be important to the elected official. Use facts and personal stories to highlight the need to take action now and the dangers of not acting.
Paragraph Four: Closing and restating the ask
Briefly summarize the letter’s important points. You should restate what you are asking for and why you think it is important.
Sincerely,
Your Full Name
Rubr
ic fo
r Le
tter
to
an E
lect
ed O
ffici
al
5 Ex
cept
iona
l4
Skill
ed3
Profi
cien
t2
Dev
elop
ing
1 In
adeq
uate
Clai
m:
The
lette
r int
rodu
ces
a co
mpe
lling
cla
im th
at is
cle
arly
argu
able
and
ta
kes
a pu
rpos
eful
pos
ition
on
an
issue
.
The
lette
r int
rodu
ces
a pr
ecise
cla
im th
at is
cle
arly
argu
able
and
ta
kes
an id
entifi
able
pos
ition
on
an is
sue.
The
lette
r int
rodu
ces
a cla
im th
at
is ar
guab
le a
nd ta
kes
a po
sitio
n.
The
lette
r con
tain
s an
unc
lear
or
emer
ging
cla
im th
at s
ugge
sts
a va
gue
posit
ion.
The
lette
r con
tain
s an
uni
dent
ifi-
able
cla
im o
r vag
ue p
ositi
on.
Dev
elop
men
t:
The
lette
r pro
vide
s am
ple
conv
incin
g an
d re
leva
nt d
ata
on c
limat
e ch
ange
and
sea
le
vel r
ise
and
evid
ence
to b
ack
up th
e cla
im. T
he co
nclu
sion
stre
ngth
ens
the
claim
and
ev
iden
ce.
The
lette
r pro
vide
s su
fficie
nt a
nd
rele
vant
dat
a an
d ev
iden
ce o
n cl
imat
e ch
ange
and
sea
leve
l ris
e to
bac
k up
the
claim
. The
co
nclu
sion
effe
ctiv
ely r
einf
orce
s th
e cla
im a
nd e
vide
nce.
The
lette
r pro
vide
s su
fficie
nt d
ata
and
evid
ence
on
clim
ate
chan
ge
and
sea
leve
l ris
e to
bac
k up
the
claim
. The
con
clusio
n tie
s to
the
claim
and
evi
denc
e.
The
lette
r pro
vide
s da
ta o
n cl
imat
e ch
ange
and
sea
leve
l ris
e an
d ev
iden
ce th
at a
ttem
pts
to b
ack
up th
e cla
im. T
he co
nclu
-sio
n m
erel
y re
stat
es th
e po
sitio
n.
The
lette
r con
tain
s lim
ited
data
on
clim
ate
chan
ge a
nd s
ea le
vel r
ise
and
evid
ence
rela
ted
to th
e cla
im.
The
lette
r may
fail
to c
onclu
de th
e ar
gum
ent o
r pos
ition
.
Aud
ienc
e:Th
e le
tter a
ddre
sses
the
com
mu-
nity
’s co
ncer
ns a
bout
the
claim
. Th
e le
tter a
ddre
sses
the
spec
ific
need
s of
the
lette
r.
The
lette
r ant
icipa
tes
the
com
mun
i-ty
’s co
ncer
ns a
bout
the
claim
. The
le
tter a
ddre
sses
the
spec
ific
need
s of
the
com
mun
ity.
The
lette
r con
sider
s th
e co
mm
uni-
ty’s
conc
erns
abo
ut th
e cla
im. T
he
lette
r add
ress
es th
e ne
eds o
f the
co
mm
unity
.
The
lette
r illu
stra
tes
an in
cons
is-te
nt a
war
enes
s of t
he c
omm
uni-
ty’s
need
s.
The
lette
r lac
ks a
n aw
aren
ess o
f th
e co
mm
unity
’s ne
eds.
Cohe
sion
:
The
lette
r stra
tegi
cally
use
s wor
ds,
phra
ses,
and
claus
es to
link
the
maj
or s
ectio
ns o
f the
lette
r. Th
e le
tter e
xpla
ins
the
rela
tions
hips
be
twee
n th
e cla
im a
nd re
ason
s as
wel
l as t
he e
vide
nce.
The
lette
r ski
llful
ly us
es w
ords
, ph
rase
s, an
d cla
uses
to li
nk th
e m
ajor
sec
tions
of t
he le
tter.
The
lette
r ide
ntifi
es th
e re
latio
nshi
p be
twee
n th
e cla
im a
nd re
ason
s as
wel
l as t
he e
vide
nce.
The
lette
r use
s wor
ds, p
hras
es, a
nd
claus
es to
link
the
maj
or s
ectio
ns
of th
e le
tter.
The
lette
r con
nect
s th
e cla
im a
nd re
ason
s.
The
lette
r con
tain
s lim
ited
wor
ds,
phra
ses,
and
claus
es to
link
the
maj
or s
ectio
ns o
f the
lette
r.
The
lette
r con
tain
s fe
w, if
any
, w
ords
, phr
ases
and
cla
uses
to li
nk
the
maj
or s
ectio
ns o
f the
lette
r.
Styl
e an
d Co
nven
tion
s:
The
lette
r pre
sent
s an
eng
agin
g,
form
al a
nd o
bjec
tive
tone
. The
le
tter i
nten
tiona
lly u
ses s
tand
ard
Engl
ish co
nven
tions
of u
sage
and
m
echa
nics
.
The
lette
r pre
sent
s an
app
ropr
i-at
e an
d fo
rmal
, obj
ectiv
e to
ne.
The
lette
r dem
onst
rate
s st
anda
rd
Engl
ish c
onve
ntio
ns o
f usa
ge a
nd
mec
hani
cs.
The
lette
r pre
sent
s a
form
al,
obje
ctiv
e to
ne. T
he le
tter
dem
onst
rate
s st
anda
rd E
nglis
h co
nven
tions
of u
sage
and
m
echa
nics
.
The
lette
r illu
stra
tes
a lim
ited
awar
enes
s of f
orm
al to
ne. T
he
lette
r dem
onst
rate
s so
me
accu
ra-
cy in
sta
ndar
d En
glish
conv
en-
tions
of u
sage
and
mec
hani
cs.
The
lette
r illu
stra
tes
a lim
ited
awar
enes
s or i
ncon
siste
nt
tone
. The
lette
r illu
stra
tes
inac
cura
cy in
sta
ndar
d En
glish
co
nven
tions
of u
sage
and
m
echa
nics
.
32
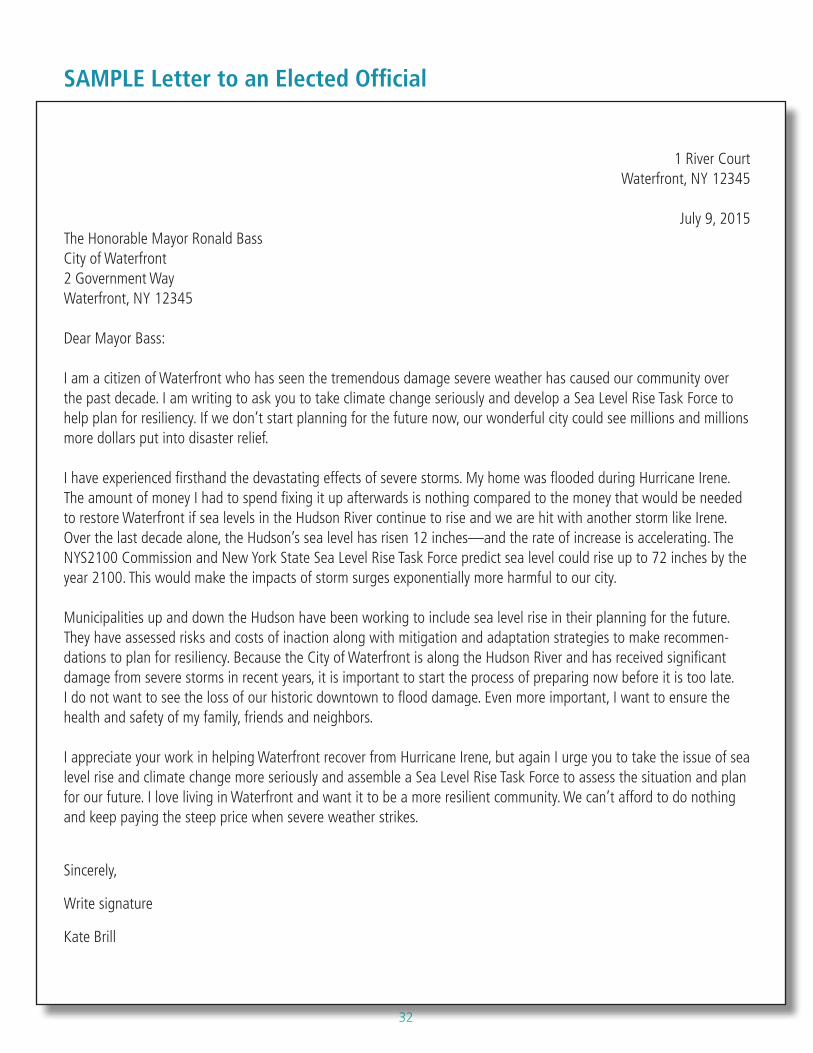
SAMPLE Letter to an Elected Official
1 River CourtWaterfront, NY 12345
July 9, 2015The Honorable Mayor Ronald BassCity of Waterfront2 Government WayWaterfront, NY 12345
Dear Mayor Bass:
I am a citizen of Waterfront who has seen the tremendous damage severe weather has caused our community over the past decade. I am writing to ask you to take climate change seriously and develop a Sea Level Rise Task Force to help plan for resiliency. If we don’t start planning for the future now, our wonderful city could see millions and millions more dollars put into disaster relief.
I have experienced firsthand the devastating effects of severe storms. My home was flooded during Hurricane Irene. The amount of money I had to spend fixing it up afterwards is nothing compared to the money that would be needed to restore Waterfront if sea levels in the Hudson River continue to rise and we are hit with another storm like Irene. Over the last decade alone, the Hudson’s sea level has risen 12 inches—and the rate of increase is accelerating. The NYS2100 Commission and New York State Sea Level Rise Task Force predict sea level could rise up to 72 inches by the year 2100. This would make the impacts of storm surges exponentially more harmful to our city.
Municipalities up and down the Hudson have been working to include sea level rise in their planning for the future. They have assessed risks and costs of inaction along with mitigation and adaptation strategies to make recommen-dations to plan for resiliency. Because the City of Waterfront is along the Hudson River and has received significant damage from severe storms in recent years, it is important to start the process of preparing now before it is too late. I do not want to see the loss of our historic downtown to flood damage. Even more important, I want to ensure the health and safety of my family, friends and neighbors.
I appreciate your work in helping Waterfront recover from Hurricane Irene, but again I urge you to take the issue of sea level rise and climate change more seriously and assemble a Sea Level Rise Task Force to assess the situation and plan for our future. I love living in Waterfront and want it to be a more resilient community. We can’t afford to do nothing and keep paying the steep price when severe weather strikes.
Sincerely,
Write signature
Kate Brill
33
Standards Covered by the Sea Level Rise in the Hudson Valley Curriculum
NYS Science Core Curriculum:
NYS Intermediate Level Science Grades: 5-8
Standard 1— Analysis, Inquiry, and Design
S1.3 Represent, present, and defend their proposed explanations of everyday observations so they can be understood by others
S1.4 Seek to clarify, to assess critically, and to reconcile with their own thinking the ideas presented by others, including peers, teachers, authors, and scientists
S3.2d Formulate and defend explanations and conclusions as they relate to scientific phenomena
T1.1a Identify a scientific or human need that is subject to a technological solution which applies scientific principles
T1.3 Consider constraints and generate several ideas for alternative solutions, using group and individual ideation techniques (group discussion, brainstorming, forces connections, role play); defer judgement until a number of ideas have been generated; evaluate (critique) ideas; and explain why the chosen solution is optimal
Standard 6— Interconnectedness: Common Themes
2.2 Use models to study processes that cannot be studied directly (e.g., when the real process is too slow, too fast, or too dangerous for direct observation)
3.1 Cite examples of how different aspects of natural and designed systems change at different rates with changes in scale
5.2 Observe patterns of change in trends or cycles and make predictions on what might happen in the future
6.1 Determine the criteria and the constraints and make trade-offs to determine the best decision
Standard 7—Interdisciplinary Problem Solving
1.3 Design solutions to real-world problems of general social interest related to home, school, or community using scientific experimentation to inform the solution and applying mathematical concepts and reasoning to assist in developing a solution
Standard 4—The Living Environment
7.2d Since the Industrial Revolution, human activities have resulted in major pollution of air, water, and soil. Pollution has cumulative ecological effects such as acid rain, global warming, or ozone depletion. The survival of living things on our planet depends on the conservation and protection of Earth’s resources
Standard 4—The Physical Setting
2.2i Weather describes the conditions of the atmosphere at a given location for a short period of time
2.2j Climate is the characteristic weather that prevails from season to season and year to year
2.2q Hazardous weather conditions include thunderstorms, tornadoes, hurricanes, ice storms, and blizzards. Humans can prepare for and respond to these conditions if given sufficient warning
2.2r Substances enter the atmosphere naturally and from human activity. Some of these substances include dust from volvanic eruptions and greenhouse gases such as carbon dioxide, methane, and water vapor. These substances can affect weather, climate, and living things
34
Physical Setting/Earth Science
Standard 2— Information Systems
Key Idea 1 Information technology is used to retrieve, process, and communicate information as a tool to enhance learning
Standard 6— Interconnectedness Common Themes
Key Idea 2 Models are simplified representations of objects, structures, or systems used in analysis, explanation, interpreta-tion, or design
Optimization: Key Idea 6 In order to arrive at the best solution that meets criteria whithin constraints, it is often necessary to make trade-offs
Standard 7— Interdisciplinary Problem Solving
Key Idea 1 The knowledge and skills of mathematics, science, and technology are used together to make informed decisions and solve problems, especially those relating to issues of science/technology/society, consumer decisions, design, and inquiry into phenomena
Key Idea 2 Solving interdisciplinary problems involves a variety of skills and strategies, including effective work habits; gath-ering and processing information; generating and analyzing ideas; realizing ideas; making connections among the common themes of mathematics, science, and technology; and presenting results
Standard 4— The Physical Setting
1.1i Approximately 70% of Earth’s surface is covered by a relatively thin layer of water, which responds to the gravitational attraction of the moon and the Sun with a daily cycle of high and low tides
2.1a Earth systems have internal and external sources of energy, both of which create heat
2.2d Temperature and precipitation patterns are altered by:• Natural events such as El Nino and volcanic eruptions
• Human influences including deforestation, urbanization, and the production of greenhouse gases such as carbon dioxide and methane
The Living Environment
Standard 1— Analysis, Inquiry, and Design
1.2a Inquiry involves asking questions and locating, interpreting, and processing information from a variety of sources.
Standard 4— The Living Environment
1.1f Every population is linked, directly or indirectly, with many others in an ecosystem. Disruptions in the numbers and types of species and environmental changes can upset ecosystem stability
6.3c A stable ecosystem can be altered, either rapidly or slowly, through the activities of organisms (including humans), or through climatic changes or natural disasters. The altered ecosystem can usually recover through gradual changes back to a point of long term stability
7.1c Human beings are part of the Earth’s ecosystems. Human activities can, deliberately or inadvertently, alter the equilibrium in ecosystems. Humans modify ecosystems as a result of population growth, consumption, and technology. Human destruction of habitats through direct harvesting, pollution, atmospheric changes, and other factors is threatening current global stability, and if not addressed, ecosystems may be irreversibly affected
7.3a Societies must decide on proposals which involve the introduction of new technologies. Individuals need to make deci-sions which will assess risks, costs, benefits, and trade-offs
7.3b The decisions of one generation both provide and limit the range of possibilities open to the next generation
35
Next Generation Science Standards:Disciplinary Core Ideas in Earth and Space Science
ESS3.D: Global Climate Change
Human activities, such as the release of greenhouse gases from burning fossil fuels, are major factors in the current rise in Earth’s mean surface temperature (global warming). Reducing the level of climate change and reducing human vulnerability to whatever climate changes do occur depend on the understanding of climate science, engineering capabilities, and other kinds of knowledge, such as understanding of human behavior and on applying that knowledge wisely in decisions and activities.
HS-ESS3-5 Though the magnitude of human impacts are greater than they have ever been, so too are human abilities to model, predict , and manage current and future impacts.
Disciplinary Core Ideas in Life Science
LS2.C: Ecosystem Dynamics, Functioning, and Resilience
HS-LS2-7 Moreover, anthropogenic changes (induced by human activity) in the environment—including habitat destruction, pollution, introduction of invasive species, overexploitation, and climate change—can disrupt an ecosystem and threaten the survival of some species.
Disciplinary Core Ideas Engineering Design
ETS1.A: Defining and Delimiting Engineering Problems
ETS1.B: Developing Possible Solutions
Grades 6-12 Common Core Standards:
CCSS.ELA-LITERACY.RST.6-8.4; CCSS.ELA-LITERACY.RST.9-10.4; CCSS.ELA-LITERACY.RST.11-12.4
Determine the meaning of symbols, key terms, and other domain-specific words and phrases as they are used in a specific scientific or technical context relevant to grade level texts and topics.
CCSS.ELA-LITERACY.WHST.6-8.1; CCSS.ELA-LITERACY.WHST.9-10.1; CCSS.ELA-LITERACY.WHST.11-12.1
Write arguments focused on discipline-specific content.
CCSS.ELA-LITERACY.WHST.6-8.4; CCSS.ELA-LITERACY.WHST.9-10.4; CCSS.ELA-LITERACY.WHST.11-12.4
Produce clear and coherent writing in which the development, organization, and style are appropriate to task, purpose, and audi-ence.
CCSS.ELA-LITERACY.WHST.6-8.7; CCSS.ELA-LITERACY.WHST.9-10.7; CCSS.ELA-LITERACY.WHST.11-12.7
Conduct short research projects to answer a question (including a self-generated question), drawing on several sources and gener-ating additional related, focused questions that allow for multiple avenues of exploration.