investigating shared leadership in undergraduate capstone ... · this quantitative study used a...
TRANSCRIPT
Investigating Shared Leadership in Undergraduate Capstone Design Teams
Brian John Novoselich
Dissertation submitted to the faculty of the Virginia Polytechnic Institute and State
University in partial fulfillment of the requirements for the degree of
Doctor of Philosophy
In
Engineering Education
David B. Knight, Chair
Eric K. Kaufman
Holly M. Matusovich
Marie C. Paretti
15 March, 2016
Blacksburg, VA
Keywords: Engineering Education, Mechanical Engineering Design, Shared Leadership,
Social Network Analysis, Transformational Leadership
Copyright Brian J. Novoselich, 2016
Investigating Shared Leadership in Undergraduate Capstone Design Teams
Brian John Novoselich
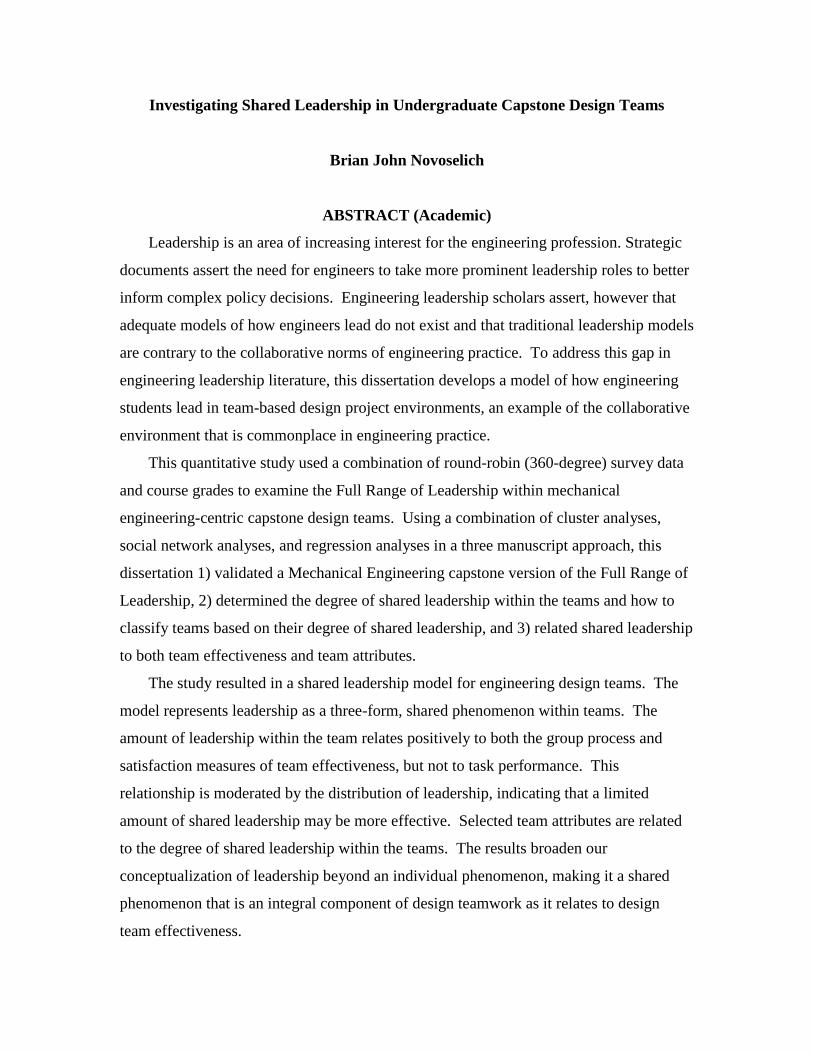
ABSTRACT (Academic)
Leadership is an area of increasing interest for the engineering profession. Strategic
documents assert the need for engineers to take more prominent leadership roles to better
inform complex policy decisions. Engineering leadership scholars assert, however that
adequate models of how engineers lead do not exist and that traditional leadership models
are contrary to the collaborative norms of engineering practice. To address this gap in
engineering leadership literature, this dissertation develops a model of how engineering
students lead in team-based design project environments, an example of the collaborative
environment that is commonplace in engineering practice.
This quantitative study used a combination of round-robin (360-degree) survey data
and course grades to examine the Full Range of Leadership within mechanical
engineering-centric capstone design teams. Using a combination of cluster analyses,
social network analyses, and regression analyses in a three manuscript approach, this
dissertation 1) validated a Mechanical Engineering capstone version of the Full Range of
Leadership, 2) determined the degree of shared leadership within the teams and how to
classify teams based on their degree of shared leadership, and 3) related shared leadership
to both team effectiveness and team attributes.
The study resulted in a shared leadership model for engineering design teams. The
model represents leadership as a three-form, shared phenomenon within teams. The
amount of leadership within the team relates positively to both the group process and
satisfaction measures of team effectiveness, but not to task performance. This
relationship is moderated by the distribution of leadership, indicating that a limited
amount of shared leadership may be more effective. Selected team attributes are related
to the degree of shared leadership within the teams. The results broaden our
conceptualization of leadership beyond an individual phenomenon, making it a shared
phenomenon that is an integral component of design teamwork as it relates to design
team effectiveness.
Investigating Shared Leadership in Undergraduate Capstone Design Teams
Brian John Novoselich
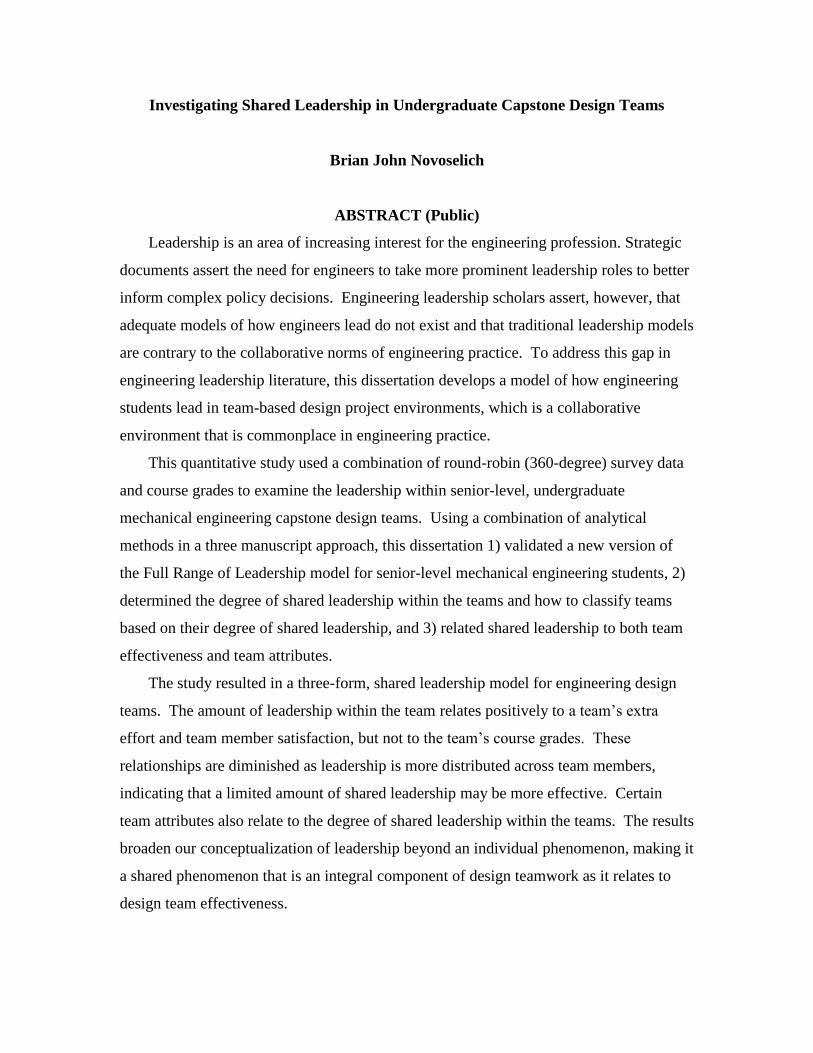
ABSTRACT (Public)
Leadership is an area of increasing interest for the engineering profession. Strategic
documents assert the need for engineers to take more prominent leadership roles to better
inform complex policy decisions. Engineering leadership scholars assert, however, that
adequate models of how engineers lead do not exist and that traditional leadership models
are contrary to the collaborative norms of engineering practice. To address this gap in
engineering leadership literature, this dissertation develops a model of how engineering
students lead in team-based design project environments, which is a collaborative
environment that is commonplace in engineering practice.
This quantitative study used a combination of round-robin (360-degree) survey data
and course grades to examine the leadership within senior-level, undergraduate
mechanical engineering capstone design teams. Using a combination of analytical
methods in a three manuscript approach, this dissertation 1) validated a new version of
the Full Range of Leadership model for senior-level mechanical engineering students, 2)
determined the degree of shared leadership within the teams and how to classify teams
based on their degree of shared leadership, and 3) related shared leadership to both team
effectiveness and team attributes.
The study resulted in a three-form, shared leadership model for engineering design
teams. The amount of leadership within the team relates positively to a team’s extra
effort and team member satisfaction, but not to the team’s course grades. These
relationships are diminished as leadership is more distributed across team members,
indicating that a limited amount of shared leadership may be more effective. Certain
team attributes also relate to the degree of shared leadership within the teams. The results
broaden our conceptualization of leadership beyond an individual phenomenon, making it
a shared phenomenon that is an integral component of design teamwork as it relates to
design team effectiveness.
iv
Dedication
To Janet
Thank you for your loving support of my many endeavors.
Sometimes you can see me better than I can see myself.
To John and Andrew
May this dissertation be an example of what you can achieve when you believe in
yourself, set goals, and work hard. Thank you for being a source of inspiration and a joy.
v
Acknowledgements
I would like to express my deepest gratitude to Dr. David B. Knight. I truly
appreciate your continued support to my academic development. Thank you for joining
me on this Ph.D. journey. I find myself very lucky that we both became Hokies in the
same semester. Dr. Holly Matusovich, thank you for making me feel a part of the team,
even from as far away as Afghanistan. I appreciate the early introduction to the writing
support group and for helping me laugh and remember that, “it’s a process.” To Dr. Eric
Kaufman, thank you for opening my eyes to a wider view of the leadership phenomenon.
Yours was the first classroom I entered on this Ph.D. journey and I am a better person for
the experience. Dr. Marie Paretti, thank you for introducing me to design education
research and the capstone design community. The possibilities are endless, and the
rewards to the student are many.
To the capstone coordinators and collaborators at all three research sites. Your
selfless support to this research project was critical to its success.
Thank you to the DEEP lab and the members of “cognitive adjustment hour”. I am
privileged to call you my academic siblings. Your suggestions and support were critical
to getting over the bumps and through the tough times. Thank you for making the past
three years a great experience. I look forward to working together in the future.
To Mom and Dad, Debbie, Chris, Brad, and Emily. Thanks for your continued support
through my many exciting endeavors. Not in my wildest dreams could I envision
transitioning from combat in Afghanistan to getting a Ph.D. in Blacksburg, Virginia.
vi
TABLE OF CONTENTS
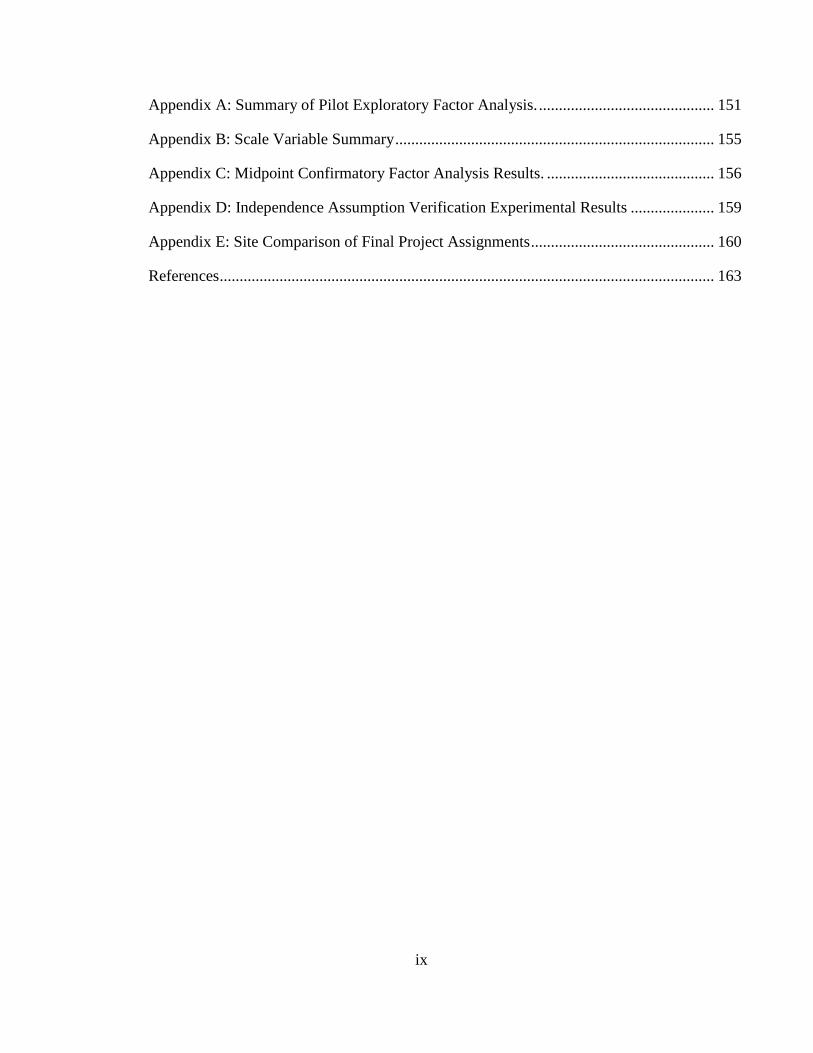
List of Tables ........................................................................................................................... x
List of Figures ....................................................................................................................... xiii
Chapter 1 .................................................................................................................................. 1
1.1 Leadership Development for Undergraduate Engineering Students ............................. 1
1.2 Need for this Research ................................................................................................... 3
1.3 Purpose of the Study ...................................................................................................... 5
1.4 Methods Overview ........................................................................................................ 8
1.5 Significance of the Study ............................................................................................... 8
1.5.1 Implications for Research ....................................................................................... 8
1.5.2 Implications for Practice ......................................................................................... 9
1.6 Definitions ................................................................................................................... 10
Chapter 2 ................................................................................................................................ 13
2.1 Population and Sample Justification ............................................................................ 13
2.2 Site Selection and Demographics ................................................................................ 13
2.3 Capstone Design Course Comparison ......................................................................... 14
Chapter 3 ................................................................................................................................ 20
3.1 Abstract ........................................................................................................................ 20
3.2 Introduction ................................................................................................................. 21
3.3 Leadership Theory and Review of the Literature ........................................................ 22
3.3.1 The Full Range of Leadership .............................................................................. 22
3.3.2 Measuring the Full Range of Leadership .............................................................. 23
3.3.3 Validating The Full Range of Leadership for Engineering Design Teams .......... 26
3.4 Data and Methods ........................................................................................................ 30
3.4.1 Data Collection ..................................................................................................... 30
3.4.2 Addressing Research Question 1: Internal Structure ............................................ 32
3.4.3 Addressing Research Question 2: Relationships to Other Variables .................... 34
vii
3.4.4 Limitations ............................................................................................................ 36
3.5 Results and Discussion ................................................................................................ 37
3.5.1 ME Capstone Leadership Model Verification ...................................................... 37
3.5.2 Interpretation of the three leadership scales ......................................................... 41
3.5.3 Evidence of Validity for Leadership Scales ......................................................... 44
3.6 Conclusions ................................................................................................................. 48
3.7 Future Work ................................................................................................................. 49
Chapter 4: ............................................................................................................................... 51
4.1 Abstract ........................................................................................................................ 51
4.2 Introduction ................................................................................................................. 52
4.3 Review of the Literature .............................................................................................. 54
4.3.1 Leadership Model ................................................................................................. 54
4.3.2 Shared Leadership ................................................................................................ 56
4.3.3 Classifying Leadership Sharedness in Teams ....................................................... 58
4.4 Data and Methods ........................................................................................................ 59
4.4.1 Data Collection ..................................................................................................... 59
4.4.2 Methods ................................................................................................................ 61
4.4.3 Limitations ............................................................................................................ 69
4.5 Results and Discussion ................................................................................................ 71
4.5.1 Addressing Research Question 1: Shared Leadership in Teams .......................... 71
4.5.2 Addressing Research Question 2: Team Classification ........................................ 74
4.6 Implications ................................................................................................................. 76
4.7 Conclusions and Future Work ..................................................................................... 78
Chapter 5 ................................................................................................................................ 81
5.1 Abstract ........................................................................................................................ 81
5.2 Introduction ................................................................................................................. 82
5.3 Review of the Literature .............................................................................................. 83
viii
5.3.1 Effectiveness of Shared Leadership (RQ1) .......................................................... 83
5.3.2 Effective Forms of Leadership ............................................................................. 84
5.3.3 Team Level Attributes Related to Shared Leadership (RQ2) ............................... 86
5.3.4 Summary of Hypotheses ....................................................................................... 93
5.4 Data and Methods ........................................................................................................ 94
5.4.1 Data Collection ..................................................................................................... 94
5.4.2 Methods ................................................................................................................ 96
5.4.3 Limitations .......................................................................................................... 108
5.5 Results and Discussion .............................................................................................. 109
5.5.1 Addressing Research Question 1: Relating Shared Leadership to Team
Effectiveness ....................................................................................................................... 109
5.5.2 Addressing Research Question 2: Team Level Attribute Relationships ............ 118
5.6 Conclusions ............................................................................................................... 134
5.7 Future Work ............................................................................................................... 138
Chapter 6 .............................................................................................................................. 140
6.1 Introduction ............................................................................................................... 140
6.2 An Illustration of Effective Leadership for ME-Centric Capstone Design
Teams ...................................................................................................................................... 141
6.2.1 The Full Range of Leadership for Design Teams ............................................... 141
6.2.2 Shared Leadership in Design Teams .................................................................. 142
6.2.3 Shared Leadership’s Relationship to Team Effectiveness and Attributes. ......... 142
6.2.4 Visualizing Effective Design Team Leadership ................................................. 143
6.3 Implications ............................................................................................................... 146
6.3.1 Implications for Engineering Education Practice ............................................... 146
6.3.2 Implications for Engineering Education Research ............................................. 147
6.4 Future Studies ............................................................................................................ 148
6.5 Concluding Remarks ................................................................................................. 149
ix
Appendix A: Summary of Pilot Exploratory Factor Analysis. ............................................ 151
Appendix B: Scale Variable Summary ................................................................................ 155
Appendix C: Midpoint Confirmatory Factor Analysis Results. .......................................... 156
Appendix D: Independence Assumption Verification Experimental Results ..................... 159
Appendix E: Site Comparison of Final Project Assignments .............................................. 160
References ............................................................................................................................ 163
x
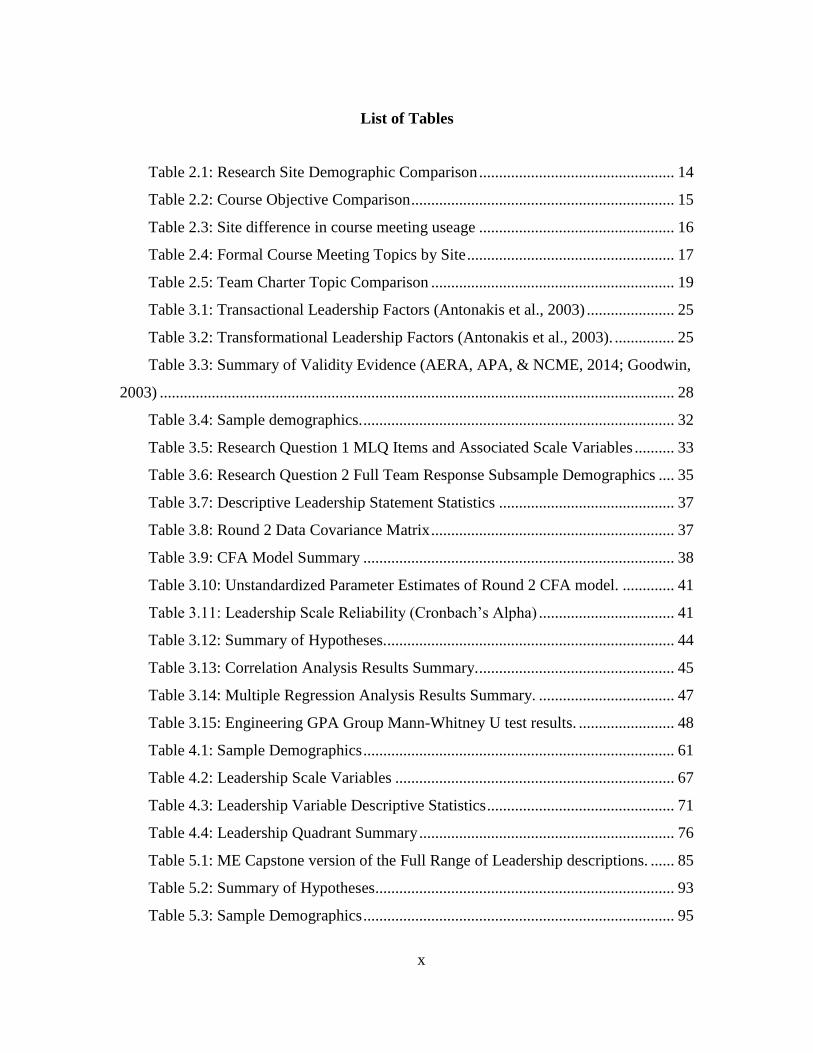
List of Tables
Table 2.1: Research Site Demographic Comparison ................................................. 14
Table 2.2: Course Objective Comparison .................................................................. 15
Table 2.3: Site difference in course meeting useage ................................................. 16
Table 2.4: Formal Course Meeting Topics by Site .................................................... 17
Table 2.5: Team Charter Topic Comparison ............................................................. 19
Table 3.1: Transactional Leadership Factors (Antonakis et al., 2003) ...................... 25
Table 3.2: Transformational Leadership Factors (Antonakis et al., 2003). ............... 25
Table 3.3: Summary of Validity Evidence (AERA, APA, & NCME, 2014; Goodwin,
2003) ................................................................................................................................. 28
Table 3.4: Sample demographics. .............................................................................. 32
Table 3.5: Research Question 1 MLQ Items and Associated Scale Variables .......... 33
Table 3.6: Research Question 2 Full Team Response Subsample Demographics .... 35
Table 3.7: Descriptive Leadership Statement Statistics ............................................ 37
Table 3.8: Round 2 Data Covariance Matrix ............................................................. 37
Table 3.9: CFA Model Summary .............................................................................. 38
Table 3.10: Unstandardized Parameter Estimates of Round 2 CFA model. ............. 41
Table 3.11: Leadership Scale Reliability (Cronbach’s Alpha) .................................. 41
Table 3.12: Summary of Hypotheses......................................................................... 44
Table 3.13: Correlation Analysis Results Summary. ................................................. 45
Table 3.14: Multiple Regression Analysis Results Summary. .................................. 47
Table 3.15: Engineering GPA Group Mann-Whitney U test results. ........................ 48
Table 4.1: Sample Demographics .............................................................................. 61
Table 4.2: Leadership Scale Variables ...................................................................... 67
Table 4.3: Leadership Variable Descriptive Statistics ............................................... 71
Table 4.4: Leadership Quadrant Summary ................................................................ 76
Table 5.1: ME Capstone version of the Full Range of Leadership descriptions. ...... 85
Table 5.2: Summary of Hypotheses........................................................................... 93
Table 5.3: Sample Demographics .............................................................................. 95
xi
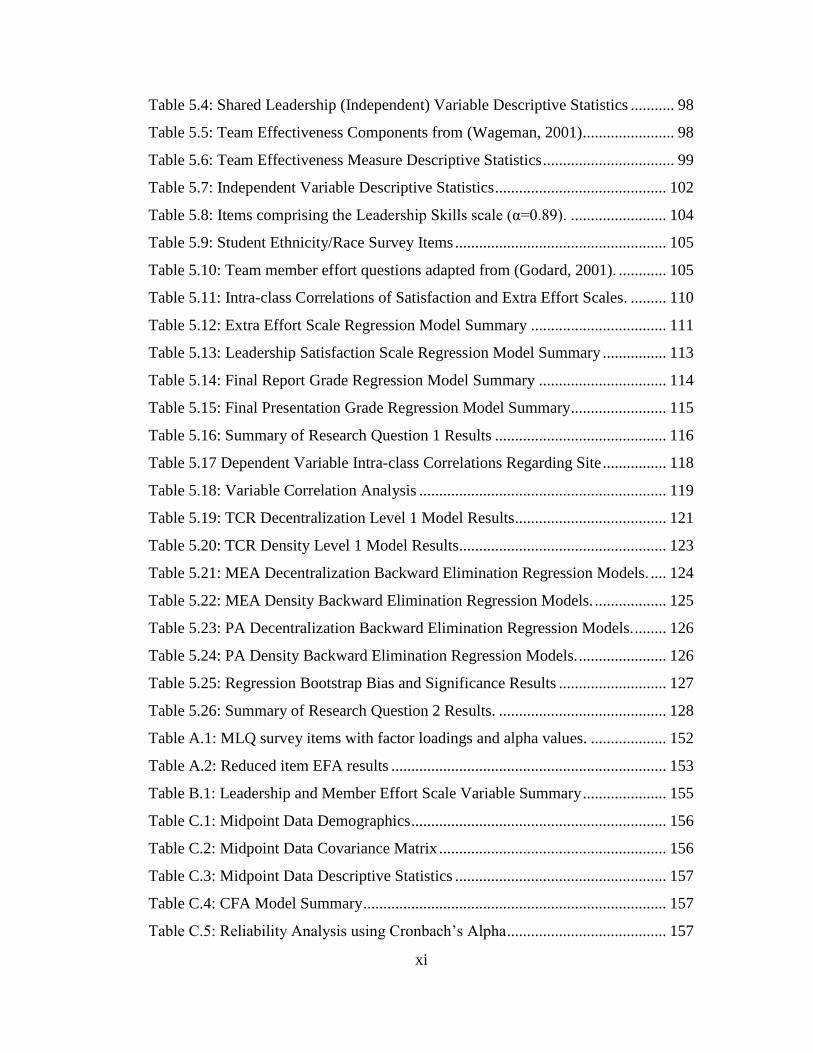
Table 5.4: Shared Leadership (Independent) Variable Descriptive Statistics ........... 98
Table 5.5: Team Effectiveness Components from (Wageman, 2001) ....................... 98
Table 5.6: Team Effectiveness Measure Descriptive Statistics ................................. 99
Table 5.7: Independent Variable Descriptive Statistics ........................................... 102
Table 5.8: Items comprising the Leadership Skills scale (α=0.89). ........................ 104
Table 5.9: Student Ethnicity/Race Survey Items ..................................................... 105
Table 5.10: Team member effort questions adapted from (Godard, 2001). ............ 105
Table 5.11: Intra-class Correlations of Satisfaction and Extra Effort Scales. ......... 110
Table 5.12: Extra Effort Scale Regression Model Summary .................................. 111
Table 5.13: Leadership Satisfaction Scale Regression Model Summary ................ 113
Table 5.14: Final Report Grade Regression Model Summary ................................ 114
Table 5.15: Final Presentation Grade Regression Model Summary ........................ 115
Table 5.16: Summary of Research Question 1 Results ........................................... 116
Table 5.17 Dependent Variable Intra-class Correlations Regarding Site ................ 118
Table 5.18: Variable Correlation Analysis .............................................................. 119
Table 5.19: TCR Decentralization Level 1 Model Results ...................................... 121
Table 5.20: TCR Density Level 1 Model Results .................................................... 123
Table 5.21: MEA Decentralization Backward Elimination Regression Models. .... 124
Table 5.22: MEA Density Backward Elimination Regression Models. .................. 125
Table 5.23: PA Decentralization Backward Elimination Regression Models. ........ 126
Table 5.24: PA Density Backward Elimination Regression Models. ...................... 126
Table 5.25: Regression Bootstrap Bias and Significance Results ........................... 127
Table 5.26: Summary of Research Question 2 Results. .......................................... 128
Table A.1: MLQ survey items with factor loadings and alpha values. ................... 152
Table A.2: Reduced item EFA results ..................................................................... 153
Table B.1: Leadership and Member Effort Scale Variable Summary ..................... 155
Table C.1: Midpoint Data Demographics ................................................................ 156
Table C.2: Midpoint Data Covariance Matrix ......................................................... 156
Table C.3: Midpoint Data Descriptive Statistics ..................................................... 157
Table C.4: CFA Model Summary ............................................................................ 157
Table C.5: Reliability Analysis using Cronbach’s Alpha ........................................ 157
xii
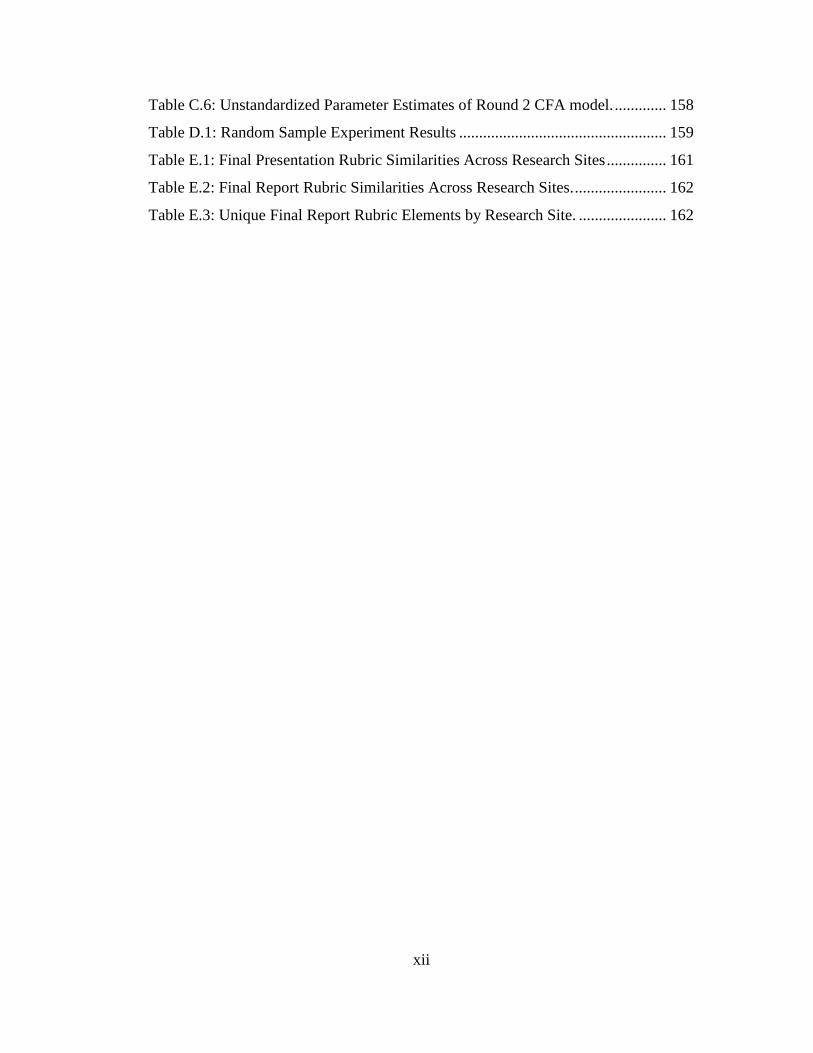
Table C.6: Unstandardized Parameter Estimates of Round 2 CFA model. ............. 158
Table D.1: Random Sample Experiment Results .................................................... 159
Table E.1: Final Presentation Rubric Similarities Across Research Sites ............... 161
Table E.2: Final Report Rubric Similarities Across Research Sites. ....................... 162
Table E.3: Unique Final Report Rubric Elements by Research Site. ...................... 162
xiii
List of Figures
Figure 1.1. Full Range of Leadership .......................................................................... 6
Figure 3.1. Full Range of Leadership ........................................................................ 24
Figure 3.2. Sample Round-Robin Survey Item ......................................................... 31
Figure 3.3. Path Diagram for the Model with Standardized Coefficients ................. 40
Figure 3.4. ME Capstone and Original Full Range of Leadership ............................ 42
Figure 3.5. Leadership Scale Variable Mean Comparison. ....................................... 47
Figure 4.1. ME Capstone and Original Full Range of Leadership ............................ 55
Figure 4.2. Team Shared Leadership Classifications. ............................................... 59
Figure 4.3. Research Methods Summary ................................................................... 62
Figure 4.4. Shared leadership Measure Examples. .................................................... 65
Figure 4.5. Classifying leadership by Decentralization and Density ......................... 66
Figure 4.6. Sample Round-Robin Survey Item ......................................................... 67
Figure 4.7. Leadership Quadrants; adapted from Mayo et al. (2003) ........................ 72
Figure 4.8: Team Leadership Quadrant Summary .................................................... 75
Figure 5.1 Sample Round-Robin Survey Item .......................................................... 95
Figure 5.2: Methods Overview Flow Chart ............................................................... 96
Figure 5.3: Shared Leadership Measure Examples. .................................................. 97
Figure 5.4: Interaction Effects of TCR Leadership Relationship with Extra Effort.112
Figure C.1. Path Diagram for the Midpoint Model (Standardized Coefficients). ... 158
1
Chapter 1
Introduction
1.1 Leadership Development for Undergraduate Engineering Students
As society and technology continue to integrate across the globe, the need for engineering-
minded leaders who can influence the development of sustainable, technically sound policy
decisions continues to increase (National Academy of Engineering, 2004, 2005; National
Research Council, 2007). The American Society for Mechanical Engineers (ASME) (2012)
relays this need, emphasizing an increased sense of urgency toward developing engineers with
leadership capability:
“Engineers must take leadership roles not only on technical projects but
in society more generally. Engineers must lead in their communities, in local,
state and federal governments, and help lead society to a sustainable world.
There are probably no second chances, now is the time for action, and we have
to get it right. Now is the time for engineering leadership, our country needs it
and our planet needs it.” (p. 3)
This call to action emphasizes both the need for diverse leadership skills (encompassing
both technical projects and society more generally), and their importance and urgency (“no
second chances”). For the United States, developing the next generation of engineers to serve in
societal leadership roles is vital to maintaining its long-term technological edge (American
Society for Engineering Education, 2009, 2012; National Academy of Engineering, 2004;
President’s Council of Advisors on Science and Technology, 2012; STEM Development Office,
2009).
To meet this need, the National Academy of Engineering (2004) argued that undergraduate
engineering programs should work to help students develop a basic level of leadership
knowledge that can then be applied throughout their careers. Farr and Brazil (2009) argue that
the undergraduate experience is the opportune time to teach the fundamentals of leadership for
engineers. However, the engineering discipline broadly has been slow to provide an emphasis on
leadership. Although the calls for leadership development have increased in sense of urgency,
engineering leadership education still has not emerged as a strong area of emphasis for
2
undergraduate engineering student development (Rottmann, Sacks, & Reeve, 2014). Rottmann
et al. (2014) summarize four barriers to engineering being widely recognized as a leadership
profession, which have prevented widespread acceptance and implementation of engineering
leadership education: 1) traditional, hierarchical views of leadership are inconsistent with
collaborative norms of engineering practice; 2) there is discomfort with the imprecise nature of
leadership concepts; 3) engineering departments maintain an extracurricular orientation of
leadership development that may propagate to students the notion that leadership is peripheral to
the engineering curriculum; and 4) engineering career trajectories require five to ten years of
technical work prior to leadership or management roles. Recent career pathway research by
Kinoshita, Young, and Knight (2014), however, provides evidence that leadership knowledge
may be required earlier than the five to ten years Rottmann et al. (2014) assert, as graduates may
take on leadership related, engineering supervisory positions within the first three years of
professional practice. My study addresses the first two barriers by investigating leadership
within engineering student capstone design teams. Developing a model for how engineers lead
in formative, collaborative, team-based environments will address the third barrier by providing
engineering educators with a conceptualization of leadership that is not peripheral, but integral to
undergraduates’ engineering experiences. Understanding how engineering students lead in their
capstone design experiences may also give practicing engineers a starting point by which to help
newly hired engineers assimilate into career-spanning professional engineering leadership
practices.
The evolution of engineering towards a leadership orientation coincides with recent and
evolving shared perceptions of the leadership phenomenon itself, thus creating an opportune time
for examining leadership in an engineering context. However, little is currently known regarding
leadership models that are applicable to a collaborative engineering context; engineering
educators and practicing engineers cannot reference an empirically tested model of how
engineers lead in collaborative, team-based engineering settings (Reeve, Rottmann, & Sacks,
2015; Rottmann et al., 2014). Developing models of effective leadership may help the
profession of engineering manage the transition towards an increased leadership role by making
the leadership phenomenon integral to common engineering professional experiences.
One such model that has emerged in the last decade as a new conceptualization of leadership
is the shared leadership paradigm (Pearce & Conger, 2003a). Pearce (2004) has described shared
3
leadership as “a simultaneous, ongoing, mutual influence process within a team that is
characterized by ‘serial emergence’ of official as well as unofficial leaders” (p. 48) within an
organization. He further asserts that it may be an applicable model for knowledge work that is
creative, complex, and interdependent, which coincides with the nature of team based design
work as described by Newstetter (1998). The shared leadership paradigm departs from past
norms where leadership was conceptualized as being individual and vertical (Jackson & Parry,
2011; Markham, 2012; Northouse, 2013; Pearce & Conger, 2003a); under these previous
conceptualizations, one leader was in charge, and followers receive leadership.
Student design courses may be an applicable context in which to investigate the degree to
which undergraduate engineers share leadership. Design teams are traditionally the educational
settings in which leadership is incorporated most intentionally into the undergraduate
engineering curriculum (Farr & Brazil, 2009; Farr, Walesh, & Forsythe, 1997). Although
research is limited, studies also indicate that shared leadership may be an applicable model for
the undergraduate engineering student design team context. A quantitative study by Zafft,
Adams, and Matkin (2009) and qualitative work by Feister, Zoltowski, Buzzanell, Oakes, and
Zhu (2014) provide indications that students share leadership within their design team
experiences. Using the Competing Values Framework, Zafft et al. (2009) found that student
design teams exhibit a dispersion of different leadership profiles across the team and that
increased dispersion related positively to team performance in terms of course grades. Through
a discursive psychological examination of engineering student interviews, Feister et al. (2014)
found that students describe leadership as emergent and fluid within their design teams, often
despite having appointed individual leaders. Both studies advocate a deeper examination of the
degree to which leadership is currently shared among design team members and how shared
leadership relates to team effectiveness and team member satisfaction with the teaming
experience.
1.2 Need for this Research
The preponderance of engineering related leadership literature fails to address how
engineering students lead in a collaborative, team-based engineering environment such as the
undergraduate design team experience. Small sample qualitative studies have mainly addressed
how students and faculty view the phenomenon of leadership within an engineering context (e.g.,
AlSagheer & Al-Sagheer, 2011; Cox, Cekic, & Adams, 2010; Sabatini & Knox, 1999;
4
Schuhmann, 2010). Other literature describes how engineering students develop as leaders along
the pathway from college through professional practice (e.g., Farr & Brazil, 2009; Farr et al.,
1997), class level curricula for engineering student leadership development (e.g., Bowman &
Farr, 2000; Galli & Luechtefeld, 2009; Hanus & Russell, 2007; Seat, Parsons, & Poppen, 2001),
and program-level curricula (e.g., Bayless, Mitchell, & Robe, 2009; Schuhmann, 2010;
Williams, Ahmed, Hanson, Peffers, & Sexton, 2012). A few quantitative studies have focused
on instrument development (Ahn, Cox, London, Cekic, & Zhu, 2014; Gerhart, Carpenter,
Grunow, & Hayes, 2010) and predictive mathematical modeling of leader emergence (Guastello,
2011). Collectively, however, this literature fails to examine how engineering students enact
leadership within their teaming experiences and how variations in leadership processes relate to
different teaming outcomes.
An empirically validated model of engineering leadership within student design teams may
also equip faculty to address team-related engagement issues that can be pervasive in project-
based courses and result in diminished student learning. Project-based pedagogy literature
illuminates challenges faced by faculty in bolstering students’ continued engagement over the
duration of an extended project (Blumenfeld et al., 1991; Jones, Epler, Mokri, Bryant, & Paretti,
2013). Correspondingly, capstone design faculty describe a need to maintain student
involvement and thoughtfulness within capstone design courses as an important part of their role
as guides or mentors (Pembridge & Paretti, 2010). When students remain engaged in the
learning environment, they experience higher academic achievement (Lo, 2010; Pace, 1983). As
discussed next, studies suggest that leadership can assist faculty with the challenges of
maintaining student engagement, which in turn supports higher learning outcomes across team
members.
In general, a large body of leadership literature indicates that leadership plays a prominent
role in team effectiveness (Hill, 2013; Hoch, 2014; Salas, Stagl, Burke, & Goodwin, 2007; Stagl,
Salas, & Burke, 2007; Wang, Waldman, & Zhang, 2014; Yukl, 2006), which is commonly
viewed as a composite measure of team task performance, member satisfaction, and commitment
Meta-analyses shows positive relationships between shared leadership and team effectiveness
(e.g., Wang et al., 2014) and team performance (e.g., D'Innocenzo, Mathieu, & Kukenberger,
2014) Other research indicates relationships between shared leadership and increased team and
individual learning in work teams (e.g., Liu, Hu, Li, Wang, & Lin, 2014). (Cohen, 1994; Salas et
5
al., 2007; Wang et al., 2014). For student teams in non-engineering contexts, leadership
practices shared across the team have been linked to students' extra effort and overall teamwork
satisfaction (e.g., Avolio, Dong I., Murray, & Sivasubramanian, 1996). Small and Rentsch
(2010) also found links between shared leadership and overall team performance for business
student teams. Collectively, these studies provide indications that student leadership can
increase student learning through increased engagement and overall team effectiveness.
Although these positive links have been established in other contexts, the undergraduate
engineering student design team context has not yet been studied.
As a result of the current gap in student design team leadership literature, faculty may fail to
understand the positive role leadership practices may play in project based design pedagogy,
relying more on what they perceive as effective rather than what research has shown to be
effective. Faculty often teach in ways they are comfortable with or have experienced previously
(Borrego, Froyd, Henderson, Cutler, & Prince, 2013; Duderstadt, 2010; Nespor, 1987). These
practices fail to adhere to the cycle of research and practice that the American Society for
Engineering Education (2009) advocate to foster incremental innovation in the engineering
education process. In an effort to initiate a cycle of innovation with regards to engineering
leadership, this study focused primarily on the second half of the cycle by using theory-based
engineering education research to make visible the phenomenon of leadership within engineering
student design teams that may help inform instructional practice for design faculty.
1.3 Purpose of the Study
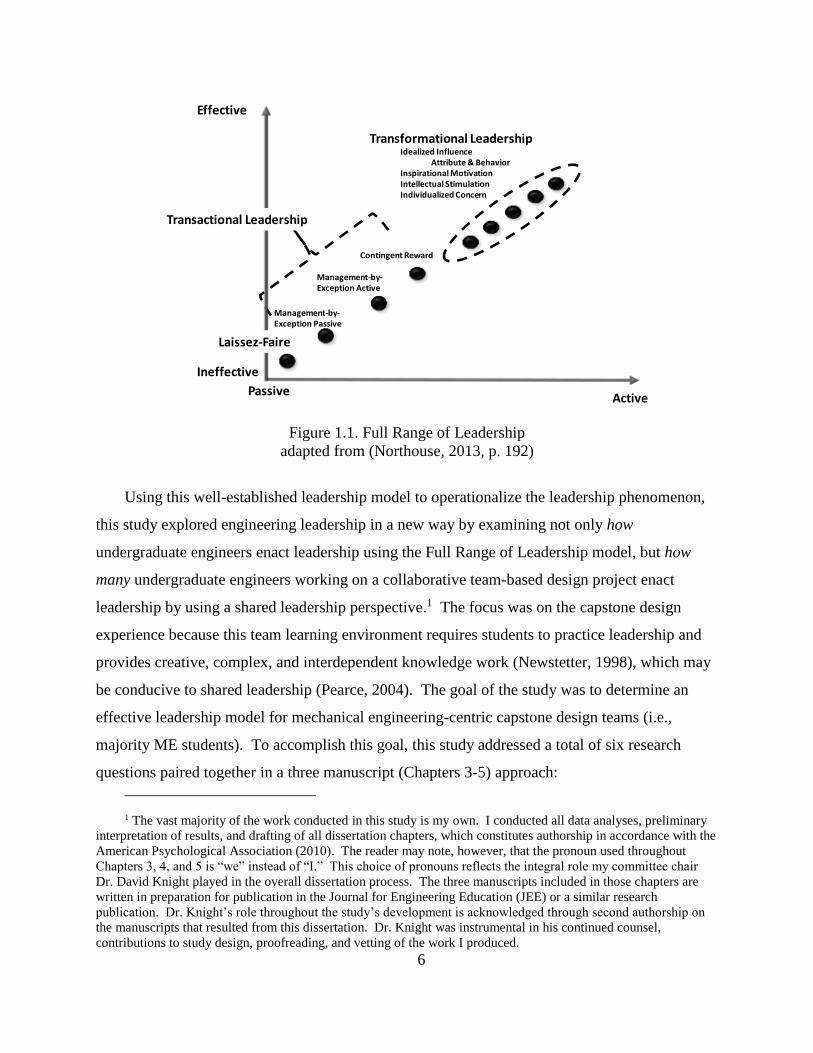
The purpose of this multi-site, quantitative study was to investigate leadership processes
within undergraduate mechanical engineering capstone design teams. This study investigated
shared leadership using the Full Range of Leadership model (Figure 1.1) (Bass, 1985; Burns,
1978) to determine: 1) the applicability of a shared Full Range of Leadership model in describing
leadership within engineering student design teams, and 2) the relationship between sharing the
Full Range of Leadership and student design team effectiveness.
6
Management-by-Exception Passive
Transformational LeadershipIdealized Influence
Attribute & BehaviorInspirational MotivationIntellectual StimulationIndividualized Concern
Contingent Reward
Management-by-Exception Active
PassiveActive
Effective
Ineffective
Laissez-Faire
Transactional Leadership
Figure 1.1. Full Range of Leadership
adapted from (Northouse, 2013, p. 192)
Using this well-established leadership model to operationalize the leadership phenomenon,
this study explored engineering leadership in a new way by examining not only how
undergraduate engineers enact leadership using the Full Range of Leadership model, but how
many undergraduate engineers working on a collaborative team-based design project enact
leadership by using a shared leadership perspective.1 The focus was on the capstone design
experience because this team learning environment requires students to practice leadership and
provides creative, complex, and interdependent knowledge work (Newstetter, 1998), which may
be conducive to shared leadership (Pearce, 2004). The goal of the study was to determine an
effective leadership model for mechanical engineering-centric capstone design teams (i.e.,
majority ME students). To accomplish this goal, this study addressed a total of six research
questions paired together in a three manuscript (Chapters 3-5) approach:
1 The vast majority of the work conducted in this study is my own. I conducted all data analyses, preliminary
interpretation of results, and drafting of all dissertation chapters, which constitutes authorship in accordance with the
American Psychological Association (2010). The reader may note, however, that the pronoun used throughout
Chapters 3, 4, and 5 is “we” instead of “I.” This choice of pronouns reflects the integral role my committee chair
Dr. David Knight played in the overall dissertation process. The three manuscripts included in those chapters are
written in preparation for publication in the Journal for Engineering Education (JEE) or a similar research
publication. Dr. Knight’s role throughout the study’s development is acknowledged through second authorship on
the manuscripts that resulted from this dissertation. Dr. Knight was instrumental in his continued counsel,
contributions to study design, proofreading, and vetting of the work I produced.
7
Chapter 3: Manuscript 1: The Full Range of Leadership for Engineering:
Examining a subset of the Multifactor Leadership Questionnaire for
mechanical engineering capstone design teams.
This study examined the validity of the Full Range of Leadership model for the
undergraduate engineering capstone design context. The study confirmed an ME capstone
version of the model developed with pilot data that provided the foundational understanding of
different forms of leadership within the engineering design team context. This foundational
understanding allowed for more complex development of the shared leadership model in
Chapters 4 and 5. Analyses addressed the following research questions:
RQ3.1: To what extent do the scales that emerge from a modified Multifactor
Leadership Questionnaire used to measure the Full Range of Leadership fit
the undergraduate ME-centric student design team context?
RQ3.2: To what degree do the emerging leadership scales demonstrate validity by
relating to other variables in expected ways?
Chapter 4: Manuscript 2: Shared Leadership in Engineering Teams: A social network
analysis of mechanical engineering capstone design teams.
This second study used social network analysis to establish the extent to which the forms of
leadership identified in Chapter 3 were shared among members of the design teams. The
measures of shared leadership used to address the first research question were subsequently used
to identify how shared leadership could be used to classify capstone design teams. This study
added a shared leadership structure to the study of engineering design teams and addressed the
following:
RQ4.1: To what degree is leadership shared within undergraduate mechanical
engineering-centric capstone design teams?
RQ4.2: To what degree does the level of shared leadership classify undergraduate
mechanical engineering-centric capstone design teams?
Chapter 5: Manuscript 3: Is Sharing Leadership Effective? Relating shared leadership
to team effectiveness and team attributes for mechanical engineering
capstone design teams.
8
The third study established the extent to which shared leadership may be effective for
undergraduate design teams and how selected team level attributes relate to shared leadership.
Analyses addresses the following research questions:
RQ5.1: How does the degree of shared leadership across the Full Range of Leadership
relate to undergraduate mechanical engineering-centric capstone design team
effectiveness?
RQ5.2: How do team-level attributes relate to the degree of shared leadership in
undergraduate mechanical engineering-centric capstone design teams?
1.4 Methods Overview
To address these research questions, this study used a rating the members approach with a
round-robin (360-degree) survey (Gockel & Werth, 2010; Mayo, Meindl, & Pastor, 2003) to
collect leadership ratings from capstone design team members of their teammates as well as their
faculty advisor. The survey also collected other team and individual attribute variables,
including demographics, self-reported leadership skills, team member satisfaction with the
experience, and team member effort. The survey was administered at three research sites; an in-
depth description of these sites is included in Chapter 2. Individual survey item data were
transformed into broader leadership scales using factor analysis, which resulted in various forms
of leadership variables (Chapter 3). Through social network analysis of the leadership scales, the
variables were further transformed into network-based measures that quantified the degree of
sharedness across each form of leadership. Cluster analyses classified teams based on their
degree of shared leadership (Chapter 4). Additional team performance data in the form of course
end presentation grades and design report grades were collected from capstone course
coordinators. Statistical analyses related the measures of leadership derived from the social
network analysis to measures of team effectiveness (measured in terms of group process, task
performance, and individual satisfaction) and team level attributes (Chapter 5). Chapter 6
synthesizes the results of Chapters 3-5 into the graphical depiction of an engineering design team
leadership model that summarizes the majority of findings.
1.5 Significance of the Study
1.5.1 Implications for Research
The methods applied in this study are novel in their approach to analyzing and visualizing
the phenomenon of leadership among undergraduate senior-level mechanical engineering
9
students. No other research has applied the shared, Full Range of Leadership model within the
undergraduate engineering context. Furthermore, the use of social network analysis to develop
visual representations of leadership in the form of sociograms and quantification of shared
leadership within design teams are unique approaches to studying leadership within engineering.
The methods used in this study can be applied to other team-level outcomes such as teamwork,
communication, or shared mental models. By investigating a new conceptualization of
leadership, engineering education researchers may have a fresh perspective of the leadership
phenomenon that more closely aligns with contemporary, scholarly leadership literature.
This new conceptualization of leadership may give engineering education researchers a
more nuanced view of leadership that may be extended to the practice of engineering more
broadly. The characterization of capstone design teams based on shared leadership measures
examined in Chapter 4 may provide a taxonomy for describing shared leadership within student
design teams, which may facilitate further leadership study. Expanding the research to include
additional settings such as freshman engineering design projects and co-curricular design teams
will provide greater insight into leadership processes in various undergraduate learning
environments. Additionally, expanding the research across the breadth of engineering
disciplines will determine applicability across the engineering field.
1.5.2 Implications for Practice
By making the phenomenon of leadership applicable to collaborative engineering
environments, faculty and students may be more apt to develop leadership understanding through
more informed engineering education practice. Though producing technologically adept leaders
is a well-documented need (National Academy of Engineering, 2004; National Research
Council, 2007), it still remains largely unfulfilled (Bayless & Robe, 2010; Knight & Novoselich,
2014); a lack of faculty preparedness to advise leadership development may play a role
(AlSagheer & Al-Sagheer, 2011; Feister et al., 2014). Quantifying and visualizing the complex
phenomenon of leadership can be transformative in leadership perceptions among engineering
faculty because the often-inaccessible concept of leadership is more tangible when it is linked to
quantitative results. Immediate utility of the study is a thoroughly evaluated shared leadership
model for senior-level mechanical engineering design students that has been empirically related
to team effectiveness measures. A new visualization of effective leadership processes at the
senior mechanical engineering level may provide additional resources for faculty to increase or
10
maintain student engagement over the course of a prolonged capstone design project, thereby
increasing overall student learning.
1.6 Definitions
The following definitions are provided to orient the reader to the terminology used in this
research:
Leadership: The process by which an individual influences team members
towards attainment of common goals. An adaptation of the Northouse (2013)
definition.
Shared Leadership: “A dynamic, interactive influence process among
individuals in groups for which the objective is to lead on another to the
achievement of group or organizational goals” (Pearce & Conger, 2003b, p. 1).
The Full Range of Leadership Model: A model of leadership that aggregates
leadership factors into three leadership scales that represent different forms of
leadership:
Transactional Leadership: An exchange oriented form of leadership where
leaders exchange rewards and promises for followers’ work if performance
warrants. This form of leadership includes leaders keeping followers
accountable for performance and work standards (Bass, 1985).
Transformational Leadership: A form of leadership where leaders go beyond
transactional leadership relationships to be attentive to the needs of followers
and helps them reach their fullest potential (Bass, 1985).
Laissez-faire Leadership: A form of leadership representing the absence of
leadership behaviors. Laissez-faire leaders take a hands-off approach to
leadership, generally relinquishing their leadership responsibilities. May be
interpreted as a social-loafer (Avolio, 2011).
Leadership Construct: a way people conceptualize leadership; a working,
hypothetical concept of leadership, formed in people’s minds.
Leadership Factor: sub-elements of the Transformational and Transactional
leadership scales in the Full Range of Leadership model, consisting of multiple
survey items.
Leadership Scale: the indirect measurement of a leadership construct as the
aggregation of multiple survey items.
Leadership Form: a leadership construct put into practice by members of a
group or team.
11
Team Effectiveness: The production of a desired effect by a team; the evaluation
of the results of team performance. Team effectiveness is often interpreted as a
multi-dimensional construct (Salas et al., 2007).
Capstone Design Course: A senior-level course that provides a culminating,
hands-on, project-based experiential learning activity through which analytical
knowledge gained from previous courses is joined with engineering practice
(Dutson, Todd, Magleby, & Sorensen, 1997).
Course Coordinator: The primary instructor for a capstone design course. This
person typically coordinates the overall capstone course effort including,
syllabus development, team assignment, project assignment, and the majority of
course instruction. This person may serve as a faculty advisor for one or more
capstone design teams.
Mechanical Engineering-Centric Capstone Design Teams: Senior-level
undergraduate mechanical engineering design teams participating in a
culminating design experience prior to graduation as part of a capstone design
course. The teams primarily consist of mechanical engineering students but
may include a minority of engineering students from other disciplines as a part
of the project.
Faculty Advisor: The senior advisor for a capstone design team, charged with
guiding students toward successful completion of their assigned project. This
person is most often a technical faculty member of the institution but may be a
professional engineer working for an external client of the project.
Social Network Analysis: The detection and interpretation of patterns of social
ties among actors of a group (Nooy, Mrvar, & Batagelj, 2011). From a shared
leadership perspective, these social ties are influence relationships among
actors.
Sociogram: A graphical depiction of group members and their associated social
ties (Mayo et al., 2003; Nooy et al., 2011; Prell, 2012).
Network Decentralization: A measure of the degree to which all members of a
social network hold an equal number of ties. From a shared leadership
perspective, it measures the distribution of leadership within the group. A
network with decentralization closer to zero is led by a single vertical leader,
whereas a network with decentralization closer to 1 shares leadership equally
across the actors in the network (Gockel & Werth, 2010).
Network Density: A ratio of how many ties exist within a network compared to
how many ties could potentially exist within the network. From a shared
leadership perspective, it measures the amount of leadership happening within a
group (Gockel & Werth, 2010).
12
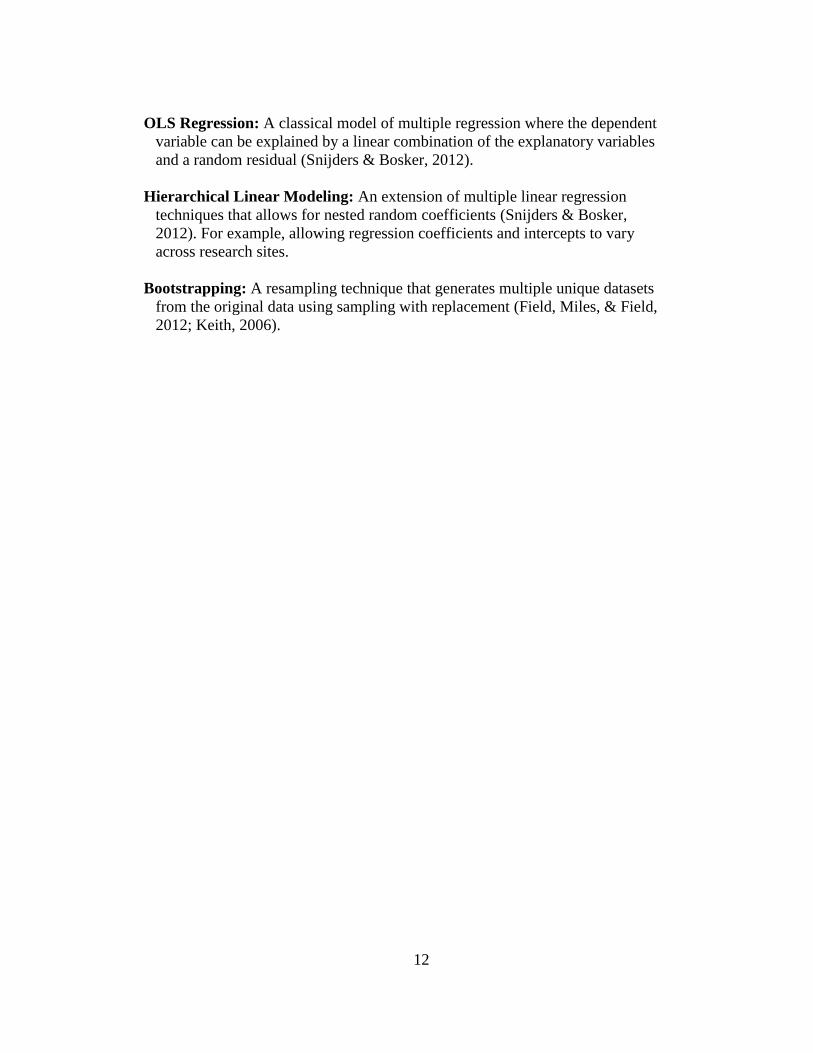
OLS Regression: A classical model of multiple regression where the dependent
variable can be explained by a linear combination of the explanatory variables
and a random residual (Snijders & Bosker, 2012).
Hierarchical Linear Modeling: An extension of multiple linear regression
techniques that allows for nested random coefficients (Snijders & Bosker,
2012). For example, allowing regression coefficients and intercepts to vary
across research sites.
Bootstrapping: A resampling technique that generates multiple unique datasets
from the original data using sampling with replacement (Field, Miles, & Field,
2012; Keith, 2006).
13
Chapter 2
Research Site Comparison
2.1 Population and Sample Justification
The target population for the study was undergraduate engineering students enrolled
in senior-level mechanical engineering design courses that use a team-based approach.
The senior level design team context, relative to the first year design team context, was
an appropriate curricular setting for this investigation because shared leadership is more
likely to develop in teams comprised of individuals with a high degree of expertise in
their given field (Pearce, 2004). Senior level design students may not be expert
engineers, but they will have reached the maximum level of training they will receive
during their undergraduate tenures. Correspondingly, they may have a greater propensity
to adopt some form of shared leadership in their teamwork than first-year students. The
study was bounded to the mechanical engineering discipline for multiple reasons: 1) the
discipline’s interest in engineering leadership (see ASME Center for Education, 2011), 2)
mechanical engineering’s status as the largest discipline for bachelor degree attainment
(Yoder, 2014), 3) access to design teams for data collection, and 4) professional interest
and expertise of the researcher.
2.2 Site Selection and Demographics
This study targeted mechanical engineering capstone design courses at three
institutions during the 2014–2015 academic year (Table 2.1). These institutions were
purposefully chosen because of their historic leadership focus and ABET accredited
engineering programs. The mixture of civilian and military institutions provided a
combination of a more traditional civilian undergraduate engineering experience at site
A, which may include voluntary affiliation with purposeful leadership development
through the Corps of Cadets for some students or various other leadership development
programs, and mandatory, 4-year leadership programs at the two military institutions
(sites B and C). The AY 2014–2015 enrollments provided roughly comparable samples
of civilian and military students with 342 students at site A comprising 43 teams and 287
students at sites B and C combined representing 56 teams. Table 2.1 demonstrates that
the student demographics of the three institutions do not reflect national mechanical

14
engineering bachelor degree demographics, which was a limitation of this study. Access,
however, was a major consideration in the selection of the study sites; professional
network contacts and proximity facilitated access to student design teams, which was
necessary for data collection.
Table 2.1: Research Site Demographic Comparison
Site
2014 ME
Bachelor's
Degree
Awarded Black Asian Hispanic
Native
American
Pacific
Islander White
Race Not-
reported
Inter-
national Male Female
2014-2015
Enrollment # Teams
Avg.
Team Size
%
Externally
Sponsored
Teams
Site A 320 1.3% 6.3% 4.7% 0.0% 0.0% 75.9% 0.0% 7.2% 91.9% 8.1% 342 43 9 56%
Site B 90 3.3% 4.4% 11.1% 2.2% 0.0% 73.3% 0.0% 2.2% 92.2% 7.8% 137 27 5 100%
Site C 88 1.1% 3.4% 4.5% 0.0% 0.0% 85.2% 0.0% 1.1% 86.4% 13.6% 150 29 5 41%
National 25042 2.4% 7.8% 8.5% 0.3% 0.2% 63.9% 0.0% 6.2% 87.2% 12.8% N/A N/A N/A N/A
2014 Data† AY 2014-2015††
†Data from (Yoder, 2014).
††Data collected from Course Coordinators for AY 2014–2015.
2.3 Capstone Design Course Comparison
Each of the proposed research sites offered similar capstone design experiences for
students. At all three sites, the senior capstone design course is a required, year-long,
two-course design experience. To understand similarities and differences across research
sites and provide context for the study, a review of course materials was conducted,
specifically investigating course objectives, student familiarity with the design process,
course content, project selection, and team formation processes.
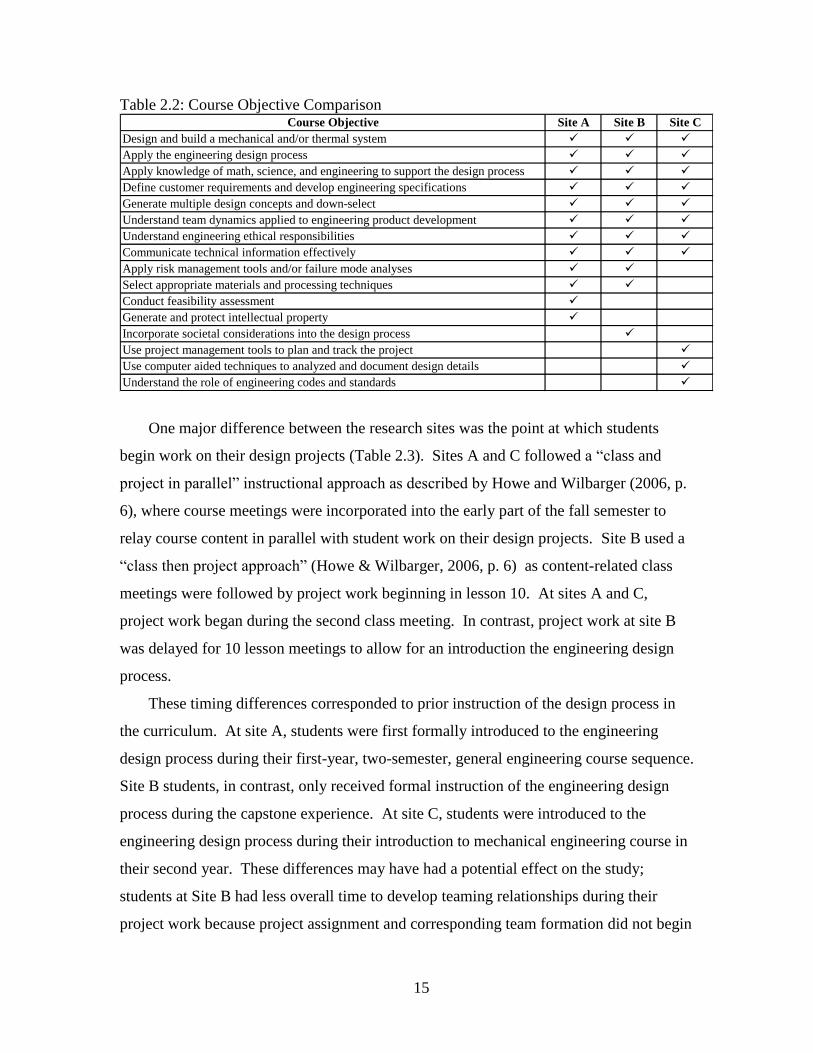
The objectives of each course focused primarily on the application of the engineering
design process towards the development of a workable prototype (see Table 2.2 for a
comparison of course objectives across the three sites). In addition to emphasis on
applying the design process, each course also incorporated objectives related to
professional skills, such as teamwork and communication. The course syllabi
comparison shown in Table 2.2 indicated that the majority of course objective topics
were common across the three sites. Each site specified between one and three additional
course objectives specific to only that research site. Across these site-specific course
objectives, none directly related to leadership or the teaming process, thus minimizing
potential impact on the study of leadership across the sites.
15
Table 2.2: Course Objective Comparison Course Objective Site A Site B Site C
Design and build a mechanical and/or thermal system
Apply the engineering design process
Apply knowledge of math, science, and engineering to support the design process
Define customer requirements and develop engineering specifications
Generate multiple design concepts and down-select
Understand team dynamics applied to engineering product development
Understand engineering ethical responsibilities
Communicate technical information effectively
Apply risk management tools and/or failure mode analyses
Select appropriate materials and processing techniques
Conduct feasibility assessment
Generate and protect intellectual property
Incorporate societal considerations into the design process
Use project management tools to plan and track the project
Use computer aided techniques to analyzed and document design details
Understand the role of engineering codes and standards
One major difference between the research sites was the point at which students
begin work on their design projects (Table 2.3). Sites A and C followed a “class and
project in parallel” instructional approach as described by Howe and Wilbarger (2006, p.
6), where course meetings were incorporated into the early part of the fall semester to
relay course content in parallel with student work on their design projects. Site B used a
“class then project approach” (Howe & Wilbarger, 2006, p. 6) as content-related class
meetings were followed by project work beginning in lesson 10. At sites A and C,
project work began during the second class meeting. In contrast, project work at site B
was delayed for 10 lesson meetings to allow for an introduction the engineering design
process.
These timing differences corresponded to prior instruction of the design process in
the curriculum. At site A, students were first formally introduced to the engineering
design process during their first-year, two-semester, general engineering course sequence.
Site B students, in contrast, only received formal instruction of the engineering design
process during the capstone experience. At site C, students were introduced to the
engineering design process during their introduction to mechanical engineering course in
their second year. These differences may have had a potential effect on the study;
students at Site B had less overall time to develop teaming relationships during their
project work because project assignment and corresponding team formation did not begin
16
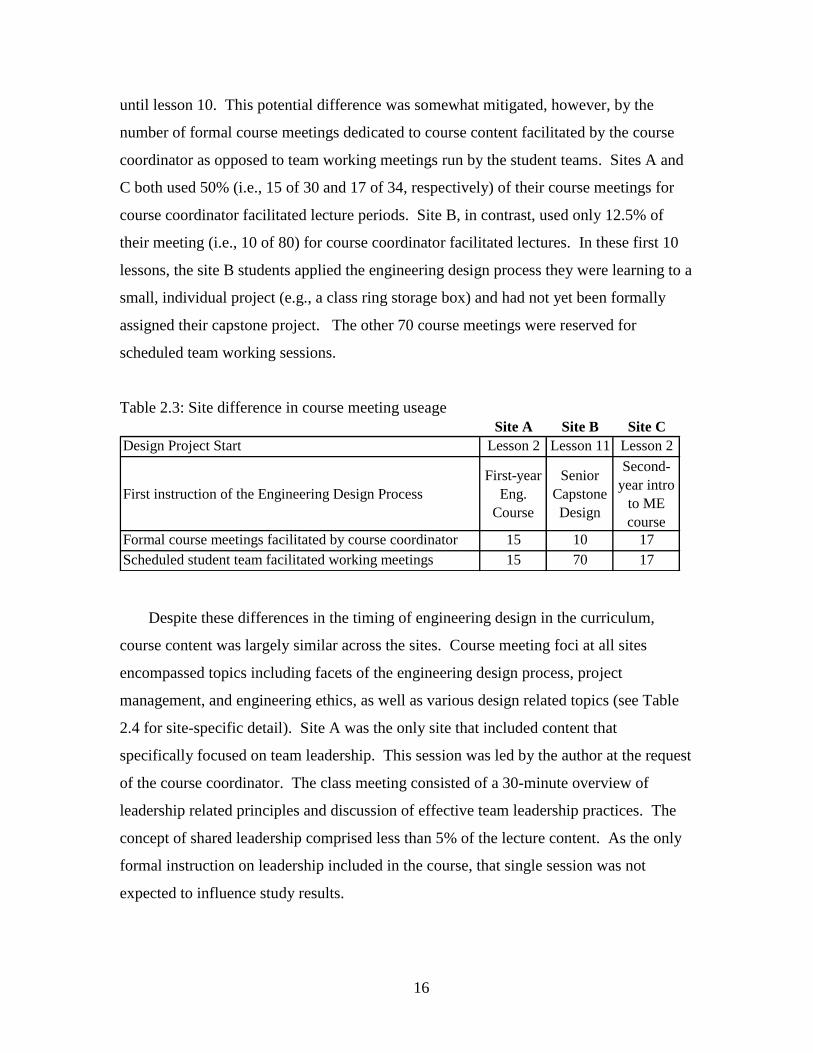
until lesson 10. This potential difference was somewhat mitigated, however, by the
number of formal course meetings dedicated to course content facilitated by the course
coordinator as opposed to team working meetings run by the student teams. Sites A and
C both used 50% (i.e., 15 of 30 and 17 of 34, respectively) of their course meetings for
course coordinator facilitated lecture periods. Site B, in contrast, used only 12.5% of
their meeting (i.e., 10 of 80) for course coordinator facilitated lectures. In these first 10
lessons, the site B students applied the engineering design process they were learning to a
small, individual project (e.g., a class ring storage box) and had not yet been formally
assigned their capstone project. The other 70 course meetings were reserved for
scheduled team working sessions.
Table 2.3: Site difference in course meeting useage
Site A Site B Site C
Design Project Start Lesson 2 Lesson 11 Lesson 2
First instruction of the Engineering Design Process
First-year
Eng.
Course
Senior
Capstone
Design
Second-
year intro
to ME
course
Formal course meetings facilitated by course coordinator 15 10 17
Scheduled student team facilitated working meetings 15 70 17
Despite these differences in the timing of engineering design in the curriculum,
course content was largely similar across the sites. Course meeting foci at all sites
encompassed topics including facets of the engineering design process, project
management, and engineering ethics, as well as various design related topics (see Table
2.4 for site-specific detail). Site A was the only site that included content that
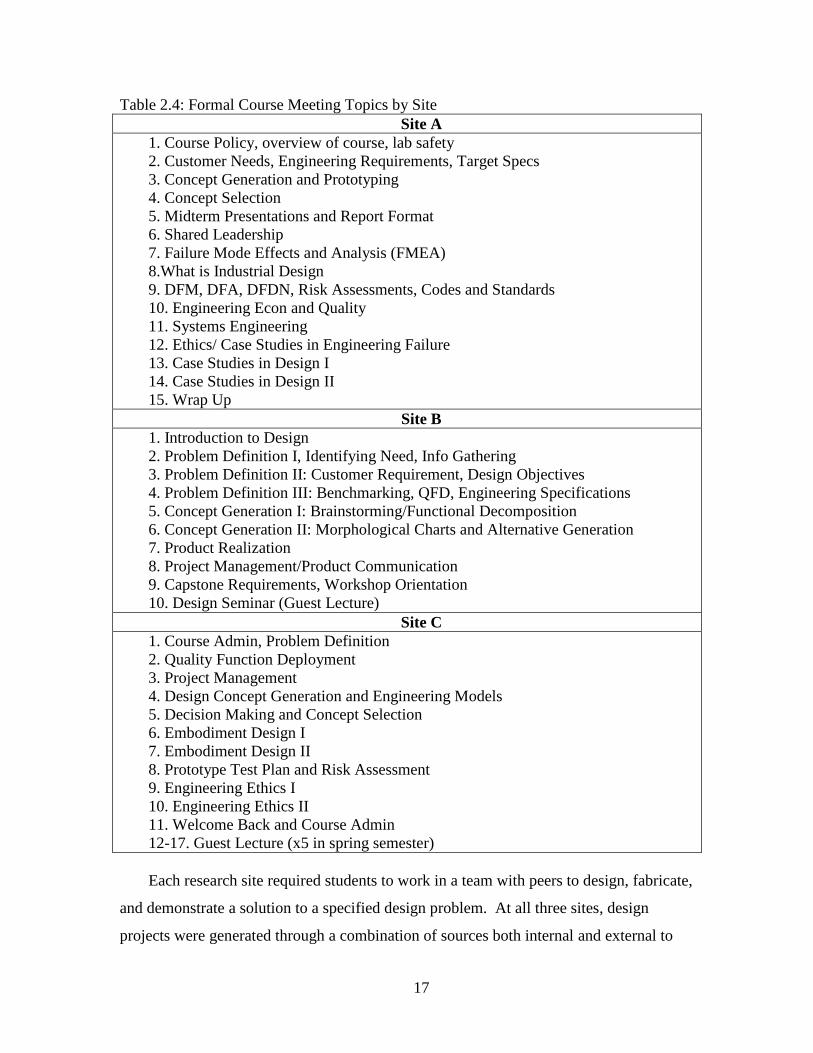
specifically focused on team leadership. This session was led by the author at the request
of the course coordinator. The class meeting consisted of a 30-minute overview of
leadership related principles and discussion of effective team leadership practices. The
concept of shared leadership comprised less than 5% of the lecture content. As the only
formal instruction on leadership included in the course, that single session was not
expected to influence study results.
17
Table 2.4: Formal Course Meeting Topics by Site
Site A
1. Course Policy, overview of course, lab safety
2. Customer Needs, Engineering Requirements, Target Specs
3. Concept Generation and Prototyping
4. Concept Selection
5. Midterm Presentations and Report Format
6. Shared Leadership
7. Failure Mode Effects and Analysis (FMEA)
8.What is Industrial Design
9. DFM, DFA, DFDN, Risk Assessments, Codes and Standards
10. Engineering Econ and Quality
11. Systems Engineering
12. Ethics/ Case Studies in Engineering Failure
13. Case Studies in Design I
14. Case Studies in Design II
15. Wrap Up
Site B
1. Introduction to Design
2. Problem Definition I, Identifying Need, Info Gathering
3. Problem Definition II: Customer Requirement, Design Objectives
4. Problem Definition III: Benchmarking, QFD, Engineering Specifications
5. Concept Generation I: Brainstorming/Functional Decomposition
6. Concept Generation II: Morphological Charts and Alternative Generation
7. Product Realization
8. Project Management/Product Communication
9. Capstone Requirements, Workshop Orientation
10. Design Seminar (Guest Lecture)
Site C
1. Course Admin, Problem Definition
2. Quality Function Deployment
3. Project Management
4. Design Concept Generation and Engineering Models
5. Decision Making and Concept Selection
6. Embodiment Design I
7. Embodiment Design II
8. Prototype Test Plan and Risk Assessment
9. Engineering Ethics I
10. Engineering Ethics II
11. Welcome Back and Course Admin
12-17. Guest Lecture (x5 in spring semester)
Each research site required students to work in a team with peers to design, fabricate,
and demonstrate a solution to a specified design problem. At all three sites, design
projects were generated through a combination of sources both internal and external to
18
the institution; the externally generated projects were vetted and scoped by course
coordinators before being included in the course (see Table 1 for the percentage
breakdown). Projects varied greatly and may include industry, military, assistive
technology, or collegiate design competition related topics. Developing some form of
working prototype was a requirement at all three sites.
Team formation processes across sites were similar as well. Teams were formed
through a combination of member preference and faculty assignment. At all sites,
students were given the opportunity to choose projects of interest from the list of projects
available and accompanying project descriptions. At sites A and C, this process occurred
within the first week of the semester. At site B, this process occurred during the first 10
lessons of the course while the students are learning the design process. Faculty assigned
students to teams based on a combination of student preference for teammates as well as
project topics; faculty also consider equality of capability across teams. The measure of
equal capability varied across sites but generally focused on students’ academic
performance within the program, including engineering course performance and any prior
experience with the project through undergraduate research, club participation, or
internship opportunities. The size of teams varied based on the number of projects
available for that academic year, complexity and scope of each project, and overall
enrollment for the capstone course, with a mean team size of between 5 and 9 students
across the sites (Table 2.1).
All three courses required student teams to develop team charters to assist in the
formation of the team (Table 2.5). Sites A and B both required some specification of
leadership structures, although these two sites did not specifically require an individual
team member to be designated “team leader” as a part of their leadership structure. Site
A, however, did require the specification of two team positions: 1) Team Facilitator, who
provides overall coordination of team efforts and ensures all team members are held
accountable for his or her individual responsibilities; and 2) Finance Manager, who
monitors team financial expenditures and project funding. Although not specified as a
part of the team charter, site C provided the most guidance requiring team member
positions. In the site C published project guidance, teams were required to specify the
following team roles among their team members: 1) Team Leader, 2) Design
19
Communication Editor, 3) Purchaser, 4) Technical Support Detachment Liaison, and 5)
Safety Officer. The specification of team roles at sites A and C had the potential to
influence team member perceptions of team leadership as an individual responsibility.
Assigning roles to individuals may attribute legitimate social power to the individuals
(French & Raven, 1959; Pierro, Raven, Amato, & Bélanger, 2013), which may have
played a role in their ability to influence other team members (Burns, 1978; Pierro et al.,
2013). Recognizing these potential effects, Chapters 3, 4, and 5 addresses specific steps
used to mitigate variation across research sites when possible.
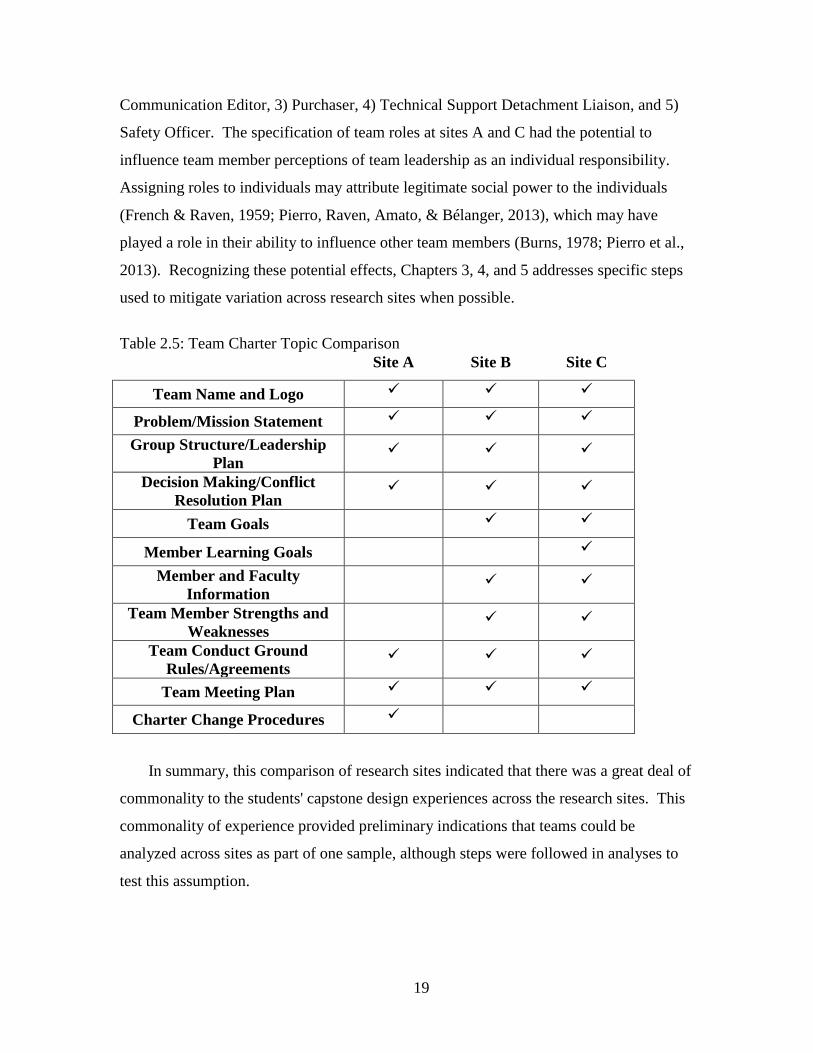
Table 2.5: Team Charter Topic Comparison
Site A Site B Site C
Team Name and Logo
Problem/Mission Statement
Group Structure/Leadership
Plan
Decision Making/Conflict
Resolution Plan
Team Goals
Member Learning Goals
Member and Faculty
Information
Team Member Strengths and
Weaknesses
Team Conduct Ground
Rules/Agreements
Team Meeting Plan
Charter Change Procedures
In summary, this comparison of research sites indicated that there was a great deal of
commonality to the students' capstone design experiences across the research sites. This
commonality of experience provided preliminary indications that teams could be
analyzed across sites as part of one sample, although steps were followed in analyses to
test this assumption.
20
Chapter 3
Manuscript 1: The Full Range of Leadership for Engineering:
Examining a subset of the Multifactor Leadership Questionnaire for mechanical
engineering capstone design teams.
3.1 Abstract
Background
Multiple national-level reports have indicated the need for engineers to take more
prominent leadership roles in the community and society to better-inform complex policy
decisions. Engineering faculty are tasked to develop a basic level of leadership
knowledge within undergraduate engineering students that can then be applied
increasingly throughout their careers. To date, these aspirations have gone largely
unfilled due at least partially to perceptions of leadership within practicing engineers that
are abstract and at odds with their professional practice.
Purpose/Hypothesis
The purpose of this study is to empirically validate the well-established Full Range of
Leadership model in the engineering student design team context. The results provide
engineering faculty a more precise and nuanced leadership model for leadership within
student capstone design teams. This research is intended to dismantle abstract views of
leadership and align leadership practices with the collaborative environment engineers
routinely experience.
Design/Methods
This quantitative study reviews and builds upon pilot exploratory factor analysis of the
Multifactor Leadership Questionnaire with confirmatory factor analysis of a subset of
items. The confirmed leadership scales are related to other related variables through
correlation and analysis of variance to add additional evidence of validity to the model.
The work establishes a leadership model for undergraduate, senior-level mechanical
engineering-centric capstone design teams.
Results
The confirmatory factor analysis results indicate that The Full Range of Leadership is
practiced by mechanical engineering-centric capstone design team members in three
forms: Transformational/Contingent Reward, Active Management by Exception, and
Passive-Avoidant. These three constructs are conceptually similar but distinct from the
Transformational, Transactional, and Laissez-Faire constructs of the Full Range of
Leadership model. The resulting leadership scales show evidence of validity within the
mechanical engineering-centric capstone design context by relating in anticipated ways
with self-reported leadership skills, member effort, and engineering GPA.
21
Conclusions
Results from this study indicate that a three-scale version of the Full Range of Leadership
model is valid for team members of mechanical engineering-centric capstone design
courses. By distilling leadership within the teams into three tangible and interpretable
constructs, this study takes a crucial first step toward making The Full Range of
Leadership relevant and approachable for engineering students preparing for professional
practice.
Key Words
Engineering Leadership, Full Range of Leadership Model, Multi-Factor Leadership
Questionnaire, Factor Analysis
3.2 Introduction
This research investigates the applicability of a widely recognized leadership model
in the collaborative, team-based environment that engineers routinely experience.
Specifically, this study explores the Full Range of Leadership model, which describes the
interplay between multiple forms of leadership to garner organizational performance
beyond expectations (Antonakis, Avolio, & Sivasubramaniam, 2003; Northouse, 2013;
Wang, Oh, Courtright, & Colbert, 2011). This model has been recommended for use by
practicing engineers (e.g., Breaux, 2006) but currently has only recently been examined
in a undergraduate engineering context (e.g., Novoselich & Knight, 2015). Using a
subset of the well-established Multifactor Leadership Questionnaire (Bass & Avolio,
2013) to garner leadership ratings among engineering capstone design team members,
this study examines the applicability of the leadership model for interpretation in a
collaborative engineering undergraduate course environment. By empirically validating
the Full Range of Leadership model in the engineering student design team context, this
work may give engineering faculty a more precise and nuanced way to access,
understand, and teach leadership to their students. This chapter addresses the following
research questions:
RQ1: To what extent do the scales that emerge from a modified
Multifactor Leadership Questionnaire used to measure the Full Range of
Leadership fit the undergraduate ME-centric student design team context?
22
RQ2: To what degree do the emerging leadership scales demonstrate validity by
relating to other variables in expected ways?
3.3 Leadership Theory and Review of the Literature
The preponderance of engineering related leadership literature fails to address how
leadership is enacted by students within the design team experience. Small sample
qualitative studies have mainly addressed how students, faculty, and practicing engineers
view leadership within an engineering context (e.g., AlSagheer & Al-Sagheer, 2011; Cox
et al., 2010; Rottmann et al., 2014; Sabatini & Knox, 1999; Schuhmann, 2010). Other
literature describes how engineering students develop as leaders along the pathway from
college through professional practice (e.g., Farr & Brazil, 2009; Farr et al., 1997), class
level curricula (e.g., Bowman & Farr, 2000; Galli & Luechtefeld, 2009; Hanus & Russell,
2007; Seat et al., 2001), and program-level curricula (e.g., Bayless et al., 2009;
Schuhmann, 2010; Williams et al., 2012) for engineering student leadership development.
A limited number of quantitative studies have focused on instrument development (e.g.,
Ahn et al., 2014; Gerhart et al., 2010), but these instruments are largely untested and lack
a wide body of empirical examination.
3.3.1 The Full Range of Leadership
The Full Range of Leadership model (see Bass, 1985; Bass & Avolio, 1994) is a
well-established leadership framework involving transformational and transactional
leadership (Mathieu, Neumann, Babiak, & Hare, 2015). Transformational leaders focus
on the change or transformation of people. According to this perspective, leaders
concern themselves with, “emotions, values, ethics, standards, and long-term goals”
(Northouse, 2013, p. 185). In working with followers, leaders take a more holistic role in
their interactions, attending to, for example, personal needs and examining motives.
Transactional leadership provides the base of leadership to achieve organizational
outcomes at expectations (Bass, 1985). Transactional leadership is described as the
exchange of valued outcomes between leaders and followers (Kuhnert & Lewis, 1987),
i.e., special recognition for adequately completing a complex task. Transformational
behaviors augment transactional behaviors to enable group outcomes to exceed
expectations (Bass, 1985; Kuhnert & Lewis, 1987; Northouse, 2013). Laissez-faire is the
23
third form of leadership accounted for in the model, describing leaders who fail to
provide influence to an organization, especially when needed (Avolio, 2011; Bass, 1985).
Recent literature (e.g., Breaux, 2006; Rottmann et al., 2014) has shown links
between engineering practice and the Full Range of Leadership model. Breaux (2006),
for example, describes transformational leadership as an effective model for practicing
engineers, as engineering leaders can champion the vision of an organization while also
assisting followers in navigating engineering’s dynamic, changing technical environment.
In their grounded theory based examination of leadership for practicing engineers,
Rottmann et al. (2014) develop a collaborative optimization leadership orientation. The
authors tie this leadership orientation back to a combination of transformational and
transactional leadership (Bass, 1985; Burns, 1978) as well as distributed leadership
(Gronn, 2008). Similar to Breaux’s (2006) description, Rottmann et al. (2014) describe
how these engineering leaders facilitate group processes which can be facilitated by the
relational aspects of transformational leadership. Rottmann et al. (2014) further describe
how the specialized training aspects of transactional leadership may assist collaborative
optimization type engineering leaders leverage and acknowledge team members’
strengths. These examples of how aspects of transformational and transactional
leadership play a role in the actions of engineering leaders in professional practice
demonstrate the potential for these forms of leadership to represent how engineering
students lead in their final stages of professional development.
3.3.2 Measuring the Full Range of Leadership
The Full Range of Leadership has been routinely measured for more than a decade
using the Multifactor Leadership Questionnaire (MLQ) (Avolio, Bass, & Jung, 1999), the
most prolific measure of the Full Range of Leadership currently in use (Jackson & Parry,
2011; Northouse, 2013). The full MLQ has demonstrated adequate construct validity in
both individual and shared transformational leadership research (Avolio,
Sivasubramaniam, Murry, Jung, & Garger, 2003). In addition, the MLQ has been
validated across a wide range of contexts, including U.S. and international undergraduate
and graduate business students, the U.S. military, research facilities, professional settings,
and project based professional environments (Antonakis et al., 2003; Avolio et al., 1999;
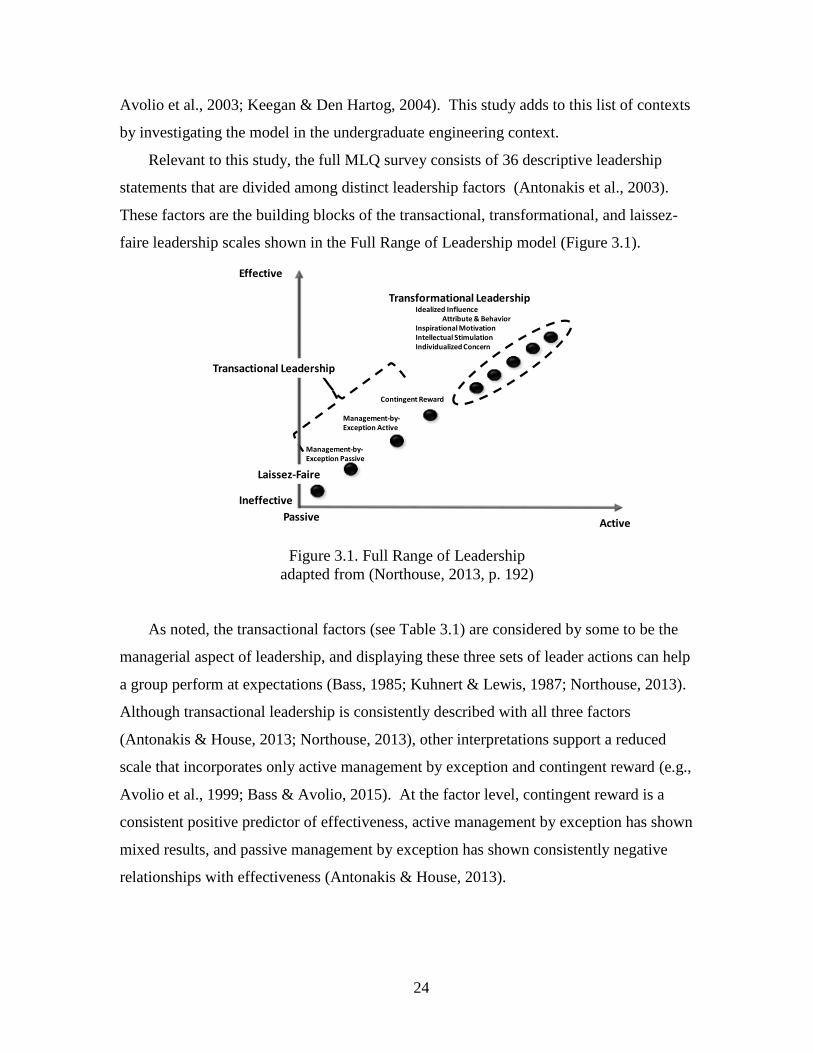
24
Avolio et al., 2003; Keegan & Den Hartog, 2004). This study adds to this list of contexts
by investigating the model in the undergraduate engineering context.
Relevant to this study, the full MLQ survey consists of 36 descriptive leadership
statements that are divided among distinct leadership factors (Antonakis et al., 2003).
These factors are the building blocks of the transactional, transformational, and laissez-
faire leadership scales shown in the Full Range of Leadership model (Figure 3.1).
Management-by-Exception Passive
Transformational LeadershipIdealized Influence
Attribute & BehaviorInspirational MotivationIntellectual StimulationIndividualized Concern
Contingent Reward
Management-by-Exception Active
PassiveActive
Effective
Ineffective
Laissez-Faire
Transactional Leadership
Figure 3.1. Full Range of Leadership
adapted from (Northouse, 2013, p. 192)
As noted, the transactional factors (see Table 3.1) are considered by some to be the
managerial aspect of leadership, and displaying these three sets of leader actions can help
a group perform at expectations (Bass, 1985; Kuhnert & Lewis, 1987; Northouse, 2013).
Although transactional leadership is consistently described with all three factors
(Antonakis & House, 2013; Northouse, 2013), other interpretations support a reduced
scale that incorporates only active management by exception and contingent reward (e.g.,
Avolio et al., 1999; Bass & Avolio, 2015). At the factor level, contingent reward is a
consistent positive predictor of effectiveness, active management by exception has shown
mixed results, and passive management by exception has shown consistently negative
relationships with effectiveness (Antonakis & House, 2013).
25
Table 3.1: Transactional Leadership Factors (Antonakis et al., 2003)
Factor Description Example
Management by Exception
(Active)
Active, corrective
transactions
Maintaining standards
Management by Exception
(Passive)
Passive corrective
transactions
Correcting mistakes
Contingent Reward Constructive transactions Rewarding performance,
clarifying roles
Bass (1985) describes transactional leadership as a necessary pre-requisite to
effective leadership, allowing for adequate group performance. To exceed expectations,
however, leaders must add transformational behaviors to their repertoire (Antonakis &
House, 2013; Bass, 1985, 1997; Northouse, 2013); this transformational scale, in its
entirety, is a consistent positive predictor of effectiveness (Antonakis & House, 2013).
As a result, the component factors are most often examined as the complete scale,
contrary to the factors of transactional leadership. Transformational leadership behaviors
are broken down into five factors in the MLQ (see Table 3.2).
Table 3.2: Transformational Leadership Factors (Antonakis et al., 2003).
Factor Description Example
Idealized Influence
(Attributed)
Perception of confidence
and power by others
Perceived as focusing in
ideals and ethics
Idealized Influence
(Behavior)
Charismatic actions of a
leader
Actions centered in values,
beliefs and sense of mission
Inspirational Motivation Energizing followers Projecting vision and
optimism
Individualized Concern Developing followers Attending to needs
Intellectual Stimulation Encourages innovative
thinking
Challenging the status quo
26
The third construct of the model is laissez-faire, a measure of non-leadership or
absentee leaders (Antonakis & House, 2013; Bass & Avolio, 1994). This construct
negatively relates to effectiveness (Antonakis & House, 2013; Bass, 1997). Although the
Full Range of Leadership model is described with laissez-faire as a separate scale (e.g.,
Antonakis & House, 2013; Northouse, 2013), multiple interpretations have combined this
laissez-faire scale with the passive management by exception factor (from transactional
leadership) into a higher order passive-avoidant scale because both negatively relate to
team effectiveness (Avolio et al., 1999; Bass & Avolio, 2015).
3.3.3 Validating The Full Range of Leadership for Engineering Design Teams
In a preliminary effort to explore the Full Range of Leadership model for
engineering design teams, Novoselich and Knight (2015) conducted exploratory analysis
of the 36 leadership descriptive statements within the full MLQ that identified a subset of
14 leadership statements for use in leadership network studies in the engineering design
team context. For that pilot study, Novoselich and Knight (2015) analyzed 435 student
round-robin responses to the full MLQ collected during the 2013-2014 academic year
from a large, Mid-Atlantic land grant institution and a small, northeastern military
academy. In that exploratory factor analysis, the factors of the Full Range of Leadership
model did not emerge as factors, thereby representing an inconsistent result with original
studies that developed the model (e.g., Avolio et al., 1999; Bass, 1985). . Exploratory
factor analysis of the 36 MLQ leadership items pointed to a three-construct leadership
model for ME Capstone design teams, consisting of Transformational/Contingent
Reward (TCR) 2, Active Management by Exception (MEA), and Passive-Avoidant(PA)3
leadership scales. These constructs are conceptually similar to but distinct from the
transformational, transactional, and laissez-faire constructs contained in the Full Range of
Leadership model. Because survey fatigue became an issue in pilot data collection, that
2 The original exploratory analysis in Novoselich and Knight (2015) labeled this construct developing.
Further professional collaboration illuminated potential miss-interpretations of the construct’s meaning
because of its label. This construct was re-named transformational/contingent reward.
3 The original exploratory analysis in Novoselich and Knight (2015) labeled this construct passive-
avoidant/laissez-faire. Further review of current literature (Avolio et al., 1999; Bass & Avolio, 2015)
indicates that a passive-avoidant label has been used in the literature and was re-named as such.
27
preliminary work empirically reduced the length of the survey to increase complete
survey response rates; the analysis identified a 14-item subset of the full MLQ that
adequately represented the three-scale leadership model, which was adopted for use in
the present study. Although main findings from that pilot study are summarized in
Appendix A, a full description can be found in Novoselich and Knight (2015).
Because of the novel findings of Novoselich and Knight (2015), additional validation
of the three construct model is warranted. Although the MLQ has undergone rigorous
testing in multiple contexts, Douglas and Purzer (2015) assert that peer-reviewed
publication does not assure instrument quality and functionality in a new context. In
addition to being administered in a novel engineering student design team context,
Novoselich & Knight’s (2015) recommendation to reduce the number of survey items
requires a re-examination of the survey’s validity for interpretation (American
Educational Research Association [AERA], American Psychological Association [APA],
& National Council on Measurement in Education [NCME], 2014; Douglas & Purzer,
2015; Goodwin, 2003). The copyright holder for the MLQ similarly asserts that
administering only part of the survey may change the instrument's validity properties
(Mind Garden, 2015); therefore, additional work must be done to demonstrate validity of
the three leadership constructs, which is the goal for the present study.
Multiple sources of evidence may be used to demonstrate the validity of an
instrument, as summarized in Table 3.3 (AERA, APA, & NCME, 2014; Goodwin, 2003).
The survey item reduction method in Novoselich and Knight (2015) demonstrates
evidence of test content through a purposeful item reduction strategy that ensured
coverage of the three leadership constructs (with appropriate reliability and preliminary
evidence of internal structure). The present study focuses on strengthening internal
structure evidence (research question 1) and determining relations to other variables
(research question 2) to demonstrate more fully the validity of the 14 item subset of the
MLQ in the engineering student design context. Evidence of response process was not
considered in this study because of the long history and extensive validation of the MLQ
items. The questions indirectly measure leadership constructs but allow the participant to
rate observable behaviors, lessening the interpretation required to rate an individual
(Singleton & Straits, 2010).
28
Table 3.3: Summary of Validity Evidence (AERA, APA, & NCME, 2014; Goodwin,
2003)
Evidence Based on… Description
Test Content
The relationship between the themes,
wording, and format of items, tasks, or
questions and the construct it intends to
measure.
Internal Structure How instrument components conform to
the construct on which they are based.
Relations to Other Variables
The degree to which instrument scores are
related to hypothetically similar constructs,
criteria they are intended to predict, or
group difference supported by theory.
Response Processes
Fit between the construct measured and the
nature of the performance or response
actually engaged by the participant.
The sections that follow establish anticipated relationships between the leadership
scales and other measured variables in the study. The literature provides indications that
measures of students’ self-reported leadership skills, member effort, and engineering
GPA are hypothesized to relate to the leadership that students enact as a part of their
teaming experience, which should be observable in the leadership ratings collected via
the reduced MLQ.
3.3.3.1 Self-Reported Leadership Skills
Establishing a relationship between the leadership scales measured by the instrument
(i.e., the 14-item MLQ, which consists of teammates' external ratings of an individual)
and another measure of student leadership (i.e., a self-report leadership skills scale)
provides convergent evidence of validity (American Educational Research Association et
al., 2014; Goodwin, 2003). Similar methods of comparing self and peer leadership
evaluations (e.g., Goldring, Cravens, Porter, Murphy, & Elliott, 2015; McEnery &
Blanchard, 1999) and personality inventories (e.g., Muck, Hell, & Gosling, 2007) have
been used to determine convergent evidence of validity. For leadership specifically,
Conway and Huffcutt (1997) showed weak but positive correlations between peer and
self-reports of leader performance in their meta-analysis of self-peer performance ratings.
As active forms of leadership (i.e., leaders enact leadership skills), TCR and MEA
leadership scale values should be higher for students with higher self-ratings of
29
leadership skills. Conversely, for an absence of leadership (i.e., PA) values should
decrease with higher self-rated leadership skills. Thus, to demonstrate validity, we
hypothesize:
Hypothesis 1: A self-report measure of leadership skills positively correlates with
both the peer-rated TCR and MEA leadership scales and negatively correlates
with the peer-rated PA scale.
3.3.3.2 Self-Reported Member Effort
Leaders are often recognized for (Hogan & Kaiser, 2005) and set an example of hard
work (Avolio, Waldman, & Yammarino, 1991). Manager effort has been shown to
exhibit positive relationships with member perceptions of relationship quality in studies
of leader-member exchange theory (LMX) (e.g., Maslyn & Uhl-Bien, 2001).
Consequently, we hypothesize the following:
Hypothesis 2: TCR and MEA Leadership scales positively correlate with a self-
report scale of member effort, and PA negatively correlate with a self-report scale
of member effort.
Demonstrating weaker relationships between the external ratings of students’
leadership and different, but related constructs (e.g., member effort) would demonstrate
discriminant evidence because those scales are meant to measure different constructs
(American Educational Research Association et al., 2014; Goodwin, 2003). Because
member effort is related to, but distinct from leadership itself, we anticipate smaller
correlation magnitudes than those observed between the TCR, MEA, PA, and a self-
reported engineering leadership skills:
Hypothesis 3: Correlation coefficients between self-reported member effort and the
TCR, MEA, and PA leadership scales will have a lower magnitude than correlation
coefficients between the self-reported leadership scale and the TCR, MEA, and PA
scales.
3.3.3.3 Self-Reported Engineering Course GPA
Identifying differences in leadership by different groupings of students may provide
additional evidence of validity, as group comparisons are often used in validation studies
to demonstrate expected differences across groups (Goodwin, 2003). Leadership
differences are expected to exist among students who perform differently academically
30
because leadership involves a person’s ability to influence other members of a group;
expert power is an important component of the influence process (Northouse, 2013).
Students who have higher grade point averages in engineering- and science-related
courses may possess a source of power with which to influence their peers and hence
exercise leadership. Expert power is attributed by followers to an individual who exhibits
competence in a subject area (French & Raven, 1959; Pierro et al., 2013). Tonso (2007)
echoes this interpretation in her ethnographic study of student design teams,
demonstrating that students with high academic-science expertise (as indicated by
engineering-science course performance) were afforded additional agency over their less
engineering-science expert peers. The additional agency afforded to students with higher
GPA would facilitate active influence within their design teams, increasing both TCR and
MEA leadership and correspondingly decreasing the absentee PA leadership behaviors:
Hypothesis 4: Students with higher self-reported engineering course GPA have
higher peer-ratings on both TCR and MEA leadership scales and lower ratings on
the PA leadership scale.
3.4 Data and Methods
3.4.1 Data Collection
Because an end goal of this study was to set conditions for measuring the Full Range
of Leadership from a shared leadership perspective in follow-on research, data collection
required a modified, round-robin (360-degree) version of the MLQ. The instrument was
adapted following the research design proposed by Mayo et al. (2003) and consistent with
the format used by Novoselich and Knight (2015). Team members assessed each of their
teammates’ leadership behaviors based on the 14 descriptive leadership statements (the
reduced MLQ) (see Figure 3.2). The study did not require faculty advisors to
reciprocally rate team member leadership in an effort to maximize full-team response to
data collection. Interactions with various course coordinators and faculty advisors
indicated the potential for low faculty member response rates; full team responses were
required to generate team level ratings of each team member and for follow-on analysis
of shared leadership.
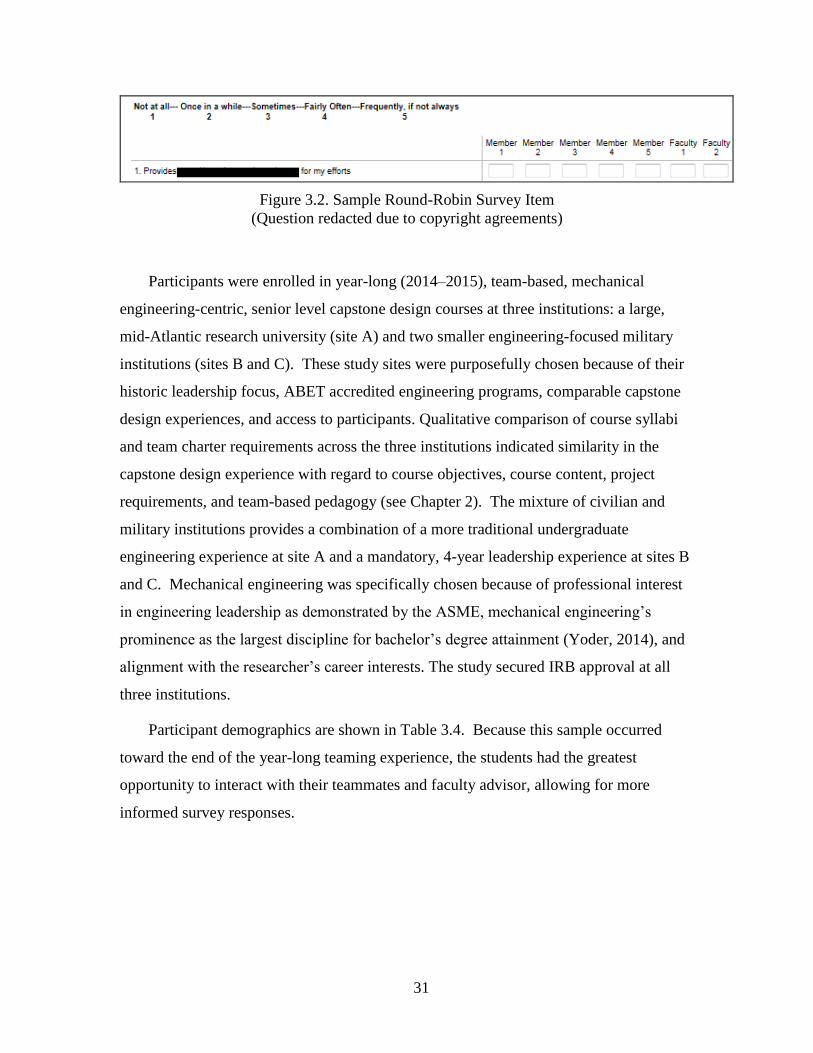
31
Figure 3.2. Sample Round-Robin Survey Item
(Question redacted due to copyright agreements)
Participants were enrolled in year-long (2014–2015), team-based, mechanical
engineering-centric, senior level capstone design courses at three institutions: a large,
mid-Atlantic research university (site A) and two smaller engineering-focused military
institutions (sites B and C). These study sites were purposefully chosen because of their
historic leadership focus, ABET accredited engineering programs, comparable capstone
design experiences, and access to participants. Qualitative comparison of course syllabi
and team charter requirements across the three institutions indicated similarity in the
capstone design experience with regard to course objectives, course content, project
requirements, and team-based pedagogy (see Chapter 2). The mixture of civilian and
military institutions provides a combination of a more traditional undergraduate
engineering experience at site A and a mandatory, 4-year leadership experience at sites B
and C. Mechanical engineering was specifically chosen because of professional interest
in engineering leadership as demonstrated by the ASME, mechanical engineering’s
prominence as the largest discipline for bachelor’s degree attainment (Yoder, 2014), and
alignment with the researcher’s career interests. The study secured IRB approval at all
three institutions.
Participant demographics are shown in Table 3.4. Because this sample occurred
toward the end of the year-long teaming experience, the students had the greatest
opportunity to interact with their teammates and faculty advisor, allowing for more
informed survey responses.
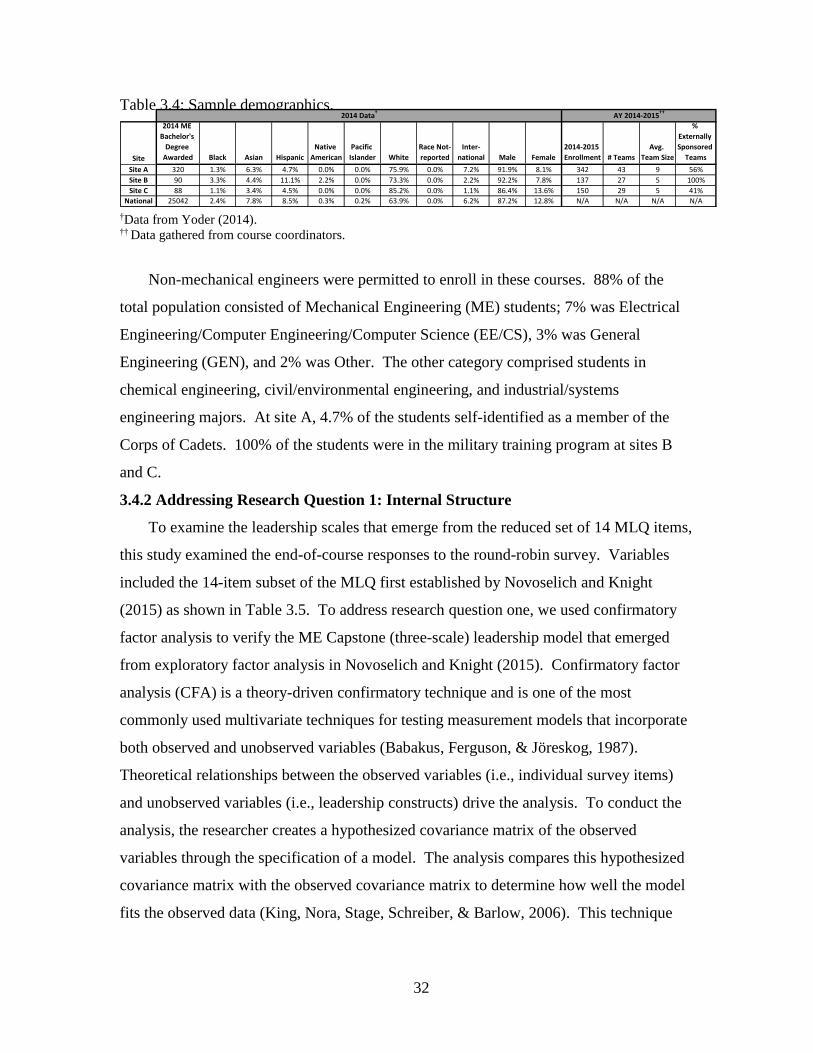
32
Table 3.4: Sample demographics.
Site
2014 ME
Bachelor's
Degree
Awarded Black Asian Hispanic
Native
American
Pacific
Islander White
Race Not-
reported
Inter-
national Male Female
2014-2015
Enrollment # Teams
Avg.
Team Size
%
Externally
Sponsored
Teams
Site A 320 1.3% 6.3% 4.7% 0.0% 0.0% 75.9% 0.0% 7.2% 91.9% 8.1% 342 43 9 56%
Site B 90 3.3% 4.4% 11.1% 2.2% 0.0% 73.3% 0.0% 2.2% 92.2% 7.8% 137 27 5 100%
Site C 88 1.1% 3.4% 4.5% 0.0% 0.0% 85.2% 0.0% 1.1% 86.4% 13.6% 150 29 5 41%
National 25042 2.4% 7.8% 8.5% 0.3% 0.2% 63.9% 0.0% 6.2% 87.2% 12.8% N/A N/A N/A N/A
2014 Data†
AY 2014-2015††
†Data from Yoder (2014). †† Data gathered from course coordinators.
Non-mechanical engineers were permitted to enroll in these courses. 88% of the
total population consisted of Mechanical Engineering (ME) students; 7% was Electrical
Engineering/Computer Engineering/Computer Science (EE/CS), 3% was General
Engineering (GEN), and 2% was Other. The other category comprised students in
chemical engineering, civil/environmental engineering, and industrial/systems
engineering majors. At site A, 4.7% of the students self-identified as a member of the
Corps of Cadets. 100% of the students were in the military training program at sites B
and C.
3.4.2 Addressing Research Question 1: Internal Structure
To examine the leadership scales that emerge from the reduced set of 14 MLQ items,
this study examined the end-of-course responses to the round-robin survey. Variables
included the 14-item subset of the MLQ first established by Novoselich and Knight
(2015) as shown in Table 3.5. To address research question one, we used confirmatory
factor analysis to verify the ME Capstone (three-scale) leadership model that emerged
from exploratory factor analysis in Novoselich and Knight (2015). Confirmatory factor
analysis (CFA) is a theory-driven confirmatory technique and is one of the most
commonly used multivariate techniques for testing measurement models that incorporate
both observed and unobserved variables (Babakus, Ferguson, & Jöreskog, 1987).
Theoretical relationships between the observed variables (i.e., individual survey items)
and unobserved variables (i.e., leadership constructs) drive the analysis. To conduct the
analysis, the researcher creates a hypothesized covariance matrix of the observed
variables through the specification of a model. The analysis compares this hypothesized
covariance matrix with the observed covariance matrix to determine how well the model
fits the observed data (King, Nora, Stage, Schreiber, & Barlow, 2006). This technique
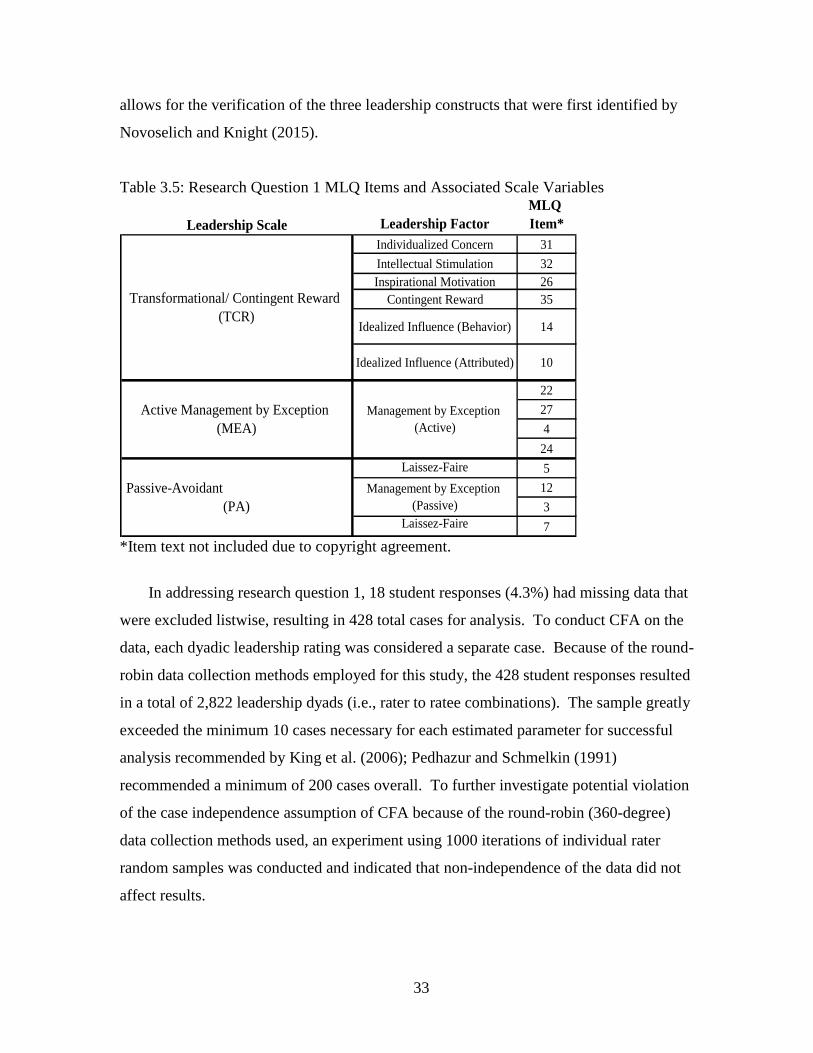
33
allows for the verification of the three leadership constructs that were first identified by
Novoselich and Knight (2015).
Table 3.5: Research Question 1 MLQ Items and Associated Scale Variables
Leadership Scale Leadership Factor
MLQ
Item*
Individualized Concern 31
Intellectual Stimulation 32
Inspirational Motivation 26
Contingent Reward 35
Idealized Influence (Behavior) 14
Idealized Influence (Attributed) 10
22
27
4
24
Laissez-Faire 5
12
3
Laissez-Faire 7
Management by Exception
(Active)
Management by Exception
(Passive)
Passive-Avoidant
(PA)
Transformational/ Contingent Reward
(TCR)
Active Management by Exception
(MEA)
*Item text not included due to copyright agreement.
In addressing research question 1, 18 student responses (4.3%) had missing data that
were excluded listwise, resulting in 428 total cases for analysis. To conduct CFA on the
data, each dyadic leadership rating was considered a separate case. Because of the round-
robin data collection methods employed for this study, the 428 student responses resulted
in a total of 2,822 leadership dyads (i.e., rater to ratee combinations). The sample greatly
exceeded the minimum 10 cases necessary for each estimated parameter for successful
analysis recommended by King et al. (2006); Pedhazur and Schmelkin (1991)
recommended a minimum of 200 cases overall. To further investigate potential violation
of the case independence assumption of CFA because of the round-robin (360-degree)
data collection methods used, an experiment using 1000 iterations of individual rater
random samples was conducted and indicated that non-independence of the data did not
affect results.
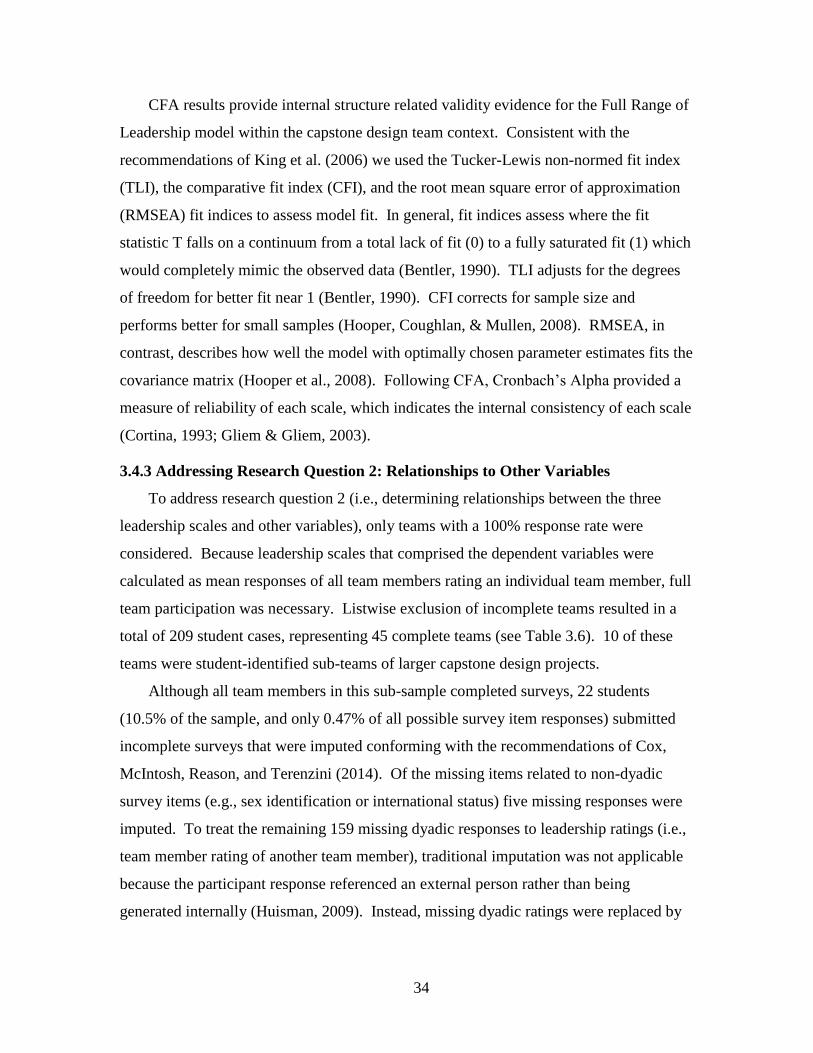
34
CFA results provide internal structure related validity evidence for the Full Range of
Leadership model within the capstone design team context. Consistent with the
recommendations of King et al. (2006) we used the Tucker-Lewis non-normed fit index
(TLI), the comparative fit index (CFI), and the root mean square error of approximation
(RMSEA) fit indices to assess model fit. In general, fit indices assess where the fit
statistic T falls on a continuum from a total lack of fit (0) to a fully saturated fit (1) which
would completely mimic the observed data (Bentler, 1990). TLI adjusts for the degrees
of freedom for better fit near 1 (Bentler, 1990). CFI corrects for sample size and
performs better for small samples (Hooper, Coughlan, & Mullen, 2008). RMSEA, in
contrast, describes how well the model with optimally chosen parameter estimates fits the
covariance matrix (Hooper et al., 2008). Following CFA, Cronbach’s Alpha provided a
measure of reliability of each scale, which indicates the internal consistency of each scale
(Cortina, 1993; Gliem & Gliem, 2003).
3.4.3 Addressing Research Question 2: Relationships to Other Variables
To address research question 2 (i.e., determining relationships between the three
leadership scales and other variables), only teams with a 100% response rate were
considered. Because leadership scales that comprised the dependent variables were
calculated as mean responses of all team members rating an individual team member, full
team participation was necessary. Listwise exclusion of incomplete teams resulted in a
total of 209 student cases, representing 45 complete teams (see Table 3.6). 10 of these
teams were student-identified sub-teams of larger capstone design projects.
Although all team members in this sub-sample completed surveys, 22 students
(10.5% of the sample, and only 0.47% of all possible survey item responses) submitted
incomplete surveys that were imputed conforming with the recommendations of Cox,
McIntosh, Reason, and Terenzini (2014). Of the missing items related to non-dyadic
survey items (e.g., sex identification or international status) five missing responses were
imputed. To treat the remaining 159 missing dyadic responses to leadership ratings (i.e.,
team member rating of another team member), traditional imputation was not applicable
because the participant response referenced an external person rather than being
generated internally (Huisman, 2009). Instead, missing dyadic ratings were replaced by
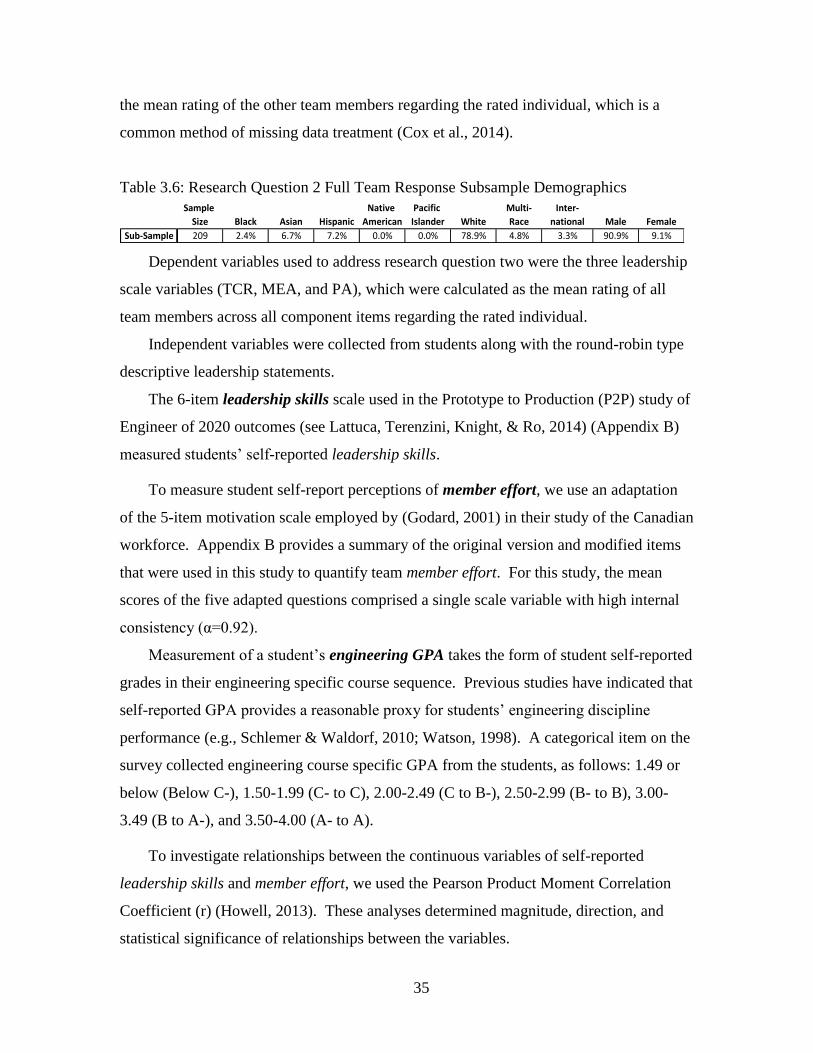
35
the mean rating of the other team members regarding the rated individual, which is a
common method of missing data treatment (Cox et al., 2014).
Table 3.6: Research Question 2 Full Team Response Subsample Demographics
Sample
Size Black Asian Hispanic
Native
American
Pacific
Islander White
Multi-
Race
Inter-
national Male Female
Sub-Sample 209 2.4% 6.7% 7.2% 0.0% 0.0% 78.9% 4.8% 3.3% 90.9% 9.1%
Dependent variables used to address research question two were the three leadership
scale variables (TCR, MEA, and PA), which were calculated as the mean rating of all
team members across all component items regarding the rated individual.
Independent variables were collected from students along with the round-robin type
descriptive leadership statements.
The 6-item leadership skills scale used in the Prototype to Production (P2P) study of
Engineer of 2020 outcomes (see Lattuca, Terenzini, Knight, & Ro, 2014) (Appendix B)
measured students’ self-reported leadership skills.
To measure student self-report perceptions of member effort, we use an adaptation
of the 5-item motivation scale employed by (Godard, 2001) in their study of the Canadian
workforce. Appendix B provides a summary of the original version and modified items
that were used in this study to quantify team member effort. For this study, the mean
scores of the five adapted questions comprised a single scale variable with high internal
consistency (α=0.92).
Measurement of a student’s engineering GPA takes the form of student self-reported
grades in their engineering specific course sequence. Previous studies have indicated that
self-reported GPA provides a reasonable proxy for students’ engineering discipline
performance (e.g., Schlemer & Waldorf, 2010; Watson, 1998). A categorical item on the
survey collected engineering course specific GPA from the students, as follows: 1.49 or
below (Below C-), 1.50-1.99 (C- to C), 2.00-2.49 (C to B-), 2.50-2.99 (B- to B), 3.00-
3.49 (B to A-), and 3.50-4.00 (A- to A).
To investigate relationships between the continuous variables of self-reported
leadership skills and member effort, we used the Pearson Product Moment Correlation
Coefficient (r) (Howell, 2013). These analyses determined magnitude, direction, and
statistical significance of relationships between the variables.
36
For analysis of the student engineering GPA groupings, the small group sizes
prevented a normal distribution of the student scale scores; thus, non-parametric tests
were appropriate (Howell, 2013). To investigate group differences across GPA
groupings, and in accordance with recommendations by Corder and Foreman (2014) and
Howell (2013), we used the Kruskal-Wallis one-way analysis of variance test to first
investigate whether any differences existed across student groups. The procedure tests
the null hypothesis that all samples were drawn from identical populations (Howell,
2013). We then conducted post-hoc Mann-Whitney U tests to determine which pairs of
student groups exhibited the differences. This analysis further determined the validity of
the leadership scales through criterion related evidence as described by Gall, Gall, and
Borg (2007) and Goodwin (2003).
3.4.4 Limitations
This study has several limitations which should be considered when interpreting
results. First, this study focuses on senior-level engineering students mainly within the
mechanical engineering discipline. As a result, generality claims to the wider field of
engineering across multiple disciplines, class years, and professional practice are
unwarranted. Second, the format of data collection, which only incorporates data
collection from students but not the faculty advisors or external clients, truncates
potential sources of leadership within the student teams. This decision was made in an
effort to lessen data collection complexity. Requiring data collection from faculty
advisors would have increased risk to the study’s viability because of a greater potential
for incomplete data with low faculty advisor participation. This facet of the study design,
however, reflected the reality that students may not possess the expert or legitimate social
power by which to influence their faculty advisors through leadership actions. The
inclusion of external clients was also deemed beyond the scope of the study and could be
an area for future work.
A third limitation of this study is the reduced number of MLQ items included in the
survey. Although a full examination of all 36 MLQ leadership descriptive statements
was desired, low student response rates in pilot data collection efforts prompted the
decision to decrease the survey length. Examining all 36 MLQ items through exploratory
factor analysis helped ensure the most advantageous subset of MLQ items were brought
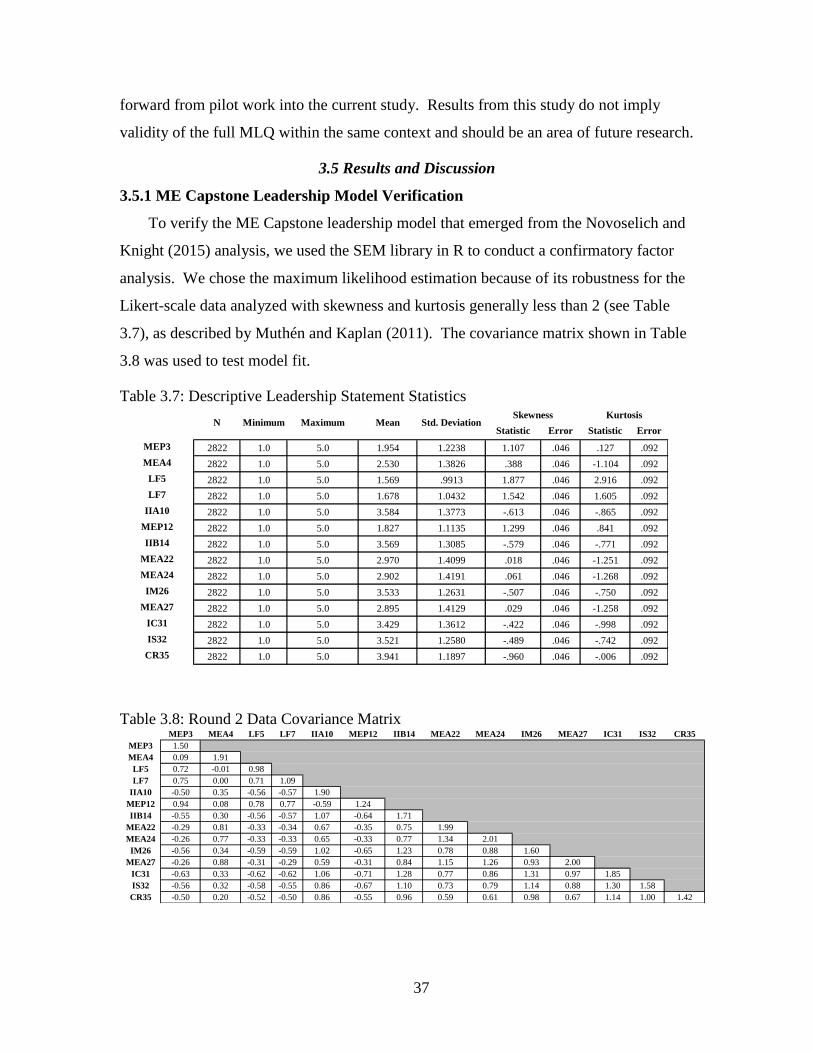
37
forward from pilot work into the current study. Results from this study do not imply
validity of the full MLQ within the same context and should be an area of future research.
3.5 Results and Discussion
3.5.1 ME Capstone Leadership Model Verification
To verify the ME Capstone leadership model that emerged from the Novoselich and
Knight (2015) analysis, we used the SEM library in R to conduct a confirmatory factor
analysis. We chose the maximum likelihood estimation because of its robustness for the
Likert-scale data analyzed with skewness and kurtosis generally less than 2 (see Table
3.7), as described by Muthén and Kaplan (2011). The covariance matrix shown in Table
3.8 was used to test model fit.
Table 3.7: Descriptive Leadership Statement Statistics
Statistic
Std.
Error Statistic
Std.
Error
MEP3 2822 1.0 5.0 1.954 1.2238 1.107 .046 .127 .092
MEA4 2822 1.0 5.0 2.530 1.3826 .388 .046 -1.104 .092
LF5 2822 1.0 5.0 1.569 .9913 1.877 .046 2.916 .092
LF7 2822 1.0 5.0 1.678 1.0432 1.542 .046 1.605 .092
IIA10 2822 1.0 5.0 3.584 1.3773 -.613 .046 -.865 .092
MEP12 2822 1.0 5.0 1.827 1.1135 1.299 .046 .841 .092
IIB14 2822 1.0 5.0 3.569 1.3085 -.579 .046 -.771 .092
MEA22 2822 1.0 5.0 2.970 1.4099 .018 .046 -1.251 .092
MEA24 2822 1.0 5.0 2.902 1.4191 .061 .046 -1.268 .092
IM26 2822 1.0 5.0 3.533 1.2631 -.507 .046 -.750 .092
MEA27 2822 1.0 5.0 2.895 1.4129 .029 .046 -1.258 .092
IC31 2822 1.0 5.0 3.429 1.3612 -.422 .046 -.998 .092
IS32 2822 1.0 5.0 3.521 1.2580 -.489 .046 -.742 .092
CR35 2822 1.0 5.0 3.941 1.1897 -.960 .046 -.006 .092
KurtosisSkewnessN Minimum Maximum Mean Std. Deviation
Table 3.8: Round 2 Data Covariance Matrix MEP3 MEA4 LF5 LF7 IIA10 MEP12 IIB14 MEA22 MEA24 IM26 MEA27 IC31 IS32 CR35
MEP3 1.50
MEA4 0.09 1.91
LF5 0.72 -0.01 0.98
LF7 0.75 0.00 0.71 1.09
IIA10 -0.50 0.35 -0.56 -0.57 1.90
MEP12 0.94 0.08 0.78 0.77 -0.59 1.24
IIB14 -0.55 0.30 -0.56 -0.57 1.07 -0.64 1.71
MEA22 -0.29 0.81 -0.33 -0.34 0.67 -0.35 0.75 1.99
MEA24 -0.26 0.77 -0.33 -0.33 0.65 -0.33 0.77 1.34 2.01
IM26 -0.56 0.34 -0.59 -0.59 1.02 -0.65 1.23 0.78 0.88 1.60
MEA27 -0.26 0.88 -0.31 -0.29 0.59 -0.31 0.84 1.15 1.26 0.93 2.00
IC31 -0.63 0.33 -0.62 -0.62 1.06 -0.71 1.28 0.77 0.86 1.31 0.97 1.85
IS32 -0.56 0.32 -0.58 -0.55 0.86 -0.67 1.10 0.73 0.79 1.14 0.88 1.30 1.58
CR35 -0.50 0.20 -0.52 -0.50 0.86 -0.55 0.96 0.59 0.61 0.98 0.67 1.14 1.00 1.42
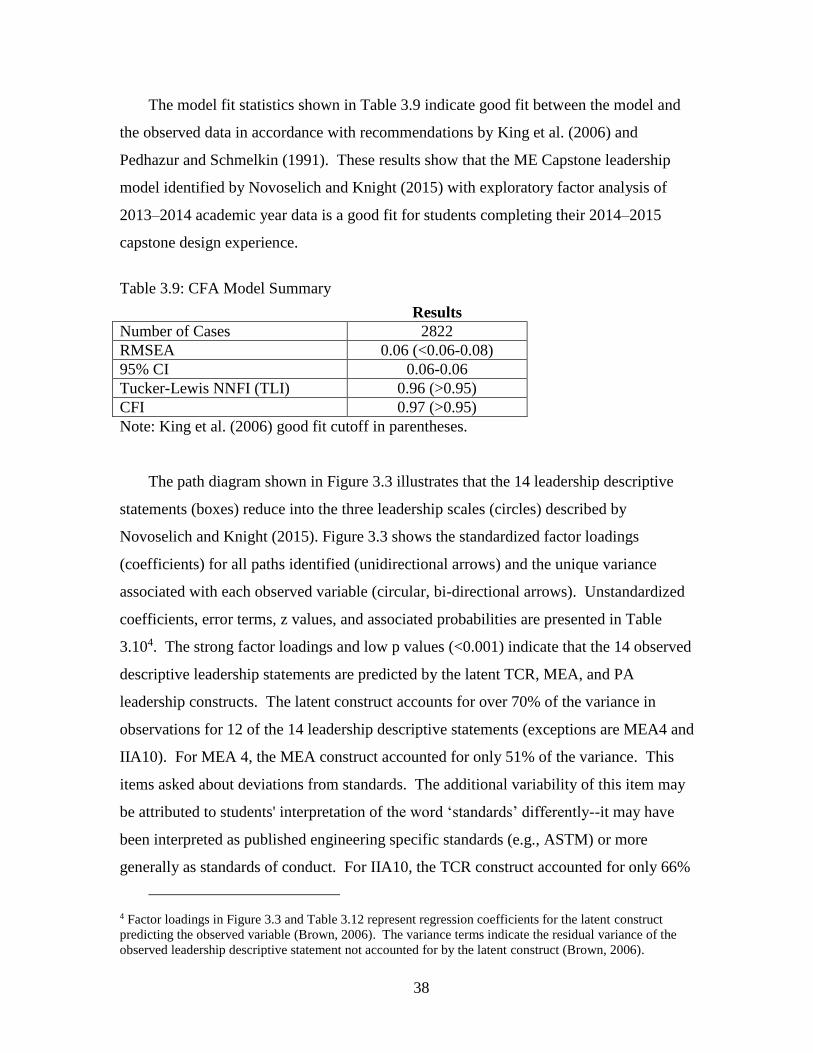
38
The model fit statistics shown in Table 3.9 indicate good fit between the model and
the observed data in accordance with recommendations by King et al. (2006) and
Pedhazur and Schmelkin (1991). These results show that the ME Capstone leadership
model identified by Novoselich and Knight (2015) with exploratory factor analysis of
2013–2014 academic year data is a good fit for students completing their 2014–2015
capstone design experience.
Table 3.9: CFA Model Summary
Results
Number of Cases 2822
RMSEA 0.06 (<0.06-0.08)
95% CI 0.06-0.06
Tucker-Lewis NNFI (TLI) 0.96 (>0.95)
CFI 0.97 (>0.95)
Note: King et al. (2006) good fit cutoff in parentheses.
The path diagram shown in Figure 3.3 illustrates that the 14 leadership descriptive
statements (boxes) reduce into the three leadership scales (circles) described by
Novoselich and Knight (2015). Figure 3.3 shows the standardized factor loadings
(coefficients) for all paths identified (unidirectional arrows) and the unique variance
associated with each observed variable (circular, bi-directional arrows). Unstandardized
coefficients, error terms, z values, and associated probabilities are presented in Table
3.104. The strong factor loadings and low p values (<0.001) indicate that the 14 observed
descriptive leadership statements are predicted by the latent TCR, MEA, and PA
leadership constructs. The latent construct accounts for over 70% of the variance in
observations for 12 of the 14 leadership descriptive statements (exceptions are MEA4 and
IIA10). For MEA 4, the MEA construct accounted for only 51% of the variance. This
items asked about deviations from standards. The additional variability of this item may
be attributed to students' interpretation of the word ‘standards’ differently--it may have
been interpreted as published engineering specific standards (e.g., ASTM) or more
generally as standards of conduct. For IIA10, the TCR construct accounted for only 66%
4 Factor loadings in Figure 3.3 and Table 3.12 represent regression coefficients for the latent construct
predicting the observed variable (Brown, 2006). The variance terms indicate the residual variance of the
observed leadership descriptive statement not accounted for by the latent construct (Brown, 2006).
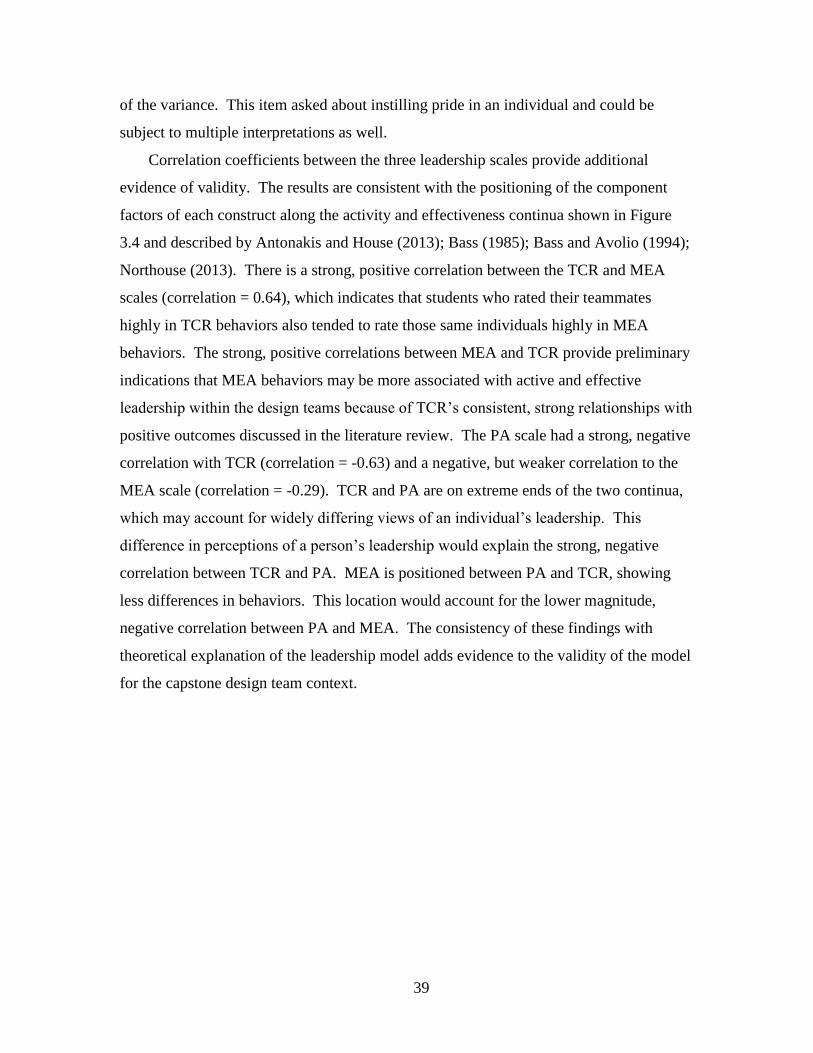
39
of the variance. This item asked about instilling pride in an individual and could be
subject to multiple interpretations as well.
Correlation coefficients between the three leadership scales provide additional
evidence of validity. The results are consistent with the positioning of the component
factors of each construct along the activity and effectiveness continua shown in Figure
3.4 and described by Antonakis and House (2013); Bass (1985); Bass and Avolio (1994);
Northouse (2013). There is a strong, positive correlation between the TCR and MEA
scales (correlation = 0.64), which indicates that students who rated their teammates
highly in TCR behaviors also tended to rate those same individuals highly in MEA
behaviors. The strong, positive correlations between MEA and TCR provide preliminary
indications that MEA behaviors may be more associated with active and effective
leadership within the design teams because of TCR’s consistent, strong relationships with
positive outcomes discussed in the literature review. The PA scale had a strong, negative
correlation with TCR (correlation = -0.63) and a negative, but weaker correlation to the
MEA scale (correlation = -0.29). TCR and PA are on extreme ends of the two continua,
which may account for widely differing views of an individual’s leadership. This
difference in perceptions of a person’s leadership would explain the strong, negative
correlation between TCR and PA. MEA is positioned between PA and TCR, showing
less differences in behaviors. This location would account for the lower magnitude,
negative correlation between PA and MEA. The consistency of these findings with
theoretical explanation of the leadership model adds evidence to the validity of the model
for the capstone design team context.
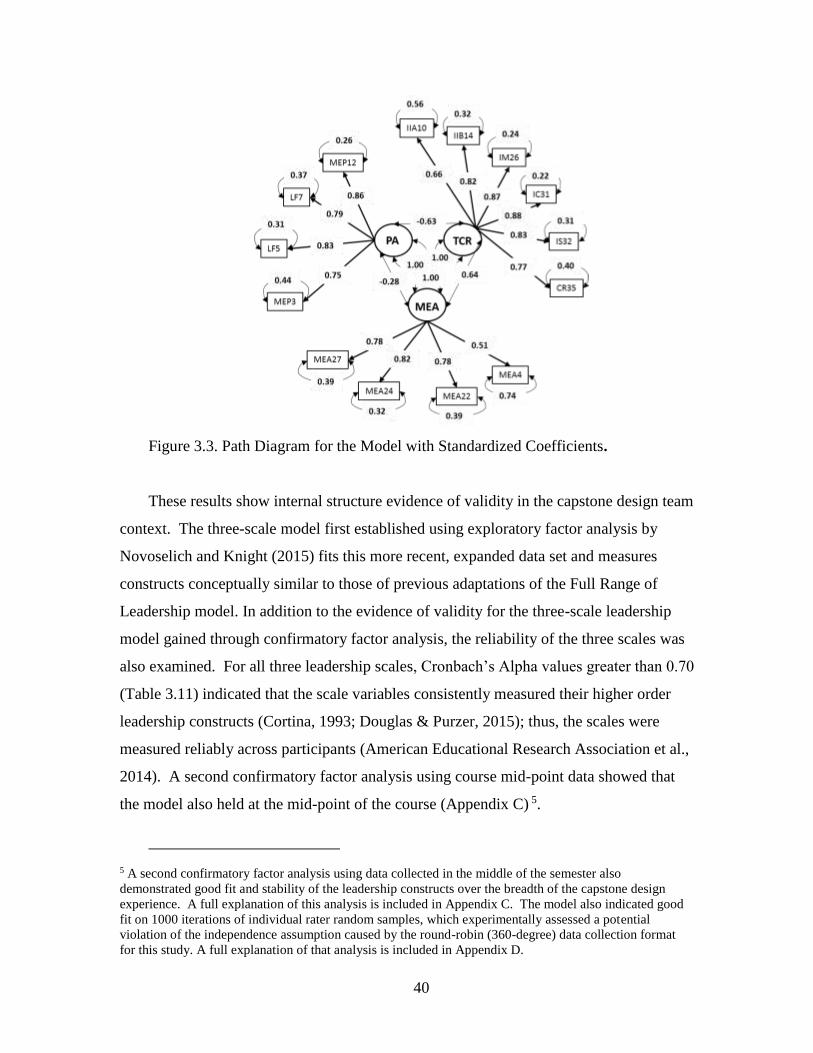
40
Figure 3.3. Path Diagram for the Model with Standardized Coefficients.
These results show internal structure evidence of validity in the capstone design team
context. The three-scale model first established using exploratory factor analysis by
Novoselich and Knight (2015) fits this more recent, expanded data set and measures
constructs conceptually similar to those of previous adaptations of the Full Range of
Leadership model. In addition to the evidence of validity for the three-scale leadership
model gained through confirmatory factor analysis, the reliability of the three scales was
also examined. For all three leadership scales, Cronbach’s Alpha values greater than 0.70
(Table 3.11) indicated that the scale variables consistently measured their higher order
leadership constructs (Cortina, 1993; Douglas & Purzer, 2015); thus, the scales were
measured reliably across participants (American Educational Research Association et al.,
2014). A second confirmatory factor analysis using course mid-point data showed that
the model also held at the mid-point of the course (Appendix C) 5.
5 A second confirmatory factor analysis using data collected in the middle of the semester also
demonstrated good fit and stability of the leadership constructs over the breadth of the capstone design
experience. A full explanation of this analysis is included in Appendix C. The model also indicated good
fit on 1000 iterations of individual rater random samples, which experimentally assessed a potential
violation of the independence assumption caused by the round-robin (360-degree) data collection format
for this study. A full explanation of that analysis is included in Appendix D.
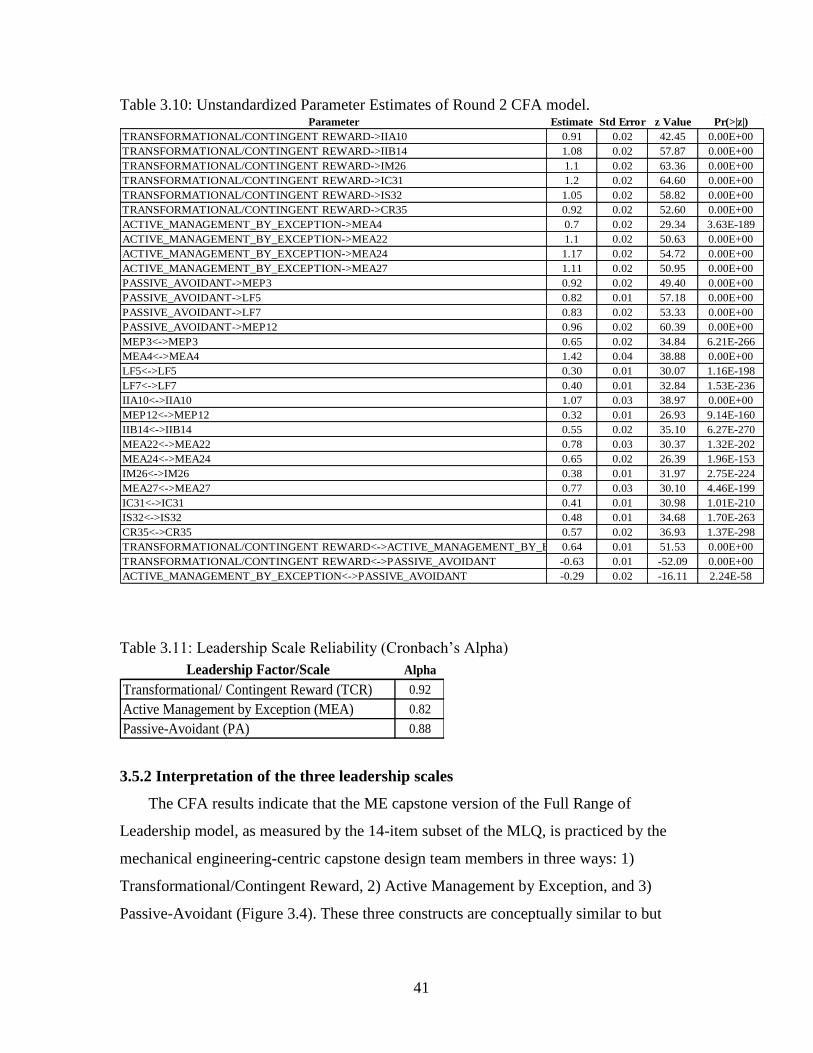
41
Table 3.10: Unstandardized Parameter Estimates of Round 2 CFA model. Parameter Estimate Std Error z Value Pr(>|z|)
TRANSFORMATIONAL/CONTINGENT REWARD->IIA10 0.91 0.02 42.45 0.00E+00
TRANSFORMATIONAL/CONTINGENT REWARD->IIB14 1.08 0.02 57.87 0.00E+00
TRANSFORMATIONAL/CONTINGENT REWARD->IM26 1.1 0.02 63.36 0.00E+00
TRANSFORMATIONAL/CONTINGENT REWARD->IC31 1.2 0.02 64.60 0.00E+00
TRANSFORMATIONAL/CONTINGENT REWARD->IS32 1.05 0.02 58.82 0.00E+00
TRANSFORMATIONAL/CONTINGENT REWARD->CR35 0.92 0.02 52.60 0.00E+00
ACTIVE_MANAGEMENT_BY_EXCEPTION->MEA4 0.7 0.02 29.34 3.63E-189
ACTIVE_MANAGEMENT_BY_EXCEPTION->MEA22 1.1 0.02 50.63 0.00E+00
ACTIVE_MANAGEMENT_BY_EXCEPTION->MEA24 1.17 0.02 54.72 0.00E+00
ACTIVE_MANAGEMENT_BY_EXCEPTION->MEA27 1.11 0.02 50.95 0.00E+00
PASSIVE_AVOIDANT->MEP3 0.92 0.02 49.40 0.00E+00
PASSIVE_AVOIDANT->LF5 0.82 0.01 57.18 0.00E+00
PASSIVE_AVOIDANT->LF7 0.83 0.02 53.33 0.00E+00
PASSIVE_AVOIDANT->MEP12 0.96 0.02 60.39 0.00E+00
MEP3<->MEP3 0.65 0.02 34.84 6.21E-266
MEA4<->MEA4 1.42 0.04 38.88 0.00E+00
LF5<->LF5 0.30 0.01 30.07 1.16E-198
LF7<->LF7 0.40 0.01 32.84 1.53E-236
IIA10<->IIA10 1.07 0.03 38.97 0.00E+00
MEP12<->MEP12 0.32 0.01 26.93 9.14E-160
IIB14<->IIB14 0.55 0.02 35.10 6.27E-270
MEA22<->MEA22 0.78 0.03 30.37 1.32E-202
MEA24<->MEA24 0.65 0.02 26.39 1.96E-153
IM26<->IM26 0.38 0.01 31.97 2.75E-224
MEA27<->MEA27 0.77 0.03 30.10 4.46E-199
IC31<->IC31 0.41 0.01 30.98 1.01E-210
IS32<->IS32 0.48 0.01 34.68 1.70E-263
CR35<->CR35 0.57 0.02 36.93 1.37E-298
TRANSFORMATIONAL/CONTINGENT REWARD<->ACTIVE_MANAGEMENT_BY_EXCEPTION0.64 0.01 51.53 0.00E+00
TRANSFORMATIONAL/CONTINGENT REWARD<->PASSIVE_AVOIDANT -0.63 0.01 -52.09 0.00E+00
ACTIVE_MANAGEMENT_BY_EXCEPTION<->PASSIVE_AVOIDANT -0.29 0.02 -16.11 2.24E-58
Table 3.11: Leadership Scale Reliability (Cronbach’s Alpha)
Leadership Factor/Scale Alpha
Transformational/ Contingent Reward (TCR) 0.92
Active Management by Exception (MEA) 0.82
Passive-Avoidant (PA) 0.88
3.5.2 Interpretation of the three leadership scales
The CFA results indicate that the ME capstone version of the Full Range of
Leadership model, as measured by the 14-item subset of the MLQ, is practiced by the
mechanical engineering-centric capstone design team members in three ways: 1)
Transformational/Contingent Reward, 2) Active Management by Exception, and 3)
Passive-Avoidant (Figure 3.4). These three constructs are conceptually similar to but
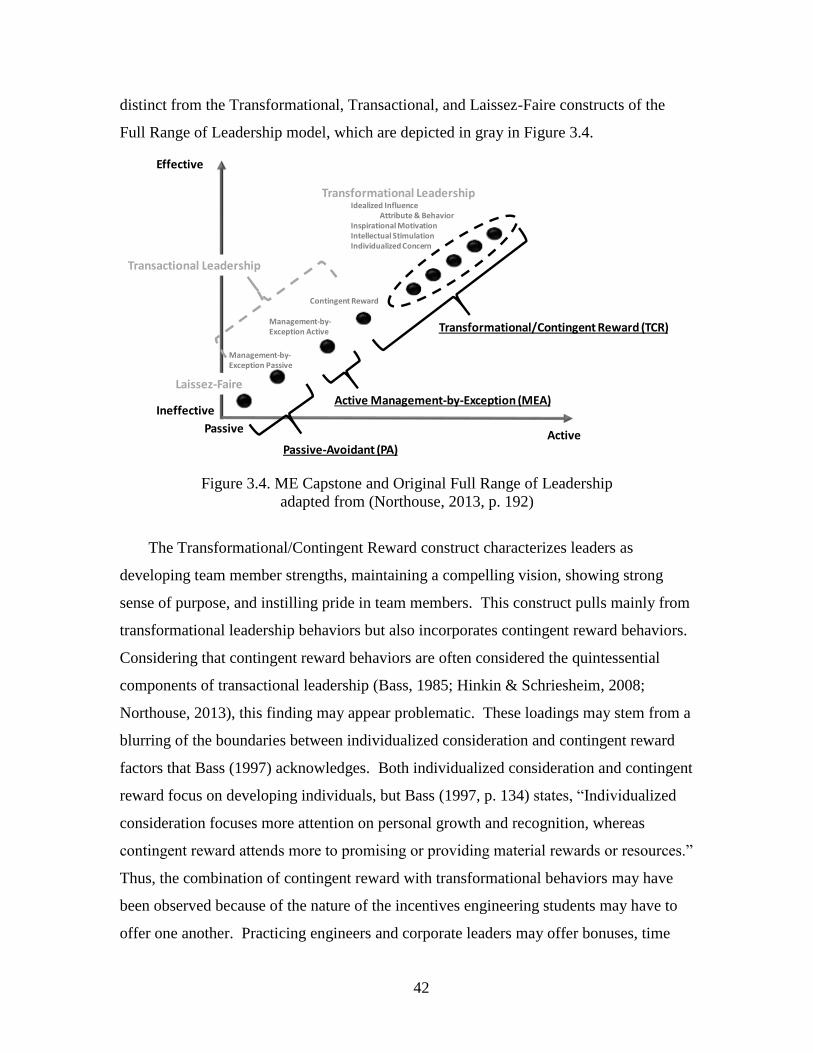
42
distinct from the Transformational, Transactional, and Laissez-Faire constructs of the
Full Range of Leadership model, which are depicted in gray in Figure 3.4.
Management-by-Exception Passive
PassiveActive
Effective
Ineffective
Laissez-Faire
Transformational LeadershipIdealized Influence
Attribute & BehaviorInspirational MotivationIntellectual StimulationIndividualized Concern
Transactional Leadership
Transformational/Contingent Reward (TCR)
Passive-Avoidant (PA)
Active Management-by-Exception (MEA)
Contingent Reward
Management-by-Exception Active
Figure 3.4. ME Capstone and Original Full Range of Leadership
adapted from (Northouse, 2013, p. 192)
The Transformational/Contingent Reward construct characterizes leaders as
developing team member strengths, maintaining a compelling vision, showing strong
sense of purpose, and instilling pride in team members. This construct pulls mainly from
transformational leadership behaviors but also incorporates contingent reward behaviors.
Considering that contingent reward behaviors are often considered the quintessential
components of transactional leadership (Bass, 1985; Hinkin & Schriesheim, 2008;
Northouse, 2013), this finding may appear problematic. These loadings may stem from a
blurring of the boundaries between individualized consideration and contingent reward
factors that Bass (1997) acknowledges. Both individualized consideration and contingent
reward focus on developing individuals, but Bass (1997, p. 134) states, “Individualized
consideration focuses more attention on personal growth and recognition, whereas
contingent reward attends more to promising or providing material rewards or resources.”
Thus, the combination of contingent reward with transformational behaviors may have
been observed because of the nature of the incentives engineering students may have to
offer one another. Practicing engineers and corporate leaders may offer bonuses, time
43
off, additional resources, or promotions; in contrast, students may be more apt to offer
incentives that are transformational in nature, such as positive reinforcement for their
efforts or additional assistance with project tasks.
The Active Management by Exception construct characterizes leaders as those who
maintain a consistent focus on standards, as well as those who identify and track mistakes
among team members. As indicated by the name, this construct incorporates the
"management" aspect of leadership to ensure team members are “doing things right”
(Rost, 1993, p. 220) and is typified by negative reinforcement by a leader when
something goes wrong. These types of behaviors can induce effort from a teammate to
comply with team standards, preventing negative consequences for failure (Bass, 1985).
In their re-examination of the MLQ, Avolio et al. (1999) described a leader who practices
active management by exception as someone who “focuses on monitoring task execution
for any problems that might arise and correcting those problems to maintain current
performance levels” (p. 445). Management by exception may be particularly important
in an engineering design context where a lack of adherence to engineering principles and
design standards can have catastrophic effects. The isolation of this construct separately
from TCR and PA behaviors may stem from common challenges in maintaining
standards for team-based engineering projects. Deficiencies in work load balance
(Borrego, Karlin, McNair, & Beddoes, 2013; Paretti, Pembridge, Brozina, Lutz, &
Phanthanousy, 2013) and student capability (Paretti et al., 2013) are recurring challenges
for student team-based engineering projects. The negative reinforcement characterized
by this leadership construct may be necessary for students to overcome these pervasive
challenges during their teaming experiences to meet standards of performance and
engineering design rigor required for successful prototype functioning.
The Passive-Avoidant construct characterizes leaders by either a delay in action until
serious issues arise or a total absence of involvement, especially when needed. This
construct combines the laissez-faire and passive management by exception factors of the
Full Range of Leadership model. These leadership behaviors are consistently ineffective
but may be necessary in some situations, like when managing large teams (Antonakis &
House, 2013), as the leader may not have the capacity to attend to all facets of the team.
There are several potential reasons for students to exhibit these types of leadership
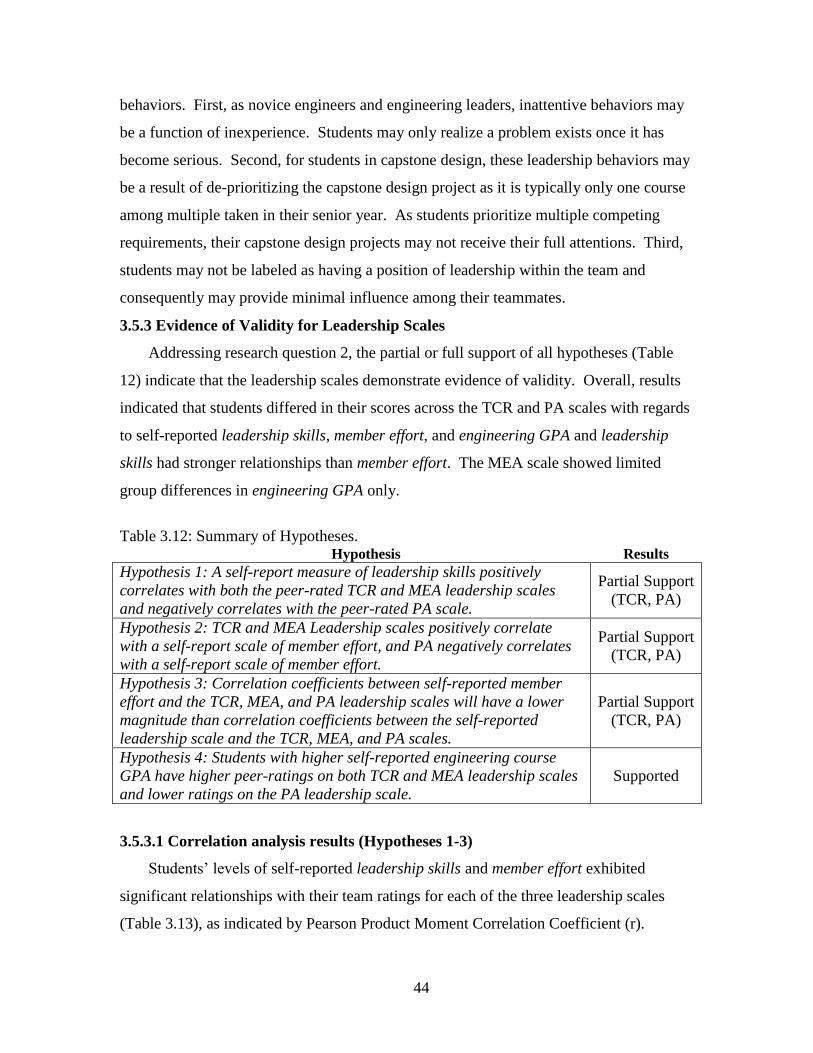
44
behaviors. First, as novice engineers and engineering leaders, inattentive behaviors may
be a function of inexperience. Students may only realize a problem exists once it has
become serious. Second, for students in capstone design, these leadership behaviors may
be a result of de-prioritizing the capstone design project as it is typically only one course
among multiple taken in their senior year. As students prioritize multiple competing
requirements, their capstone design projects may not receive their full attentions. Third,
students may not be labeled as having a position of leadership within the team and
consequently may provide minimal influence among their teammates.
3.5.3 Evidence of Validity for Leadership Scales
Addressing research question 2, the partial or full support of all hypotheses (Table
12) indicate that the leadership scales demonstrate evidence of validity. Overall, results
indicated that students differed in their scores across the TCR and PA scales with regards
to self-reported leadership skills, member effort, and engineering GPA and leadership
skills had stronger relationships than member effort. The MEA scale showed limited
group differences in engineering GPA only.
Table 3.12: Summary of Hypotheses. Hypothesis Results
Hypothesis 1: A self-report measure of leadership skills positively
correlates with both the peer-rated TCR and MEA leadership scales
and negatively correlates with the peer-rated PA scale.
Partial Support
(TCR, PA)
Hypothesis 2: TCR and MEA Leadership scales positively correlate
with a self-report scale of member effort, and PA negatively correlates
with a self-report scale of member effort.
Partial Support
(TCR, PA)
Hypothesis 3: Correlation coefficients between self-reported member
effort and the TCR, MEA, and PA leadership scales will have a lower
magnitude than correlation coefficients between the self-reported
leadership scale and the TCR, MEA, and PA scales.
Partial Support
(TCR, PA)
Hypothesis 4: Students with higher self-reported engineering course
GPA have higher peer-ratings on both TCR and MEA leadership scales
and lower ratings on the PA leadership scale.
Supported
3.5.3.1 Correlation analysis results (Hypotheses 1-3)
Students’ levels of self-reported leadership skills and member effort exhibited
significant relationships with their team ratings for each of the three leadership scales
(Table 3.13), as indicated by Pearson Product Moment Correlation Coefficient (r).
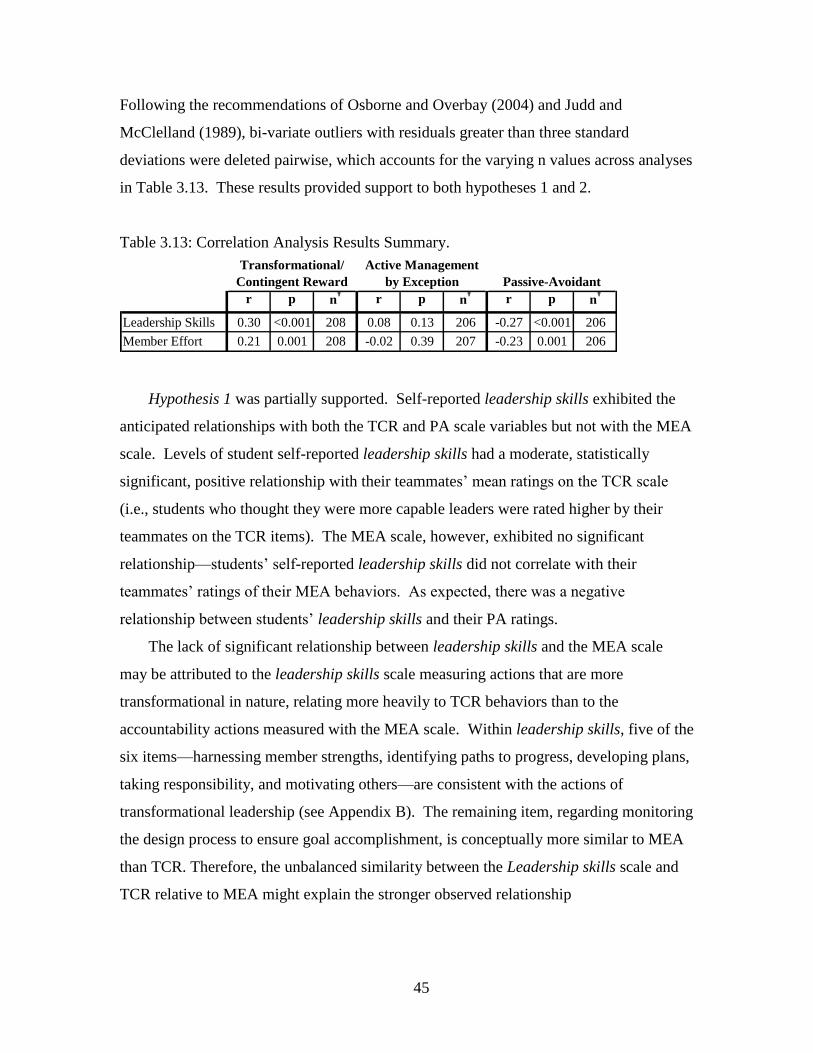
45
Following the recommendations of Osborne and Overbay (2004) and Judd and
McClelland (1989), bi-variate outliers with residuals greater than three standard
deviations were deleted pairwise, which accounts for the varying n values across analyses
in Table 3.13. These results provided support to both hypotheses 1 and 2.
Table 3.13: Correlation Analysis Results Summary.
r p n†
r p n†
r p n†
Leadership Skills 0.30 <0.001 208 0.08 0.13 206 -0.27 <0.001 206
Member Effort 0.21 0.001 208 -0.02 0.39 207 -0.23 0.001 206
Passive-Avoidant
Transformational/
Contingent Reward
Active Management
by Exception
Hypothesis 1 was partially supported. Self-reported leadership skills exhibited the
anticipated relationships with both the TCR and PA scale variables but not with the MEA
scale. Levels of student self-reported leadership skills had a moderate, statistically
significant, positive relationship with their teammates’ mean ratings on the TCR scale
(i.e., students who thought they were more capable leaders were rated higher by their
teammates on the TCR items). The MEA scale, however, exhibited no significant
relationship—students’ self-reported leadership skills did not correlate with their
teammates’ ratings of their MEA behaviors. As expected, there was a negative
relationship between students’ leadership skills and their PA ratings.
The lack of significant relationship between leadership skills and the MEA scale
may be attributed to the leadership skills scale measuring actions that are more
transformational in nature, relating more heavily to TCR behaviors than to the
accountability actions measured with the MEA scale. Within leadership skills, five of the
six items—harnessing member strengths, identifying paths to progress, developing plans,
taking responsibility, and motivating others—are consistent with the actions of
transformational leadership (see Appendix B). The remaining item, regarding monitoring
the design process to ensure goal accomplishment, is conceptually more similar to MEA
than TCR. Therefore, the unbalanced similarity between the Leadership skills scale and
TCR relative to MEA might explain the stronger observed relationship
46
Hypothesis 2 was partially supported. Member effort also exhibited the anticipated
relationships with the TCR and PA scale variables but not with the MEA scale. Self-
reported member effort had a weak, statistically significant, positive relationship with
their teammates’ mean ratings of them on the TCR scale (i.e., students who thought they
were putting forth more effort on the project were rated higher by their teammates on the
TCR items). As expected, there was also a negative relationship between students’ self-
reported member effort and their PA ratings.
The MEA scale did not exhibit a significant relationship with the member effort
scale; perhaps the varying degrees of effort required to actively manage the work of team
members plays a role in this lack of relationships. One potential explanation for this
finding may be that the negative reinforcement and criticisms associated with MEA may
take varying degrees of effort for engineers to enact. For blatant displays of failures to
achieve standards, such as absence or inattentiveness at team meetings and working
session, observation and criticism requires relatively low effort. Conversely, for complex
design problems, requiring precise application and interpretation of engineering
principles, observing and correcting these types of errors may require thorough, rigorous
examination, a marked increase in associated leader effort. Because the effort required to
maintain accountability of team member actions may vary widely, this increased variance
may explain the lack of correlation between the MEA scale and member effort. The lack
of significant relationship between effort and MEA is an area of further study to
determine how and why students actively manage other team members.
Hypothesis 3 was fully supported. Across all three leadership scale variables,
correlation coefficients for member effort were lower than for leadership skills. The TCR
scale had an r=0.30 correlation with leadership skills but only an r=0.21 correlation with
member effort. The MEA scale had an r=0.08 correlation with leadership skills but only
an r=-0.02 correlation with member effort. The PA scale had an r=-0.27 correlation with
leadership skills but only an r=-0.23 correlation with member effort. Multiple regression
analyses corroborated the stronger relationship between leadership skills and the
leadership scale variables (Table 3.14). When leadership skills and member effort were
considered together in multiple regression models, the relationship between leadership
skills and both TCR and PA scales remained significant, but member effort was not.
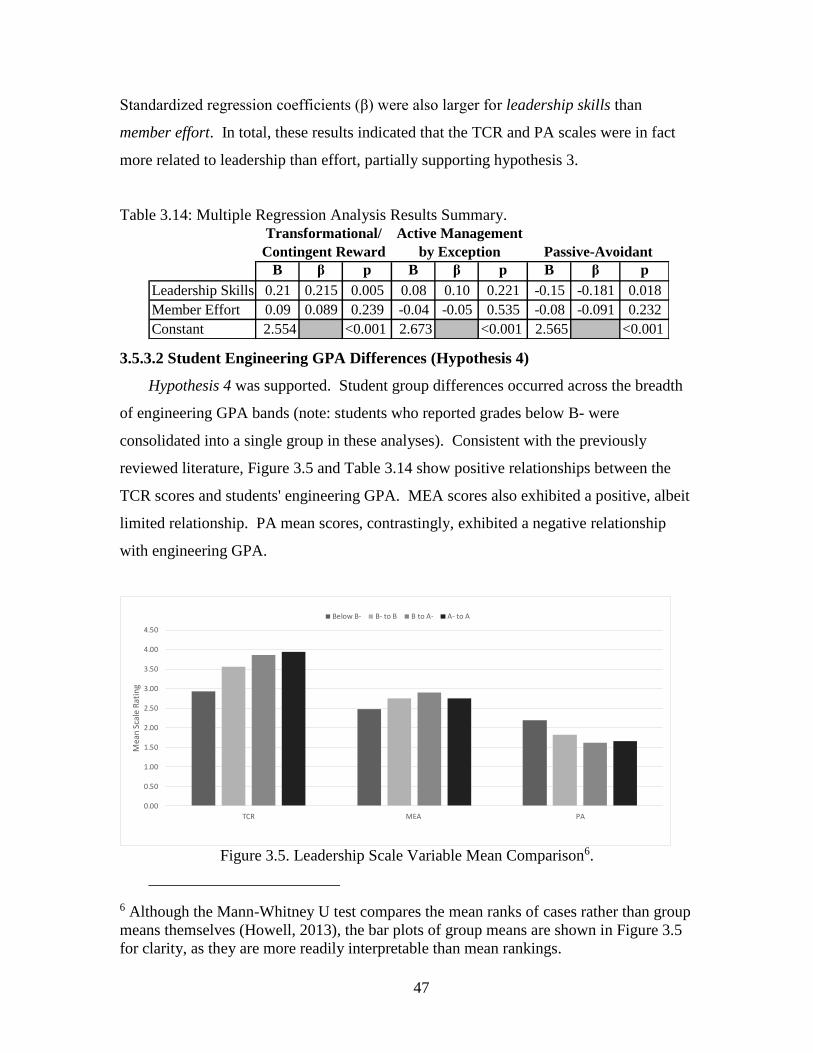
47
Standardized regression coefficients (β) were also larger for leadership skills than
member effort. In total, these results indicated that the TCR and PA scales were in fact
more related to leadership than effort, partially supporting hypothesis 3.
Table 3.14: Multiple Regression Analysis Results Summary.
B β p B β p B β p
Leadership Skills 0.21 0.215 0.005 0.08 0.10 0.221 -0.15 -0.181 0.018
Member Effort 0.09 0.089 0.239 -0.04 -0.05 0.535 -0.08 -0.091 0.232
Constant 2.554 <0.001 2.673 <0.001 2.565 <0.001
Transformational/
Contingent Reward
Active Management
by Exception Passive-Avoidant
3.5.3.2 Student Engineering GPA Differences (Hypothesis 4)
Hypothesis 4 was supported. Student group differences occurred across the breadth
of engineering GPA bands (note: students who reported grades below B- were
consolidated into a single group in these analyses). Consistent with the previously
reviewed literature, Figure 3.5 and Table 3.14 show positive relationships between the
TCR scores and students' engineering GPA. MEA scores also exhibited a positive, albeit
limited relationship. PA mean scores, contrastingly, exhibited a negative relationship
with engineering GPA.
0.00
0.50
1.00
1.50
2.00
2.50
3.00
3.50
4.00
4.50
TCR MEA PA
Mea
n S
cale
Rat
ing
Below B- B- to B B to A- A- to A
Figure 3.5. Leadership Scale Variable Mean Comparison6.
6 Although the Mann-Whitney U test compares the mean ranks of cases rather than group
means themselves (Howell, 2013), the bar plots of group means are shown in Figure 3.5
for clarity, as they are more readily interpretable than mean rankings.
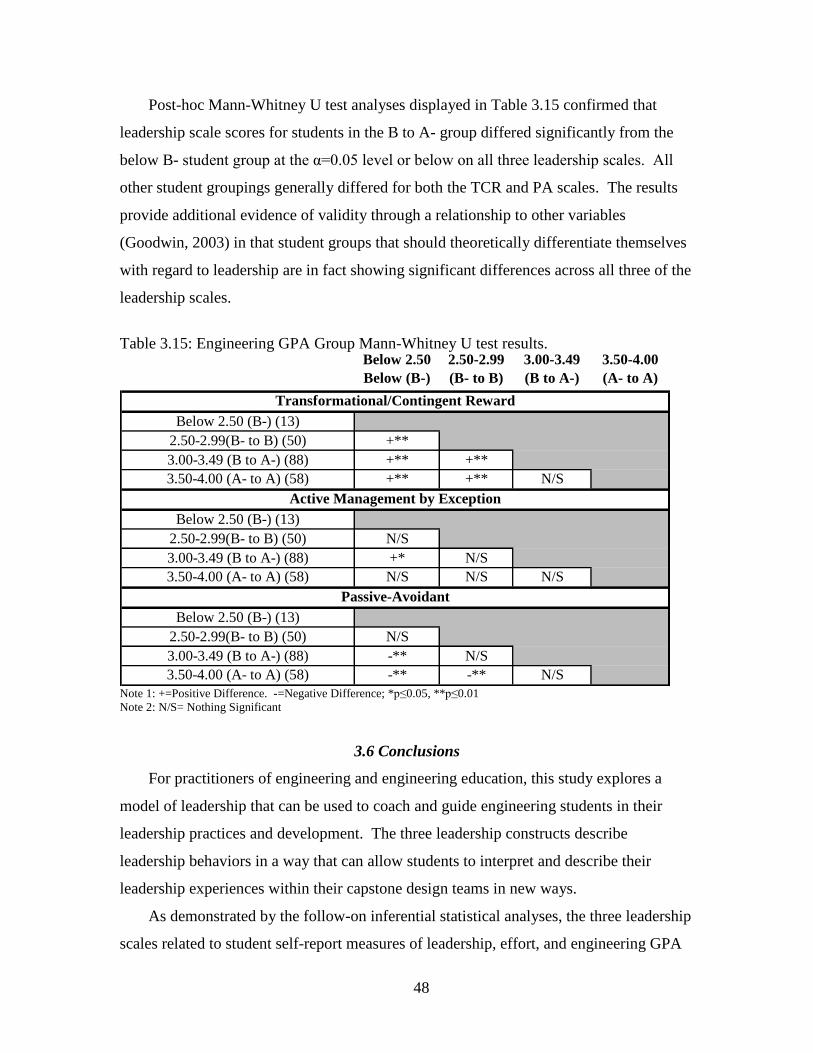
48
Post-hoc Mann-Whitney U test analyses displayed in Table 3.15 confirmed that
leadership scale scores for students in the B to A- group differed significantly from the
below B- student group at the α=0.05 level or below on all three leadership scales. All
other student groupings generally differed for both the TCR and PA scales. The results
provide additional evidence of validity through a relationship to other variables
(Goodwin, 2003) in that student groups that should theoretically differentiate themselves
with regard to leadership are in fact showing significant differences across all three of the
leadership scales.
Table 3.15: Engineering GPA Group Mann-Whitney U test results. Below 2.50
Below (B-)
2.50-2.99
(B- to B)
3.00-3.49
(B to A-)
3.50-4.00
(A- to A)
Below 2.50 (B-) (13)
2.50-2.99(B- to B) (50) +**
3.00-3.49 (B to A-) (88) +** +**
3.50-4.00 (A- to A) (58) +** +** N/S
Below 2.50 (B-) (13)
2.50-2.99(B- to B) (50) N/S
3.00-3.49 (B to A-) (88) +* N/S
3.50-4.00 (A- to A) (58) N/S N/S N/S
Below 2.50 (B-) (13)
2.50-2.99(B- to B) (50) N/S
3.00-3.49 (B to A-) (88) -** N/S
3.50-4.00 (A- to A) (58) -** -** N/S
Passive-Avoidant
Active Management by Exception
Transformational/Contingent Reward
Note 1: +=Positive Difference. -=Negative Difference; *p≤0.05, **p≤0.01
Note 2: N/S= Nothing Significant
3.6 Conclusions
For practitioners of engineering and engineering education, this study explores a
model of leadership that can be used to coach and guide engineering students in their
leadership practices and development. The three leadership constructs describe
leadership behaviors in a way that can allow students to interpret and describe their
leadership experiences within their capstone design teams in new ways.
As demonstrated by the follow-on inferential statistical analyses, the three leadership
scales related to student self-report measures of leadership, effort, and engineering GPA
49
differentially. These differences corroborate the fact that these scales are each measuring
different facets of the leadership phenomenon. Although the factors that comprise the
full range of leadership model were not fully measured in this study, the three higher
order leadership scales that were confirmed in this study demonstrated evidence of
validity in ways consistent with interpretations of the Full Range of Leadership model.
As a result, this study indicates that the wide body of literature surrounding the Full
Range of Leadership model may provide insights for engineers looking to apply or teach
effective leadership concepts for engineering practice.
The TCR, MEA, and PA leadership constructs investigated in this study can provide
a method for engineering students to better understand relevant facets of leadership
within the design team context. Illuminating these three separate forms of leadership
behaviors for engineering students and young engineers may make the often nebulous
idea of leadership more concrete and nuanced towards their personal experiences in the
capstone design space. Being able to relate these constructs to their engineering
experiences, students may gain a basic level of leadership knowledge that can then be
applied and reflected upon increasingly throughout their careers, as the National
Academy of Engineering (2004) aspires.
3.7 Future Work
Although this research provides indications of what forms of leadership exist in
engineering student design teams, the effectiveness of the different forms of leadership
was beyond the scope of this study. Further investigation is warranted to determine how
these forms of leadership and combinations thereof may contribute to enhanced learning
for the engineering students and overall design team effectiveness. Although the Bass
(1985) and Northouse (2013) descriptions of the Full Range of Leadership model may
support transformational/contingent reward building upon active management by
exception to produce team performance beyond expectations, empirical evidence is not
currently available to support these assertions within the engineering design team context.
Further study that relates leader behaviors across the three leadership forms to measures
of student learning and team success would provide empirical support for more and less
effective models of team leadership and is an area on on-going research for the authors.
Further investigation could also examine the longitudinal development of each leadership
50
form during a team’s life cycle to determine if an optimal progression of development
exists.
This specific research informs a larger study of shared leadership within the capstone
design teams. The round-robin data collection technique used in this study allows for a
network analysis of the student leadership ratings, which can be used to quantify the
degree to which leadership across the three leadership scales is shared among the students
and faculty advisor within each team as explained by (Mayo et al., 2003). Assessing
shared leadership within the teams will further contextualize leadership practice in an
engineering design setting to better align leadership practice to the collaborative
environment experienced by engineers. An examination of how and to what degree
teams combine and share leadership across the three constructs may allow for the
classification and description of teams based on the forms of leadership that they enact.
These classifications and descriptions may provide faculty and engineering professionals
an additional set of tools with which to describe and understand teamwork, team
leadership, and leadership practices related to student design team success.
The general lack of relationships between the MEA leadership scale and other
variables indicates that students' MEA behaviors may be related to other variables not
incorporated into this study. Qualitative study of student teams exploring how and why
students, faculty, and external clients hold team members accountable for work within
capstone design projects may provide greater insight on how MEA behaviors are
operationalized within the capstone design team experience.
This research is also focused exclusively on the mechanical engineering capstone
design context. Although this study provides critical insights into how students enact
leadership in a key developmental experience prior to professional engineering practice,
the study’s focus on the mechanical engineering capstone design context prevents
generalization across engineering disciplines and breadth of the undergraduate
engineering experience. Further study is warranted within other engineering disciplines
and across developmental stages from the first year to professional practice to address the
applicability of this leadership model to the larger practice of engineering.
51
Chapter 4:
Manuscript 2: Shared Leadership in Engineering Teams: A social network analysis
of mechanical engineering capstone design teams.
4.1 Abstract
Background
Multiple national-level reports have indicated the need for engineers to take more
prominent leadership roles to better-inform complex policy decisions. Engineering
faculty are tasked to develop a basic level of leadership knowledge within undergraduate
engineering students that can then be applied increasingly throughout their careers.
Recent engineering leadership literature, however suggests that an adequate model of
how engineers lead does not exist and that engineers find the traditional, vertical
conceptualizations incompatible with the collaborative nature of engineering practice.
Several studies indicate that a shared leadership model may be more appropriate than the
historically vertical leadership conceptualization for knowledge work similar to that
found in student design teams.
Purpose/Hypothesis
This study examines the extent to which the Full Range of Leadership is shared within
undergraduate, senior-level engineering capstone design teams and classify teams based
on their level of leadership sharedness.
Design/Methods
This quantitative study examines round-robin (360-degree) student leadership ratings
gathered from mechanical engineering capstone design team students using a 14-item
subset of the Multifactor Leadership Questionnaire. Shared leadership is measured using
social network analysis and operationalized as a combination of network decentralization
and density across the three forms of leadership related to the Full Range of Leadership
model. Cluster analyses of decentralization and density measures groups the design
teams into a shared leadership classification system.
Results
Results suggest that leadership, on average, is more shared than centralized within
capstone design teams. The amount of leadership varies across the three forms
examined, in alignment with previous studies of the Full Range of Leadership model for
student teams in other contexts. Classification results show that measures of shared
leadership create dichotomous groupings of teams, facilitating a quadrant classification of
shared leadership.
52
Conclusions
This study corroborates previous engineering teamwork research that encourages the
conceptualization of leadership as shared within engineering student design teams. To
allow students and practicing engineers to relate their design work experiences to
concepts of leadership, shared leadership models may be more consistent than historical,
vertical models. The results develop a taxonomy of how engineers lead within their
design teams accounting for forms of leadership and levels of leadership sharing.
Key Words
Shared Leadership, Engineering Leadership, Mechanical Engineering Design, Full Range
of Leadership model, Social Network Analysis
4.2 Introduction
For more than a decade, reports from industry and the federal government have
called for the preparation of engineering students for leadership roles (e.g., ASME Center
for Education, 2011; National Academy of Engineering, 2004, 2005), but this call has
been largely unanswered (ASME Center for Education, 2011). For example, in
comprehensive reviews of current engineering leadership education programs, Graham,
Crawley, and Mendelsohn (2009) find these programs lacking a systematic approach to
targeting ‘leadership’ as a specific outcome in engineering education. Outside the
classroom, in 2014, only six of the 541 members of the U.S. Congress have had former
employment as an engineer (Manning, 2014), and only 11 members hold some form of an
engineering degree (Glanville, 2013). One potential barrier toward preparing engineering
students as leaders may be vertical views of leadership that have dominated the literature
historically (Jackson & Parry, 2011; Markham, 2012; Pearce & Conger, 2003b) and
remain present in engineering practice (Rottmann et al., 2014). Rottmann et al. (2014)
indicate that those traditional, top-down leadership perceptions lead to an aversion of
leadership for some engineers and are inconsistent with the collaborative, team-based
norms of engineering practice.
A gap in engineering related leadership literature may partially explain engineers’
aversion to leadership. Recent literature suggests that an adequate model for how
engineers lead in a team-based engineering context does not exist (e.g., Paul & Cowe
Falls, 2015; Reeve et al., 2015; Rottmann et al., 2014). Engineering educators and
53
practicing engineers currently cannot reference a leadership model that has been
rigorously examined in an engineering team-based context, which may make leadership
concepts unapproachable for engineers. Knight and Novoselich (2014) described a
disconnect in leadership emphasis between the engineering classroom and industry
practice, and Rottmann et al. (2014) found that some practicing engineers are
uncomfortable with leadership concepts. Paretti et al. (2013) also describe how faculty
may feel ill-equipped to intervene in teaming dynamics issues such as team conflict and
workload imbalances, of which leadership scholars assert leadership can play an integral
part in preventing or alleviating (e.g., Hill, 2013). Leadership models that better relate
leadership to the collaborative, team-based norms of engineering practice may help
bridge these engineering-leadership disconnects.
This study investigates leadership from the perspective of such collaborative, team-
based environments that engineers routinely experience. Leadership scholars indicate
that shared leadership, characterized by the serial emergence of official as well as
unofficial leaders, may be a more effective model than a vertical, individualistic approach
(Feister et al., 2014; Pearce, 2004; Pearce & Conger, 2003b), especially for the creative,
complex, and interdependent knowledge work like that of an engineering student design
team setting. For such settings, which provide engineering students formative leadership
experiences prior to professional practice, studies by Zafft et al. (2009) and Feister et al.
(2014) indicate that leadership may be more shared than vertical among student team
members, and both studies advocate for further exploration of shared leadership within
student design teams.
The purpose of this study is to examine the degree to which leadership is shared
within design teams. By empirically developing a shared leadership model within the
engineering student design team context, this research may provide engineering faculty a
conceptualization of leadership that better coincides with the collaborative norms of
engineering practice. Specifically, the study addresses the following research questions:
RQ1. To what degree is leadership shared within undergraduate mechanical
engineering-centric capstone design teams?
RQ2. To what degree does the level of shared leadership classify
undergraduate mechanical engineering-centric capstone design teams?
54
4.3 Review of the Literature
4.3.1 Leadership Model
The Full Range of Leadership model informs this study’s investigation of shared
leadership. Previous literature has articulated the applicability of the Full Range of
Leadership model for engineering contexts (e.g., Breaux, 2006; Novoselich & Knight,
2015), and links between the theory and leadership orientations within engineering
professional practice have been proposed (e.g., Rottmann et al., 2014). Avolio et al.
(2003) made an early attempt to assess shared leadership in a variety of non-engineering
teams using the Full Range of Leadership model. Following the proposed research
design of Mayo et al. (2003), more current work by Novoselich and Knight (Chapter 3)
established the validity of an adapted version of the Full Range of Leadership model for
shared leadership analysis within the mechanical engineering capstone design team
context, which is incorporated into this study. This leadership model has been in
existence for over two decades (see Bass & Avolio, 1994) and is operationalized with the
well-established Multifactor Leadership Questionnaire (MLQ) (Bass & Avolio, 2013).
The Full Range of Leadership model aggregates a series of nine types of leader
actions into three forms of leadership to explain how leaders can help their organizations
or teams perform beyond expectations (Antonakis et al., 2003; Northouse, 2013; Wang et
al., 2011). It describes how organizations can exceed expectations by augmenting a base
of transactional leadership behaviors with transformational behaviors (Bass, 1985).
Transactional leadership refers to the exchange of valued outcomes between leaders and
followers, and transformational leadership is the set of behaviors that unite followers and
changes their goals and beliefs (Kuhnert & Lewis, 1987). A third form of leadership,
laissez-faire, describes absentee leadership behaviors and most often contributes to low
organizational performance (Antonakis & House, 2013). Leaders enact all three forms of
leadership to varying degrees.
Within the capstone design team context, recent work indicates that similar
leadership scales occur in capstone design teams, consistent with other team-level
examination of the Full Range of Leadership model. Using factor analysis in an
inaugural examination of the model for capstone design teams, Novoselich and Knight
(2015, Chapter 3) identified conceptually similar combinations of the nine leadership
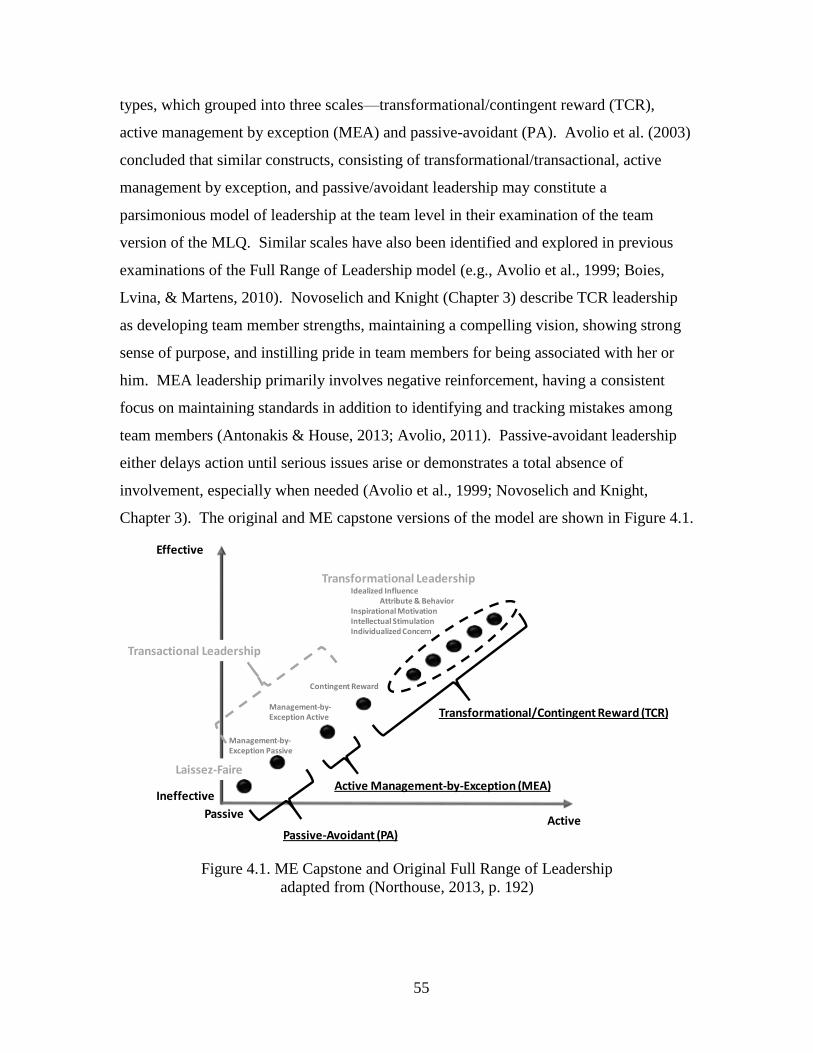
55
types, which grouped into three scales—transformational/contingent reward (TCR),
active management by exception (MEA) and passive-avoidant (PA). Avolio et al. (2003)
concluded that similar constructs, consisting of transformational/transactional, active
management by exception, and passive/avoidant leadership may constitute a
parsimonious model of leadership at the team level in their examination of the team
version of the MLQ. Similar scales have also been identified and explored in previous
examinations of the Full Range of Leadership model (e.g., Avolio et al., 1999; Boies,
Lvina, & Martens, 2010). Novoselich and Knight (Chapter 3) describe TCR leadership
as developing team member strengths, maintaining a compelling vision, showing strong
sense of purpose, and instilling pride in team members for being associated with her or
him. MEA leadership primarily involves negative reinforcement, having a consistent
focus on maintaining standards in addition to identifying and tracking mistakes among
team members (Antonakis & House, 2013; Avolio, 2011). Passive-avoidant leadership
either delays action until serious issues arise or demonstrates a total absence of
involvement, especially when needed (Avolio et al., 1999; Novoselich and Knight,
Chapter 3). The original and ME capstone versions of the model are shown in Figure 4.1.
Management-by-Exception Passive
PassiveActive
Effective
Ineffective
Laissez-Faire
Transformational LeadershipIdealized Influence
Attribute & BehaviorInspirational MotivationIntellectual StimulationIndividualized Concern
Transactional Leadership
Transformational/Contingent Reward (TCR)
Passive-Avoidant (PA)
Active Management-by-Exception (MEA)
Contingent Reward
Management-by-Exception Active
Figure 4.1. ME Capstone and Original Full Range of Leadership
adapted from (Northouse, 2013, p. 192)
56
The Full Range of leadership model has demonstrated applicability for shared
leadership research in addition to its vertical leadership roots. First developed by Burns
(1978) and expanded by Bass (1985) as a vertical leadership model, more recent work
has examined the model in a shared context. Avolio et al. (1996; 2003) examined the
Full Range of Leadership performed collectively by teams, using the team as the referent,
rather than an individual leader (Avolio, 2011). Although conducted in contexts other
than engineering student design teams, these results provide preliminary evidence that the
Full Range of Leadership model is applicable across a wide spectrum from a wholly
individual phenomenon related to one leader to a collective phenomenon associated with
an entire group. These studies demonstrate the potential for the Full Range of Leadership
model to be applicable to a shared leadership context.
4.3.2 Shared Leadership
The shared leadership paradigm has emerged as a new conceptualization of
leadership that promotes the active influence of multiple individuals toward goal
accomplishment (Hoch, 2014; Mathieu, D’Innocenzo, Kukenberger, & Reilly, 2015;
Pearce & Conger, 2003b). Whereas many leadership theories look at the traits or
behaviors of leaders themselves (Derue, Nahrgang, Wellman, & Humphrey, 2011), the
shared leadership paradigm focuses on how many individuals enact leadership within an
organization or team (Hoch, 2014; Mathieu, D’Innocenzo, et al., 2015). Pearce (2004)
has described shared leadership as, “a simultaneous, ongoing, mutual influence process
within a team that is characterized by ‘serial emergence’ of official as well as unofficial
leaders” (p. 48) within an organization. In this paradigm, leaders emerge from the group
based on their knowledge, skills, or abilities to lead the team through tasks or challenges
and then pass the mantle of leadership to others as the team’s situation evolves. At its
core, the concept revolves around previous conceptualizations of followers and their
empowerment (Pearce & Conger, 2003b). For example, situational leadership theory
prescribes that at the follower’s final stage of development, the leader should adopt a
delegating approach which involves low supportive and low directive behavior, enabling
the follower to perform semi-autonomously in the accomplishment of their tasks
(Blanchard, Oncken, & Burrows, 2000). The shared leadership paradigm furthers the
boundaries of these semi-autonomous actions to include active influence of the
57
organization toward goal accomplishment. Fletcher and Kaufer (2003, p. 24) describe
the modern requirement for vertical leaders to differentiate themselves from the group
while simultaneously interacting as an integral part of the group as a “paradox of shared
leadership”(p. 24).
Shared leadership models may align leadership perceptions with current
conceptualizations of knowledge and collaboration in design teams. The shared
leadership paradigm’s development accounts for the situated nature of knowledge; in this
modern age of increased technology and rapid industrial pace, it is nearly impossible for
one person to have the necessary knowledge, skills, and abilities for all aspects of highly
intellectual work (Pearce, 2004) or necessary to make well informed leadership decisions
independently. This setting aligns with Newstetter’s (1998) description of student
learning environments in engineering design teams, as well as Salas et al.’s (2007)
integrative model of team effectiveness, which references team leaders (plural) not team
leader (singular) and describes how shared cognition affects leadership and vice-versa.
In light of this evolving knowledge distribution and new landscape of modern
collaboration, Wageman and Gardner (2012) called for a re-examination of team
leadership. These calls were echoed by Dorst (2008), who articulated the need to
examine the context in which design is practiced. Outside of engineering, Cox, Pearce,
and Perry (2003) similarly proposed a model of shared leadership to benefit new product
development team performance. Therefore, empirical evidence to support the existence
shared leadership in design teams may align the leadership phenomenon with other
distributed practices of their work together, making leadership more approachable to
design team members.
Studies indicate that shared leadership models may be better suited to the
undergraduate engineering student design team context than a vertical model; evidence
from other contexts corroborate the utility of a shared leadership model. A quantitative
study by Zafft et al. (2009) and qualitative work by Feister et al. (2014) provide
indications that students share leadership within their design team experiences. Using the
Competing Values Framework, Zafft et al. (2009) found that student design teams exhibit
a dispersion of different leadership profiles across the team and that increased dispersion
related positively to team performance in terms of course grades. This quantitative study

58
is corroborated by a qualitative study of engineering student team members, as Feister et
al. (2014) found that students describe leadership as emergent and fluid within their
teams despite having an appointed individual leader. In light of this literature, we propose
the following:
Hypothesis 1: Leadership is more shared than vertical for engineering student
design teams.
4.3.3 Classifying Leadership Sharedness in Teams
Operationalizing the Full Range of Leadership across a vertical to shared continuum
may pose challenges to the accessibility of leadership concepts for engineering educators.
Accounting for the Full Range of Leadership alone involves three distinct forms of
leadership behaviors (Avolio et al., 1999; Bass & Avolio, 2013), and accounting for the
sharing of each form adds yet another level of complexity. Developing a multi-layered
model of shared leadership may require a method of simplification and visualization to
make the concepts more approachable (Contractor, DeChurch, Carson, Carter, & Keegan,
2012).
Previous theoretical shared leadership literature provides a potential solution for
team leadership classification. Mayo et al. (2003) propose a leadership quadrant system
to differentiate teams based on their degree of shared or vertical leadership. In this
quadrant system, Mayo et al. (2003) account for both the distribution and amount of
leadership enacted by team members to classify teams into one of four categories: 1)
Shared Leadership, 2) Low Shared Leadership, 3) Vertical Leadership, or 4) Leadership
Avoidance (Figure 4.2).
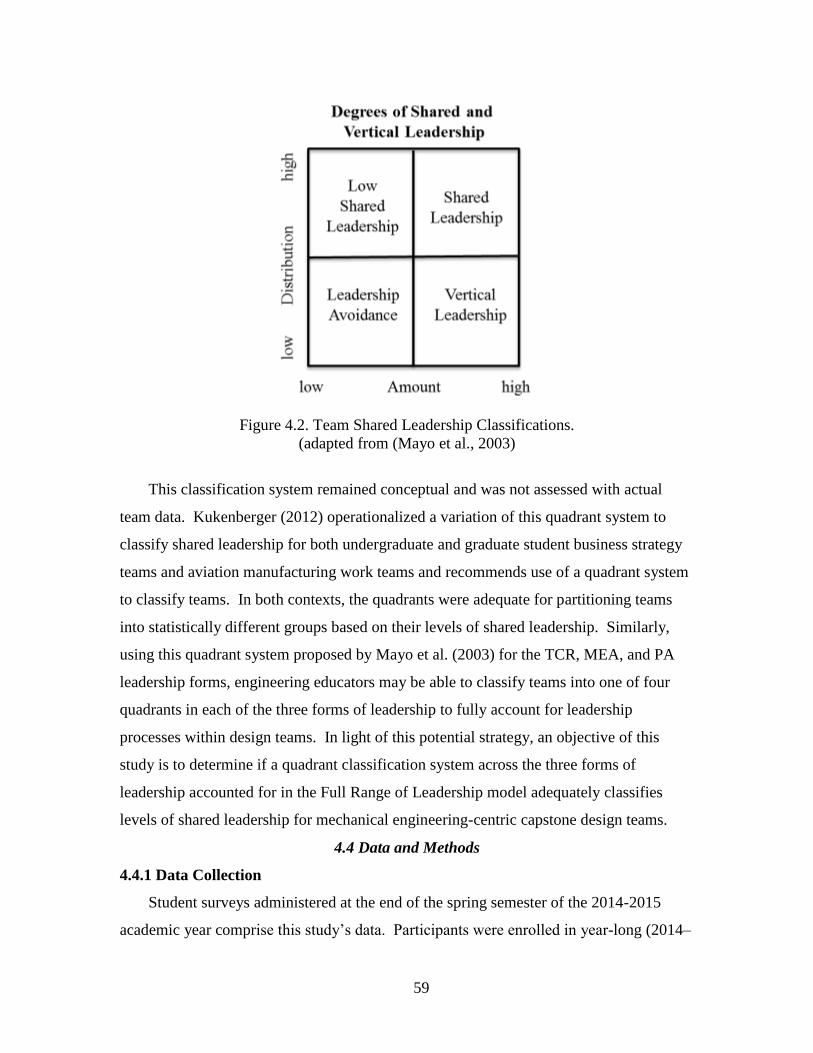
59
Figure 4.2. Team Shared Leadership Classifications.
(adapted from (Mayo et al., 2003)
This classification system remained conceptual and was not assessed with actual
team data. Kukenberger (2012) operationalized a variation of this quadrant system to
classify shared leadership for both undergraduate and graduate student business strategy
teams and aviation manufacturing work teams and recommends use of a quadrant system
to classify teams. In both contexts, the quadrants were adequate for partitioning teams
into statistically different groups based on their levels of shared leadership. Similarly,
using this quadrant system proposed by Mayo et al. (2003) for the TCR, MEA, and PA
leadership forms, engineering educators may be able to classify teams into one of four
quadrants in each of the three forms of leadership to fully account for leadership
processes within design teams. In light of this potential strategy, an objective of this
study is to determine if a quadrant classification system across the three forms of
leadership accounted for in the Full Range of Leadership model adequately classifies
levels of shared leadership for mechanical engineering-centric capstone design teams.
4.4 Data and Methods
4.4.1 Data Collection
Student surveys administered at the end of the spring semester of the 2014-2015
academic year comprise this study’s data. Participants were enrolled in year-long (2014–
60
2015), team-based, mechanical engineering-centric, senior level capstone design courses
at three institutions: a large, mid-Atlantic research university (site A) and two smaller
engineering-focused military institutions (sites B and C). These study sites were
purposefully chosen because of their historic leadership focus, ABET accredited
engineering programs, comparable capstone design experiences, and access to
participants. Qualitative comparison of course syllabi and team charter requirements
across the three institutions indicated similarity in the capstone design experience with
regard to course objectives, course content, project requirements, and team-based
pedagogy (see Chapter 2). The mixture of civilian and military institutions provides a
combination of a more traditional civilian undergraduate engineering experience at site A
and mandatory, 4-year leadership programs at sites B and C. Leadership training for
students at site A may include voluntary affiliation with purposeful leadership
development through the Corps of Cadets for some students (the Corps of Cadets
represents less than 5% of the ME students at site A) or various other voluntary
leadership training programs. Mechanical engineering was specifically chosen because
of the discipline’s professional interest in engineering leadership (see ASME Center for
Education, 2011), mechanical engineering’s prominence as the largest discipline for
bachelor’s degree attainment (Yoder, 2014), and alignment with the researcher’s career
interests. The study had IRB approval at all three institutions.
The survey was administered by the authors on-line using Qualtrics survey
development software at sites A and B. The office of institutional research at site C
administered the online survey through a different web host. At all three sites
participation in the survey was voluntary; students were recruited via a short introduction
to the research by the capstone course coordinators in-class. At site B, the survey was
attached to the course end's peer-review assignment but was identified as a separate
research survey and not a course requirement.
This study's sample included 209 students (Table 4.1) who comprised 45 complete
design teams; teams were only included if they exhibited a 100% response rate, which
was a requirement for social network analysis. These 209 cases represent 46.5% of the
total responses from the research sites. Site A had 118 participants (21 teams), site B had
58 participants (16 teams) and site C had 33 participants (8 teams). 10 of the 45 teams
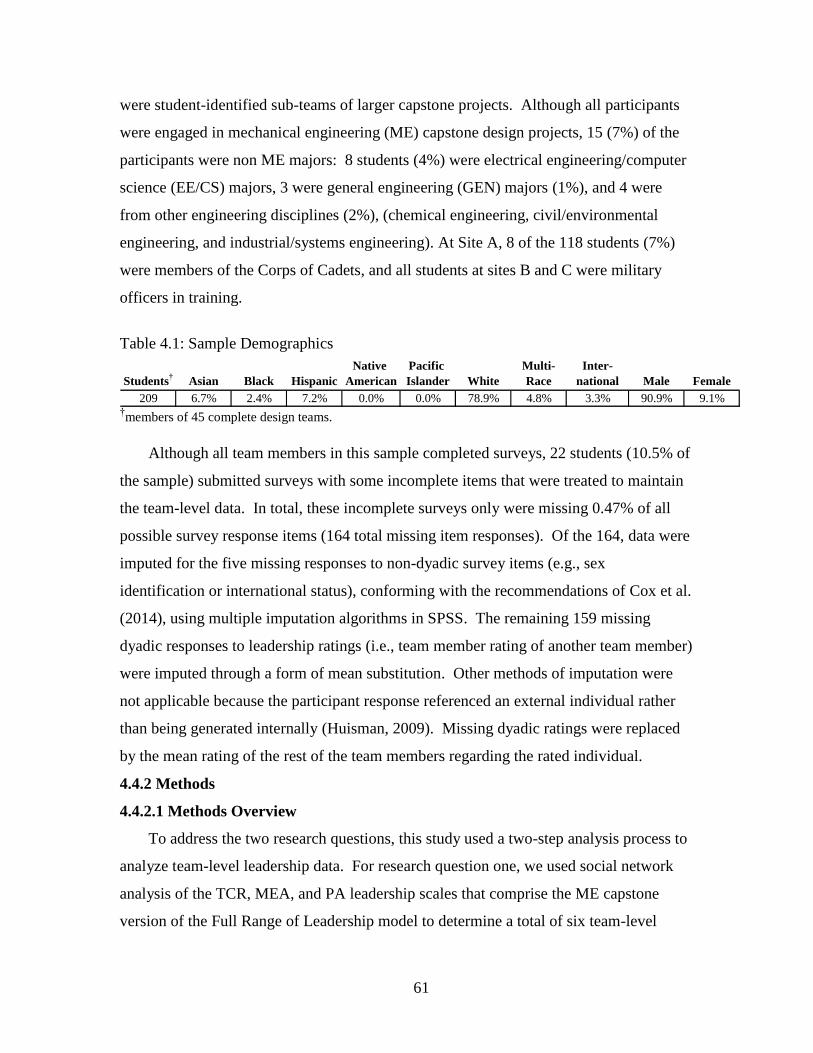
61
were student-identified sub-teams of larger capstone projects. Although all participants
were engaged in mechanical engineering (ME) capstone design projects, 15 (7%) of the
participants were non ME majors: 8 students (4%) were electrical engineering/computer
science (EE/CS) majors, 3 were general engineering (GEN) majors (1%), and 4 were
from other engineering disciplines (2%), (chemical engineering, civil/environmental
engineering, and industrial/systems engineering). At Site A, 8 of the 118 students (7%)
were members of the Corps of Cadets, and all students at sites B and C were military
officers in training.
Table 4.1: Sample Demographics
Students†
Asian Black Hispanic
Native
American
Pacific
Islander White
Multi-
Race
Inter-
national Male Female
209 6.7% 2.4% 7.2% 0.0% 0.0% 78.9% 4.8% 3.3% 90.9% 9.1%†members of 45 complete design teams.
Although all team members in this sample completed surveys, 22 students (10.5% of
the sample) submitted surveys with some incomplete items that were treated to maintain
the team-level data. In total, these incomplete surveys only were missing 0.47% of all
possible survey response items (164 total missing item responses). Of the 164, data were
imputed for the five missing responses to non-dyadic survey items (e.g., sex
identification or international status), conforming with the recommendations of Cox et al.
(2014), using multiple imputation algorithms in SPSS. The remaining 159 missing
dyadic responses to leadership ratings (i.e., team member rating of another team member)
were imputed through a form of mean substitution. Other methods of imputation were
not applicable because the participant response referenced an external individual rather
than being generated internally (Huisman, 2009). Missing dyadic ratings were replaced
by the mean rating of the rest of the team members regarding the rated individual.
4.4.2 Methods
4.4.2.1 Methods Overview
To address the two research questions, this study used a two-step analysis process to
analyze team-level leadership data. For research question one, we used social network
analysis of the TCR, MEA, and PA leadership scales that comprise the ME capstone
version of the Full Range of Leadership model to determine a total of six team-level
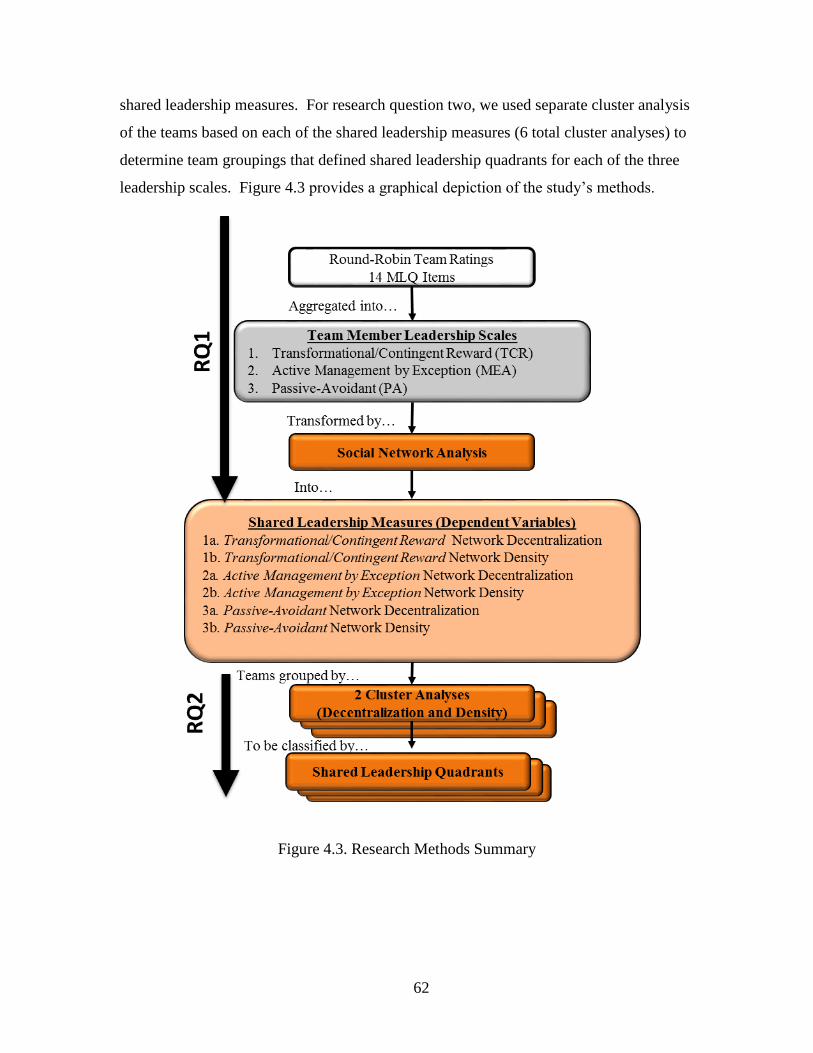
62
shared leadership measures. For research question two, we used separate cluster analysis
of the teams based on each of the shared leadership measures (6 total cluster analyses) to
determine team groupings that defined shared leadership quadrants for each of the three
leadership scales. Figure 4.3 provides a graphical depiction of the study’s methods.
Figure 4.3. Research Methods Summary
63
4.4.2.2 Shared Leadership (Research Question 1)
Various meta-analyses have shown that shared leadership in teams is theorized as
either 1) an aggregated, collective attribute existing across the team as a whole, or 2) a
more complex sharing structure that emanates from the ebb and flow of dyadic (member
to member) relationships across the team members (D'Innocenzo et al., 2014; Nicolaides
et al., 2014; Wang et al., 2014). The majority of current shared leadership studies
conceptualize shared leadership as the former—a team collective attribute (D'Innocenzo
et al., 2014)—and correspondingly measure shared leadership using a rate the team
approach (Gockel & Werth, 2010). By interpreting shared leadership as an aggregated
team attribute, team members rate the team through a survey using direct-consensus (i.e.,
agreement among the members) or referent-shift consensus, where the referent becomes
the team or the team members rather than the single external leader (D'Innocenzo et al.,
2014; Gockel & Werth, 2010; Nicolaides et al., 2014; Wang et al., 2014). This approach
to measuring shared leadership, however, fails to measure the distribution of leadership
directly, but rather measures an average level of leadership across all team members
(Gockel & Werth, 2010; Small & Rentsch, 2010). These types of studies are limited in
their ability to fully understand how leadership is shared among team members (Small &
Rentsch, 2010).
Thus, to operationalize shared leadership in this study, we used the latter
interpretation—leadership is considered to be a network of dyadic relationships, which is
often described as a rate the members approach (Gockel & Werth, 2010). In these types
of studies, researchers use social network analysis of individual team member round-
robin data (i.e., 360-degree data in which each member rates all other team members)
(D'Innocenzo et al., 2014; Gockel & Werth, 2010; Nicolaides et al., 2014; Wang et al.,
2014). Two measures of shared leadership are commonly used in this type of social
network analysis: 1) network centralization (i.e., variability of individual indices), and 2)
network density (i.e., proportion of influence relationships within the team compared to
the total possible) (Gockel & Werth, 2010; Mayo et al., 2003). Mayo et al. (2003)
proposed using this social network analysis approach across each scale of the Full Range
of Leadership model to operationalize shared leadership in teams, which guides the
design of this study.
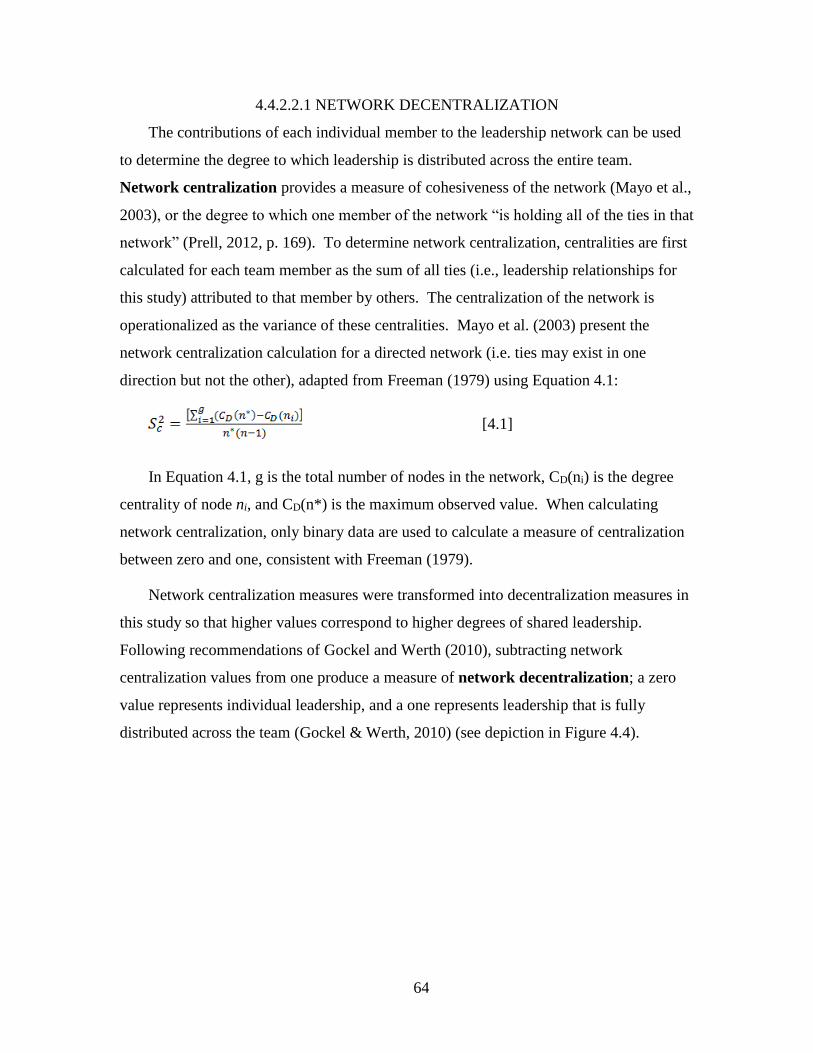
64
4.4.2.2.1 NETWORK DECENTRALIZATION
The contributions of each individual member to the leadership network can be used
to determine the degree to which leadership is distributed across the entire team.
Network centralization provides a measure of cohesiveness of the network (Mayo et al.,
2003), or the degree to which one member of the network “is holding all of the ties in that
network” (Prell, 2012, p. 169). To determine network centralization, centralities are first
calculated for each team member as the sum of all ties (i.e., leadership relationships for
this study) attributed to that member by others. The centralization of the network is
operationalized as the variance of these centralities. Mayo et al. (2003) present the
network centralization calculation for a directed network (i.e. ties may exist in one
direction but not the other), adapted from Freeman (1979) using Equation 4.1:
[4.1]
In Equation 4.1, g is the total number of nodes in the network, CD(ni) is the degree
centrality of node ni, and CD(n*) is the maximum observed value. When calculating
network centralization, only binary data are used to calculate a measure of centralization
between zero and one, consistent with Freeman (1979).
Network centralization measures were transformed into decentralization measures in
this study so that higher values correspond to higher degrees of shared leadership.
Following recommendations of Gockel and Werth (2010), subtracting network
centralization values from one produce a measure of network decentralization; a zero
value represents individual leadership, and a one represents leadership that is fully
distributed across the team (Gockel & Werth, 2010) (see depiction in Figure 4.4).
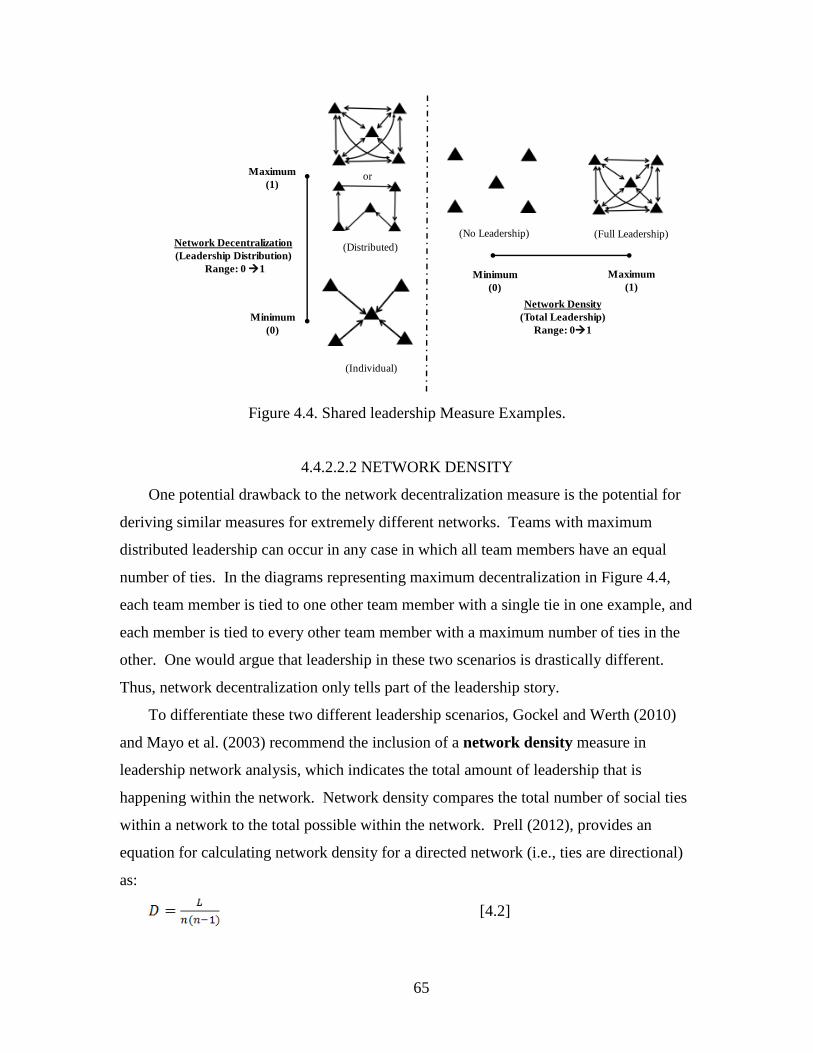
65
Network Decentralization
(Leadership Distribution)
Range: 0 1
Network Density
(Total Leadership)
Range: 01
Maximum
(1)
Minimum
(0)
(Individual)
(Distributed)
(No Leadership) (Full Leadership)
or
Minimum
(0)
Maximum
(1)
Figure 4.4. Shared leadership Measure Examples.
4.4.2.2.2 NETWORK DENSITY
One potential drawback to the network decentralization measure is the potential for
deriving similar measures for extremely different networks. Teams with maximum
distributed leadership can occur in any case in which all team members have an equal
number of ties. In the diagrams representing maximum decentralization in Figure 4.4,
each team member is tied to one other team member with a single tie in one example, and
each member is tied to every other team member with a maximum number of ties in the
other. One would argue that leadership in these two scenarios is drastically different.
Thus, network decentralization only tells part of the leadership story.
To differentiate these two different leadership scenarios, Gockel and Werth (2010)
and Mayo et al. (2003) recommend the inclusion of a network density measure in
leadership network analysis, which indicates the total amount of leadership that is
happening within the network. Network density compares the total number of social ties
within a network to the total possible within the network. Prell (2012), provides an
equation for calculating network density for a directed network (i.e., ties are directional)
as:
[4.2]
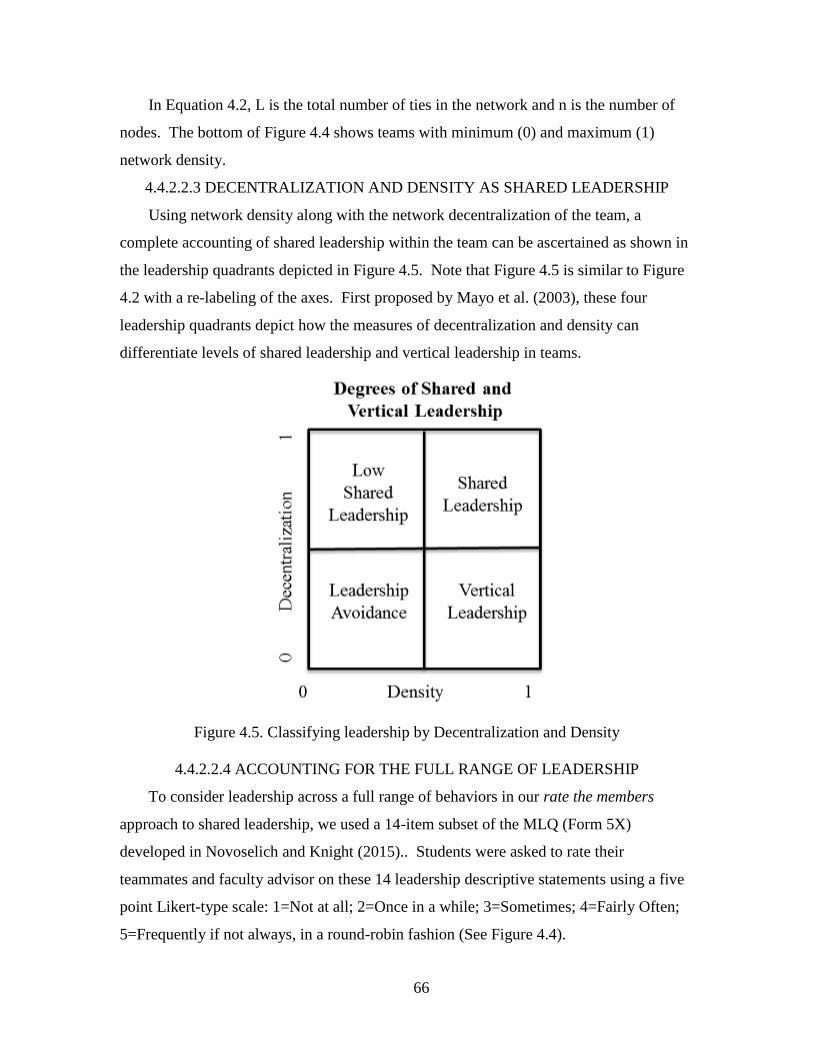
66
In Equation 4.2, L is the total number of ties in the network and n is the number of
nodes. The bottom of Figure 4.4 shows teams with minimum (0) and maximum (1)
network density.
4.4.2.2.3 DECENTRALIZATION AND DENSITY AS SHARED LEADERSHIP
Using network density along with the network decentralization of the team, a
complete accounting of shared leadership within the team can be ascertained as shown in
the leadership quadrants depicted in Figure 4.5. Note that Figure 4.5 is similar to Figure
4.2 with a re-labeling of the axes. First proposed by Mayo et al. (2003), these four
leadership quadrants depict how the measures of decentralization and density can
differentiate levels of shared leadership and vertical leadership in teams.
Figure 4.5. Classifying leadership by Decentralization and Density
4.4.2.2.4 ACCOUNTING FOR THE FULL RANGE OF LEADERSHIP
To consider leadership across a full range of behaviors in our rate the members
approach to shared leadership, we used a 14-item subset of the MLQ (Form 5X)
developed in Novoselich and Knight (2015).. Students were asked to rate their
teammates and faculty advisor on these 14 leadership descriptive statements using a five
point Likert-type scale: 1=Not at all; 2=Once in a while; 3=Sometimes; 4=Fairly Often;
5=Frequently if not always, in a round-robin fashion (See Figure 4.4).
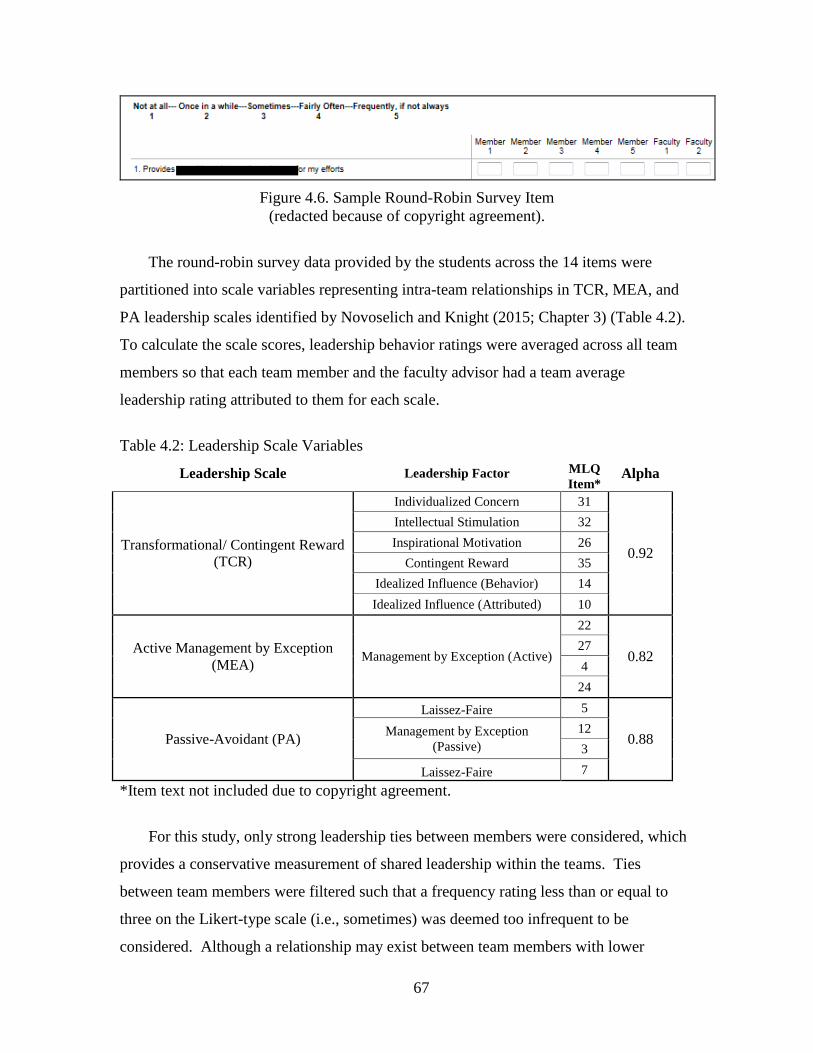
67
Figure 4.6. Sample Round-Robin Survey Item
(redacted because of copyright agreement).
The round-robin survey data provided by the students across the 14 items were
partitioned into scale variables representing intra-team relationships in TCR, MEA, and
PA leadership scales identified by Novoselich and Knight (2015; Chapter 3) (Table 4.2).
To calculate the scale scores, leadership behavior ratings were averaged across all team
members so that each team member and the faculty advisor had a team average
leadership rating attributed to them for each scale.
Table 4.2: Leadership Scale Variables
Leadership Scale Leadership Factor MLQ
Item* Alpha
Transformational/ Contingent Reward
(TCR)
Individualized Concern 31
0.92
Intellectual Stimulation 32
Inspirational Motivation 26
Contingent Reward 35
Idealized Influence (Behavior) 14
Idealized Influence (Attributed) 10
Active Management by Exception
(MEA) Management by Exception (Active)
22
0.82 27
4
24
Passive-Avoidant (PA)
Laissez-Faire 5
0.88 Management by Exception
(Passive)
12
3
Laissez-Faire 7
*Item text not included due to copyright agreement.
For this study, only strong leadership ties between members were considered, which
provides a conservative measurement of shared leadership within the teams. Ties
between team members were filtered such that a frequency rating less than or equal to
three on the Likert-type scale (i.e., sometimes) was deemed too infrequent to be
considered. Although a relationship may exist between team members with lower
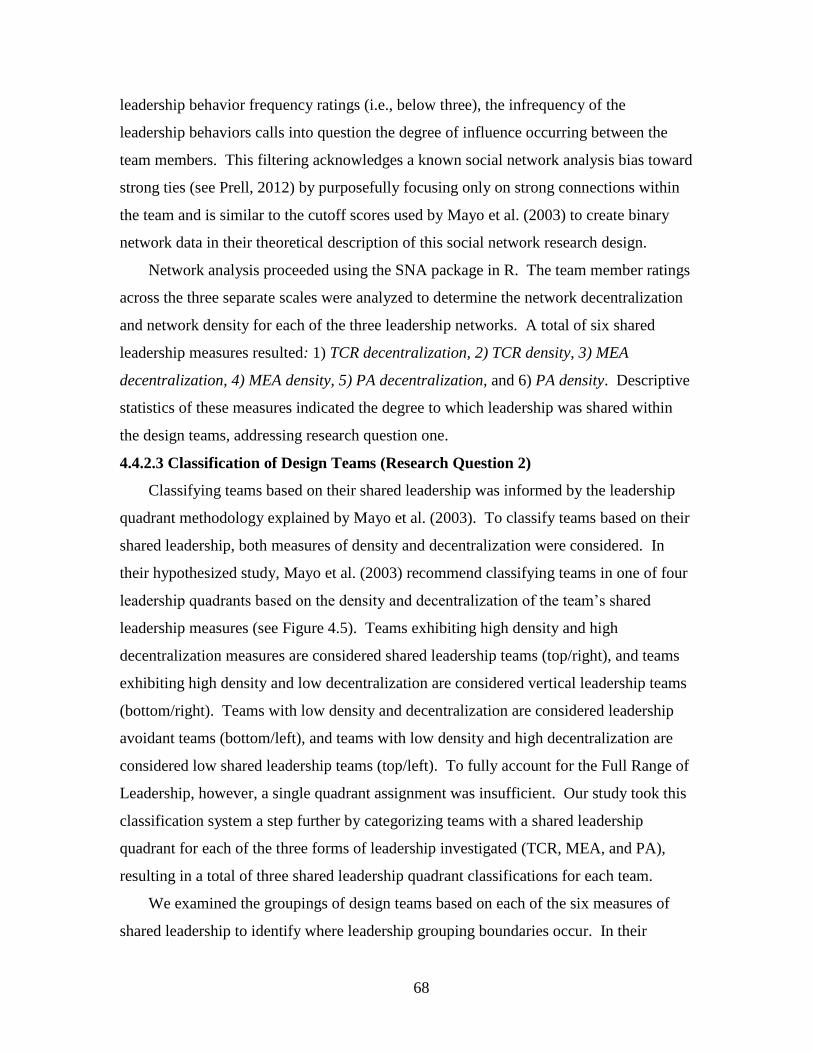
68
leadership behavior frequency ratings (i.e., below three), the infrequency of the
leadership behaviors calls into question the degree of influence occurring between the
team members. This filtering acknowledges a known social network analysis bias toward
strong ties (see Prell, 2012) by purposefully focusing only on strong connections within
the team and is similar to the cutoff scores used by Mayo et al. (2003) to create binary
network data in their theoretical description of this social network research design.
Network analysis proceeded using the SNA package in R. The team member ratings
across the three separate scales were analyzed to determine the network decentralization
and network density for each of the three leadership networks. A total of six shared
leadership measures resulted: 1) TCR decentralization, 2) TCR density, 3) MEA
decentralization, 4) MEA density, 5) PA decentralization, and 6) PA density. Descriptive
statistics of these measures indicated the degree to which leadership was shared within
the design teams, addressing research question one.
4.4.2.3 Classification of Design Teams (Research Question 2)
Classifying teams based on their shared leadership was informed by the leadership
quadrant methodology explained by Mayo et al. (2003). To classify teams based on their
shared leadership, both measures of density and decentralization were considered. In
their hypothesized study, Mayo et al. (2003) recommend classifying teams in one of four
leadership quadrants based on the density and decentralization of the team’s shared
leadership measures (see Figure 4.5). Teams exhibiting high density and high
decentralization measures are considered shared leadership teams (top/right), and teams
exhibiting high density and low decentralization are considered vertical leadership teams
(bottom/right). Teams with low density and decentralization are considered leadership
avoidant teams (bottom/left), and teams with low density and high decentralization are
considered low shared leadership teams (top/left). To fully account for the Full Range of
Leadership, however, a single quadrant assignment was insufficient. Our study took this
classification system a step further by categorizing teams with a shared leadership
quadrant for each of the three forms of leadership investigated (TCR, MEA, and PA),
resulting in a total of three shared leadership quadrant classifications for each team.
We examined the groupings of design teams based on each of the six measures of
shared leadership to identify where leadership grouping boundaries occur. In their
69
proposed study, Mayo et al. (2003) failed to articulate the actual values that quantified
"high" and "low" decentralization and density to define leadership quadrants related to
shared and vertical leadership. To address this empirical gap, we used six separate
cluster analysis to define boundaries between groups of teams based on each of the six
shared leadership measures. Cluster analysis is a statistical method that identifies
homogenous groupings within a sample by of by maximizing between group variance
and minimizing within group variance (Everitt, 2011; Steinley, 2006).
To perform the analysis, we used the TwoStep cluster component of SPSS version
23 (SPSS INC., 2001). This process includes a pre-cluster step that sequentially scans
cases to create a series of potential clusters based on the specified distance criterion. A
follow-on hierarchical clustering analysis determines the optimal number of clusters. In
this follow-on analysis, these potential clusters are evaluated using the specified fit
criterion to determine an initial estimate for the parsimonious number of clusters by
minimizing the fit criterion. A final determination of the appropriate number of clusters
is determined by evaluating the maximum distance between the two closest clusters. For
our analyses, we used the Euclidean distance as our specified distance criterion consistent
with Steinley (2006). We used Akaike’s information criterion (AIC) as our specified fit
criterion over the default Bayesian information criterion (BIC) to capitalize on AIC’s
propensity to over-estimate the number of parameters in cluster analysis (see Steinley,
2006). Evaluating the fit of the groupings to the team data provided evidence to support
the suitability of a quadrant system for differentiating teams based on their level of shared
or vertical leadership.
4.4.3 Limitations
Several limitations should be acknowledged when interpreting the results. First, this
study focuses on the mechanical engineering capstone design context with senior-level
engineering students at only three research sites. As a result, generality claims to the
wider field of engineering across multiple disciplines, class years, and professional
practice are unwarranted.
A second limitation of this study is the reduced number of MLQ items included in
the survey. Although a full examination of all 36 MLQ leadership descriptive statements
was desired, low student response rates in pilot data collection efforts prompted a
70
decrease in survey length to help bolster survey response rates as discussed in
(Novoselich & Knight, 2015). As a result, it is inappropriate to compare the specific
findings of this study to those of other studies that incorporated all 36 MLQ leadership
descriptive statements without acknowledging differences in data collection techniques
employed. Mind Garden Inc., the copyright holder for the MLQ, asserts that
administering only part of the survey may change the interpretation, and the validity
properties of the instrument may change (Mind Garden, 2015). Novoselich and Knight
(Chapter 3) acknowledge these concerns in their validation study.
Third, there are limitations inherent to the use of survey data. Survey responses
require recollection of events which is subject to memory distortion over prolonged
periods (Singleton & Straits, 2010). As raters of other team members’ leadership
behaviors, students may feel threatened by the survey process (Zafft et al., 2009).
Although confidentiality of the survey data was ensured and explicitly stated in the
recruiting and informed consent processes, students may not have fully trusted the
process (Hurley, 1998), especially since the names of all team members were included on
the team-specific surveys to ensure rating accuracy. Consequently, student ratings may
have been inflated to be more socially acceptable (Singleton & Straits, 2010). The round-
robin nature of the data collection process required for a rating the members approach to
shared leadership is also time consuming and survey fatigue may set in, which could also
result in inaccurate ratings (Grunspan, Wiggins, & Goodreau, 2014).
Finally, the study purposefully did not require faculty advisors to reciprocally rate
team member leadership. This decision was made in an effort to maximize full-team
response to data collection as interactions with various course coordinators and faculty
advisors indicated the potential for low faculty member response rates. Full team
responses were required to generate team level ratings of each team member and for
follow-on social network analysis to measure leadership sharing. The exclusion of the
advisor’s rating of the team members is inconsistent with the norms of social network
analyses, creating potential gaps in the leadership networks. This facet of the study
design does, however, reflect the reality that students may not possess the expert or
legitimate social power (see French & Raven, 1959; Pierro et al., 2013) with which to
influence their faculty advisors through leadership actions.
71
4.5 Results and Discussion
4.5.1 Addressing Research Question 1: Shared Leadership in Teams
In addressing research question one, social network analysis results partially
supported hypothesis 1. Across the six measures, leadership is more shared within the
student design teams for four measures of the Full Range of Leadership. The extent to
which shared leadership occurs was different among the various forms of leadership,
however. Descriptive statistics for network decentralization and density shown in Table
4.3 indicate that the mean decentralization and mean density for TCR are high (i.e.,
greater than 0.5), placing these teams in the shared leadership quadrant of Figure 4.5.
With a mean density value of 0.63 for TCR leadership shows that on average, almost
two-thirds of a team’s potential TCR leadership ties are occurring, making TCR
leadership the only type of leadership classified as shared leadership.
Table 4.3: Leadership Variable Descriptive Statistics
N Minimum Maximum Mean1,2
Std.
Deviation
TCR Network Decentralization 45 0.25 1.00 0.70 0.19
MEA Network Decentralization 45 0.22 0.94 0.75 0.15
PA Network Decentralization 45 0.25 1.00 0.84 0.19
TCR Network Density 45 0.25 0.80 0.63 0.14
MEA Network Density 45 0.05 0.67 0.35 0.13
PA Network Density 45 0.00 0.36 0.05 0.07 1For Decentralization: 1=shared leadership; 0=vertical leadership 2For Density: 1=full leadership; 0=no leadership
72
Figure 4.7. Leadership Quadrants; adapted from Mayo et al. (2003) 7
For MEA, the high mean decentralization and lower density scores place teams in
the low shared leadership quadrant of Figure 4.7, using 0.5 as the value for the separating
value. Finally, for PA leadership, high mean decentralization and low mean density
scores place teams in the low shared leadership quadrant of Figure 5 as well. With mean
density scores of 0.35 and 0.05 for MEA and PA leadership respectively, slightly over
one third of the MEA ties and about 5% of the PA ties occur more than sometimes (based
on the Likert scale cutoff of three used in this study). Correspondingly, although
leadership is shared across the breadth of the Full Range of Leadership (all three forms
show high decentralization), the amount of shared leadership differs considerably across
the three forms with TCR leadership distinguishing itself from MEA and PA.
Examination of the maximum and minimum density and decentralization values in
Table 4.3 show that the 45 teams cover the breadth of shared and vertical leadership. The
low network density minimum values for MEA and PA indicate that very little or none of
these leadership behaviors are happening within some teams, placing them in the low
shared leadership or leadership avoidance quadrants; maximum density values indicate
that some teams do fall within in the shared leadership and vertical leadership quadrants
7 This leadership quadrant figure from Mayo et al. (2003) is identical to that shown in Figure 4.5. The
figure is brought forward in the text to assist the reader in referencing the quadrants for the remainder of the
text.
73
of Figure 4.7. The decentralization minimum values indicate that some teams are more
leadership avoidance or vertical in their leadership; maximum values indicated that other
teams fall in the low shared leadership or shared leadership quadrants.
The prevalence of shared leadership practices across the design teams indicates that a
shared leadership model may be an appropriate way to characterize leadership within
engineering capstone design teams. These results corroborate the small sample findings
of Zafft et al. (2009), as well as Feister et al. (2014) who articulated the shared, emergent
nature of leadership within student design teams and Pearce (2004) who asserted that
shared leadership is an effective model for knowledge work that is creative, complex, and
interdependent. The sharing of leadership in design teams may also help explain the
discomfort Rottmann et al. (2014) found between practicing engineers and traditional
leadership actions. Engineers who see inconsistency between leadership and the
collaborative nature of their profession may not be familiar with the relatively recent
shared conceptualization of leadership, which this research shows is pervasive for student
design teams.
These results also provide evidence that engineering students may lead each other in
effective ways, as design teams exhibited high density TCR leadership networks. The
wide body of literature regarding the Full Range of Leadership model indicates that
transformational behaviors are the most active and often the most effective in a variety of
contexts (Antonakis & House, 2013; Lowe, Kroeck, & Sivasubramaniam, 1996; Wang et
al., 2011). Contingent reward behaviors are also among the most active and effective
(Antonakis & House, 2013; Lowe et al., 1996; Wang et al., 2011). Both of these are
components of the TCR leadership scale. Active management by exception has been
shown to exhibit both positive and negative relationships with organizational
effectiveness (Antonakis & House, 2013; Lowe et al., 1996), and Passive-avoidant
behaviors are consistently negative predictors of effectiveness (Antonakis & House,
2013). On average, there was a greater number of ties in the more effective TCR
leadership network than the less effective MEA and PA networks within the design teams
of this study. Further research is warranted to determine the effectiveness of each form
of leadership for undergraduate engineering design teams, as current literature fails to
address this context (see Chapter 5).
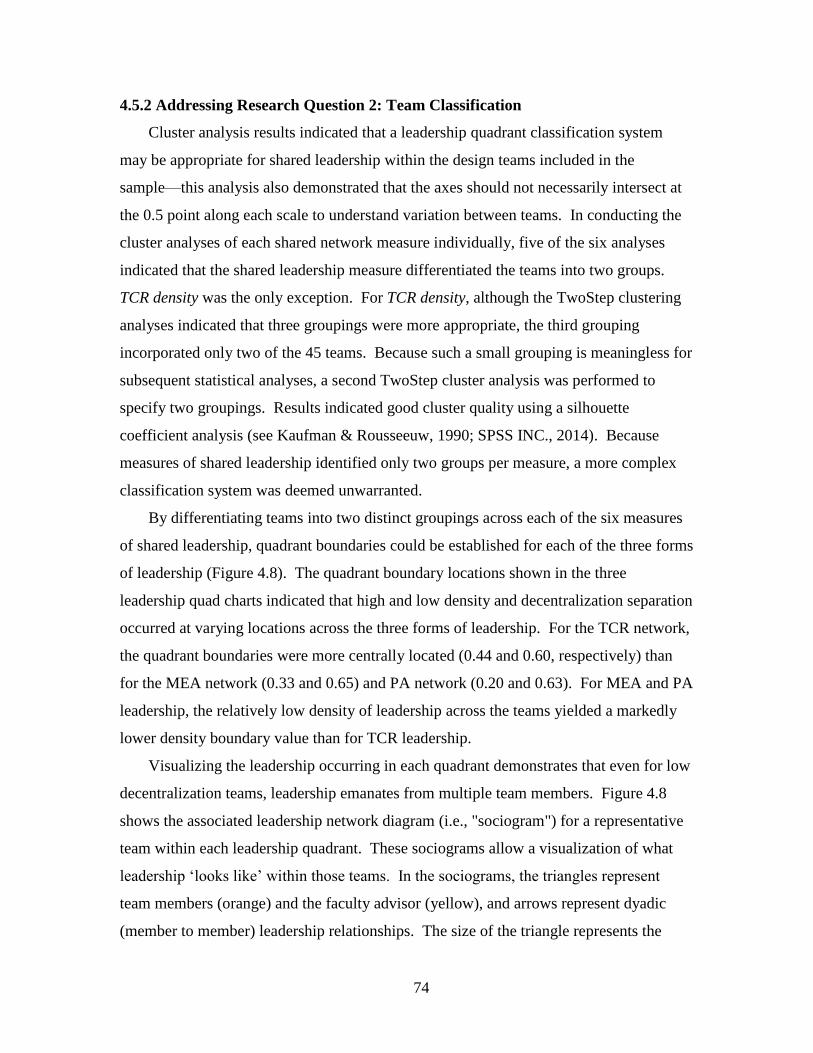
74
4.5.2 Addressing Research Question 2: Team Classification
Cluster analysis results indicated that a leadership quadrant classification system
may be appropriate for shared leadership within the design teams included in the
sample—this analysis also demonstrated that the axes should not necessarily intersect at
the 0.5 point along each scale to understand variation between teams. In conducting the
cluster analyses of each shared network measure individually, five of the six analyses
indicated that the shared leadership measure differentiated the teams into two groups.
TCR density was the only exception. For TCR density, although the TwoStep clustering
analyses indicated that three groupings were more appropriate, the third grouping
incorporated only two of the 45 teams. Because such a small grouping is meaningless for
subsequent statistical analyses, a second TwoStep cluster analysis was performed to
specify two groupings. Results indicated good cluster quality using a silhouette
coefficient analysis (see Kaufman & Rousseeuw, 1990; SPSS INC., 2014). Because
measures of shared leadership identified only two groups per measure, a more complex
classification system was deemed unwarranted.
By differentiating teams into two distinct groupings across each of the six measures
of shared leadership, quadrant boundaries could be established for each of the three forms
of leadership (Figure 4.8). The quadrant boundary locations shown in the three
leadership quad charts indicated that high and low density and decentralization separation
occurred at varying locations across the three forms of leadership. For the TCR network,
the quadrant boundaries were more centrally located (0.44 and 0.60, respectively) than
for the MEA network (0.33 and 0.65) and PA network (0.20 and 0.63). For MEA and PA
leadership, the relatively low density of leadership across the teams yielded a markedly
lower density boundary value than for TCR leadership.
Visualizing the leadership occurring in each quadrant demonstrates that even for low
decentralization teams, leadership emanates from multiple team members. Figure 4.8
shows the associated leadership network diagram (i.e., "sociogram") for a representative
team within each leadership quadrant. These sociograms allow a visualization of what
leadership ‘looks like’ within those teams. In the sociograms, the triangles represent
team members (orange) and the faculty advisor (yellow), and arrows represent dyadic
(member to member) leadership relationships. The size of the triangle represents the
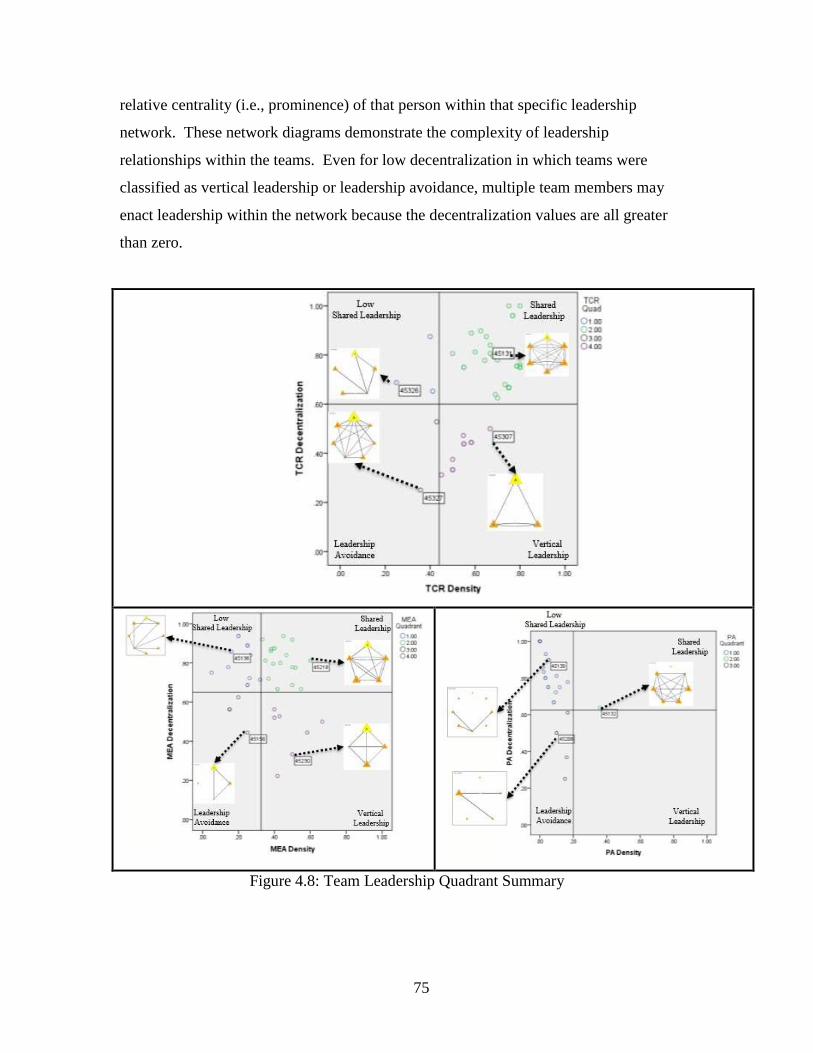
75
relative centrality (i.e., prominence) of that person within that specific leadership
network. These network diagrams demonstrate the complexity of leadership
relationships within the teams. Even for low decentralization in which teams were
classified as vertical leadership or leadership avoidance, multiple team members may
enact leadership within the network because the decentralization values are all greater
than zero.
Figure 4.8: Team Leadership Quadrant Summary
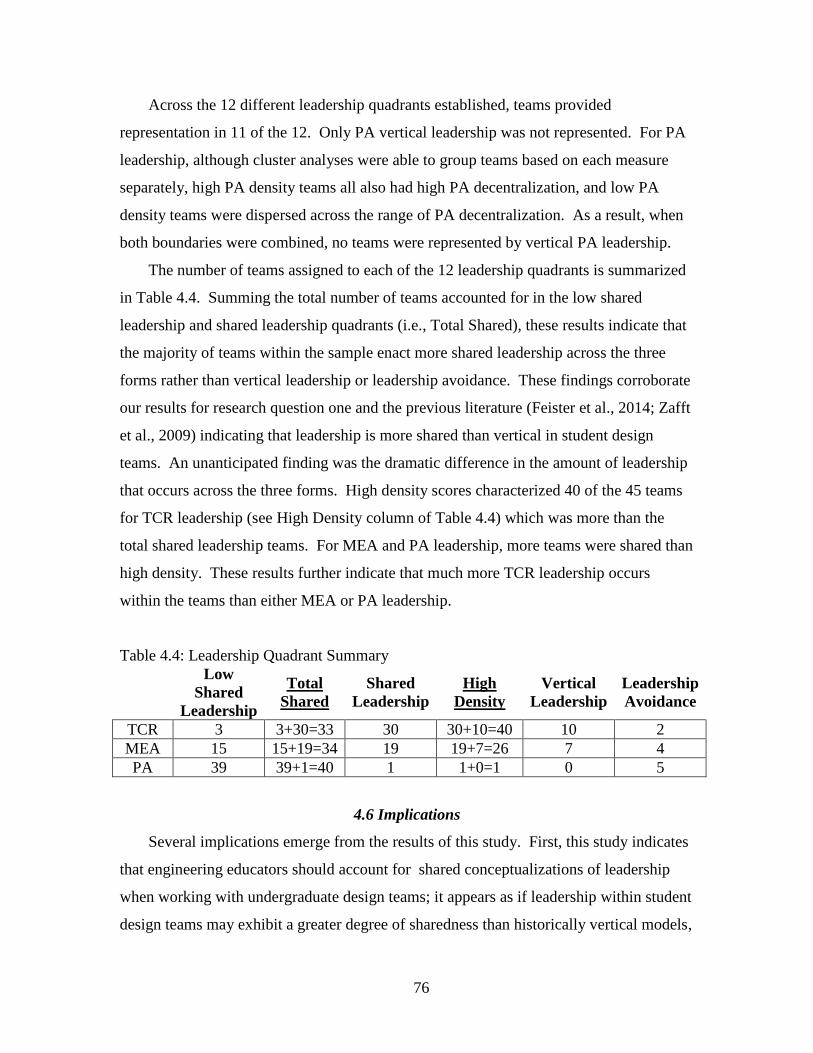
76
Across the 12 different leadership quadrants established, teams provided
representation in 11 of the 12. Only PA vertical leadership was not represented. For PA
leadership, although cluster analyses were able to group teams based on each measure
separately, high PA density teams all also had high PA decentralization, and low PA
density teams were dispersed across the range of PA decentralization. As a result, when
both boundaries were combined, no teams were represented by vertical PA leadership.
The number of teams assigned to each of the 12 leadership quadrants is summarized
in Table 4.4. Summing the total number of teams accounted for in the low shared
leadership and shared leadership quadrants (i.e., Total Shared), these results indicate that
the majority of teams within the sample enact more shared leadership across the three
forms rather than vertical leadership or leadership avoidance. These findings corroborate
our results for research question one and the previous literature (Feister et al., 2014; Zafft
et al., 2009) indicating that leadership is more shared than vertical in student design
teams. An unanticipated finding was the dramatic difference in the amount of leadership
that occurs across the three forms. High density scores characterized 40 of the 45 teams
for TCR leadership (see High Density column of Table 4.4) which was more than the
total shared leadership teams. For MEA and PA leadership, more teams were shared than
high density. These results further indicate that much more TCR leadership occurs
within the teams than either MEA or PA leadership.
Table 4.4: Leadership Quadrant Summary
Low
Shared
Leadership
Total
Shared
Shared
Leadership
High
Density
Vertical
Leadership
Leadership
Avoidance
TCR 3 3+30=33 30 30+10=40 10 2
MEA 15 15+19=34 19 19+7=26 7 4
PA 39 39+1=40 1 1+0=1 0 5
4.6 Implications
Several implications emerge from the results of this study. First, this study indicates
that engineering educators should account for shared conceptualizations of leadership
when working with undergraduate design teams; it appears as if leadership within student
design teams may exhibit a greater degree of sharedness than historically vertical models,
77
consistent with the assertions of Zafft et al. (2009) and Feister et al. (2014). The 45
design teams examined for this study exhibited a greater degree of shared than vertical
leadership, on average, across all three of the leadership networks that comprise the Full
Range of Leadership. As a consequence, faculty may consider the types of leadership
frameworks they encourage within student design teams through tools such as team
charters (Cox & Bobrowski, 2000; Hughston, 2014). Requiring teams to specify a team
leader may cause frustration and confusion among students as they attempt to reconcile
individual, vertical leadership concepts in a shared environment. Course documents may,
more appropriately encourage identification of a team facilitator or team manager and
acknowledge the potential for multiple leaders within a team. Solely individual models
of leadership may inhibit potential sources of influence within the teams (Pearce, 2004).
Team members may perceive that it is not their place to influence the team because of a
lack of leadership positioning; additionally, students identified as leaders may fail to
consider sources of influence from team members when holding a vertical leadership
perspective. For engineering practitioners, these results provide a context for the
leadership dynamic that these students experience in their last formative engineering
project many will face prior to entering the profession.
Second, this research developed a leadership taxonomy which may help make
complex leadership concepts accessible (Contractor et al., 2012) for students, engineering
educators, and engineering education researchers. The taxonomy developed in this study
encompasses not only multiple forms of leadership but also how those forms are shared
within undergraduate engineering design teams. Illuminating the three separate forms of
leadership behaviors for engineering students may make the often nebulous idea of
leadership more concrete and nuanced towards their personal experiences in the capstone
design space. Addressing the forms of leadership across the continuum for vertical to
shared may allow them to better describe how leadership emanates from their team
(Contractor et al., 2012; Mayo et al., 2003). By relating the three forms of leadership and
types of shared leadership to concrete experiences, engineering students may gain a basic
level of leadership knowledge that can then be applied and reflected upon increasingly
throughout their careers, as the National Academy of Engineering (2004) aspires.
78
Third, this study demonstrates the complexity of how engineering students lead;
engineering education researchers may consider the methodology by which they study
leadership to ensure oversimplification of the phenomenon does not result. The social
network analysis results indicate that leadership influence occurs in three conceptually
different forms, to varying degrees, and should be considered at the dyadic level,
consistent with the recommendations of Mayo et al. (2003) and Gockel and Werth
(2010). Although a rate the team approach to team leadership study may be prominent in
current shared leadership literature, this method may fail to examine comprehensively the
complexity of leadership interaction that is occurring within the team which can be
elucidated in a rate the members approach (Gockel & Werth, 2010). At a minimum,
researchers should be aware of these limitations and consider them in developing their
research design. More broadly, through an application of the rate the members approach
to shared leadership research, this study demonstrates the utility of social network
analysis in rendering the complexity of design team interactions in useful ways.
Finally, this study indicates the utility of social network analysis to both quantify and
visualize complex, team-level phenomena. Visualizing shared leadership through social
network analyses provided additional insights into the leadership networks that were not
readily apparent through numerical description. Specifically, although low
decentralization teams were characterized by vertical leadership, which may often be
associated with a single, individual leader (Pearce & Conger, 2003b), an examination of
network diagrams indicated that this was not actually the case for the design teams.
Although decentralization values greater than zero indicate multiple team members enact
leadership, being able to see what leadership ‘looks like’ in the network provided much
needed insight that may have otherwise been overlooked. Although teams may enact
vertical leadership, none of the teams attribute leadership behaviors to only one
individual.
4.7 Conclusions and Future Work
This study demonstrates the utility of social network analysis in a rate the members
approach for measuring shared leadership in the engineering design team context using a
reduced set of MLQ items. Operationalizing shared leadership as a combination of
network decentralization and density across three leadership networks, we found
79
evidence to support its prevalence in mechanical engineering centric capstone design
teams. The amount of leadership existing in the networks varies and is consistent with
previous analyses of the Full Range of Leadership model in the student teaming
literature. The teams were adequately represented by a shared leadership quadrant
classification system, with at least one team falling in 11 of the 12 possible shared
leadership quadrants.
Although the findings of research question one indicated the degree to which
leadership is shared across the Full Range of Leadership, the effectiveness of the different
forms of leadership was beyond the scope of this study. Further investigation is
warranted to determine how sharing these forms of leadership, and combinations thereof,
may contribute to enhanced learning for the engineering students and overall design team
effectiveness. Although descriptions of the Full Range of Leadership model by Bass
(1985) and Northouse (2013) may support transformational/contingent reward building
upon active management by exception to produce team performance beyond
expectations, empirical evidence is not currently available to support these assertions for
capstone design teams. Further investigations that relate decentralization and density
measures across the three leadership forms to measures of team success would provide
empirical support for more and less effective models of team leadership and is an area of
on-going research for the authors (see Chapter 5).
Additionally, further exploration of the dyadic leadership relationships occurring
between team members is warranted to unpack the shared leadership phenomenon within
the teams. The network data included in this study allows for exploration of the
prominence that each team member, including the faculty advisor, holds in the leadership
networks through measures of network centrality. Determining the personal attributes
that relate to this emergence, for example, can help characterize leadership emergence
from within the team.
Finally, this study focused exclusively on the mechanical engineering capstone
design context. Although the study provides critical insights into how students share
leadership in a key developmental experience prior to professional engineering practice,
the study’s focus on the mechanical engineering capstone design context prevents
generalization across engineering disciplines and breadth of the undergraduate

80
engineering experience. Further study is warranted within other engineering disciplines
and across developmental stages from freshman year to professional practice to address
the applicability of a shared leadership model to the larger practice of engineering.
81
Chapter 5
Manuscript 3: Is Sharing Leadership Effective? Relating shared leadership to team
effectiveness and team attributes for mechanical engineering capstone design teams.
5.1 Abstract
Background
Multiple national-level reports have indicated the need for engineers to take more prominent
leadership roles to better-inform complex policy decisions. Engineering faculty are tasked to
develop a basic level of leadership knowledge within undergraduate engineering students that
can then be applied increasingly throughout their careers. Recent engineering leadership
literature, however suggests that an adequate model of how engineers lead in collaborative team-
based environments does not exist. Several studies indicate that a shared leadership model may
be more effective than the historically vertical models. Little empirical evidence is available to
support these claims or determine what contributes to shared leadership development with design
teams.
Purpose/Hypothesis
The purpose of this study is to further develop a model of how engineers lead in collaborative,
team-based environments. This study hypothesizes that sharing leadership will positively relate
to design team effectiveness and that specific team attributes will relate to the level of shared
leadership in the teams.
Design/Methods
This quantitative study examines round-robin (360-degree) student leadership ratings gathered
from mechanical engineering capstone design team students using a 14-item subset of the
Multifactor Leadership Questionnaire. Shared leadership is operationalized as a combination of
network decentralization and density using social network analyses across three forms of
leadership related to the Full Range of Leadership model. These measures serve as independent
variables for explanatory regression analyses examining relationships to multiple measures of
team effectiveness. The measures also serve as dependent variables related to specific team
attributes.
Results
Results indicates that the level of shared leadership within the team relates to the group process
and individual satisfaction components of team effectiveness but did not relate to measures of
task performance (i.e., course grades). A selection of team attributes, to include team
engineering GPA, GPA diversity, team leadership skills, team size, and team sex related to
various aspects of shared leadership within the teams.
82
Conclusions
This study expands an empirically tested model of how engineers lead for undergraduate
engineering student design teams. The model adds greater depth to previous shared leadership
literature claims that a shared leadership is a more effective model for knowledge work that is
creative, complex, and interdependent. The model shows that an active, engaging form of
leadership, distributed across a limited number of team members, may be more effective
structure than fully shared or individual leadership structures. The model also shows specific
team attributes that may relate to shared leadership development within the teams.
Key Words
Shared Leadership, Engineering Leadership, Team Effectiveness, Full Range of Leadership
model, Multifactor Leadership Questionnaire, Social Network Analysis
5.2 Introduction
Since the publication of the Green Report (1994) more than two decades ago, reports from
industry and the federal government have called for the preparation of engineering students with
leadership skills (e.g., ASME Center for Education, 2011; National Academy of Engineering,
2004, 2005). Current reviews of engineering leadership education programs, however, indicate
that engineering leadership programs largely lack institution resources (e.g., Graham, 2012).
One potential barrier to progress in preparing engineers as leaders may be the view that
leadership within engineering programs is best left to extra-curricular settings (Knight &
Novoselich, 2014; Rottmann et al., 2014). Currently, leadership is not widely perceived as an
integral skill in the development of students for the engineering field. A gap in literature may
partially explain this perception that leadership is not integral to engineering practice. Recent
literature suggests that an empirically tested model for effective leadership in a team-based
engineering context does not exist (e.g., Paul & Cowe Falls, 2015; Reeve et al., 2015; Rottmann
et al., 2014). Although conceptualizations of engineering leadership are departing from
traditional, vertical views of leadership, there is no literature that describes how leadership
relates to design team effectiveness or what team attributes relate to the way engineers lead their
peers.
This study aims to address this literature gap by investigating leadership from the
perspective of the collaborative, team-based environment that engineers routinely experience.
Leadership scholars indicate that shared leadership, characterized by the serial emergence of
official as well as unofficial leaders, may be a more effective model than a vertical,
83
individualistic approach (Feister et al., 2014; Pearce, 2004; Pearce & Conger, 2003b), especially
for the creative, complex, and interdependent knowledge work like that of an engineering design
team. Although studies suggest that shared leadership is pervasive in undergraduate engineering
design teams (e.g., Feister et al., 2014; Novoselich and Knight, Chapter 4), little is known
regarding the effectiveness of shared leadership for design teams or how the level of shared
leadership relates to the team itself. Building upon the prior shared leadership research of
Novoselich and Knight (Chapter 4), this study deepens our understanding of shared leadership in
design teams by examining how sharing various forms of leadership relates to team
effectiveness; it also explores how team level attributes relate to the level of shared leadership in
the team. Specifically, the study addresses the following research questions:
RQ1. How does the degree of shared leadership across the Full Range of Leadership
relate to undergraduate mechanical engineering-centric capstone design team effectiveness?
RQ2. How do team-level attributes relate to the degree of shared leadership in
undergraduate mechanical engineering-centric capstone design teams?
5.3 Review of the Literature
5.3.1 Effectiveness of Shared Leadership (RQ1)
Leadership literature has traditionally focused on vertical conceptualizations of leadership
where one leader influences followers (Jackson & Parry, 2011; Markham, 2012; Pearce &
Conger, 2003b). The possibility of multiple team members influencing each other has been a
relatively recent development in the long history of leadership research (Pearce & Conger,
2003b). In the shared leadership paradigm, leaders emerge from the group based on their
knowledge, skills, or ability, to lead the team through tasks or challenges and then pass the
mantle of leadership to others as the team’s situation evolves.
Shared leadership’s rise accounts for the situated nature of knowledge; in this modern age of
increased technology and rapid industrial pace, it is nearly impossible for one person to have the
necessary knowledge, skills, and abilities for all aspects of highly intellectual work (Pearce,
2004). This scenario aligns with Newstetter’s (1998) description of student learning
environments in engineering design teams as well as Salas et al.’s (2007) integrative model of
team effectiveness, which references team leaders (plural) not team leader (singular) and
describes how shared cognition affects leadership and vice-versa. In light of this evolving
knowledge distribution, Wageman and Gardner (2012) call for a re-examination of team
84
leadership in light of the new landscape of modern collaboration. These calls are echoed by
Dorst (2008), who calls for an examination of the context by which design is practiced, which
are aims of this study.
Capstone design teams provides a suitable context for exploring how engineers lead.
Capstone design projects are often a culminating, team-based event for undergraduate engineers
as they prepare for professional engineering practice (Howe & Wilbarger, 2006). On the cusp of
professional engineering practice, these experiences are also a final opportunity to address and
develop engineering professional skills, to include leadership (Farr & Brazil, 2012; Shuman,
Besterfield-Sacre, & Mcgourty, 2005). Pearce (2004) hypothesizes the positive role shared
leadership can play in knowledge work that is creative, complex and interdependent, such as that
of a design project. Cox et al. (2003) discuss the potential for shared leadership to benefit new
product development team performance, a work atmosphere very similar to what is asked of
capstone design students.
Limited empirical work suggests the effectiveness of shared leadership for the design team
context. For student design teams specifically, Zafft et al. (2009) were able to establish that
increased dispersion of different leadership profiles across team members related positively to
team success in terms of course grades using the Competing Values Framework. The authors of
this study admit, however, that they were unable to relate a specific measure of shared leadership
to team success, which is a goal of this study. In other contexts, shared leadership has been
shown to relate significantly to team outcomes. For example, recent meta-analyses of shared
leadership indicate that both the distribution and quantity of leadership in teams positively relates
to team effectiveness (Wang et al., 2014) and team performance (D'Innocenzo et al., 2014;
Nicolaides et al., 2014). In light of this literature, we propose the following:
Hypothesis 1: Shared leadership positively relates to team effectiveness for mechanical
engineering-centric capstone design teams.
5.3.2 Effective Forms of Leadership
The Full Range of Leadership model informs this study’s investigation of shared leadership.
Whereas shared leadership examines how many individuals enact leadership within the teams,
the Full Range of Leadership model explains how individuals perform different forms of
leadership. The Full Range of Leadership model has been in existence for over two decades (see
Bass & Avolio, 1994). Previous literature has demonstrated the applicability of the Full Range
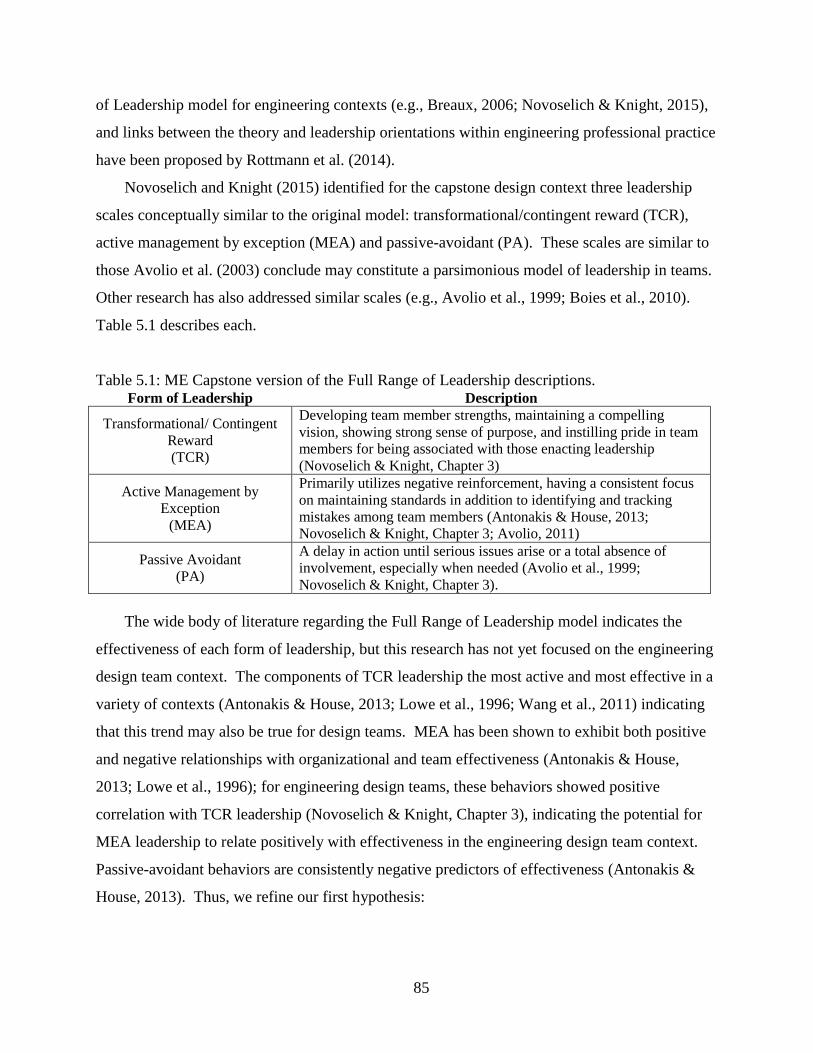
85
of Leadership model for engineering contexts (e.g., Breaux, 2006; Novoselich & Knight, 2015),
and links between the theory and leadership orientations within engineering professional practice
have been proposed by Rottmann et al. (2014).
Novoselich and Knight (2015) identified for the capstone design context three leadership
scales conceptually similar to the original model: transformational/contingent reward (TCR),
active management by exception (MEA) and passive-avoidant (PA). These scales are similar to
those Avolio et al. (2003) conclude may constitute a parsimonious model of leadership in teams.
Other research has also addressed similar scales (e.g., Avolio et al., 1999; Boies et al., 2010).
Table 5.1 describes each.
Table 5.1: ME Capstone version of the Full Range of Leadership descriptions. Form of Leadership Description
Transformational/ Contingent
Reward
(TCR)
Developing team member strengths, maintaining a compelling
vision, showing strong sense of purpose, and instilling pride in team
members for being associated with those enacting leadership
(Novoselich & Knight, Chapter 3)
Active Management by
Exception
(MEA)
Primarily utilizes negative reinforcement, having a consistent focus
on maintaining standards in addition to identifying and tracking
mistakes among team members (Antonakis & House, 2013;
Novoselich & Knight, Chapter 3; Avolio, 2011)
Passive Avoidant
(PA)
A delay in action until serious issues arise or a total absence of
involvement, especially when needed (Avolio et al., 1999;
Novoselich & Knight, Chapter 3).
The wide body of literature regarding the Full Range of Leadership model indicates the
effectiveness of each form of leadership, but this research has not yet focused on the engineering
design team context. The components of TCR leadership the most active and most effective in a
variety of contexts (Antonakis & House, 2013; Lowe et al., 1996; Wang et al., 2011) indicating
that this trend may also be true for design teams. MEA has been shown to exhibit both positive
and negative relationships with organizational and team effectiveness (Antonakis & House,
2013; Lowe et al., 1996); for engineering design teams, these behaviors showed positive
correlation with TCR leadership (Novoselich & Knight, Chapter 3), indicating the potential for
MEA leadership to relate positively with effectiveness in the engineering design team context.
Passive-avoidant behaviors are consistently negative predictors of effectiveness (Antonakis &
House, 2013). Thus, we refine our first hypothesis:
86
Hypothesis 1A: The degree of shared TCR and MEA leadership will positively relate to
team effectiveness.
Hypothesis 1B: The degree of shared PA leadership will negatively relate to team
effectiveness.
5.3.3 Team Level Attributes Related to Shared Leadership (RQ2)
Although there is literature to support how sharing the various forms of leadership may
relate to team effectiveness (i.e. Wang et al., 2014), much less is known regarding how team
attributes may relate to shared leadership (Hoch, 2014). A better understanding of how various
team attributes relate to the level of shared leadership within teams may provide engineering
educators who structure and mentor design teams an additional resource to foster team
effectiveness by understanding how the makeup of the team relates to the level of shared
leadership then enact. In their development of a shared leadership model for new product
development teams (a context similar to a student design team), Cox et al. (2003) hypothesized
that certain team characteristics, including team member proximity, team size, team ability, team
diversity (across multiple dimensions including race, gender, employment tenure, and
educational backgrounds), and maturity, may relate to shared leadership. Limited studies have
begun to investigate these hypotheses (i.e., Allen & O'Neill, 2015; Carson, Tesluk, & Marrone,
2007; Hoch, 2014; Mathieu, D’Innocenzo, et al., 2015), but the proposed hypotheses remain
largely untested (Hoch, 2014). Correspondingly, the work of Cox et al. (2003), provides a
foundation for the generation of hypotheses in the present study. The sections that follow
propose a series of hypotheses based on that research as well as related literature.
5.3.3.1 Shared Leadership and Engineering Course GPA
Students’ course performance within engineering may be related to shared leadership within
the teams. Consistent with explanations of personal social power, (see French & Raven, 1959;
Pierro et al., 2013) elevated academic ability within engineering may provide a source of social
power for students to influence their peers and exercise leadership. Tonso (2007) echoes this
interpretation in her ethnographic study of student design teams. She found that students with
high academic-science expertise, as indicated by engineering science course performance, were
afforded additional agency over their peers with less engineering science-expertise (Tonso,
2007). Thus, there is the potential for teams with a greater level of overall engineering course
GPA to share leadership more actively because of their elevated, collective technical ability.
87
Correspondingly, because TCR and MEA are both active forms of leadership involving
interactions with team members, these forms of leadership may be more prevalent when the
collective GPA in the team is higher. Conversely, because PA leadership involves an absence of
leadership behaviors, this form of leadership may be less prevalent in teams with elevated
average GPAs. Cox et al. (2003) support these claims as they hypothesize positive relationships
between team technical ability and shared leadership development for new product development
teams. Accordingly, we hypothesize:
Hypothesis 2: Team average self-reported engineering course GPA will have a positive
relationship with shared TCR and MEA leadership and a negative relationship with shared
PA leadership.
In contrast, teams with a more diverse representation of engineering course GPA may
exhibit more individualized leadership, as the higher GPA students are afforded additional
agency with which to influence their teammates, similar to a technical mastery orientation of
engineering leadership discussed by Rottmann et al. (2014). These relationships would hold
across the three modes of leadership in the Full Range of Leadership (i.e., TCR, MEA, and PA),
as disparity of agency among team members would result in a greater ability to enact TCR and
MEA leadership for those with higher GPA, and greater PA leadership for those with lower
GPA. These assertions result in the following hypothesis:
Hypothesis 3: Teams' self-reported engineering course GPA diversity will have a
negative relationship with shared TCR, MEA, and PA leadership.
5.3.3.2 Shared Leadership and Team Size
Team size has also been hypothesized to have an effect on shared leadership, as Cox et al.
(2003) propose a negative relationship between team size and shared leadership development.
They suggest that as teams become increasingly large, close working relationships that lead to
influence between team members will be more challenging to develop. Meta-analytic studies of
shared leadership (e.g., D'Innocenzo et al., 2014; Nicolaides et al., 2014), however, indicate that
team size is often relegated to a control variable, so confirming these propositions remains
elusive. Increased group size has been shown to have a demotivating effect on its members, a
phenomenon called social loafing (Borrego, Karlin, et al., 2013; Karau & Williams, 1993).
Correspondingly, team members of larger teams may contribute less effort to the project,
resulting in a decrease of shared TCR and MEA leadership. Conversely, larger teams may
88
increase PA’s absentee leadership behaviors, thereby increasing shared PA leadership. Thus, we
hypothesize:
Hypothesis 4: Team size will have a negative relationship with shared TCR and MEA
leadership and a positive relationship with shared PA leadership.
5.3.3.3 Shared Leadership and Leadership Skills
Students’ individual perceived leadership abilities and the self-efficacy that entails may
influence shared leadership within the teams. Bandura (1982) asserted that how individuals
judge their capabilities affects their self-perceptions of efficacy and in turn their motivations and
behaviors. Those with higher judgement of an ability (e.g., leadership) often rise to the demands
of a situation more often than their lower judging counterparts (Bandura, 1982). Leadership self-
efficacy involves a person’s self-confidence in their ability to perform behaviors related to their
leadership role (Paglis, 2010). Hence, students who rate themselves higher in engineering
leadership skills may have higher leadership self-efficacy and, in-turn, may exhibit more
leadership behaviors within a team. Correspondingly, for TCR and MEA, as forms of leadership
requiring action, teams with greater average leadership skills would facilitate greater practice of
these forms of leadership among its members, thus increasing shared leadership. Conversely, by
measuring leadership inaction, PA leadership behaviors would be less present in higher
leadership-skilled teams, decreasing shared leadership. Accordingly, we hypothesize:
Hypothesis 5: The average level of leadership skills within the team will positively
relate to shared TCR and MEA leadership and negatively relate to shared PA leadership.
Leadership self-efficacy has also been shown to relate to individual leader emergence in
teams. In their study of leader emergence from leaderless, all-male student groups, Smith and
Foti (1998) found a strong correlation between general self-efficacy and leader emergence.
Similarly, Paglis (2010) found positive relationships between individual leadership self-efficacy
and leader performance. Consequently, teams with higher individual maximum leadership skills
(i.e., one particular standout team member) may be more apt to exhibit vertical leadership as
opposed to shared leadership; individuals with the highest leadership self-efficacy may emerge
as a central, vertical leader within a team. Emergence of a central leader in the team would
correspondingly diminish shared TCR and MEA leadership while increasing the shared PA
behaviors of those team members not recognized as that central leader. Thus we hypothesize:
89
Hypothesis 6: The maximum individual leadership score within a team will negatively
relate to shared TCR and MEA leadership and positively relate to shared PA leadership.
5.3.3.4 Shared Leadership and Sex
Literature supports potential relationships between leadership and personal characteristics.
Carter, Mossholder, Feild, and Armenakis (2014) discuss how demographic characteristics, such
as sex, may invoke social categorization in leader-follower situations. Although research
indicates that little if any sex-related differences exist in overall leadership style or effectiveness
(e.g., Hoyt, 2013), studies indicate that women emerge (Kolb, 1999; Lucas & Baxter, 2012), are
perceived (Eagly & Karau, 2002; Lucas & Baxter, 2012), and are rated (Eagly & Karau, 2002) as
leaders in ways that are distinguishable from men. Despite literature hypothesizing the benefits
of shared leadership to close gender inequality in leadership roles (Neubert & Taggar, 2004;
Pearce & Conger, 2003a), emerging research indicates that men emerge as leaders more often
than women, even in shared leadership environments (Mendez & Busenbark, 2015). According
to role congruity theory, women’s leadership actions are typically perceived as influential, but
only when it conforms to the social expectations ascribed to women in general, which tend to be
more caring and communal (Eagly & Karau, 2002). Meta-analyses support these societal norms,
showing that although differences are small, women tend to engage in more transformational and
contingent reward and less in management by exception and laissez-faire leadership behaviors
than their male counterparts (Eagly, Johannesen-Schmidt, & van Engen, 2003; Vinkenburg, van
Engen, Eagly, & Johannesen-Schmidt, 2011). Correspondingly, women would be more likely to
be recognized as leaders in a team’s TCR network, which espouses behaviors that tend to be
ascribed to women (Eagly et al., 2003), thus increasing the level of shared TCR leadership as the
proportionality of women of a team increases. MEA or PA networks, which may be perceived as
more masculine (Eagly et al., 2003), would correspondingly see a decrease in the number of
recognized participants for teams with additional women, decreasing shared leadership.
Accordingly, we hypothesize:
Hypothesis 7: The proportion of women assigned to a design team will have positive
relationships with shared TCR leadership and negative relationships with shared MEA and
PA leadership.
90
5.3.3.5 Shared Leadership and Race/Ethnicity
Research also indicates that race and ethnicity may relate to shared leadership, although the
presence of these relationships varies by methods used. Dugan, Kodama, and Gebhardt (2012)
summarize contradictory findings, with qualitative approaches suggesting that race influences
student perceptions of leadership and leadership development (Arminio et al., 2000; Komives,
Owen, Longerbeam, Mainella, & Osteen, 2005; Renn & Ozaki, 2010) and quantitative
approaches showing little or no significant relationships (e.g., Cress, Astin, Zimmerman–Oster,
& Burkhardt, 2001; Dugan & Komives, 2010; Posner, 2004). Seers, Keller, and Wilkerson
(2003) argue that demographic differences may be a barrier to shared leadership when teams are
comprised mainly of white males, which is common for current engineering teams. Limited
research also suggests that Asian and Asian American students in particular may develop
leadership differently than students of other races (Chung, 2014). Traditionally attributed to
cultural norms of reserve and harmony in relationships (Fukuyama & Greenfield, 1983), research
has shown that Asian Americans may struggle with being identified as leaders within a
traditionally western culture (Chung, 2014). Kodama, McEwen, Liang, and Lee (2001) assert
that “traditional Asian values” (p. 414), such as interdependence with family and deference to
authority, may affect the college experience of these students. Cox et al. (2003) also hypothesize
negative relationships for a series of diversity related attributes, including race and ethnicity, but
these relationships have not been empirically tested. In light of these potential racial and
ethnicity relationships, we hypothesize:
Hypothesis 8: Racial and ethnic diversity on a team will have a negative relationship
with shared leadership development.
5.3.3.6 Shared Leadership and Project Effort
Team member project effort may also relate to shared leadership. Leaders are often
characterized by hard work (Hogan & Kaiser, 2005) and set an example of hard work (Avolio et
al., 1991). Manager effort has shown positive relationships with member perceptions of
relationship quality in studies of leader-member exchange theory (LMX) (e.g., Maslyn & Uhl-
Bien, 2001). Additionally, team members who exert a large amount of effort in a project may be
perceived as more dependable or conscientious, which positively relates to leadership (Jackson
& Parry, 2011; Northouse, 2013). As the team members across the team exert a greater amount
of effort, there may be a corresponding increase in the number of team members perceived as
91
leaders within the team and an increase in leadership interactions occurring within the team.
Because TCR and MEA leadership both measure leadership actions, these forms of leadership
would tend to be more shared with increased project effort, and PA leadership, which measures
leader inaction, would correspondingly be less shared. We hypothesize:
Hypothesis 9: Average team level effort will have a positive relationship with shared
TCR and MEA leadership and a negative relationship with shared PA leadership.
5.3.3.7 Shared Leadership and Engineering Discipline
Despite a dearth of research regarding engineering discipline differences in leadership
actions, the literature indicates a potential for shared leadership to be related to the diversity of
engineering disciplines in a team. While functioning on interdisciplinary teams, students’
engineering disciplines may play a role in their ability to influence their teammates because of
technical expertise. Disciplinary knowledge from an under-represented discipline within the
team may provide a source of power for students to influence their peers and hence exercise
leadership. For example, a mechanical engineering project with a complex circuit design aspect
may include an electrical engineering student as a part of the team. As a subject matter expert in
circuit design, the electrical engineering student may have significant influence on the project
because of his or her expertise. Within explanations of personal social power (e.g., French &
Raven, 1959; Pierro et al., 2013), expert power is attributed by followers to someone exhibiting
competence in a subject area. In addition to this potential relationship, Knight and Novoselich
(2014) found disciplinary differences in the perceptions of leadership importance in their study
of undergraduate engineering program faculty and administrators which may filter down to
students. These studies indicate that as the number of engineering disciplines represented in a
design team increase, more students are afforded the ability to influence other team members,
increasing the level of shared leadership. These positive relationships would hold true for both
TCR and MEA leadership, which involve active influence of team members by the leader. The
opposite relationship would hold to PA leadership, which is a measure of leadership inaction. In
light of this literature, we hypothesize:
Hypothesis 10: Team engineering discipline diversity will have a positive relationship
with shared TCR and MEA leadership and a negative relationship shared PA leadership.
92
5.3.3.8 Shared Leadership and Team Tenure
The amount of time team members have worked together (i.e., team tenure) may also relate
to differences in shared leadership within the teams. Studies indicate that shared leadership takes
time to develop as team member roles solidify and a history of interactions is built (e.g., Avolio
et al., 1996; Avolio et al., 2003; Small & Rentsch, 2010) and that shared leadership is related to
team tenure (Hoch, 2014). Students who have worked together for a longer duration in the past
may be more apt to share leadership among themselves in current projects because of an increase
in cohesion and shared values that has developed over time (Michel & Hambrick, 1992). Thus,
previous work experiences may afford students the ability to more quickly generate close
working relationships that can lead to shared TCR and MEA leadership, and decreasing the
levels of shared PA leadership within the teams. From this body of literature, we hypothesize:
Hypothesis 11: The amount of time team members have worked together prior to the
current project will positively relate to shared TCR and MEA leadership and negatively
relate to shared PA leadership.
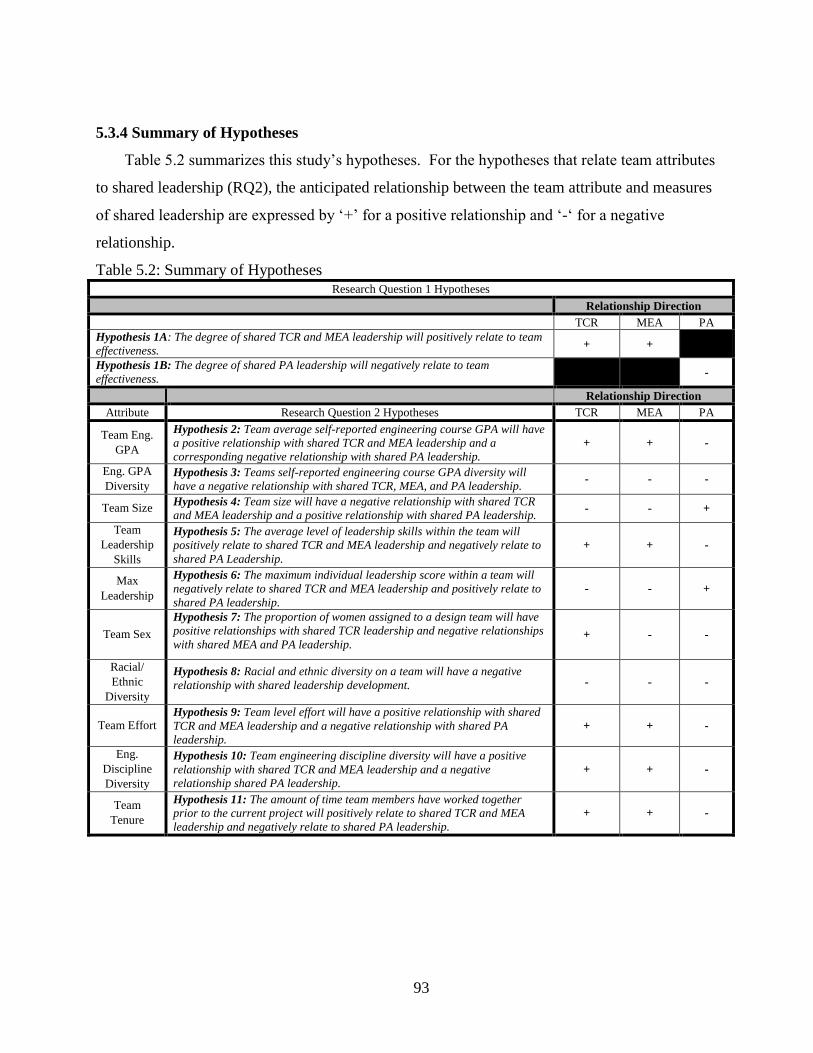
93
5.3.4 Summary of Hypotheses
Table 5.2 summarizes this study’s hypotheses. For the hypotheses that relate team attributes
to shared leadership (RQ2), the anticipated relationship between the team attribute and measures
of shared leadership are expressed by ‘+’ for a positive relationship and ‘-‘ for a negative
relationship.
Table 5.2: Summary of Hypotheses Research Question 1 Hypotheses
Relationship Direction
TCR MEA PA
Hypothesis 1A: The degree of shared TCR and MEA leadership will positively relate to team
effectiveness. + +
Hypothesis 1B: The degree of shared PA leadership will negatively relate to team
effectiveness. -
Relationship Direction
Attribute Research Question 2 Hypotheses TCR MEA PA
Team Eng.
GPA
Hypothesis 2: Team average self-reported engineering course GPA will have
a positive relationship with shared TCR and MEA leadership and a
corresponding negative relationship with shared PA leadership.
+ + -
Eng. GPA
Diversity
Hypothesis 3: Teams self-reported engineering course GPA diversity will
have a negative relationship with shared TCR, MEA, and PA leadership. - - -
Team Size Hypothesis 4: Team size will have a negative relationship with shared TCR
and MEA leadership and a positive relationship with shared PA leadership. - - +
Team
Leadership
Skills
Hypothesis 5: The average level of leadership skills within the team will
positively relate to shared TCR and MEA leadership and negatively relate to
shared PA Leadership.
+ + -
Max
Leadership
Hypothesis 6: The maximum individual leadership score within a team will
negatively relate to shared TCR and MEA leadership and positively relate to
shared PA leadership.
- - +
Team Sex
Hypothesis 7: The proportion of women assigned to a design team will have
positive relationships with shared TCR leadership and negative relationships
with shared MEA and PA leadership. + - -
Racial/
Ethnic
Diversity
Hypothesis 8: Racial and ethnic diversity on a team will have a negative
relationship with shared leadership development. - - -
Team Effort Hypothesis 9: Team level effort will have a positive relationship with shared
TCR and MEA leadership and a negative relationship with shared PA
leadership.
+ + -
Eng.
Discipline
Diversity
Hypothesis 10: Team engineering discipline diversity will have a positive
relationship with shared TCR and MEA leadership and a negative
relationship shared PA leadership.
+ + -
Team
Tenure
Hypothesis 11: The amount of time team members have worked together
prior to the current project will positively relate to shared TCR and MEA
leadership and negatively relate to shared PA leadership.
+ + -
94
5.4 Data and Methods
5.4.1 Data Collection
Student surveys administered during the spring semester of the 2014–2015 academic year
comprise this study’s data. Participants were enrolled in year-long, team-based, mechanical
engineering-centric, senior level capstone design courses at three institutions: a large, mid-
Atlantic research university (site A) and two smaller engineering-focused military institutions
(sites B and C). These study sites were purposefully chosen because of their historic leadership
focus, ABET accredited engineering programs, comparable capstone design experiences, and
access to participants. Qualitative comparison of course syllabi and team charter requirements
across the three institutions indicated similarity in the capstone design experience with regard to
course objectives, course content, project requirements, and team-based pedagogy (see Chapter
2). The mixture of civilian and military institutions provides a combination of a more traditional
civilian undergraduate engineering experience at site A and mandatory, 4-year leadership
programs at sites B and C. Leadership training for students at site A may include voluntary
affiliation with the Corps of Cadets, which includes purposeful leadership development, or
various other voluntary leadership training programs; the Corps of Cadets represents less than
5% of the participating ME students at site A. Mechanical engineering was chosen because of
the discipline’s professional interest in engineering leadership (see ASME Center for Education,
2011), mechanical engineering’s prominence as the largest discipline for bachelor’s degree
attainment (Yoder, 2014), and alignment with the researcher’s career interests. The study had
IRB approval at all three institutions.
In taking the survey, team members assessed each of their teammates’ leadership behaviors
based on 14 MLQ-derived leadership descriptive statements (see Novoselich & Knight, 2015).
These survey items were presented in a round-robin (360-degree) format, which asked all team
members to rate each of their team members and the faculty advisor (Figure 5.2). A series of
additional round-robin questions asked team members to rate their teammates and advisor
regarding various MLQ derived leadership outcomes that related to team effectiveness. Finally,
several individual questions regarding demographic information were also asked. The survey
was administered by the authors online using Qualtrics survey development software at sites A
and B, and the office of institutional research at site C administered the online survey through a
different web host.
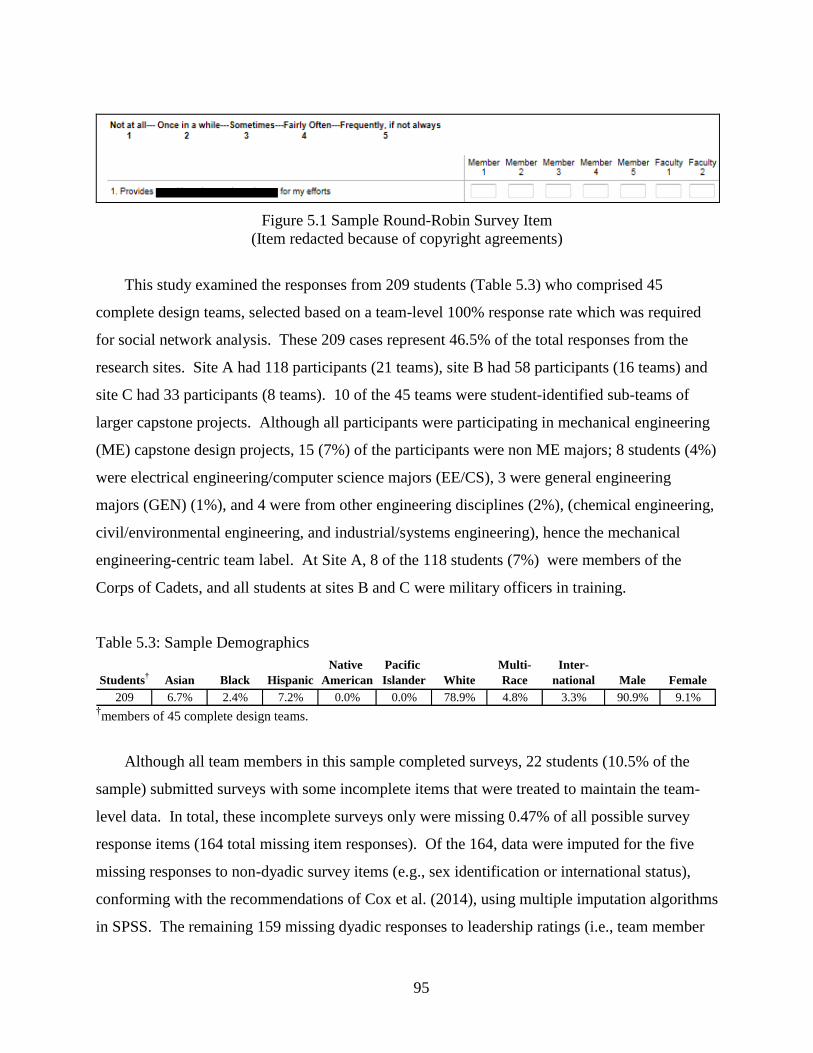
95
Figure 5.1 Sample Round-Robin Survey Item
(Item redacted because of copyright agreements)
This study examined the responses from 209 students (Table 5.3) who comprised 45
complete design teams, selected based on a team-level 100% response rate which was required
for social network analysis. These 209 cases represent 46.5% of the total responses from the
research sites. Site A had 118 participants (21 teams), site B had 58 participants (16 teams) and
site C had 33 participants (8 teams). 10 of the 45 teams were student-identified sub-teams of
larger capstone projects. Although all participants were participating in mechanical engineering
(ME) capstone design projects, 15 (7%) of the participants were non ME majors; 8 students (4%)
were electrical engineering/computer science majors (EE/CS), 3 were general engineering
majors (GEN) (1%), and 4 were from other engineering disciplines (2%), (chemical engineering,
civil/environmental engineering, and industrial/systems engineering), hence the mechanical
engineering-centric team label. At Site A, 8 of the 118 students (7%) were members of the
Corps of Cadets, and all students at sites B and C were military officers in training.
Table 5.3: Sample Demographics
Students†
Asian Black Hispanic
Native
American
Pacific
Islander White
Multi-
Race
Inter-
national Male Female
209 6.7% 2.4% 7.2% 0.0% 0.0% 78.9% 4.8% 3.3% 90.9% 9.1%†members of 45 complete design teams.
Although all team members in this sample completed surveys, 22 students (10.5% of the
sample) submitted surveys with some incomplete items that were treated to maintain the team-
level data. In total, these incomplete surveys only were missing 0.47% of all possible survey
response items (164 total missing item responses). Of the 164, data were imputed for the five
missing responses to non-dyadic survey items (e.g., sex identification or international status),
conforming with the recommendations of Cox et al. (2014), using multiple imputation algorithms
in SPSS. The remaining 159 missing dyadic responses to leadership ratings (i.e., team member
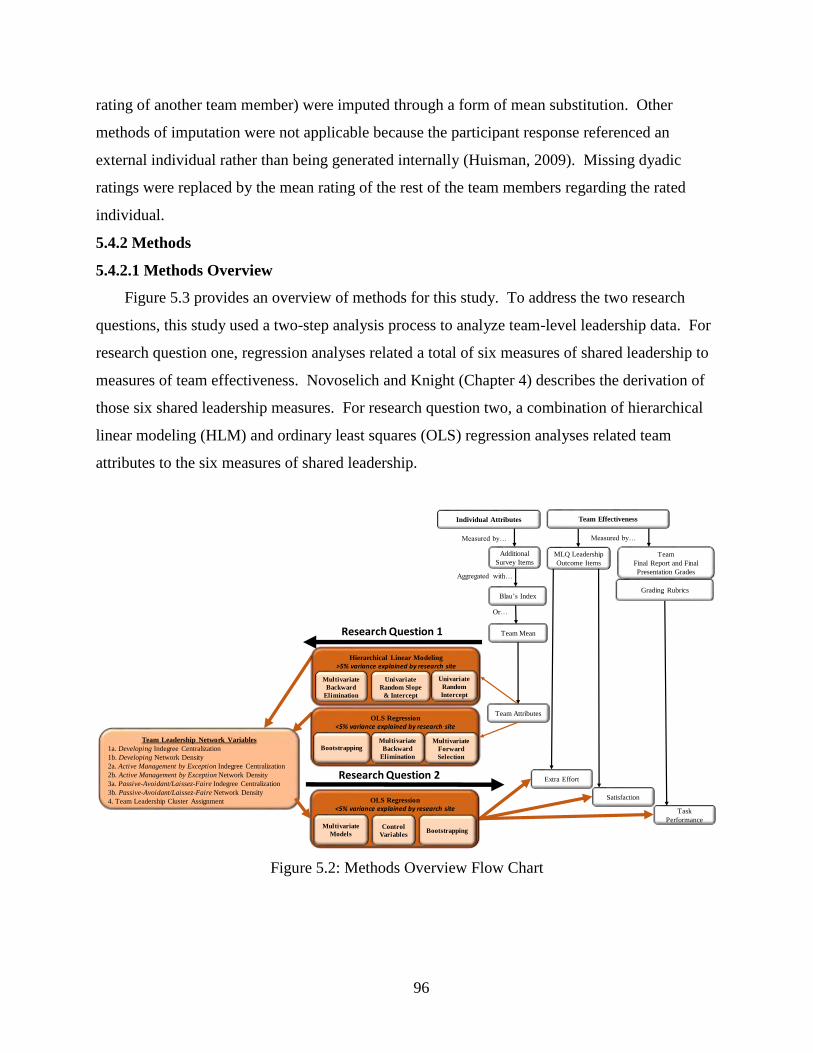
96
rating of another team member) were imputed through a form of mean substitution. Other
methods of imputation were not applicable because the participant response referenced an
external individual rather than being generated internally (Huisman, 2009). Missing dyadic
ratings were replaced by the mean rating of the rest of the team members regarding the rated
individual.
5.4.2 Methods
5.4.2.1 Methods Overview
Figure 5.3 provides an overview of methods for this study. To address the two research
questions, this study used a two-step analysis process to analyze team-level leadership data. For
research question one, regression analyses related a total of six measures of shared leadership to
measures of team effectiveness. Novoselich and Knight (Chapter 4) describes the derivation of
those six shared leadership measures. For research question two, a combination of hierarchical
linear modeling (HLM) and ordinary least squares (OLS) regression analyses related team
attributes to the six measures of shared leadership.
Team Leadership Network Variables
1a. Developing Indegree Centralization
1b. Developing Network Density
2a. Active Management by Exception Indegree Centralization
2b. Active Management by Exception Network Density
3a. Passive-Avoidant/Laissez-Faire Indegree Centralization
3b. Passive-Avoidant/Laissez-Faire Network Density
4. Team Leadership Cluster Assignment
Individual Attributes
Additional
Survey Items
Measured by…
Aggregated with…
Blau’s Index
Team Mean
Or…
Team Attributes
Team Effectiveness
Measured by…
MLQ Leadership
Outcome Items
Team
Final Report and Final
Presentation Grades
Extra Effort
Satisfaction
Task
Performance
Grading Rubrics
Hierarchical Linear Modeling
>5% variance explained by research site
Univariate
Random
Intercept
Univariate
Random Slope
& Intercept
Multivariate
Backward
Elimination
OLS Regression
<5% variance explained by research site
Multivariate
Backward
Elimination
Bootstrapping
OLS Regression
<5% variance explained by research site
BootstrappingMultivariate
ModelsControl
Variables
Research Question 1
Research Question 2
Multivariate
Forward
Selection
Figure 5.2: Methods Overview Flow Chart
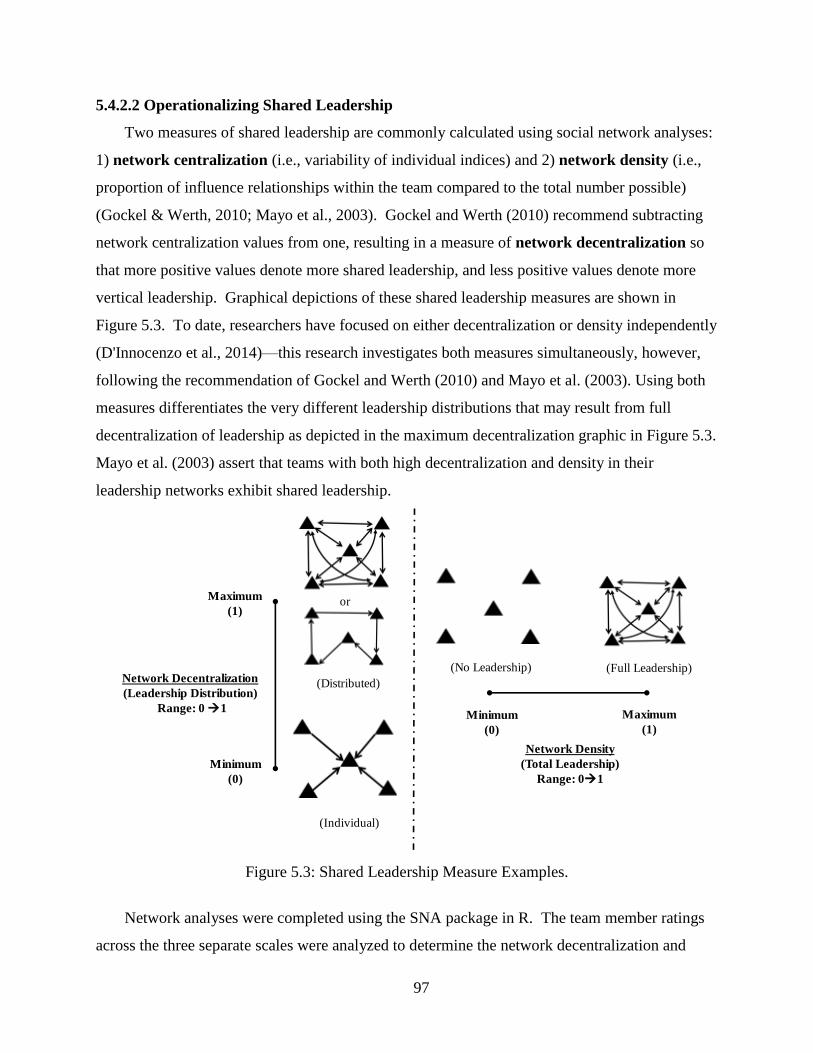
97
5.4.2.2 Operationalizing Shared Leadership
Two measures of shared leadership are commonly calculated using social network analyses:
1) network centralization (i.e., variability of individual indices) and 2) network density (i.e.,
proportion of influence relationships within the team compared to the total number possible)
(Gockel & Werth, 2010; Mayo et al., 2003). Gockel and Werth (2010) recommend subtracting
network centralization values from one, resulting in a measure of network decentralization so
that more positive values denote more shared leadership, and less positive values denote more
vertical leadership. Graphical depictions of these shared leadership measures are shown in
Figure 5.3. To date, researchers have focused on either decentralization or density independently
(D'Innocenzo et al., 2014)—this research investigates both measures simultaneously, however,
following the recommendation of Gockel and Werth (2010) and Mayo et al. (2003). Using both
measures differentiates the very different leadership distributions that may result from full
decentralization of leadership as depicted in the maximum decentralization graphic in Figure 5.3.
Mayo et al. (2003) assert that teams with both high decentralization and density in their
leadership networks exhibit shared leadership.
Network Decentralization
(Leadership Distribution)
Range: 0 1
Network Density
(Total Leadership)
Range: 01
Maximum
(1)
Minimum
(0)
(Individual)
(Distributed)
(No Leadership) (Full Leadership)
or
Minimum
(0)
Maximum
(1)
Figure 5.3: Shared Leadership Measure Examples.
Network analyses were completed using the SNA package in R. The team member ratings
across the three separate scales were analyzed to determine the network decentralization and
98
network density for each of the three forms of leadership, resulting in a total of six shared
leadership measures: TCR decentralization, TCR density, MEA decentralization, MEA density,
PA decentralization, and PA density (see Table 5.4).
Table 5.4: Shared Leadership (Independent) Variable Descriptive Statistics
Statistic Std. Error Statistic Std. Error
TCR Decentralization 45 0.25 1.00 0.68 0.19 -0.49 0.35 -0.51 0.69
TCR Density 45 0.25 0.80 0.63 0.14 -0.69 0.35 -0.16 0.69
Interaction TCR
Decentralization-Density45 0.09 0.80 0.44 0.18 -0.17 0.35 -0.67 0.69
MEA Decentralization 45 0.22 0.94 0.73 0.17 -1.02 0.35 0.67 0.69
MEA Density 45 0.05 0.67 0.35 0.14 0.07 0.35 -0.64 0.69
Interaction MEA
Decentralization-Density45 0.04 0.49 0.25 0.11 0.17 0.35 -0.67 0.69
PA Decentralization 45 0.25 1.00 0.84 0.19 -1.26 0.35 1.31 0.69
PA Density 45 0.00 0.36 0.05 0.07 2.30 0.35 7.42 0.69
Interaction PA
Decentralization-Density45 0.00 0.23 0.03 0.04 2.37 0.35 8.10 0.69
Skewness KurtosisN Minimum Maximum Mean
Std.
Deviation
5.4.2.3 Operationalizing Team Effectiveness
We operationalized team effectiveness using a combination of measures. Team
effectiveness is often categorized as a team’s success in the accomplishment of assigned tasks in
addition to a positive collaborative experience that leaves team members satisfied with the
experience (Borrego, Karlin, et al., 2013; Hackman, 1990; Wageman, 2001). Wageman (2001)
cites Hackman (1990) in her definition of three components of team effectiveness which are
summarized in Table 5.5.
Table 5.5: Team Effectiveness Components from (Wageman, 2001)
Effectiveness
Component Definition
Group
Process
The degree to which members interact in ways that allow the team to work
increasingly well together over time.
Individual
Satisfaction
The degree to which the group experience, on balance, is more satisfying than
frustrating to team members.
Task
Performance
The degree to which the team’s product or service meets the needs of those that
use it.
This combination of team effectiveness measures has parallels to common outcomes
assessment of capstone design teams. Capstone faculty members often discuss product (i.e.,
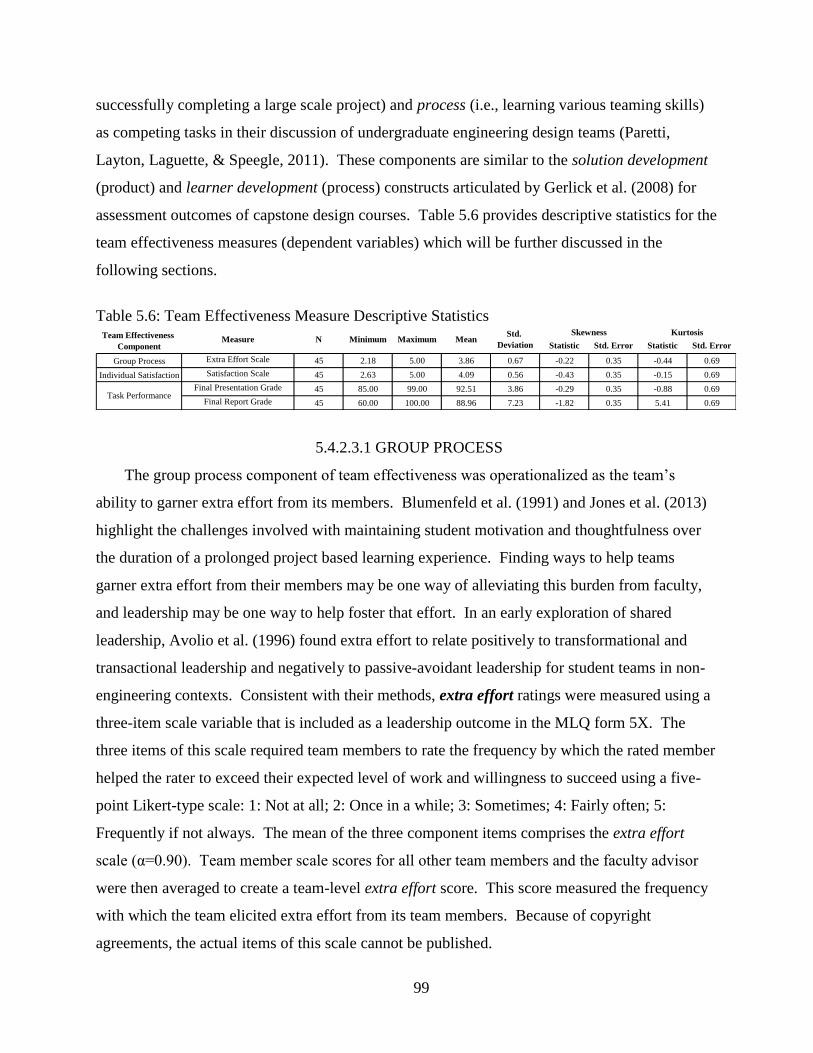
99
successfully completing a large scale project) and process (i.e., learning various teaming skills)
as competing tasks in their discussion of undergraduate engineering design teams (Paretti,
Layton, Laguette, & Speegle, 2011). These components are similar to the solution development
(product) and learner development (process) constructs articulated by Gerlick et al. (2008) for
assessment outcomes of capstone design courses. Table 5.6 provides descriptive statistics for the
team effectiveness measures (dependent variables) which will be further discussed in the
following sections.
Table 5.6: Team Effectiveness Measure Descriptive Statistics
Statistic Std. Error Statistic Std. Error
Group Process Extra Effort Scale 45 2.18 5.00 3.86 0.67 -0.22 0.35 -0.44 0.69
Individual Satisfaction Satisfaction Scale 45 2.63 5.00 4.09 0.56 -0.43 0.35 -0.15 0.69
Final Presentation Grade 45 85.00 99.00 92.51 3.86 -0.29 0.35 -0.88 0.69
Final Report Grade 45 60.00 100.00 88.96 7.23 -1.82 0.35 5.41 0.69
MeasureSkewness Kurtosis
N Minimum Maximum MeanStd.
DeviationTeam Effectiveness
Component
Task Performance
5.4.2.3.1 GROUP PROCESS
The group process component of team effectiveness was operationalized as the team’s
ability to garner extra effort from its members. Blumenfeld et al. (1991) and Jones et al. (2013)
highlight the challenges involved with maintaining student motivation and thoughtfulness over
the duration of a prolonged project based learning experience. Finding ways to help teams
garner extra effort from their members may be one way of alleviating this burden from faculty,
and leadership may be one way to help foster that effort. In an early exploration of shared
leadership, Avolio et al. (1996) found extra effort to relate positively to transformational and
transactional leadership and negatively to passive-avoidant leadership for student teams in non-
engineering contexts. Consistent with their methods, extra effort ratings were measured using a
three-item scale variable that is included as a leadership outcome in the MLQ form 5X. The
three items of this scale required team members to rate the frequency by which the rated member
helped the rater to exceed their expected level of work and willingness to succeed using a five-
point Likert-type scale: 1: Not at all; 2: Once in a while; 3: Sometimes; 4: Fairly often; 5:
Frequently if not always. The mean of the three component items comprises the extra effort
scale (α=0.90). Team member scale scores for all other team members and the faculty advisor
were then averaged to create a team-level extra effort score. This score measured the frequency
with which the team elicited extra effort from its team members. Because of copyright
agreements, the actual items of this scale cannot be published.
100
5.4.2.3.2 INDIVIDUAL SATISFACTION
The individual satisfaction component of team effectiveness was operationalized as the
team’s overall satisfaction with the leadership and teamwork of its members. Satisfaction with
the learning environment has been shown to strongly correlate with students’ effort and
achievement. At the university level, Pace (1983) found that, “students who were the most
satisfied with college put the most into it and got the most out of it.” (Pace, 1983, p. 33). Studies
have also shown that students’ satisfaction with collaborative learning experiences positively
affect subjective measures of their learning (e.g., Lo, 2010). Examining student satisfaction with
the teaming experience can provide indications as to whether that teaming experience is
conducive to a positive learning environment.
Avolio et al. (1996) also found team member satisfaction to relate positively to levels of
transformational and transactional leadership and negatively relate to passive-avoidant leadership
for student teams in non-engineering contexts. Consistent with their methods, team member
satisfaction ratings in this research were measured using a two-item scale variable (α=0.87) that
is part of the MLQ form 5X. The two items of this scale required team members to rate the
frequency by which the rated member worked with and led the rater in satisfactory ways using a
five-point Likert-type scale: 1: Not at all; 2: Once in a while; 3: Sometimes; 4: Fairly often; 5:
Frequently if not always. Team member scale scores for all other team members and the faculty
advisor were averaged to create a team-level satisfaction score. This score measured the
frequency by which the team members were satisfied with the leadership and teamwork enacted
by its members. As with the previous measures, actual items cannot be published because of
copyright reasons.
5.4.2.3.3 TASK PERFORMANCE
The task performance component of team effectiveness was operationalized as the team’s
performance on their final design presentation and design report as measured by course grades.
The use of final project grades as a measure of task performance is consistent with Zafft et al.
(2009), who used final design project grades to measure team performance in their study of
leadership in student design teams. Including final design presentation grades as a second
measure of task performance follows Brackin and Gibson (2002), who assert the inadequacy of
the design report to evaluate both teaming skills and technical skills. The design presentation
was specifically chosen as a second measure because of the incorporation of industry
101
professionals into the evaluation process at all three research sites, which provides a different
perspective on the team’s performance.
A number of steps were taken to verify that using team grades as a measure of course
performance across the three institutions was appropriate. Because the teams were nested in
separate institutions with a separate grading rubrics, there was a concern that the teams’ grades
were measuring different things and would not be comparable across the three research sites. To
mitigate this potential, we used a combination of rubric theme comparison and grade
transformation to z scores, consistent with Stump, Husman, and Corby (2014), to ensure
comparability of the grades. Appendix E provides a detailed comparison of the course
requirements and associated grading rubrics for the presentation and report assignments as well
as z score transformation.
5.4.2.3.4 CONTROL VARIABLES
To account for potential relationships that may provide alternate explanations of team
effectiveness, we controlled for team size, team engineering GPA, team engineering GPA
diversity, team sex, and team leadership skills. Although not an exhaustive list of alternate
potential explanations of team effectiveness, the sample size of design teams included in the data
set limited the number of variables that could be included in regression analyses. We
specifically considered these variables because of the statistically significant relationships
between these variables with measures of shared leadership for capstone design teams, which
will be described in the team level variables section of this manuscript.
5.4.2.4 Relating Shared Leadership to Team Effectiveness (Research Question 1)
We used ordinary least squares (OLS) regression to address RQ1. Consistent with the
recommendations of Keith (2006), we investigated the main effects and interaction effects of the
density and decentralization measures across the TCR, MEA, and PA networks for each team
effectiveness dependent variable. Models with statistically significant main or interaction effects
were then aggregated into more complex models. The parsimonious models were then evaluated
with the inclusion of control variables to determine if the relationships held while controlling for
other potential explanations of team effectiveness.
We also used a follow-up bootstrapping analysis to evaluate the statistical significance of the
relationships determined through OLS analysis. Bootstrapping is a resampling technique applied
for data sets with small sample sizes that creates random sets from the original data using
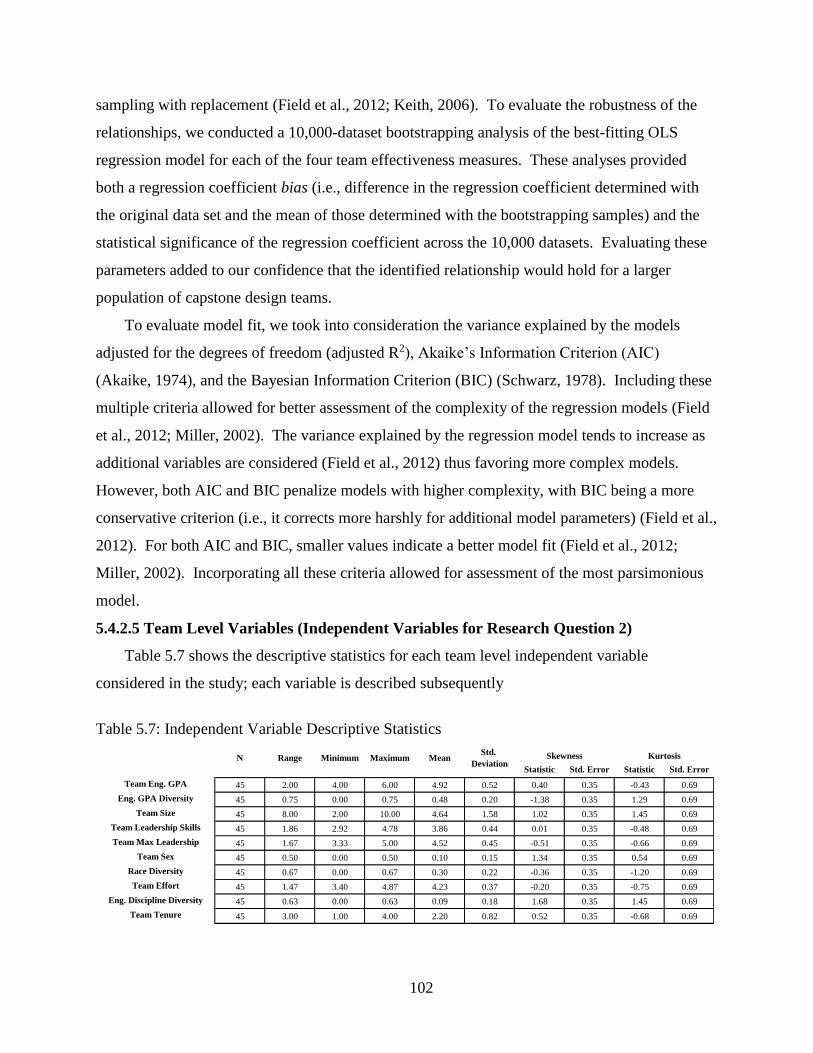
102
sampling with replacement (Field et al., 2012; Keith, 2006). To evaluate the robustness of the
relationships, we conducted a 10,000-dataset bootstrapping analysis of the best-fitting OLS
regression model for each of the four team effectiveness measures. These analyses provided
both a regression coefficient bias (i.e., difference in the regression coefficient determined with
the original data set and the mean of those determined with the bootstrapping samples) and the
statistical significance of the regression coefficient across the 10,000 datasets. Evaluating these
parameters added to our confidence that the identified relationship would hold for a larger
population of capstone design teams.
To evaluate model fit, we took into consideration the variance explained by the models
adjusted for the degrees of freedom (adjusted R2), Akaike’s Information Criterion (AIC)
(Akaike, 1974), and the Bayesian Information Criterion (BIC) (Schwarz, 1978). Including these
multiple criteria allowed for better assessment of the complexity of the regression models (Field
et al., 2012; Miller, 2002). The variance explained by the regression model tends to increase as
additional variables are considered (Field et al., 2012) thus favoring more complex models.
However, both AIC and BIC penalize models with higher complexity, with BIC being a more
conservative criterion (i.e., it corrects more harshly for additional model parameters) (Field et al.,
2012). For both AIC and BIC, smaller values indicate a better model fit (Field et al., 2012;
Miller, 2002). Incorporating all these criteria allowed for assessment of the most parsimonious
model.
5.4.2.5 Team Level Variables (Independent Variables for Research Question 2)
Table 5.7 shows the descriptive statistics for each team level independent variable
considered in the study; each variable is described subsequently
Table 5.7: Independent Variable Descriptive Statistics
Statistic Std. Error Statistic Std. Error
Team Eng. GPA 45 2.00 4.00 6.00 4.92 0.52 0.40 0.35 -0.43 0.69
Eng. GPA Diversity 45 0.75 0.00 0.75 0.48 0.20 -1.38 0.35 1.29 0.69
Team Size 45 8.00 2.00 10.00 4.64 1.58 1.02 0.35 1.45 0.69
Team Leadership Skills 45 1.86 2.92 4.78 3.86 0.44 0.01 0.35 -0.48 0.69
Team Max Leadership 45 1.67 3.33 5.00 4.52 0.45 -0.51 0.35 -0.66 0.69
Team Sex 45 0.50 0.00 0.50 0.10 0.15 1.34 0.35 0.54 0.69
Race Diversity 45 0.67 0.00 0.67 0.30 0.22 -0.36 0.35 -1.20 0.69
Team Effort 45 1.47 3.40 4.87 4.23 0.37 -0.20 0.35 -0.75 0.69
Eng. Discipline Diversity 45 0.63 0.00 0.63 0.09 0.18 1.68 0.35 1.45 0.69
Team Tenure 45 3.00 1.00 4.00 2.20 0.82 0.52 0.35 -0.68 0.69
Std.
DeviationSkewness KurtosisN Range Minimum Maximum Mean
103
To characterize teams based on continuous (e.g., self-reported leadership skills) or
dichotomous (e.g., sex) attributes, the team average score on the associated scale variable or
individual survey item was used. For variables that included multiple categories (e.g.,
engineering discipline), indices of diversity were used to measure differences within teams.
Previous studies have used Blau’s Index for Diversity (Blau, 1977) to provide characterization of
teams based on team member categorical differences. Small and Rentsch (2010), for example,
used Blau’s index for control variables in their social network study of student business teams.
Because Blau’s index has been successfully used in previous student team social network
leadership studies, Blau’s index was used for this study to allow for comparison of findings.
Blau (1977) specifies the calculation of his diversity index as:
[5.1]
In Equation 5.1, pi is the proportion of group members in the ith category, and k is the total
number of categories for the attribute of interest. This variable measures heterogeneity regarding
grouping categories ranging from zero to one; teams with a Blau’s index of zero would be
homogeneous in one particular category (e.g., an all-Hispanic team), and teams with a Blau’s
index of one would show equal representation across all group categories.
Measurement of a student’s engineering GPA took the form of student self-reported grades
in their engineering specific courses. Previous studies have indicated that self-reported GPA
provides a reasonable proxy for students’ engineering discipline performance (e.g., Schlemer &
Waldorf, 2010; Watson, 1998). A categorical item on the survey gathered this information, as
follows: 1.49 or below (Below C-), 1.50-1.99 (C- to C), 2.00-2.49 (C to B-), 2.50-2.99 (B- to B),
3.00-3.49 (B to A-), and 3.50-4.00 (A- to A). The team engineering GPA variable is the team-
wide average of student responses and provides an overall level of engineering course
performance for the team. The engineering GPA diversity variable determined the heterogeneity
of engineering GPAs across the team.
Team size refers to the number of students assigned to each design team. This variable was
determined based on the student team rosters established in the course at the beginning of the
Fall semester and was verified through a tally of survey responses. For large teams greater than
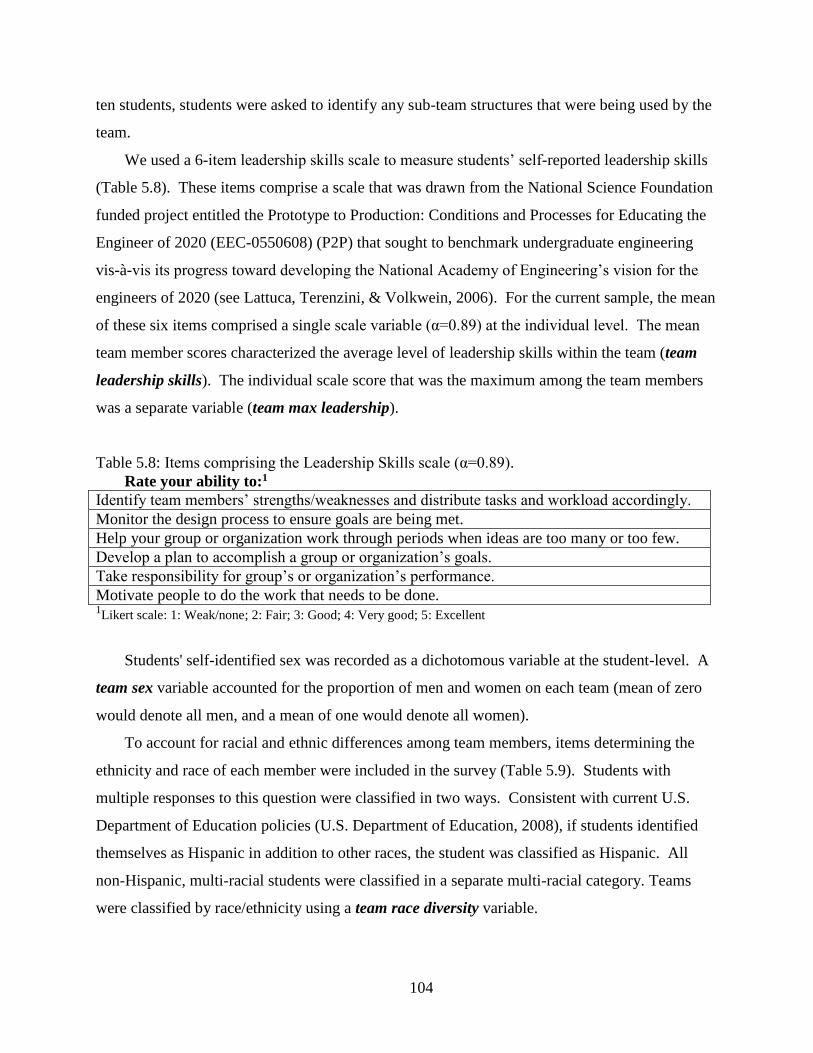
104
ten students, students were asked to identify any sub-team structures that were being used by the
team.
We used a 6-item leadership skills scale to measure students’ self-reported leadership skills
(Table 5.8). These items comprise a scale that was drawn from the National Science Foundation
funded project entitled the Prototype to Production: Conditions and Processes for Educating the
Engineer of 2020 (EEC-0550608) (P2P) that sought to benchmark undergraduate engineering
vis-à-vis its progress toward developing the National Academy of Engineering’s vision for the
engineers of 2020 (see Lattuca, Terenzini, & Volkwein, 2006). For the current sample, the mean
of these six items comprised a single scale variable (α=0.89) at the individual level. The mean
team member scores characterized the average level of leadership skills within the team (team
leadership skills). The individual scale score that was the maximum among the team members
was a separate variable (team max leadership).
Table 5.8: Items comprising the Leadership Skills scale (α=0.89).
Rate your ability to:1
Identify team members’ strengths/weaknesses and distribute tasks and workload accordingly.
Monitor the design process to ensure goals are being met.
Help your group or organization work through periods when ideas are too many or too few.
Develop a plan to accomplish a group or organization’s goals.
Take responsibility for group’s or organization’s performance.
Motivate people to do the work that needs to be done. 1Likert scale: 1: Weak/none; 2: Fair; 3: Good; 4: Very good; 5: Excellent
Students' self-identified sex was recorded as a dichotomous variable at the student-level. A
team sex variable accounted for the proportion of men and women on each team (mean of zero
would denote all men, and a mean of one would denote all women).
To account for racial and ethnic differences among team members, items determining the
ethnicity and race of each member were included in the survey (Table 5.9). Students with
multiple responses to this question were classified in two ways. Consistent with current U.S.
Department of Education policies (U.S. Department of Education, 2008), if students identified
themselves as Hispanic in addition to other races, the student was classified as Hispanic. All
non-Hispanic, multi-racial students were classified in a separate multi-racial category. Teams
were classified by race/ethnicity using a team race diversity variable.

105
Table 5.9: Student Ethnicity/Race Survey Items
Question Response Options
Are you Hispanic or Latino? Hispanic/Latino
Not Hispanic/Latino
What is your race? Choose one or more
regardless of ethnicity.
American Indian or Alaskan Native
Asian
Black or African American
Native Hawaiian/Other Pacific Islander
White
To measure students' self-reported perceptions of project effort, we used an adaptation of the
5-item work effort scale employed by (Godard, 2001) in their study of the Canadian workforce.
Table 5.10 provides a summary of the original version and modified items that were used in this
study to quantify team member project effort. The original survey items formed a scale (α=0.78)
measuring the degree to which individuals report effort in the performance of their work. For
this study, the mean scores of the five adapted questions, which measure effort in their
performance on the design project, comprised a single scale variable with high internal
consistency (α=0.92). The team-level mean measured team effort.
Table 5.10: Team member effort questions adapted from (Godard, 2001). Original Question Adapted Question1
You always put as much effort as possible into your
work.
I always put as much effort as possible into my work
on this design project.
You are highly committed to do the best job you can. I am highly committed to do the best job I can on this
design project.
For you, a good day at work is one in which you have
performed to your utmost.
To me, a good work day is one in which I have
performed to my utmost.
You try to work as hard as you can. I try to work as hard as I can on this design project.
You intentionally expend a great deal of effort in doing
your job.
I intentionally expend a great deal of effort on my
academic work. 1Likert Scale: 1: Strongly Disagree; 2: Disagree; 3: Neither Agree nor Disagree; 4: Agree; 5: Strongly Agree
To account for engineering disciplinary differences among team members, an item
determining the engineering major of each member was included in the survey. Responses to
this question were aggregated into larger groupings of similar engineering major (e.g., EE/CS)
and an expanded Other category that included students there were not included in the ME, GEN,
or EE/CS categories). Teams were characterized using an engineering discipline diversity
variable.
106
An item regarding prior work experience among team members and with the faculty advisor
collected information about team tenure. Each team member was asked: “Rate the extent to
which you have worked with each team mate prior to this teaming experience,” with the
following options: 1: Not at all; 2: Once in a while; 3: Sometimes; 4: Fairly often; 5: Frequently
if not always. The team tenure variable accounted for the average amount of time students had
worked together prior to the current design team experience using the mean response across all
dyadic ratings.
5.4.2.6 Research Question 2 Analyses
To relate the degree of shared leadership within the teams to team level attributes for
addressing research question two, we used a combination of ordinary least squares (OLS)
regression and Hierarchical Linear Modeling (HLM). Because the 45 teams analyzed in this
study were nested within three separate sites (A, B, and C), there was a potential to violate the
case independence assumption of regression. If a significant level of variance can be explained
by the site in which the team is nested, the cases cannot be considered independent (Field et al.,
2012; Paterson & Goldstein, 1991; Raudenbush & Bryk, 2002; Snijders & Bosker, 2012). For
example, teams may have had different levels of leadership training across sites that would affect
the relationship between shared leadership and team level attributes. HLM allows the intercept
and slope of the level 1 (i.e., team) model to vary by level 2 groupings (i.e., site) (see
Raudenbush and Bryk (2002) or Snijders and Bosker (2012) for a full description of the method).
As subsequently described, the level of variance explained by level 2 groupings (site) warranted
HLM for TCR decentralization and TCR density.
Analysis proceeded by first considering only univariate, fixed effects models with random
intercepts for each independent variable. Those models with significant fixed effects were then
further analyzed using random effects models (i.e., varying slope and intercept). Finally, those
variables with significant relationships were combined using backward elimination to elucidate
the significant relationships while controlling for the effects of the other variables.
For all hierarchical linear modeling analyses, the independent variables were centered on the
grand mean because the study focused on the relationships between team level attributes and
shared leadership measures (Field et al., 2012). Grand mean centering was used because model
results are consistent with those that are obtained using raw variable scores, and the models are
more readily interpretable, especially when random slope models are considered (Field et al.,
107
2012). A consequence of this centering is that the intercepts for these models do not correspond
with a team exhibiting zero values of the independent variables, but rather an average value
across those variables (Dedrick et al., 2009; Field et al., 2012).
To evaluate model fit, the variance explained by the models, adjusted for the degrees of
freedom (adjusted R2), Akaike’s Information Criterion (AIC) (Akaike, 1974), and the Bayesian
Information Criterion (BIC) (Schwarz, 1978) were all taken into consideration. Including these
multiple criteria allowed for better assessment of the complexity of the regression models
evaluated (Field et al., 2012; Miller, 2002). These analyses used the level 1 variance explained
value (pseudo R2) by Raudenbush and Bryk (2002) because the multiple random effects
incorporated into HLM models make conventional R2 calculations inappropriate (Luo & Azen,
2013). The variance explained by the regression model tends to increase as additional variables
are considered (Field et al., 2012), thus favoring more complex models. As previously noted,
however, both AIC and BIC penalize models with more complexity; smaller values indicate a
better model fit (Field et al., 2012; Miller, 2002). Incorporating all these criteria allowed for
assessment of a parsimonious model (i.e., least complex) that explained the most variance in the
dependent variable.
To analyze the MEA and PA decentralization and density, HLM was not required because a
negligible amount of variance was explained by research site differences. Instead, we used OLS
regression to examine the relationships between team level attributes and MEA decentralization,
MEA density, PA decentralization, and PA density. We performed a combination of stepwise
regression and backward elimination of all independent variables to determine the most
parsimonious model. In stepwise regression, the independent variables are sequentially added to
the model if they are below a threshold criterion to enter the model; once added, are retained in
the model only if they remain below a deletion criterion (Howell, 2013; Miller, 2002).
Backward elimination works in the opposite direction from stepwise regression; all variables are
entered into the model and then sequentially removed. Removal proceeds sequentially based on
the smallest partial correlation with the dependent variable until no variables meet the removal
criterion (Howell, 2013; Miller, 2002). For these analyses, the test criteria were set at p=0.05 to
enter and p=0.10 to remove. Using both selection methods to explore appropriate models was
informed by Miller (2002), who explains the limitations of each method when performed
separately, and Broersen (1986), who proposes a method that uses backward elimination on a
108
completed stepwise regression model to determine the parsimonious model. Unlike Broersen’s
(1986) process, however, because stepwise regression did not identify any statistically significant
relationships for PA density or decentralization from which to begin building more complex
models, backward elimination was performed using all independent variables to identify any
significant relationships (Howell, 2013). Tests were performed using the STEPWISE and
BACKWARD procedures in SPSS v23. 8 Similar to the HLM models, the multiple OLS models
were evaluated using a combination of model variance explained (adjusted R2), AIC, and BIC to
determine the parsimonious model for the given dependent variable. We also used a follow-up
bootstrapping procedure to evaluate the statistical significance of the relationships determined
through OLS analysis.
5.4.3 Limitations
Several limitations should be acknowledged when interpreting the results. First, the 45 team
sample represents a relatively small sample size with which to investigate relationships among
the independent and dependent variables (Miller, 2002). This limited sample can be attributed to
the challenges inherent to collecting full-team network data from students (Grunspan et al.,
2014). Ideally, the significant relationships determined through exploratory analysis in this
paper should be tested on another set of data (Miller, 2002); however, all cases were required to
conduct the exploratory analysis. The study uses bootstrapping to strengthen the robustness of
regression findings to help mitigate the low sample size. Despite this limitation, this relatively
small number of teams still exceeds the sample size of other benchmark studies of shared
leadership for engineering design teams; Zafft et al. (2009), for example, analyzed only seven
teams in their quantitative study.
Second, this study focuses mainly in the mechanical engineering discipline and with senior-
level engineering students at only three research sites. As a result, generality claims to the wider
field of engineering across multiple disciplines, class years, institutions and to professional
practice contexts are unwarranted.
Third, this study administered a reduced format of the MLQ survey. Although a full
examination of all 36 MLQ leadership descriptive statements was desired, low student response
rates in pilot data collection efforts prompted a decrease in survey length to help bolster survey
8 For clarity, only the backward elimination results are shown as analysis proceeded with all variables under
consideration; the stepwise results are discussed as appropriate.
109
response rates, as discussed in Novoselich and Knight (2015). It is therefore inappropriate to
compare the specific findings of this study to those of other studies that incorporated all 36 MLQ
leadership descriptive statements without acknowledging differences in data collection.
Novoselich and Knight (Chapter 3) acknowledge these concerns in their validation study.
Fourth, there are limitations inherent to the use of survey data. Survey responses require
recollection of events which is subject to memory distortion over prolonged periods (Singleton &
Straits, 2010). As raters of other team members’ leadership behaviors, students may feel
threatened by the survey process (Zafft et al., 2009). Although confidentiality of the survey data
was ensured and explicitly stated in the recruiting and informed consent processes, students may
not have fully trusted the process (Hurley, 1998), especially since the names of all team members
were included on the team-specific surveys to ensure rating accuracy. Consequently, student
ratings may have been inflated to be more socially acceptable (Singleton & Straits, 2010).
Finally, the study did not require faculty advisors to reciprocally rate team members’
leadership. This decision was made to maximize full-team responses; interactions with various
course coordinators and faculty advisors indicated the potential for low faculty member response
rates. Full team responses were required to generate team level ratings of each team member and
for follow-on social network analysis to measure leadership sharing. The exclusion of the
advisor’s rating of the team members is inconsistent with the norms of social network analyses,
creating potential gaps in the leadership networks. This facet of the study design does, however,
reflect the reality that students may not possess the expert or legitimate social power with which
to influence their faculty advisors through leadership actions.
5.5 Results and Discussion
5.5.1 Addressing Research Question 1: Relating Shared Leadership to Team Effectiveness
To determine the appropriate analysis method for relating measures of shared leadership to
team effectiveness, the level of variance explained by level 2 (research site) groupings was
examined. We examined the intra-class correlations of satisfaction and extra effort scale
variables for the 45 teams (level 1) across the three research sites (level 2) (Table 5.11). The
intra-class correlation is determined from a one-way random effects ANOVA, which determines
the amount of variance between level two groupings (τ) and the amount of variance within level
two (σ2). The intra-class coefficient (ρ) is the ratio of level two variance to the total variance
(τ+σ2) (Snijders & Bosker, 2012). Intra-class correlations were calculated using the MIXED
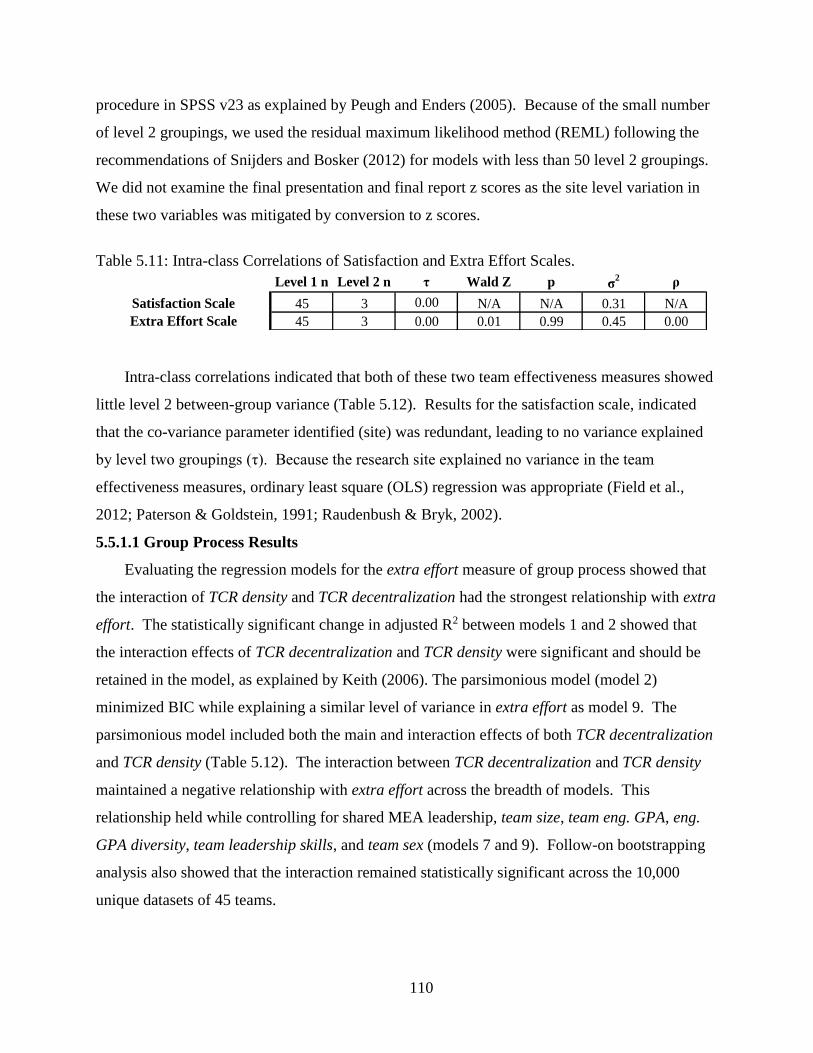
110
procedure in SPSS v23 as explained by Peugh and Enders (2005). Because of the small number
of level 2 groupings, we used the residual maximum likelihood method (REML) following the
recommendations of Snijders and Bosker (2012) for models with less than 50 level 2 groupings.
We did not examine the final presentation and final report z scores as the site level variation in
these two variables was mitigated by conversion to z scores.
Table 5.11: Intra-class Correlations of Satisfaction and Extra Effort Scales.
Level 1 n Level 2 n τ Wald Z p σ2 ρ
Satisfaction Scale 45 3 0.00 N/A N/A 0.31 N/A
Extra Effort Scale 45 3 0.00 0.01 0.99 0.45 0.00
Intra-class correlations indicated that both of these two team effectiveness measures showed
little level 2 between-group variance (Table 5.12). Results for the satisfaction scale, indicated
that the co-variance parameter identified (site) was redundant, leading to no variance explained
by level two groupings (τ). Because the research site explained no variance in the team
effectiveness measures, ordinary least square (OLS) regression was appropriate (Field et al.,
2012; Paterson & Goldstein, 1991; Raudenbush & Bryk, 2002).
5.5.1.1 Group Process Results
Evaluating the regression models for the extra effort measure of group process showed that
the interaction of TCR density and TCR decentralization had the strongest relationship with extra
effort. The statistically significant change in adjusted R2 between models 1 and 2 showed that
the interaction effects of TCR decentralization and TCR density were significant and should be
retained in the model, as explained by Keith (2006). The parsimonious model (model 2)
minimized BIC while explaining a similar level of variance in extra effort as model 9. The
parsimonious model included both the main and interaction effects of both TCR decentralization
and TCR density (Table 5.12). The interaction between TCR decentralization and TCR density
maintained a negative relationship with extra effort across the breadth of models. This
relationship held while controlling for shared MEA leadership, team size, team eng. GPA, eng.
GPA diversity, team leadership skills, and team sex (models 7 and 9). Follow-on bootstrapping
analysis also showed that the interaction remained statistically significant across the 10,000
unique datasets of 45 teams.
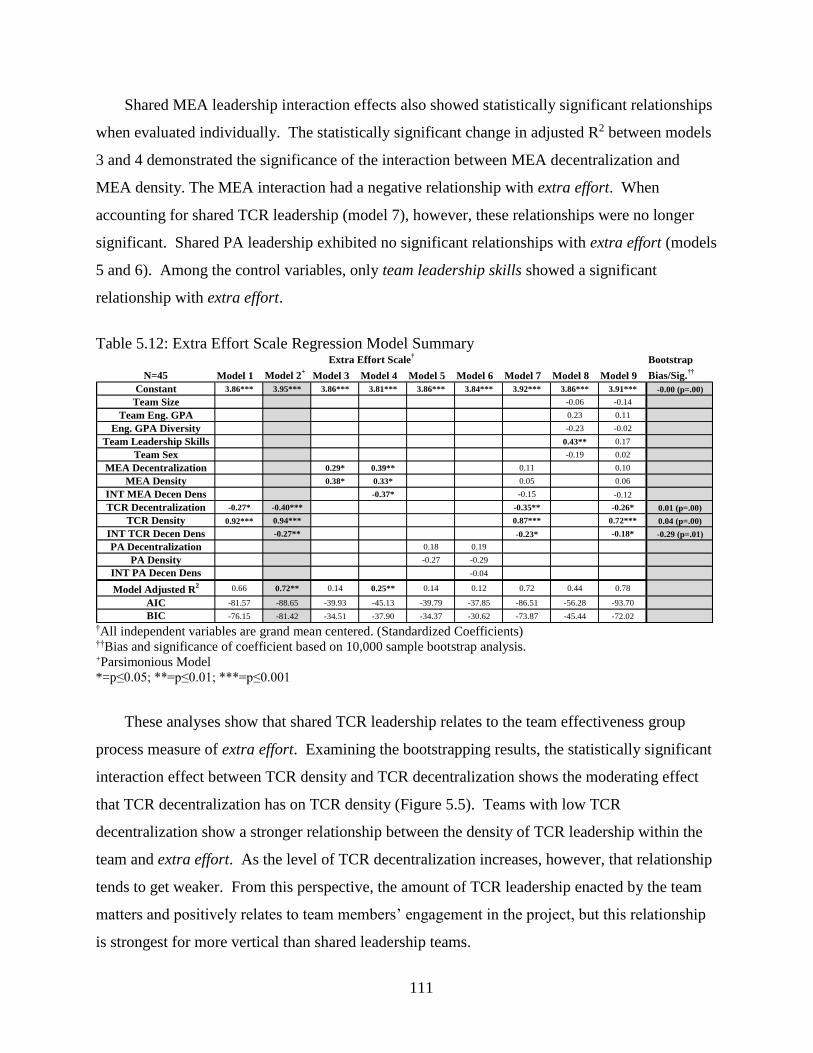
111
Shared MEA leadership interaction effects also showed statistically significant relationships
when evaluated individually. The statistically significant change in adjusted R2 between models
3 and 4 demonstrated the significance of the interaction between MEA decentralization and
MEA density. The MEA interaction had a negative relationship with extra effort. When
accounting for shared TCR leadership (model 7), however, these relationships were no longer
significant. Shared PA leadership exhibited no significant relationships with extra effort (models
5 and 6). Among the control variables, only team leadership skills showed a significant
relationship with extra effort.
Table 5.12: Extra Effort Scale Regression Model Summary Bootstrap
N=45 Model 1 Model 2+
Model 3 Model 4 Model 5 Model 6 Model 7 Model 8 Model 9 Bias/Sig.††
Constant 3.86*** 3.95*** 3.86*** 3.81*** 3.86*** 3.84*** 3.92*** 3.86*** 3.91*** -0.00 (p=.00)
Team Size -0.06 -0.14
Team Eng. GPA 0.23 0.11
Eng. GPA Diversity -0.23 -0.02
Team Leadership Skills 0.43** 0.17
Team Sex -0.19 0.02
MEA Decentralization 0.29* 0.39** 0.11 0.10
MEA Density 0.38* 0.33* 0.05 0.06
INT MEA Decen Dens -0.37* -0.15 -0.12
TCR Decentralization -0.27* -0.40*** -0.35** -0.26* 0.01 (p=.00)
TCR Density 0.92*** 0.94*** 0.87*** 0.72*** 0.04 (p=.00)
INT TCR Decen Dens -0.27** -0.23* -0.18* -0.29 (p=.01)
PA Decentralization 0.18 0.19
PA Density -0.27 -0.29
INT PA Decen Dens -0.04
Model Adjusted R2 0.66 0.72** 0.14 0.25** 0.14 0.12 0.72 0.44 0.78
AIC -81.57 -88.65 -39.93 -45.13 -39.79 -37.85 -86.51 -56.28 -93.70
BIC -76.15 -81.42 -34.51 -37.90 -34.37 -30.62 -73.87 -45.44 -72.02
Extra Effort Scale†
†All independent variables are grand mean centered. (Standardized Coefficients) ††Bias and significance of coefficient based on 10,000 sample bootstrap analysis. +Parsimonious Model
*=p≤0.05; **=p≤0.01; ***=p≤0.001
These analyses show that shared TCR leadership relates to the team effectiveness group
process measure of extra effort. Examining the bootstrapping results, the statistically significant
interaction effect between TCR density and TCR decentralization shows the moderating effect
that TCR decentralization has on TCR density (Figure 5.5). Teams with low TCR
decentralization show a stronger relationship between the density of TCR leadership within the
team and extra effort. As the level of TCR decentralization increases, however, that relationship
tends to get weaker. From this perspective, the amount of TCR leadership enacted by the team
matters and positively relates to team members’ engagement in the project, but this relationship
is strongest for more vertical than shared leadership teams.
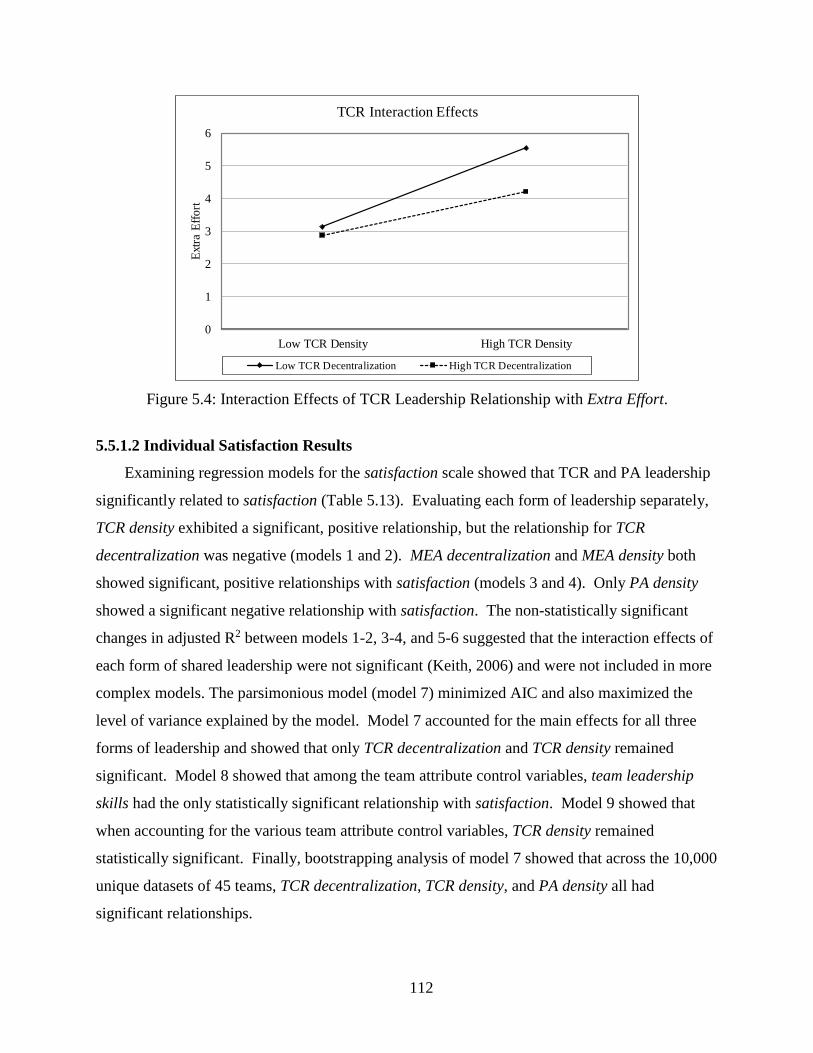
112
0
1
2
3
4
5
6
Low TCR Density High TCR Density
Ext
ra E
ffo
rt
TCR Interaction Effects
Low TCR Decentralization High TCR Decentralization
Figure 5.4: Interaction Effects of TCR Leadership Relationship with Extra Effort.
5.5.1.2 Individual Satisfaction Results
Examining regression models for the satisfaction scale showed that TCR and PA leadership
significantly related to satisfaction (Table 5.13). Evaluating each form of leadership separately,
TCR density exhibited a significant, positive relationship, but the relationship for TCR
decentralization was negative (models 1 and 2). MEA decentralization and MEA density both
showed significant, positive relationships with satisfaction (models 3 and 4). Only PA density
showed a significant negative relationship with satisfaction. The non-statistically significant
changes in adjusted R2 between models 1-2, 3-4, and 5-6 suggested that the interaction effects of
each form of shared leadership were not significant (Keith, 2006) and were not included in more
complex models. The parsimonious model (model 7) minimized AIC and also maximized the
level of variance explained by the model. Model 7 accounted for the main effects for all three
forms of leadership and showed that only TCR decentralization and TCR density remained
significant. Model 8 showed that among the team attribute control variables, team leadership
skills had the only statistically significant relationship with satisfaction. Model 9 showed that
when accounting for the various team attribute control variables, TCR density remained
statistically significant. Finally, bootstrapping analysis of model 7 showed that across the 10,000
unique datasets of 45 teams, TCR decentralization, TCR density, and PA density all had
significant relationships.
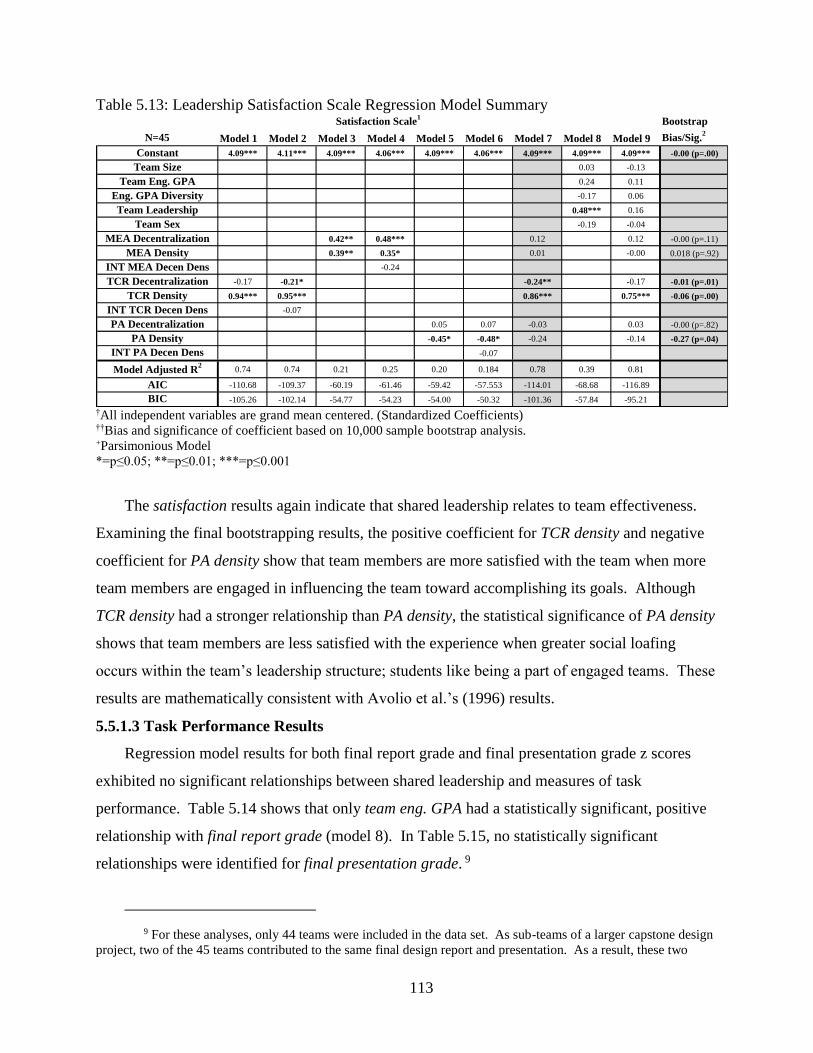
113
Table 5.13: Leadership Satisfaction Scale Regression Model Summary Bootstrap
N=45 Model 1 Model 2 Model 3 Model 4 Model 5 Model 6 Model 7 Model 8 Model 9 Bias/Sig.2
Constant 4.09*** 4.11*** 4.09*** 4.06*** 4.09*** 4.06*** 4.09*** 4.09*** 4.09*** -0.00 (p=.00)
Team Size 0.03 -0.13
Team Eng. GPA 0.24 0.11
Eng. GPA Diversity -0.17 0.06
Team Leadership 0.48*** 0.16
Team Sex -0.19 -0.04
MEA Decentralization 0.42** 0.48*** 0.12 0.12 -0.00 (p=.11)
MEA Density 0.39** 0.35* 0.01 -0.00 0.018 (p=.92)
INT MEA Decen Dens -0.24
TCR Decentralization -0.17 -0.21* -0.24** -0.17 -0.01 (p=.01)
TCR Density 0.94*** 0.95*** 0.86*** 0.75*** -0.06 (p=.00)
INT TCR Decen Dens -0.07
PA Decentralization 0.05 0.07 -0.03 0.03 -0.00 (p=.82)
PA Density -0.45* -0.48* -0.24 -0.14 -0.27 (p=.04)
INT PA Decen Dens -0.07
Model Adjusted R2
0.74 0.74 0.21 0.25 0.20 0.184 0.78 0.39 0.81
AIC -110.68 -109.37 -60.19 -61.46 -59.42 -57.553 -114.01 -68.68 -116.89
BIC -105.26 -102.14 -54.77 -54.23 -54.00 -50.32 -101.36 -57.84 -95.21
Satisfaction Scale1
†All independent variables are grand mean centered. (Standardized Coefficients) ††Bias and significance of coefficient based on 10,000 sample bootstrap analysis. +Parsimonious Model
*=p≤0.05; **=p≤0.01; ***=p≤0.001
The satisfaction results again indicate that shared leadership relates to team effectiveness.
Examining the final bootstrapping results, the positive coefficient for TCR density and negative
coefficient for PA density show that team members are more satisfied with the team when more
team members are engaged in influencing the team toward accomplishing its goals. Although
TCR density had a stronger relationship than PA density, the statistical significance of PA density
shows that team members are less satisfied with the experience when greater social loafing
occurs within the team’s leadership structure; students like being a part of engaged teams. These
results are mathematically consistent with Avolio et al.’s (1996) results.
5.5.1.3 Task Performance Results
Regression model results for both final report grade and final presentation grade z scores
exhibited no significant relationships between shared leadership and measures of task
performance. Table 5.14 shows that only team eng. GPA had a statistically significant, positive
relationship with final report grade (model 8). In Table 5.15, no statistically significant
relationships were identified for final presentation grade. 9
9 For these analyses, only 44 teams were included in the data set. As sub-teams of a larger capstone design
project, two of the 45 teams contributed to the same final design report and presentation. As a result, these two
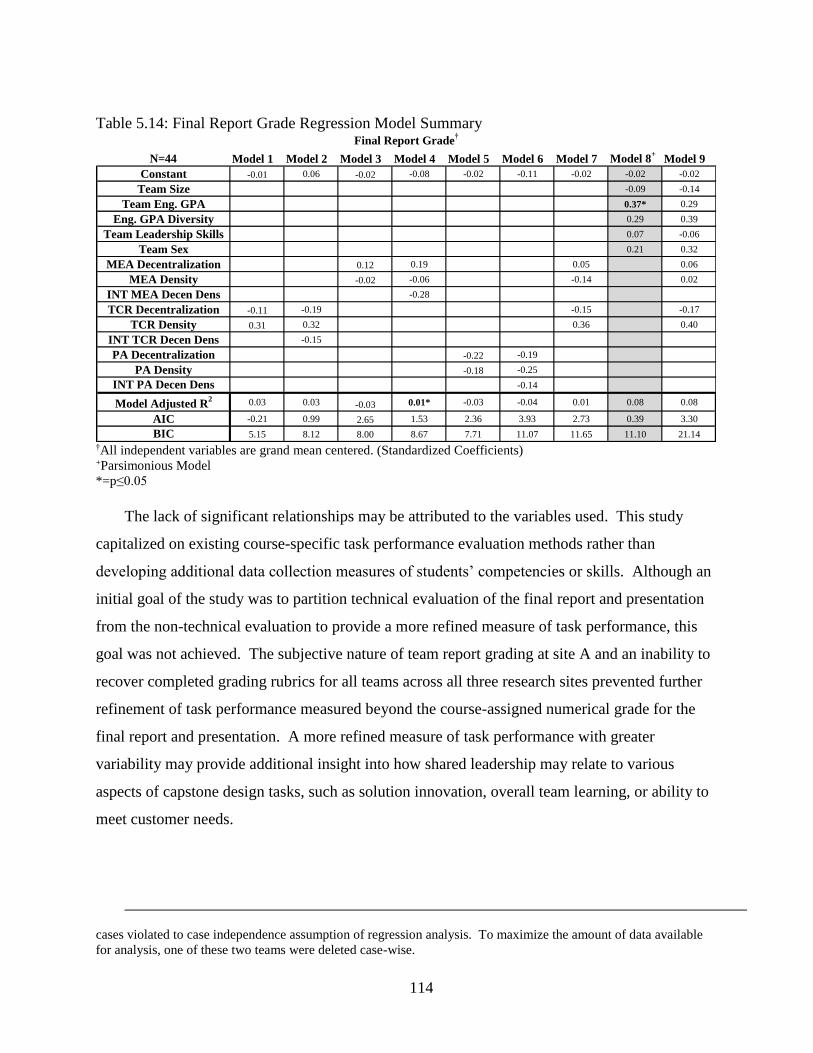
114
Table 5.14: Final Report Grade Regression Model Summary
N=44 Model 1 Model 2 Model 3 Model 4 Model 5 Model 6 Model 7 Model 8+
Model 9
Constant -0.01 0.06 -0.02 -0.08 -0.02 -0.11 -0.02 -0.02 -0.02
Team Size -0.09 -0.14
Team Eng. GPA 0.37* 0.29
Eng. GPA Diversity 0.29 0.39
Team Leadership Skills 0.07 -0.06
Team Sex 0.21 0.32
MEA Decentralization 0.12 0.19 0.05 0.06
MEA Density -0.02 -0.06 -0.14 0.02
INT MEA Decen Dens -0.28
TCR Decentralization -0.11 -0.19 -0.15 -0.17
TCR Density 0.31 0.32 0.36 0.40
INT TCR Decen Dens -0.15
PA Decentralization -0.22 -0.19
PA Density -0.18 -0.25
INT PA Decen Dens -0.14
Model Adjusted R2 0.03 0.03 -0.03 0.01* -0.03 -0.04 0.01 0.08 0.08
AIC -0.21 0.99 2.65 1.53 2.36 3.93 2.73 0.39 3.30
BIC 5.15 8.12 8.00 8.67 7.71 11.07 11.65 11.10 21.14
Final Report Grade†
†All independent variables are grand mean centered. (Standardized Coefficients) +Parsimonious Model
*=p≤0.05
The lack of significant relationships may be attributed to the variables used. This study
capitalized on existing course-specific task performance evaluation methods rather than
developing additional data collection measures of students’ competencies or skills. Although an
initial goal of the study was to partition technical evaluation of the final report and presentation
from the non-technical evaluation to provide a more refined measure of task performance, this
goal was not achieved. The subjective nature of team report grading at site A and an inability to
recover completed grading rubrics for all teams across all three research sites prevented further
refinement of task performance measured beyond the course-assigned numerical grade for the
final report and presentation. A more refined measure of task performance with greater
variability may provide additional insight into how shared leadership may relate to various
aspects of capstone design tasks, such as solution innovation, overall team learning, or ability to
meet customer needs.
cases violated to case independence assumption of regression analysis. To maximize the amount of data available
for analysis, one of these two teams were deleted case-wise.
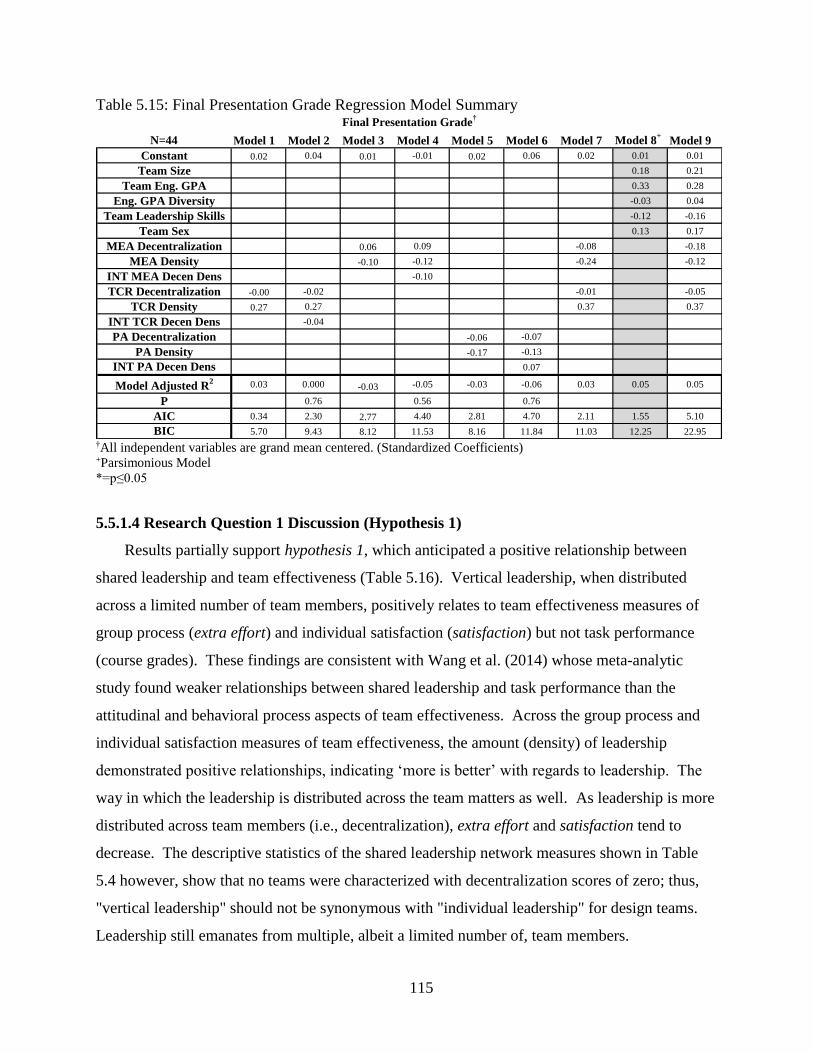
115
Table 5.15: Final Presentation Grade Regression Model Summary
N=44 Model 1 Model 2 Model 3 Model 4 Model 5 Model 6 Model 7 Model 8+
Model 9
Constant 0.02 0.04 0.01 -0.01 0.02 0.06 0.02 0.01 0.01
Team Size 0.18 0.21
Team Eng. GPA 0.33 0.28
Eng. GPA Diversity -0.03 0.04
Team Leadership Skills -0.12 -0.16
Team Sex 0.13 0.17
MEA Decentralization 0.06 0.09 -0.08 -0.18
MEA Density -0.10 -0.12 -0.24 -0.12
INT MEA Decen Dens -0.10
TCR Decentralization -0.00 -0.02 -0.01 -0.05
TCR Density 0.27 0.27 0.37 0.37
INT TCR Decen Dens -0.04
PA Decentralization -0.06 -0.07
PA Density -0.17 -0.13
INT PA Decen Dens 0.07
Model Adjusted R2 0.03 0.000 -0.03 -0.05 -0.03 -0.06 0.03 0.05 0.05
P 0.76 0.56 0.76
AIC 0.34 2.30 2.77 4.40 2.81 4.70 2.11 1.55 5.10
BIC 5.70 9.43 8.12 11.53 8.16 11.84 11.03 12.25 22.95
Final Presentation Grade†
†All independent variables are grand mean centered. (Standardized Coefficients) +Parsimonious Model
*=p≤0.05
5.5.1.4 Research Question 1 Discussion (Hypothesis 1)
Results partially support hypothesis 1, which anticipated a positive relationship between
shared leadership and team effectiveness (Table 5.16). Vertical leadership, when distributed
across a limited number of team members, positively relates to team effectiveness measures of
group process (extra effort) and individual satisfaction (satisfaction) but not task performance
(course grades). These findings are consistent with Wang et al. (2014) whose meta-analytic
study found weaker relationships between shared leadership and task performance than the
attitudinal and behavioral process aspects of team effectiveness. Across the group process and
individual satisfaction measures of team effectiveness, the amount (density) of leadership
demonstrated positive relationships, indicating ‘more is better’ with regards to leadership. The
way in which the leadership is distributed across the team matters as well. As leadership is more
distributed across team members (i.e., decentralization), extra effort and satisfaction tend to
decrease. The descriptive statistics of the shared leadership network measures shown in Table
5.4 however, show that no teams were characterized with decentralization scores of zero; thus,
"vertical leadership" should not be synonymous with "individual leadership" for design teams.
Leadership still emanates from multiple, albeit a limited number of, team members.
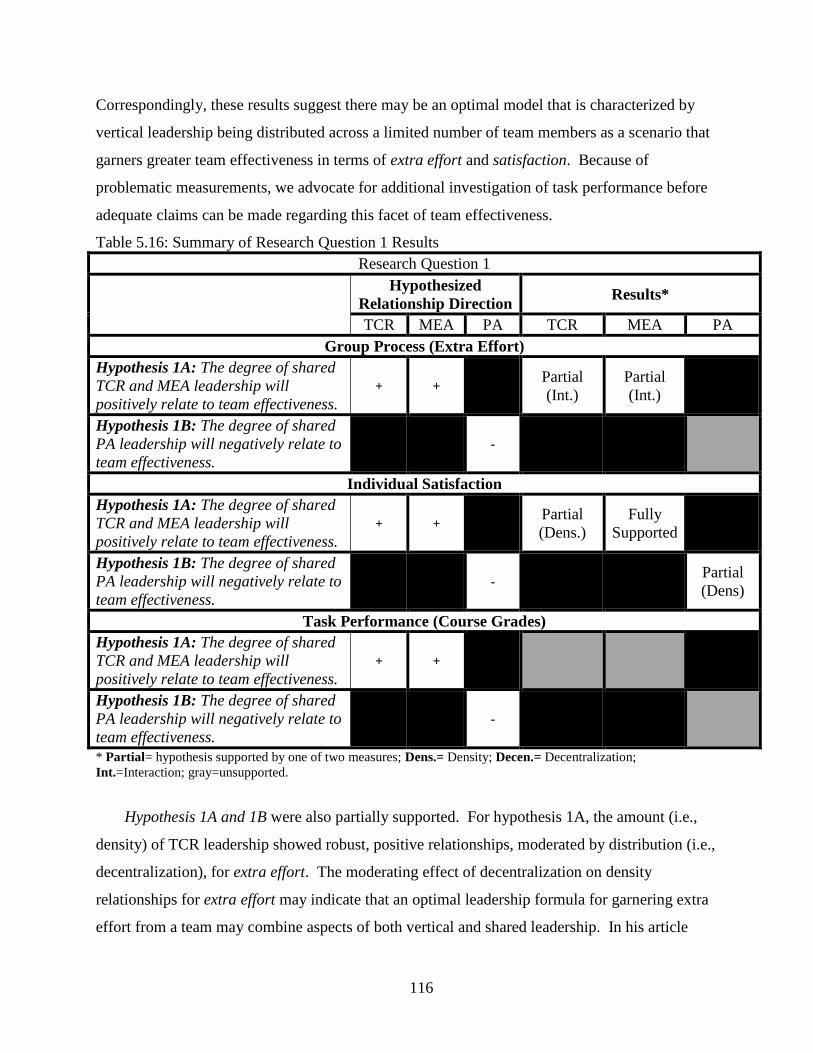
116
Correspondingly, these results suggest there may be an optimal model that is characterized by
vertical leadership being distributed across a limited number of team members as a scenario that
garners greater team effectiveness in terms of extra effort and satisfaction. Because of
problematic measurements, we advocate for additional investigation of task performance before
adequate claims can be made regarding this facet of team effectiveness.
Table 5.16: Summary of Research Question 1 Results
Research Question 1
Hypothesized
Relationship Direction Results*
TCR MEA PA TCR MEA PA
Group Process (Extra Effort)
Hypothesis 1A: The degree of shared
TCR and MEA leadership will
positively relate to team effectiveness.
+ + Partial
(Int.)
Partial
(Int.)
Hypothesis 1B: The degree of shared
PA leadership will negatively relate to
team effectiveness.
-
Individual Satisfaction
Hypothesis 1A: The degree of shared
TCR and MEA leadership will
positively relate to team effectiveness.
+ + Partial
(Dens.)
Fully
Supported
Hypothesis 1B: The degree of shared
PA leadership will negatively relate to
team effectiveness.
- Partial
(Dens)
Task Performance (Course Grades)
Hypothesis 1A: The degree of shared
TCR and MEA leadership will
positively relate to team effectiveness.
+ +
Hypothesis 1B: The degree of shared
PA leadership will negatively relate to
team effectiveness.
-
* Partial= hypothesis supported by one of two measures; Dens.= Density; Decen.= Decentralization;
Int.=Interaction; gray=unsupported.
Hypothesis 1A and 1B were also partially supported. For hypothesis 1A, the amount (i.e.,
density) of TCR leadership showed robust, positive relationships, moderated by distribution (i.e.,
decentralization), for extra effort. The moderating effect of decentralization on density
relationships for extra effort may indicate that an optimal leadership formula for garnering extra
effort from a team may combine aspects of both vertical and shared leadership. In his article
117
addressing the role shared leadership plays in creative, complex, and interdependent knowledge
work, Pearce (2004) acknowledges the role of a central leader in developing an enabling
structure for the team and communicating a uniting vision from which shared leadership may
develop. In their description of vertical leadership, however, Mayo et al. (2003) acknowledge
that influence may emanate from a select few central leaders within a team rather than a single
leader. Further study of how leadership is distributed across the design teams may provide
additional information to better understand if there is an optimal number of central leaders that
may be more effective. Although this individual evaluation of leadership centrality is beyond the
scope of the current study, the round-robin (360-degree) nature of the data collected for this
study facilitates this deeper examination and is an area of on-going research for the authors.
For satisfaction, there was a robust, positive relationship with the amount of TCR leadership
(i.e., density), but a negative relationship with TCR leadership distribution (i.e.,
decentralization). The negative relationship between TCR decentralization and satisfaction
shows that as TCR leadership becomes more distributed across the teams, however, satisfaction
tends to decrease. This negative relationship may provide indications that students become less
satisfied with the teaming experience when influence comes from multiple team members; that
finding coincides with the extra effort results discussed previously. Pearce (2004) articulates the
importance of shared vision for the success of shared leadership. Within student teams, if the
teams do not share a common vision, the distribution of leadership across team members may be
problematic and less satisfying. This finding is an area worthy of further investigation.
Although preliminary regression models suggest shared MEA leadership may also positively
relate to extra effort and satisfaction, these relationships did not remain significant while
controlling for other variables. This result is also consistent with Wang et al. (2014) who found
stronger relationships between shared ‘new-genre leadership’ (such as TCR leadership
behaviors) compared to more traditional forms of leadership (which may include MEA). The
lack of significant relationships in more complex models does not mean MEA leadership should
be ignored. Engineering is a profession grounded in fundamental laws and professional
standards for which engineers must remain accountable with their technical work.
Correspondingly, MEA leadership is a necessary part of how engineers lead as demonstrated by
the fact that it was present in all teams analyzed.
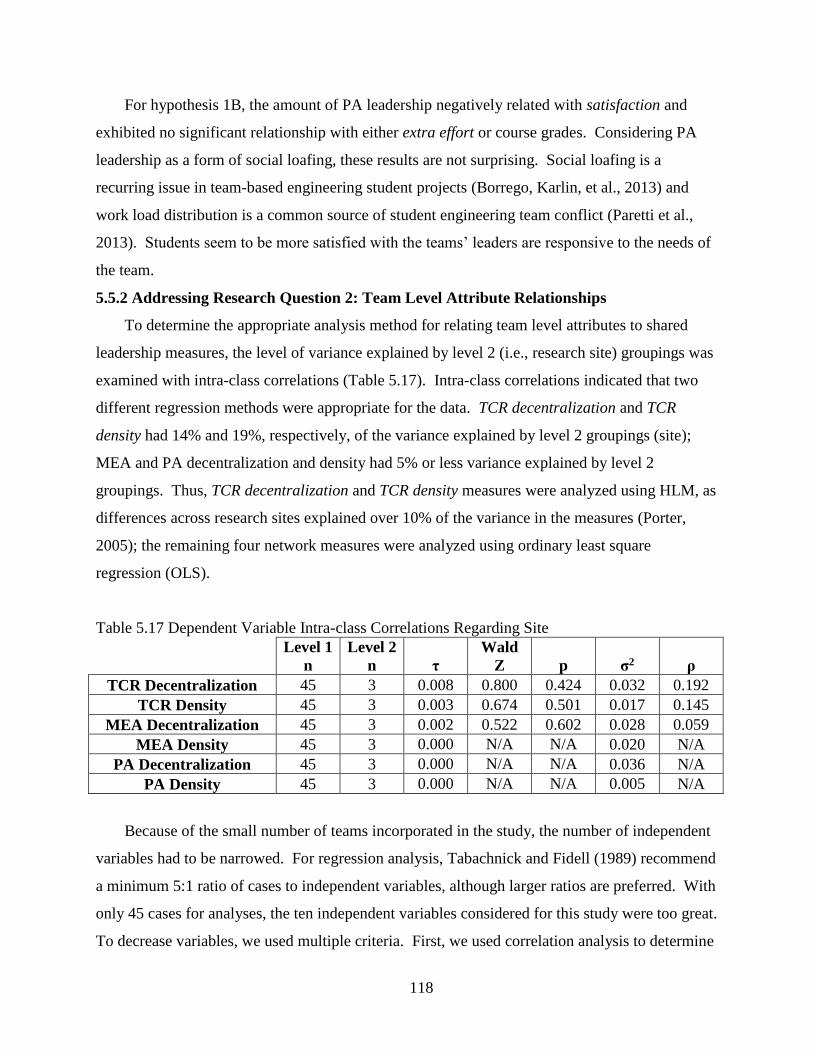
118
For hypothesis 1B, the amount of PA leadership negatively related with satisfaction and
exhibited no significant relationship with either extra effort or course grades. Considering PA
leadership as a form of social loafing, these results are not surprising. Social loafing is a
recurring issue in team-based engineering student projects (Borrego, Karlin, et al., 2013) and
work load distribution is a common source of student engineering team conflict (Paretti et al.,
2013). Students seem to be more satisfied with the teams’ leaders are responsive to the needs of
the team.
5.5.2 Addressing Research Question 2: Team Level Attribute Relationships
To determine the appropriate analysis method for relating team level attributes to shared
leadership measures, the level of variance explained by level 2 (i.e., research site) groupings was
examined with intra-class correlations (Table 5.17). Intra-class correlations indicated that two
different regression methods were appropriate for the data. TCR decentralization and TCR
density had 14% and 19%, respectively, of the variance explained by level 2 groupings (site);
MEA and PA decentralization and density had 5% or less variance explained by level 2
groupings. Thus, TCR decentralization and TCR density measures were analyzed using HLM, as
differences across research sites explained over 10% of the variance in the measures (Porter,
2005); the remaining four network measures were analyzed using ordinary least square
regression (OLS).
Table 5.17 Dependent Variable Intra-class Correlations Regarding Site
Level 1
n
Level 2
n τ
Wald
Z p σ2 ρ
TCR Decentralization 45 3 0.008 0.800 0.424 0.032 0.192
TCR Density 45 3 0.003 0.674 0.501 0.017 0.145
MEA Decentralization 45 3 0.002 0.522 0.602 0.028 0.059
MEA Density 45 3 0.000 N/A N/A 0.020 N/A
PA Decentralization 45 3 0.000 N/A N/A 0.036 N/A
PA Density 45 3 0.000 N/A N/A 0.005 N/A
Because of the small number of teams incorporated in the study, the number of independent
variables had to be narrowed. For regression analysis, Tabachnick and Fidell (1989) recommend
a minimum 5:1 ratio of cases to independent variables, although larger ratios are preferred. With
only 45 cases for analyses, the ten independent variables considered for this study were too great.
To decrease variables, we used multiple criteria. First, we used correlation analysis to determine
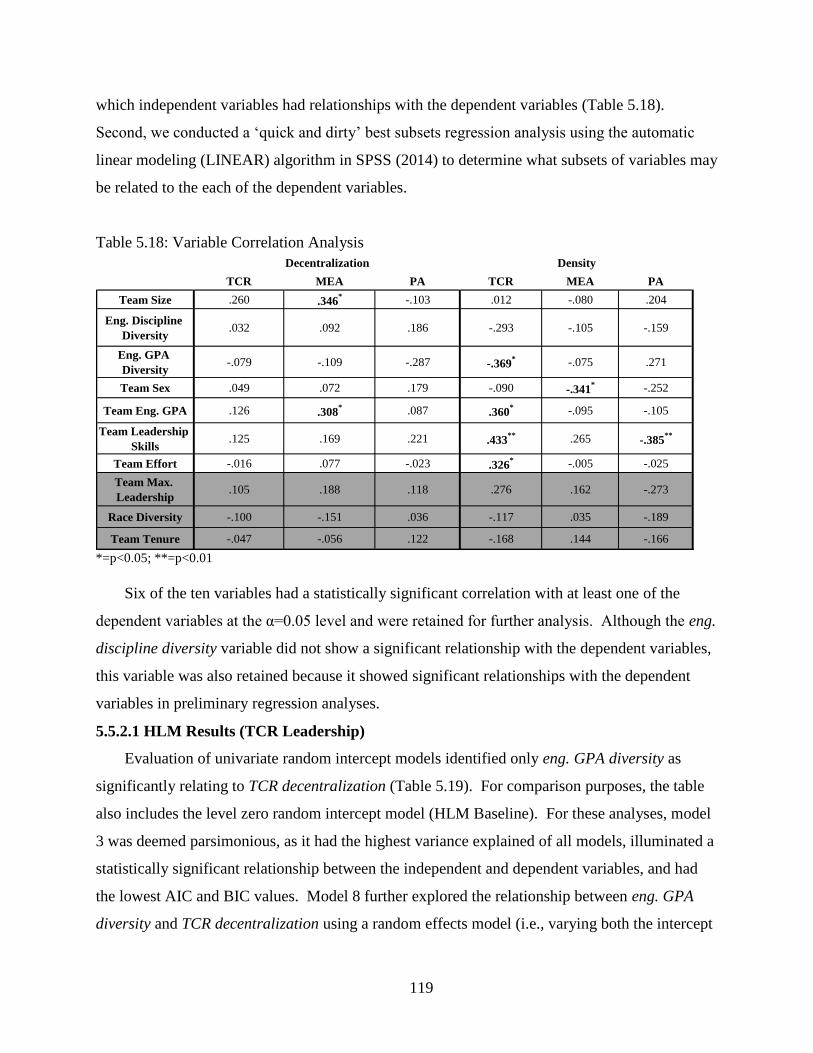
119
which independent variables had relationships with the dependent variables (Table 5.18).
Second, we conducted a ‘quick and dirty’ best subsets regression analysis using the automatic
linear modeling (LINEAR) algorithm in SPSS (2014) to determine what subsets of variables may
be related to the each of the dependent variables.
Table 5.18: Variable Correlation Analysis
TCR MEA PA TCR MEA PA
Team Size .260 .346* -.103 .012 -.080 .204
Eng. Discipline
Diversity.032 .092 .186 -.293 -.105 -.159
Eng. GPA
Diversity-.079 -.109 -.287 -.369
* -.075 .271
Team Sex .049 .072 .179 -.090 -.341* -.252
Team Eng. GPA .126 .308* .087 .360
* -.095 -.105
Team Leadership
Skills.125 .169 .221 .433
** .265 -.385**
Team Effort -.016 .077 -.023 .326* -.005 -.025
Team Max.
Leadership.105 .188 .118 .276 .162 -.273
Race Diversity -.100 -.151 .036 -.117 .035 -.189
Team Tenure -.047 -.056 .122 -.168 .144 -.166
Decentralization Density
*=p<0.05; **=p<0.01
Six of the ten variables had a statistically significant correlation with at least one of the
dependent variables at the α=0.05 level and were retained for further analysis. Although the eng.
discipline diversity variable did not show a significant relationship with the dependent variables,
this variable was also retained because it showed significant relationships with the dependent
variables in preliminary regression analyses.
5.5.2.1 HLM Results (TCR Leadership)
Evaluation of univariate random intercept models identified only eng. GPA diversity as
significantly relating to TCR decentralization (Table 5.19). For comparison purposes, the table
also includes the level zero random intercept model (HLM Baseline). For these analyses, model
3 was deemed parsimonious, as it had the highest variance explained of all models, illuminated a
statistically significant relationship between the independent and dependent variables, and had
the lowest AIC and BIC values. Model 8 further explored the relationship between eng. GPA
diversity and TCR decentralization using a random effects model (i.e., varying both the intercept
120
and slope by site); that model, however, had a poorer fit, and the relationship was no longer
significant. Thus, these results identified model 3 as the most parsimonious model; as students
with more widely varying engineering course performance are grouped together in a design
team, the TCR leadership network becomes more centralized.
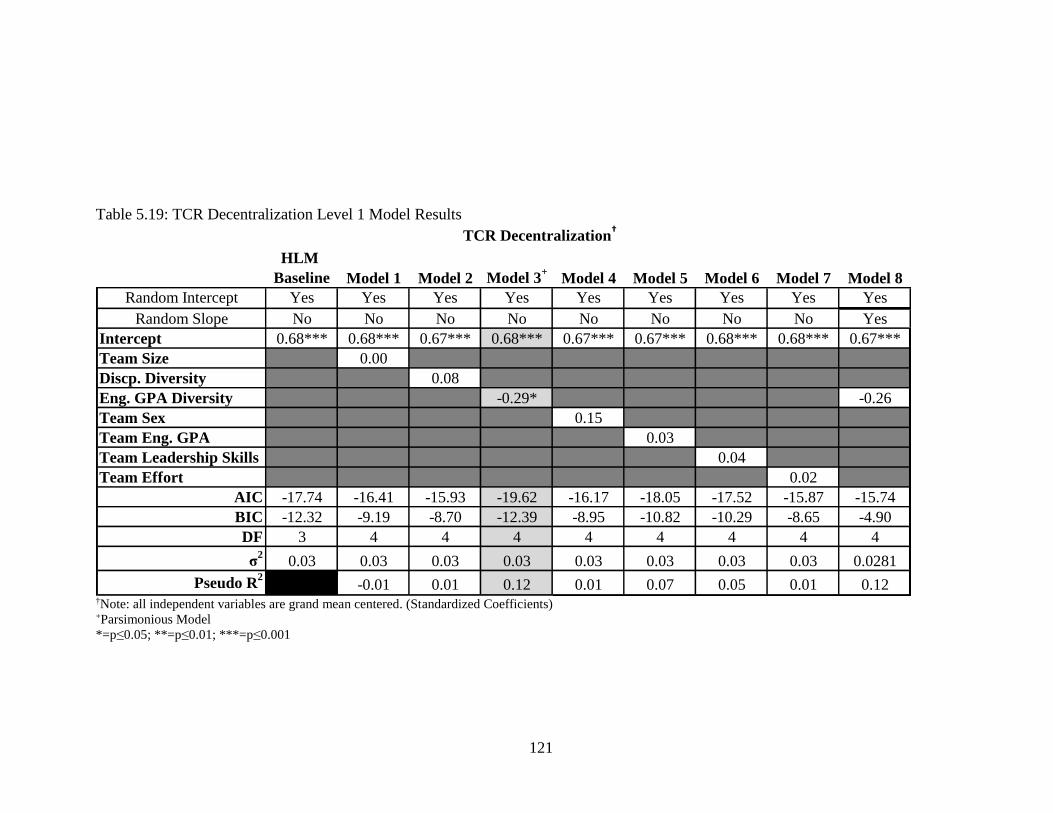
121
Table 5.19: TCR Decentralization Level 1 Model Results
HLM
Baseline Model 1 Model 2 Model 3+
Model 4 Model 5 Model 6 Model 7 Model 8
Random Intercept Yes Yes Yes Yes Yes Yes Yes Yes Yes
Random Slope No No No No No No No No Yes
Intercept 0.68*** 0.68*** 0.67*** 0.68*** 0.67*** 0.67*** 0.68*** 0.68*** 0.67***
Team Size 0.00
Discp. Diversity 0.08
Eng. GPA Diversity -0.29* -0.26
Team Sex 0.15
Team Eng. GPA 0.03
Team Leadership Skills 0.04
Team Effort 0.02
AIC -17.74 -16.41 -15.93 -19.62 -16.17 -18.05 -17.52 -15.87 -15.74
BIC -12.32 -9.19 -8.70 -12.39 -8.95 -10.82 -10.29 -8.65 -4.90
DF 3 4 4 4 4 4 4 4 4
σ2
0.03 0.03 0.03 0.03 0.03 0.03 0.03 0.03 0.0281
Pseudo R2
-0.01 0.01 0.12 0.01 0.07 0.05 0.01 0.12
TCR Decentralization†
†Note: all independent variables are grand mean centered. (Standardized Coefficients) +Parsimonious Model
*=p≤0.05; **=p≤0.01; ***=p≤0.001
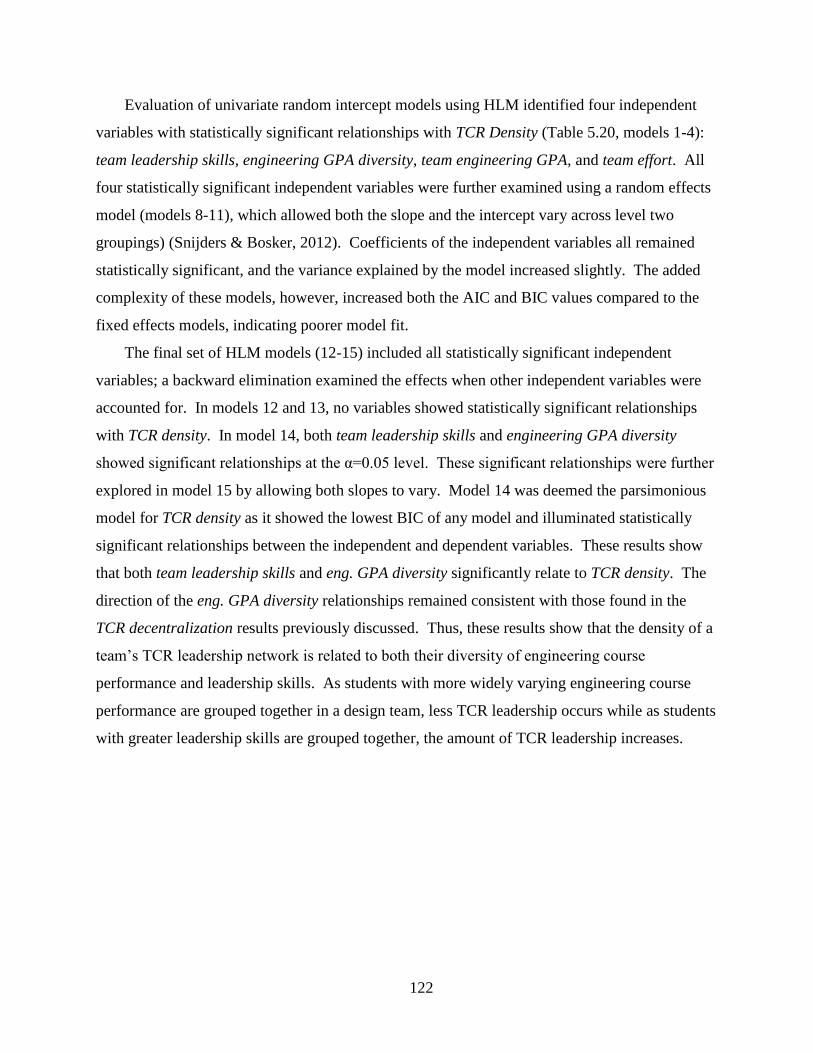
122
Evaluation of univariate random intercept models using HLM identified four independent
variables with statistically significant relationships with TCR Density (Table 5.20, models 1-4):
team leadership skills, engineering GPA diversity, team engineering GPA, and team effort. All
four statistically significant independent variables were further examined using a random effects
model (models 8-11), which allowed both the slope and the intercept vary across level two
groupings) (Snijders & Bosker, 2012). Coefficients of the independent variables all remained
statistically significant, and the variance explained by the model increased slightly. The added
complexity of these models, however, increased both the AIC and BIC values compared to the
fixed effects models, indicating poorer model fit.
The final set of HLM models (12-15) included all statistically significant independent
variables; a backward elimination examined the effects when other independent variables were
accounted for. In models 12 and 13, no variables showed statistically significant relationships
with TCR density. In model 14, both team leadership skills and engineering GPA diversity
showed significant relationships at the α=0.05 level. These significant relationships were further
explored in model 15 by allowing both slopes to vary. Model 14 was deemed the parsimonious
model for TCR density as it showed the lowest BIC of any model and illuminated statistically
significant relationships between the independent and dependent variables. These results show
that both team leadership skills and eng. GPA diversity significantly relate to TCR density. The
direction of the eng. GPA diversity relationships remained consistent with those found in the
TCR decentralization results previously discussed. Thus, these results show that the density of a
team’s TCR leadership network is related to both their diversity of engineering course
performance and leadership skills. As students with more widely varying engineering course
performance are grouped together in a design team, less TCR leadership occurs while as students
with greater leadership skills are grouped together, the amount of TCR leadership increases.
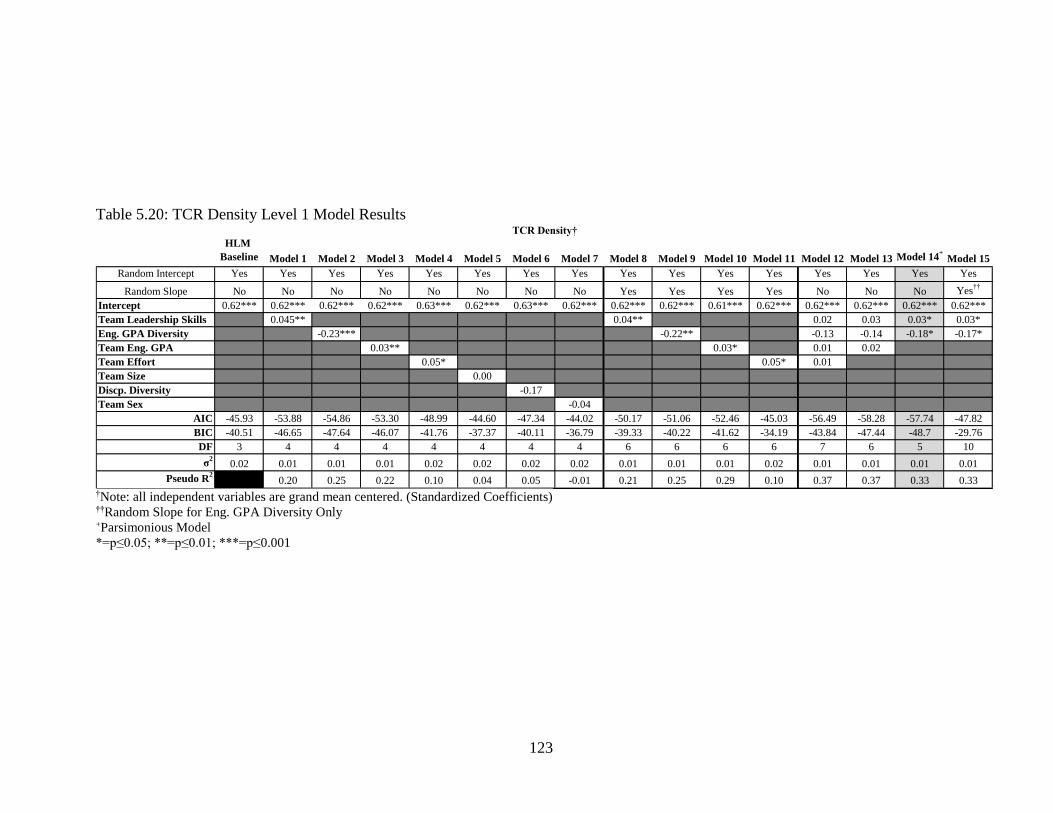
123
Table 5.20: TCR Density Level 1 Model Results
HLM
Baseline Model 1 Model 2 Model 3 Model 4 Model 5 Model 6 Model 7 Model 8 Model 9 Model 10 Model 11 Model 12 Model 13 Model 14+
Model 15
Random Intercept Yes Yes Yes Yes Yes Yes Yes Yes Yes Yes Yes Yes Yes Yes Yes Yes
Random Slope No No No No No No No No Yes Yes Yes Yes No No No Yes††
Intercept 0.62*** 0.62*** 0.62*** 0.62*** 0.63*** 0.62*** 0.63*** 0.62*** 0.62*** 0.62*** 0.61*** 0.62*** 0.62*** 0.62*** 0.62*** 0.62***
Team Leadership Skills 0.045** 0.04** 0.02 0.03 0.03* 0.03*
Eng. GPA Diversity -0.23*** -0.22** -0.13 -0.14 -0.18* -0.17*
Team Eng. GPA 0.03** 0.03* 0.01 0.02
Team Effort 0.05* 0.05* 0.01
Team Size 0.00
Discp. Diversity -0.17
Team Sex -0.04
AIC -45.93 -53.88 -54.86 -53.30 -48.99 -44.60 -47.34 -44.02 -50.17 -51.06 -52.46 -45.03 -56.49 -58.28 -57.74 -47.82
BIC -40.51 -46.65 -47.64 -46.07 -41.76 -37.37 -40.11 -36.79 -39.33 -40.22 -41.62 -34.19 -43.84 -47.44 -48.7 -29.76
DF 3 4 4 4 4 4 4 4 6 6 6 6 7 6 5 10
σ2
0.02 0.01 0.01 0.01 0.02 0.02 0.02 0.02 0.01 0.01 0.01 0.02 0.01 0.01 0.01 0.01
Pseudo R2
0.20 0.25 0.22 0.10 0.04 0.05 -0.01 0.21 0.25 0.29 0.10 0.37 0.37 0.33 0.33
TCR Density†
†Note: all independent variables are grand mean centered. (Standardized Coefficients) ††Random Slope for Eng. GPA Diversity Only +Parsimonious Model
*=p≤0.05; **=p≤0.01; ***=p≤0.001
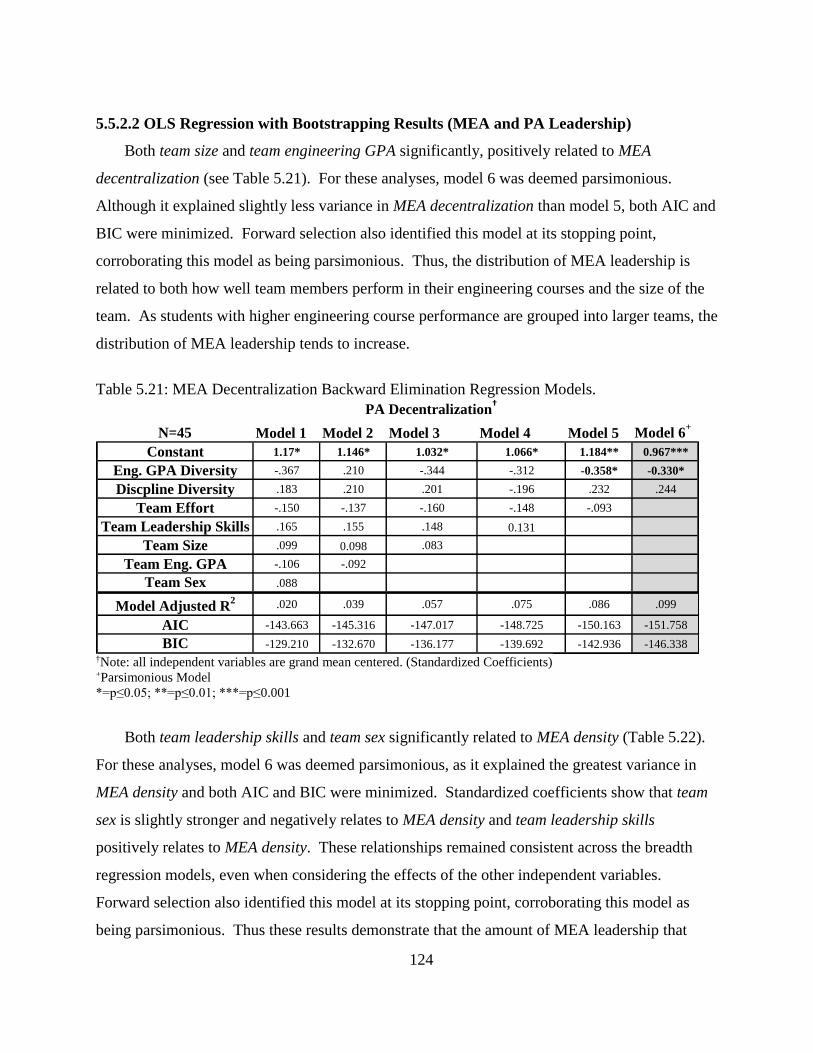
124
5.5.2.2 OLS Regression with Bootstrapping Results (MEA and PA Leadership)
Both team size and team engineering GPA significantly, positively related to MEA
decentralization (see Table 5.21). For these analyses, model 6 was deemed parsimonious.
Although it explained slightly less variance in MEA decentralization than model 5, both AIC and
BIC were minimized. Forward selection also identified this model at its stopping point,
corroborating this model as being parsimonious. Thus, the distribution of MEA leadership is
related to both how well team members perform in their engineering courses and the size of the
team. As students with higher engineering course performance are grouped into larger teams, the
distribution of MEA leadership tends to increase.
Table 5.21: MEA Decentralization Backward Elimination Regression Models.
N=45 Model 1 Model 2 Model 3 Model 4 Model 5 Model 6+
Constant 1.17* 1.146* 1.032* 1.066* 1.184** 0.967***
Eng. GPA Diversity -.367 .210 -.344 -.312 -0.358* -0.330*
Discpline Diversity .183 .210 .201 -.196 .232 .244
Team Effort -.150 -.137 -.160 -.148 -.093
Team Leadership Skills .165 .155 .148 0.131
Team Size .099 0.098 .083
Team Eng. GPA -.106 -.092
Team Sex .088
Model Adjusted R2 .020 .039 .057 .075 .086 .099
AIC -143.663 -145.316 -147.017 -148.725 -150.163 -151.758
BIC -129.210 -132.670 -136.177 -139.692 -142.936 -146.338
PA Decentralization†
†Note: all independent variables are grand mean centered. (Standardized Coefficients) +Parsimonious Model
*=p≤0.05; **=p≤0.01; ***=p≤0.001
Both team leadership skills and team sex significantly related to MEA density (Table 5.22).
For these analyses, model 6 was deemed parsimonious, as it explained the greatest variance in
MEA density and both AIC and BIC were minimized. Standardized coefficients show that team
sex is slightly stronger and negatively relates to MEA density and team leadership skills
positively relates to MEA density. These relationships remained consistent across the breadth
regression models, even when considering the effects of the other independent variables.
Forward selection also identified this model at its stopping point, corroborating this model as
being parsimonious. Thus these results demonstrate that the amount of MEA leadership that
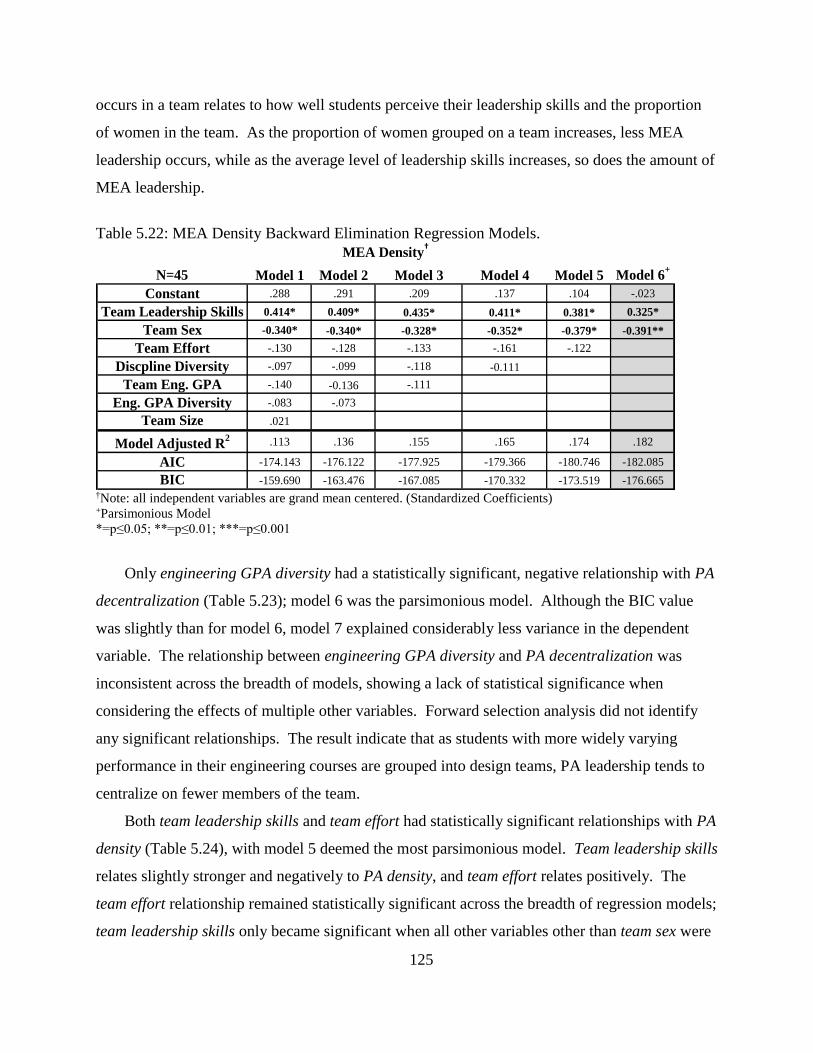
125
occurs in a team relates to how well students perceive their leadership skills and the proportion
of women in the team. As the proportion of women grouped on a team increases, less MEA
leadership occurs, while as the average level of leadership skills increases, so does the amount of
MEA leadership.
Table 5.22: MEA Density Backward Elimination Regression Models.
N=45 Model 1 Model 2 Model 3 Model 4 Model 5 Model 6+
Constant .288 .291 .209 .137 .104 -.023
Team Leadership Skills 0.414* 0.409* 0.435* 0.411* 0.381* 0.325*
Team Sex -0.340* -0.340* -0.328* -0.352* -0.379* -0.391**
Team Effort -.130 -.128 -.133 -.161 -.122
Discpline Diversity -.097 -.099 -.118 -0.111
Team Eng. GPA -.140 -0.136 -.111
Eng. GPA Diversity -.083 -.073
Team Size .021
Model Adjusted R2 .113 .136 .155 .165 .174 .182
AIC -174.143 -176.122 -177.925 -179.366 -180.746 -182.085
BIC -159.690 -163.476 -167.085 -170.332 -173.519 -176.665
MEA Density†
†Note: all independent variables are grand mean centered. (Standardized Coefficients) +Parsimonious Model
*=p≤0.05; **=p≤0.01; ***=p≤0.001
Only engineering GPA diversity had a statistically significant, negative relationship with PA
decentralization (Table 5.23); model 6 was the parsimonious model. Although the BIC value
was slightly than for model 6, model 7 explained considerably less variance in the dependent
variable. The relationship between engineering GPA diversity and PA decentralization was
inconsistent across the breadth of models, showing a lack of statistical significance when
considering the effects of multiple other variables. Forward selection analysis did not identify
any significant relationships. The result indicate that as students with more widely varying
performance in their engineering courses are grouped into design teams, PA leadership tends to
centralize on fewer members of the team.
Both team leadership skills and team effort had statistically significant relationships with PA
density (Table 5.24), with model 5 deemed the most parsimonious model. Team leadership skills
relates slightly stronger and negatively to PA density, and team effort relates positively. The
team effort relationship remained statistically significant across the breadth of regression models;
team leadership skills only became significant when all other variables other than team sex were
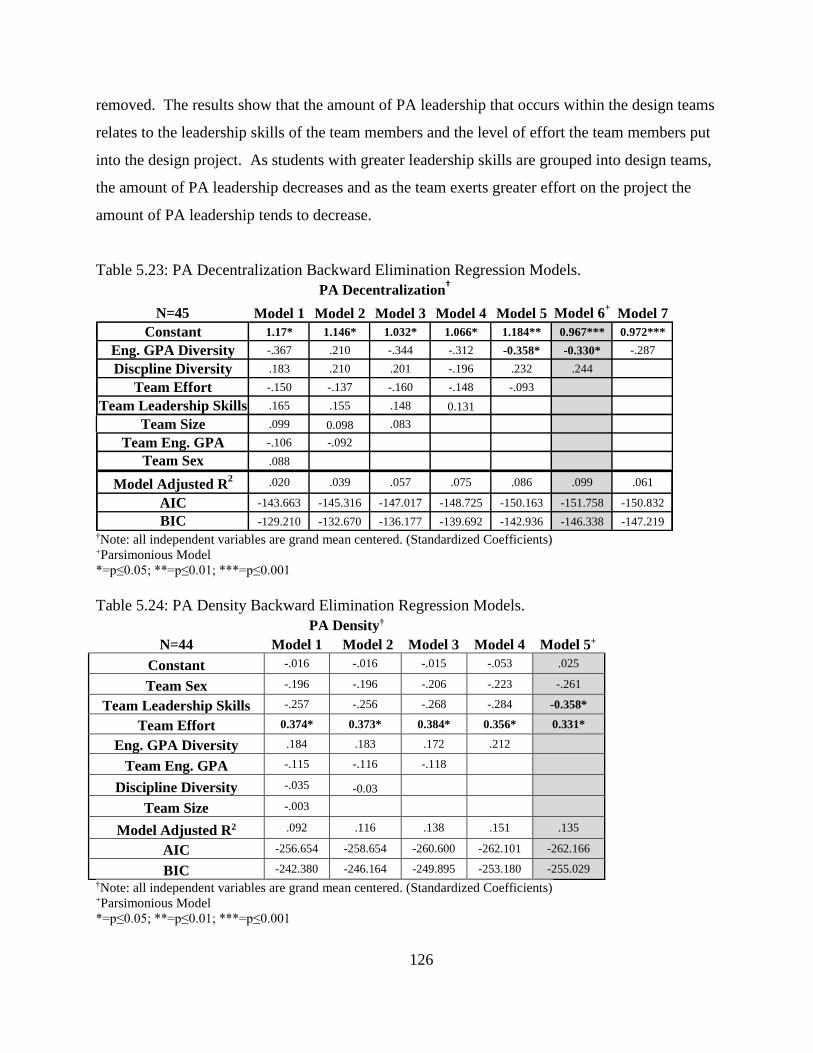
126
removed. The results show that the amount of PA leadership that occurs within the design teams
relates to the leadership skills of the team members and the level of effort the team members put
into the design project. As students with greater leadership skills are grouped into design teams,
the amount of PA leadership decreases and as the team exerts greater effort on the project the
amount of PA leadership tends to decrease.
Table 5.23: PA Decentralization Backward Elimination Regression Models.
N=45 Model 1 Model 2 Model 3 Model 4 Model 5 Model 6+
Model 7
Constant 1.17* 1.146* 1.032* 1.066* 1.184** 0.967*** 0.972***
Eng. GPA Diversity -.367 .210 -.344 -.312 -0.358* -0.330* -.287
Discpline Diversity .183 .210 .201 -.196 .232 .244
Team Effort -.150 -.137 -.160 -.148 -.093
Team Leadership Skills .165 .155 .148 0.131
Team Size .099 0.098 .083
Team Eng. GPA -.106 -.092
Team Sex .088
Model Adjusted R2 .020 .039 .057 .075 .086 .099 .061
AIC -143.663 -145.316 -147.017 -148.725 -150.163 -151.758 -150.832
BIC -129.210 -132.670 -136.177 -139.692 -142.936 -146.338 -147.219
PA Decentralization†
†Note: all independent variables are grand mean centered. (Standardized Coefficients) +Parsimonious Model
*=p≤0.05; **=p≤0.01; ***=p≤0.001
Table 5.24: PA Density Backward Elimination Regression Models.
PA Density†
N=44 Model 1 Model 2 Model 3 Model 4 Model 5+
Constant -.016 -.016 -.015 -.053 .025
Team Sex -.196 -.196 -.206 -.223 -.261
Team Leadership Skills -.257 -.256 -.268 -.284 -0.358*
Team Effort 0.374* 0.373* 0.384* 0.356* 0.331*
Eng. GPA Diversity .184 .183 .172 .212
Team Eng. GPA -.115 -.116 -.118
Discipline Diversity -.035 -0.03
Team Size -.003
Model Adjusted R2 .092 .116 .138 .151 .135
AIC -256.654 -258.654 -260.600 -262.101 -262.166
BIC -242.380 -246.164 -249.895 -253.180 -255.029
†Note: all independent variables are grand mean centered. (Standardized Coefficients) +Parsimonious Model
*=p≤0.05; **=p≤0.01; ***=p≤0.001
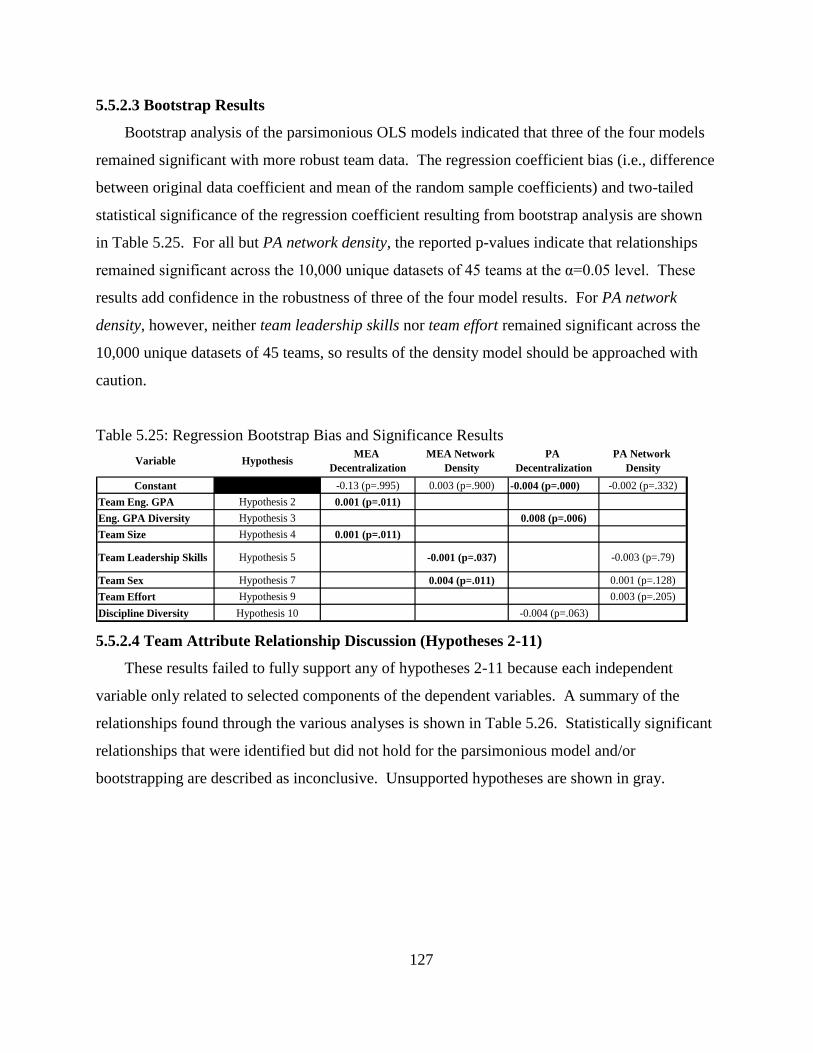
127
5.5.2.3 Bootstrap Results
Bootstrap analysis of the parsimonious OLS models indicated that three of the four models
remained significant with more robust team data. The regression coefficient bias (i.e., difference
between original data coefficient and mean of the random sample coefficients) and two-tailed
statistical significance of the regression coefficient resulting from bootstrap analysis are shown
in Table 5.25. For all but PA network density, the reported p-values indicate that relationships
remained significant across the 10,000 unique datasets of 45 teams at the α=0.05 level. These
results add confidence in the robustness of three of the four model results. For PA network
density, however, neither team leadership skills nor team effort remained significant across the
10,000 unique datasets of 45 teams, so results of the density model should be approached with
caution.
Table 5.25: Regression Bootstrap Bias and Significance Results
Constant -0.13 (p=.995) 0.003 (p=.900) -0.004 (p=.000) -0.002 (p=.332)
Team Eng. GPA Hypothesis 2 0.001 (p=.011)
Eng. GPA Diversity Hypothesis 3 0.008 (p=.006)
Team Size Hypothesis 4 0.001 (p=.011)
Team Leadership Skills Hypothesis 5 -0.001 (p=.037) -0.003 (p=.79)
Team Sex Hypothesis 7 0.004 (p=.011) 0.001 (p=.128)
Team Effort Hypothesis 9 0.003 (p=.205)
Discipline Diversity Hypothesis 10 -0.004 (p=.063)
PA Network
DensityVariable
MEA
Decentralization
MEA Network
Density
PA
DecentralizationHypothesis
5.5.2.4 Team Attribute Relationship Discussion (Hypotheses 2-11)
These results failed to fully support any of hypotheses 2-11 because each independent
variable only related to selected components of the dependent variables. A summary of the
relationships found through the various analyses is shown in Table 5.26. Statistically significant
relationships that were identified but did not hold for the parsimonious model and/or
bootstrapping are described as inconclusive. Unsupported hypotheses are shown in gray.
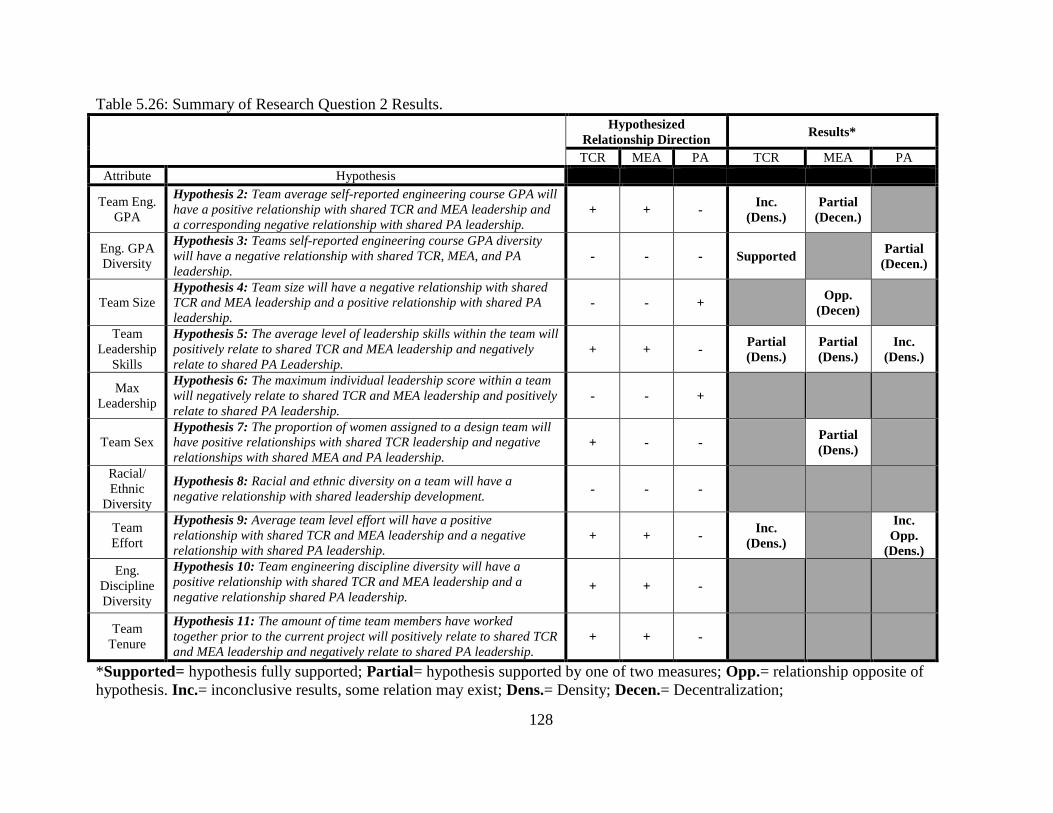
128
Table 5.26: Summary of Research Question 2 Results.
Hypothesized
Relationship Direction Results*
TCR MEA PA TCR MEA PA
Attribute Hypothesis
Team Eng.
GPA
Hypothesis 2: Team average self-reported engineering course GPA will
have a positive relationship with shared TCR and MEA leadership and
a corresponding negative relationship with shared PA leadership. + + -
Inc.
(Dens.)
Partial
(Decen.)
Eng. GPA
Diversity
Hypothesis 3: Teams self-reported engineering course GPA diversity
will have a negative relationship with shared TCR, MEA, and PA
leadership. - - - Supported
Partial
(Decen.)
Team Size
Hypothesis 4: Team size will have a negative relationship with shared
TCR and MEA leadership and a positive relationship with shared PA
leadership. - - +
Opp.
(Decen)
Team
Leadership
Skills
Hypothesis 5: The average level of leadership skills within the team will
positively relate to shared TCR and MEA leadership and negatively
relate to shared PA Leadership. + + -
Partial
(Dens.)
Partial
(Dens.)
Inc.
(Dens.)
Max
Leadership
Hypothesis 6: The maximum individual leadership score within a team
will negatively relate to shared TCR and MEA leadership and positively
relate to shared PA leadership. - - +
Team Sex
Hypothesis 7: The proportion of women assigned to a design team will
have positive relationships with shared TCR leadership and negative
relationships with shared MEA and PA leadership. + - -
Partial
(Dens.)
Racial/
Ethnic
Diversity
Hypothesis 8: Racial and ethnic diversity on a team will have a
negative relationship with shared leadership development. - - -
Team
Effort
Hypothesis 9: Average team level effort will have a positive
relationship with shared TCR and MEA leadership and a negative
relationship with shared PA leadership. + + -
Inc.
(Dens.)
Inc.
Opp.
(Dens.)
Eng.
Discipline
Diversity
Hypothesis 10: Team engineering discipline diversity will have a
positive relationship with shared TCR and MEA leadership and a
negative relationship shared PA leadership. + + -
Team
Tenure
Hypothesis 11: The amount of time team members have worked
together prior to the current project will positively relate to shared TCR
and MEA leadership and negatively relate to shared PA leadership. + + -
*Supported= hypothesis fully supported; Partial= hypothesis supported by one of two measures; Opp.= relationship opposite of
hypothesis. Inc.= inconclusive results, some relation may exist; Dens.= Density; Decen.= Decentralization;
129
Engineering GPA was most related with shared leadership, as anticipated by
hypotheses 2 and 3. Hypothesis 2 was inconclusive for TCR leadership, partially
supported for MEA leadership, and not supported for PA leadership. TCR leadership
showed only an inconclusive relationship with team mean GPA indicating that students’
technical ability may relate to TCR leadership, but further inquiry is warranted. Team
mean GPA related positively with shared MEA leadership, but only for the
decentralization measure, thus partially supporting hypothesis 2. From this relationship,
it appears as if students’ technical ability relates to leadership within their capstone
design experience. Teams with overall higher technical ability had more students
engaged in the accountability behaviors of the MEA network. Students may be more
willing to examine critically the work of others and hold them more accountable for
performance within a project. The lack of corresponding relationship for MEA density
indicates that the increased involvement of team members in the MEA network does not
necessarily extend to all members of the team.
Hypothesis 3 was fully supported for TCR leadership, unsupported for MEA
leadership, and partially supported for PA leadership. Engineering GPA diversity had
negative relationships with both the decentralization and density of the TCR network as
anticipated. As design teams become more diverse in student technical ability, TCR
leadership becomes more centralized, and the number of leadership connections
decreases. These results suggest that a select few students are enacting TCR leadership
within the team when teams are diverse with respect to past academic performance. With
GPA as a proxy for technical ability, these results may be a manifestation of the technical
mastery leadership orientation identified by Rottmann et al. (2014). Through this
leadership orientation, engineers who are confident in their own technical competence
and are recognized by peers for this competence lead other team members through formal
and informal technical mentoring relationships. Teams with a broader range of
engineering GPAs represented may have fewer technical masters available for
mentorship. The higher performing students may be serving in more centralized
technical mastery roles because of their increased expert power (French & Raven, 1959;
Northouse, 2013), and the less technically proficient may have less expert power with
130
which to influence their peers. This dynamic would simultaneously decrease both the
decentralization and density of the network. Because developing team member strengths
is a facet of TCR leadership, the nature of these technical mentoring relationships may
feel more transformational in nature than forcing accountability, thereby explaining why
the relationship exists for TCR but not for MEA.
Partially supporting hypothesis 3, engineering GPA diversity showed a negative
relationship with PA decentralization but not density. As the students on the low end of
the engineering GPA spectrum fail to influence their peers in the TCR and MEA
network, they may be identified as having more PA leadership behaviors. This small
number of students would explain the negative relationship between engineering GPA
diversity and PA decentralization. The corresponding centralization of PA leadership
however, does not include a corresponding decrease in PA density. This lack of reduction
in density may be a result of the overall low density of the PA networks. The PA density
mean in Table 5.4 shows that on average, only 5% of the possible PA ties in a network
actually occur within the teams and, at most, only 36% occur. The overall low density of
PA leadership shows that these relationships are occurring mainly at the dyadic level (i.e.,
member to member), so there is only a small range for which the PA density may
decrease.
Hypothesis 4 was not supported; shared leadership did not relate to team size in the
directions anticipated. Team size only had a significant relationship with MEA
decentralization but in the opposite direction hypothesized. Larger teams tended to
distribute leadership rather than centralize, but only for the MEA network. This
relationship shows that as teams are larger, the accountability actions inherent to MEA
leadership are distributed among multiple students. This trend may result from an effort
to mitigate the effects of social loafing. Social loafing is more likely to occur within
larger teams (Karau & Williams, 1993). To prevent these actions from adversely
affecting the team, more students may be bearing the burden of monitoring
accountability. The lack of a corresponding density relationship may be explained by a
lack of strong integration within larger teams. (Cox et al., 2003) summarize research
suggesting team size having a marginally negative effect on work integration, which
would account for the disparate MEA relationships observed. As the team gets larger,
131
social loafing behaviors may only be observed more sporadically, increasing the variance
in MEA density and preventing coherent trends. The lack of relationship between team
size and the TCR and PA networks indicates that students engage in shared TCR and PA
leadership to varying degrees across the range of team sizes. In general, there is a dearth
of literature regarding relationships between shared leadership and team size with which
to help interpret these results. Nicolaides et al. (2014) describe how team size is most
often treated often as a “nuisance variable to be controlled for statistically” (p. 926) and
D'Innocenzo et al. (2014) describes how this non-purposeful treatment of team size
hinders further exploration in meta-analytic study. In proposing a positive relationship
between team size and shared leadership, (Cox et al., 2003) acknowledge that potential
ambiguous effects of team size. All three works advocate continued exploration of these
relationships.
Hypothesis 5 was partially supported for TCR and MEA leadership and inconclusive
for PA leadership. Team leadership skills had the anticipated relationships with both
TCR and MEA density but not decentralization. As the teams' mean, self-reported
engineering leadership skills increased, so did the number of leadership ties in both the
TCR and MEA networks. There was also some evidence of a decrease in PA density,
although this relationship did not hold up under stricter statistical scrutiny. These results
are consistent with leadership self-efficacy trends discussed in the literature review.
Consistent with Paglis (2010), when team members collectively perceived themselves as
having more leadership skills they seem more willing to enact TCR and MEA leadership
and are potentially less prone to absentee (PA) leadership behaviors. The lack of
relationship between team leadership skills and leadership distribution may indicate that
teams distribute the forms of leadership in different ways. These results suggest that a
team with a high density of leadership does not necessarily mean that everyone is
leading. The greater number of ties commensurate with increased leadership density may
be distributed across multiple team members in some teams yet attributed to a more select
few in other teams. According to distributed leadership theories, the roles team members
take on, (e.g., mentor, instructor, coach, or facilitator) relates to how leadership is
distributed within the teams (Burke, Fiore, & Salas, 2003), especially in early stages of
team development. Examining the relationships between a team member’s prominence
132
within the leadership networks and their individual leadership skills would help uncover
these differences but is beyond the scope of this work. Further exploration of the teams
at the individual level may help interpret the lack of relationships in the decentralization
of leadership. Small and Rentsch (2010) describe the scant empirical study of the
distributed aspect of shared leadership. Further investigation may help fill this gap in the
literature.
Hypothesis 6 was not supported. No statistically significant relationships were
uncovered relating to a team’s maximum leadership. The maximum measure did not
account for the overall team mean leadership skills. The degree to which the maximum
leader differed from the mean of the team (i.e., z score) may have been a more effective
measure of maximum leadership skills and could be considered in future research
designs. A team’s maximum leadership could remain an area of further inquiry. From a
social identity perspective of leader emergence, the first phase of a leader’s emergence is
their appearance of exerting influence over others within a group (Jackson & Parry, 2011)
and according to leadership self-efficacy, a person may be more apt to demonstrate
leadership (influence) over others is they are more self-confident in their leadership
abilities. This research stream may help unpack the emergence of leaders within the
teams.
Hypothesis 7 was unsupported for TCR leadership, partially supported for MEA
leadership, and unsupported for PA leadership. Team sex had a significant negative
relationship with MEA density, partially supporting Hypothesis 7. This relationship
indicates that as the proportion of women on a team increased, the number of ties within
the MEA network tended to decrease. These results may be related to gender differences
in the way men and women lead, as described in the literature review. Women in other
contexts outside of engineering, on average, tend to be more oriented on enhancing
others’ self-worth with their leadership style than men, exhibiting more TCR and less
MEA or PA behaviors than their male counterparts (Eagly et al., 2003; Vinkenburg et al.,
2011). This same trend may be present within the engineering design teams; as the
proportion of women increase, the overall level of MEA may tend to decrease within the
team. Perhaps the lack of relationships between the sex composition of the teams and
either TCR or PA leadership may be attributed to the relatively small differences between
133
women and men Eagly et al. (2003) found which may be compounded by the rearranging
of the leadership factors by Novoselich and Knight (Chapter 3) that resulted in the TCR,
MEA, and PA leadership scales investigated. Gender differences across the leadership
scales in the capstone design context is an area worthy of further inquiry at both the
individual and team level. The relatively low representation of women in this study may
have contributed to the lack of significant findings.
Hypothesis 8 was unsupported. No discernable relationships were uncovered
regarding race and ethnicity within the teams. This lack of relationship must also be
viewed with the understanding that there were very few underrepresented minority
students within the study sample. Racial and ethnic relationships to team leadership
skills are complex issues, as discussed in the literature review and should be an area of
further inquiry within contexts that allow for in-depth analysis.
Hypothesis 9 was unsupported across all three forms of leadership; there were
inconclusive relationships in the TCR and PA networks. Team effort showed positive,
but inconclusive, relationships with TCR density. The potential positive relationship
between team member effort and TCR leadership is not surprising considering the
amount of effort this form of leadership may require. Implementing a TCR leadership
system may require strong physical effort to overcome organizational (or group)
obstacles (Avolio, 2011). The inconclusive, positive relationship between team effort and
PA density is a little more problematic. This relationship indicates that as the overall
level of project effort increases within a design team, so does the number of ties in the PA
network. There a two potential explanations for this. First, if students are working
harder on a project, they may be more self-consumed in their personal contributions to
the project and less willing or able to engage other students within the team (i.e., the
divide and conquer approach to teamwork), which their peers may perceive as PA
behavior. Another potential explanation may be that an increase in PA behaviors by a
select few social loafers within the team may result in increased effort by the rest of the
team to compensate for the social loafers’ lack of leadership and direction. Social loafing
is cited as the most prominent problem in team-based engineering student projects (see
Borrego, Karlin, et al., 2013). Future work could specifically examine how social loafing
relates to leadership within design teams.
134
Hypothesis 10 was unsupported. No statistically significant relationships were
uncovered between a team’s engineering discipline diversity and shared leadership. It is
possible that the disciplinary expertise non-ME students bring to an ME project may not
be recognized by the ME students as a source of expert power from which to influence
the team. The lack of relationship for engineering discipline diversity should be
interpreted with caution, however, because of the overall low representation of non-ME
majors in the teams. Future work could compare discipline-centric teams to
interdisciplinary teams to see if there are any differences in team leadership processes.
Hypothesis 11 was unsupported, as no statistically significant relationships were
uncovered relating to a team’s tenure. The lack of significant relationships between
shared leadership and students’ prior work experiences with one another may be
attributed to a low representation of teams with strong prior work experience within the
data. These results may also indicate that the teams are afforded ample time within the
capstone design course with which to build the relationships necessary for sharing
leadership among the team members. These relationships should remain an area of
further inquiry. Nicolaides et al. (2014) explain that although team tenure may promote
shared leadership, the effectiveness of shared leadership may decay with time. Their
study found that team tenure moderates the shared leadership-team performance
relationship over a prolonged duration.
5.6 Conclusions
For engineering educators, three main conclusions emerge from this study of shared
leadership within undergraduate student design teams.
1. Leadership for undergraduate capstone design teams is a complex
phenomenon, encompassing both distribution and amount across three
different leadership forms.
Across the three forms of leadership, this study identified different relationships
between decentralization and density with both team effectiveness and team attributes.
For engineering education and engineering leadership researchers, results show that both
the amount and distribution of leadership, or the interaction between the two measures,
are important considerations for undergraduate engineering student design teams. This
study highlights the utility of measuring shared leadership using both network
135
decentralization and density in a rate the members approach. Previous studies have used
an aggregated rate the team approach or considered network density and network
decentralization separately in measuring shared leadership. These previous studies have
shown positive relationships between shared leadership and team effectiveness or team
performance (D'Innocenzo et al., 2014; Wang et al., 2014). Our current study has
investigated both density and decentralization to better render the complexity of
effectively sharing leadership. This dynamic should be accounted for in future research
designs, especially because our study demonstrates that specific forms of leadership do
not consist of a singular set of behaviors. Thus, researchers should be purposeful in how
they operationalize leadership within their studies.
2. Regarding team effectiveness, although shared leadership may be more
pervasive than vertical leadership within mechanical-engineering centric
capstone design teams:
a. Sharing leadership across the full breadth of a team may not be an
effective strategy.
The results show that a distributed, vertical form of leadership may be an optimal
strategy for mechanical engineering centric capstone design teams. This classification of
leadership, that maximizes the amount of leadership happening within the team while
limiting the distribution of leadership to a select few team members, was most consistent
with increased team effectiveness measures. As students and faculty structure design
teams, this study provides evidence that teams could be encouraged to adopt an approach
to leadership that increases the amount of leadership enacted while also accounting for
and coping with divergent influence from team members to maintain a focus on team
goals, consistent with previous research indicating the shared nature of leadership in
undergraduate engineering teams (Feister et al., 2014; Zafft et al., 2009). An immediate
strategy may be to limit leadership distribution within teams based on the results of this
study. More importantly, faculty may need to help teams develop strategies to evaluate
conflicting influences from within the team and stay focused towards their common
goals, which is consistent with the assertions of Muethal and Hoegl (2013) and
Schaeffner et al. (2015) regarding professional teams. As interventions are developed
that help students understand and incorporate shared leadership into their teamwork
136
processes, the moderating or negative effects of leadership distribution may diminish.
The result may be more engaged teams as they exert extra effort and are more satisfied
based on this study’s results.
b. Encouraging one central leader within the team may create a
leadership structure that is inconsistent with how leadership actually
occurs within design teams
Although a more vertical leadership strategy may be more effective for student design
teams, "vertical leadership" may not be synonymous with "individual leadership."
Faculty that attempt to specify or encourage a single leader within the design team may
unintentionally establish a leadership structure that is inconsistent with the collaborative
nature of design work. The results of this study suggest that within design teams, more
leadership within the teams may create more engaged teams as it relates positively to
measures of extra effort and satisfaction. Identifying one central leader may artificially
truncate the amount of leadership that could occur within the team. Although distributing
leadership had a moderating or negative relationship with measures of team effectiveness,
no teams in the study exhibited individual leadership, consistent with previous
descriptions of the shared, fluid nature of undergraduate engineering team leadership
(e.g., Feister et al., 2014; Zafft et al., 2009). Leadership structures encouraged through
team charters of course specific guidance could acknowledge this reality of design team
leadership
c. The type of leadership enacted by the team is important.
Engineering educators could also encourage students to enact leadership behaviors
consistent with TCR leadership. The results indicate that leadership is not a spectator
sport, as evidenced by the negative relationship between PA density and team member
satisfaction which is indicative of PA leadership behaviors (Antonakis & House, 2013).
Rather, TCR leadership, which is based on positive reinforcement and is the most active
form within the Full Range of Leadership model, had the most robust relationships with
team effectiveness measures, consistent with other meta-analyses (D'Innocenzo et al.,
2014; Wang et al., 2014). TCR-type leaders develop their fellow team members'
strengths, maintain a compelling vision, show a strong sense of purpose, and instill pride
in team members while challenging methodologies (Novoselich & Knight, 2015). These
137
leadership behaviors may create a more engaged team overall by shaping the way team
members interact as Chi and Huang (2014) assert. Although the accountability
associated with MEA leadership showed significant relationships when considered
separately, consistent with previous transactional leadership findings (Antonakis &
House, 2013; Lowe et al., 1996) and may be important for the technical, standards-based
field of engineering, TCR leadership dominated the parsimonious models for team
effectiveness among the leadership behaviors in more complex leadership models.
3. Several team attributes relate to the level of shared leadership within design
teams:
a. Team Engineering GPA and Engineering GPA diversity
The study indicates that the engineering discipline ability of students, as measured by
engineering course GPA, has the strongest, most prevalent relationships with the degree
of shared leadership across the three networks, consistent with expert power providing a
source of influence (French & Raven, 1959; Pierro et al., 2013; Tonso, 2007). For
engineering faculty wishing to develop effective leadership strategies within the teams as
a part of the capstone experience, these results indicate that the GPA of the team
members may play a role in determining the types of leadership experiences the team
member will have. Assigning students to teams in a way that increases the mean GPA of
the team may provide overall greater leadership engagement for those teams but may also
result in overall low leadership engagement for low mean GPA teams. GPA disparity
within the team, in contrast, may result in a lack of leadership experiences for some team
members, as the higher performing students have the potential to serve in what Rottmann
et al. (2014) call technical mastery roles. As shared leadership related to team
effectiveness in this study, higher GPA teams may exhibit extra effort and satisfaction,
leading to more engagement in the project. More diverse GPA teams may exhibit less
extra effort and satisfaction and overall less engagement.
b. Team Leadership Skills
Preparing students for the leadership challenges of a capstone design experience may
also be important in shaping the shared leadership of the design teams. Faculty may
consider how they develop engineering leadership skills in their students prior to the
capstone experience and the prior leadership experiences of the team members during
138
team formation. The significant relationships between team leadership skills and
network density across the three networks shows that how students perceive themselves
as leaders plays a role in the amount of leadership enacted in the team, which in turn
related to measures of team effectiveness and consistent with Paglis (2010) and Smith
and Foti (1998). Providing students opportunities to exhibit leadership, assess
performance, and reflect on their leadership skills (a type of on-the-job training) may
provide them the leadership awareness necessary for them to be more active contributors
to the leadership networks of their design team (Farr & Brazil, 2012). Although these
self-perceptions did not relate to how leadership was distributed across the teams, it did
contribute significantly to the amount of leadership happening within the teams, which
in-turn relates positively with both the extra effort and satisfaction of the team.
c. Team Size and Team Sex
Team size and sex may also help shape shared leadership within undergraduate
engineering student design teams. In general, the relationships were inconsistent with
previous studies relating leadership and sex (Eagly et al., 2003; Vinkenburg et al., 2011)
or social loafing (Karau & Williams, 1993). Neither variable related to TCR leadership,
but both related to MEA leadership, which involves maintaining accountability of
students within the team. As faculty assign students to teams within the capstone design
course, these two variable may relate to how students hold each other accountable. While
mentoring teams, faculty may need to pay closer attention to how accountability happens
in larger teams since these results indicate it is more distributed in larger teams. For
faculty with mixed sex teams, faculty may also want to monitor the team accountability
procedures to ensure team leaders continue to hold team members accountable, as MEA
density tended to decrease with an increased proportion of women on the team.
5.7 Future Work
Moving forward, this study has raised a series of questions that are worthy of further
inquiry. First, the moderating or negative relationships between leadership distribution
and team effectiveness highlights the need for a better understanding of effective
leadership distribution strategies for design teams. Further inquiry at the individual team
member level is ongoing with the current dataset but is beyond the scope of this study.
Additional qualitative research may also provide insights into the complexity of this
139
phenomenon beyond what the available numerical data provide. Second, along this same
research stream, investigating additional sources of leadership within design teams is
warranted. This study specifically considered only faculty advisors and student team
members. As a result, other sources of influence or leadership, such as teaching
assistants, customers/clients, and subject matter experts outside the team, were not
investigated. Future studies may include these potential sources of influence to see how
they are situated in the leadership networks. Third, the lack of significant relationships
between shared leadership and course grade were contrary to previous research findings
relating shared leadership and task performance in other contexts. Further inquiry is
warranted to determine how leadership relates to engineering design team task
performance using more purposefully developed measures than course assigned grades.
Nevertheless, the exploratory nature of this study raises many new questions regarding
leadership in design teams, all of which may help build and refine models for how
engineers lead.
140
Chapter 6
Leadership for Capstone Design Teams
6.1 Introduction
The purpose of this study was to investigate leadership processes within
undergraduate mechanical engineering-centric capstone design teams to 1) determine the
applicability of the shared Full Range of Leadership model, and 2) determine the
relationship between sharing the Full Range of Leadership and team effectiveness. To
meet those objectives, the study addressed the following research questions:
RQ3.1: To what extent do the scales that emerge from a modified Multifactor
Leadership Questionnaire used to measure the Full Range of Leadership fit the
undergraduate ME-centric student design team context?
RQ3.2: To what degree do the emerging leadership scales demonstrate validity by
relating to other variables in expected ways?
RQ4.1: To what degree is leadership shared within undergraduate mechanical
engineering-centric capstone design teams?
RQ4.2: To what degree does the level of shared leadership classify undergraduate
mechanical engineering-centric capstone design teams?
RQ5.1: How does the degree of shared leadership across the Full Range of
Leadership relate to undergraduate mechanical engineering-centric capstone
design team effectiveness?
RQ5.2: How do team-level attributes relate to the degree of shared leadership in
undergraduate mechanical engineering-centric capstone design teams?
This chapter synthesizes the findings of Chapters 3-5 that address those research
questions through a single illustration of effective leadership for mechanical engineering-
centric capstone design teams. The chapter then discusses implications of those findings
in terms of engineering education practice and engineering education research. The
chapter concludes with a proposal of future work that will stem from this dissertation.
141
6.2 An Illustration of Effective Leadership for ME-Centric Capstone Design Teams
6.2.1 The Full Range of Leadership for Design Teams
Chapter 3 applied the Full Range of Leadership Model to the ME-centric capstone
design team context. Addressing research question 3.1 in Chapter 3 established
leadership constructs that emerged from the Full Range of Leadership model within the
mechanical engineering-centric capstone design teams. A combination of prior published
exploratory factor analysis using all 36 leadership descriptive statements of the
Multifactor Leadership Questionnaire (MLQ) and follow-on confirmatory factor analysis
of a 14-item subset of the MLQ established that ME-centric capstone design teams enact
leadership in three forms:
Transformational/Contingent Reward (TCR) Leadership: Developing
team member strengths, maintaining a compelling vision, showing strong
sense of purpose, and instilling pride in team members. This construct
combines aspects of both the transformational leadership scale and the
contingent reward factor of the original Full Range of Leadership model.
Active Management by Exception (MEA) Leadership: Maintaining a
consistent focus on standards; identifying and tracking mistakes among
team members. This construct is directly interpretable with the
management by exception (active) factor of the original Full Range of
Leadership model.
Passive-Avoidant (PA) Leadership: Either a delay in action until serious
issues arise or a total absence of involvement, especially when needed.
This construct combines the laissez-faire with the passive management by
exception factor of the original Full Range of Leadership model.
The confirmatory factor analyses conducted in Chapter 3 established the internal
structure evidence of validity for these leadership constructs. These three forms of
leadership are exhibited simultaneously in varying degrees by the members and advisors
of the ME-centric capstone design teams; they are not mutually exclusive. There was a
strong, positive correlation between TCR and MEA leadership ratings. PA leadership
142
also showed strong, negative correlation with TCR leadership and moderate, negative
correlation with MEA leadership.
Analyses addressing research question 3.2 in Chapter 3 produced additional evidence
for the validity of these three leadership constructs beyond the internal structure
evidence. The three forms of leadership exhibited varying degrees of correlation with
student self-reported leadership skills and, to a lesser degree, self-reported team member
effort. The corresponding scale variables also distinguished students based on their self-
reported engineering course GPA. These relationships between the leadership scales and
other variables related to leadership provide evidence that the scales measure students'
leadership behaviors.
6.2.2 Shared Leadership in Design Teams
Research question 4.1, addressed in Chapter 4, situated the three forms of leadership
within a shared leadership framework. We used a combination of network
decentralization and network density measures to operationalize shared leadership within
the teams, following the recommendations of Mayo et al. (2003) and Gockel and Werth
(2010). The findings related to research question 3 indicated that all three forms of
leadership tend to be more shared than vertical across the 45 teams included in the
sample.
Research question 4.2, also addressed in Chapter 4, specified a classification system
for shared leadership in teams. Results indicated that the quadrant system of shared
leadership classification first proposed by Mayo et al. (2003) was adequate for classifying
shared leadership within ME-centric capstone design teams. Cluster analyses
differentiate the teams into two distinct groups across each of the six measures of shared
leadership incorporated into the study.
6.2.3 Shared Leadership’s Relationship to Team Effectiveness and Attributes.
Chapter 5 related the shared leadership framework to measures of team effectiveness
and describes relationships between team attributes and the level of shared leadership
within design teams. An overarching finding from Chapter 5 that addresses research
question 5.1 is that leadership related to team effectiveness for measures of extra effort
and satisfaction, but not for course grades. Regression results indicated that density had
positive relationships with team effectiveness for both TCR and MEA leadership and
143
negative relationships for PA leadership. Decentralization exhibited a moderating effect
on density for TCR and MEA leadership in relation to extra effort. Also, decentralization
showed a negative main effect for TCR leadership and a positive main effect for MEA
leadership related to satisfaction. These results indicated that there is a band of effective
amounts of decentralization for TCR and MEA leadership, with somewhat greater MEA
decentralization than TCR decentralization; leadership was optimal when shared among a
few team members, not the whole team, but also when it did not rest with a single
individual.
Regression models indicated that TCR leadership exhibited the strongest positive
relationships with team effectiveness measures, and MEA leadership showed weaker
relationships when considered separately. Analyses addressing research question 5.2
established relationships between team attributes and the degree to which forms of
leadership are shared. Team engineering GPA, engineering GPA diversity, team
leadership skills, team sex, and team size all related to either the decentralization or
density (or both) of one or more forms of leadership. Other team attributes exhibited
inconclusive or no relationships with the decentralization or density of the three forms of
leadership.
6.2.4 Visualizing Effective Design Team Leadership
Addressing the six research questions of this dissertation produced a summary
illustration of effective leadership for mechanical engineering-centric capstone design
teams (Figure 6.1). Each of the three studies contained in Chapters 3-5 add layers of
complexity to the illustration.
Chapter 3 established the 3 forms of leadership (i.e., TCR, MEA, and PA) enacted by
the capstone design teams, which is a modification of the Full Range of Leadership
model for the ME capstone context. As a result, Chapter 3 established the need for three
separate forms of leadership (PA, MEA, and TCR) in Figure 6.1.
Chapter 4 determined the degree to which the three forms of leadership were shared
among the teams and specified a classification strategy for team leadership. Thus, results
in Chapter 4 correspondingly situated the three forms of leadership within the shared
leadership framework of Figure 6.1. The framework accounts for both amount (density)
and distribution (decentralization) to describe how a team shares each form of leadership.
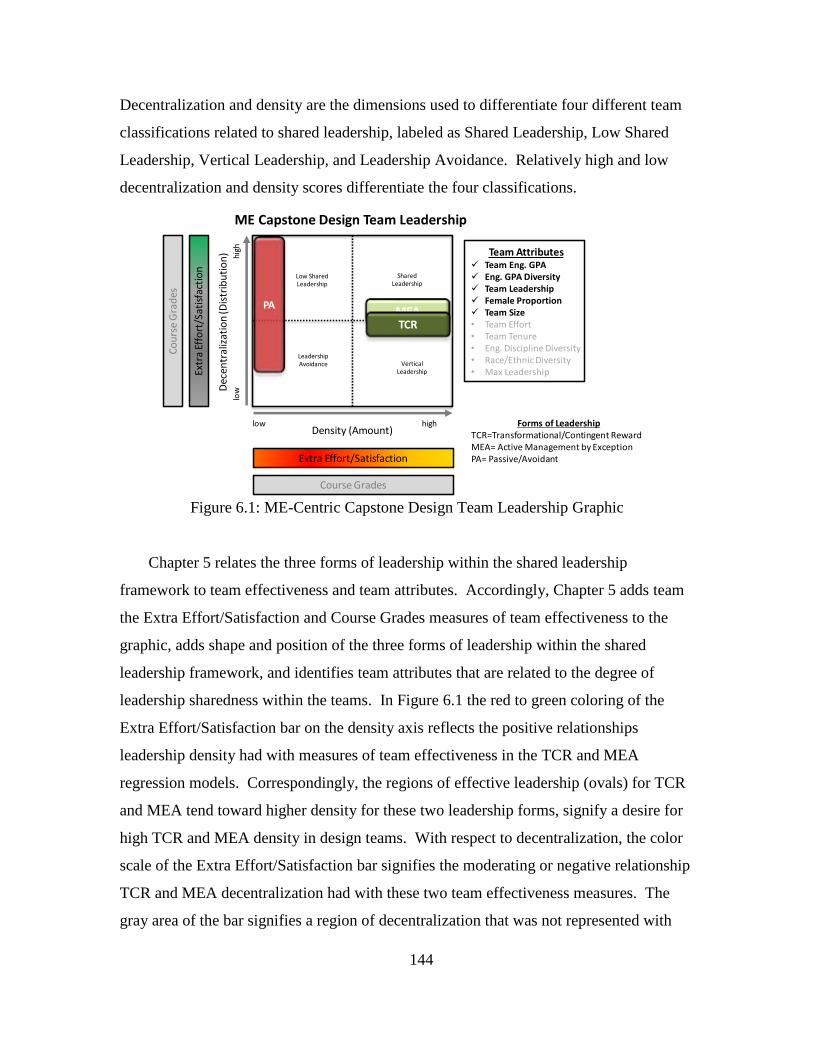
144
Decentralization and density are the dimensions used to differentiate four different team
classifications related to shared leadership, labeled as Shared Leadership, Low Shared
Leadership, Vertical Leadership, and Leadership Avoidance. Relatively high and low
decentralization and density scores differentiate the four classifications.
MEA
low high
Dec
entr
aliz
atio
n (D
istr
ibu
tio
n)
Shared Leadership
Vertical Leadership
Low Shared Leadership
Leadership Avoidance
TCR
Density (Amount)
low
high Team Attributes
Team Eng. GPA Eng. GPA Diversity Team Leadership Female Proportion Team Size• Team Effort• Team Tenure• Eng. Discipline Diversity• Race/Ethnic Diversity• Max Leadership
Extra Effort/Satisfaction
Extr
a Ef
fort
/Sat
isfa
ctio
n
Course Grades
Co
urs
e G
rad
es
ME Capstone Design Team Leadership
Forms of LeadershipTCR=Transformational/Contingent RewardMEA= Active Management by ExceptionPA= Passive/Avoidant
PA
Figure 6.1: ME-Centric Capstone Design Team Leadership Graphic
Chapter 5 relates the three forms of leadership within the shared leadership
framework to team effectiveness and team attributes. Accordingly, Chapter 5 adds team
the Extra Effort/Satisfaction and Course Grades measures of team effectiveness to the
graphic, adds shape and position of the three forms of leadership within the shared
leadership framework, and identifies team attributes that are related to the degree of
leadership sharedness within the teams. In Figure 6.1 the red to green coloring of the
Extra Effort/Satisfaction bar on the density axis reflects the positive relationships
leadership density had with measures of team effectiveness in the TCR and MEA
regression models. Correspondingly, the regions of effective leadership (ovals) for TCR
and MEA tend toward higher density for these two leadership forms, signify a desire for
high TCR and MEA density in design teams. With respect to decentralization, the color
scale of the Extra Effort/Satisfaction bar signifies the moderating or negative relationship
TCR and MEA decentralization had with these two team effectiveness measures. The
gray area of the bar signifies a region of decentralization that was not represented with
145
the team data in this study. Both TCR and MEA Leadership are also centrally located on
the decentralization axis and limited in height to signify that both forms of leadership are
shared to some degree in teams (none of the 45 teams displayed individual leadership),
but that decentralization could be limited. In Figure 6.1 The darker green coloring for
TCR leadership in comparison to MEA leadership and the overshadow of TCR leadership
signifies how when TCR and MEA leadership were combined in more complex
regression models, TCR leadership remained significant while MEA did not. PA
leadership tends toward lower density and is colored a translucent red to reflect a need to
minimize this form of leadership for team effectiveness. PA leadership also covers the
range of decentralization by which the team data reflected to signify that there is no
relationship between PA decentralization and team effectiveness measures within the
range covered in this study. In Figure 6.1, Course Grades remains gray to signify the
lack of relationships with shared leadership determined by this study. Finally, the team
attributes box shows checks for those team attributes that relate to shared leadership in
this study and lists all attributes investigated to encourage future consideration of these
variables.
This illustration provides a preliminary framework by which mechanical engineering
capstone design students and faculty may better understand the leadership phenomenon.
Investigating the phenomenon from a shared leadership perspective, this illustration
conceptualizes leadership as a three-form influence process varying in both amount and
distribution within engineering design teams. Because this research was informed by the
Full Range of Leadership model, the breadth of leadership literature related to the
constructs it contains may provide additional insight into effective leadership practices
from which engineers may draw and provide much needed insight into how to develop
these practices in student engineers.
Context is an important consideration for interpreting this study of shared leadership.
Although much of the literature that informed this research related to professional
contexts, including both engineering and other disciplines, the academic environment
within which we conducted this research differentiates itself from professional practice in
a number of ways (Stevens, Johri, & O’Connor, 2014). First, the novice and peer nature
of the 45 teams incorporated into this study would be hard to replicate in professional
146
practice. Stevens et al. (2014) describes professional engineering practice as
heterogeneous; consequently, professional design teams would most likely be comprised
of engineers with varying levels of professional experience and subject matter expertise.
These differences may create a more vertical leadership environment than the more
homogeneous student teams of this research. Second, task performance has different
connotation in the professional environment when compared to the academic setting
studied. The student teams may have much greater ability to fail in their design task than
would a professional team. Because the capstone design course is still a learning
environment, a satisfactory outcome of the experience may produce a failed design, but a
lot of learning could still occur based on how and why the team failed in their design task
(Paretti et al., 2011). In a professional engineering environment, similar outcomes would
be an unrealistic long-term business model. Thus, the relationships between shared
leadership and task performance may differ across contexts. In light of these distinctions,
additional research is warranted before this model may be applied to professional
engineering practice.
6.3 Implications
6.3.1 Implications for Engineering Education Practice
Identifying shared leadership as an appropriate model for undergraduate engineering
design teams may inform how capstone design faculty discuss and promote leadership
within their classes. Course tools, such as team charters, used to facilitate team formation
may inadvertently push students toward team leadership approaches that are inconsistent
with the realities of how leadership actually happens within the teams. For example, the
specification of a single leader at two of the three sites in this study contradicts the
pervasive shared leadership that actually occurred within the design teams and is an
inconsistent approach with the ways in which shared leadership related to team
effectiveness. These results suggest that a more appropriate means for addressing the
formation of leadership may be to identify multiple leadership roles and responsibilities.
Facilitating this level of discussion may help create an enabling team structure that can
promote greater effectiveness by allowing multiple leaders to emerge within the team.
The shared leadership illustration developed in this study provides an additional
resource that faculty may consider when mentoring design teams. By modeling effective
147
leadership practices themselves and making students aware of effective leadership
processes, faculty may allow a more satisfying capstone design experience and increase
the engagement of the students. TCR leadership outweighed both MEA and PA
leadership behaviors in its relationship to team effectiveness. Faculty may consider
adopting TCR behaviors and encourage students to adopt them as a part of their capstone
design team experiences. The results of this study provide indications that teams may put
forth additional effort and be more satisfied with the experience, both of which may
promote greater learning for students.
The results of this study provide additional evidence to support the importance of
team composition for undergraduate capstone design teaming processes. For faculty
wishing to address leadership skills as a part of the capstone design experience, how
students are assigned to teams may play a role in students' leadership processes and
experiences. Students’ engineering course GPA showed the strongest relationships with
shared leadership, with greater GPA diversity relating to decreased shared leadership. A
more equitable distribution of GPAs across the team may increase leadership sharing
within the teams. In addition, students’ leadership self-efficacy could become a
consideration for faculty, as results indicated that teams with higher self-reported
leadership skills engaged in more, active leadership. Finally, the size and sex of the team
may play a role in the level of MEA leadership that occurs. Understanding these
leadership dynamics may provide capstone design faculty the ability to better tailor the
capstone design experience to meet the developmental needs of students preparing for
leadership roles in engineering professional practice.
6.3.2 Implications for Engineering Education Research
Identifying shared leadership as a pervasive model within capstone design teams
may change how researchers conceptualize the phenomenon of leadership, particularly
for the engineering context. The results of this study encourage the broadening of
leadership conceptualizations beyond its historical embodiment within a single person, as
multiple individuals play a role in leading design teams. Researchers considering the
leadership of only one individual within design teams may artificially reduce the
complexity of team leadership.
148
This study developed a new methodology for quantitative study of a team-level
phenomenon for engineering design teams. Using a combination of social network
analysis and more traditional statistical techniques, this study operationalized the
theoretical propositions of Mayo et al. (2003), Gockel and Werth (2010), and Cox et al.
(2003). Leader-follower relationships occurring across the breadth of the design team
were distilled into both decentralization and density measures that could be used as both
dependent and independent variables for follow-on analysis. Teamwork researchers may
consider the use of social network analyses for various other teamwork related topics
involving multiple interactions, such as social loafing, shared cognition, communication,
or situated knowledge distribution.
By applying the Full Range of Leadership model to the undergraduate engineering
design team context, this study opens a wealth of literature from which engineering
education researchers may better understand leadership within engineering design teams.
The three forms of leadership explored in this study were conceptually similar to forms
identified by other leadership scholars outside the undergraduate engineering design team
context. Consequently, the wide range of scholarly publication regarding the Full Range
of Leadership model may help engineering education researchers develop ideas for
understanding the leadership phenomenon for engineers; the engineering education
community may not need to start from scratch.
Finally, the illustration developed in this study provides a framework and taxonomy
of leadership behaviors that may help researchers classify engineering leadership
behaviors and sharing. This study provides a common frame of reference and
terminology for which future engineering education researchers can discuss leadership-
related findings.
6.4 Future Studies
The results of this study encourage the following areas for further exploration:
Comparison of leadership decentralization and density relationships to team
effectiveness separately so that results may be more directly compared with
previous quantitative studies.
149
Replication of the current research design within other engineering
disciplines, across multiple academic years, and for professional practice to
determine variations of findings from those of this study.
Investigation of student team member prominence in the leadership networks
to determine characteristics of students who tend to exhibit different forms of
leadership within design teams.
Investigation of faculty advisor prominence in the leadership network to
determine relationships with shared leadership and team effectiveness.
Exploration of other sources of leadership for capstone design teams beyond
those covered in this study (e.g., Graduate Teaching Assistants, Clients,
Sponsors, or Subject Matter Experts).
Qualitative study to better understand how leadership roles transition across
individuals within the design teams.
Structural equation modeling of shared leadership and team effectiveness,
which allows for leadership decentralization and density to serve as both
dependent and independent variables within a single model.
6.5 Concluding Remarks
An original intent of this study was to make leadership more approachable to
engineers and engineering educators. Through over two years of work, I am unsure
whether this study met that objective. What I have been able to show is that leadership is
a complex influence process when examined at the team level. Complexity, however,
can often be a result of a combination of many simpler things. A friend once told me that
the Space Shuttle may seem complex, but it is really just a bunch of nuts and bolts. The
complexity comes from how the nuts and bolts are stacked together. My hope is that this
inaugural, team-level investigation of shared leadership does not detract from one central
theme that I have personally experienced in my over twenty years of professional
leadership experience. Leadership is about people—people as individuals. This study has
illuminated three forms of leadership enacted by people when placed in a capstone design
team context. The form of leadership that focuses most on caring for the individual
person (TCR) has the strongest relationships with team effectiveness. It further
highlights that leadership is most often a shared activity among multiple team members
150
for capstone design teams, and sharing leadership in that way may increase the team's
extra effort and satisfaction. I hope that readers can walk away from this dissertation
with those two central themes; if so, then I consider this work a success.
In many ways, the completion of this dissertation is a new beginning. The study has
illuminated a number of implications for engineering education practice and research.
Results show that purposeful leadership development may provide an additional resource
for faculty to enhance the capstone design experience and prepare students as future
engineering leaders. That can only be the case if these results are shared with the broader
community, and this dissertation was written in a three manuscript (Chapters 3-5) format
for that reason. At the time of publication, the manuscripts contained in this document
are either in preparation for or under review by engineering education scholars. My
sincere hope is that those manuscripts may help engineers pause and reconsider how they
conceptualize leadership and realize its utility as an influence process for reaching design
team goals.
151
Appendix A: Summary of Pilot Exploratory Factor Analysis.
Exploratory factor analysis was conducted using the maximum likelihood method
with oblique rotation using the Oblimin with Kaiser normalization rotation method
(Novoselich & Knight, 2015), and six-, three-, and nine-factor models were considered
based on eigenvalues. Novoselich and Knight (2015) ultimately determined that a three-
scale model was most suitable for use because of its consistency with the Full Range of
Leadership Model.
Substantive differences between the theory’s original leadership constructs and those
that emerged from data analysis required a re-naming of the three scales. Scale 1, which
was comprised of the theory’s transformational items as well as the contingent reward
items was named Transformational/Contingent Reward (TCR). Scale 2, comprised of
both Laissez-Faire and Management-by-Exception Passive, was named Passive-Avoidant
(PA), consistent with the naming convention used by Avolio et al. (1999) in previous
analyses of the MLQ. All of the items of Management-by-Exception (Active) loaded
onto Scale 3; correspondingly, the scale was named Active Management-by-Exception
(MEA) to reflect the fact that this scale maintained the same dimensions as the original
MLQ factor.
Pilot study data collection indicated that the round robin format of the 36-item
survey resulted in survey fatigue. The length of the survey may have decreased the
overall response rate, consistent with the assertions of Grunspan et al. (2014) who explain
how survey fatigue is a heightened concern for network studies. The round-robin type
surveys used in network studies can be more taxing as students must rate all network
members rather than just themselves. Time to complete the full survey ranged from 11 to
27 minutes. Anecdotal comments from students who completed the survey identified
survey fatigue as a concern, especially for larger teams. At one institution, 49% of
responses were incomplete despite indications that the students opened the survey and
viewed the round-robin questions. Factor analysis could only be accomplished using
complete survey responses.
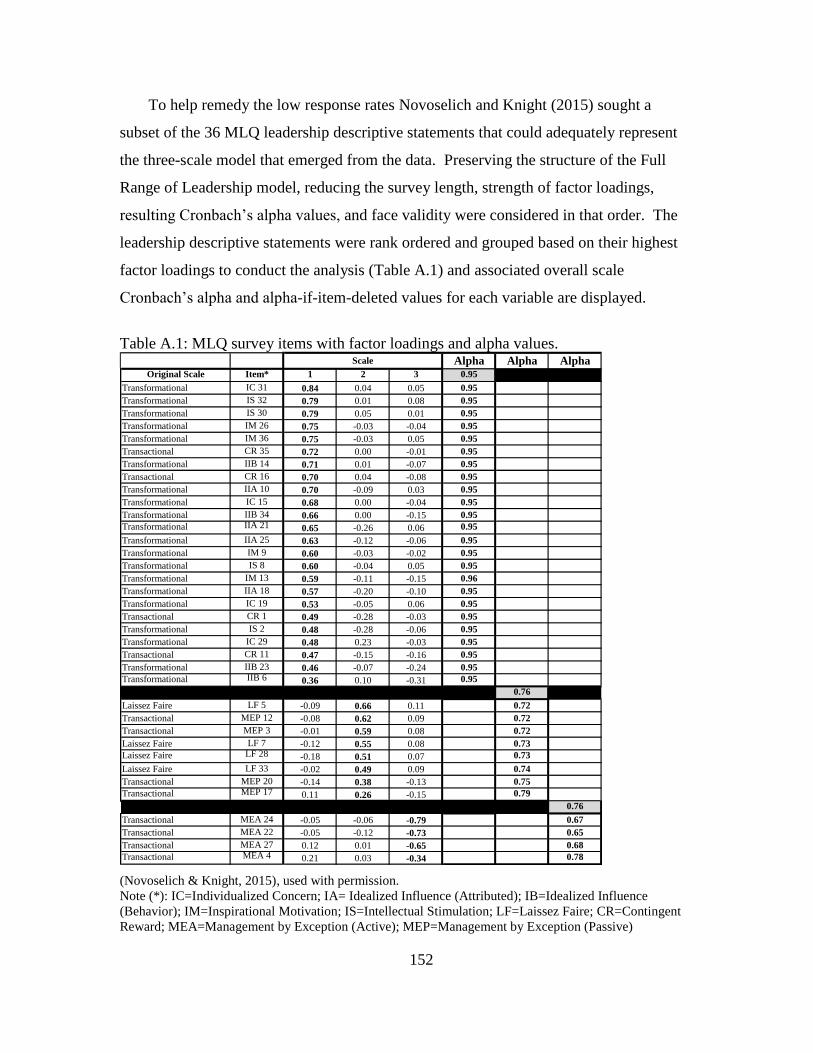
152
To help remedy the low response rates Novoselich and Knight (2015) sought a
subset of the 36 MLQ leadership descriptive statements that could adequately represent
the three-scale model that emerged from the data. Preserving the structure of the Full
Range of Leadership model, reducing the survey length, strength of factor loadings,
resulting Cronbach’s alpha values, and face validity were considered in that order. The
leadership descriptive statements were rank ordered and grouped based on their highest
factor loadings to conduct the analysis (Table A.1) and associated overall scale
Cronbach’s alpha and alpha-if-item-deleted values for each variable are displayed.
Table A.1: MLQ survey items with factor loadings and alpha values. Alpha Alpha Alpha
Original Scale Item* 1 2 3 0.95
Transformational IC 31 0.84 0.04 0.05 0.95
Transformational IS 32 0.79 0.01 0.08 0.95
Transformational IS 30 0.79 0.05 0.01 0.95
Transformational IM 26 0.75 -0.03 -0.04 0.95
Transformational IM 36 0.75 -0.03 0.05 0.95
Transactional CR 35 0.72 0.00 -0.01 0.95
Transformational IIB 14 0.71 0.01 -0.07 0.95
Transactional CR 16 0.70 0.04 -0.08 0.95
Transformational IIA 10 0.70 -0.09 0.03 0.95
Transformational IC 15 0.68 0.00 -0.04 0.95
Transformational IIB 34 0.66 0.00 -0.15 0.95
Transformational IIA 21 0.65 -0.26 0.06 0.95
Transformational IIA 25 0.63 -0.12 -0.06 0.95
Transformational IM 9 0.60 -0.03 -0.02 0.95
Transformational IS 8 0.60 -0.04 0.05 0.95
Transformational IM 13 0.59 -0.11 -0.15 0.96
Transformational IIA 18 0.57 -0.20 -0.10 0.95
Transformational IC 19 0.53 -0.05 0.06 0.95
Transactional CR 1 0.49 -0.28 -0.03 0.95
Transformational IS 2 0.48 -0.28 -0.06 0.95
Transformational IC 29 0.48 0.23 -0.03 0.95
Transactional CR 11 0.47 -0.15 -0.16 0.95
Transformational IIB 23 0.46 -0.07 -0.24 0.95
Transformational IIB 6 0.36 0.10 -0.31 0.95
0.76
Laissez Faire LF 5 -0.09 0.66 0.11 0.72
Transactional MEP 12 -0.08 0.62 0.09 0.72
Transactional MEP 3 -0.01 0.59 0.08 0.72
Laissez Faire LF 7 -0.12 0.55 0.08 0.73
Laissez Faire LF 28 -0.18 0.51 0.07 0.73
Laissez Faire LF 33 -0.02 0.49 0.09 0.74
Transactional MEP 20 -0.14 0.38 -0.13 0.75
Transactional MEP 17 0.11 0.26 -0.15 0.79
Alpha of 7,3,12,5 is 0.757 SPSS 23 Jul. 0.76
Transactional MEA 24 -0.05 -0.06 -0.79 0.67
Transactional MEA 22 -0.05 -0.12 -0.73 0.65
Transactional MEA 27 0.12 0.01 -0.65 0.68
Transactional MEA 4 0.21 0.03 -0.34 0.78
Scale
(Novoselich & Knight, 2015), used with permission.
Note (*): IC=Individualized Concern; IA= Idealized Influence (Attributed); IB=Idealized Influence
(Behavior); IM=Inspirational Motivation; IS=Intellectual Stimulation; LF=Laissez Faire; CR=Contingent
Reward; MEA=Management by Exception (Active); MEP=Management by Exception (Passive)
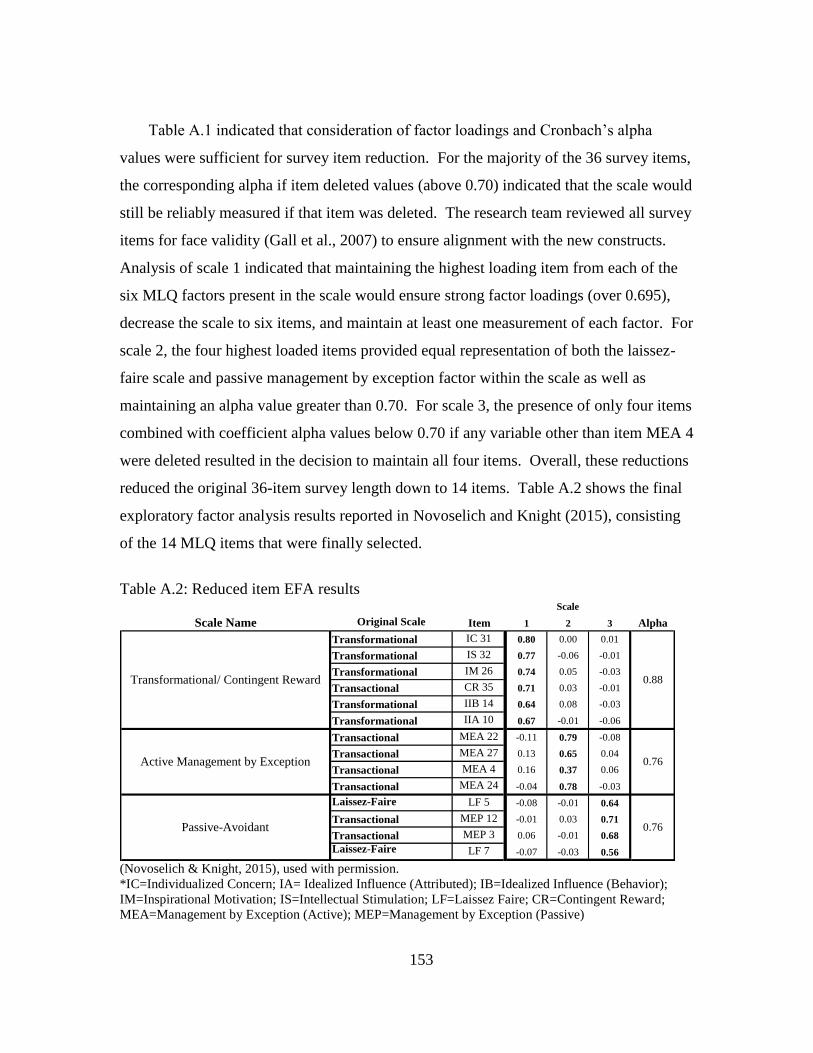
153
Table A.1 indicated that consideration of factor loadings and Cronbach’s alpha
values were sufficient for survey item reduction. For the majority of the 36 survey items,
the corresponding alpha if item deleted values (above 0.70) indicated that the scale would
still be reliably measured if that item was deleted. The research team reviewed all survey
items for face validity (Gall et al., 2007) to ensure alignment with the new constructs.
Analysis of scale 1 indicated that maintaining the highest loading item from each of the
six MLQ factors present in the scale would ensure strong factor loadings (over 0.695),
decrease the scale to six items, and maintain at least one measurement of each factor. For
scale 2, the four highest loaded items provided equal representation of both the laissez-
faire scale and passive management by exception factor within the scale as well as
maintaining an alpha value greater than 0.70. For scale 3, the presence of only four items
combined with coefficient alpha values below 0.70 if any variable other than item MEA 4
were deleted resulted in the decision to maintain all four items. Overall, these reductions
reduced the original 36-item survey length down to 14 items. Table A.2 shows the final
exploratory factor analysis results reported in Novoselich and Knight (2015), consisting
of the 14 MLQ items that were finally selected.
Table A.2: Reduced item EFA results
Scale Name Original Scale Item 1 2 3 Alpha
Transformational IC 31 0.80 0.00 0.01
Transformational IS 32 0.77 -0.06 -0.01
Transformational IM 26 0.74 0.05 -0.03
Transactional CR 35 0.71 0.03 -0.01
Transformational IIB 14 0.64 0.08 -0.03
Transformational IIA 10 0.67 -0.01 -0.06
Transactional MEA 22 -0.11 0.79 -0.08
Transactional MEA 27 0.13 0.65 0.04
Transactional MEA 4 0.16 0.37 0.06
Transactional MEA 24 -0.04 0.78 -0.03
Laissez-Faire LF 5 -0.08 -0.01 0.64
Transactional MEP 12 -0.01 0.03 0.71
Transactional MEP 3 0.06 -0.01 0.68
Laissez-Faire LF 7 -0.07 -0.03 0.56
Passive-Avoidant 0.76
Scale
Transformational/ Contingent Reward 0.88
Active Management by Exception 0.76
(Novoselich & Knight, 2015), used with permission. *IC=Individualized Concern; IA= Idealized Influence (Attributed); IB=Idealized Influence (Behavior);
IM=Inspirational Motivation; IS=Intellectual Stimulation; LF=Laissez Faire; CR=Contingent Reward;
MEA=Management by Exception (Active); MEP=Management by Exception (Passive)

154
In this final exploratory analysis, eigenvalues supported a three-scale structure from
the 14 individual items. All three scales provided adequate reliability with Cronbach’s
alpha greater than 0.70 (Cortina, 1993). These 14 items comprised the leadership
descriptive statements incorporated in the current study.
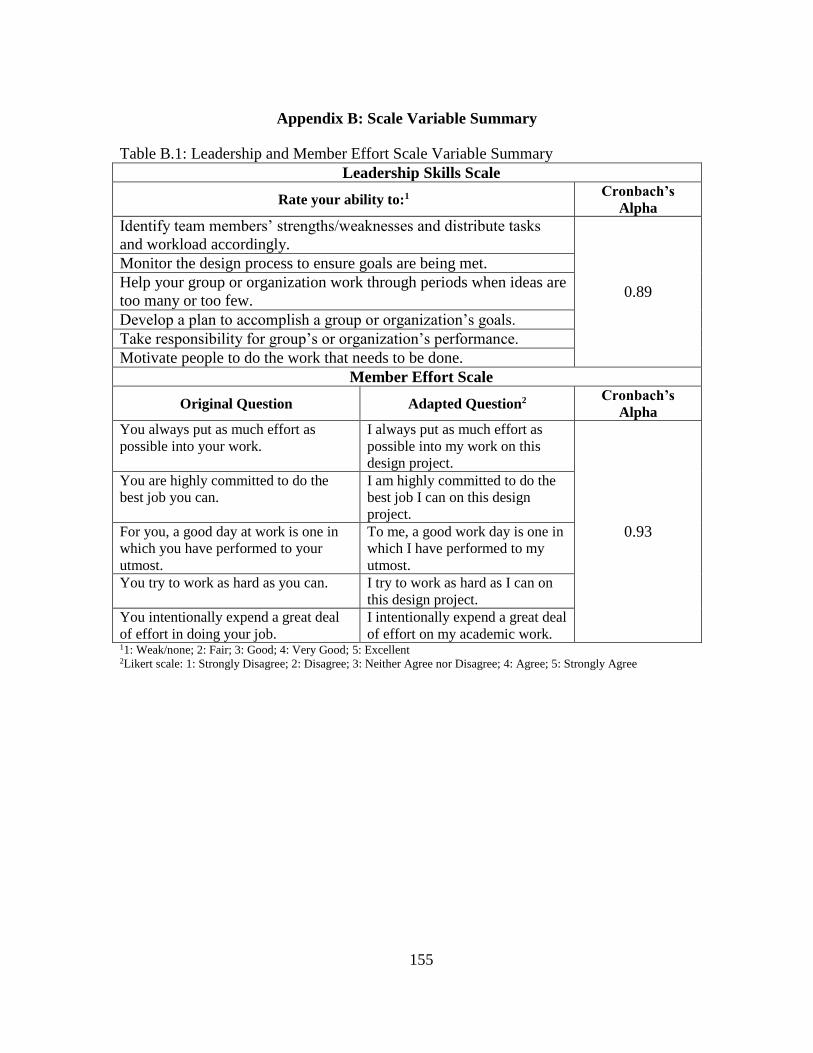
155
Appendix B: Scale Variable Summary
Table B.1: Leadership and Member Effort Scale Variable Summary
Leadership Skills Scale
Rate your ability to:1 Cronbach’s
Alpha
Identify team members’ strengths/weaknesses and distribute tasks
and workload accordingly.
0.89
Monitor the design process to ensure goals are being met.
Help your group or organization work through periods when ideas are
too many or too few.
Develop a plan to accomplish a group or organization’s goals.
Take responsibility for group’s or organization’s performance.
Motivate people to do the work that needs to be done.
Member Effort Scale
Original Question Adapted Question2 Cronbach’s
Alpha
You always put as much effort as
possible into your work. I always put as much effort as
possible into my work on this
design project.
0.93
You are highly committed to do the
best job you can. I am highly committed to do the
best job I can on this design
project. For you, a good day at work is one in
which you have performed to your
utmost.
To me, a good work day is one in
which I have performed to my
utmost. You try to work as hard as you can. I try to work as hard as I can on
this design project. You intentionally expend a great deal
of effort in doing your job. I intentionally expend a great deal
of effort on my academic work. 11: Weak/none; 2: Fair; 3: Good; 4: Very Good; 5: Excellent 2Likert scale: 1: Strongly Disagree; 2: Disagree; 3: Neither Agree nor Disagree; 4: Agree; 5: Strongly Agree
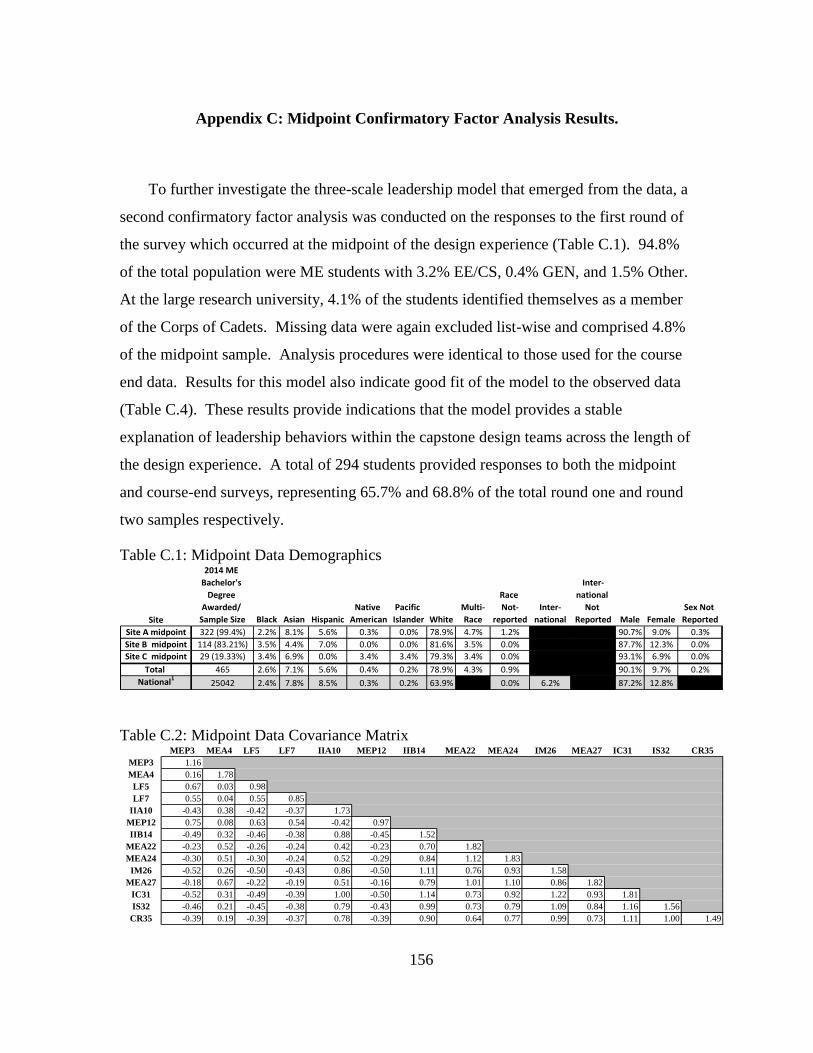
156
Appendix C: Midpoint Confirmatory Factor Analysis Results.
To further investigate the three-scale leadership model that emerged from the data, a
second confirmatory factor analysis was conducted on the responses to the first round of
the survey which occurred at the midpoint of the design experience (Table C.1). 94.8%
of the total population were ME students with 3.2% EE/CS, 0.4% GEN, and 1.5% Other.
At the large research university, 4.1% of the students identified themselves as a member
of the Corps of Cadets. Missing data were again excluded list-wise and comprised 4.8%
of the midpoint sample. Analysis procedures were identical to those used for the course
end data. Results for this model also indicate good fit of the model to the observed data
(Table C.4). These results provide indications that the model provides a stable
explanation of leadership behaviors within the capstone design teams across the length of
the design experience. A total of 294 students provided responses to both the midpoint
and course-end surveys, representing 65.7% and 68.8% of the total round one and round
two samples respectively.
Table C.1: Midpoint Data Demographics
Site
2014 ME
Bachelor's
Degree
Awarded/
Sample Size Black Asian Hispanic
Native
American
Pacific
Islander White
Multi-
Race
Race
Not-
reported
Inter-
national
Inter-
national
Not
Reported Male Female
Sex Not
Reported
Site A midpoint 322 (99.4%) 2.2% 8.1% 5.6% 0.3% 0.0% 78.9% 4.7% 1.2% 90.7% 9.0% 0.3%
Site B midpoint 114 (83.21%) 3.5% 4.4% 7.0% 0.0% 0.0% 81.6% 3.5% 0.0% 87.7% 12.3% 0.0%
Site C midpoint 29 (19.33%) 3.4% 6.9% 0.0% 3.4% 3.4% 79.3% 3.4% 0.0% 93.1% 6.9% 0.0%
Total 465 2.6% 7.1% 5.6% 0.4% 0.2% 78.9% 4.3% 0.9% 90.1% 9.7% 0.2%
National1
25042 2.4% 7.8% 8.5% 0.3% 0.2% 63.9% 0.0% 0.0% 6.2% 0.0% 87.2% 12.8% 0.0%
Table C.2: Midpoint Data Covariance Matrix MEP3 MEA4 LF5 LF7 IIA10 MEP12 IIB14 MEA22 MEA24 IM26 MEA27 IC31 IS32 CR35
MEP3 1.16
MEA4 0.16 1.78
LF5 0.67 0.03 0.98
LF7 0.55 0.04 0.55 0.85
IIA10 -0.43 0.38 -0.42 -0.37 1.73
MEP12 0.75 0.08 0.63 0.54 -0.42 0.97
IIB14 -0.49 0.32 -0.46 -0.38 0.88 -0.45 1.52
MEA22 -0.23 0.52 -0.26 -0.24 0.42 -0.23 0.70 1.82
MEA24 -0.30 0.51 -0.30 -0.24 0.52 -0.29 0.84 1.12 1.83
IM26 -0.52 0.26 -0.50 -0.43 0.86 -0.50 1.11 0.76 0.93 1.58
MEA27 -0.18 0.67 -0.22 -0.19 0.51 -0.16 0.79 1.01 1.10 0.86 1.82
IC31 -0.52 0.31 -0.49 -0.39 1.00 -0.50 1.14 0.73 0.92 1.22 0.93 1.81
IS32 -0.46 0.21 -0.45 -0.38 0.79 -0.43 0.99 0.73 0.79 1.09 0.84 1.16 1.56
CR35 -0.39 0.19 -0.39 -0.37 0.78 -0.39 0.90 0.64 0.77 0.99 0.73 1.11 1.00 1.49
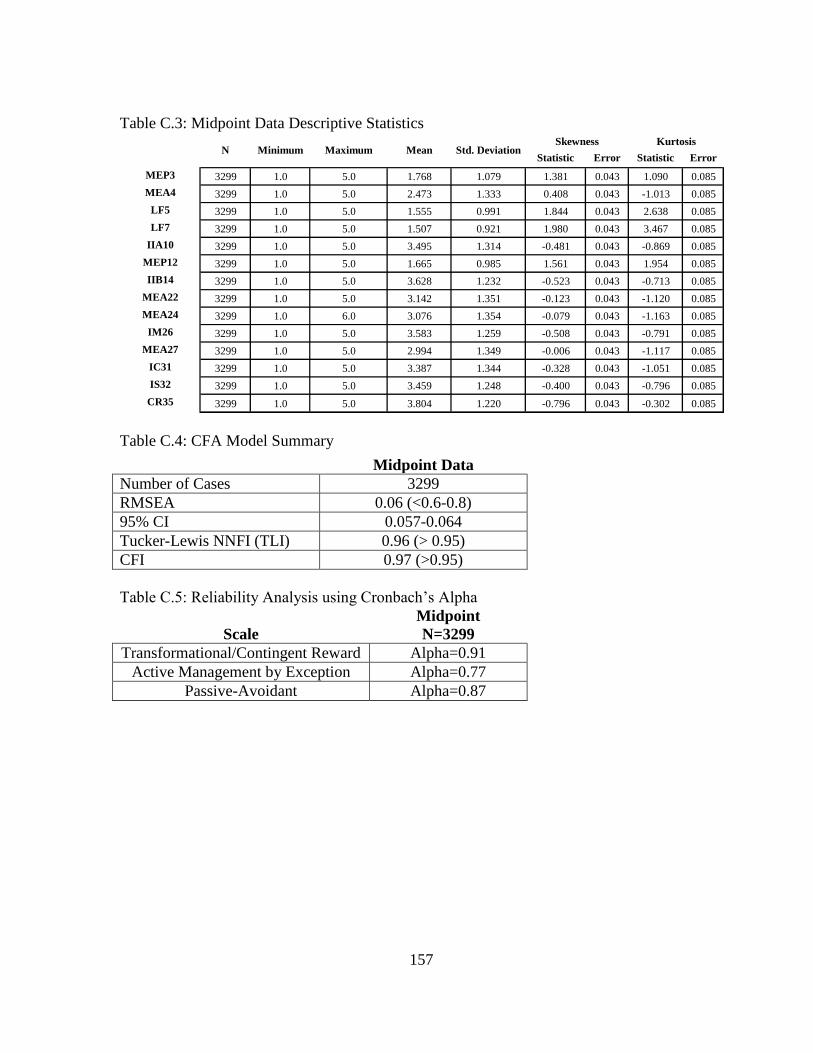
157
Table C.3: Midpoint Data Descriptive Statistics
Statistic
Std.
Error Statistic
Std.
Error
MEP3 3299 1.0 5.0 1.768 1.079 1.381 0.043 1.090 0.085
MEA4 3299 1.0 5.0 2.473 1.333 0.408 0.043 -1.013 0.085
LF5 3299 1.0 5.0 1.555 0.991 1.844 0.043 2.638 0.085
LF7 3299 1.0 5.0 1.507 0.921 1.980 0.043 3.467 0.085
IIA10 3299 1.0 5.0 3.495 1.314 -0.481 0.043 -0.869 0.085
MEP12 3299 1.0 5.0 1.665 0.985 1.561 0.043 1.954 0.085
IIB14 3299 1.0 5.0 3.628 1.232 -0.523 0.043 -0.713 0.085
MEA22 3299 1.0 5.0 3.142 1.351 -0.123 0.043 -1.120 0.085
MEA24 3299 1.0 6.0 3.076 1.354 -0.079 0.043 -1.163 0.085
IM26 3299 1.0 5.0 3.583 1.259 -0.508 0.043 -0.791 0.085
MEA27 3299 1.0 5.0 2.994 1.349 -0.006 0.043 -1.117 0.085
IC31 3299 1.0 5.0 3.387 1.344 -0.328 0.043 -1.051 0.085
IS32 3299 1.0 5.0 3.459 1.248 -0.400 0.043 -0.796 0.085
CR35 3299 1.0 5.0 3.804 1.220 -0.796 0.043 -0.302 0.085
Mean Std. DeviationSkewness Kurtosis
N Minimum Maximum
Table C.4: CFA Model Summary
Midpoint Data
Number of Cases 3299
RMSEA 0.06 (<0.6-0.8)
95% CI 0.057-0.064
Tucker-Lewis NNFI (TLI) 0.96 (> 0.95)
CFI 0.97 (>0.95)
Table C.5: Reliability Analysis using Cronbach’s Alpha
Scale
Midpoint
N=3299
Transformational/Contingent Reward Alpha=0.91
Active Management by Exception Alpha=0.77
Passive-Avoidant Alpha=0.87
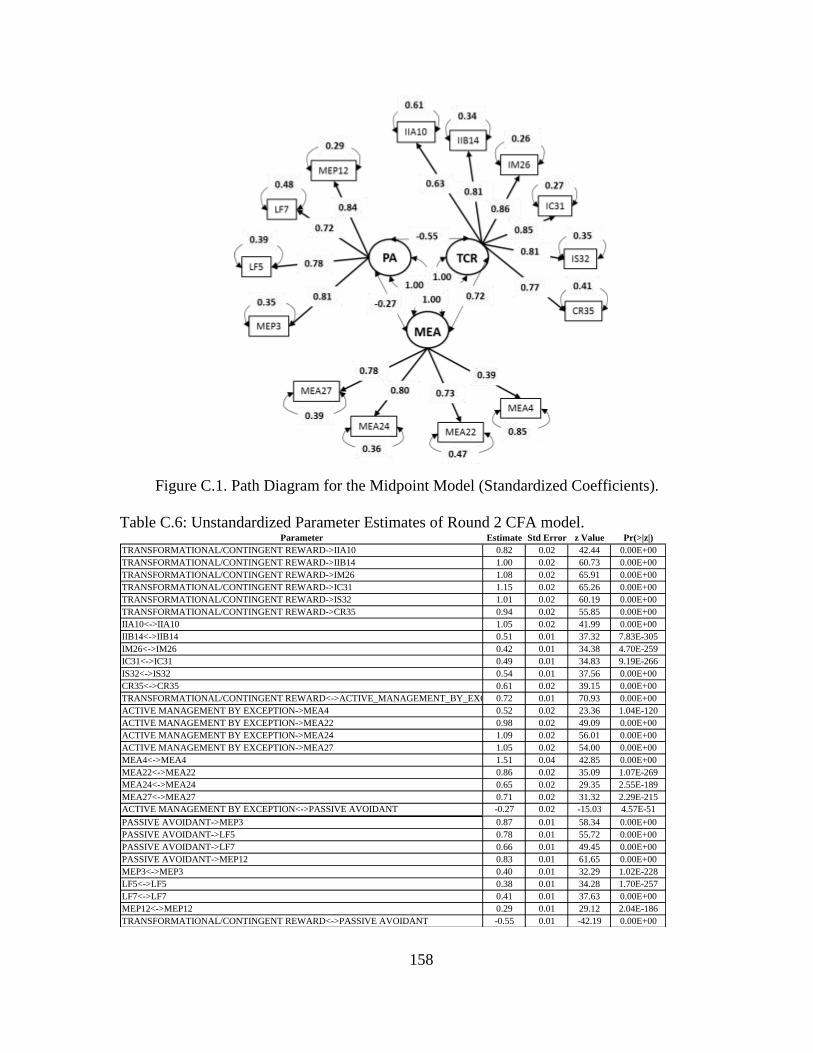
158
Figure C.1. Path Diagram for the Midpoint Model (Standardized Coefficients).
Table C.6: Unstandardized Parameter Estimates of Round 2 CFA model. Parameter Estimate Std Error z Value Pr(>|z|)
TRANSFORMATIONAL/CONTINGENT REWARD->IIA10 0.82 0.02 42.44 0.00E+00
TRANSFORMATIONAL/CONTINGENT REWARD->IIB14 1.00 0.02 60.73 0.00E+00
TRANSFORMATIONAL/CONTINGENT REWARD->IM26 1.08 0.02 65.91 0.00E+00
TRANSFORMATIONAL/CONTINGENT REWARD->IC31 1.15 0.02 65.26 0.00E+00
TRANSFORMATIONAL/CONTINGENT REWARD->IS32 1.01 0.02 60.19 0.00E+00
TRANSFORMATIONAL/CONTINGENT REWARD->CR35 0.94 0.02 55.85 0.00E+00
IIA10<->IIA10 1.05 0.02 41.99 0.00E+00
IIB14<->IIB14 0.51 0.01 37.32 7.83E-305
IM26<->IM26 0.42 0.01 34.38 4.70E-259
IC31<->IC31 0.49 0.01 34.83 9.19E-266
IS32<->IS32 0.54 0.01 37.56 0.00E+00
CR35<->CR35 0.61 0.02 39.15 0.00E+00
TRANSFORMATIONAL/CONTINGENT REWARD<->ACTIVE_MANAGEMENT_BY_EXCEPTION0.72 0.01 70.93 0.00E+00
ACTIVE MANAGEMENT BY EXCEPTION->MEA4 0.52 0.02 23.36 1.04E-120
ACTIVE MANAGEMENT BY EXCEPTION->MEA22 0.98 0.02 49.09 0.00E+00
ACTIVE MANAGEMENT BY EXCEPTION->MEA24 1.09 0.02 56.01 0.00E+00
ACTIVE MANAGEMENT BY EXCEPTION->MEA27 1.05 0.02 54.00 0.00E+00
MEA4<->MEA4 1.51 0.04 42.85 0.00E+00
MEA22<->MEA22 0.86 0.02 35.09 1.07E-269
MEA24<->MEA24 0.65 0.02 29.35 2.55E-189
MEA27<->MEA27 0.71 0.02 31.32 2.29E-215
ACTIVE MANAGEMENT BY EXCEPTION<->PASSIVE AVOIDANT -0.27 0.02 -15.03 4.57E-51
PASSIVE AVOIDANT->MEP3 0.87 0.01 58.34 0.00E+00
PASSIVE AVOIDANT->LF5 0.78 0.01 55.72 0.00E+00
PASSIVE AVOIDANT->LF7 0.66 0.01 49.45 0.00E+00
PASSIVE AVOIDANT->MEP12 0.83 0.01 61.65 0.00E+00
MEP3<->MEP3 0.40 0.01 32.29 1.02E-228
LF5<->LF5 0.38 0.01 34.28 1.70E-257
LF7<->LF7 0.41 0.01 37.63 0.00E+00
MEP12<->MEP12 0.29 0.01 29.12 2.04E-186
TRANSFORMATIONAL/CONTINGENT REWARD<->PASSIVE AVOIDANT -0.55 0.01 -42.19 0.00E+00
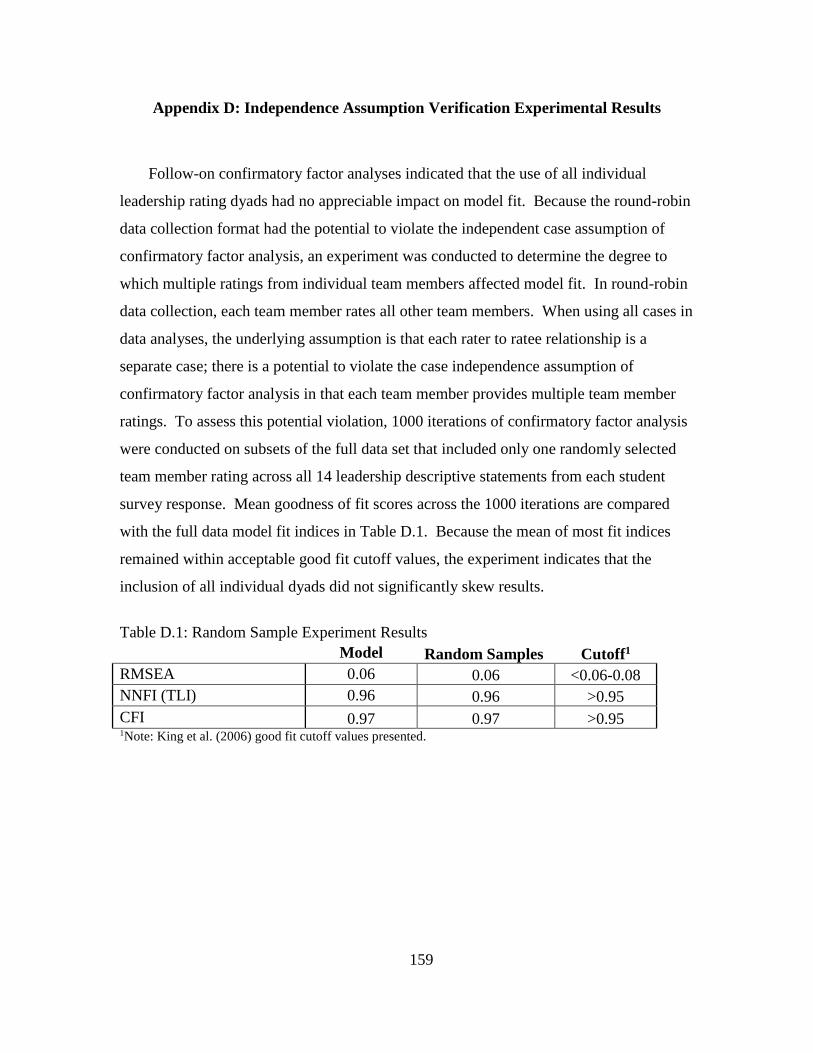
159
Appendix D: Independence Assumption Verification Experimental Results
Follow-on confirmatory factor analyses indicated that the use of all individual
leadership rating dyads had no appreciable impact on model fit. Because the round-robin
data collection format had the potential to violate the independent case assumption of
confirmatory factor analysis, an experiment was conducted to determine the degree to
which multiple ratings from individual team members affected model fit. In round-robin
data collection, each team member rates all other team members. When using all cases in
data analyses, the underlying assumption is that each rater to ratee relationship is a
separate case; there is a potential to violate the case independence assumption of
confirmatory factor analysis in that each team member provides multiple team member
ratings. To assess this potential violation, 1000 iterations of confirmatory factor analysis
were conducted on subsets of the full data set that included only one randomly selected
team member rating across all 14 leadership descriptive statements from each student
survey response. Mean goodness of fit scores across the 1000 iterations are compared
with the full data model fit indices in Table D.1. Because the mean of most fit indices
remained within acceptable good fit cutoff values, the experiment indicates that the
inclusion of all individual dyads did not significantly skew results.
Table D.1: Random Sample Experiment Results
Model Random Samples Cutoff1
RMSEA 0.06 0.06 <0.06-0.08
NNFI (TLI) 0.96 0.96 >0.95
CFI 0.97 0.97 >0.95 1Note: King et al. (2006) good fit cutoff values presented.
160
Appendix E: Site Comparison of Final Project Assignments
A detailed analysis of the design presentation and design report assignments revealed
that using course grades as a measure of task performance across the three research sites
was appropriate. Results of the analyses showed that the teams’ grades were measuring
similar requirements and were comparable across the three research sites. Although the
teams were nested in separate institutions with a separate grading rubrics, there was
enough commonality in assignment expectations across the research sites to deem use of
course grades appropriate for measuring task performance.
For all three sites, the final design requirements were graded at the team level and
had a similar percentage contribution to the spring semester course grade. At site A, the
final design report represented 15% of the course grade and was graded using a site-
specific standardized rubric with input from both the client and a graduate teaching
assistant called the engineering manager. The final design presentation represented 10%
of the course grade. At site B, the final design report represented 20% of the course
grade, and unlike the other two institutions, the site B report was graded in two iterations
using a site-specific standardized rubric. The preliminary evaluation included input from
the faculty advisor and project sponsor. The team was then able to revise the report prior
to the secondary evaluation which included both the faculty advisor and course
coordinator. At site B, the final presentation also comprised 20% of the course grade. At
site C, the final design report and presentation comprised 22.5% and 15% of the final
course grade, respectively. The final design report was generally graded only by the
faculty advisor at site C, using a site-specific standardized rubric. Faculty advisors may
solicit feedback from the client in the grading process at site C., but it was not routine.
Across all three institutions, the final presentations were graded using a combination of
judging panels and faculty advisor input from their observations of the final presentation
using site specific grading rubrics.
Although teams were evaluated using site specific grading rubrics, a comparison of
the grading rubrics identified commonality in course requirements. The results indicated
that the teams were graded on similar criteria (see Tables E.1 and E.2). In Table E.1,
161
sites A and B differed only slightly from site C in final presentation requirements. Site A
did not require evaluation of question and answer sessions, or lessons learned from the
project. Both sites A and B also did not evaluate the team’s use of project management.
Table E.2 shows a high degree of commonality among the three research sites with
regards to the final report. Because of the large number of unique rubric topics at sites B
and C, these unique items were consolidated in Table E.3, which shows that these unique
topics in the final report rubrics accounted for between 8 and 12% of the grade at sites B
and C, respectively; 88-92% of topics across the three research sites were common.
To alleviate potential differences in team scores that may have resulted from
institution level differences, we converted the raw final presentation and final report
grade percentages into z-scores by institution, similar to the methods employed by Stump
et al. (2014) in their analysis of student intelligence beliefs across multiple courses. This
transformation preserved ranking within the site groupings but removed between-site
variation (Coladarci, 2004).
Table E.1: Final Presentation Rubric Similarities Across Research Sites Final Presentation Rubric Site A1 Site B2 Site C3
Technical Content
Effectively communicate design problem. Explain chosen
solution method.
Use of analytical methods to generate/refine design.
Success of design in meeting customer needs/design problem.
Sufficient development of design to allow prototyping and
operation.
Validation of design through testing, modeling, and prototyping.
Ability of completed design to meet project requirements
Lessons learned and future development.
Use of project management to effectively use resources.
Presentation Delivery
Organization, design, and effectiveness of presentation.
Clear communication, clarity, content, and engagement by
presenter.
Effective communication of technical material to audience.
Discussion/answers to questions 15 point scale: 1: Poor; 2: Fair; 3: Good; 4: Very Good; 5: Excellent (Common Rubric) 25 point scale: 1: Poor; 2: Marginal; 3: Fair; 4: Good; 5: Excellent (Common Rubric) 3Audience: 4 point scale: 1: Unsatisfactory; 2: Below Expectations; 3: Meets Expectations; 4: Exceeds
Expectations. Mentor (Faculty Advisor): 3 point scale:1: Unsatisfactory; 2: Below Expectations; 3: Meets
Expectations
162
Table E.2: Final Report Rubric Similarities Across Research Sites. Final Report Rubric Similarities Site A Site B Site C
Technical Content
Front Matter (Title Page, Executive Summary, etc.)
Problem Statement/ Definition
Customer Need Identification
Design Concepts/Background Research
Concept Evaluation and Selection
Embodiment Design
Prototype Test Plan/ Testing Results
Technology Readiness/Future Work Recommendations
Budget/Cost Analysis
References
Engineering Drawings
Prototype Test Matrices
Project Summary (customer summary)
Report Writing
Formatting and Style
Table E.3: Unique Final Report Rubric Elements by Research Site. Final Report Rubric Differences Site A Site B† Site C†
Technical Content
STEP-Lifecycle Analysis 4%
Applicable Standards 4%
Summary of customer deliverables 1%
Project Management 2%
Team Charter/Team Structure 1%
Project Management Gantt Chart 1%
Closeout Memos (post project reflection) 4%
Quad Chart (PowerPoint project summary) 3% †Percentage of Grade
163
References
Ahn, B., Cox, M. F., London, J., Cekic, O., & Zhu, J. (2014). Creating an Instrument to
Measure Leadership, Change, and Synthesis in Engineering Undergraduates.
Journal of Engineering Education, 103(1), 115-136. doi:10.1002/jee.20036
Akaike, H. (1974). A new look at the statistical model identification. IEEE Transactions
on Automatic Control, 19, 716-723.
Allen, N. J., & O'Neill, T. A. (2015). The Trajectory of Emergence of Shared Group-
Level Constructs. Small Group Research, 46(3), 352-390.
doi:10.1177/1046496415584973
AlSagheer, A., & Al-Sagheer, A. (2011). Faculty's Perceptions of Teaching Ethics and
Leadership in Engineering Education. Journal of International Education
Research, 7(2), 55-66.
American Educational Research Association, American Psychological Association, &
National Council on Measurement in Education. (2014). Standards for
Educational and Psychological Testing. Washington, DC: American Educational
Research Association.
American Psychological Association. (2010). Publication Manual of the American
Psychological Association (6th ed.). Washington, DC: American Psychological
Association.
American Society for Engineering Education. (2009). Phase 1 Report: Creating a
Culture for Scholarly and Systemic Innovation in Engineering Education.
Washington DC: American Society for Engineering Education.
American Society for Engineering Education. (2012). Innovation With Impact: Creating
a Culture for Scholarly and Systematic Innovation in Engineering Education.
Washington D.C.: American Society for Engineering Education.
Antonakis, J., Avolio, B. J., & Sivasubramaniam, N. (2003). Context and Leadership: An
examination of the nine-factor full-range leadership theory using the Multifactor
Leadership Questionnaire. The Leadership Quarterly, 14(3), 261-295.
doi:10.1016/S1048-9843(03)00030-4
Antonakis, J., & House, R. J. (2013). The Full-Range Leadership Theory: The Way
Forward. In B. J. Avolio & F. J. Yammarino (Eds.), Transformational and
Charismatic Leadership: The Road Ahead (Vol. 2, pp. 3-34). New York: Emerald
Group Publishing.
Arminio, J. L., Carter, S., Jones, S. E., Kruger, K., Lucas, N., Washington, J., . . . Scott,
A. (2000). Leadership Experiences of Students of Color. NASPA Journal, 37(3),
496.
ASEE Deans Council, & Roundtable, A. C. (1994). The Green Report: Engineering
Education for a Changing World. ASEE, Washington, DC.
ASME Board on Education. (2012). Vision 2030: Creating the Future of Mechanical
Engineering Education (Executive Summary). New York: American Society of
Mechanical Engineers.
ASME Center for Education. (2011). Vision 2030 Creating the Future of Mechanical
Engineering Education. New York: American Society of Mechanical Engineers.
164
Avolio, B. J. (2011). Full Range Leadership Development (2nd ed.). Washington D.C.:
Sage.
Avolio, B. J., Bass, B. M., & Jung, D. I. (1999). Re-examining the components of
transformational and transactional leadership using the Multifactor Leadership
Questionnaire. Journal of Occupational and Organizational Psychology, 72(4),
441-462.
Avolio, B. J., Dong I., J., Murray, W., & Sivasubramanian, N. (1996). Building Highly
Developed Teams: Focusing on shared leadership process, efficacy, trust, and
performance. In M. M. Beyerlein, D. A. Johnson, & S. T. Beyerlein (Eds.),
Advances in Interdisciplinary Studies of Work Teams: Team Leadership (Vol. 3,
pp. 173-209). Greenwich, CT: AJI Press.
Avolio, B. J., Sivasubramaniam, N., Murry, W. D., Jung, D. I., & Garger, J. W. (2003).
Assessing Shared Leadership. In C. L. Pearce & J. A. Conger (Eds.), Shared
Leadership: Reframing the Hows and Whys of Leadership (pp. 143-172).
Thousand Oaks: Sage
Avolio, B. J., Waldman, D. A., & Yammarino, F. J. (1991). Leading in the 1990s: The
Four I's of Transformational Leadership. Journal of European Industrial
Training, 15(4), 9-16.
Babakus, E., Ferguson, C. E., Jr., & Jöreskog, K. G. (1987). The Sensitivity of
Confirmatory Maximum Likelihood Factor Analysis to Violations of
Measurement Scale and Distributional Assumptions. Journal of Marketing
Research, 24(2), 222-228. doi:10.2307/3151512
Bandura, A. (1982). Self-efficacy mechanism in human agency. American Psychologist,
37(2), 122-147. doi:10.1037//0003-066X.37.2.122
Bass, B. M. (1985). Leadership and Performance Beyond Expectations. New York: Free
Press.
Bass, B. M. (1997). Does the Transactional-Transformational Leadership Paradigm
Transcend Organizational and National Boundaries? American Psychologist,
52(2), 130-139. doi:10.1037/0003-066X.52.2.130
Bass, B. M., & Avolio, B. J. (1994). Improving Organizational Effectiveness Through
Transformational Leadership. Thousand Oaks: Sage.
Bass, B. M., & Avolio, B. J. (2013). Multifactor Leadership Questionnaire: The
benchmark measure of transformational leadership. Retrieved from
http://www.mindgarden.com/products/mlq.htm
Bass, B. M., & Avolio, B. J. (2015). Multifactor Leadership Questionnaire. Retrieved
from http://www.mindgarden.com/16-multifactor-leadership-questionnaire
Bayless, D. J., Mitchell, J., & Robe, T. R. (2009). Engineering Leadership Studies and
the Robe Leadership Institute Model in the Russ College of Engineering and
Technology at Ohio University. Paper presented at the 39th ASEE/IEEE Frontiers
in Education Conference, San Antonio, TX.
Bayless, D. J., & Robe, T. R. (2010). Leadership education for engineering students.
Paper presented at the 40th ASEE/IEEE Frontiers in Education Conference,
Washington DC.
Bentler, P. M. (1990). Comparative Fit Indexes in Structural Models. Psychological
Bulletin, 107(2), 238-246. doi:10.1037/0033-2909.107.2.238
165
Blanchard, K. H., Oncken, W., & Burrows, H. (2000). One Min. Manager Meets The
Monkey: HarperCollins UK.
Blau, P. M. (1977). Inequality and heterogeneity: a primitive theory of social structure.
New York: Free Press.
Blumenfeld, P. C., Soloway, E., Marx, R. W., Krajcik, J. S., Guzdial, M., & Palincsar, A.
(1991). Motivating project-based learning: sustaining the doing, supporting the
learning. Educational Psychologist, 26(3-4), 369-398.
doi:10.1207/s15326985ep2603&4_8
Boies, K., Lvina, E., & Martens, M. L. (2010). Shared Leadership and Team Performance
in a Business Strategy Simulation. Journal of Personnel Psychology, 9(4), 195-
202. doi:10.1027/1866-5888/a000021
Borrego, M., Froyd, J. E., Henderson, C., Cutler, S., & Prince, M. (2013). Influence of
Engineering Instructors’ Teaching and Learning Beliefs on Pedagogies in
Engineering Science Courses. International Journal of Engineering Education,
29(6), 1456-1471.
Borrego, M., Karlin, J., McNair, L. D., & Beddoes, K. (2013). Team Effectiveness
Theory from Industrial and Organizational Psychology Applied to Engineering
Student Project Teams—A Review. Journal of Engineering Education, 102(4),
472-512.
Bowman, B. A., & Farr, J. V. (2000). Embedding Leadership In Civil Engineering
Education. Journal of Professional Issues in Engineering Education and Practice,
126(1), 16-20.
Brackin, P., & Gibson, D. (2002). Methods of Assessing Student Learning in Capstone
Design Projects with Industry: A Five Year Review. Paper presented at the
American Society for Engineering Education Annual Conference and Exposition,
Montreal.
Breaux, P. J. (2006). An effective leadership approach for today's engineer Paper
presented at the IEEE/UT Engineering Management Conference, Austin, TX.
Broersen, P. M. T. (1986). Subset Regression with Stepwise Directed Search. Journal of
the Royal Statistical Society. Series C (Applied Statistics), 35(2), 168-177.
Brown, T. A. (2006). Confirmatory factor analysis for applied research. New York:
Guilford Press.
Burke, C. S., Fiore, S. M., & Salas, E. (2003). The Role of Shared Cognition in Enabling
Shared Leadership and Team Adaptability In C. L. Pearce & J. A. Conger (Eds.),
Shared Leadership: Reframing the Hows and Whys of Leadership (pp. 103-122).
Thousand Oaks: Sage.
Burns, J. M. (1978). Leadership. New York: Harper & Row.
Carson, J. B., Tesluk, P. E., & Marrone, J. A. (2007). Shared Leadership in Teams: An
Investigation of Antecedent Conditions and Performance. The Academy of
Management Journal, 50(5), 1217-1234. doi:10.2307/20159921
Carter, M. Z., Mossholder, K. W., Feild, H. S., & Armenakis, A. A. (2014).
Transformational Leadership, Interactional Justice, and Organizational
Citizenship Behavior: The Effects of Racial and Gender Dissimilarity Between
Supervisors and Subordinates. Group & Organization Management, 39(6), 691-
719. doi:10.1177/1059601114551605
166
Chi, N.-W., & Huang, J.-C. (2014). Mechanisms Linking Transformational Leadership
and Team Performance: The Mediating Role of Team Goal Orientation and
Group Affective Tone. Group & Organization Management, 39(3), 300-325.
doi:10.1177/1059601114522321
Chung, J. Y. (2014). Racism and Asian American Student Leadership. Equity and
Excellence in Education, 47(2), 117-132.
Cohen, S. G. (1994). Designing Effective Self Managed Work Teams. In M. M.
Beyerlein & D. A. Johnson (Eds.), Advances in interdisciplinary studies of work
teams, 1994: theories of self-managing work teams (pp. 67-102).
Coladarci, T. (2004). Fundamentals of statistical reasoning in education. New York:
John Wiley & Sons.
Contractor, N. S., DeChurch, L. A., Carson, J., Carter, D. R., & Keegan, B. (2012). The
topology of collective leadership. The Leadership Quarterly, 23, 994-1011.
Conway, J. M., & Huffcutt, A. I. (1997). Psychometric Properties of Multisource
Performance Ratings: A meta-Analysis of Subordinate, Supervisor, Peer, and
Self-Ratings. Human Performance, 10(4), 331-360.
doi:10.1207/s15327043hup1004_2
Corder, G. W., & Foreman, D. I. (2014). Nonparametric statistics: a step-by-step
approach (2nd ed.). Hoboken, NJ: John Wiley & Sons.
Cortina, J. M. (1993). What Is Coefficient Alpha? An Examination of Theory and
Applications. Journal of Applied Psychology, 78(1), 98-104.
Cox, B. E., McIntosh, K., Reason, R. D., & Terenzini, P. T. (2014). Working with
Missing Data in Higher Education Research: A Primer and Real-World Example.
The Review of Higher Education, 37(3), 377-402.
Cox, J. F., Pearce, C. L., & Perry, M. L. (2003). Toward a Model of Shared Leadership
and Distributed Influence in the Innovation Process. In C. L. Pearce & J. A.
Conger (Eds.), Shared Leadership: Reframing the Hows and Whys of Leadership
(pp. 48-76). Thousand Oaks, CA: Sage.
Cox, M. F., Cekic, O., & Adams, S. G. (2010). Developing Leadership Skills of
Undergraduate Engineering Students: Perspectives from engineering faculty.
Journal of STEM Education: Innovations & Research, 11(3/4), 22-33.
Cox, P. L., & Bobrowski, P. E. (2000). The team charter assignment: Improving the
effectiveness of classroom teams. Journal of Behavioral and Applied
Management, 1(1), 92-103.
Cress, C. M., Astin, H. S., Zimmerman–Oster, K., & Burkhardt, J. C. (2001).
Developmental outcomes of college students’ involvement in leadership
activities. Journal of College Student Development, 42, 15-27.
D'Innocenzo, L., Mathieu, J. E., & Kukenberger, M. R. (2014). A Meta-Analysis of
Different Forms of Shared Leadership−Team Performance Relations. Journal of
Management, 0149206314525205.
Dedrick, R. F., Ferron, J. M., Hess, M. R., Hogarty, K. Y., Kromrey, J. D., Lang, T. R., . .
. Lee, R. S. (2009). Multilevel Modeling: A Review of Methodological Issues and
Applications. Review of Educational Research, 79(1), 69-102.
doi:10.3102/0034654308325581
167
Derue, D. S., Nahrgang, J. D., Wellman, N., & Humphrey, S. E. (2011). Trait And
Behavioral Theories Of Leadership: An Integration And Meta-Analytic Test Of
Their Relative Validity. Personnel Psychology, 64, 7-52.
Dorst, K. (2008). Design research: a revolution-waiting-to-happen. Design Studies, 29(1),
4-11. doi:10.1016/j.destud.2007.12.001
Douglas, K. A., & Purzer, Ş. (2015). Validity: Meaning and Relevancy in Assessment for
Engineering Education Research. Journal of Engineering Education, 104(2), 108-
118. doi:10.1002/jee.20070
Duderstadt, J. J. (2010). Engineering for a Changing World: A Roadmap to the Future of
American Engineering Practice, Research, and Education Holistic Engineering
Education (pp. 17-35). New York: Springer.
Dugan, J. P., Kodama, C. M., & Gebhardt, M. C. (2012). Race and Leadership
Development Among College Students: The Additive Value of Collective Racial
Esteem. Journal of Diversity in Higher Education, 5(3), 174-189.
doi:10.1037/a0029133
Dugan, J. P., & Komives, S. R. (2010). Influences on college students’ capacity for
socially responsible leadership. Journal of College Student Development, 51, 525-
549. doi:10.1353/csd.2010.0009
Dutson, A. J., Todd, R. H., Magleby, S. P., & Sorensen, C. D. (1997). A Review of
Literature on Teaching Engineering Design Through Project-Oriented Capstone
Courses. Journal of Engineering Education, 86(1), 17-28. doi:10.1002/j.2168-
9830.1997.tb00260.x
Eagly, A. H., Johannesen-Schmidt, M. C., & van Engen, M. L. (2003). Transformational,
Transactional, and Laissez-Faire Leadership Styles: A Meta-Analysis Comparing
Women and Men. Psychological Bulletin, 129(4), 569-591. doi:10.1037/0033-
2909.129.4.569
Eagly, A. H., & Karau, S. J. (2002). Role congruity theory of prejudice toward female
leaders. Psychological Review, 109(3), 573.
Everitt, B. (2011). Cluster Analysis (Vol. 5th). Chichester, West Sussex, U.K: Wiley.
Farr, J. V., & Brazil, D. M. (2009). Leadership Skills Development for Engineers.
Engineering Management Journal, 21(1), 3-8.
Farr, J. V., & Brazil, D. M. (2012). Leadership skills development for engineers. IEEE
Engineering Management Review, 40(3), 13-22. doi:10.1109/EMR.2012.6291576
Farr, J. V., Walesh, S. G., & Forsythe, G. B. (1997). Leadership development for
engineering managers. Journal of Management in Engineering, 13(4), 38-41.
doi:10.1061/(ASCE)0742-597X(1997)13:4(38)
Feister, M. K., Zoltowski, C. B., Buzzanell, P. M., Oakes, W. C., & Zhu, Q. (2014).
Leadership in Multidisciplinary Project Teams: Investigating the emergent nature
of leadership in an engineering education context. Paper presented at the 121st.
ASEE Annual Conference & Exposition, Indianapolis, IN.
Field, A., Miles, J., & Field, Z. (2012). Discovering Statistics Using R. Thousand Oaks,
CA: Sage.
Fletcher, J. K., & Kaufer, K. (2003). Shared Leadership: Paradox and Possibility. In C. L.
Pearce & J. A. Conger (Eds.), Shared Leadership: Reframing the Hows and Whys
of Leadership (pp. 21-47). Thousand Oaks, CA: Sage.
168
Freeman, L. C. (1979). Centrality in social networks: conceptual clarification. Social
networks, 1(3), 215-239.
French, J. J., & Raven, B. (1959). The bases of social power. In D. Cartwright (Ed.),
Studies in Social Power (pp. 150-167). Ann Arbor, MI: Institute for Social
Research.
Fukuyama, M. A., & Greenfield, T. K. (1983). Dimensions of assertiveness in an Asian-
American student population. Journal of Counseling Psychology, 30(3), 429-432.
doi:10.1037/0022-0167.30.3.429
Gall, M. D., Gall, J. P., & Borg, W. R. (2007). Collecting Research Data with Tests and
Self-Report Measures Educational Research: An Introduction (pp. 192-226). New
York: Pearson.
Galli, B. J., & Luechtefeld, R. (2009). An environment that fosters shared leadership and
the effects on engineering education: An analysis and proposed structure. Paper
presented at the 39th Annual ASEE/IEEE Frontiers in Education Conference, San
Antonio, TX.
Gerhart, A., Carpenter, D., Grunow, M., & Hayes, K. (2010). Development Of A
Leadership And Entrepreneurship Skills Assessment Instrument. Paper presented
at the American Society for Engineering Education Annual Conference and
Exposition, Louisville, KY.
Gerlick, R., Davis, D., Beyerlein, S., McCormack, J., Thompson, P., Harrison, O., &
Trevisan, M. (2008). Assessment structure and methodology for design processes
and products in engineering capstone courses. Paper presented at the American
Society for Engineering Education Annual Conference and Exposition,
Pittsburgh, PA.
Glanville, P. (2013). Engineers in Politics. Retrieved from https://www.asme.org/career-
education/early-career-engineers/me-today/me-today-march-2013-
issue/engineers-in-politics
Gliem, J. A., & Gliem, R. R. (2003). Calculating, Interpreting, and Reporting Cronbach’s
Alpha Reliability Coefficient for Likert-Type Scales: Midwest Research-to-
Practice Conference in Adult, Continuing, and Community Education.
Gockel, C., & Werth, L. (2010). Measuring and Modeling Shared Leadership Traditional
Approaches and New Ideas. Journal of Personnel Psychology, 9(4), 172-180.
doi:10.1027/1866-5888/a000023
Godard, J. (2001). High Performance and the Transformation of Work? The Implications
of Alternative Work Practices for the Experience and Outcomes of Work.
Industrial and Labor Relations Review, 54(4), 776-805.
Goldring, E., Cravens, X., Porter, A., Murphy, J., & Elliott, S. (2015). The convergent
and divergent validity of the Vanderbilt Assessment of Leadership in Education
(VAL-ED): Instructional leadership and emotional intelligence. Journal of
Educational Administration, 53(2), 177-196. doi:10.1108/JEA-06-2013-0067
Goodwin, L. D. L. N. L. (2003). The Meaning of Validity in the New Standards for
Educational and Psychological Testing: Implications for Measurement Courses.
Measurement & Evaluation in Counseling & Development (American Counseling
Association), 36(3), 181-191.
169
Graham, R. (2012). Achieving excellence in engineering education: the ingredients of
successful change The Royal Academy of Engineering and Massachusettes
Institute of Technology. London.
Graham, R., Crawley, E., & Mendelsohn, B. R. (2009). Engineeing Leadership
Education: A snapshot review of international good practice. Cambridge, MA:
White paper sponsored by the Bernard M. Gordon MIT Engineeing Leadership
Program.
Gronn, P. (2008). The future of distributed leadership. Journal of Educational
Administration, 46(2), 141-158. doi:10.1108/09578230810863235
Grunspan, D. Z., Wiggins, B. L., & Goodreau, S. (2014). Understanding Classrooms
through Social Network Analysis: A Primer for Social Network Analysis in
Education Research. CBE-Life Sciences Education, 13(2), 167-178.
doi:10.1187/cbe.13-08-0162
Guastello, S. (2011). Leadership Emergence in Engineering Design Teams. Nonlinear
Dynamics Psychology and Life Sciences, 15(1), 87-104.
Hackman, J. R. (1990). Groups that work (and those that don't): creating conditions for
effective teamwork. San Francisco: Jossey-Bass.
Hanus, J., & Russell, J. S. (2007). Integrating The Development Of Teamwork, Diversity,
Leadership, And Communication Skills Into A Capstone Design Course. Paper
presented at the ASEE Annual Conference and Exposition, Honolulu, HI.
Hill, S. E. K. (2013). Team Leadership. In P. G. Northouse (Ed.), Leadership: Theory
and Practice (6th ed., pp. 287-319). Los Angeles: Sage Publications Inc.
Hinkin, T. R., & Schriesheim, C. A. (2008). A Theoretical and Empirical Examination of
the Transactional and Non-Leadership Dimensions of the Multifactor Leadership
Questionnaire. The Leadership Quarterly, 19(5), 501-513.
doi:10.1016/j.leaqua.2008.07.001
Hoch, J. E. (2014). Shared Leadership, diversity, and information sharing in teams.
Journal of Managerial Psychology, 29(5), 541-564. doi:10.1108/JMP-02-2012-
0053
Hogan, R., & Kaiser, R. B. (2005). What We Know About Leadership. Review of
General Psychology, 9(2), 169-180. doi:10.1037/1089-2680.9.2.169
Hooper, D., Coughlan, J., & Mullen, M. (2008). Structural equation modelling:
Guidelines for determining model fit. Electronic Journal of Business Research
Methods 6(1), 53-60.
Howe, S., & Wilbarger, J. (2006). 2005 National survey of engineering capstone design
courses. Paper presented at the American Society for Engineering Education
Annual Conference and Exposition, Chicago, IL.
Howell, D. C. (2013). Statistical Methods for Psychology (8th ed.). Belmont, CA:
Wadsworth.
Hoyt, C. L. (2013). Women and Leadership. In P. G. Northouse (Ed.), Leadership:
Theory and Practice (6th ed., pp. 349-382). Los Angeles: Sage
Hughston, V. C. (2014). Consequences of team charter quality: Teamwork mental model
similarity and team viability in engineering design student teams. (Doctor of
Philosophy), The Pennsylavia State University, State College, PA.
Huisman, M. (2009). Imputation of missing network data: some simple procedures.
Journal of Social Structure, 10(1), 1-29.
170
Hurley, S. (1998). Application of team-based 360° feedback systems. Team Performance
Management, 4(5), 202-210.
Jackson, B., & Parry, K. (2011). A Very Short, Fairly Interesting and Reasonably Cheap
Book About Studying Leadership (2nd ed.). Thousand Oaks, CA: Sage.
Jones, B. D., Epler, C. M., Mokri, P., Bryant, L. H., & Paretti, M. C. (2013). The effects
of a collaborative problem-based learning experience on students’ motivation in
engineering capstone courses. Interdisciplinary Journal of Problem-based
Learning, 7(2), 2.
Judd, C. M., & McClelland, G. H. (1989). Data analysis: a model-comparison approach.
San Diego: Harcourt Brace Jovanovich.
Karau, S. J., & Williams, K. D. (1993). Social loafing - a meta-analytic review and
theoretical integration. Journal of Personality and Social Psychology, 65(4), 681-
706.
Kaufman, L., & Rousseeuw, P. J. (1990). Finding groups in data: An introduction to
cluster analysis. New York: John Wiley and Sons.
Keegan, A. E., & Den Hartog, D. N. (2004). Transformational Leadership in a Project-
based Environment: A comparative study of the leadership styles of project
managers and line managers. International Journal of Project Management,
22(8), 609-617. doi:10.1016/j.ijproman.2004.05.005
Keith, T. (2006). Multiple Regression and Beyond. New York: Pearson.
King, J., Nora, A., Stage, F., Schreiber, J., & Barlow, E. (2006). Reporting Structural
Equation Modeling and Confirmatory Factor Analysis Results: A Review. The
Journal of Educational Research, 99(6), 323-337. doi:10.3200/JOER.99.6.323-
338
Kinoshita, T., Young, G., & Knight, D. B. (2014). Learning after learning: Perceptions
of engineering alumni on skill development. Paper presented at the Frontiers in
Education Conference, Madrid, Spain.
Knight, D. B., & Novoselich, B. J. (2014). Developing engineers who lead: Are student,
faculty and administrator perspectives aligned? Paper presented at the ASEE
Annual Conference and Exposition, Indianapolis, IN.
Kodama, C. M., McEwen, M. K., Liang, C. T. H., & Lee, S. (2001). A Theoretical
Examination of Psychosocial Issues for Asian Pacific American Students. NASPA
Journal, 38(4), 411.
Kolb, J. A. (1999). The Effect of Gender Role, Attitude toward Leadership, and Self-
Confidence on Leader Emergence: Implications for Leadership Development.
Human Resource Development Quarterly, 10(4), 305-320.
doi:10.1002/hrdq.3920100403
Komives, S. R., Owen, J. E., Longerbeam, S. D., Mainella, F. C., & Osteen, L. (2005).
Developing a Leadership Identity: A Grounded Theory. Journal of College
Student Development, 46(6), 593.
Kuhnert, K. W., & Lewis, P. (1987). Transactional and Transformational Leadership: A
Constructive/Developmental Analysis. The Academy of Management Review,
12(4), 648-657.
Kukenberger, M. R. (2012). A Shared Leadership Classification and Multi-Level
Exploration of Compositional Antecedents and Team and Individual Outcomes.
(Dissertation/Thesis), ProQuest Dissertations Publishing.
171
Lattuca, L., Terenzini, P., Knight, D., & Ro, H. K. (2014). 2020 Vision: Progress in
Preparing the Engineer of the Future. Washington, DC: The National Science
Foundation.
Lattuca, L. R., Terenzini, P. T., & Volkwein, J. F. (2006). Engineering change: A study
of the impact of EC2000. Baltimore, MD: ABET.
Liu, S. B., Hu, J., Li, Y. H., Wang, Z., & Lin, X. S. (2014). Examining the cross-level
relationship between shared leadership and learning in teams: evidence from
China. The Leadership Quarterly, 25(2), 282-295.
doi:10.1016/j.leaqua.2013.08.006
Lo, C. C. (2010). Student Learning and Student Satisfaction in an Interactive Classroom.
the journal of general education, 59(4), 238-263. doi:10.1353/jge.2010.0025
Lowe, K. B., Kroeck, K. G., & Sivasubramaniam, N. (1996). Effectiveness correlates of
transformational and transactional leadership: A meta-analytic review of the mlq
literature. The Leadership Quarterly, 7(3), 385-425. doi:10.1016/S1048-
9843(96)90027-2
Lucas, J. W., & Baxter, A. R. (2012). Power, Influence, and Diversity in Organizations.
The Annals of the American Academy of Political and Social Science, 639(1), 49-
70. doi:10.1177/0002716211420231
Luo, W., & Azen, R. (2013). Determining Predictor Importance in Hierarchical Linear
Models Using Dominance Analysis. Journal of Educational and Behavioral
Statistics, 38(1), 3-31. doi:10.3102/1076998612458319
Manning, J. E. (2014). Membership of the 113th Congress, A Profile. Retrieved from
Washington D.C.:
Markham, S. E. (2012). The evolution of organizations and leadership from the ancient
world to modernity: A multilevel approach to organizational science and
leadership. The Leadership Quarterly, 23, 1136-1151.
Maslyn, J. M., & Uhl-Bien, M. (2001). Leader-Member Exchange and Its Dimensions:
Effects of Self-Effort and Other's Effort on Relationship Quality. Journal of
Applied Psychology, 86(4), 697-708. doi:10.1037/0021-9010.86.4.697
Mathieu, C., Neumann, C., Babiak, P., & Hare, R. D. (2015). Corporate psychopathy and
the full-range leadership model. Assessment, 22(3), 267-278.
doi:10.1177/1073191114545490
Mathieu, J. E., D’Innocenzo, L., Kukenberger, M. R., & Reilly, G. (2015). Modeling
Reciprocal Team Cohesion–Performance Relationships, as Impacted by Shared
Leadership and Members’ Competence. Journal of Applied Psychology, 1-22.
Mayo, M., Meindl, J. R., & Pastor, J.-C. (2003). Shared Leadership in Work Teams. In C.
L. Pearce & J. A. Conger (Eds.), Shared Leadership: Reframing the hows and
whys of leadership (pp. 193-214). Thousand Oaks, CA: Sage.
McEnery, J. M., & Blanchard, P. N. (1999). Validity of Multiple Ratings of Business
Student Performance in a Management Simulation. Human Resource
Development Quarterly, 10(2), 155-172. doi:10.1002/hrdq.3920100206
Mendez, M. J., & Busenbark, J. R. (2015). Shared leadership and gender: all members are
equal … but some more than others. Leadership & Organization Development
Journal, 36(1), 17-34. doi:10.1108/LODJ-11-2012-0147
Michel, J. G., & Hambrick, D. C. (1992). Diversification Posture and Top Management
Team Characteristics. The Academy of Management Journal, 35(1), 9-37.
172
Miller, A. (2002). Subset Selection in Regression (Vol. 95). Washington, DC: Chapman
& Hall/CRC.
Mind Garden. (2015). Frequently Asked Questions. Retrieved from
http://www.mindgarden.com/content/23-faq#horizontalTab5
Muck, P. M., Hell, B., & Gosling, S. D. (2007). Construct Validation of a Short Five-
Factor Model Instrument. European Journal of Psychological Assessment, 23(3),
166-175. doi:10.1027/1015-5759.23.3.166
Muethal, M., & Hoegl, M. (2013). Shared leadership effectiveness in independent
professional teams. European Management Journal, 31, 423-432.
Muthén, B. O., & Kaplan, D. (2011). A Comparison of Some Methodologies for the
Factor Analysis of Non-Normal Likert Variables: A Note on the Size of the
Model. UCLA: Department of Statistics.
National Academy of Engineering. (2004). The Engineer of 2020: Visions of Engineering
in the New Century. Washington DC: National Academies Press.
National Academy of Engineering. (2005). Educating the Engineer of 2020: Adapting
Engineering Education to the New Century. (0309096499, 9780309096492).
Washington, DC: National Academies Press.
National Research Council. (2007). Rising above the gathering storm: energizing and
employing America for a brighter economic future. Washington, D.C: National
Academies Press.
Nespor, J. (1987). The role of beliefs in the practice of teaching. Journal of Curriculum
Studies, 19(4), 317-328. doi:10.1080/0022027870190403
Neubert, M. J., & Taggar, S. (2004). Pathways to informal leadership: The moderating
role of gender on the relationship of individual differences and team member
network centrality to informal leadership emergence. The Leadership Quarterly,
15(2), 175-194. doi:10.1016/j.leaqua.2004.02.006
Newstetter, W. C. (1998). Of Green Monkeys and Failed Affordances: A Case Study of a
Mechanical Engineering Design Course. Research in Engineering Design, 10,
118-128.
Nicolaides, V. C., LaPort, K. A., Chen, T. R., Tomassetti, A. J., Weis, E. J., Zaccaro, S.
J., & Cortina, J. M. (2014). The Shared Leadership of Teams: A meta-analysis of
proximal, distal, and moderating relationships. The Leadership Quarterly, 25,
923-942.
Nooy, W. d., Mrvar, A., & Batagelj, V. (2011). Exploratory Social Network Analysis with
Pajek (Vol. 34.). New York: Cambridge University Press.
Northouse, P. G. (2013). Leadership: Theory and Practice (6th ed.). Thousand Oaks, CA:
Sage.
Novoselich, B. J., & Knight, D. B. (2015). Sharing the Full Range of Leadership in
Student Teams: Developing an Instrument. Paper presented at the American
Society for Engineering Education Annual Conference and Exposition, Seattle,
WA.
Osborne, J. W., & Overbay, A. (2004). The power of outliers (and why researchers
should always check for them). Practical Assessment, Research & Evaluation,
9(6). Retrieved from http://PAREonline.net/getvn.asp?v=9&n=6
Pace, C. R. (1983). Achievement and the Quality of Student Effort. Washington, DC:
Department of Education.
173
Paglis, L. L. (2010). Leadership self-efficacy: research findings and practical
applications. Journal of Management Development, 29(9), 771-782.
doi:10.1108/02621711011072487
Paretti, M., Layton, R., Laguette, S., & Speegle, G. (2011). Managing and Mentoring
Capstone Design Teams: Considerations and Practices for Faculty. International
Journal of Engineering Education, 27(6), 1192-1205.
Paretti, M., Pembridge, J. J., Brozina, S. C., Lutz, B. D., & Phanthanousy, J. N. (2013).
Mentoring Team Conflicts in Capstone Design: Problems and Solutions. Paper
presented at the ASEE Annual Convention & Exposition, Atlanta, GA.
Paterson, L., & Goldstein, H. (1991). New Statistical Methods for Analysing Social
Structures: An Introduction to Multilevel Models. British Educational Research
Journal, 17(4), 387-393. doi:10.1080/0141192910170408
Paul, R., & Cowe Falls, L. (2015, 14-17 June, 2015). Student Perspectives in Defining
Engineering Leadership. Paper presented at the 122nd ASEE Annual Conference
and Exposition, Seattle, WA.
Pearce, C. L. (2004). The future of leadership: Combining vertical and shared leadership
to transform knowledge work. The Academy of Management Executive, 18(1), 47-
57.
Pearce, C. L., & Conger, J. A. (2003a). All Those Years Ago. In C. L. Pearce & J. A.
Conger (Eds.), Shared Leadership: Reframing the hows and whys of leadership
(pp. 1-18). Thousand Oaks, CA: Sage.
Pearce, C. L., & Conger, J. A. (2003b). Shared leadership: Reframing the hows and whys
of leadership. Thousand Oaks, CA: Sage.
Pedhazur, E. J., & Schmelkin, L. P. (1991). Measurement, Design, and Analysis: An
integrated approach. Hillsdale, N.J.: Lawrence Ebraum Associates.
Pembridge, J., & Paretti, M. (2010). The Current State of Capstone Design Pedagogy.
American Society for Engineering Education., 00496-00413.
Peugh, J. L., & Enders, C. K. (2005). Using the SPSS Mixed Procedure to Fit Cross-
Sectional and Longitudinal Multilevel Models. Educational and Psychological
Measurement, 65(5), 717-741. doi:10.1177/0013164405278558
Pierro, A., Raven, B. H., Amato, C., & Bélanger, J. J. (2013). Bases of social power,
leadership styles, and organizational commitment. International Journal of
Psychology, 48(6), 1122-1134. doi:10.1080/00207594.2012.733398
Porter, S. R. (2005). What can multilevel models add to institution research? . In M. A.
Coughlin (Ed.), Applications of intermediate/advanced statistics in institutional
research (Resources in Institutional Research, No. 16.) (pp. 110-131).
Tallahassee, FL: Association for In stitutional Research.
Posner, B. Z. (2004). A leadership development instrument for students: Updated.
Journal of College Student Development, 45, 443-456.
doi:10.1353/csd.2004.0051
Prell, C. (2012). Social Network Analysis: History, theory & methodology. Los Angeles,
Calif: SAGE.
President’s Council of Advisors on Science and Technology. (2012). Report to the
President: Engage To Excel: Producing One Million Additional College
Graduates With Degrees In Science, Technology, Engineering, and Mathematics.
Washington D.C.
174
Raudenbush, S. E., & Bryk, A. S. (2002). Hierarchical Linear Models: Applications and
Data Analysis Methods (2nd ed.). Thousand Oaks, CA: Sage.
Reeve, D., Rottmann, C., & Sacks, R. (2015). The Ebb and Flow of Engineering
Leadership Orientations. Paper presented at the 122nd ASEE Annual Conference
and Exposition, Seattle, WA.
Renn, K. A., & Ozaki, C. C. (2010). Psychosocial and Leadership Identities Among
Leaders of Identity-Based Campus Organizations. Journal of Diversity in Higher
Education, 3(1), 14-26. doi:10.1037/a0018564
Rost, J. C. (1993). Leadership for the twenty-first century: Greenwood Publishing Group.
Rottmann, C., Sacks, R., & Reeve, D. (2014). Engineering Leadership: Grounding
leadership theory in engineers’ professional identities. Leadership.
doi:10.177/1742715014543581
Sabatini, D. A., & Knox, R. C. (1999). Results of a Student Discussion Group on
Leadership Concepts. Journal of Engineering Education, 88(2), 185-188.
Salas, E., Stagl, K. C., Burke, C. S., & Goodwin, G. F. (2007). Fostering Team
Effectiveness in Organizations: Toward an Integrative Theoretical Framework.
Nebraska Symposium on Motivation, 52, 185-243.
Schaeffner, M., Huettermann, H., Gebert, D., Boener, S., Kearney, E., & Song, L. J.
(2015). Swim or Sink Together: The Potential of Collective Team Identification
and Team Member Alignment for Separating Task and Relationship Conflicts.
Group & Organization Management, 40(4), 467-499.
doi:10.1177/1059601114561059
Schlemer, L., & Waldorf, D. (2010). Testing the Test: Validity and Reliability of Senior
Exit Exam. Paper presented at the 117th ASEE Annual Conference & Exposition
Proceedings Louisville, KY.
Schuhmann, R. J. (2010). Engineering Leadership Education--The Search for Definition
and a Curricular Approach. Journal of STEM Education: Innovations and
Research, 11(3), 61-69.
Schwarz, G. (1978). Estimating the Dimension of a Model. The Annals of Statistics, 6(2),
461-464. doi:10.1214/aos/1176344136
Seat, E., Parsons, J. R., & Poppen, W. A. (2001). Enabling Engineering Performance
Skills: A Program to Teach Communication, Leadership, and Teamwork. Journal
of Engineering Education, 90(1), 7-12. doi:10.1002/j.2168-9830.2001.tb00561.x
Seers, A., Keller, T., & Wilkerson, J. W. (2003). Can Team Members Share Leadership.
In J. A. Conger & C. L. Pearce (Eds.), Shared Leadership (pp. 77-102). Thousand
Oaks: Sage.
Shuman, L. J., Besterfield-Sacre, M., & Mcgourty, J. (2005). The ABET “Professional
Skills” – Can They Be Taught? Can They Be Assessed? Journal of Engineering
Education, 41-55.
Singleton, R. A., & Straits, B. C. (2010). Approaches to Social Research. New York, NY:
Oxford University Press.
Small, E. E., & Rentsch, J. R. (2010). Shared Leadership in Teams: A Matter of
Distribution. Journal of Personnel Psychology, 9(4), 203-211. doi:10.1027/1866-
5888/a000017
Smith, J. A., & Foti, R. J. (1998). A pattern approach to the study of leader emergence.
The Leadership Quarterly, 9(2), 147-160. doi:10.1016/S1048-9843(98)90002-9
175
Snijders, T. A. B., & Bosker, R. J. (2012). Multilevel Analysis: An introduction to basic
and advanced multilevel modeling. Washington, DC: Sage.
SPSS INC. (2001). The SPSS TwoStep cluster component: A scalable component to
segment your customers more effectively.: SPSS.
SPSS INC. (2014). IBM SPSS Statistics 23 Algorithms. New York: IBM Corporation.
Stagl, K. C., Salas, E., & Burke, C. S. (2007). Best Practices in Team Leadership: What
team leaders do to facilitate team effectiveness. In J. A. Conger & R. E. Riggio
(Eds.), Developing the next generation of leaders (pp. 172-197). San Francisco:
Jossey-Bass.
Steinley, D. (2006). K-means clustering: A half-century synthesis. British Journal Of
Mathematical & Statistical Psychology, 59(1), 1-34.
doi:10.1348/000711005X48266
STEM Development Office. (2009). STEM Education and Outreach Strategic Plan.
Washington D.C.: Department of Defense.
Stevens, R., Johri, A., & O’Connor, K. (2014). Professional Engineering Work. In A.
Johri & B. M. Olds (Eds.), Cambridge Handbook of Engineering Education
Research (pp. 119-137). New York: Cambridge.
Stump, G. S., Husman, J., & Corby, M. (2014). Engineering Students' Intelligence
Beliefs and Learning. Journal of Engineering Education, 103(3), 369-387.
doi:10.1002/jee.20051
Tabachnick, B. G., & Fidell, L. S. (1989). Using multivariate statistics (Vol. 2nd). New
York: Harper & Row.
Tonso, K. L. (2007). On the Outskirts of Engineering: Learning Identity, Gender, and
Power via Engineering Practice. Rotterdam: Sense Publishers.
U.S. Department of Education. (2008). Policy Questions on the Department of
Education's 2007 Guidance on Collecting, Maintaining and Reporting Data by
Race or Ethnicity. Retrieved from
http://www2.ed.gov/policy/rschstat/guid/raceethnicity/questions.html#postsec
Vinkenburg, C. J., van Engen, M. L., Eagly, A. H., & Johannesen-Schmidt, M. C. (2011).
An exploration of stereotypical beliefs about leadership styles: is transformational
leadership a route to women's promotion? The Leadership Quarterly, 22(1), 10-
21.
Wageman, R. (2001). How Leaders Foster Self-Managing Team Effectiveness: Design
Choices versus Hands-on Coaching. Organization Science, 12(5), 559-577.
doi:10.1287/orsc.12.5.559.10097
Wageman, R., & Gardner, H. (2012). The Changing Ecology of Teams: New directions
for teams research ; editorial. Journal of organizational behavior, 33(3), 301-315.
Wang, D., Waldman, D. A., & Zhang, Z. (2014). A meta-analysis of shared leadership
and team effectiveness. The Journal of applied psychology, 99(2), 181-198.
doi:10.1037/a0034531
Wang, G., Oh, I.-S., Courtright, S. H., & Colbert, A. E. (2011). Transformational
leadership and performance across criteria and levels: a meta-analytic review of
25 years of research. Group & organization management, 36(2), 223-270.
doi:10.1177/1059601111401017
176
Watson, J. L. (1998). An analysis of the value of the FE examination for the assessment
of student learning in engineering and science topics. Journal of Engineering
Education, 87(3), 305.
Williams, J. M., Ahmed, J., Hanson, J. H., Peffers, S. N., & Sexton, S. M. (2012). The
Rose-Hulman Institute Of Technology Leadership Advancement Program:
Preparing Engineering, Math, And Science Students For Leadership Success.
Paper presented at the ASEE Annual Conference and Exposition, San Antonio,
TX.
Yoder, B. L. (2014). Engineering by the Numbers. Retrieved from Washington, DC.:
http://www. asee. org/papers-and-publications/publications/collegeprofiles/2011-
profile-engineering-statistics. pdf
Yukl, G. A. (2006). Leadership in Organizations. Upper Saddle River, NJ:
Pearson/Prentice Hall.
Zafft, C. R., Adams, S. G., & Matkin, G. S. (2009). Measuring Leadership in Self
Managed Teams using the Competing Values Framework. Journal of Engineering
Education, July, 273-282.