investigating soft failures induced by system-level esd
TRANSCRIPT
INVESTIGATING SOFT FAILURES INDUCED BY SYSTEM-LEVEL
ESD
BY
SANDEEP GAUTAM VORA
THESIS
Submitted in partial fulfillment of the requirements
for the degree of Master of Science in Electrical and Computer Engineering
in the Graduate College of the
University of Illinois at Urbana-Champaign, 2018
Urbana, Illinois
Adviser:
Professor Elyse Rosenbaum
brought to you by COREView metadata, citation and similar papers at core.ac.uk
provided by Illinois Digital Environment for Access to Learning and Scholarship Repository

ii
ABSTRACT
Hardware and application-level manifestations of ESD soft failures were characterized for three
single-board computers. ESD events were generated following the system-level ESD standard
(IEC 61000-4-2), matching real-world testing and events. Soft failures resulting from ESD were
seen on all products tested. Failures associated with the peripheral ICs occur independently of the
application being run; the application-dependent failures are attributed to noise at the CPU.

iii
ACKNOWLEDGMENTS
I would like to thank my advisor, Elyse Rosenbaum, for her guidance, without which this work
would not have been possible. Additionally, I would like to thank my co-advisor on this project,
Professor Shobha Vasudevan, for her guidance.
I would also like to thank my co-worker Rui Jiang and my lab mates Nick Thomson, Collin
Reiman, Yang Xiu and Zaichen Chen for useful guidance.
Many thanks to my family and friends for their continued support.

iv
TABLE OF CONTENTS
1. INTRODUCTION ...................................................................................................................... 1
1.1 Motivation ............................................................................................................................. 1
1.2 The IEC 61000-4-2 Standard ................................................................................................ 2
1.3 Soft Failures .......................................................................................................................... 4
1.4 Thesis Overview .................................................................................................................... 5
2. TEST SETUP .............................................................................................................................. 6
3. MICROPROCESSOR (RASPBERRY PI) ................................................................................. 7
3.1 Discussion ........................................................................................................................... 10
4. MICROCONTROLLER (ARDUINO UNO) ........................................................................... 13
4.1 Discussion ........................................................................................................................... 16
4.2 Novel Methodology for Fault Localization ......................................................................... 18
4.2.1 Bit flips in a single register ........................................................................................... 19
4.2.2 Bit flips in multiple registers ........................................................................................ 21
5. FIELD PROGRAMMABLE GATE ARRAY .......................................................................... 22
5.1 Discussion ........................................................................................................................... 26
6. CROSS-EUT DISCUSSION .................................................................................................... 27
6.1 Root-Cause Analysis ........................................................................................................... 27
6.2 Mitigation ............................................................................................................................ 29
7. CONCLUSION ......................................................................................................................... 30
7.1. Future Work ....................................................................................................................... 30
REFERENCES ............................................................................................................................. 31

1
1. INTRODUCTION
1.1 Motivation
Objects can become charged either through the triboelectric effect or through electrostatic
induction. Electrostatic discharge (ESD) is a phenomenon which occurs either when: (1) objects
at different electrostatic potentials share charge, or (2) a charged object transfers charge to an
uncharged (grounded) object. When an object with a higher voltage is brought toward an object
with a lower voltage, the electric field between the objects increases until either the dielectric
(often air) breaks down or contact is made. The charge difference, whether one of the objects is
floating or grounded, object location in relation to other conductive objects, and the resistance in
the discharge path will change the peak current of the ESD event. Given the right conditions, an
ESD event will cause high enough currents to damage one of the objects. These ESD events can
occur during manufacture as well as during handling by an end user. Should one of these objects
be an integrated circuit (IC), the IC may be damaged or give erroneous outputs (soft failures) [1,
2].
Manufacturers must test the reliability of their products before release. One common test
performed is based on the IEC 61000-4-2 standard. If the products pass the test undamaged or do
not experience a high number of catastrophic soft failures, e.g. resets, total loss of data, etc., then
the products can be released. However, the current test methodology used by manufacturers often
fails to capture application-specific soft failures.
In recent years, works on system-level ESD design have had two primary foci. One is the
development of a system-efficient ESD design (SEED) methodology which will ensure that the
ESD current and voltage that impinge on an IC pin do not exceed the safe operating level [3, 4, 5].
Other works explore the electromagnetic propagation of ESD energy, with the objectives of
elucidating where electrical noise will appear and guiding system design improvements [6, 7].
Relatively few works describe soft failures from the user point-of-view [8]. However, such data
could help one determine the most worthwhile approach to ESD-induced soft failure mitigation;

2
i.e., it could help determine whether soft failure robustness should be provided by IC design,
system EMI design, software design, or a combination of these.
1.2 The IEC 61000-4-2 Standard
One of the most used system reliability tests is described in the IEC 61000-4-2 testing standard
[9]. The main purpose of this test is to understand how the system responds to external ESD events
during operation. This standard stems from the idea that every time a customer handles a product,
there is a chance that a discharge may occur. Additionally, these discharges can either occur
directly upon contact, or indirectly through the air before contact is achieved. Accordingly, the
IEC standard guides designers to test points where customers or installers may come in contact
with the equipment — for example, external facing ports, or touchscreens.
In this study, only IEC discharges were used. This includes both contact and air discharges where
applicable. The test setup for the discharges is shown in Figure 1. Here the equipment under test
(EUT) is placed on a thin sheet of insulating material, separating it from a metal, horizontal
coupling plane (HCP). Controlled discharges are generated using an ESD gun which can be
discharged either when in contact with the EUT or when moving towards the EUT. For contact
discharges, the standard suggests precharging the ESD gun to ±8 kV while for air discharges or
indirect discharges the suggested voltage is increased to ±15 kV.
Figure 2 shows a sample waveform of a contact discharge into a 2 Ω test target. The waveform
shape is specified in the standard [9] with the following parameters:
𝐹𝑖𝑟𝑠𝑡 𝑃𝑒𝑎𝑘 𝑅𝑖𝑠𝑒 𝑇𝑖𝑚𝑒: 𝑡(𝐼 = 90% 𝐼𝑝𝑒𝑎𝑘) − 𝑡(𝐼 = 10% 𝐼𝑝𝑒𝑎𝑘) = 𝒕𝒓 = 𝟖𝟎𝟎 𝒑𝒔
𝐹𝑖𝑟𝑠𝑡 𝑃𝑒𝑎𝑘 𝑀𝑎𝑥𝑖𝑚𝑢𝑚:𝑰𝒑
𝑽𝒑𝒓𝒆𝒄𝒉𝒂𝒓𝒈𝒆= 𝟑. 𝟕𝟓
𝒌𝑽
𝑨
𝐶𝑢𝑟𝑟𝑒𝑛𝑡 𝑎𝑡 30 𝑛𝑠:𝑰𝟑𝟎
𝑽𝒑𝒓𝒆𝒄𝒉𝒂𝒓𝒈𝒆= 𝟐
𝑨
𝒌𝑽
𝐶𝑢𝑟𝑟𝑒𝑛𝑡 𝑎𝑡 60 𝑛𝑠:𝑰𝟔𝟎
𝑽𝒑𝒓𝒆𝒄𝒉𝒂𝒓𝒈𝒆= 𝟏
𝑨
𝒌𝑽

3
Figure 1: Test setup for the IEC 61000-4-2 test standard. The EUT is placed on an insulator on a
horizontal coupling plane (HCP) which is connected to the ground plane through two 470 kΩ
resistors in series to allow for discharge between zaps. The ESD generator creates an ESD event
through the ESD gun. The resulting current waveform can be captured through a current probe
put around the gun tip. Figure courtesy of N. Thomson.
Figure 2: Sample waveform of current discharge from ESD gun into a 2 Ω target. Figures of
merit include the 10%-90% rise time of the initial peak current (Ip). The current at 30 ns (I30) and
the current at 60 ns (I60) are defined in the standard as well. Figure courtesy of N. Thomson.
kVESD
GENERATOR
+2.00
EUT HCP
Ground Plane
Insulator
470 kΩ
To Scope
Current Probe

4
1.3 Soft Failures
While single event upsets (SEUs) have been widely studied, ESD typically induces a more
widespread disruption of the IC circuitry, yet has received less attention. SEUs result from
energetic particles, e.g. alpha particles, impinging on the device and creating electron hole pairs in
the substrate. These carriers will then be collected by their respective diffusions, and if there is
enough charge, will result in a soft failure [10]. In contrast to SEUs, where it is expected that a
single bit or transistor is upset, the quantity of soft failures resulting from ESD may exceed just a
singular bit flip [11]. As energy enters the system, depending on the location, intensity, and path
travelled, the on-chip power supply integrity may be compromised until the ESD energy clears the
system [11, 12].
Soft failures from system-level ESD are dependent on the system under test, which can be broken
down into a few major sub-systems: the casing, the circuit board, and the chip and package.
1. The casing of a system may include conductive or insulative shielding that covers all or
part of the system. Based on the design of this shielding, access to sensitive components of
a system can be greatly restricted to only ports necessary for interaction with the outside
world. This reduces the locations where ESD currents may enter the system and often
results in an increase in robustness. Additionally, shielding can partially or completely
block electromagnetic fields radiated by the ESD gun. Insulative shielding provides the
benefit of increasing the magnitude of the electric field required for the ESD gun or a
charged object to discharge into the system. If the charge on the gun is not large enough,
discharge will not occur. On the other hand, while a perfectly conductive shielding will
redirect all current from a discharge around what is housed within the shielding, a realistic
conductive shielding can result in a secondary discharge from the shielding itself to the
system inside. This secondary discharge may occur if the shielding is either poorly
grounded or not grounded at all. It is important to note that all devices tested in this work
had no shielding. All the systems tested were designed for hobbyists or education and
include headers for connecting to peripherals. This results in what is essentially a worst-
case scenario for the systems under test [13].
5
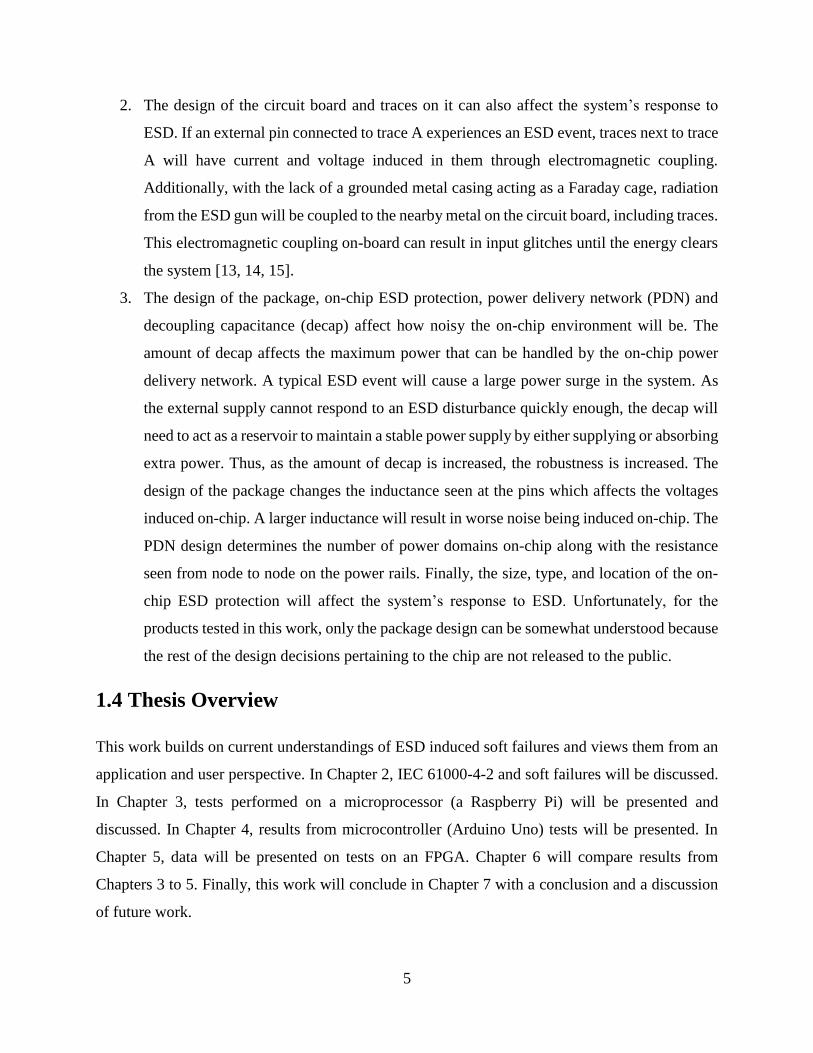
2. The design of the circuit board and traces on it can also affect the system’s response to
ESD. If an external pin connected to trace A experiences an ESD event, traces next to trace
A will have current and voltage induced in them through electromagnetic coupling.
Additionally, with the lack of a grounded metal casing acting as a Faraday cage, radiation
from the ESD gun will be coupled to the nearby metal on the circuit board, including traces.
This electromagnetic coupling on-board can result in input glitches until the energy clears
the system [13, 14, 15].
3. The design of the package, on-chip ESD protection, power delivery network (PDN) and
decoupling capacitance (decap) affect how noisy the on-chip environment will be. The
amount of decap affects the maximum power that can be handled by the on-chip power
delivery network. A typical ESD event will cause a large power surge in the system. As
the external supply cannot respond to an ESD disturbance quickly enough, the decap will
need to act as a reservoir to maintain a stable power supply by either supplying or absorbing
extra power. Thus, as the amount of decap is increased, the robustness is increased. The
design of the package changes the inductance seen at the pins which affects the voltages
induced on-chip. A larger inductance will result in worse noise being induced on-chip. The
PDN design determines the number of power domains on-chip along with the resistance
seen from node to node on the power rails. Finally, the size, type, and location of the on-
chip ESD protection will affect the system’s response to ESD. Unfortunately, for the
products tested in this work, only the package design can be somewhat understood because
the rest of the design decisions pertaining to the chip are not released to the public.
1.4 Thesis Overview
This work builds on current understandings of ESD induced soft failures and views them from an
application and user perspective. In Chapter 2, IEC 61000-4-2 and soft failures will be discussed.
In Chapter 3, tests performed on a microprocessor (a Raspberry Pi) will be presented and
discussed. In Chapter 4, results from microcontroller (Arduino Uno) tests will be presented. In
Chapter 5, data will be presented on tests on an FPGA. Chapter 6 will compare results from
Chapters 3 to 5. Finally, this work will conclude in Chapter 7 with a conclusion and a discussion
of future work.

6
2. TEST SETUP
All experiments were done using a test bed that was designed per the IEC 61000-4-2 ESD standard
as explained in Chapter 1.2. In most cases the EUT was, by necessity, attached to either another
computer or a monitor. None of the EUT are protected by enclosures; they are fully open systems.
Contact discharges were directed to the ground shields, power pins and exposed signal pins.
Indirect discharges were performed on the horizontal and vertical coupling planes (HCP and VCP).
If the EUT had been enclosed in a case, air discharges would also be performed. It is known that
the radiated field from an ESD gun [16] may induce currents and voltages on internal nodes of the
system. Therefore, contact discharges were directed to the processor heatsink to emulate the case
that a radiated field impinges on the processor and its package, affecting the traces closest to the
processor. The discharge current waveform was measured using a current probe and only the first
peak of the IEC waveform was evident. This confirms that heatsink zaps inject very little charge
into the system and that the resultant soft failures may be attributed to the radiated EM field.
In total, this thesis documents the results of nearly 5,000 electrostatic discharges.

7
3. MICROPROCESSOR (RASPBERRY PI)
Figure 3 shows a single-board computer which runs a version of Linux. The computer contains an
integrated CPU/GPU packaged with HDMI I/O circuitry. The Ethernet and USB ports are
controlled by a separate chip. System power is supplied through USB (5V) although most of the
components run on a combination of 3.3V, 1.8V and/or 2.5V. This product also has the CE mark.
In order to obtain this mark for electronics, testing includes radiated and conducted emissions and
immunity performance. This includes performing tests conforming to the IEC 61000-4-2 standard.
ESD tests were performed while the processor was either running a GPU intensive task, a game
based on centipede; running a file compression program; performing an I/O stream to disk; or
idling on the desktop.
Figure 3: Single-board computer top view. Discharge locations indicated by the lightning bolts.
Heatsink not shown.
USB
Control

8
Discharges of ±1.8kV to the CPU heatsink resulted in application-dependent display failures
described in Figure 4. “Display flicker” refers to the partial corruption of one row of pixels on the
display. These flickers are transient, lasting only until the next frame.
As indicated on the left-hand side of Figure 4, when the single-board computer is idle, the
probability of getting display flickers is significantly higher than when any of the three other
programs are running. In fact, the occurrence of display flickers is a decreasing function of the
average CPU usage. As the application being run moves from nothing (idling) to disk I/O to a
simple game to compression, the average CPU usage increases monotonically, and the frequency
of ESD-induced display flickers decreases.
Figure 4: Display failure likelihood based on program running when ±1.8kV is discharged onto
the single-board computer’s CPU heatsink. Error bars show a 95% confidence interval.
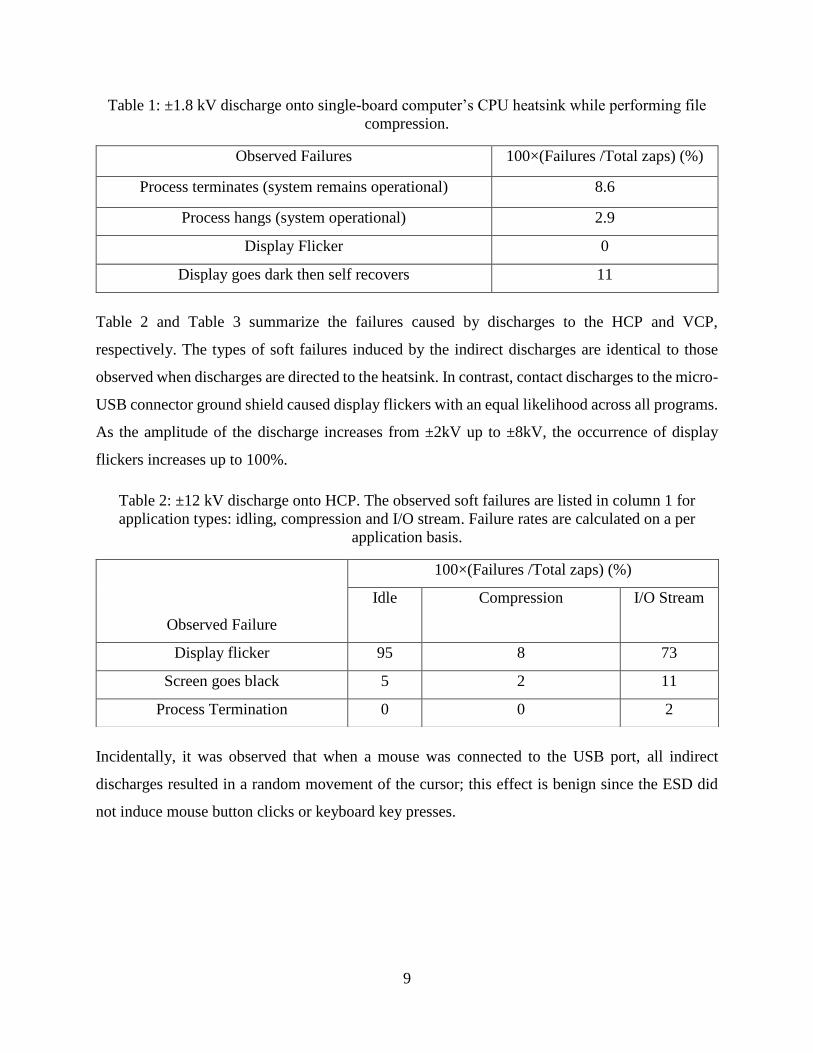
Only when the file compression program was being run were any soft failures other than display
failures observed; Table 1 summarizes the system’s response to ESD during the compression
process. The Linux operating system remained fully functional even when the compression process
was terminated or frozen due to ESD, as was established, following the discharge, by showing that
the start menu was working and other programs could be launched.
0
20
40
60
80
Display flicker Display goes dark then self
recovers
Per
cen
t li
kel
iho
od
of
ES
D-
ind
uce
d e
rro
r
Idle on desktop Simple game
File Compression (CPU intensive) IO Stream (Disk intensive)
9
Table 1: ±1.8 kV discharge onto single-board computer’s CPU heatsink while performing file
compression.
Table 2 and Table 3 summarize the failures caused by discharges to the HCP and VCP,
respectively. The types of soft failures induced by the indirect discharges are identical to those
observed when discharges are directed to the heatsink. In contrast, contact discharges to the micro-
USB connector ground shield caused display flickers with an equal likelihood across all programs.
As the amplitude of the discharge increases from ±2kV up to ±8kV, the occurrence of display
flickers increases up to 100%.
Table 2: ±12 kV discharge onto HCP. The observed soft failures are listed in column 1 for
application types: idling, compression and I/O stream. Failure rates are calculated on a per
application basis.
Incidentally, it was observed that when a mouse was connected to the USB port, all indirect
discharges resulted in a random movement of the cursor; this effect is benign since the ESD did
not induce mouse button clicks or keyboard key presses.
Observed Failures 100×(Failures /Total zaps) (%)
Process terminates (system remains operational) 8.6
Process hangs (system operational) 2.9
Display Flicker 0
Display goes dark then self recovers 11
Observed Failure
100×(Failures /Total zaps) (%)
Idle Compression I/O Stream
Display flicker 95 8 73
Screen goes black 5 2 11
Process Termination 0 0 2

10
Table 3: ±12 kV discharge onto VCP.
3.1 Discussion
The soft failures observed during testing of the single-board computer may be placed in two
categories: process terminations and display failures.
During those soft failures which are manifested by the application terminating, the system remains
operational (see Table 1). Software intervention is the preferred method of handling such failures;
for this system, error mitigation is successful only in some cases, i.e., when the process terminates
rather than hangs. When an anomaly is detected, different interrupts are raised based on the
anomaly’s severity. It is evident that following some of the discharges, the application sent an error
message to the OS which then aborted and exited the process. In some other cases, it can be
assumed that the compression process was corrupted in such a way that the problem was invisible
to the application itself and to the OS. If the OS does not receive notice that the application has
stopped operating normally, it will not terminate it. An example of a soft failure an application can
detect would be a memory out-of-bounds error which, at the hardware level, would result from a
bitflip in the SRAM or registers. On the other hand, if there are corruptions of lower level software
— e.g. drivers or hypervisors — loaded into SRAM, the application might not detect the issue.
Figure 4 indicates that two different types of transient display failures occurred. Three possible
mechanisms for the display blanking failures have been identified.
i. Severe corruption of the display buffer. A flush is required for it to resume correct
operation.
Observed Failure
100×(Failures /Total zaps) (%)
Idle Compression I/O Stream
Display flicker 95 8 64
Screen goes black 5 13 9
Process Termination 0 0 0

11
ii. Control line corruption. This results in the computer being unable to detect the monitor
and, therefore, not outputting any data. Reconnection requires handshaking between
the display and the driver which may take a few seconds. This explanation is believed
to be most likely.
iii. The GPU stops responding. At this point, the OS detects an anomaly and resets the
GPU. This would result in the display going black for a few seconds.
Display flickers occur at a rate that is application-dependent (see left-hand side of Figure 4), which
strongly suggests that the failure originates in the processor RTL. Specifically, it is concluded that
the application dependence must arise inside the integrated CPU/GPU because display flickers due
to ESD noise at the LCD monitor would presumably not be application-dependent, and the
display’s refresh rate is also application-independent. However, it is likely that as the CPU usage
increases, the percentage of time spent on instructions whose corruption would result in display
flickers would decrease. This is because rather than the system only performing updates to what
is displayed as is done with an idling desktop, as the CPU usage increases, more and more of the
clock cycles are used to perform the CPU intensive task. If, in order for a display flicker to occur,
an ESD event must corrupt data in certain registers during display operations, a reduction in
percentage of total time of these operations will result in a decreased likelihood. However, if the
induced noise is large enough, i.e., with contact discharges, it is likely that the frame buffers are
always corrupted resulting in an application-independent display flicker as was seen in the data.
Alternatively, as the contact discharges were performed to the ground plane, the disturbance
corrupted data being transmitted during the event.
Indirect discharges (see Table 2 and Table 3) induce the same types of soft failures as do the
discharges to the heatsink, and with a similar application-dependency. For this system, it is
surmised that discharges to the heatsink cause disturbances that are similar to those induced by
(IEC style) indirect discharges. The only observation that might contradict this conclusion is that
the heatsink zaps caused premature process termination only when the file compression program
was run, while VCP zaps could cause the file copy process to terminate. However, over the range
of investigated pre-charge voltages, premature process termination from indirect discharges occurs
at such a low rate (2%) that its application dependence may not be statistically significant. The
low incidence of this soft failure is assumed to result from the small joint probability of occurrence

12
for all the necessary conditions. Process termination may occur if a discharge corrupts a specific
(unidentified) instruction in SRAM. It also may be caused by corruption of the specific instruction
or needed resources (e.g. ALU) during processing or when the instruction or corresponding data
is in registers. This failure will occur only if a sufficiently large amount of noise is induced in the
system. As the ESD gun was held and actuated manually, variations in energy and noise coupled
to the system may have been large enough to add to the variability in the system’s response to
ESD.

13
4. MICROCONTROLLER (ARDUINO
UNO)
The microcontroller, shown in Figure 5, has a CE mark, similar to the single-board computer. The
board was tethered to a laptop via USB through which it output serial data and received power.
Transmission of serial data through the USB port is handled by an ASIC, henceforth referred to as
a USB interface chip. This system runs almost exclusively on 5V with the exception of parts of
the USB interface chip that run on 3.3V. Data can also be output from a digital output pin using
pulse width modulation; both the digital output pin and the serial output can transmit
simultaneously.
Figure 5: Microcontroller top view. Heatsink not shown. Lightning bolts indicate discharge
locations.
During the first round of testing, this EUT ran either an SRAM read/write program, a recursive
arithmetic program or a serial output program. Discharges were made to the heatsink (which is
adhered to the top of the microcontroller chip), ground shields, power pins and coupling planes.
The failures resulting from ESD are classified as shown in Table 4. Type A.1 and A.2 failures are
USB
CHIP
USB
Port
Digital Output

14
both system hangs, requiring either a reset signal or power cycling to resume normal operation. A
type C failure is caused by a change of one or more bits stored in the on-chip SRAM. An example
of a type D failure is shown in Figure 6. This failure was always manifested as a patterned,
partially-corrupted output stream. The only characters output are those that were programmed, but
the order in which the characters is output is jumbled. The serial output remains corrupted while
the system continues to run.
Table 4: List of failures seen upon discharging to the heatsink of the microcontroller.
Table 5 shows the rate at which each failure occurs when discharges are applied to the heatsink.
The given failure rate is calculated only for those experimental trials in which the failure could
be observed. For example, SRAM data corruption would not be detected when the serial output
program was running.
Table 5: ±3.25 kV discharges onto heatsink attached to microcontroller.
For the next set of experiments, the serial output program was modified. The new code enables a
watchdog timer which will reset the device (including its pulse width modulated (PWM) output
pins) should an anomaly be detected. The duty cycle of the PWM output is varied between 10%
and 90% over the course of 500 loop iterations. The modified serial output program was run during
ESD testing; the various failures observed are summarized in Table 6.
Type Failure
A.1 Serial output hangs; reset possible with reset button
A.2 Serial output hangs; power cycle required for recovery
B Program reset
C SRAM data corruption
D Sustained, serial output corruption
System Response 100×(Failures /Total zaps) (%)
A.1 2.0
A.2 7.0
B 5.0
C 1.0
D 4.0

15
Figure 6: Two examples of serial-output corruption while the microcontroller runs a program
containing a while-loop which prints “new round” at regular intervals. Discharges were
performed at ±3.25 kV on the heatsink.
Table 6: Discharges onto the heatsink at ±3.25 kV. Failures detected while running a program
utilizing the serial output, the PWM output and the watchdog timer. * denotes an error that
mainly occurred when the PWM signal was disabled, leaving serial as the only output.
With the same program running, indirect discharges were made to the HCP and VCP. Table 7
summarizes the observed soft failures. Only the serial output failed in this experiment.
Type Failure 100×(Failures
/Total zaps) (%)
A.1 Serial output hangs, PWM output operational; system is
reset using reset button
3.0
A.2 Serial output hangs, PWM operational; power cycle
required for recovery
8.0
E Serial output hangs and PWM duty cycle becomes constant
(= System hang)
3.0
F Serial output hangs, but watchdog timer resets system after
8 seconds
1.0
G Transient serial output corruption followed by self-recovery 1.0
D* Sustained, serial output corruption 3.0

16
Table 7: Failures observed following indirect discharges to a coupling plane at ±16 kV. The
microcontroller was running the same program as for Table 6.
Finally, the effect of ±6kV discharges to the ground and power nets of the board was investigated;
again, only type A.1 and A.2 failures were observed.
4.1 Discussion
The types of soft failures detected during ESD testing of the microcontroller are aggregated in
Table 8.
Table 8: Failure categories for microcontroller.
For the type A, specifically subtypes A.1 and A.2, soft failures, it is the USB interface chip that
fails to output data while the microcontroller continues to operate normally. A pick-off placed on
the data-line between the microcontroller and the USB interface chip shows that the
microcontroller is properly transmitting data.
Type E failures are different; the microcontroller is no longer running the program. Instead, the
system is operating in the last known state, which results in a constant PWM and no serial output.
The likely cause of this failure is corruption of the program counter (PC), likely due to bit flips in
registers, causing the system to break from the loop it should be running.
Discharge Location Observed Failures 100×(Failures /Total zaps) (%)
HCP A.1+A.2 4.0
HCP Error in one line of serial output 1.0
VCP A.1+A.2 8.0
Type Failure
A Serial output hang
B Program reset
C SRAM data corruption
D Sustained, serial output corruption
E System hang
F Reset by watchdog timer
G Transient, serial output corruption

17
In some cases, a failure at the microcontroller level is detected by the watchdog timer (type F);
specifically, these are failures that cause the watchdog timer to not be updated, resulting in a
timeout reset. The watchdog timer catches only a small fraction (~1%) of the failures, for two
reasons. First, most of the failures occur in the USB interface chip. Second, the watchdog timer
does not monitor all circuits inside the microcontroller, and faults may occur in unmonitored
circuits. The watchdog timer must receive a signal from the core within 8 seconds or it will issue
a system reset; however, if any of the uncore components or off-chip components have a failure
that requires a reset, the watchdog will not catch it.
Program restart failures (type B) presumably result when ESD energy couples to the reset pin of
the microcontroller, thereby causing the system to reset. Resetting the PC to the beginning of the
running program can be done by initiating a system reset either by the watchdog timer or the
system reset pin. However, the watchdog timer was set to issue a reset after an 8 second timeout
and in these test cases resets were immediate. Finally, resets can be caused by corrupting internal
registers; however, register corruption is unlikely.
Sustained corruption of the serial output (type D)—shown in Figure 6—may result from corruption
of the pointers in the microcontroller that point to where each character of “new round” is stored.
Because the time needed to complete one loop of the program is less than the time it takes to output
“new round” through the serial interface, data will be buffered for output. If the pointers are
corrupted, the output order of each character in “new round” will be affected. The pointers are
presumably stored in the general-purpose registers or in the SRAM; the values could be corrupted
by bit flips, a subject that is investigated further in the next Chapter. Since the ASCII characters
output by the serial interface are uncorrupted, data register corruption can be ruled out. However,
the exact failure mechanism was unable to be determined as compiler optimization and the specific
architecture for the serial interface, both of which we have little insight into, affect the
manifestation of this failure.
Transient corruption of the serial output data (type G) originates at the microcontroller, as was
established by using a pick-off on the transmit line. The buffered serial output data is corrupted,
resulting in a few lines of nonsense.

18
Recall that the data for Table 6 were generated using a program that utilizes both the serial output
port and the PWM digital output pin and that activates a watchdog timer. When the percentage of
time spent on instructions pertaining to serial output is increased, i.e. by removing watchdog timer
instructions or PWM instructions, the likelihood of causing a type D serial communication failure
increases from 0.025% to 3.0%. Sending RS-232 serial data to the USB interface chip causes most
of the program execution time to be spent on the serial device driver in the microcontroller. The
serial port connects to the external world and sends and receives data. This results in a higher
probability of coupling noise to it, and to the registers that control it, which are closely connected
to the serial port. The term closely connected refers to the nets of separation between IO and the
registers. If the system is storing or computing the data to be sent over the serial port and those
registers are more likely to be corrupted, it is likely that increasing the total computation time spent
on outputting via the serial port will necessarily result in an increase in faults.
Finally, a comparison of the data in Table 7 with that of Table 6 shows that discharges to the HCP
and VCP only cause the serial output to hang, i.e., the USB interface chip to malfunction, while
discharges to the heatsink caused a wider variety of soft failures. This discrepancy may be
attributed to the reduced amount of energy that couples to the traces near the microcontroller when
the discharge is directed to the HCP or VCP.
4.2 Novel Methodology for Fault Localization
Having now established that some of the application-level soft failures are the result of a hardware
upset in the microcontroller, we seek to better understand the connections between the physical
and computational layers. Toward this end, relatively high amplitude discharges were made to the
microcontroller heatsink while special test programs designed by Rui Jiang were being run [17].
The test programs use only 7 assembly instructions for enhanced fault localization. Prompt fault
detection is necessary to minimize the propagation of the fault from its original hardware location
before detection. This motivates two noteworthy features of our detection methodology. First, the
device is programmed using assembly language to minimize the amount of overhead code and the
detection latency. Second, the program uses the GPIO instead of the serial port, the latter of which
requires additional software and hardware which are themselves susceptible to failure, potentially
causing the misdiagnosis of an ESD failure.

19
4.2.1 Bit flips in a single register
Figure 7: Pseudo-code of P1 for detecting bit flips in a single general-purpose register.
An experiment is designed to count the number of bit flips in a single general-purpose register
(GPR) or in one byte of the SRAM, caused by a single ESD. Figure 7 shows pseudo-code for the
small program, P1, which is used to detect the number of bit flips in the GPR. In line 1 of the
pseudo-code, setup() resets all GPRs, configures the GPIO ports as outputs, and loads a pre-
defined binary string, 𝑣𝑎𝑙, into the GPR being monitored. In line 3 of the pseudo-code, the
delay() function ensures that the output value is held sufficiently long to be read out through
LEDs before being overwritten. The output of the XOR operation performed on line 4 of the
pseudo-code will be used to indicate the difference between the binary string initially written in
the register and the register’s possibly erroneous contents after the ESD. This output is written to
the I/O register. The program flow chart is given in Figure 8.
Figure 8: Flow chart of the program, P1. The program instructions are stored in the embedded
Flash; IR denotes instruction register which loads instructions from the Flash memory. GPR r17
is used to store the data, and GPR r16 initially stores the value from the IR and is then
repurposed to store the result of the XOR operation and feeds that result to the I/O register.
1 setup();
2 while(1){
3 delay();
4 IOreg = GPR xor val;
5 }
IR
GPR r17
I/O register
GPR r16
GPR r16
XOR
Flash
ldi r16, val
eor r16,r17
out 0x1B, r16
…

20
Program P2 is similar to P1, except that it detects bit flips in the SRAM. Data is written into a
single byte of the SRAM during the program setup stage.
Five hundred zaps were performed while running each program; the GPIO was read out after each
zap. The results of these experiments are shown in Table 9.
Table 9 Result of experiments to detect bit flips. 5.2 kV discharge to the microcontroller
heatsink.
Both sustained and transient failures are detected. In both cases, single and multiple bit flips are
detected. When more than one bit is corrupted, the flipped bits are not necessarily adjacent. For
example, in one trial the contents of GPR r17 changed from 00000000 to 00100110.
A sustained failure is one that does not correct itself and needs a system reset or power cycling to
fix. When P1 is executed, a sustained corruption indicates that the contents of GPR r17 were
modified. This is known because the content of GPR r17 are not updated after the program’s initial
setup step. A corrupted value will persist in GPR r17 and result in an error being continually
detected at the output. Similarly, a sustained corruption detected by program P2 indicates a
corruption in SRAM, since the contents of the SRAM are not being updated.
Transient failures self-correct in about one second, which corresponds to the time it takes for one
iteration of the program’s main loop. Transient failure implies that at least one of three hardware
units shown in Figure 8 (IR, GPR r16 or the I/O register) has its contents corrupted. For example,
if GPR r16 is corrupted, the erroneous data will propagate to the output and be read as an error.
However, in the next iteration of the main loop, GPR r16 is loaded with a new value from the IR
to be used in the XOR operation. The output from the XOR is then stored back into GPR r16. The
value of GPR r16 is now correct, and the failure has been “fixed.”
In all the experiments, the embedded Flash memory can be excluded as the source of data
corruption. Flash memory stores the instructions to be executed. If the Flash memory were
Failures 100×(Failures /Total zaps) for
program P1 (%)
100×(Failures /Total zaps) for
program P2 (%)
Sustained 1.0 1.2
Transient 2.8 3.0

21
corrupted, a system reset would not fix the failure; the board would have to be reprogrammed.
However, in these experiments, a system reset resolves the sustained failures.
4.2.2 Bit flips in multiple registers
It would be useful to know the extent of the ESD-induced hardware faults, i.e., whether it is typical
that just one register is affected or whether it is more common for many registers to be upset.
Program P3, whose pseudo-code is shown in Figure 9, allows us to monitor the contents of multiple
GPRs. The program was run during ESD testing and the results of the experiment are summarized
in Table 10.
Figure 9: Pseudo-code for P3 which detects bit flips in any of 9 general purpose registers.
Table 10: Result of experiment to detect bit flips in one or more GPR. 4.6 kV discharge to the
microcontroller heatsink. The number of corrupted GPR cannot be determined if the corruption
is transient.
Failures Number of
corrupted GPRs
(among 9 tested)
100×(Failures
/Total zaps)
(%)
Sustained 1 2.2
2 0.4
3-8 0
9 0.2
Transient N.A. 2.6
From the data in Table 10, one may conclude that the ESD faults are most typically localized, but
in some cases the upset is widespread. Widespread upset might be indicative of noise on the on-
chip power supply since that is common to all the registers. Noise can be induced on the on-chip
power supply through the on-chip IO circuitry [11].
1 setup()
2 while(1){
3 for (i=0; i<n; i++)
4 delay();
5 IOreg = GPR(i) xor val;
6 }
7 }

22
5. FIELD PROGRAMMABLE GATE
ARRAY
The FPGA evaluation board, shown in Figure 10, does not have a CE mark. This suggests that it
may have gone through less ESD testing than the previously discussed products. During ESD
testing it was tethered to a computer via its serial port, a monitor through DVI, and a power adapter.
Simultaneously, it was running one of the following applications: a slide show; a ringtone player;
Simon Says; or self-diagnostic routines which test the SRAM/DRAM, the LEDs, the ports or the
user input buttons.
Figure 10: FPGA top view. Discharge locations indicated by the lightning bolts. Heatsink not
shown.
Discharges were made to the points shown in Figure 10 and the observed soft failures are listed in
Table 11. Table 12 provides a summary of the soft failures observed following IEC-style

23
discharges at a variety of pre-charge voltages. The discharge locations in this table are locations
prescribed in the IEC test standard. Discharge voltages were raised either to the maximum value
specified in the test standard or until the system started resetting 100 percent of the time. Program
resets (type B failure) are the most frequent, which will be explained in the discussion Chapter that
follows. The program being run was varied in this experiment; however, the failures had no
apparent application-dependency.
Table 11: Types of ESD soft failures for the FPGA board.
Figure 11: Display frame corruption. Example of failure type I, display corruption, seen during
ESD testing of the FPGA.
Type Failure
B Program resets to its beginning.
H System hangs but can be restarted using the reset signal.
I The displayed image loses its interlacing, as shown in Figure 11, requiring a reset to
recover.
J The display has its left and right halves flipped, as shown in Figure 12, requiring a
reset to recover.

24
Figure 12: Display frame corruption. Example of failure type J.
Table 12: FPGA board soft failures caused by ESD. Upset occurred only in response to the
polarity of discharge(s) indicated in column 2.
In order to direct the energy from the ESD event closer to the system on chip (SOC), ESD zaps
were directed to the FPGA heatsink while a slideshow was running. While this does not exactly
conform to the test procedure, these discharges offer the ability to focus on the SOC’s robustness
rather than the robustness of the full system consisting of board, FPGA chip, and other chips on-
Discharge Location Voltage
(kV)
System Response 100×(Failures /Total zaps)
(%)
HCP ±9 - 0
HCP ±12 B 20
HCP ±12 H 10
GND shield of USB ports ±8 - 0
GND pin of AC socket -3 B 30
GND pin of AC socket -4 B 100

25
board. The failure occurrences are given in Table 13. Discharges at magnitudes below 3kV rarely
induced soft failures while discharges at ±3kV caused failures a few percent of the time. Higher
amplitude discharges resulted in a higher incidence of soft failures and a dominance of type B
errors.
Table 13: Discharge to FPGA heatsink with a pre-charge voltage of ±3 kV while running a
slideshow.
System Response 100×(Failures /Total zaps) (%)
B 6.7
H 3.3
I 1.7
J 3.3
Figure 13: Zaps to the power terminal of the FPGA board: probability of an error vs. discharge
voltage across all applications.
Discharges to the power terminal induce type B soft failures with a probability that is a linearly
increasing function of the ESD gun pre-charge voltage; the measurement data are plotted in Figure
13.
R² = 0.9918
0
0.1
0.2
0.3
0.4
0.5
0.6
0.7
0.8
0.9
1
0 1 2 3 4 5 6 7 8
Lik
elih
oo
d o
f E
rro
r
GUN Voltage [kV]

26
5.1 Discussion
The soft failures observed during ESD testing of the FPGA are categorized as follows.
• System hang
• Program reset
• Display corruption
Discharges to the HCP, ground or power can cause a program reset, suggesting that the program
reset trace is affected. This line runs from a push button; pushing the button causes the system to
restart from the beginning of the running application. It is concluded that the program reset line is
highly sensitive to radiated and coupled fields. Further discussion of noise coupling to signal traces
is found in [18]. Additionally, the data in Table 12 and Table 13 show that program reset type
failures occur more frequently than the other types of failures. The reset signal is asynchronous,
presumably eliminating the requirement that the ESD event occur near the clock edge for there to
be a reset soft failure.
Display corruption failures require a manual reset for recovery. This type of corrective action
would be required if registers storing the pointers to the display buffer were corrupted.
System hangs may indicate a severe malfunction of the main processing unit, e.g., the
microcontroller or microprocessor, or the memory controllers. Malfunction of the memory
controllers may result in loss of access to the DRAM or Flash. Similar to the type E failure seen
in the microcontroller, the system is non-operational.

27
6. CROSS-EUT DISCUSSION
Most of the observed soft failures occur in multiple of the EUT. These “cross-EUT” failures are
categorized as shown in Table 14.
Table 14: Failures seen across multiple products tested.
Failure
1 Output Failure
A. Display failure
B. Serial output failure
2 System hangs
3 Program resets
4 Program hangs
5 SRAM data corruption
6.1 Root-Cause Analysis
Similar symptoms across multiple devices may suggest a similar root cause. Display failures
occurred in both EUT that have display drivers, even though the FPGA has a peripheral display
chip and the single-board computer has a GPU packaged with the CPU. Two possible reasons for
ESD-induced display failures have been identified, and they are not mutually exclusive. (1)
Display signals or transceivers are highly susceptible to ESD [19]. (2) The failure is highly visible
to the user. High visibility arises because data are constantly being transmitted to the display,
which increases the likelihood that the display drivers are operational when an ESD occurs.
Furthermore, most, if not all, of the GPU’s output registers and buffers are constantly being used,
resulting in there being many signals that can be affected by ESD. In contrast, even if multiple
registers within a CPU are corrupted, they may not be in use which would result in an undetected
fault.
The microcontroller board exhibited many serial output failures and the underlying error
mechanism may be similar to that for the display failures, namely, susceptible device controllers
[20] and signal lines. Device controllers may produce erroneous outputs or crash with fault
injection. Likewise, large amounts of exposed signaling, particularly control signals for I/O, are

28
relatively easy to corrupt. Once corrupted, handshaking may fail, and re-initialization of the
transceiver may be required for proper operation.
System hangs occurred mainly in the EUTs without a sophisticated OS. This suggests that the
relatively good fault tolerance of the one EUT with an OS, i.e. the single-board computer with
microprocessor, may be the result of software-based error detection and recovery. However, there
are still cases in which the OS was compromised by an ESD-induced hardware fault in the main
processing unit or memory controller(s).
Program hangs are observed much less frequently than system hangs. In this case, it is required
that the hardware failure propagates up the software stack and causes failures in the running
software. Program hangs indicate that ESD has affected either a smaller portion of the chip or a
less critical part of the chip, e.g., registers containing non-critical information, than was affected
during a system hang.
A highly susceptible part of the EUT is the reset line. This line is often asynchronous and therefore
more easily disturbed than a synchronous input. This line is one of the most critical signals in the
system as it affects the whole system (it is a global signal).
SRAM data corruption was detected very infrequently. Using the diagnostic technique presented
in Chapter 4.2, it was found that SRAM and register bit flips occur infrequently, i.e., in only 1-2%
of the trials, even when the ESD gun is discharged near the processor. It is concluded that core
circuitry, such as SRAM, is not immune to ESD, but uncore circuitry is affected more frequently.
The latter is more susceptible as it tends to have more signals directly connected to the pins of the
chip.
Notably, the FPGA board did not have the CE mark. The data in Figure 13 show that discharges
at 2 kV to either the power or ground resulted in FPGA soft failures. On the other hand, for the
other products, failure levels were around 4kV to 8kV. In addition, the failures observed for the
two products with the CE mark, e.g. display flicker, are less severe in nature; the greater robustness
of these products can be attributed, at least in part, to the fact they were designed to pass ESD
qualification testing, while the FPGA board was not.

29
6.2 Mitigation
Mitigating failures in peripheral chips, e.g., video controller, USB driver, etc., would be useful for
addressing output failures (type 1 failure from Table 14). Software-directed failure mitigation may
be possible, even though software control of these chips is limited. One possible course of action
is to include software-controlled switches that trigger based on a watchdog timer which monitors
ESD susceptible components. This method would require peripheral chips to be designed to either
include their own watchdog timers or have extra signaling to the central processor so that its
watchdog timer can be leveraged.
There are two options for alleviating reset line glitches that cause system upsets. One is better EMI
design for the trace. The second is to make the signal synchronous instead so that ESD is less likely
to trigger a reset.
Mitigation of CPU-based “hangs” (failure types 2 and 4 from Table 14) can be approached from a
hardware/software combined solution. A checkpoint and rollback method [21] can be implemented
to deal with CPU-based faults. During normal operation, checkpoints will be frequently saved, and
upon a sensor detecting an ESD event, the system will be rolled back to the last known good state.
While a checkpoint and rollback based recovery methodology is simple to implement, it is a
high-cost recovery method which consumes potentially large amounts of compute power and
would only serve as an initial recovery concept before more complicated but more efficient
solutions are used. The added overhead comes from both the checkpointing and the recovery. If a
checkpoint is generated more and more often, an increasingly larger portion of the total clock
cycles used for an application must be used for creation of the checkpoint. On the other hand, if a
checkpoint is not created often enough, there is a potential for significant loss of data and compute
time when a recovery is needed. Additional research is needed to ensure only relevant failures are
caught with the checkpoint and rollback recovery process. Relevant failures are those that affect
the user experience, and thus mitigation methods need only to handle faults that propagate through
the system and become observable at the software level [22]. For example, a fault in an unused
register will not propagate up the software stack; thus, it will never affect the user experience and
can be safely ignored.

30
7. CONCLUSION
ESD events can cause faults which propagate from the hardware up to the application. The
likelihood of error propagation up to the application level is itself application-dependent.
Asynchronous inputs seem to be more susceptible to ESD-induced noise, requiring more careful
design. Faults affecting the output, rather than the whole system, mostly originate in data I/O units.
Display/output failures are one of the soft failures most often seen by the user as a result of either
high visibility or high usage.
Most soft failures occur in only a few percent of ESD testing trials, suggesting that a “perfect
storm” of necessary conditions must be met in order for a failure to be detectable by the user. In
particular, whether a failure occurs may depend on the relative timing of the ESD and the clock
edge, and also on what instruction is being executed when the ESD occurs. To fully characterize
the soft failure behavior of a system requires many more discharges than are normally performed
in ESD testing.
Short assembly language programs that access specific circuit blocks were demonstrated to be
useful for identifying specific parts of hardware that experience ESD-induced upsets. Similar
programs may be valuable research tools for further investigations of ESD soft failures.
7.1. Future Work
A major obstacle in understanding why soft failures occur comes as a result of obfuscation of the
architecture of the devices under test. In order to better understand the root causes of soft failures
and optimize mitigation strategies, creating a custom chip will give a complete view of the
underlying architecture and layout. This will allow for simulations of the circuits in question.
Additionally, adding custom sensors for ESD noise will enable finding the noise thresholds for
soft failures. These sensors can assist in determining when a system recovery must be carried out.

31
REFERENCES
[1] System Level ESD Part I: Common Misconceptions and Recommended Basic Approaches,
JEDEC, 2011.
[2] System Level ESD Part II: Implementation of Effective ESD Robust Designs, JEDEC, 2013.
[3] N. Monnereau et al., “A system-level electrostatic-discharge-protection modeling
methodology for time-domain analysis,” IEEE Transactions on Electromagnetic
Compatibility, vol. 55, no.1, pp. 45-57, 2013
[4] M. Scholz et al., “Comparison of system-level ESD design methodologies—towards the
efficient and ESD robust design of systems,” IEEE Transactions on Device and Materials
Reliability, vol. 13, no. 1, pp. 213-222, 2013.
[5] S. Bertonnaud et al., “IEC system level ESD challenges and effective protection strategy for
USB2 interface,” in Proc. EOS/ESD Symp., pp 388-395, 2012.
[6] J. Lee et al., “A study of a measurement and simulation method on ESD noise causing soft-
errors by disturbing signals,” in Proc. EOS/ESD Symp., pp.1-5, 2011.
[7] T. Yoshida and N. Masui, “A study on discharge current and radiation noise of ESD from
charged metal and charged human body,” in Industry Applications Society Annual Meeting,
pp.1-6, 2008.
[8] B. Orr et al., “A systematic method for determining soft-failure robustness of a subsystem,”
in Proc. EOS/ESD Symp., pp.1-8, 2013.
[9] Electromagnetic Compatibility (EMC) - Part 4-2: Testing and Measurement Techniques -
Electrostatic Discharge Immunity Test, IEC, 2008.
[10] D. K. Nichols, W. E. Price and C. J. Malone, “Single event upset (SEU) of semiconductor
devices - a summary of JPL test data,” IEEE Transactions on Nuclear Science, vol. 30, no. 6,
pp. 4520-4525, Dec. 1983.
[11] N. A. Thomson, Y. Xiu and E. Rosenbaum, “Soft-failures induced by system-level ESD,”
IEEE Transactions on Device and Materials Reliability, vol. 17, no. 1, pp. 90-98, March
2017.
[12] Y. Xiu, N. Thomson, R. Mertens, C. Reiman and E. Rosenbaum, “Chip-level ESD-induced
noise on internally and externally regulated power supplies,” 2017 39th Electrical
Overstress/Electrostatic Discharge Symposium (EOS/ESD), Tucson, AZ, 2017, pp. 1-10.
[13] C. Duvvury and H. Gossner, System level ESD Co-Design. Hoboken: John Wiley and Sons,
Inc., 2015.
[14] S. Yang et al., “Mirrored power distribution network noise injection for soft failure root
cause analysis,” in Proc. EOS/ESD Symp., Garden Grove, CA, 2016, pp. 1-5.
[15] A. Patnaik et al., “Systematic evaluation of soft failures in system-level ESD transient
events,” IEEE Transactions on Electromagnetic Compatibility, vol. 60, no. 5, pp. 1263-1269,
Oct. 2018.
[16] M. Honda, “Measurement of ESD-gun radiated fields,” in Proc. EOS/ESD Symp., pp. 323-
327, 2007.

32
[17] R. Jiang, “Detection, diagnosis and modeling of ESD-induced soft failure – a gate-level and
mixed-signal approach,” MS thesis, University of Illinois at Urbana-Champaign, 2017.
[18] K. Wang et al., “The PCB level ESD immunity study by using 3 dimension ESD scan
system,” in Proc. Intl. EMC Symp., vol. 2, pp. 343-348, 2004.
[19] Y. Waghela, “Case study of ESD issue debug on smartphone reference design,” in
DesignCon, 2016.
[20] H. Cho et al., “Understanding soft errors in uncore components,” in ACM/IEEE DAC, pp. 1-
6, 2015.
[21] D. Siewiorek and R. Swarz, Reliable Computer Systems Design and Evaluation. A K Peters,
1998.
[22] M. Li et al., “SWAT: an error resilient system,” Workshop on Silicon Errors in Logic-
System Effects, 2008.