investigating the criterion-related validity of the toefl ... · table 8 classification rate on an...
TRANSCRIPT

Listening. Learning. Leading.
Investigating the Criterion-Related Validity of the TOEFL Speaking Scores for ITA Screening and Setting Standards for ITAs
Xiaoming Xi
ISSN 1930-9317
TOEFL iBT Research ReportTOEFLiBT-03 January 2008
Investigating the Criterion-Related Validity of the TOEFL® Speaking Scores for ITA
Screening and Setting Standards for ITAs
Xiaoming Xi
ETS, Princeton, NJ
RR-08-02

ETS is an Equal Opportunity/Affirmative Action Employer.
As part of its educational and social mission and in fulfilling the organization's non-profit Charter and Bylaws, ETS has and continues to learn from and also to lead research that furthers educational and measurement research to advance quality and equity in education and assessment for all users of the organization's products and services.
Copyright © 2008 by ETS. All rights reserved.
No part of this report may be reproduced or transmitted in any form or by any means, electronic or mechanical, including photocopy, recording, or any information storage and retrieval system, without permission in writing from the publisher. Violators will be prosecuted in accordance with both U.S. and international copyright laws.
ETS, the ETS logos, GRADUATE RECORD EXAMINATIONS, GRE, SPEAK, TOEFL, the TOEFL logo, AND TSE are registered trademarks of Educational Testing Service (ETS). The TEST OF ENGLISH AS A FOREIGN LANGUAGE and TEST OF SPOKEN ENGLISH are trademarks of ETS.
College Board is a registered trademark of the College Entrance Examination Board.

Abstract
Although the primary use of the speaking section of the Test of English as a Foreign Language™
Internet-based test (TOEFL® iBT Speaking test) is to inform admissions decisions at English
medium universities, it may also be useful as an initial screening measure for international
teaching assistants (ITAs). This study provides criterion-related validity evidence for the use of
TOEFL iBT Speaking for ITA screening and evaluates the effectiveness of using the scores for
teaching assistantship (TA) assignment classification.
Four universities participated in this study. Local ITA-screening tests or instructor
recommendations were used as the criterion measures. Relationships between the TOEFL
Speaking test and the local ITA tests were explored through observed and disattenuated
correlations. These relationships were moderately strong, supporting the use of the TOEFL
Speaking test for ITA screening. However, the strengths of the relationship between the TOEFL
Speaking test and the local ITA tests were found to be somewhat different across universities
depending on the extent to which the local test engaged and evaluated nonlanguage abilities.
Implications of these findings are discussed.
Binary and ordinal logistic regressions were used to investigate how effective TOEFL
Speaking scores were in separating students into distinct TA assignment categories. At all four
universities, TOEFL Speaking scores were significant predictors of students’ TA assignments
and were fairly accurate in classifying students for TA assignments. ROC curves were used to
determine TOEFL Speaking cut scores for TA assignments at each university that would
minimize false positives (i.e., true nonpasses classified as passes).
The results have considerable potential value in providing guidance on using the TOEFL
iBT Speaking scores for ITA screening.
Key words: TOEFL iBT Speaking, criterion-related validity, standard setting, cut scores, logistic
regression
i

The Test of English as a Foreign Language™ (TOEFL®) was developed in 1963 by the National Council on the Testing of English as a Foreign Language. The Council was formed through the cooperative effort of more than 30 public and private organizations concerned with testing the English proficiency of nonnative speakers of the language applying for admission to institutions in the United States. In 1965, Educational Testing Service (ETS) and the College Board® assumed joint responsibility for the program. In 1973, a cooperative arrangement for the operation of the program was entered into by ETS, the College Board, and the Graduate Record Examinations® (GRE®) Board. The membership of the College Board is composed of schools, colleges, school systems, and educational associations; GRE Board members are associated with graduate education. The test is now wholly owned and operated by ETS.
ETS administers the TOEFL program under the general direction of a policy board that was established by, and is affiliated with, the sponsoring organizations. Members of the TOEFL Board (previously the Policy Council) represent the College Board, the GRE Board, and such institutions and agencies as graduate schools of business, two-year colleges, and nonprofit educational exchange agencies.
Since its inception in 1963, the TOEFL has evolved from a paper-based test to a computer-based test and, in 2005, to an Internet-based test, TOEFL iBT. One constant throughout this evolution has been a continuing program of research related to the TOEFL test. From 1977 to 2005, nearly 100 research and technical reports on the early versions of TOEFL were published. In 1997, a monograph series that laid the groundwork for the development of TOEFL iBT was launched. With the release of TOEFL iBT, a TOEFL iBT report series has been introduced.
Currently this research is carried out in consultation with the TOEFL Committee of Examiners. Its members include representatives of the TOEFL Board and distinguished English as a second language specialists from the academic community. The Committee advises the TOEFL program about research needs and, through the research subcommittee, solicits, reviews, and approves proposals for funding and reports for publication. Members of the Committee of Examiners serve four-year terms at the invitation of the Board; the chair of the committee serves on the Board.
Current (2007-2008) members of the TOEFL Committee of Examiners are:
Alister Cumming (Chair) University of Toronto Geoffrey Brindley Macquarie University Frances A. Butler Language Testing Consultant Carol A. Chapelle Iowa State University Catherine Elder University of Melbourne April Ginther Purdue University John Hedgcock Monterey Institute of International Studies David Mendelsohn York University Pauline Rea-Dickins University of Bristol Mikyuki Sasaki Nagoya Gakuin University Steven Shaw University of Buffalo
To obtain more information about the TOEFL programs and services, use one of the following:
E-mail: [email protected] Web site: www.ets.org/toefl

Acknowledgments
I would like to give special thanks to the ITA program coordinators (Tim Farnsworth at the
University of California, Los Angeles; Jeffrey Adams-Davis at the University of North Carolina,
Charlotte; Barbara Hoekje and Christos Theodoropulos at Drexel University; and Gordon Tapper
at the University of Florida at Gainesville) for their collaboration in collecting the data in this
study and for their helpful comments on an earlier draft of this report. Without their support, I
would not have been able to complete this study. Thanks also go to Teresa Holland, Emily
Midouhas, and Jonathan Steinberg for their help in preparing the manuscript and to Dan Eignor
and three ETS reviewers for reviewing a draft of this manuscript.
iii

Table of Contents
Page
Introduction..................................................................................................................................... 1
ITA Testing in the United States and Potential Use of TOEFL Speaking Scores as an
Initial ITA Screener ........................................................................................................................ 5
Trade-Off of Different Classification Errors in Using TOEFL Speaking Scores for Teaching
Assistantship Assignments.............................................................................................................. 6
Method ............................................................................................................................................ 7
Participating Universities......................................................................................................... 7
Participants .............................................................................................................................. 7
Instruments .............................................................................................................................. 8
Procedure ................................................................................................................................. 9
Analytic Methods..................................................................................................................... 9
Analyses and Results ............................................................................................................. 10
Institution 1: University of California, Los Angeles ............................................................. 10
Institution 2: University of North Carolina, Charlotte........................................................... 18
Institution 3: Drexel University ............................................................................................. 25
Institution 4: University of Florida at Gainesville................................................................. 32
Summary of Reliability Estimates and Cut Score Recommendations................................... 39
Discussion..................................................................................................................................... 41
Relationships Between TOEFL Speaking and Local ITA Test Scores ................................. 41
Setting Cut Scores on the TOEFL iBT Speaking Test for ITA Screening............................ 46
Limitations and Conclusion................................................................................................... 47
References..................................................................................................................................... 50
Notes ............................................................................................................................................. 53
List of Appendixes........................................................................................................................ 55
iv

List of Tables
Page
Table 1 Data Collected at Each Participating University .......................................................... 9
Table 2 Descriptives of TOEFL Speaking Scores and TOP Composite and Analytic Scores at
University of California, Los Angeles ........................................................................ 12
Table 3 Observed and Disattenuated Correlations Between TOEFL Speaking Scores and TOP
Scores.......................................................................................................................... 13
Table 4 Results of the Ordinal Regression Analysis on University of California, Los Angeles
Data ............................................................................................................................. 14
Table 5 True Versus Predicted Outcome Categories at University of California, Los Angles 14
Table 6 True Positive (Sensitivity) Versus False Positive (Specificity) Rates at Different
TOEFL Speaking Cut Scores for Provisional Passes ................................................. 16
Table 7 True Positive (Sensitivity) Versus False Positive (Specificity) Rates at Different
TOEFL Speaking Cut Scores for Clear Passes ........................................................... 17
Table 8 Classification Rate on an Independent Sample With 27 on the TOEFL Speaking Test
as the Cut Score for Clear Passes and 24 for Provisional Passes................................ 18
Table 9 Classification Rate on an Independent Sample With 27 on the TOEFL Speaking Test
as the Cut Score for Clear Passes and 23 for Provisional Passes................................ 18
Table 10 Descriptives of TOEFL Speaking Scores and Presentation Test Scores for the Whole
Sample at University of North Carolina, Charlotte .................................................... 20
Table 11 Observed and Disattenuated Correlations Between TOEFL Speaking Scores and
University of North Carolina, Charlotte Presentation Test Composite and Analytic
Scores.......................................................................................................................... 21
Table 12 Descriptives of Participants’ TOEFL Speaking Scores on Form A and Presentation
Test Scores .................................................................................................................. 22
Table 13 Results of the Logistic Regression Analysis on the University of North Caroline,
Charlotte Data ............................................................................................................. 23
Table 14 True Versus Predicted Teaching Assistantship Assignment Categories at University
of North Carolina, Charlotte ....................................................................................... 23
Table 15 True Positive and False Positive Rates at Different TOEFL Speaking Cut Scores for
Clear Passes at University of North Carolina, Charlotte ............................................ 24
v

Table 16 Classification Rate Based on an Independent Sample Using 21 on the TOEFL
Speaking Test as the Cut Score................................................................................... 24
Table 17 Descriptives of TOEFL Speaking, SPEAK, DIP Composite, and DIP Analytic Scores
for the Whole Sample at Drexel.................................................................................. 27
Table 18 Observed and Disattenuated Correlations Among the TOEFL Speaking, SPEAK, DIP
Composite, and DIP Analytic Scores.......................................................................... 28
Table 19 Results of the Logistic Regression Analysis on Drexel Data ..................................... 29
Table 20 True Versus Predicted Classification Rate for Teaching Assignment
Recommendations With a Cutoff of .50 Probability .................................................. 30
Table 21 Comparison of the Areas Under the ROC Curve With TOEFL Speaking, DIP, DIP -
Teach., and SPEAK Scores as Predictors ................................................................... 31
Table 22 True Positive Versus False Positive Rates for AA at Different TOEFL Speaking Cut
Scores.......................................................................................................................... 32
Table 23 Descriptives of TOEFL Speaking Scores on Form A and SPEAK Scores................. 33
Table 24 Descriptives of TOEFL Speaking Scores on Form B and Teach Evaluation Scores . 34
Table 25 Observed and Disattenuated Correlations Among TOEFL Speaking, SPEAK, and
Teach Evaluation Scores............................................................................................. 35
Table 26 Results of Ordinal Regression Analysis on University of Florida at Gainesville Data
..................................................................................................................................... 37
Table 27 True Versus Predicted Outcome Category ................................................................. 37
Table 28 True Positive Versus False Positive Rates at Different TOEFL Speaking Cut Score
Points for Provisional Passes ...................................................................................... 38
Table 29 True Positive Versus False Positive Rates at Different TOEFL Speaking Cut Score
Points for Clear Passes................................................................................................ 38
Table 30 Reliability Estimates of the TOEFL iBT Test and Local ITA Tests .......................... 40
Table 31 Summary of TOEFL Speaking Cut Score Recommendations at the Four Institutions
..................................................................................................................................... 41
vi

Introduction
The Test of English as a Foreign Language™ Internet-based test (TOEFL® iBT) test has
undergone major revisions to include speaking as a mandatory section for the first time. The
TOEFL iBT Speaking section has been designed to measure the candidates’ ability to
communicate orally in English in an academic environment. Although the primary use of
TOEFL iBT Speaking is to inform admission decisions regarding EFL/ESL applicants at English
medium universities, it may also be useful as an initial screening measure for international
teaching assistants (ITAs).
Some research has provided support for the validity of TOEFL iBT Speaking as a
measure of speaking ability in typical academic settings, such as speaking about academic course
content, campus life, and familiar daily topics (Butler, Eignor, Jones, McNamara, & Suomi,
2000; Douglas, 1997; Rosenfeld, Leung, & Oltman, 2001; Waters, 1996). Still, additional
evidence needs to be established to support it as a measure of speaking ability in instructional
settings, and the use of its scores for making decisions about teaching assistantship (TA)
assignments at institutions in the United States.
The goals of this study are to provide criterion-related validity evidence for ITA
screening decisions based on TOEFL Speaking scores and to evaluate the adequacy of using the
scores for TA assignments. First, the paper investigates the relationships between scores on a
TOEFL Speaking test1 and scores on criterion measures, intending to establish some association
between them. Then, it illustrates how cut scores for TA assignments can be determined based
on students’ performances on the TOEFL Speaking test and on the criterion measures.
Criterion-related validity studies are nothing new to the language testing field and can be
dated as far back as the 1950s (Lado, 1961). When examining the relationship between TOEFL
Speaking scores and criterion measure scores, issues such as the choice of good criterion
measures and the reliability of the criterion measures often arise. Both factors may impact the
strength and the interpretation of the relationships between TOEFL Speaking scores and criterion
measure scores.
The criterion measure can be another test for which evidence has been collected to
support its validity and reliability as an ITA-screening test. This type of criterion measure
features fairly standardized test administrations and uses explicit rubrics and trained raters.
1

Another type consists of a comprehensive classroom diagnostic assessment of ITAs by
instructors. This second type is less structured than an ITA test. The instructors usually have
ample opportunities to observe ITAs’ communication skills and use multiple sources of
information to make ITA evaluations and recommendations, whereas a test provides only a
single observation of the candidates’ speaking ability in a contrived environment.
A third measure is the evaluations of ITAs’ relevant speaking skills by their
undergraduate students. This type of criterion measure is very appealing because the
undergraduate students usually have multiple opportunities to observe ITA’s use of language in
various instructional settings as opposed to the single shot the ITA test evaluates. However, two
major issues are associated with this kind of criterion measure. The first is that it may have low
inter-rater reliability. The second issue is that students' evaluations of their ITA’s language
ability may be impacted by irrelevant, nonlanguage factors (Rubin, 1992). In addition, logistical
difficulties may prevent collecting a sufficient number of undergraduate students’ evaluations of
ITAs. For example, at some universities students are not allowed to teach in their first year even
if they have passed the ITA test; at universities where ITAs can teach in their first year, many of
them who passed the ITA tests may not have any TA assignments in the subsequent semester.
Difficulties such as these make it challenging to collect students’ evaluations of ITAs
immediately after they have taken a local ITA test.
In this study, two types of criterion measures for the TOEFL Speaking test were used:
locally developed teaching simulation tests used to select ITAs and ITA course instructors’
recommendations of TA assignments. Universities that have established procedures to select
ITAs were selected for inclusion in this study. Specifically, these universities use performance-
based tests that attempt to simulate language use in real instructional settings. A variant of this
type of teaching simulation test was considered to be more authentic in resembling real-world
language-use tasks and in engaging the underlying oral skills required in instructional settings, in
comparison to a tape-mediated general speaking proficiency test and oral interview (Hoekje &
Linnell, 1994). At these participating universities, various studies have been conducted to
support the validity of their tests for ITA screenings, or procedures have been established to
check the effectiveness of the ITA test for ITA assignments. These procedures may include
mechanisms for the departments to file complaints about their ITAs’ inadequate communication
skills or for undergraduates to evaluate their ITAs' communication skills and other aspects of
2

their classroom teaching skills. Whenever feasible, the reliability of the local ITA tests was
estimated in this study and then corrected for to reveal the true relationships between the local
ITA tests and the TOEFL Speaking test. Otherwise measurement errors associated with both the
TOEFL Speaking test and the local ITA tests may disguise the true relationships between them.
The most important focus of this paper is to illustrate the process of setting cut scores for
ITA screenings. This involves both methodological considerations and value judgments. On the
methodological side, this paper demonstrates step by step how the overall effectiveness of
TOEFL Speaking scores in classifying TA assignments can be established. It also discusses two
types of errors that may occur when using TOEFL Speaking scores for classifying teaching
assignments, taking their trade-offs into account in order to establish an appropriate standard in
ITA screening.
For screening ITAs, the most important decision is a pass-fail decision that decides
whether an international student has sufficient speaking skills to teach. Most universities that
offer ITA-training courses also assign provisional passes to their potential ITAs, making them
eligible to teach with concurrent ITA-training coursework. A desirable screening measure would
split the potential students into fairly distinct groups. For example, potential ITAs who qualify
for teaching assignments should have higher TOEFL Speaking scores than provisional passes
and nonpasses. Likewise, provisional passes should have higher TOEFL Speaking scores than
nonpasses. In most cases, the distributions of TOEFL Speaking scores of the adjacent groups will
overlap. Inevitably, those who are on the border between passing and provisionally passing and
between provisionally passing and not passing are the toughest cases to classify. However,
optimal cut scores can be set based on TOEFL Speaking scores to discriminate between the
members of the different groups and to reflect value judgments about different types of error.
The process of deriving cut scores for ITA assignments is called standard setting. There
are two general approaches to standard setting, test-centered and examinee-centered. Test-
centered methods (Angoff, 1971) are best suited for selective-response items. The examinee-
centered approach, such as the borderline-group and the contrasting-groups methods, is better
suited for extended-response tests (Cohen, Kane, & Crooks, 1999).
In the borderline-group method (Livingston & Zieky, 1982), a group whose levels of
performance are near the performance standard2 of interest is identified based on, for example, a
criterion measure other than the test for which the cut scores are to be derived. A cut score is
3

obtained that represents the central tendency of the test scores (e.g., median) from this group of
examinees. In the contrasting-groups method (Livingston & Zieky), two groups, one above the
performance standard and one below, are identified based on some criterion measure, for
example, experts’ judgments. The score distributions of these two groups are examined, and a
cut score is determined that best separates the examinees into these two distinct groups. Multiple
borderline groups or multiple pairs of contrasting groups are used when multiple cut scores are to
be set.
Cohen et al. (1999) have modified the contrasting-groups approach and developed the
generalized examinee-centered method. Conceptually similar to the contrasting-groups approach,
it uses a sample representing a whole range of performances and allows multiple cut scores to be
set simultaneously rather than separately. Based on this approach, these basic steps were
followed to derive the cut scores on the TOEFL Speaking test in this study: a sample of potential
ITAs was recruited, their performance on the criterion measure and the TOEFL Speaking test
was obtained, and cut scores on the TOEFL Speaking test that best separated them into ITA
assignment categories based on their criterion performance were determined.
This study intends to answer two major questions: First, how are scores on the TOEFL
Speaking test and local ITA tests related to each other? Second, what are the appropriate TOEFL
Speaking score requirements for TA assignments at these institutions?
The first question was investigated using correlational analyses. Both observed and
disattenuated correlations (i.e., correlations corrected for score unreliability) between scores on
the TOEFL Speaking test and on the criterion measures were used. Since TA assignment
recommendations are categorical outcomes, the response to the second question is that linear
regression is not appropriate. Logistic regression or discriminant function analyses have been
applied in predicting a dichotomous or a polytomous dependent outcome. However, logistic
regression has become the more popular methodology because it requires less stringent
assumptions, that is, it does not assume that the data demonstrate a multivariate normal
distribution with equal variances and covariances for all variables (Cleary & Angel, 1984; Efron,
1975; Lei & Koehly, 2000; Press & Wilson, 1978). The only assumptions for logistic regression
are independent sampling, a linear relationship between the logit of the predicted outcomes and
the independent variables, and the absence of multicollinearity (i.e., highly correlated predictors).
Therefore, binary logistic regression was used in this study to model dichotomous outcome
4

variables. Ordinal regression was employed when there were more than two ordered outcome
categories, such as eligible to teach, eligible with concurrent ESL coursework, and not eligible
(see Appendix A for more about these approaches).
The next section reviews ITA testing in the United States and the potential use of the
TOEFL iBT Speaking test for ITA screening to establish the methodology of setting cut scores.
ITA Testing in the United States and Potential Use of TOEFL Speaking Scores
as an Initial ITA Screener
In the 1970s and early 1980s, the ITA problem surfaced, with increasing complaints from
undergraduate students and their parents about the oral communication problems of ITAs (Smith,
Byrd, Nelson, Barrett, & Constantinides, 1992). To address their concerns, more and more states
and university governing bodies passed legislation or made regulations to mandate the testing of
ITAs for English oral skills. As reviewed in Plakans & Abraham (1990), three major types of tests
have been used to test the oral skills of ITAs: the Test of Spoken English™ (TSE®) or its
institutional version, SPEAK® (developed by ETS); oral interviews; and teaching simulation tests.
These tests have served complementary functions in ITA testing. In particular, because
some universities provide teaching assistantships as a form of financial aid to their incoming
international graduate students, their speaking proficiency requires screening before they arrive
on campus. Sometimes universities may need to have information about candidates’ speaking
proficiency prior to admissions decisions, since these students frequently require the financial
assistance that comes with employment as a TA. Local ITA-screening tests cannot fulfill this
goal, since it may take up to a few weeks to schedule and administer the ITA tests and report
scores. TSE has frequently served this purpose of pre-admission screening, as it is administered
in test centers around the world. TSE uses speaking tasks that are contextualized in more general
settings, whereas the TOEFL iBT Speaking test has been designed specifically to measure oral
communication skills for academic purposes. TOEFL iBT Speaking may therefore be a more
appropriate measure for ITA screenings than the TSE, given its more specific focus. In addition,
since TSE has been gradually phased out with the launch of the TOEFL iBT test worldwide, a
new pre-admission screening test is needed.
Locally administered SPEAK exams, which use retired TSE forms, have been widely
used as on-site ITA screeners. The widespread use of SPEAK for this purpose has been
attributed to its efficiency in testing (i.e., multiple candidates can be tested together in a language
5

lab), excellent rater training and support materials provided by ETS, and professionally
developed test materials (Smith, Byrd, et al., 1992). Still, some research has found that although
SPEAK discriminates high- and low-level speakers very well, it does not screen students in the
middle range very well (Landa, 1988). Therefore, some institutions (e.g., University of Florida at
Gainesville and University of California, Berkeley) have started to use SPEAK as an on-site
initial screener to select ITAs whose speaking proficiency is well above the required standards
and follow SPEAK with a teaching simulation test to further screen borderline students.
Although the TOEFL iBT test has been launched worldwide in the majority of locations
worldwide, the SPEAK test can still be used for on-campus initial screening. However, for
incoming international students who submit their TOEFL iBT scores with their applications
(including their TOEFL Speaking scores), the TOEFL Speaking scores could potentially be used
for pre-admission screening. Such an approach would aid in identifying candidates who are
ready to teach as well as help determine who needs to be tested using a local test before and/or
after they have arrived.
Trade-Off of Different Classification Errors in Using TOEFL Speaking Scores
for Teaching Assistantship Assignments
Now that the methodological considerations in setting cut scores have been discussed,
and the history of ITA testing has been reviewed in order to set the context for the
methodological illustration, value judgments involved in setting cut scores for TA assignments
merit discussion.
When TOEFL Speaking scores are used to classify students for TA assignments, two
types of classification errors are likely to occur: false positives and false negatives. In this
context, false positives are those not qualified as TAs based on their local ITA test scores who
are predicted as qualified by their TOEFL Speaking scores. False negatives, on the other hand,
occur when qualified TAs are predicted to be unqualified by their TOEFL Speaking scores.
Since ITA programs are gatekeepers for quality undergraduate education, false positives may
have more serious impact from this perspective; having unqualified ITAs in classrooms may
compromise the quality of undergraduate education and infringe on the interests of
undergraduate students who pay high tuitions and fees. However, false negatives have dangers as
well. Many international graduate students are offered teaching assistantships as part of their
financial aid packages and rely on these positions to finance their studies. Without employment
6

as TAs and in the absence of alternative funding, they may have to quit their studies and return to
their home countries. In addition, many science departments do not have enough faculty to teach
introductory undergraduate courses and are in dire need of ITAs to teach some courses. The
departments may consequently feel frustrated if the ITA program cannot supply enough ITA
candidates.
If TOEFL Speaking scores were to be used as an initial screening measure and
unqualified TAs were mistakenly classified as qualified (a false positive), there would be no way
to rectify this error. However, if otherwise qualified ITAs were predicted to be unqualified (a
false negative), they would still have a chance to be tested using the local ITA test once they
arrived on campus. The impact would be that their TA employment may be delayed until they
pass the local test. After weighing the pros and the cons of both kinds of errors in consultation
with the ITA program coordinators at these universities, it was decided that minimizing false
positives is more important than minimizing false negatives when using TOEFL Speaking scores
for ITA screening at these universities. Therefore, the optimal cut score on the TOEFL Speaking
test should be one that minimizes false positives while yielding a reasonably high true positive
rate. Raising the cut score could further minimize the rate of true nonpasses being classified as
passes, but at the expense of a higher false negative rate.
Method
Participating Universities
Four universities participated in this study: University of California, Los Angeles
(UCLA); University of North Carolina, Charlotte (UNCC); Drexel University (Drexel); and
University of Florida at Gainesville (UF). At all these universities, an in-house ITA-screening
test is used alone or in conjunction with the SPEAK test to screen ITAs.
Participants
At each institution, students who signed up for their local ITA tests were invited to
participate in this study. Participants were paid $20 each for their participation. The characteristics
of the participants at each university will be discussed in the Analyses and Results section.
7

Instruments
The TOEFL Speaking test. The TOEFL Speaking test was delivered through the web at
UCLA, UF, and UNCC. The web interface, created specifically for this study, was similar to that
for the operational TOEFL iBT Speaking test. The TOEFL Speaking test was administered
through the Interactive Voice Response (IVR) system at Drexel to maintain consistency because
the same delivery system was used in the previous year to collect a portion of the data. Two
alternate forms, Form A and Form B, were used in this study to prevent participants who
repeated the test before and after the ITA training class from receiving the same form or to
ensure test security during different mass test administrations. These two forms were not
equated; however, rigorous test development and rater training practices were followed to make
them as comparable as possible.3
Each form contained six speaking tasks. The first two were independent tasks that asked
the examinees to speak about familiar topics. The remaining four tasks were integrated tasks that
required more than one skill when responding. Tasks 3 and 4 integrated speaking with listening
and reading. One task involved a campus-based situation, and the other involved an academic
topic. Tasks 5 and 6 integrated listening and speaking, using one campus-based task and one
academic task. The listening and reading materials were short. When the test was delivered
through the web, all the instructions and reading materials were presented on the computer.
Students could hear the listening materials as well as the instructions through their earphones.
When the test was delivered through the IVR system, examinees dialed in via the system to take
the test. They were provided with a printed paper booklet from a designated website. Students
could take notes and use them when responding to the speaking tasks.
For each of the six questions, examinees were given a short time to prepare a response.
The test was approximately 20 minutes long. The response time allowed for each question
ranged from 45 to 60 seconds.
All the tests were double-scored holistically by trained raters at ETS, except for those
given at Drexel, which were single scored. Each rater could rate no more than two responses
from an examinee. The raw scores averaged across raters were summed across six tasks and
converted to scaled scores of 0 to 30.
8

Procedure
Potential ITAs were recruited at each university to take both the TOEFL Speaking test
and their local ITA tests. The two tests were administered within two weeks of each other. Table
1 summarizes the data collected at each university. More detailed information for each university
is provided in the Analysis and Results section.
Table 1
Data Collected at Each Participating University
University TOEFL Speaking
In-house ITA test
SPEAK Instructor recommendations
UCLA X X UNCC X X Drexel X X X X UF X X X
Note. ITA = international teaching assistants; UCLA = University of California, Los Angeles;
UNCC = University of North Carolina, Charlotte; UF = University of Florida at Gainesville.
Analytic Methods
The relationships between the TOEFL Speaking test and local ITA-screening measures
were investigated through correlational analyses using the entire sample of examinees who took
both tests at each university. The disattenuated correlations among the analytic scores of the in-
house ITA tests (i.e., scores on the different components of speaking ability such as
pronunciation and grammar) were taken from the outputs of multivariate generalizability (G)
studies on the analytic scores. All others were computed by dividing the observed correlation by
the square root of the product of the reliability estimates of the two measures. The reliability of
the measures was estimated with univariate or multivariate G analyses (Brennan, 2001a).
Multivariate G studies were used for composite scores that were averages or weighted averages
of multiple analytic scores. In cases where a G study was not feasible, Cronbach’s alpha was
used to estimate the internal consistency of a measure.
Binary logistic regression was used to build models to predict dichotomous outcomes,
and ordinal regression was used to predict three or more ordered outcomes. The optimal cut
score was derived for each institution through the ROC curve, which identifies a cutoff point on
9

the TOEFL Speaking test that keeps false positives low. When the sample size was 50 or larger,
it was split into a model-training sample and a cross-validation sample so that the classification
accuracy could be tested against an independent sample.
When the sample did not include both a group that met a particular performance standard
and another that did not (e.g., when it only contained those qualified for TA assignments), a
borderline group was identified whose performance just satisfied TA language requirements. The
central tendency (i.e., median) of the TOEFL Speaking scores of this group was examined to
determine the optimal cut score.
GENOVA (Crick & Brennan, 1983) and mGENOVA (Brennan, 2001b) were used to
perform the univariate and multivariate G analyses respectively. SPSS 13.0 (2002) was used for
the logistic regression analyses.
Analyses and Results
Because the data collected at each university were somewhat different, the analyses and
results are organized by university. For the sake of clarity, the local ITA tests and requirements
for ITAs are discussed in turn for each university, along with the participant and data collection
procedures. For each university, the observed and disattenuated correlations between TOEFL
Speaking scores and local ITA assessment scores are presented first, followed by the analyses
that established the cut scores on the TOEFL Speaking test. The reliabilities of TOEFL Speaking
scores and the local ITA test scores for all four universities are summarized in a table at the end
of this section.
Institution 1: University of California, Los Angeles
Local ITA assessments and requirements for ITAs. The Test of Oral Proficiency (TOP)
has recently replaced SPEAK at UCLA for screening ITAs (see www.oid.ucla.edu/top for more
information). TOP is a locally developed test that measures the oral English ability of
international students to conduct discussion sections, labs, and office hours and to interact in
English with undergraduate students throughout the course of normal TA duties. TOP consists of
three tasks:
1. Self-introduction (2 minutes). Test takers introduce themselves and are asked some
questions. This part of the exam is not scored and is intended for the test takers to
warm up for the test.
10
2. Short presentation (5 minutes). Test takers are given information from typical
classroom materials, such as a syllabus, guidelines for a term paper, class rules, or
similar information and present the information to the class (undergraduate students
act as a class) after ten minutes of preparation.
3. Prepared presentation (10 minutes). Test takers are expected to teach their class
about a basic topic in their field. The class asks questions during the presentation.
The short presentation and the prepared presentation tasks are each scored on four areas
of language ability: pronunciation (pron.), grammar/vocabulary (gram./voc.), rhetorical
organization (organ.), and question handling (quest. handle.; Appendix B). The total
pronunciation score is the sum of two raters’ scores across tasks 2 and 3, which ranges from 0-
16. The other analytic scores are computed in a similar way and are on the same scale.
Each TOP exam is double rated on the four areas. The composite TOP score is derived by
summing the four scores, with a weight of 1.5 assigned to pronunciation. Then it is scaled to a
range of 0 to10. A score of 7.1 or higher is necessary for a clear pass, which will allow students
to work as a TA with no restrictions on employment. A score of 6.4 to 7.0 is considered a
provisional pass, and students scoring in this range are required to take an ITA oral
communications course prior to or during their first quarter of TA work. A score lower than 6.4
does not to qualify for TA work.
The TOP test scores were shown to have a correlation of .67 with the ratings of ITAs’
readiness for classroom teaching by undergraduate students who acted as a class during the TOP
exams (UCLA Office of Instructional Development, 2005). In addition, in a survey of test takers’
reactions to the TOP test, their responses were overwhelmingly positive. Nearly all of the
respondents felt it was a good and realistic depiction of a TA situation. Some test takers who had
experience with both the SPEAK and TOP tests compared the two, expressing their satisfaction
with the new test for various reasons, mostly having to do with authenticity.
The cut scores for the TOP test were determined by the TOP exam coordinator and a
panel of ESL experts. They reviewed a whole range of the TOP test takers’ performance and
selected the cut scores based on the language demands of TA positions at UCLA.
Participants and procedure. Eighty-four international graduate students at UCLA took
both the TOP and TOEFL Speaking Form A or B between September 2004 and September 2005.
Thirteen of them took the TOEFL Speaking test at the beginning of the fall quarter and at the end
11

of the ITA-training course. Their second records were not used in the correlational and ordinal
regression analyses, which assumed independent sampling. Forty-two (50.0%) test takers were
classified as clear passes, 15 (17.9%) as provisional passes, and 27 (32.1%) as nonpasses based
on their TOP scores.
These participants were enrolled in graduate degree programs in applied sciences (31%),
medical/life sciences (22%), mathematical sciences (21%), humanities (15%), and social
sciences (11%). Most were in their first year of graduate study (73%), and they were primarily
speakers of Asian languages (71%), with 52% speaking Chinese and 14% Korean. The
descriptives of students’ TOEFL iBT speaking and TOP scores are shown in Table 2. Overall, a
wide range of proficiency levels was represented.
Table 2
Descriptives of TOEFL Speaking Scores and TOP Composite and Analytic Scores at
University of California, Los Angeles
Max. possible
score
Min. Max. M The mean as the percentage of the
max. possible score
SD
TOEFL Speaking 30 9 30 21.4 71.3% 4.9 TOP 10 4.5 10.0 7.2 72.0% 1.4 TOP pronunciation 16 4.0 16.0 10.2 63.8% 3.0 TOP gram./voc. 16 7.0 16.0 11.9 74.3% 2.6 TOP organ. 16 8.0 16.0 11.9 74.3% 2.2
76.3% TOP quest. handle 16 8.0 16.0 12.2 2.2
Note. N = 84. Pron = pronunciation, gram./voc. = grammar/vocabulary, organ. = rhetorical
organization, quest. handle = question handling.
Relationships between TOEFL Speaking scores and TOP scores. Table 3 demonstrates
correlations between TOEFL Speaking scores and TOP composite scores and analytic scores. The
observed correlations among the TOEFL Speaking scores and TOP composite and analytic scores
were moderately high. After correcting for score unreliability, the correlation between the TOEFL
Speaking and TOP composite scores increased from .78 to .84. The disattenuated correlations also
show that the TOEFL Speaking scores had strong correlations with the TOP analytic scores,
showing the strongest relationship with the TOP grammar and vocabulary scores (.86).
12

The TOP pronunciation, grammar and vocabulary, organization, and question handling
scores were interrelated, with the pronunciation and grammar and vocabulary scores most
strongly correlated. The relationship between the TOP organization and pronunciation scores
was the weakest.
Table 3
Observed and Disattenuated Correlations Between TOEFL Speaking Scores and TOP Scores
Test TOEFL Speaking
TOP TOP pron.
TOP gram./voc.
TOP TOP organ. quest. handle
TOEFL Speaking
1
TOP .78 1 .84
TOP pron. .75 .92 1 .81 .99
TOP gram./voc.
.75 .91 .78 1
.86 1.00 .90
.68 .85 .69 .76 1 TOP organ.
.80 .98 .75 .88 TOP quest. handle
.69 .88 .73 .77 .78 1
.82 1.000 .88 .90 .92 Note. The disattenuated correlations appear in boldface. N = 84. Pron = pronunciation, gram./voc. =
grammar/vocabulary, organ. = rhetorical organization, quest. handle = question handling.
Results of the ordinal regression analysis. Sixty-five cases (approximately 77%)
randomly selected from the whole sample were used in model building, and the remaining 19
cases were used in testing classification accuracy. Because three rather than two ordinal
outcomes were predicted, a large number of students were used in model training to yield a
stable model.
Thirty-three test takers (51%) were clear passes, 10 were provisional passes (15%), and
22 were nonpasses (34%). The proportion of provisional pass students was lower in comparison
to the other two groups (as it was in the combined sample). An ordinal regression model with the
logit link satisfied the assumption of parallel regression lines and also provided good
classification results. The null hypothesis, that TOEFL Speaking scores and TA assignments
were not related, was rejected, as shown in Table 4. The Wald test suggests that the TOEFL
13
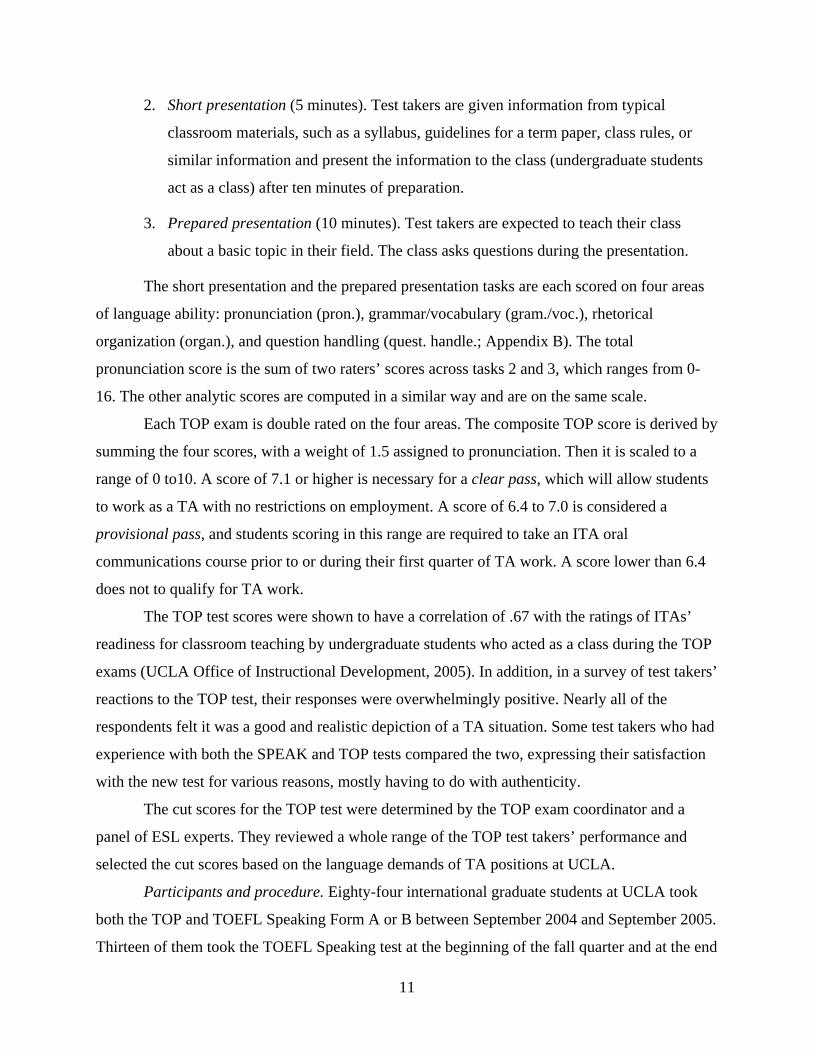
Speaking scores were a significant predictor of the TA assignment outcomes. A positive B
coefficient (.60) suggests that the likelihood is high that a student with a high TOEFL Speaking
score will be in a higher TA assignment category.
Table 4
Results of the Ordinal Regression Analysis on University of California, Los Angeles Data
Test Estimate S.E. Chi-square
Wald chi-square
Df Sig.
Overall model fitting
56.63 1 .000
Predictor TOEFL Speaking
.60 .12 25.07 1 .000
The Nagelkerke R-square was .67,4 indicating that a large proportion of the variance in
the TA assignment outcome categories could be predicted by the TOEFL Speaking scores.
The classification accuracy further demonstrates how the TOEFL Speaking scores
performed in classifying students into one of the three outcomes. In Table 5, diagonal cases were
correctly classified and off-diagonal cases were incorrectly classified. The model did a superb
job of correctly classifying the clear passes (97.0%), fairly well with nonpasses (81.8%), but not
as well with provisional passes (30.0%). This may be due to the fact that the model was trained
on much fewer cases in the provisional pass category. Further, these provisional pass students
were borderline students and may be more difficult to classify accurately.
Table 5
True Versus Predicted Outcome Categories at University of California, Los Angles
True TA assignment outcome
Percentage correct
Predicted TA assignment outcome Nonpass Provisional
pass Clear passes
Nonpasses 18 1 3 81.8% Provisional passes 5 3 2 30.0% Clear passes 1 0 32 97.0% Overall percentage 81.5%
Note. TA = teaching assistant.
14

Setting the cut scores. In the ROC curve for provisional passes (Figure 1), the area under
the curve was very high (.91), indicating that the probability of the TOEFL Speaking score of a
marginal or clear pass student exceeding that of a nonpass student was 91%. Table 6 contrasts
the true positive and false positive rates for different TOEFL Speaking score points for
provisional passes. When the cut score is set at 24, no false positives will occur, but the true
positive rate will stand at 53.5%. In other words, the model has to misclassify 46.5% of the
marginal or clear passes as nonpasses to correctly classify all nonpasses. If 23 is chosen as the
cut score, approximately 5 out of 100 nonpasses may be classified as provisional passes.
However, 11.6% (65.1%–53.5%) more provisional passes will be correctly classified. This cut
score would reduce the number of students to be tested locally using the TOP but increase the
number of students in ITA-training classes. A slightly lower cut score may be justified for two
reasons: (a) Many science departments who hire the most ITAs are in dire need of TAs and a
larger pool of eligible ITAs would help meet this need; and (b) ITA course instructors can offer
extra help in class to ameliorate the situation where nonpasses are assigned TA work with
concurrent English coursework.
Sens
itivi
ty
(Tru
e Po
sitiv
es)
1-Specificity (False Positives)
Figure 1. The ROC curve for predicting provisional passes.
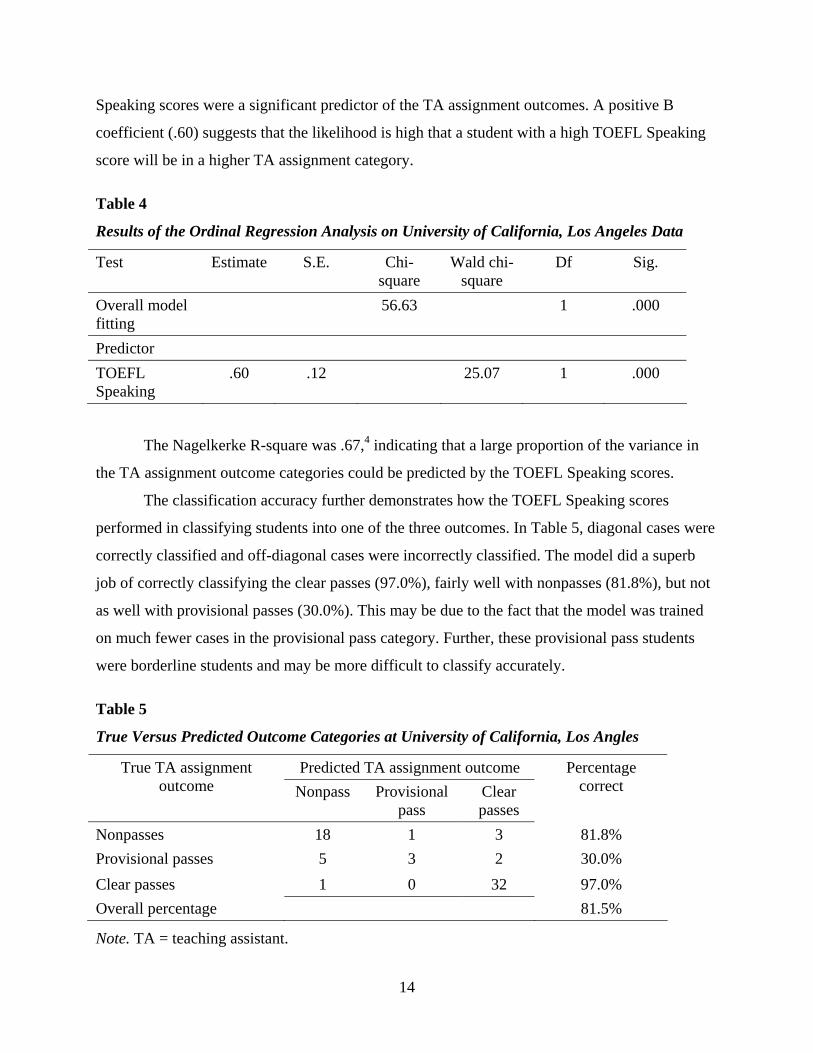
The area below the curve in Figure 1 was .96 when the TOEFL Speaking scores were
used to predict candidates who were clear passes. A cut score of 27 produces a false positive rate
of 0 (Table 7). If the cut score is lowered to 24, 3 out of 100 provisional passes may be falsely
classified as clear passes, but the number of students that need to be tested locally (the false
15

negatives) would be significantly reduced, from 63.6% (100%–36.4%) to 33.3% (100%–66.7%).
This would bring down the cost of local testing considerably. But given that there would not be
any opportunities to rectify the unfavorable situation (i.e., provisional passes classified as clear
passes) if it did occur, it would be preferable to stay with a cut score of 27 initially, validate the
score with new samples, and then modify the score as needed.
Table 6
True Positive (Sensitivity) Versus False Positive (Specificity) Rates at Different TOEFL
Speaking Cut Scores for Provisional Passes
Positive if greater than or equal to True positive False positive
8.0 1.000 1.000 11.0 1.000 .955 13.5 1.000 .864 14.5 .977 .773 16.0 .977 .591 17.5 .930 .500 18.5 .884 .227 19.5 .860 .182 21.0 .791 .136 22.5 .651 .045 23.5 .535 .000 25.0 .395 .000 26.5 .279 .000 27.5 .209 .000 28.5 .140 .000 29.5 .070 .000 31.0 .000 .000
Note. The smallest cutoff value is the minimum observed test value minus 1, and the largest
cutoff value is the maximum observed test value plus 1. All other cutoff values are the averages
of two consecutive ordered observed test values. An integer cutoff value such as 21 is possible
when the two consecutive test scores in the sample are 20 and 22. The cutoff values are rounded
off to integers in the discussion of cut scores in the text because integer scaled scores are
reported for the TOEFL iBT Speaking test.
16
Table 7
True Positive (Sensitivity) Versus False Positive (Specificity) Rates at Different TOEFL
Speaking Cut Scores for Clear Passes
Positive if greater True positive False positive than or equal to
21.0 .970 .156 22.5 .818 .063 23.5 .667 .031 25.0 .485 .031 26.5 .364 .000 27.5 .273 .000 28.5 .182 .000 29.5 .091 .000 31.0 .000 .000
Note. Not all possible cut points are displayed.
Cross-validation of the classification accuracy. Cut scores derived from the training
sample were validated using the independent sample. As shown in Tables 8 and 9, using 23 or 24
as the cut score for provisional passes and 27 for clear passes, the classification accuracy with
the independent sample was fairly similar. All nonpasses were correctly predicted; only one of
the provisional passes was incorrectly classified as a clear pass. However, some students were
incorrectly classified into the lower categories. This is acceptable given that the false nonpasses
can be tested again using the local test once ITAs arrive, and those who are false provisional
passes can gain exemptions from ITA coursework at the recommendation of their instructors.
The particular student who was a marginal pass but was predicted as a clear pass was
from India. This student’s TOP analytic scores were above average except for a pronunciation
score that was below the average. Since pronunciation scores are given a weight of 1.5 in the
computation of the TOP composite scores, this weakness in pronunciation was magnified in the
TOP final score (6.8). This Indian student scored 27 on the TOEFL Speaking test, probably due
to strengths in areas other than pronunciation, which resulted from years of using English.
This false positive case causes some concern. However, UCLA allows provisional pass
students to teach with concurrent English coursework. Given that ITAs receive language support
17

as necessary after they start to teach, it should be reasonable to keep the cut score of 23 for
provisional passes.
Table 8
Classification Rate on an Independent Sample With 27 on the TOEFL Speaking Test as the
Cut Score for Clear Passes and 24 for Provisional Passes
True TA assignment outcome
Predicted TA assignment outcome Percentage correct Nonpasses Provisional
passes Clear passes
Nonpasses 5 0 0 100.0% Provisional passes 0.0% 4 0 1 Clear passes 4 3 2 22.2% Overall percentage 36.8%
Note. TA = teaching assistantship.
Table 9
Classification Rate on an Independent Sample With 27 on the TOEFL Speaking Test as the
Cut Score for Clear Passes and 23 for Provisional Passes
True TA assignment outcome
Predicted TA assignment outcome Percentage correct Nonpasses Provisional
passes Clear passes
Nonpasses 5 0 0 100.0% Provisional passes 4 0 1 0.0% Clear passes 3 4 2 22.2% Overall percentage 36.8%
Institution 2: University of North Carolina, Charlotte
Local ITA assessments and requirements for ITAs. UNCC uses presentation tests to select
ITAs. At the beginning of the fall semester, a noncontent-based presentation test (NCPT) is
given. This test consists of videotaped presentations in which the students are asked to complete
the following tasks:
1. Biographical warm-up (2-3 minutes). ITA candidates answer questions about
themselves.
18

2. Describing a course syllabus (5 minutes). Candidates describe a syllabus from an
introductory level course in their field.
3. Fielding questions (5 minutes). Candidates answer questions arising from the
presentation.
Two raters are present at the test and determine whether candidates’ communication
skills are strong enough for classroom interactions, based on the rating instrument by Smith,
Meyers, and Burkhalter (1992; Appendix B). Each test is rated on teaching (on a scale of 0-27),
presentational language (on a scale of 0-18), interactive language (on a scale of 0-15), and
overall impression (on a scale of 0-15). Scores on these components are summed and then
multiplied by four. Students must achieve a minimum score of 230 out of 300 on the test in order
to teach. Students scoring below 230 may not teach and must attend a semester-long ITA
communications course. At the end of the course, they are assessed again using a content-based
presentation test (CPT). It is similar to the NCPT except that students are required to present a
concept in their own field and field questions related to the presentation. The CPT is rated using
the same scale as the NCPT. Students who have not taken the NCPT and who are not in the ITA
course can also take the CPT to qualify as TAs by achieving a score of 230 or above on the test.
At UNCC, the NCPT and CPT tests are used interchangeably for ITA screening.
To set the cut score for the test, panel members, consisting of experienced ESL
instructors, reviewed a wide range of performances on the test and made a cut score
recommendation that reflects the minimum speaking proficiency required to fulfill teaching
duties at this university.
Participants and procedure. Thirty students took TOEFL Speaking Form A and NCPT at
the beginning of the fall semester in 2004, and 23 took TOEFL Speaking Form B and CPT at the
end of the fall semester, for a combined sample of 53 students. Some students who took Form B
did not enroll in the ITA course. The majority (88%) were speakers of Asian languages, with
53% speaking Indian and 31% Chinese. This breakdown is characteristic of the ITA population
at UNCC.
Students studied applied (61%), mathematical (12%), medical/life (10%), and social
(18%) sciences. Nearly all students were in their first or second year of graduate work (94%).
Almost half (47%) had been in the United States for less than a year and 39% for one-to-three
19

years. Table 10 shows that the participants were varied in their proficiency levels, as indicated by
the range (max. = 29; min. = 8) and spread (SD = 5.3) of their TOEFL Speaking test scores.
Table 10
Descriptives of TOEFL Speaking Scores and Presentation Test Scores for the Whole Sample
at University of North Carolina, Charlotte
N Test Max. Min. Max. M The mean as a percentage of
the max. possible score
SD possible
score
TOEFL Speaking 53 30 8 29 20.9 69.7% 5.3 Presentation test 53 300 189 293 246.5 82.2% 20.9 Teaching 53 27 19.0 27.0 23.9 88.5% 1.8 Presentation language
53 18 11.0 17.8 14.2 78.9% 1.4
Interactive language 53 15 9.3 14.8 11.9 79.3% 1.0 Overall impression 53 15 8.0 14.5 11.6 77.3% 1.5
Relationships between TOEFL Speaking scores and presentation test scores. As
expected, the teaching scores of the presentation tests had the lowest correlations with the
TOEFL Speaking scores, and the presentation test language scores were most strongly correlated
with the TOEFL Speaking scores (Table 11). This pattern was consistent for both the NCPT and
CPT. The TOEFL Speaking scores had stronger relationships with the total and analytic scores
of the NCPT than those of the CPT. This was reasonable given that when students present a
concept in a specialized discipline, their background knowledge and teaching skills may have a
larger impact on their overall level of communication. The CPT was more likely to engage
nonlanguage skills, which may have weakened its relationship with the TOEFL Speaking scores.
The overall impression scores had almost perfect correlation with the total presentation
test scores. The presentational language and interactive language scores were highly correlated,
and they also had strong correlations with the overall impression scores. Teaching scores had the
lowest correlations with presentational and interactive language scores but had a moderately
strong correlation with the overall impression scores. It is interesting to note that for the CPT the
teaching scores had a much weaker relationship with the overall impression scores than was the
20

case for the NCPT. Presentational language and interactive language scores for the CPT were
also less strongly related than those for the NCPT.
Table 11
Observed and Disattenuated Correlations Between TOEFL Speaking Scores and University of
North Carolina, Charlotte Presentation Test Composite and Analytic Scores
Test TOEFL Speaking
Presentation test
Teaching Presentation language
Interactive language
Overall impression
TOEFL Speaking
1
Presentation test
.78(.53) 1
.93(.58) Teaching .69(.35) .88(.79) 1
.81(.41) .99(.91) Presentation. language
.73(.62) .90(.93) .61(.56) 1
.91(.67) 1.00(.99) .72(.63) Interactive language
.71(.52) .88(.91) .58(.53) .96(.96) 1
.91(.58) 1.00(1.00) .73(.64) 1.00(1.00) Overall impression
.74(.44) .97(.95) .83(.68) .86(.88) .84(.88) 1
.94(.53) 1.00(1.00) .92(.79) .91(1.00) .89(1.00)
Note. The numbers not in parentheses are correlations between TOEFL Speaking scores and
composite and analytic NCPT scores. The numbers in parentheses are correlations between
TOEFL Speaking scores and composite and analytic CPT scores. The disattenuated correlations
appear in boldface.
Binary logistic regression analysis. Thirty students from primarily Indian (48%) and
Chinese (35%) native-language backgrounds completed the TOEFL Speaking test Form A and
the NCPT in August and September, 2004. Students in this sample were enrolled in degree
programs in various disciplines. Most were in their first year of study (74%) at the time of
participation and had lived in the United States for 3 years or less (90%). This sample was fairly
similar to the combined sample (N = 53). The descriptives of this sample are shown in Table 12.
A binary logistic regression model was fitted on the 30 students. Since this is a simple
model with one predictor and two outcome categories, 30 cases are adequate (Peduzzi, Concato,
21
Kemper, Holford, & Feinstein; 1996). The accuracy of the predictions was then cross-validated
on the 23 students who took the TOEFL Speaking test Form B, and an interchangeable ITA
assessment, the CPT.
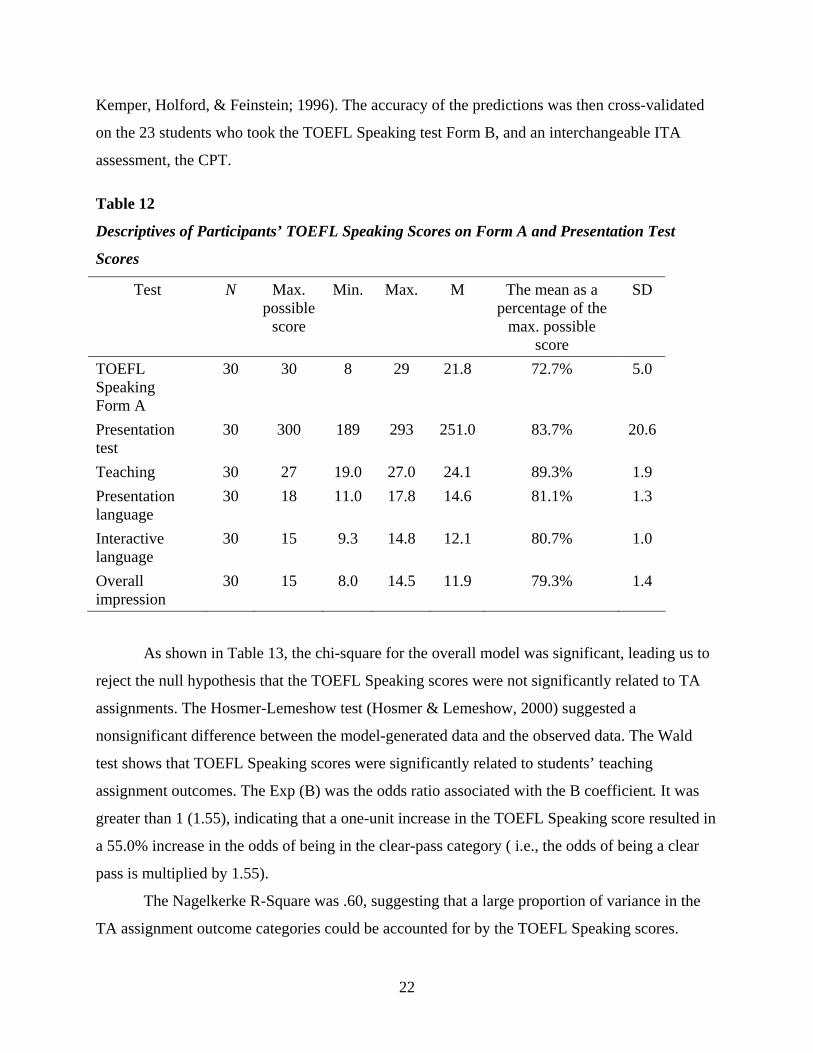
Table 12
Descriptives of Participants’ TOEFL Speaking Scores on Form A and Presentation Test
Scores
N Test Max. possible
score
Min. Max. M The mean as a percentage of the
max. possible score
SD
TOEFL Speaking Form A
30 30 8 29 21.8 72.7% 5.0
Presentation test
30 300 189 293 251.0 83.7% 20.6
Teaching 30 27 19.0 27.0 24.1 89.3% 1.9 Presentation language
30 18 11.0 17.8 14.6 81.1% 1.3
Interactive language
30 15 9.3 14.8 12.1 80.7% 1.0
Overall impression
30 15 8.0 14.5 11.9 79.3% 1.4
As shown in Table 13, the chi-square for the overall model was significant, leading us to
reject the null hypothesis that the TOEFL Speaking scores were not significantly related to TA
assignments. The Hosmer-Lemeshow test (Hosmer & Lemeshow, 2000) suggested a
nonsignificant difference between the model-generated data and the observed data. The Wald
test shows that TOEFL Speaking scores were significantly related to students’ teaching
assignment outcomes. The Exp (B) was the odds ratio associated with the B coefficient. It was
greater than 1 (1.55), indicating that a one-unit increase in the TOEFL Speaking score resulted in
a 55.0% increase in the odds of being in the clear-pass category ( i.e., the odds of being a clear
pass is multiplied by 1.55).
The Nagelkerke R-Square was .60, suggesting that a large proportion of variance in the
TA assignment outcome categories could be accounted for by the TOEFL Speaking scores.
22

Table 13
Results of the Logistic Regression Analysis on the University of North Caroline, Charlotte Data
Test B S.E. Chi-square
Wald chi-square
Df Sig. Exp (B)
Overall model evaluation
10.12 1 .001
Hosmer- Lemeshow test
4.03 6 .673
Predictor TOEFL Speaking
.44 .20 4.87 1 .027 1.55
Constant -5.84 3.41 2.94 1 .086 .003
All the students who were qualified ITAs were predicted correctly based on their TOEFL
Speaking scores (Table 14). However, one of the three nonpasses was predicted as a clear pass.
The overall correct classification rate was 96.7%, which is very high.
Table 14
True Versus Predicted Teaching Assistantship Assignment Categories at University of North
Carolina, Charlotte
True TA assignment outcome
Predicted TA assignment outcome
Nonpass Clear pass Percentage correct
Nonpass 2 1 66.7 Clear pass 0 27 100.0 Overall percentage 96.7
Note. TA = teaching assistantship.
Setting the cut score. The area under the ROC curve for clear passes was .92, which is
very high. Given the error rate in nonpasses, if the TOEFL Speaking cut score were set at 21, the
false positive rate would be reduced to 0 (Table 15). In the meantime, 70.4% of the clear passes
would be predicted correctly. This corresponds to a false negative rate of 29.6%.
Cross-validation of the classification accuracy. Table 16 shows the classification
accuracy on the independent sample using 21 on the TOEFL Speaking test as the cut score.
23

Table 15
True Positive and False Positive Rates at Different TOEFL Speaking Cut Scores for Clear
Passes at University of North Carolina, Charlotte
Positive if greater than or equal to
True positive False positive
18.5 .889 .333 19.5 .815 .333 21.0 .704 .000 22.5 .593 .000 23.5 .407 .000
Note. Not all possible cut points are displayed.
Table 16
Classification Rate Based on an Independent Sample Using 21 on the TOEFL Speaking Test
as the Cut Score
True TA assignment
outcome
Predicted TA assignment outcome
Nonpass Clear pass Percentage correct
Nonpass 5 1 83.3 Clear pass 8 9 52.9 Overall percentage 60.9
Note. TA = teaching assistantship.
Overall, when the cut score on the TOEFL Speaking test was set at 21, the classification
accuracy deteriorated with the independent sample, especially in predicting the clear passes
(from 70.4% to 52.9%). This suggests that 47.1% of the clear passes may be classified as
nonpasses and required to take the local ITA test. This is acceptable given that they will have a
chance to be re-tested using the local presentation test.
The accuracy in predicting the nonpasses was still fairly high (83.3%). Only one out of
the six nonpasses was classified as a clear pass (i.e., a false positive) based on a TOEFL
Speaking score. This student was from India and received a 24 on the TOEFL Speaking test but
only a 210 on the CPT in January 2005. Further consultation with the ITA coordinator at UNCC
24

revealed that a major problem with this student’s spoken English was that he tended to speak
very fast when nervous, compressing syllables and making his speech less intelligible. After
completing an oral communication course, this student learned to slow down when speaking and
scored 258 on the CPT in May 2005. His problem seemed to be a communication strategy
problem rather than a persistent language issue. This may explain his drastic improvement on the
CPT test after taking the course. This improvement also highlights the importance of ITA-
training programs.
Given the cross-validation results, it may be preferable to raise the cut score to 24 to
eliminate all false positives, monitor the impact of this cut score, and modify it later if necessary.
Institution 3: Drexel University
Local ITA assessments and requirements for international teaching assistants. Drexel
offers a four-week training program to all prospective ITAs during the summer term to prepare
them for their teaching responsibilities. The course covers three components: oral English skills,
teaching skills, and American campus culture. At the end of the program, participants are given
the Drexel Interactive Performance test (DIP).
In this test, ITA candidates are required to make 10-minute presentations of a topic or
concept from their respective fields. Their peers (classmates) and native English-speaking
undergraduates ask questions from the audience. The rating is conducted independently by two
raters who watch the presentations on videotape. Each presentation is rated on six components
on a 1-5 point scale: listening comprehension (listening), interactive language skills (int. lang.),
discourse language skills (discourse), vocabulary (voc.), teacher presence and nonverbal
communication (teach.), and overall comprehensibility (comprehensibility). The individual
scores are then averaged across raters and components to produce an overall score ranging from
1 to 5 (see Appendix D).
In final ITA evaluations and recommendations, the ITA class instructor considers
multiple sources of information: candidates’ DIP scores, feedback on their scoring sheets, and
their performance in ITA class. The instructor assigns candidates to one of three categories based
on an overall assessment of their communication ability in instructional settings: no instructional
contact (NC), restricted assignments (RA), or nonrestricted (all) assignments (AA). Those in the
NC category are not allowed to teach; those in the RA category are allowed to have small-group
instructional contact or labs; and those classified as AA can have unrestricted assignments,
25

including those requiring large-group instructional contact. These recommendations serve as the
final decisions for different kinds of teaching assignments.
In addition, the SPEAK test is usually given twice a week between the first and tenth
weeks of the term to prospective ITAs. During the SPEAK test, examinees, prompted by
prerecorded questions, speak on topics of general interest such as food, entertainment, and
traveling, as well as on topics of general interest such as education, culture, and environment.
The test has 12 tasks, each of which intends to elicit a particular language function, such as
giving and supporting an opinion, comparing and contrasting, persuading, apologizing,
complaining, and describing information presented graphically. In some of the tasks, examinees
are expected to role-play with a specific audience and situation. Raters consider the combined
impact of four language competencies (linguistic, functional, sociolinguistic, and discourse) on
overall communication effectiveness and assign a holistic score for each task on a scale of 20 to
60, with 10-point increments. Then the scores on the 12 tasks are averaged and reported on a
scale of 20 to 60, using 5-point increments.
Candidates who score 55 or higher on the SPEAK test can take on nonrestricted teaching
assignments (AA). A follow-up course on oral communication skills is available free of charge
to graduate students throughout the year to improve their spoken-language proficiency and to
help them prepare for the SPEAK. A special support group for teaching assistants in the
classroom is provided weekly by the course instructor as well.
Participants and procedure.5 In total, 45 ITAs were administered the SPEAK, the
TOEFL Speaking test, and the DIP at the end of the summer ITA course over the course of 2
years. Twenty-two students completed the TOEFL Speaking test Form A in 2003 and 23
completed the TOEFL Speaking test Form B in 2004, along with the SPEAK and DIP. A
subscore of the DIP, DIP – Teach, was computed, which was the average of all the component
scores but the Teach. score.
The participants were 58% speakers of Chinese and 33% speakers of other Asian
languages and were enrolled in degree programs in the applied (51%), social (31%), and
medical/life (18%) sciences. A wide range of proficiency levels was represented by this sample
(Table 17).
26

Table 17
Descriptives of TOEFL Speaking, SPEAK, DIP Composite, and DIP Analytic Scores for the
Whole Sample at Drexel
Test Max. possible
score
Min. Max. M The mean as a percentage of the
max. possible score
SD
TOEFL Speaking 30 10 30 21.8 72.7% 5.3
SPEAK 60 38.3 60.0 51.7 86.2% 5.9
DIP 5 2.5 4.9 3.9 78.0% .7
DIP – Teach. 5 2.7 4.9 3.9 78.0% .7
Listening 5 3.5 5.0 4.3 86.0% .6
Int. lang. 5 2.0 5.0 3.8 76.0% .8
Dis. 5 2.5 5.0 4.0 80.0% .8
Voc. 5 2.0 5.0 4.0 80.0% .8
Teach. 5 2.0 5.0 3.7 74.0% .9
Comp 5 1.5 4.5 3.4 68.0% .7 Note. N = 45. Int. lang. = interactive language, Dis. = discourse, Voc. = vocabulary, Teach. =
teacher presence & nonverbal, Comp. = comprehensibility.
Table 18 demonstrates that for this sample, students’ TOEFL Speaking scores had a
moderately strong positive correlation with their DIP scores (.70) and a slightly higher
correlation with their DIP – Teach. scores (.73), which was reasonable given that DIP – Teach.
was a cleaner measure of students’ language skills. The TOEFL Speaking scores had higher
correlations with the DIP discourse and vocabulary scores than with other DIP analytic scores.
The disattenuated correlation between teacher presence and nonverbal communication
scores and interactive language scores was almost perfect, suggesting that they were closely related
constructs conceptually, that the raters were having trouble distinguishing between them, or that for
this student sample they were highly correlated, although they may be conceptually distinct.
27

Table 18
Observed and Disattenuated Correlations Among the TOEFL Speaking, SPEAK, DIP
Composite, and DIP Analytic Scores
Test TOEFL Speaking
SPEAK DIP DIP – Teach.
Listening Int. Dis. Voc. Teach. lang.
TOEFL Speaking
1
SPEAK .89 1
DIP .70 .73 1
DIP – Teach.
.73 .74 .99 1
Listening .65 .64 .78 .79 1
Int. lang. .63 .60 .91 .90 .68 1 .74
Dis. .69 .75 .91 .92 .72 .74 1 .80 .89
Voc. .68 .71 .82 .86 .69 .64 .84 1 .81 .67 .90
Teach. .52 .54 .89 .81 .62 .83 .73 .54 1 .82 1.00 .97 .60
Comp. .45 .42 .76 .74 .39 .72 .56 .47 .73 .58 .91 .66 .53 .82
Note. N = 45. The disattenuated correlations appear in boldface. Disattenuated correlations
between SPEAK, TOEFL Speaking scores, and other scores were not computed because item-
level and rater-level data were not available for the SPEAK and TOEFL Speaking tests at this
university. Int. lang. = interactive language, Dis. = discourse, Voc. = vocabulary, Teach. =
teacher presence & nonverbal, Comp. = comprehensibility.
The SPEAK scores had a moderately strong relationship with the DIP – Teach. scores
(.74) and had a slightly weaker relationship with DIP scores (.73). The correlation between the
TOEFL Speaking and the SPEAK scores was high (.89). This was reasonable given that both are
semi-direct speaking tests that involve no face-to-face interaction. Another factor that may have
28

contributed to their strong relationship is that the sample was very homogenous. All of the
participants were academically bound and in business, engineering, and science. With a more
diverse sample (e.g., a sample that included both academically bound students and ESL/EFL
speakers with little exposure to academic studies), a weaker relationship between SPEAK and
TOEFL Speaking scores might be observed.
Binary logistic regression analysis. Based on ITA course instructor recommendations, 26
students (57.8%) were classified AA and 19 (42.2%) were classified RA. None was classified
NC. Therefore, only two outcome categories were predicted. The data from both years were
combined to obtain an adequate sample size for the binary logistic regression analysis. Table 19
shows the results.
Table 19
Results of the Logistic Regression Analysis on Drexel Data
Test B S.E. Chi-square
Wald chi-
square
Df Sig. Exp(B)
Overall model evaluation
39.47 1 .000
Hosmer and Lemeshow test
2.17 7 .950
Predictor TOEFL Speaking
.78 .24 10.23 1 .001 2.18
Constant -17.04 5.15 10.96 1 .001 .000
The overall model with the TOEFL Speaking scores as the predictor was a significant
improvement over the null model with the intercept only (no predictors), as shown by the
significant chi-square statistic. In addition, the Hosmer-Lemeshow test was not significant,
suggesting no significant difference between the model-generated data and the observed data.
The Wald test shows that the TOEFL Speaking scores were a significant predictor of students’
teaching assignments. The Nagelkerke R-Square was .79, which was very high.
29
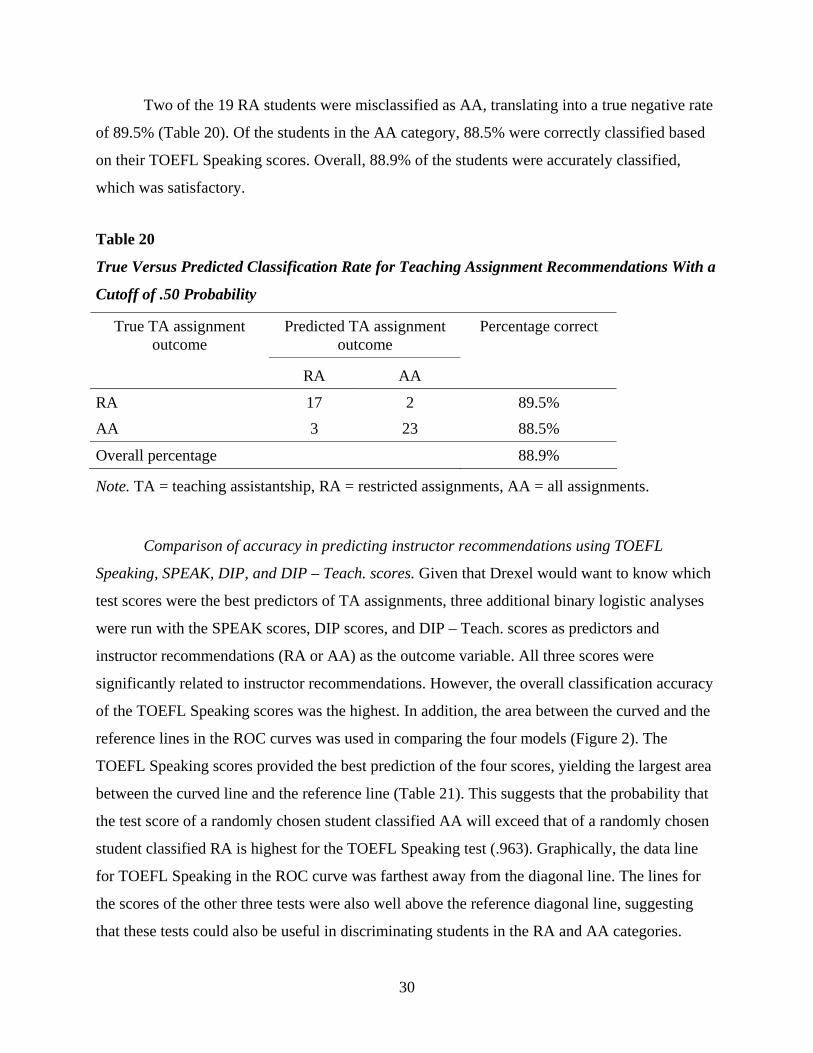
Two of the 19 RA students were misclassified as AA, translating into a true negative rate
of 89.5% (Table 20). Of the students in the AA category, 88.5% were correctly classified based
on their TOEFL Speaking scores. Overall, 88.9% of the students were accurately classified,
which was satisfactory.
Table 20
True Versus Predicted Classification Rate for Teaching Assignment Recommendations With a
Cutoff of .50 Probability
Predicted TA assignment outcome
True TA assignment outcome
RA
Percentage correct
AA
RA 17 2 89.5% AA 3 23 88.5%
Overall percentage 88.9%
Note. TA = teaching assistantship, RA = restricted assignments, AA = all assignments.
Comparison of accuracy in predicting instructor recommendations using TOEFL
Speaking, SPEAK, DIP, and DIP – Teach. scores. Given that Drexel would want to know which
test scores were the best predictors of TA assignments, three additional binary logistic analyses
were run with the SPEAK scores, DIP scores, and DIP – Teach. scores as predictors and
instructor recommendations (RA or AA) as the outcome variable. All three scores were
significantly related to instructor recommendations. However, the overall classification accuracy
of the TOEFL Speaking scores was the highest. In addition, the area between the curved and the
reference lines in the ROC curves was used in comparing the four models (Figure 2). The
TOEFL Speaking scores provided the best prediction of the four scores, yielding the largest area
between the curved line and the reference line (Table 21). This suggests that the probability that
the test score of a randomly chosen student classified AA will exceed that of a randomly chosen
student classified RA is highest for the TOEFL Speaking test (.963). Graphically, the data line
for TOEFL Speaking in the ROC curve was farthest away from the diagonal line. The lines for
the scores of the other three tests were also well above the reference diagonal line, suggesting
that these tests could also be useful in discriminating students in the RA and AA categories.
30

Table 21
Comparison of the Areas Under the ROC Curve With TOEFL Speaking, DIP, DIP - Teach.,
and SPEAK Scores as Predictors
Asymptotic 95% confidence interval
Test variable(s) Area Std. error Asymptotic sig.
Lower Upper bound bound
TOEFL Speaking .963 .024 .000 .916 1.009 DIP .878 .059 .000 .762 .993 DIP – Teach. .891 .054 .000 .785 .997 SPEAK .925 .037 .000 .852 .998
Source of the Curve
— TOEFL Speaking ––– DIP – – DIP-Teach - - - SPEAK
Sens
itivi
ty
…… Reference Line
1 – Specificity
Figure 2. ROC curves with TOEFL Speaking, SPEAK, DIP, and DIP – Teach. Scores as
predictors.
A further examination of the true positives versus false positives (Table 22) at different
TOEFL Speaking score cut points indicates that when the cut score on TOEFL Speaking is set at
23, the proportion of false positives is expected to be 0. This corresponds to a 76.9% true
positive rate, meaning that 76.9% of the students in AA will be predicted as such based on their
TOEFL Speaking scores and that 23.1% of them will be falsely predicted as eligible for RA only.
31
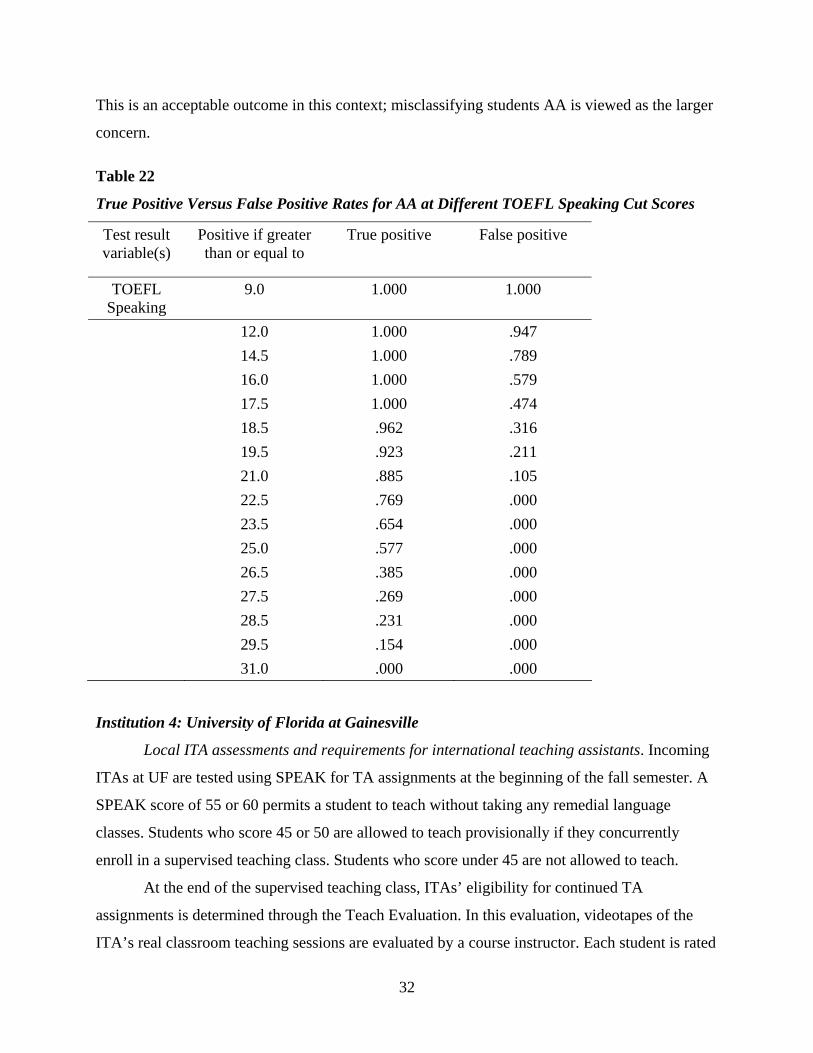
This is an acceptable outcome in this context; misclassifying students AA is viewed as the larger
concern.
Table 22
True Positive Versus False Positive Rates for AA at Different TOEFL Speaking Cut Scores
Test result variable(s)
Positive if greater than or equal to
True positive False positive
TOEFL Speaking
9.0 1.000 1.000
12.0 1.000 .947 14.5 1.000 .789 16.0 1.000 .579 17.5 1.000 .474 18.5 .962 .316 19.5 .923 .211 21.0 .885 .105 22.5 .769 .000 23.5 .654 .000 25.0 .577 .000 26.5 .385 .000 27.5 .269 .000 28.5 .231 .000 29.5 .154 .000 31.0 .000 .000
Institution 4: University of Florida at Gainesville
Local ITA assessments and requirements for international teaching assistants. Incoming
ITAs at UF are tested using SPEAK for TA assignments at the beginning of the fall semester. A
SPEAK score of 55 or 60 permits a student to teach without taking any remedial language
classes. Students who score 45 or 50 are allowed to teach provisionally if they concurrently
enroll in a supervised teaching class. Students who score under 45 are not allowed to teach.
At the end of the supervised teaching class, ITAs’ eligibility for continued TA
assignments is determined through the Teach Evaluation. In this evaluation, videotapes of the
ITA’s real classroom teaching sessions are evaluated by a course instructor. Each student is rated
32

by only one instructor. Students are rated on overall language comprehensibility (language, on a
scale of 0-21), listening/question handling (listening/quest. handle., on a scale of 0-6), lecturing
ability (lecturing, on a scale of 0-6), and cultural/teaching ability (cultural/teaching, on a scale of
0-15; Appendix D). This rating scale was adapted from the ITA rating instrument in Smith et al.
(1992). A minimum overall score of 38 out of 48 is required for an ITA to continue to teach
under normal departmental supervision. This score was determined by ESL instructors in the
program who reviewed videotapes of the students’ classroom teaching sessions.
Participants and procedure. Forty-one students took SPEAK and the TOEFL Speaking
test Form A in August 2004 prior to the beginning of the fall semester at UF. Twenty-seven
students who were placed in the supervised teaching class took the TOEFL Speaking test Form B
and the Teach Evaluation at the end of the class. Sixteen of them had also taken the TOEFL
Speaking test Form A. All 27 students passed the Teach Evaluation with a score of 38 or above.
The 41 students who completed the TOEFL Speaking test Form A and SPEAK were
primarily native speakers of Asian languages (63%, with 42% speaking Chinese), followed by
speakers of European languages (25%). They were enrolled in the medical/life sciences (37%),
applied sciences (29%), humanities (12%), mathematical sciences (12%), and social sciences
(5%). Most students were in their first or second year of study (85%). Around half had been in
the United States for less than a year and one-third for 1–3 years.
The 27 students who completed the TOEFL Speaking test Form B and the Teach
Evaluation were also predominantly native speakers of Asian languages. Most were in their first
year of graduate study (61%) and had lived in the United States for 2 years or less (86%). Tables
23 and 24 present the descriptives of the TOEFL Speaking, SPEAK, and Teach Evaluation
composite and analytic scores for these two samples.
Table 23
Descriptives of TOEFL Speaking Scores on Form A and SPEAK Scores
N Test Max. possible
score
Min. Max. M The mean as a percentage of the
max. possible score
SD
TOEFL Speaking Form A
41 30 11 27 20.5 68.3% 3.3
SPEAK 41 60 35 60 44.6 74.3% 5.9
33

Table 24
Descriptives of TOEFL Speaking Scores on Form B and Teach Evaluation Scores
Max possible
score
Min. Max. M The mean as a percentage of the
max. possible score
SD
TOEFL Speaking Form B
30 18 28 21.4 71.3% 2.7
Teach Evaluation 48 39.0 47.0 43.2 90.0% 2.6 Language 21 15.0 20.5 18.2 86.7% 1.6 Listening/ quest. handle.
6 4.0 6.0 5.3 88.3% 0.7
Lecturing 6 4.5 6.0 5.4 90.0% 0.5 Cultural/ 15 12.0 15.0 14.2 94.7% 0.9 teaching Note. N = 27. Quest. handle = question handling.
Relationships among the TOEFL Speaking, SPEAK, and Teach Evaluation scores. Table
25 demonstrates that the TOEFL Speaking scores had a moderately high correlation with the
SPEAK scores. The TOEFL Speaking scores were moderately related to the Teach Evaluation
scores and had a slightly stronger relationship with the Teach Evaluation language scores.
However, the TOEFL Speaking scores had very weak relationships with the other Teach
Evaluation analytic scores. It is worth noting that the Teach Evaluation language scores also had
very weak relationships with the listening/question handling and lecturing scores and almost no
relationship with the cultural /teaching ability scores. This suggests that these three components
of the Teach Evaluation test may be measuring constructs other than language skills. The
Cronbach's alpha for the four components of the Teach Evaluation test was only .499, suggesting
that the four component scores may not be sufficiently interrelated to justify their combination in
an overall Teach Evaluation score. If the language score were removed from the total Teach
Evaluation score, the alpha would increase to .628. Therefore, it may be more appropriate to
combine the three nonlanguage scores into a composite nonlanguage score reported with a
separate language score. Then cut scores could be established separately for the language and the
nonlanguage components.
34

Table 25
Observed and Disattenuated Correlations Among TOEFL Speaking, SPEAK, and Teach
Evaluation Scores
Test TOEFL Speaking
SPEAK Teach Language Listening Lecturing Cultural/ /quest. handle.
teaching
TOEFL Speaking
1
.74 1 SPEAK .91
Teach Evaluation
.44 - 1
.72
.48 - .77 1 Language .56
Listening/ .11 - .62 .28 1 .13 quest. handle.
.21 - .70 .32 .51 1 Lecturing .24
Cultural/ .14 - .59 .10 .26 .53 1 .17 teaching
Note. The disattenuated correlations appear in boldface. Quest. handle = question handling.
A few factors need to be considered when interpreting these observed and disattenuated
correlations. First, the correlation between the TOEFL Speaking and SPEAK scores was based on
the sample of 41 students with more varied proficiency levels. Correlations between the TOEFL
Speaking and Teach Evaluation composite and analytic scores, on the other hand, were based on a
sample of more limited range. This is because only those who score 50 or lower on SPEAK are
required to take Teach Evaluation, and all the students who participated in this study passed Teach
Evaluation. The correlation between the TOEFL Speaking and Teach Evaluation scores would
have been higher if a sample with a wider range of proficiency levels had been used.
35

Second, the observed correlations among the Teach Evaluation analytic scores could not
be corrected for score unreliability and range restriction.6 The reliability of the Teach Evaluation
analytic scores could not be estimated because the test was single-rated and did not use multiple
tasks. In addition, the standard deviation of the Teach Evaluation scores of a group with
unrestricted range was not available since only those who scored 45 and 50 on SPEAK were
required to sit for the Teach Evaluation. Disattenuated correlations between the TOEFL
Speaking scores and Teach Evaluation analytic scores were underestimated because the
reliability estimates of the latter were assumed to be 1, but may actually be lower, and could not
be corrected for range restriction. The disattenuated correlation between the TOEFL Speaking
scores and Teach Evaluation composite scores was underestimated as well, because only the
internal consistency of the Teach Evaluation composite was used in computing the disattenuated
correlation. If error due to variation in rater judgments in the Teach Evaluation test were
accounted for, the reliability could well have been lower, thus increasing the disattenuated
correlation.
Ordinal logistic regression analysis. Of the 41 students, three were clear passes (7%), 22
were provisional passes (54%), and 16 were nonpasses (39%) based on their SPEAK scores. An
ordinal regression with a negative log-log link function was fitted on the data since the lower
categories were more probable. The parallel regression line assumption was satisfied.
The significant overall model-fitting test supported the adequacy of the model. The Wald
test also shows that the TOEFL Speaking scores were a strong predictor of the TA assignment
outcomes (Table 26).
The Nagelkerke R-Square was .50, indicating that a fairly large proportion of the
variance in the dependent variable was explained by the TOEFL Speaking scores.
The overall classification accuracy rate was 71.4% (Table 27). Of the nonpasses, 75.0%
were predicted correctly based on their TOEFL Speaking scores. The prediction of provisional
passes was better, with 81.8% of them correctly classified by their TOEFL Speaking scores. All
three clear passes were predicted as provisional passes. Overall, only the four nonpasses
classified as provisional passes were classified in higher outcome categories, suggesting that the
false-positive rate was very low.
36

Table 26
Results of Ordinal Regression Analysis on University of Florida at Gainesville Data
Test Estimate S.E. Chi-square
Wald chi-square
Df Sig.
Overall model fitting 22.0 1 .000
Predictor
TOEFL Speaking .41 .11 14.6 1 .000
Table 27
True Versus Predicted Outcome Category
True TA assignment
outcome
Predicted TA assignment outcome Percentage correct Nonpass Provisional
pass Clear pass
Nonpass 12 4 0 75.0% Provisional pass
4 18 0 81.8%
Clear pass 0 3 0 0.0%
Overall percentage 71.4%
Setting the cut scores. The area under the ROC curve for provisional passes was .883,
suggesting that the probability was 88.3%, that the TOEFL Speaking score of a randomly
selected provisional or clear pass student was higher than that of a randomly selected nonpass
student.
When the cut score is set at 23, false positives can be avoided (Table 28). However, the
trade-off is that 50% of the provisional passes become misclassified as nonpasses. This higher
false-negative rate is acceptable, however, given that the impact of false positives (i.e.,
potentially unqualified TAs in the classroom) is viewed as being more serious than that of false
negatives.
37

Table 28
True Positive Versus False Positive Rates at Different TOEFL Speaking Cut Score Points for
Provisional Passes
Positive if greater than or equal to
True positive
False positive
19.5 .769 .231 21.0 .615 .077 22.5 .500 .000 23.5 .154 .000 25.0 .077 .000
Note. Not all possible cut points are displayed.
As for predicting clear passes, when the cut score is set at 28 the false positive rate can be
minimized to 0, but all the true clear passes will be falsely classified as nonclear passes (Table
29). If the cut score is lowered to 27, three out of 100 nonpasses or provisional passes may
become classified as clear passes, but the false-negative rate can be reduced from 100% to
66.7%, which can produce substantial savings in local ITA testing costs. However, since there
were only three students in the clear-pass category, this cut score should be monitored closely in
the local context and modified if found to be inappropriate.
Table 29
True Positive Versus False Positive Rates at Different TOEFL Speaking Cut Score Points for
Clear Passes
Positive if greater True positive False positive than or equal to
23.5 .667 .079 25.0 .333 .053 26.5 .333 .026 28.0 .000 .000
Note. Not all possible cut points are displayed.
38
An alternative approach to setting the cut score. Since ITAs participating in the
supervised teaching class were all marginal passes based on their initial SPEAK scores and
passed the Teach Evaluation at the end of the course, this group could also be treated as a
borderline group for ITA-screening purposes. The TOEFL Speaking score distribution of this
group could be examined and a score that indicates the central tendency of the distribution could
be selected as the cut score for clear passes. The median of the TOEFL Speaking scores of this
sample was 21. This was lower than the cut score of 27-28 derived in the analysis above.
However, using the average TOEFL Speaking score level of the borderline group as a cut score
would not necessarily eliminate false positives. The pros and cons of raising or lowering the cut
score need to be weighed carefully in order to determine a score that provides a good balance
between ensuring classification accuracy and saving valuable local testing resources.
Summary of Reliability Estimates and Cut Score Recommendations
Table 30 shows the reliability of the TOEFL Speaking scores and the local ITA test
scores for each university, the size of the sample for estimating the reliability, and how the
reliability estimates were obtained. When interpreting reliability estimates, a few factors should
be considered: the sample size and variability of the sample, the method used to estimate the
reliability, and the types of error that were modeled in the reliability analyses. In general,
reliability estimates that take into account both rater error and task variability tend to be lower
than those that model only rater error, everything else being equal. Furthermore, a larger sample
provides a more stable reliability estimate, and a sample that is more varied in proficiency levels
yields a higher reliability estimate, everything else being equal. For example, the reliability of
the Teach Evaluation and the TOEFL Speaking scores could have been higher if a sample with
more variability had been used.
Table 31 summarizes the recommended cut scores for TA assignments for the four
universities. It also indicates whether the cut score was validated using an independent sample.
39

Table 30
Reliability Estimates of the TOEFL iBT Test and Local ITA Tests
School Test Reliability Sample size Method used to estimate the reliability
TOEFL Speaking .93 84 G study that modeled variability in both rater judgments and tasksa
UCLA TOP .91 84 Multivariate G study that modeled
variability in both rater judgments and tasks
TOEFL Speaking .85 53 G study that modeled variability in both rater judgments and tasks UNCC
Presentation test .90 53 Multivariate G study that modeled only rate error
TOEFL Speaking Not computed because item-level and rater-level data were not available. Drexel
DIP .84 45 Multivariate G study that modeled only rater error
.76b TOEFL Speaking 27 G study that modeled variability in both rater judgments and tasks
UF Teach Evaluation .50 27 Cronbach alpha that modeled the
internal consistency of the test
Note. UCLA = University of California, Los Angeles; UNNC = University of North Caroline,
Greensboro; UF = University of Florida at Gainesville. a. The G coefficients are reported in all the G analyses in this table. b. This estimate is based on a
sample of 27 students who took both the TOEFL Speaking and the Teach Evaluation test. The
reliability of the TOEFL Speaking scores was .82 based on a sample of 41 students who took
both the TOEFL Speaking and the SPEAK. This sample was more varied in proficiency levels
than the sample reported in the table.
40

Table 31
Summary of TOEFL Speaking Cut Score Recommendations at the Four Institutions
Pass Provisional pass Criterion measure Cross validation UCLA 27 23-24 In-house test (TOP) Yes UNCC 24 In-house test (NCPT) Yes
23a Drexel ITA course instructor recommendation
No
UF 27-28 23 SPEAK No
Note. UCLA = University of California, Los Angeles; UNNC = University of North Caroline,
Greensboro; UF = University of Florida at Gainesville. a For all or unrestricted assignments (AA).
Discussion
Relationships Between TOEFL Speaking and Local ITA Test Scores
This study investigated the criterion-related validity of the TOEFL Speaking test for
screening ITAs by examining its relationships with local ITA tests. The findings support the use
of the TOEFL Speaking test for ITA screening because TOEFL Speaking scores were reasonably
correlated with scores on the local ITA-screening measures. After being corrected for score
unreliability, the correlations were higher, suggesting that had the scores been more reliable the
relationships would have been stronger. One might argue that observed correlations are those
based on observed scores; however, disattenuated correlations provide additional information
about the possible causes for low observed correlations. They reveal whether the observed
correlations are low because the real relationships are weak or because there is too much
measurement error. If the reliabilities of both measures are very high, the possibility can be
excluded that a weak correlation between them is due to measurement error.
The TOEFL Speaking scores had the strongest relationship with the UCLA TOP scores
(observed/disattenuated correlations: .78/.84) and the UNCC NCPT (.78/.93), weaker
relationships with the Drexel DIP test scores (.70/NA) and the UNCC CPT (.53/.58), and the
weakest relationship with the UF Teach Evaluation scores (.44/.72). However, due to
unavailability of data in some cases or the particular assessment design, some disattenuated
correlations could not be estimated (e.g., Drexel) or were underestimated (e.g., UF). In other
cases, the restricted range disattenuated the correlations as well (e.g., UF). Therefore, the
41

estimated disattenuated correlations provided only a partial picture of the true relationships
among these measures.
The strengths of the relationships were certainly affected by the extent to which the local
ITA tests engaged and evaluated nonlanguage abilities. McNamara (1996, p. 43) distinguishes
between “strong” and “weak” language performance tests by the criteria used to assess the
elicited performance. He claims that in strong language performance tests, task completion is the
primary focus and performance is evaluated against real-world criteria, of which language may
be only one facet. In contrast, weak language tests use tasks to elicit speech samples on which
language performance, and probably some aspects of the execution of the performance, is
assessed using primarily linguistically driven criteria. McNamara argues that it is possible for a
language performance test to use simulated real-world tasks but to evaluate only the linguistic
aspects of elicited performance, thus making it a weak language test. He contends that many tests
for specific purposes, such as the Occupational English Test (McNamara, 1990), may appear to
be strong language performance tests on the surface but should actually be considered weak
because of their assessment focus on the quality of language performance.
McNamara (1996), in his discussion of strong versus weak language tests, alludes to
differences in the extent to which language test tasks resemble real-world tasks. In his definition,
however, test tasks do not distinguish between these two types of tests. However, it can be
argued that both the tasks and the rating criteria define the constructs of a performance test of
speaking proficiency and affect how strong it may be. The scoring criteria determine the aspects
of speech that provide evidence about candidates’ speaking ability, whereas test tasks with
varying degrees of resemblance to real-world tasks may have a differential impact on the
demonstration of language skills.
The criterion measures used in this study can be viewed as representing a less-to-more
continuum of performance-based tests. SPEAK can be placed on the left, or least authentic, end
of the continuum, since it uses tasks that are the least authentic in eliciting speech characteristic
of language use in academic settings. UCLA’s TOP, the UNCC presentation tests, and the
Drexel DIP represent fairly authentic performance-based assessments that simulate the
communication typical TA duties involve. On the right end of the continuum is the UF Teach
Evaluation, which is an evaluation of ITAs’ videotaped real classroom teaching sessions. At this
end of the continuum, speaking abilities become entangled with teaching skills, increasing the
42

chances that examinees’ speaking abilities are impacted by their teaching skills and adding
difficulty separating these factors in evaluations.
The scoring rubrics of these local tests range from primarily linguistically driven criteria
(weak sense) to real-world criteria (strong sense; McNamara, 1996). For example, the scoring
rubric for the UCLA TOP is most representative of a linguistically driven rubric in which
teaching abilities are clearly not scored. Rubrics for the other three local ITA tests contain, to
varying degrees, teaching or cultural abilities in which nonlinguistic factors such as personality,
rapport with students, and concern about students’ learning may play important roles. Therefore,
the more nonlanguage abilities assessed and the greater the influence that the nonlanguage
components had on the overall evaluation of the ITA test performance, the weaker the
relationship was between the TOEFL Speaking scores and the ITA test scores.
This study also found that TOEFL Speaking scores were more strongly related to the
linguistic aspects of speech measured by components of local ITA tests such as the UCLA
TOP’s pronunciation (observed/disattenuated correlations: .75/.81) and vocabulary and grammar
(.75/.87), the UNCC presentational language (.73/.91 for the NCPT and .62/.67 for the CPT), the
Drexel DIP discourse (.69/NA) and vocabulary (.68/NA), and the UF Teach Evaluation language
(.48/.56). However, the TOEFL Speaking scores bore weaker connections to indicators of
teaching ability such as the UNCC presentation test teaching component (.69/.81 for the NCPT
and .35/.41 for the CPT), Drexel DIP teacher presence/nonverbal communication (.52/NA), and
the UF Teach Evaluation lecturing (.21/.24) and cultural/teaching (.14/.17). This provides further
support for the differences in the strength of relationships between the TOEFL Speaking scores
and the local ITA test scores.
These findings raise intriguing validity issues. Their interpretation depends on how the
constructs of performance-based language tests such as the ITA tests examined in this study are
defined. The ITA testing literature has established that language is a necessary but not a
sufficient factor for ITAs to be successful in classroom teaching. For example, as Hoekje and
Williams (1994) pointed out, language ability is one of the factors that contributes to the
communication success of ITAs in classroom teaching, along with others such as knowledge of
the field, ability to adjust teaching to students’ knowledge level and learning styles, and
personality factors such as confidence in public speaking and interpersonal skills. They argued
for a broadened notion of ITA communicative competence that incorporates the ability to
43

communicate effectively in an instructional setting. This may require a mix of abilities such as
language skills, understanding of the American classroom culture and norms, and teaching skills.
Consequently, in performance-based teaching simulation tests, candidates’ overall teaching
performance and oral language skills are often intertwined.
Nevertheless, some researchers have raised fairness issues involved in using more
performance-based language tests. As discussed earlier, McNamara (1996) noted that most
performance-based language tests are actually weak in the sense that the scoring criteria are
primarily linguistically-driven, with some aspects addressing overall task fulfillment in language-
related terms. One reason that language testers may not be willing to step out of their comfort
zone in regard to language tests is that strong language tests are, in a strict sense, not just
language tests any more (McNamara, 1996). Additionally, they are concerned that using real-
world criteria that include nonlanguage factors may introduce equity issues. Actually, because
the test tasks simulate real-world language use scenarios, nonlanguage factors such as knowledge
about the topic and job competence affect the demonstration of language skills even when
linguistically-driven criteria are used. The addition of these nonlanguage factors makes it more
difficult for raters to tease out examinees’ language skills, which are the target of the assessment.
A few projects that developed performance-based language tests for specific purposes (Bailey,
1985; McNamara, 1990) had to come face-to-face with this fairness issue and seriously consider
the consequences of decisions made based on such test scores. For example, Bailey discussed
fairness issues related to a performance-based ITA test she was developing at UCLA. She was
struggling with the issue of whether it is fair to test ITAs on both their speaking abilities and
teaching abilities while TAs who are native speakers of English are not held responsible for the
same requirements. The compromise solution is usually, as McNamara noted, a performance-
based test in a weak sense, one that uses tasks that simulate real-world tasks but criteria that
focus on language performance.
In a similar fashion, ITA training programs in the United States have struggled with
whether they should go beyond language training. Hoekje and Williams (1994) defined the goal
of ITA training as preparing students to effectively take on all of the responsibilities of a TA,
including teaching, classroom management, and advising. For ITAs who have a high command
of English speaking skills, a lack of familiarity with campus culture and communication and
teaching strategies may still be a barrier to successful classroom teaching. For ITAs with
44

inadequate spoken English skills, effective communication and interpersonal skills, such as
nonverbal behavior, use of the board and other visual aids, and strategies to check students’
comprehension, may allow them to perform adequately in classroom teaching. This suggests that
English proficiency is not synonymous with ITAs’ qualifications to communicate with a class.
Training incorporating elements of American campus culture and communication and teaching
strategies may be necessary for all new ITAs, no matter their level of English-speaking. For this
reason, ITA training programs usually put emphasis on three aspects of teaching: language,
culture, and pedagogy. However, Hoekje and Williams also raised the central question of
“whether ITA educators have the right or duty to provide nonlinguistic training to ITAs when it
is not provided to native-speaking TAs” (p. 263).
The solution to both TA testing and training problems appears simple on the surface:
require native-speaking TAs to take a test of teaching skills and provide them with adequate
training in pedagogy. However, given that the mandate for ITA testing in many states resulted
primarily from the escalating public perceptions of inadequate ITA language skills, the notion of
testing native-speaking TAs’ teaching abilities may be a sensitive one involving complex social
and policy issues. Additionally, advocating for pedagogical training for native-speaking TAs
(such as an intensive course) may be impractical due to the costs of such training.
Theoretical work is therefore required to redefine the constructs of performance-based
ITA screening tests that reflect the richness in the performance sample elicited while ensuring
equity when using the scores for ITA screening. The question of whether or not cultural
knowledge and teaching skills should be incorporated as part of the screening construct needs to
be informed by a careful consideration of the potential consequences of doing so.
As it requires a minimal threshold language level for strategies to aid communication, the
TOEFL Speaking test, as a test of academic speaking skills, may be an effective measure to
identify high-level students who are well qualified for teaching as well as low-level students
whose language abilities are below the minimal threshold level. Therefore, the TOEFL iBT
Speaking test is an effective initial screening measure. For borderline students, performance-
based tests that require language use in simulated instructional settings may provide better
assessments about their oral communication skills and their readiness for teaching assignments.
45

Setting Cut Scores on the TOEFL iBT Speaking Test for ITA Screening
Having established moderately strong relationships between TOEFL Speaking scores and
ITA test scores, this study recommended TOEFL iBT Speaking test cut scores for making TA
assignments at these four universities. Cut scores were set to minimize the chances of an
unqualified ITA being classified as eligible to teach.
This study used primarily the generalized examinee-centered standard-setting approach to
determine cut scores on the TOEFL Speaking test. The borderline group approach was also used
to analyze some of the data at UF. The choice of approach was based on the nature of the
sample, i.e., whether participants representing a wide range of performance on the local ITA tests
were available. This study has provided an example of how cut scores can be derived when
examinees’ performance levels on criterion measures are available. Further, it has employed
binary logistic regression to predict dichotomous outcomes and ordinal regression, an emerging
statistical technique in education, to model three or more outcomes that have a natural ordering.
This study’s use of ordinal regression is thought to be one of the first such applications in
language testing. The use of binary and ordinal logistic regression for classification and for
setting cut scores thus makes methodological contributions to standard-setting practices in
language testing, given that, in many contexts, cut scores need to be established for two or more
ordered performance categories.
TOEFL Speaking scores were found to be generally accurate in classifying students into
distinct TA assignment groups, with the classification accuracy ranging from 71.4% to 96.7% for
the model-building sample. At Drexel, of all the potential ITA-screening measures, including the
TOEFL Speaking test, SPEAK, DIP, and DIP - Teach, the TOEFL Speaking test was the most
effective in accurately predicting instructor recommendations of TA assignments. For each
university, cut scores were recommended so as to minimize the chances of nonpasses being
classified as passes. At UCLA and UNCC, the TOEFL Speaking scores were also found to
function reasonably well in predicting TA assignments using an independent sample with cut
scores determined through the model-building sample.
At UF, the cut scores for clear passes derived through the generalized examinee-centered
method and the borderline group approaches were different. However, using the generalized
examinee-centered approach with ordinal logistic regression, the cut score was estimated based
on a sample representing a wide range of spoken language proficiency. This allowed an
46
examination of the overlap of TOEFL Speaking score distributions for different TA assignment
categories, leading to more appropriate cut score estimations. The borderline group approach
could not accommodate the need to minimize or eliminate false positives because the sample
only included those students that were eligible to teach.
It needs to be noted that the recommended cut score for one university being higher than
that of another does not necessarily suggest that the former requires stronger speaking skills for
their TAs. The presence in a sample of a particular type of student that did not fit the general
prediction model may push up a cut score out of the need to minimize false positives. The Indian
student in the UNCC sample whose enunciation problems due to anxiety prevented the receipt of a
passing score on the local ITA test is one example. Although there was only one such student in
the cross-validation sample, the ITA program coordinator at UNCC noted that fast speech rate with
poor enunciation is a common problem for Indian students who fail their presentation tests
initially. Thus, an institution needs to think carefully about the particular characteristics of their
ITA population and the kind of language support available to them before establishing its cut
scores.
For the purposes of this study, the consequences of having potentially unqualified ITAs
(false positives) were considered more severe than those of failing otherwise qualified ITAs (false
negatives). Depending on the situation of a particular university, its ITA program may be willing
to bear the consequences of having a slightly higher false positive rate to reduce the chances of
misclassifying qualified ITAs as unqualified. This approach is certainly legitimate, assuming a
mechanism can be established to identify unqualified ITAs who are mistakenly put into the
classroom and procedures put in place to provide them with the language support they need.
Limitations and Conclusion
The results of this study have considerable potential value in providing guidance on using
the TOEFL iBT Speaking scores for ITA-screening purposes. However, a few limitations about
interpreting or using the results of this study are worth noting.
A very important consideration in selecting samples for this study is to make sure that the
specific sample is representative of the candidate population in terms of disciplines, proficiency
levels, and native language backgrounds. Although site coordinators were instructed to obtain
adequate and representative samples, most of the data collection had to occur shortly after
prospective ITAs arrived on campus when they were busy with orientation activities.
47

Consequently, the samples were fairly small and may be insufficiently representative. The
characteristics of the samples may certainly have had an impact on the estimations of both the
correlations and the cut scores.
Although reasonably strong relationships were found between TOEFL Speaking scores
and local ITA test scores, supporting the use of TOEFL iBT Speaking scores for ITA screening,
additional empirical evidence is needed demonstrating that the underlying speaking skills
assessed in both tests are similar. Discourse analysis of candidate speech and verbal protocols of
candidates’ oral production processes, for example, may provide additional support.
Theodoropulos and Hoekje (2005) investigated the discourse features of the TOEFL Speaking,
SPEAK, and the local ITA test responses using the data collected at Drexel. They found that the
TOEFL Speaking and DIP tests provided more opportunities than the SPEAK for students to
produce a richer and more varied response in terms of discourse structure. However, they also
reported minimal use of prosodic cues such as intonation and stress to mark the connections
between speech segments in the TOEFL Speaking and SPEAK. More research along this line
would shed further light on the validity of TOEFL iBT Speaking for ITA screening purpose.
Although the TOEFL Speaking test may be adequate in predicting the outcomes of ITA
assignments, it is important to note that teaching simulation tests, as used in this study, are more
relevant for screening ITAs, and more importantly, diagnosing their strengths and weaknesses.
Thus, they are expected to have a more positive impact on the teaching and learning practices
that focus on improving the communicative skills of prospective ITAs.
Because observed scores were used in deriving the optimal TOEFL Speaking cut scores
for TA assignments, some amount of error almost certainly occurred in the estimation process. In
addition, the relatively low proportions of participants in some of the TA assignment categories
may also have influenced the classification accuracy. Consequently, these TOEFL Speaking
score recommendations need to be closely monitored, validated with new samples in local
settings if possible, and modified, if necessary. Mechanisms should be established to rectify
cases where ITA assignment classification as a result of these cut score recommendations is not
accurate.
Although collecting student evaluations of ITAs in real classroom settings was part of the
original study design, student evaluations were in fact collected only for a small number of ITAs
at one of the universities. At the other universities, it was impossible to collect a sufficient
48

number of student evaluations, either because ITAs were not allowed to teach in their first year
or because they did not have any TA assignments in the subsequent semester. A future area of
investigation would be to assess the quality of ITAs’ classroom teaching. This would require re-
testing using the TOEFL Speaking test at the time of their appointments.
49

References
Afifi, A. A., & Clark, V. (1990). Computer-aided multivariate analysis (2nd ed.). New York: Van
Nostrand Reinhold.
Agresti, A. (2002). Categorical data analysis (2nd ed.). New York: Wiley.
Angoff, W. H. (1971). Scales, norms, and equivalent scores. In R. L. Thorndike (Ed.)
Educational measurement (2nd ed., pp. 508-600). Washington, DC: American Council on
Education.
Bailey, K. M. (1985). If I had known then what I know now: Performance testing of foreign
teaching assistants. In P. C. Hauptman, R. LeBlanc, & M. B. Wesche (Eds.), Second
language performance testing (pp. 153-180). Ottawa, Canada: University of Ottawa.
Brennan, R. L. (2001a). Generalizability theory. New York: Springer-Verlag.
Brennan, R. L. (2001b). Manual for mGENOVA. Version 2.1. Iowa Testing Programs Occasional
Papers No. 50. The University of Iowa: Iowa City.
Butler, F. A., Eignor, D., Jones, S., McNamara, T. F., & Suomi, B. K. (2000). TOEFL 2000
speaking framework: A working paper (TOEFL Monograph Series No. MS-20).
Princeton, NJ: ETS.
Cleary, P. D., & Angel, R. (1984). The analysis of relationships involving dichotomous
dependent variables. Journal of Health and Social Behavior, 25, 334-348.
Cohen, A. S., Kane, M. T., & Crooks, T. J. (1999). A generalized examination-centered method for
setting standards on achievement tests. Applied Measurement in Education, 12, 343-366.
Cox, D. R., & Snell, E. J. (1989). The analysis of binary data (2nd ed.). London: Chapman and Hall.
Crick, J. E., & Brennan, R. L. (1983). Manual for GENOVA: A generalized analysis of variance
system (ACT Technical Bulletin No. 43). Iowa City, IA: ACT, Inc.
Douglas, D. (1997). Testing speaking ability in academic contexts: Theoretical considerations
(TOEFL Monograph Series No. MS-8). Princeton, NJ: ETS.
Efron, B. (1975). The efficiency of logistic regression compared to normal discriminant analysis.
Journal of the American Statistical Society, 70, 892–898.
Grimm, L.G., & Yarnold, P.R. (Eds.). (1995). Reading and understanding multivariate statistics.
Washington, DC: American Psychological Association.
Hoekje, B., & K. Linnell. (1994). “Authenticity” in language testing: Evaluating spoken
language tests for international teaching assistants. TESOL Quarterly, 28, 103-125.
50
Hoekje, B., & J. Williams. (1994). Communicative competence as a theoretical framework for
ITA education. In C. G. Madden & C. L. Myers (Eds.), Discourse and performance of
international teaching assistants. Alexandria, VA: Teachers of English to Speakers of
Other Languages, Inc.
Hosmer, D. W., & Lemeshow, S. (2000). Applied logistic regression (2nd ed.). New York: Wiley.
Lado, R. (1961). Language testing. New York: McGraw-Hill.
Landa, M. (1988). Training international students as teaching assistants. In J. A. Mestenhauser,
G. Marty, & I. Steglitz (Eds.), Culture, learning, and the disciplines: Theory and practice
in cross-cultural orientation. Washington, D.C.: NAFSA.
Lei, P. W., & Koehly, L. M. (2000). Linear discriminant analysis versus logistic regression: A
comparison of classification errors. Paper presented at the annual meeting of American
Educational Research Association, New Orleans, LA.
Livingston, S. A., & Zieky, J. J. (1982). Passing scores: A manual for setting standards of
performance on educational and occupational tests. Princeton, NJ: ETS.
McCullagh, P., & Nelder, J. A. (1989). Generalized linear models. London: Chapman and Hall.
McNamara, T. F. (1990). Item response theory and the validation of an ESP test for health
professionals. Language Testing, 7, 52-75.
McNamara, T. F. (1996). Measuring second language performance. London: Longman.
McNemar, Q. (1969). Psychological statistics (4th ed.). New York: Wiley.
Menard, S. (2001). Applied logistic regression analysis (Sage University Paper Series on
Quantitative Applications in the Social Sciences No. 07-106). Thousand Oaks, CA: Sage.
Peduzzi, P., Concato, J., Kemper, E., Holford, T. R., & Feinstein, A. (1996). A simulation of the
number of events per variable in logistic regression analysis. Journal of Clinical
Epidemiology, 99, 1373-1379.
Plakans, B. S., & Abraham, R. G. (1990). The testing and evaluation of international teaching
assistants. In D. Douglas (Ed.), English language testing in U.S. colleges and universities
(pp. 68-81). Washington, D.C.: NAFSA.
Press, S. J., & Wilson, S. (1978). Choosing between logistic regression and discriminant
analysis. Journal of the American Statistical Association, 73, 699-705.
51

Rosenfeld, M., Leung, S., & Oltman, P. K. (2001). The reading, writing, speaking, and listening
tasks important for academic success at the undergraduate and graduate levels (TOEFL
Monograph Series No. MS-21). Princeton, NJ: ETS.
Rubin, D.L. (1992). Nonlanguage factors affecting undergraduates’ judgments of nonnative
English speaking teaching assistants. Research in Higher Education, 33, 511-531.
Smith, R. M., Byrd, P., Nelson, G. L., Barrett, R. P., & Constantinides, J. C. (1992). Crossing
pedagogical oceans: International teaching assistants in U. S. undergraduate education
(ASHE-ERIC Higher Education Report No. 8.). Washington, DC: George Washington
University.
Smith, J., Meyers, C. M., & Burkhalter, A. J. (1992). Communicate: Strategies for international
teaching assistants. Englewood Cliffs, NJ: Regents/Prentice Hall.
SPSS. (2002). Ordinal regression analysis, SPSS Advanced Models 10.0. Chicago, IL: Author.
Theodoropulos, C., & Hoekje B. (2005). Tuning the instruments: A local comparability study of
TAST, SPEAK, and an IPT. Paper presented at the annual TESOL convention, San
Antonio, TX.
UCLA Office of Instructional Development. (2005). The TOP test coordinator’s manual. Los
Angeles: Author.
Waters, A. (1996). A review of research into needs in English for academic purposes of
relevance to the North American higher education context (TOEFL Monograph Series
No. MS-06). Princeton, NJ: ETS.
52

Notes 1. Because the speaking section of the TOEFL iBT is completely new and may pose challenges
to potential test takers, the TOEFL program made the speaking section available as a stand-
alone test, the TOEFL Academic Speaking Test (TAST). It was delivered through the
Interactive Voice Response (IVR) system and used by individuals to practice for TAST or by
institutions for local use. A web-based version of this stand-alone speaking test was
developed for this study. TAST was discontinued because the TOEFL program launched the
TOEFL Practice On-line (TPO), which is Internet-delivered and contains retired TOEFL iBT
test forms for students to prepare for the test. In describing the test instruments in this study,
the TOEFL Speaking test, rather than the TOEFL iBT Speaking test, is used because we used
this stand-alone test.
2. Performance standards has been used by some researchers as a synonym for cut score. In
this article, it refers to the desired performance level in the domain of interest.
3. The fact that Form A and Form B were not equated might have some influence on the results
in this study. In operational TOEFL iBT tests, only the reading and listening sections are
equated across different test forms. The comparability of the writing and speaking sections is
ensured through test development and rater training efforts.
4. The Nagelkerke R-Square is not contained in Table 4 or in any other similar tables in this
report.
5. Barbara Hoekje and Christos Theodoropulos designed the local validity study and collected
the data at Drexel University. The participants were not paid by ETS. The Drexel
investigators decided to administer the SPEAK exam to the students in the summer ITA class
at the end of the class and to compute the DIP - Teach scores. They graciously gave ETS
access to use the data.
6. If the range of one variable is restricted (curtailed), and the standard deviation for an
unrestricted distribution is known, McNemar's formula (McNemar, 1969) can be used to
correct the observed correlation for range restriction (p. 162).
53

where:
rc = the corrected correlation;
ru = the uncorrected correlation;
Sx = the unrestricted standard deviation; and
sx = the restricted standard deviation.
54

List of Appendixes
Page
A — Binary and Ordinal Logistic Regression Models.............................................................. 56
B — UCLA TOP Test Scoring Rubrics .................................................................................... 59
C — UNCC Presentation Test Scoring Rubrics........................................................................ 60
D — Drexel DIP Test Scoring Rubric ....................................................................................... 63
E — UF Teach Evaluation Rubrics........................................................................................... 64
55

Appendix A
Binary and Ordinal Logistic Regression Models
Model Evaluations
Unlike a linear regression model, a logistic regression model takes categorical or ordinal
variables as dependent variables and applies maximum likelihood estimation (MLE) after
transforming the dependent variable into logits (Menard, 2001). Logits are the natural log of the
odds, with odds defined as the probability of an event divided by the probability of no event.
In a binary regression model, the log odds in a response category are predicted by the
explanatory variables. In an ordinal regression model, a function of the cumulative response
probabilities of being in a category or lower is predicted (Agresti, 2002). The link function
transforms the cumulative probabilities in order so that the model can be estimated.
Several link functions are available in the ordinal regression procedure, such as logit,
complementary log-log, negative log-log, probit, and cauchit (SPSS, 2002), although the first
three are the most commonly used. There are no clear-cut rules to determine which link function
is preferable but the following guidelines are useful: The logit link is usually used when the
cases in different response categories are roughly evenly distributed; the complementary log-log
function may work better for data where higher categories are more probable; and the negative
log-log may be more appropriate for data where lower categories are more probable (SPSS). The
choice of the link function depends on which one provides reasonable classification results while
satisfying the parallel regression line (slope) assumption across all categories.
Although logistic regression is less restrictive, it does require a larger sample size. This is
because MLE relies on large-sample asymptotic normality, which means that the reliability of
the parameter estimates declines when there are only a few cases for each observed combination
of independent variables. As a rule of thumb, Peduzzi ,Concato, Kempet, Holford, and Feinstein
(1996) recommend a minimum of 10 observations per parameter in the model. Grimm and
Yarnold (1995) propose that at least 50 cases per independent variable might be required for
accurate hypothesis testing, especially when the dependent variable has many groups.
A logistic model can be evaluated in multiple ways. A model chi-square test is used to
indicate whether the model with the predictor(s) represents a significant improvement over the
null model with only the intercept and no predictors (slopes are 0). The Hosmer-Lemeshow test
in binary logistic regression shows whether there is a significant difference between observed
56

and model-predicted values. The goodness-of-fit tests in ordinal regression indicate whether the
model fits the data; however, it is only relevant if a smaller number of categorical independent
variables are used. If continuous variables are used, these statistics will not follow the chi-square
distribution, so the goodness-of-fit tests are not very informative (McCullagh & Nelder, 1989).
The significance of individual predictors can be assessed by the Wald test. A significant
Wald test for a certain predictor indicates that it is significantly related to the outcome variables.
The Nagelkerke R-Square is a supplemental measure of the association between the predictors
and the dependent variable. It adjusts for the Cox and Snell R-Square (Cox & Snell, 1989) so
that it varies between 0 and 1, where 0 represents no predictive utility and 1 indicates a perfect
prediction. The Nagelkerke R-Square approximates the R-Square in linear regression, which
indicates the proportion of variance in the dependent variable explained by the independent
variable(s).
Since a primary goal of a logistic regression analysis is to create a model that can reliably
classify observations into one of two or more distinct outcomes, the success of a logistic model
can be evaluated by examining the classification table. Two concepts are important in
classification: sensitivity and specificity. Sensitivity refers to the extent to which positive
observations are correctly classified (true positives), and specificity indicates the degree to which
negative observations are correctly classified as negative (true negatives). The term 1 –
specificity is used to show the proportion of negative cases that are misclassified as positive,
commonly called false positives. For a binary logistic regression, the classification table is a 2 x
2 table with the rows representing the observed outcomes and the columns indicating the
predicted outcomes given a particular cutoff probability point, usually set at 0.5. For an ordinal
logistic regression, it is an n x n table (n = number of outcome categories), where the category
that is associated with the highest probability is the predicted category.
Using ROC Curves to Derive Optimal Cut Scores
While the classification table shows the classification rate based on one cut-off value
(usually 0.5), the receiver operating characteristic (ROC) curve is used to plot sensitivity versus 1
– specificity values for different cut-off points, which are the coordinates of the curve (Afifi &
Clark, 1990; Hosmer & Lemeshow, 2000). The curved line is the line for the input data, and the
diagonal line, which is the reference line, represents chance probability. The higher the curve is
above the reference line, the more accurate the prediction is. Graphing a ROC curve gives a good
57

visual representation of the prediction accuracy, and the area between the curve and the reference
line is a numerical representation. For example, it can represent the probability that the TOEFL
Speaking score for a randomly chosen student who is eligible to teach will exceed that for a
randomly chosen student who is not eligible.
ROC curves can help us determine optimal cut points. When choosing a cut score, there
is a tradeoff between maximizing true positives and minimizing false positives. The selection of
an optimal score depends on the need in a specific context.
58

Appendix B
UCLA TOP Test Scoring Rubrics
From UCLA TOP Test Scoring Rubrics by University of California, Los Angeles, 2006, Los
Angeles: Author. Copyright by University of California, Los Angeles. Adapted with permission
of the author.
Scoring categories
4 3 2 1 0
Phonetic & phonological
Accent not distracting. Pronunciation does not impede communication.
Accent slightly distracting.
Accent somewhat distracting. Pron. Somewhat impedes communication.
Accent very distracting. Pron. severely impedes communication.
Unintelligible or few words intelligible. competence Pronunciation
rarely or slightly impedes communication.
Lack of grammar/lexis severely impedes communication. May be satisfactory for very simple communication.
Lack of grammar/
Grammar errors common in more complex constructions. Some errors in simple constructions. Lexical errors somewhat impede communication.
Lexical / grammatical
If errors occur they are not very noticeable. Errors do not impede communication.
Some errors but rarely major. Appropriate use/range of vocab. and grammar structure for situation, but errors occur, slightly impede communication.
lexis prevents basic
competence
communication.
Rhetorical organization
Discourse is well-organized and clearly structured. Ideas are logically connected to one another with appropriate cohesive devices.
Discourse is organized and structured, errors in use of cohesive devices and organization of ideas slightly impede communication.
Discourse not well organized. Errors in use of cohesive devices and organization of ideas somewhat impede communication.
Discourse is generally not organized or structured. Errors in use of cohesive devices and lack of organization of ideas severely impede communication.
Discourse exhibits no organization or lack of phonetic or LG competence prevents assessment.
Often responds inappropriately. Needs clarification very often, even for basic things.
Does not demonstrate signs of question comprehension. No evidence that candidate can respond to spoken English.
Question handling
Responds appropriately, quickly, and fully to questions. Shows clear evidence of question comprehension.
Responds fairly appropriately to questions. May ask for clarification. Usually shows evidence of question comprehension.
Sometimes does not respond appropriately to questions, showing evidence of insufficient question comprehension. Often asks for clarification, even for fairly simple questions.
59

Appendix C
UNCC Presentation Test Scoring Rubrics
From UNCC Presentation Test Scoring Rubrics by University of North Carolina, Charlotte,
2006, Charlotte, NC: Author. Copyright by University of North Carolina, Charlotte. Adapted
with permission of the author.
I. TEACHING SKILLS SCORE (0-3) COMMENTS 1. Organization of presentation
0 .5 1 1.5 2 2.5 3 appropriate for topic; logical sequence; overt signaling of importance; relevant, practical examples; transitions
2. Clarity of presentation 0 .5 1 1.5 2 2.5 3 concise but substantial; focused on topic;
appropriate amount of information; effective use of supporting detail
3. Use of visuals 0 .5 1 1.5 2 2.5 3 well-chosen, well-organized; easy to read; smoothly
integrated
4. Manner of speaking 0 .5 1 1.5 2 2.5 3 appropriate volume, speed, variation of tone; manner
varied to maximize comprehensibility
5. Audience awareness 0 .5 1 1.5 2 2.5 3 appropriate content, vocabulary, manner of
presentation, eye contact; monitoring of verbal/nonverbal audience response
6. Interaction 0 .5 1 1.5 2 2.5 3 invites interaction; friendly & nonjudgmental
response; encourages questions; provides feedback 7. Teacher presence
0 .5 1 1.5 2 2.5 3 confident, poised; performs easily; rapport with audience; takes leadership position; appropriate posture, gestures, facial expression, use of space
8. Aural comprehension 0 .5 1 1.5 2 2.5 3 understands utterances at a natural rate; may require
some clarification but not extensive adjustments
9. Method of handling questions 0 .5 1 1.5 2 2.5 3 responds quickly; repeats, rephrases & checks
comprehension; direct, concise, substantial answers
I. TOTAL FOR TEACHING SKILLS (OUT OF 27)
60

II. PRESENTATION LANGUAGE SKILLS SCORE (0-3) COMMENTS 1. Pronunciation A
0 .5 1 1.5 2 2.5 3 individual sounds; word stress; emphasis for contrast / focus; enunciation 2. Pronunciation B
0 .5 1 1.5 2 2.5 3 thought grouping; rhythm, linking; intonation 3. Grammar
0 .5 1 1.5 2 2.5 3 form, usage; some errors but none that interfere with intelligibility 4. Fluency
0 .5 1 1.5 2 2.5 3 phrasing; pauses; smooth rhythmic patterns 5. Vocabulary
0 .5 1 1.5 2 2.5 3 appropriate word choice; adequate range 6. General comprehensibility 0 .5 1 1.5 2 2.5 3
II. TOTAL FOR PRESENTATION LANGUAGE SKILLS __ (OUT OF 18)
III. INTERACTIVE LANGUAGE SKILLS SCORE (0-3) COMMENTS 1. Pronunciation A
0 .5 1 1.5 2 2.5 3 individual sounds; word stress; emphasis for contrast / focus 2. Pronunciation B
0 .5 1 1.5 2 2.5 3 thought grouping; rhythm, linking; intonation 3. Grammar
0 .5 1 1.5 2 2.5 3 form, usage; some errors but none that interfere with intelligibility 4. Fluency
0 .5 1 1.5 2 2.5 3 phrasing; pauses; smooth rhythmic patterns 5. General comprehensibility 0 .5 1 1.5 2 2.5 3
III. TOTAL FOR INTERACTIVE LANGUAGE SKILLS __ (OUT OF 15)
61

IV. OVERALL IMPRESSION OF PRESENTATION SCORE (OUT OF 15) / COMMENTS:
0-3 = not ready for students
4-7 = ready for one-on-one, but not classroom teaching
8-11 = ready for classroom teaching but more practice needed
12-15 = ready for classroom teaching
PRESENTATION TOTAL: = + + + + X 4
I. Teaching II. Pres. lang III. Int. lang. IV. Overall imp Raw score Total score
62

Appendix D
Drexel DIP Test Scoring Rubric
From Drexel DIP Test Scoring Rubric by Drexel University, 2006, Philadelphia: Author.
Copyright by Drexel University. Adapted with permission of the author.
Interactive Performance Test Rating Sheet
Department:___________________________ Student:______________________________ Rater:________________________________ Date:_________________________________
almost
always usually often some- rarely
times
Listening comprehension: The speaker's listening comprehension is sufficient to easily understand questions and respond appropriately
5 4 3 2 1
Interactive language skills: The speaker is able to negotiate with the audience, paraphrase and restate information, maintaining easy comprehensibility.
5 4 3 2 1
Discourse language skills: The speaker uses appropriate markers to make connections within the text, support main points, and show logical relationships.
5 4 3 2 1
Vocabulary: The speaker has sufficient general and field specific vocabulary to express concepts easily and accurately.
5 4 3 2 1
Teacher presence and nonverbal communication: The speaker demonstrates confidence, rapport with audience, ease of performance, and nonverbal communication is appropriate and encourages interaction
5 4 3 2 1
Overall comprehensibility: The speaker's overall comprehensibility is sufficient to be intelligible while presenting information and answering questions.
5 4 3 2 1
TOTAL: AVERAGE:
Overall Impression: Comments: ______ No instructional contact ______ Restricted assignments ______ Nonrestricted (All)
assignments
63

Appendix E
UF Teach Evaluation Rubrics
From UF Teach Evaluation Rubrics by University of Florida at Gainesville, 2006, Gainesville:
Author. Copyright by University of Florida at Gainesville. Adapted with permission of the
author.
1. OVERALL LANGUAGE COMPREHENSIBILITY
LOW - - - HIGH
A. Pronunciation at word level 0 1 2 3 1/2
B. Intonation stress, pausing 0 1 2 3 1/2
C. Grammar 0 1 2 3 1/2
D. Fluency 0 1 2 3 1/2
E. Discourse cohesion and organization 0 1 2 3 1/2
F. Speed 0 1 2 3 1/2
G. Loudness 0 1 2 3 1/2
2. LISTENING/HANDLING QUESTIONS
A. General listening ability 0 1 2 3 1/2
B. Question-handling and responding 0 1 2 3 1/2
3. LECTURING ABILITY
A. Clarity of expression 0 1 2 3 1/2
B. Use of supporting evidence 0 1 2 3 1/2
4. CULTURAL/TEACHING ABILITY
A. Familiarity with cultural code 0 1 2 3 1/2
B. Eye contact 0 1 2 3 1/2
C. Use of blackboard/overhead 0 1 2 3 1/2
D. Appropriate nonverbal behavior 0 1 2 3 1/2
E. Teacher presence 0 1 2 3 1/2
64

5. OVERALL IMPRESSION
TA is understandable at least 90% of the time Yes No
TA understands students at least 90% of the time Yes No
TA classroom behavior is appropriate. Yes No
TA pedagogical skills are acceptable. Yes No
LANGUAGE ____/21 Comments
LISTENING ____/ 6
LECTURE ____/ 6
TEACHING ____/15
OVERALL ____/48
Recommendation:
____ TA is ready to teach with normal departmental supervision.
____ TA is recommended for further work in ASE.
65

To obtain more information about TOEFL programs and services, use one of the following:
Phone: 1-877-863-3546(US, US Territories*, and Canada)
1-609-771-7100(all other locations)
E-mail: [email protected] site: www.ets.org/toefl
*America Samoa, Guam, Puerto Rico, and US Virgin Islands
Test of English as a Foreign LanguagePO Box 6155
Princeton, NJ 08541-6155USA