investigating the design parameters of a diamond shaped
TRANSCRIPT

Paper: ASAT-15-108-AE
15th
International Conference on
AEROSPACE SCIENCES & AVIATION TECHNOLOGY,
ASAT - 15 – May 28 - 30, 2013, Email: [email protected] ,
Military Technical College, Kobry Elkobbah, Cairo, Egypt,
Tel: +(202) 24025292 –24036138, Fax: +(202) 22621908
1
Investigating the Design Parameters of a Diamond-Shaped
Supersonic Airfoil
{M. H. F. El-Gohary, M. Y. M. Ahmed*}†
Abstract: The lifting surfaces of supersonic flying vehicles generally have sharp leading
edges. The airfoil sections of such wings produce the desired lift and, more importantly, yield
less drag compared with the conventional blunt airfoils commonly used with subsonic flying
vehicles.
It is evident that, under given flight conditions, the aerodynamic characteristics of a
supersonic airfoil namely, its aerodynamic coefficients are strongly dependent on its
geometry. More interestingly, the variation in these coefficients is non-monotonic with the
variation in the airfoil design.
In the present paper, a parametric study is conducted on a diamond-shaped airfoil of a 10%
thickness-to-chord ratio. The objective is to investigate the impact of the airfoil design on its
performance. A computer code is developed based on the exact shock-expansion theory to
estimate the pressure distribution over the airfoil and, hence, its corresponding aerodynamic
coefficients. It was found that, the aerodynamic coefficients of the airfoil are sensitive to its
design. In addition, the designs for maximum lift and minimum drag coefficients are
competing. A nearly-symmetric airfoil would yield a maximum aerodynamic efficiency.
Keywords: Missile aerodynamics, supersonic airfoil, parametric study.
1. Introduction In the flying vehicles, the aerodynamic forces, especially lift, are mainly generated by the
control surfaces which are, thus, also known as the lifting surfaces. The value of the generated
forces at given flight conditions varies with the design of these surfaces. The key parameter in
the design of the lifting surfaces is the design of their sections; the airfoils.
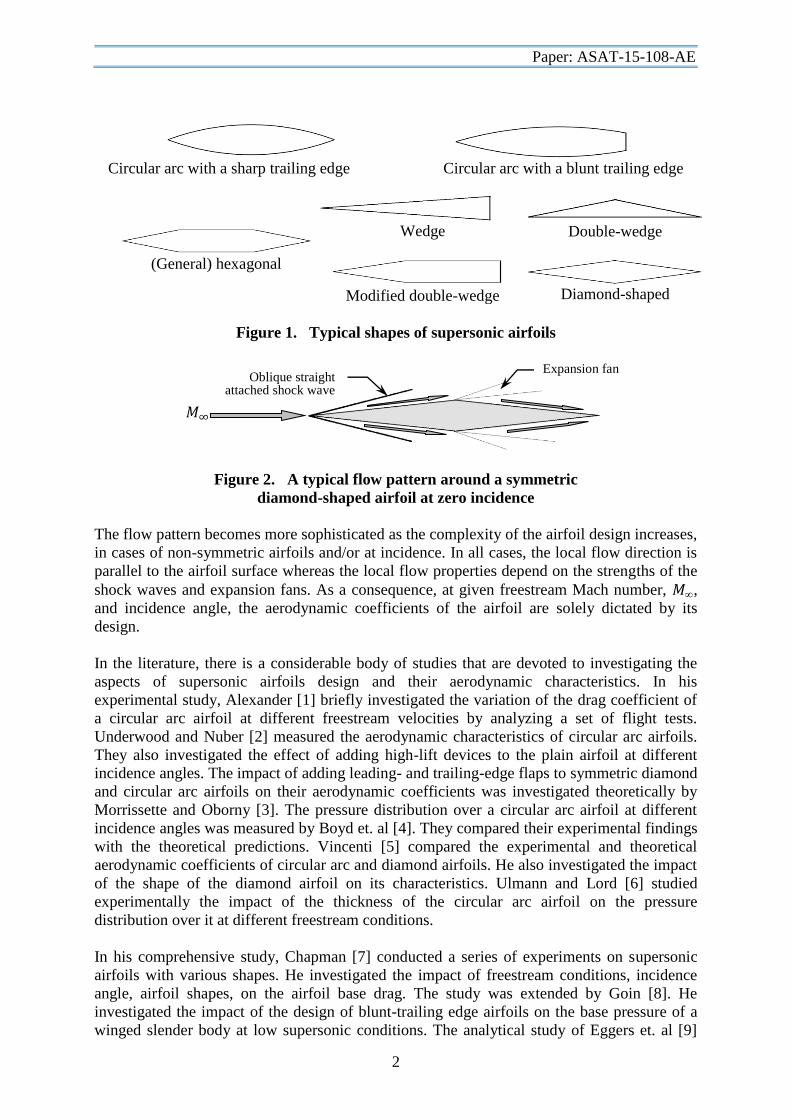
The common designs of supersonic airfoils include two major families namely, the circular
arc airfoils and the general hexagonal airfoils. The former can have a sharp or a blunt trailing
edge whereas the latter can have a variety of derived shapes, Fig. 1. In all designs, the
supersonic airfoil can be symmetric or non-symmetric about its chord line.
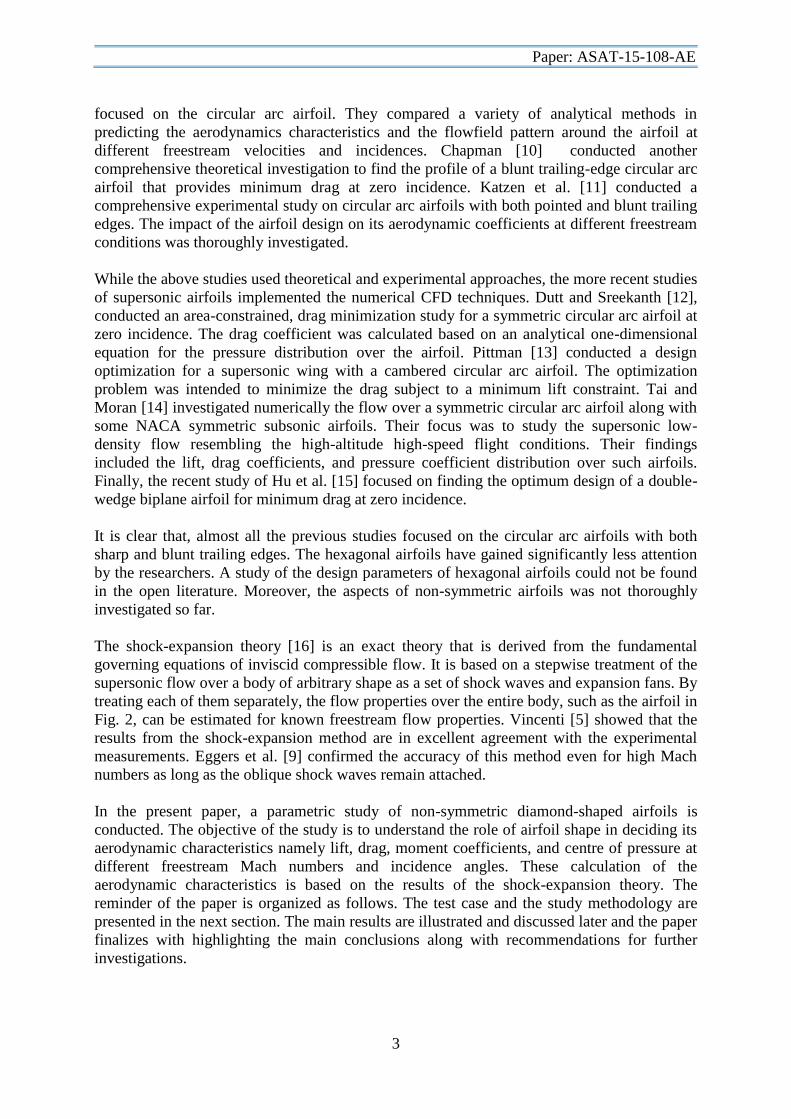
In contrast to subsonic and transonic airfoils, the supersonic airfoils are characterized by a
sharp leading edge. This key design feature is intended to generate a straight, attached shock
wave ahead of the airfoil much weaker than the detached bow shock wave generated ahead of
airfoils with blunt leading edges. Downstream of the leading edge, the flow over the airfoil
subsequently expands as it passes through a series of expansion waves. The typical flow
pattern around a symmetric diamond-shaped airfoil at zero incidence is illustrated in Fig. 2.
* [email protected] ; † Egyptian Armed Forces, Egypt.
Paper: ASAT-15-108-AE
2
Circular arc with a sharp trailing edge Circular arc with a blunt trailing edge
(General) hexagonal
Wedge
Double-wedge
Modified double-wedge
Diamond-shaped
Figure 1. Typical shapes of supersonic airfoils
Figure 2. A typical flow pattern around a symmetric
diamond-shaped airfoil at zero incidence
The flow pattern becomes more sophisticated as the complexity of the airfoil design increases,
in cases of non-symmetric airfoils and/or at incidence. In all cases, the local flow direction is
parallel to the airfoil surface whereas the local flow properties depend on the strengths of the
shock waves and expansion fans. As a consequence, at given freestream Mach number, ,
and incidence angle, the aerodynamic coefficients of the airfoil are solely dictated by its
design.
In the literature, there is a considerable body of studies that are devoted to investigating the
aspects of supersonic airfoils design and their aerodynamic characteristics. In his
experimental study, Alexander [1] briefly investigated the variation of the drag coefficient of
a circular arc airfoil at different freestream velocities by analyzing a set of flight tests.
Underwood and Nuber [2] measured the aerodynamic characteristics of circular arc airfoils.
They also investigated the effect of adding high-lift devices to the plain airfoil at different
incidence angles. The impact of adding leading- and trailing-edge flaps to symmetric diamond
and circular arc airfoils on their aerodynamic coefficients was investigated theoretically by
Morrissette and Oborny [3]. The pressure distribution over a circular arc airfoil at different
incidence angles was measured by Boyd et. al [4]. They compared their experimental findings
with the theoretical predictions. Vincenti [5] compared the experimental and theoretical
aerodynamic coefficients of circular arc and diamond airfoils. He also investigated the impact
of the shape of the diamond airfoil on its characteristics. Ulmann and Lord [6] studied
experimentally the impact of the thickness of the circular arc airfoil on the pressure
distribution over it at different freestream conditions.
In his comprehensive study, Chapman [7] conducted a series of experiments on supersonic
airfoils with various shapes. He investigated the impact of freestream conditions, incidence
angle, airfoil shapes, on the airfoil base drag. The study was extended by Goin [8]. He
investigated the impact of the design of blunt-trailing edge airfoils on the base pressure of a
winged slender body at low supersonic conditions. The analytical study of Eggers et. al [9]
𝑀∞
Expansion fan Oblique straight
attached shock wave
Paper: ASAT-15-108-AE
3
focused on the circular arc airfoil. They compared a variety of analytical methods in
predicting the aerodynamics characteristics and the flowfield pattern around the airfoil at
different freestream velocities and incidences. Chapman [10] conducted another
comprehensive theoretical investigation to find the profile of a blunt trailing-edge circular arc
airfoil that provides minimum drag at zero incidence. Katzen et al. [11] conducted a
comprehensive experimental study on circular arc airfoils with both pointed and blunt trailing
edges. The impact of the airfoil design on its aerodynamic coefficients at different freestream
conditions was thoroughly investigated.
While the above studies used theoretical and experimental approaches, the more recent studies
of supersonic airfoils implemented the numerical CFD techniques. Dutt and Sreekanth [12],
conducted an area-constrained, drag minimization study for a symmetric circular arc airfoil at
zero incidence. The drag coefficient was calculated based on an analytical one-dimensional
equation for the pressure distribution over the airfoil. Pittman [13] conducted a design
optimization for a supersonic wing with a cambered circular arc airfoil. The optimization
problem was intended to minimize the drag subject to a minimum lift constraint. Tai and
Moran [14] investigated numerically the flow over a symmetric circular arc airfoil along with
some NACA symmetric subsonic airfoils. Their focus was to study the supersonic low-
density flow resembling the high-altitude high-speed flight conditions. Their findings
included the lift, drag coefficients, and pressure coefficient distribution over such airfoils.
Finally, the recent study of Hu et al. [15] focused on finding the optimum design of a double-
wedge biplane airfoil for minimum drag at zero incidence.
It is clear that, almost all the previous studies focused on the circular arc airfoils with both
sharp and blunt trailing edges. The hexagonal airfoils have gained significantly less attention
by the researchers. A study of the design parameters of hexagonal airfoils could not be found
in the open literature. Moreover, the aspects of non-symmetric airfoils was not thoroughly
investigated so far.
The shock-expansion theory [16] is an exact theory that is derived from the fundamental
governing equations of inviscid compressible flow. It is based on a stepwise treatment of the
supersonic flow over a body of arbitrary shape as a set of shock waves and expansion fans. By
treating each of them separately, the flow properties over the entire body, such as the airfoil in
Fig. 2, can be estimated for known freestream flow properties. Vincenti [5] showed that the
results from the shock-expansion method are in excellent agreement with the experimental
measurements. Eggers et al. [9] confirmed the accuracy of this method even for high Mach
numbers as long as the oblique shock waves remain attached.
In the present paper, a parametric study of non-symmetric diamond-shaped airfoils is
conducted. The objective of the study is to understand the role of airfoil shape in deciding its
aerodynamic characteristics namely lift, drag, moment coefficients, and centre of pressure at
different freestream Mach numbers and incidence angles. These calculation of the
aerodynamic characteristics is based on the results of the shock-expansion theory. The
reminder of the paper is organized as follows. The test case and the study methodology are
presented in the next section. The main results are illustrated and discussed later and the paper
finalizes with highlighting the main conclusions along with recommendations for further
investigations.
Paper: ASAT-15-108-AE
4
2. Case Study and Methodology
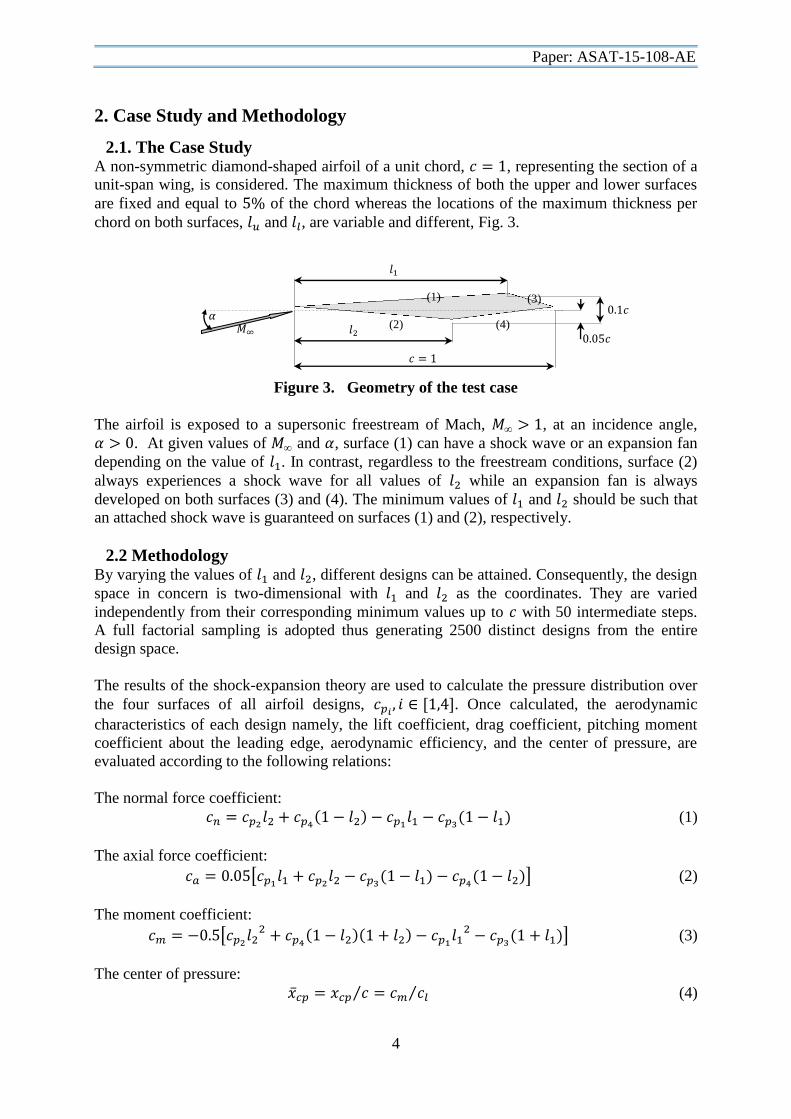
2.1. The Case Study A non-symmetric diamond-shaped airfoil of a unit chord, , representing the section of a
unit-span wing, is considered. The maximum thickness of both the upper and lower surfaces
are fixed and equal to of the chord whereas the locations of the maximum thickness per
chord on both surfaces, and , are variable and different, Fig. 3.
Figure 3. Geometry of the test case
The airfoil is exposed to a supersonic freestream of Mach, , at an incidence angle,
. At given values of and , surface (1) can have a shock wave or an expansion fan
depending on the value of . In contrast, regardless to the freestream conditions, surface (2)
always experiences a shock wave for all values of while an expansion fan is always
developed on both surfaces (3) and (4). The minimum values of and should be such that
an attached shock wave is guaranteed on surfaces (1) and (2), respectively.
2.2 Methodology By varying the values of and , different designs can be attained. Consequently, the design
space in concern is two-dimensional with and as the coordinates. They are varied
independently from their corresponding minimum values up to with 50 intermediate steps.
A full factorial sampling is adopted thus generating 2500 distinct designs from the entire
design space.
The results of the shock-expansion theory are used to calculate the pressure distribution over
the four surfaces of all airfoil designs, . Once calculated, the aerodynamic
characteristics of each design namely, the lift coefficient, drag coefficient, pitching moment
coefficient about the leading edge, aerodynamic efficiency, and the center of pressure, are
evaluated according to the following relations:
The normal force coefficient:
( )
( ) (1)
The axial force coefficient:
[
( )
( )] (2)
The moment coefficient:
[
( )( )
( )] (3)
The center of pressure:
⁄ ⁄ (4)
𝑐
𝑐
𝑙
𝑙
𝑐
𝑀∞
(3) (1)
𝛼 (2) (4)
Paper: ASAT-15-108-AE
5
The lift coefficient:
(5)
The drag coefficient:
(6)
The aerodynamic efficiency:
⁄ (7)
In the above relations, the reference area and length are the ( ) and ( ),
respectively, both having the value of one. A computer code written in C++ language is
developed to automate the calculations. The code also calculates all local flow properties such
as Mach number, temperature and density ratios (relative to their freestream counterparts)
over the entire airfoil. To validate the code, one case from the work of Ivey et al. [16] is
investigated using the developed code. The validation case is a symmetric diamond-shaped
airfoil of equal leading and trailing-edge angles of placed at incidence in a Mach 4
freestream. Table 1 holds a comparison between the reported and calculated values of local
pressure coefficients and Mach numbers on the four surfaces of the airfoil. The accuracy of
calculations of the code is assumed acceptable.
Table 1 Validation results for the calculation code
Local pressure coefficient Local Mach number
Ivey et al. [16] Code Ivey et al. [16] Code
Forward windward 0.0416 0.042 3.7 3.71
Rearward windward 0.0188 0.019 3.84 3.86
Forward leeward -0.0169 -0.0163 4.16 4.156
Rearward leeward -0.0308 -0.0306 4.33 4.32
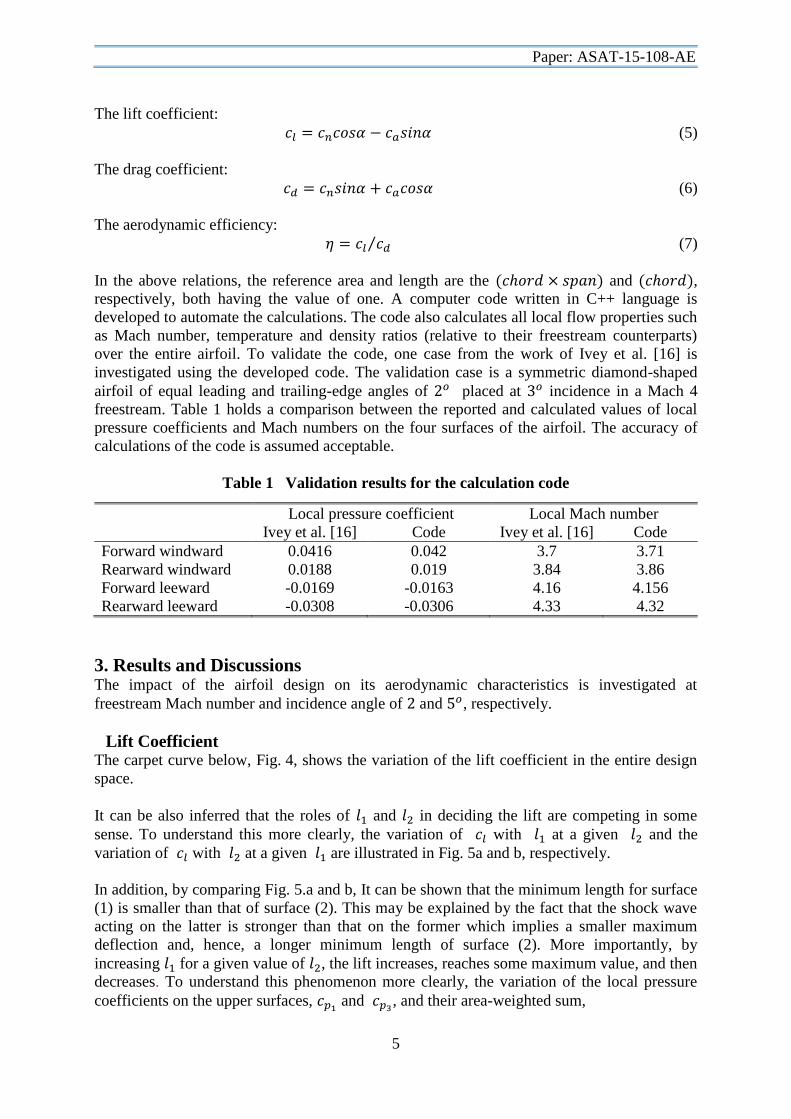
3. Results and Discussions The impact of the airfoil design on its aerodynamic characteristics is investigated at
freestream Mach number and incidence angle of and , respectively.
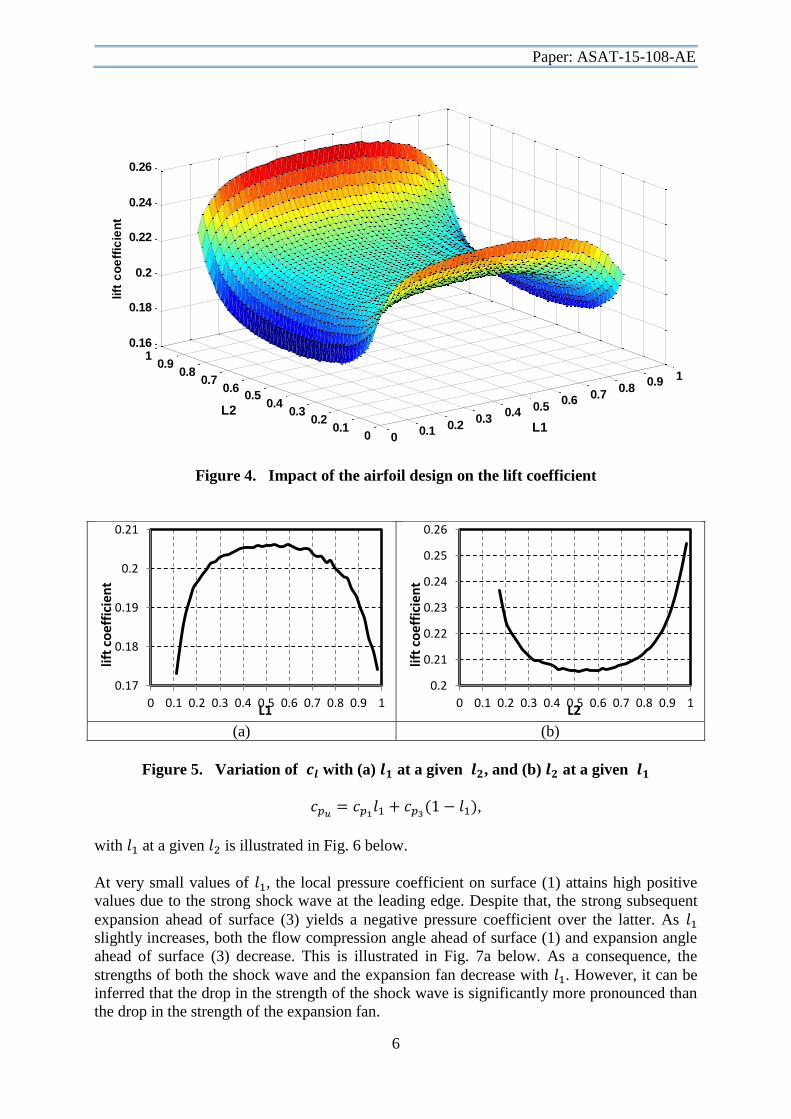
Lift Coefficient The carpet curve below, Fig. 4, shows the variation of the lift coefficient in the entire design
space.
It can be also inferred that the roles of and in deciding the lift are competing in some
sense. To understand this more clearly, the variation of with at a given and the
variation of with at a given are illustrated in Fig. 5a and b, respectively.
In addition, by comparing Fig. 5.a and b, It can be shown that the minimum length for surface
(1) is smaller than that of surface (2). This may be explained by the fact that the shock wave
acting on the latter is stronger than that on the former which implies a smaller maximum
deflection and, hence, a longer minimum length of surface (2). More importantly, by
increasing for a given value of , the lift increases, reaches some maximum value, and then
decreases. To understand this phenomenon more clearly, the variation of the local pressure
coefficients on the upper surfaces, and
, and their area-weighted sum,
Paper: ASAT-15-108-AE
6
Figure 4. Impact of the airfoil design on the lift coefficient
(a) (b)
Figure 5. Variation of with (a) at a given , and (b) at a given
( ),
with at a given is illustrated in Fig. 6 below.
At very small values of , the local pressure coefficient on surface (1) attains high positive
values due to the strong shock wave at the leading edge. Despite that, the strong subsequent
expansion ahead of surface (3) yields a negative pressure coefficient over the latter. As
slightly increases, both the flow compression angle ahead of surface (1) and expansion angle
ahead of surface (3) decrease. This is illustrated in Fig. 7a below. As a consequence, the
strengths of both the shock wave and the expansion fan decrease with . However, it can be
inferred that the drop in the strength of the shock wave is significantly more pronounced than
the drop in the strength of the expansion fan.
00.1 0.2
0.30.4 0.5
0.6 0.70.8
0.9 1
00.1
0.20.3
0.40.5
0.60.7
0.80.9
10.16
0.18
0.2
0.22
0.24
0.26
L1
L2
lift
co
eff
icie
nt
0.17
0.18
0.19
0.2
0.21
0 0.1 0.2 0.3 0.4 0.5 0.6 0.7 0.8 0.9 1
lift
coe
ffic
ien
t
L1
0.2
0.21
0.22
0.23
0.24
0.25
0.26
0 0.1 0.2 0.3 0.4 0.5 0.6 0.7 0.8 0.9 1
lift
coe
ffic
ien
t
L2
Paper: ASAT-15-108-AE
7
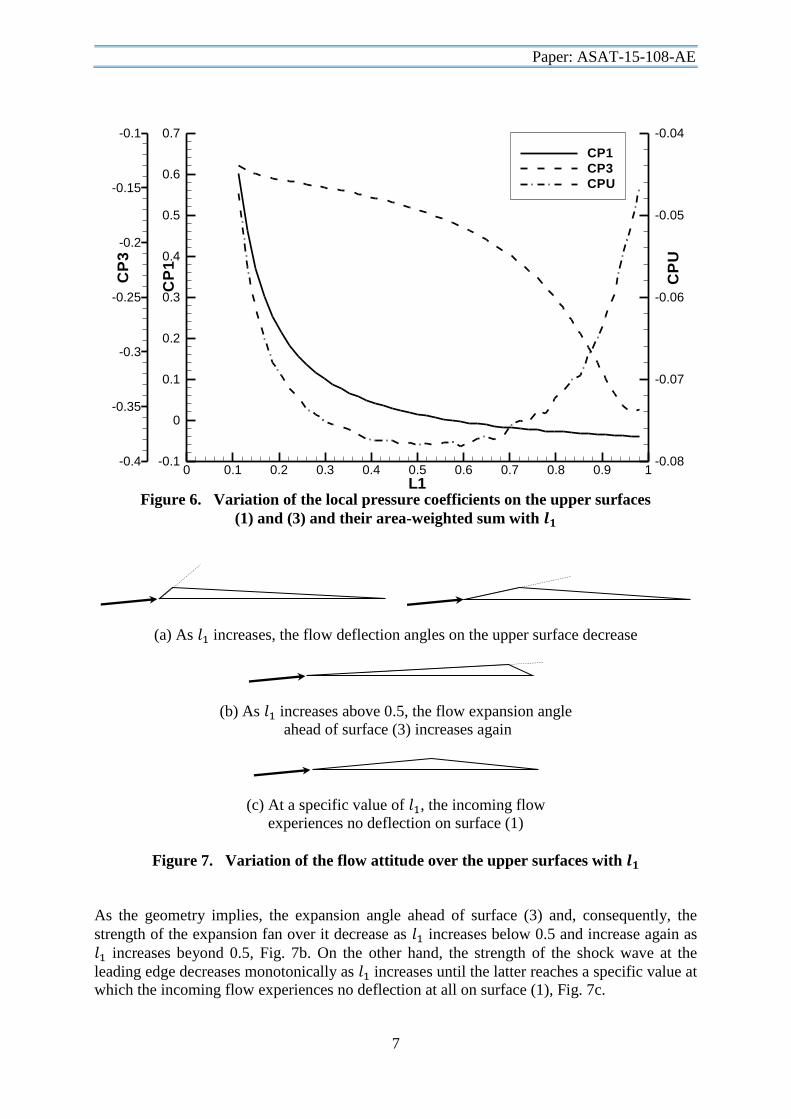
Figure 6. Variation of the local pressure coefficients on the upper surfaces
(1) and (3) and their area-weighted sum with
(a) As increases, the flow deflection angles on the upper surface decrease
(b) As increases above 0.5, the flow expansion angle
ahead of surface (3) increases again
(c) At a specific value of , the incoming flow
experiences no deflection on surface (1)
Figure 7. Variation of the flow attitude over the upper surfaces with
As the geometry implies, the expansion angle ahead of surface (3) and, consequently, the
strength of the expansion fan over it decrease as increases below 0.5 and increase again as
increases beyond 0.5, Fig. 7b. On the other hand, the strength of the shock wave at the
leading edge decreases monotonically as increases until the latter reaches a specific value at
which the incoming flow experiences no deflection at all on surface (1), Fig. 7c.
L1
CP
1
CP
3
CP
U
0 0.1 0.2 0.3 0.4 0.5 0.6 0.7 0.8 0.9 1-0.1
0
0.1
0.2
0.3
0.4
0.5
0.6
0.7
-0.4
-0.35
-0.3
-0.25
-0.2
-0.15
-0.1
-0.08
-0.07
-0.06
-0.05
-0.04
CP1
CP3
CPU
Paper: ASAT-15-108-AE
8
It is also interesting to note that both and
always have negative values even with
highly positive values of . This can be explained recalling that such values of
are
associated with an expansion ahead of surface (3) strong enough to reduce below zero.
Both and the strength of the expansion fan decrease as increases such that
remains
negative. In addition, the high positive values of are associated with small areas of surface
(1) while the corresponding negative values of are associated with large areas of surface
(3). The overall effect of the local pressure coefficients and the areas is that becomes
negative for all values of . Likewise, the overall effect these two factors may explain the rise
in as approaches 1. Since lift is composed primarily from the projection of the pressure
distribution in the normal direction, the trend of with is identical to that of with .
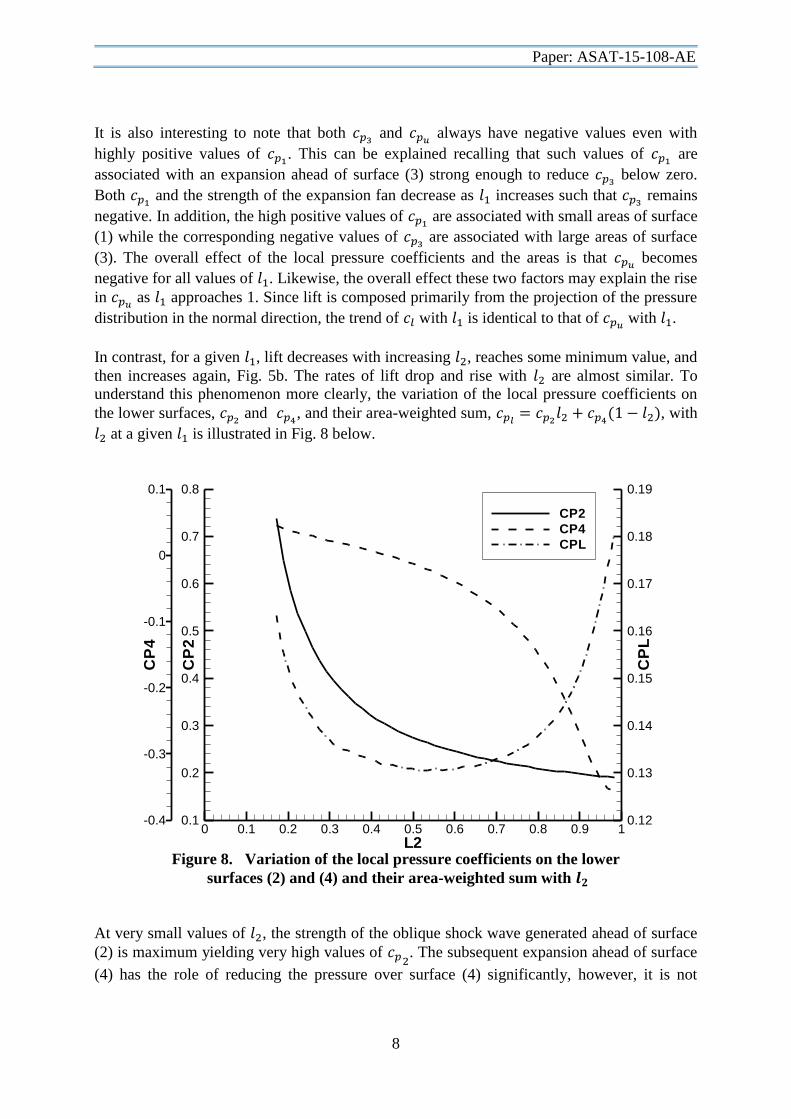
In contrast, for a given , lift decreases with increasing , reaches some minimum value, and
then increases again, Fig. 5b. The rates of lift drop and rise with are almost similar. To
understand this phenomenon more clearly, the variation of the local pressure coefficients on
the lower surfaces, and
, and their area-weighted sum,
( ), with
at a given is illustrated in Fig. 8 below.
Figure 8. Variation of the local pressure coefficients on the lower
surfaces (2) and (4) and their area-weighted sum with
At very small values of , the strength of the oblique shock wave generated ahead of surface
(2) is maximum yielding very high values of . The subsequent expansion ahead of surface
(4) has the role of reducing the pressure over surface (4) significantly, however, it is not
L2
CP
2
CP
4
CP
L
0 0.1 0.2 0.3 0.4 0.5 0.6 0.7 0.8 0.9 10.1
0.2
0.3
0.4
0.5
0.6
0.7
0.8
-0.4
-0.3
-0.2
-0.1
0
0.1
0.12
0.13
0.14
0.15
0.16
0.17
0.18
0.19
CP2
CP4
CPL
Paper: ASAT-15-108-AE
9
strong enough to bring below zero. As increases, the strength of the forward shock
wave decreases, causing both and
to decrease with the latter becoming negative. The
shock wave is always present ahead of surface (1) and thus, remains positive for all values
of . In addition, as increases, the area exposed to increases while the area exposed to
decreases. The overall effects of the pressure coefficients and the associated areas yield
the trend of shown in Fig. 8. Similarly, the trend of with is identical to that of
with .
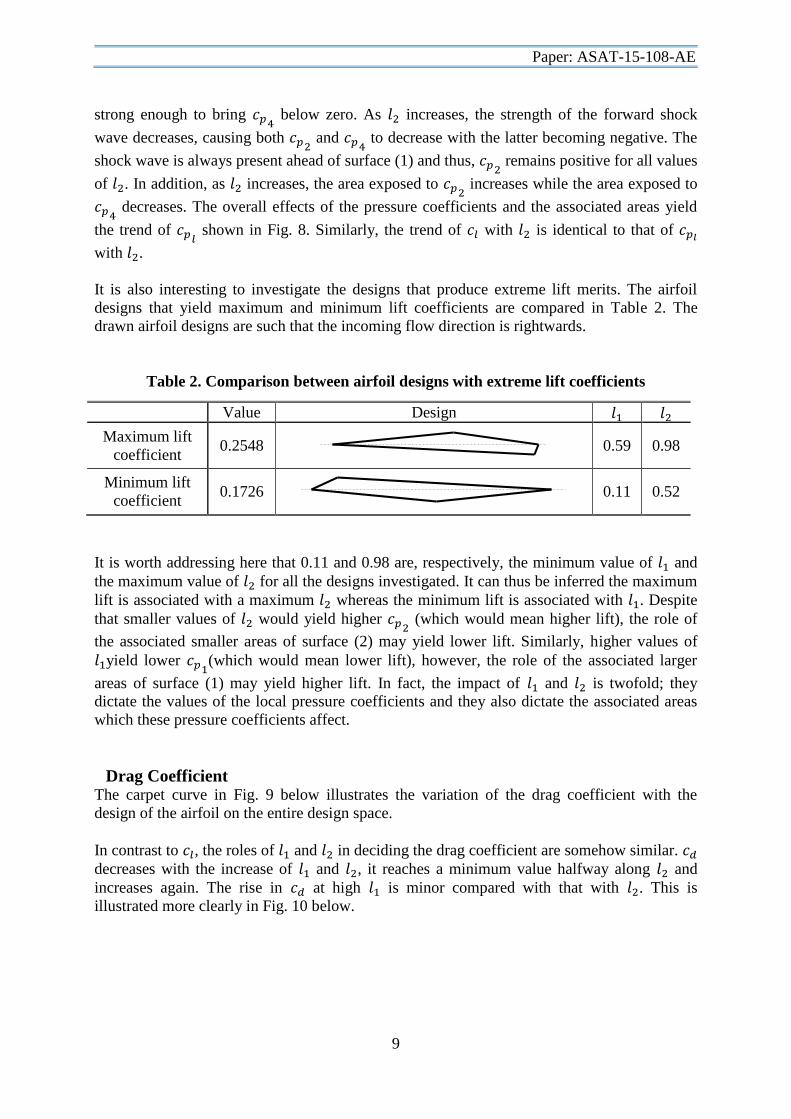
It is also interesting to investigate the designs that produce extreme lift merits. The airfoil
designs that yield maximum and minimum lift coefficients are compared in Table 2. The
drawn airfoil designs are such that the incoming flow direction is rightwards.
Table 2. Comparison between airfoil designs with extreme lift coefficients
Value Design
Maximum lift
coefficient 0.2548
0.59 0.98
Minimum lift
coefficient 0.1726
0.11 0.52
It is worth addressing here that 0.11 and 0.98 are, respectively, the minimum value of and
the maximum value of for all the designs investigated. It can thus be inferred the maximum
lift is associated with a maximum whereas the minimum lift is associated with . Despite
that smaller values of would yield higher (which would mean higher lift), the role of
the associated smaller areas of surface (2) may yield lower lift. Similarly, higher values of
yield lower (which would mean lower lift), however, the role of the associated larger
areas of surface (1) may yield higher lift. In fact, the impact of and is twofold; they
dictate the values of the local pressure coefficients and they also dictate the associated areas
which these pressure coefficients affect.
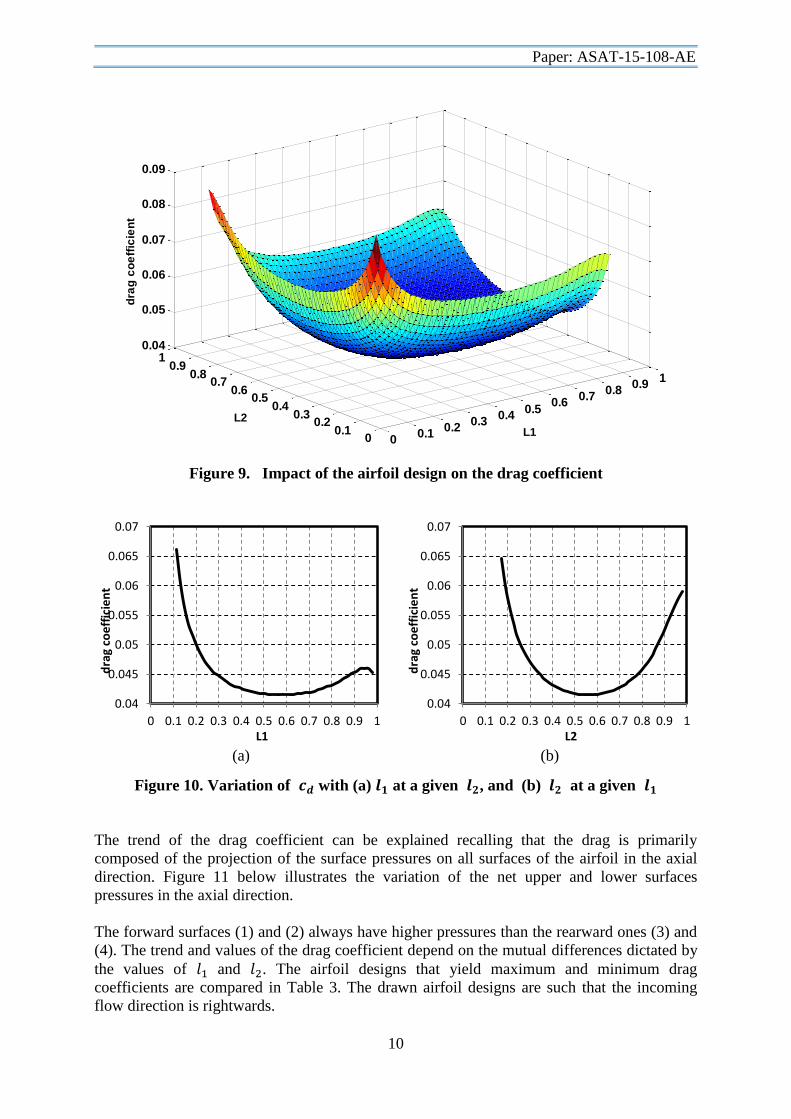
Drag Coefficient The carpet curve in Fig. 9 below illustrates the variation of the drag coefficient with the
design of the airfoil on the entire design space.
In contrast to , the roles of and in deciding the drag coefficient are somehow similar.
decreases with the increase of and , it reaches a minimum value halfway along and
increases again. The rise in at high is minor compared with that with . This is
illustrated more clearly in Fig. 10 below.
Paper: ASAT-15-108-AE
10
Figure 9. Impact of the airfoil design on the drag coefficient
(a) (b)
Figure 10. Variation of with (a) at a given , and (b) at a given
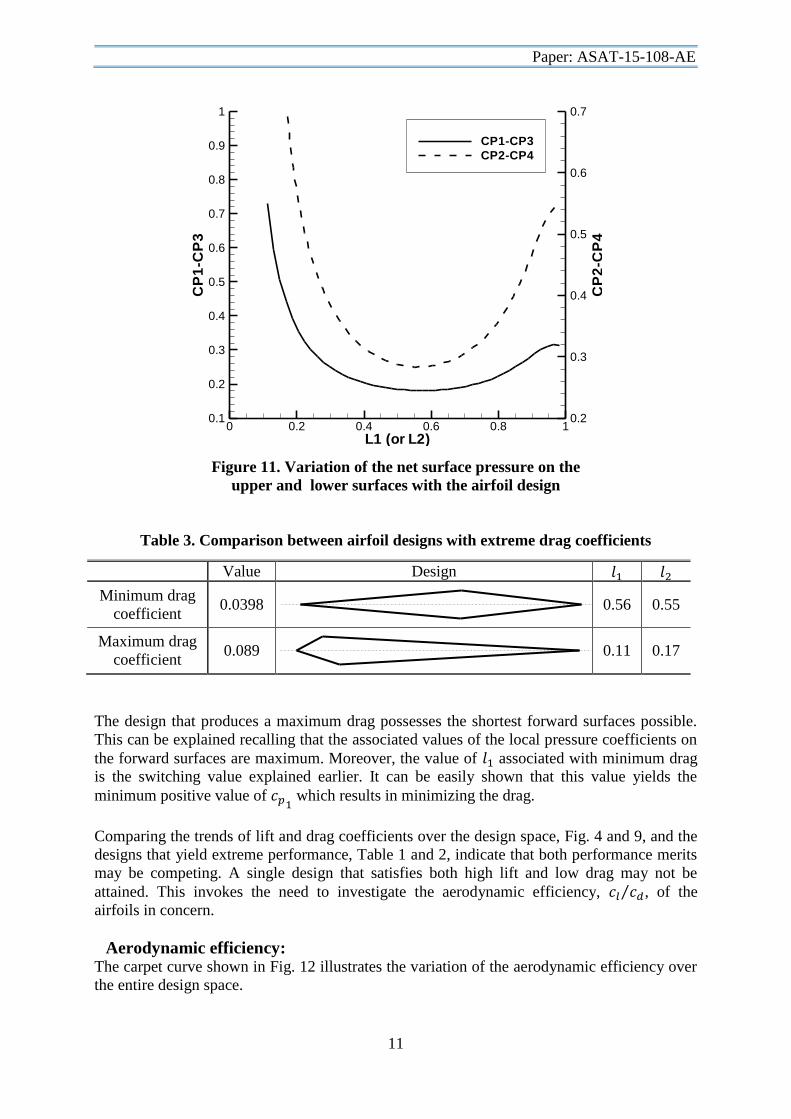
The trend of the drag coefficient can be explained recalling that the drag is primarily
composed of the projection of the surface pressures on all surfaces of the airfoil in the axial
direction. Figure 11 below illustrates the variation of the net upper and lower surfaces
pressures in the axial direction.
The forward surfaces (1) and (2) always have higher pressures than the rearward ones (3) and
(4). The trend and values of the drag coefficient depend on the mutual differences dictated by
the values of and . The airfoil designs that yield maximum and minimum drag
coefficients are compared in Table 3. The drawn airfoil designs are such that the incoming
flow direction is rightwards.
00.1
0.20.3
0.40.5
0.60.7
0.80.9
1
00.1
0.20.3
0.40.5
0.60.7
0.80.9
10.04
0.05
0.06
0.07
0.08
0.09
L1
L2
dra
g c
oe
ffic
ien
t
0.04
0.045
0.05
0.055
0.06
0.065
0.07
0 0.1 0.2 0.3 0.4 0.5 0.6 0.7 0.8 0.9 1
dra
g co
eff
icie
nt
L1
0.04
0.045
0.05
0.055
0.06
0.065
0.07
0 0.1 0.2 0.3 0.4 0.5 0.6 0.7 0.8 0.9 1
dra
g co
eff
icie
nt
L2
Paper: ASAT-15-108-AE
11
Figure 11. Variation of the net surface pressure on the
upper and lower surfaces with the airfoil design
Table 3. Comparison between airfoil designs with extreme drag coefficients
Value Design
Minimum drag
coefficient 0.0398
0.56 0.55
Maximum drag
coefficient 0.089
0.11 0.17
The design that produces a maximum drag possesses the shortest forward surfaces possible.
This can be explained recalling that the associated values of the local pressure coefficients on
the forward surfaces are maximum. Moreover, the value of associated with minimum drag
is the switching value explained earlier. It can be easily shown that this value yields the
minimum positive value of which results in minimizing the drag.
Comparing the trends of lift and drag coefficients over the design space, Fig. 4 and 9, and the
designs that yield extreme performance, Table 1 and 2, indicate that both performance merits
may be competing. A single design that satisfies both high lift and low drag may not be
attained. This invokes the need to investigate the aerodynamic efficiency, ⁄ , of the
airfoils in concern.
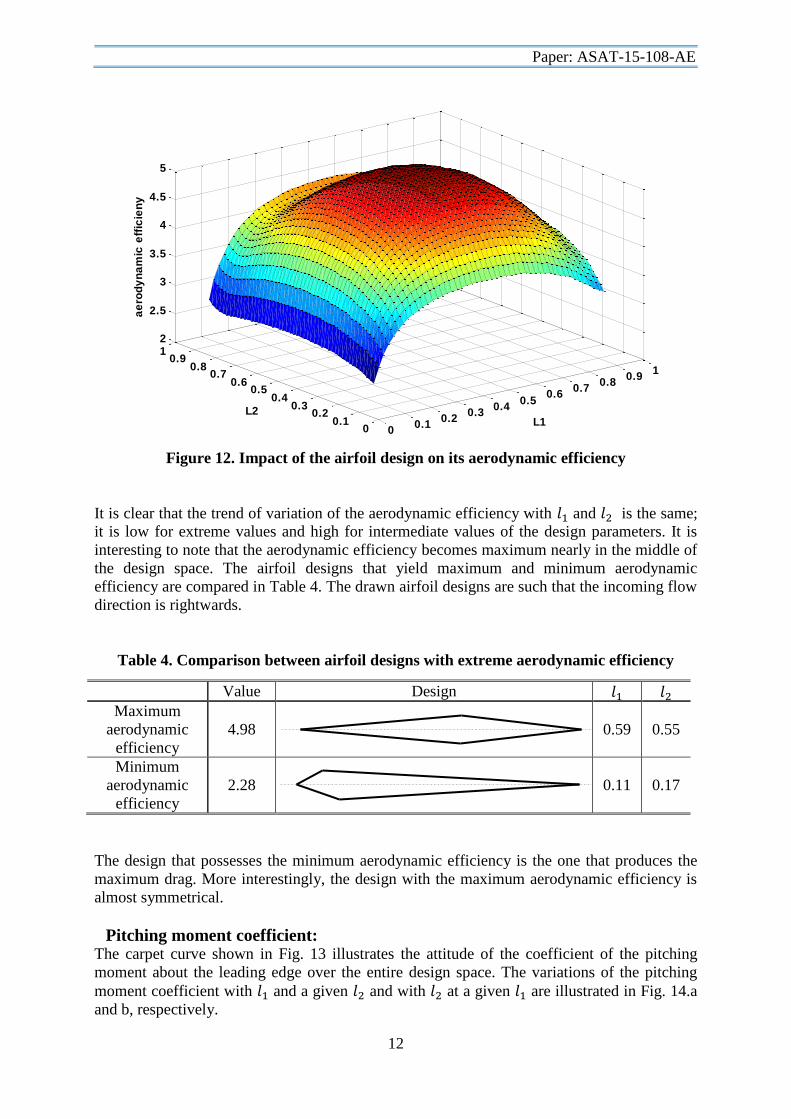
Aerodynamic efficiency: The carpet curve shown in Fig. 12 illustrates the variation of the aerodynamic efficiency over
the entire design space.
L1 (or L2)
CP
1-C
P3
CP
2-C
P4
0 0.2 0.4 0.6 0.8 10.1
0.2
0.3
0.4
0.5
0.6
0.7
0.8
0.9
1
0.2
0.3
0.4
0.5
0.6
0.7
CP1-CP3
CP2-CP4
Paper: ASAT-15-108-AE
12
Figure 12. Impact of the airfoil design on its aerodynamic efficiency
It is clear that the trend of variation of the aerodynamic efficiency with and is the same;
it is low for extreme values and high for intermediate values of the design parameters. It is
interesting to note that the aerodynamic efficiency becomes maximum nearly in the middle of
the design space. The airfoil designs that yield maximum and minimum aerodynamic
efficiency are compared in Table 4. The drawn airfoil designs are such that the incoming flow
direction is rightwards.
Table 4. Comparison between airfoil designs with extreme aerodynamic efficiency
Value Design
Maximum
aerodynamic
efficiency
4.98
0.59 0.55
Minimum
aerodynamic
efficiency
2.28 0.11 0.17
The design that possesses the minimum aerodynamic efficiency is the one that produces the
maximum drag. More interestingly, the design with the maximum aerodynamic efficiency is
almost symmetrical.
Pitching moment coefficient: The carpet curve shown in Fig. 13 illustrates the attitude of the coefficient of the pitching
moment about the leading edge over the entire design space. The variations of the pitching
moment coefficient with and a given and with at a given are illustrated in Fig. 14.a
and b, respectively.
00.1
0.20.3
0.40.5
0.60.7
0.80.9
1
00.1
0.20.3
0.40.5
0.60.7
0.80.9
12
2.5
3
3.5
4
4.5
5
L1L2
ae
rod
yn
am
ic e
ffic
ien
y

Paper: ASAT-15-108-AE
13
Figure 13. Impact of the airfoil design on its pitching moment
(a) (b)
Figure 14. Variation of with (a) at a given , and (b) at a given
While the negative sign of reflects its direction, its absolute value reflects its magnitude. In
general, the magnitude of decreases as increases. The slope of drop increases at high
values of and for very small values of , increases rather than decreases. In contrast, the
magnitude of increases as increases. The slope of rise increases at high values of
and for very small values of , decreases rather than increases. These phenomena can be
understood recalling the combined effect of the local pressure coefficients and the associated
areas. In fact, the impact of and on is threefold; they govern the values of the local
pressure coefficients, their associated areas, and the distance to the airfoil's leading edge. For
instance, as increases, the local pressure coefficient decreases, the area of surface (1)
increases, and the arm of the resultant pressure force to the leading edge increases. The
combined effect of these three factors eventually dictate the value of the pitching moment.
The airfoil designs that yield maximum and minimum pitching moment coefficients are
00.1
0.20.3
0.40.5
0.60.7
0.80.9
1
00.1
0.20.3
0.40.5
0.60.7
0.80.9
1-0.15
-0.125
-0.1
-0.075
-0.05
L1
L2
pit
ch
ing
mo
me
nt
co
eff
icie
nt
-0.1
-0.09
-0.08
-0.07
-0.06
-0.05
0 0.1 0.2 0.3 0.4 0.5 0.6 0.7 0.8 0.9 1
pit
chin
g m
om
en
t co
eff
icie
nt
L1
-0.15
-0.14
-0.13
-0.12
-0.11
-0.1
-0.09
-0.08
0 0.1 0.2 0.3 0.4 0.5 0.6 0.7 0.8 0.9 1
pit
chin
g m
om
en
t co
eff
icie
nt
L2

Paper: ASAT-15-108-AE
14
compared in Table 5. The drawn airfoil designs are such that the incoming flow direction is
rightwards.
Location of the center of pressure: The carpet curve shown in Fig. 15 illustrates the variation of the center of pressure location
over the entire design space.
Figure 15. Impact of the airfoil design on the location of its center of pressure
The center of pressure shifts towards the airfoil leading edge as increases. In contrast,
increasing has the role of shifting the centre of pressure towards the airfoil trailing edge. As
in the case of the pitching moment coefficient, the impact of and on the centre of
pressure location is complicated due to the variation of pressure distribution over the airfoil
surfaces, the associated areas, and the distances to the leading edge. The airfoil designs that
yield maximum and minimum pitching moment coefficients are compared in Table 6. The
drawn airfoil designs are such that the incoming flow direction is rightwards.
Table 5. Comparison between airfoil designs with extreme pitching moment coefficient
Value Design
Maximum
pitching
moment
coefficient
-0.1497 0.26 0.98
Minimum
pitching
moment
coefficient
-0.054 0.98 0.33
00.1
0.20.3
0.40.5
0.60.7
0.80.9
1
00.1
0.20.3
0.40.5
0.60.7
0.80.9
10.2
0.3
0.4
0.5
0.6
0.7
L1
L2
no
rma
liz
ed
ce
ntr
e o
f p
res
su
re

Paper: ASAT-15-108-AE
15
Table 6. Comparison between airfoil designs with extreme center of pressure locations
Value Design
Maximum
location 0.64
0.094 0.983
Minimum
location 0.28
0.9815 0.1541
It is interesting to find out that the values of and are also the extremes. The centre of
pressure becomes closest to the trailing edge if is minimum and is maximum; it becomes
closest to the leading edge if is maximum and is minimum.
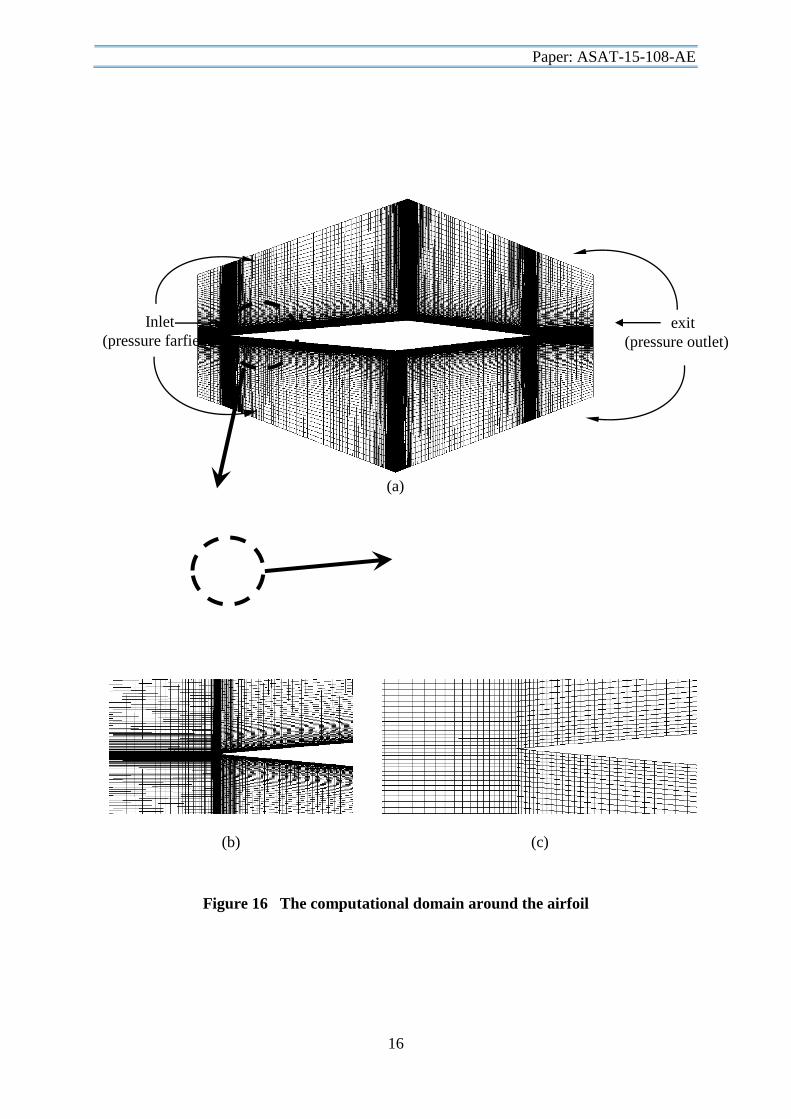
It also useful to explore the details of the flowfield around the form of the airfoils in concern.
This can be exclusively done by making use of computational fluid dynamics (CFD)
techniques. Due to the large number of designs investigated, a sample design is selected for
this purpose. The airfoil that produces the maximum aerodynamic efficiency is taken as the
single case study a commercial CFD code [17] is used. A multi-block structured two-
dimensional grid is constructed around the airfoil. The form of the discretized computational
domain and the definiton of the flow inlet and exit boundaries are illustrated in Fig. 16a. The
grid is designed to be clustered over the airfoil surfaces and at their intersections. Zoom-ins at
the airfoil leading edge are illustrated in Fig. 16b and c.
The steady, inviscid, density-based solver is used for simlating the flow around the airfoil.
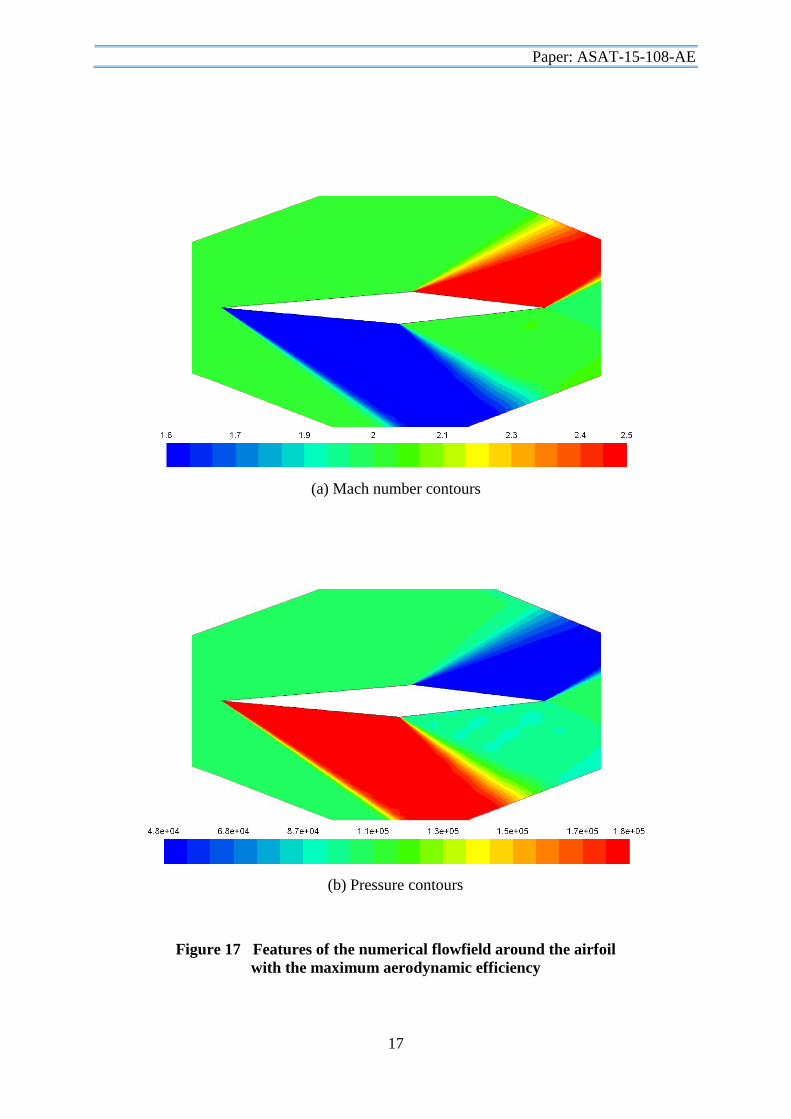
Upon convergence of the numerical solution, the numerical flowfield features can be
displayed. Figure 17 a and b show the Mach and pressure contours around the airfoil,
respectively.
Cleraly, a shock wave is generated ahead of surface (2) as indicated by the sudden change in
the contours color. The flow expands ahead of surfaces (3) and (4) as indicated by the gradual
change in the contours color. It is also interesting to note that the flow experiences neither
expansion nor compression ahead of surface (1) since the deflection angle of this surface is
which is very close to the value of the incidence angle. The value of the aerodynamic
efficiency as calculated by the CFD solver is 4.975 which agrees very closely with that
calculated using the shock-expansion theory, 4.9 (Table 4).
Conclusions In this paper, a parametric study of diamond-shaped supersonic airfoil design has been
conducted based on the results of the shock-expansion theory. It has been shown that the
aerodynamic attitude of the airfoil in terms of the aerodynamic characteristics is strongly
dependent on its design. More interestingly, these aerodynamic characteristics for a given
design have shown a high degree of competition; simultaneously satisfying various
characteristics may be unattainable. This may invoke the need for a multi-objective design
optimization of the airfoil which can be the topic of future studies. Further studies may
involve different airfoil designs such as modified diamond-shaped or hexagonal airfoils. It
should be noted that the results presented in this paper are limited to the potential flow
assumption. Future studies should make use of CFD techniques to solve the flow around the
airfoil more accurately taking the flow viscosity into account.
Paper: ASAT-15-108-AE
16
(a)
(b) (c)
Figure 16 The computational domain around the airfoil
Inlet
(pressure farfield) exit
(pressure outlet)
Paper: ASAT-15-108-AE
17
(a) Mach number contours
(b) Pressure contours
Figure 17 Features of the numerical flowfield around the airfoil
with the maximum aerodynamic efficiency
Paper: ASAT-15-108-AE
18
References [1] Alexander, S. R., "Drag Measurements of Symmetrical Circular-arc and NACA 65-009
Rectangular Airfoils Having an Aspect Ratio of 207 as Determined by Flight Tests at
Supersonic Speed," NACA RM L6J14, March, 1947.
[2] Underwood, W. J. and Nuber, R. J., "Two-dimensional Wind-tunnel Investigation at
High Reynolds Numbers of Two Symmetrical Circular-arc Airfoil Sections with High-
lift Devices," NACA RM L6K22, March, 1947.
[3] Morrissette, R. R., and Oborny, L. F., "Theoretical Characteristics of Two-dimensional
Supersonic Control Surfaces," NACA RM L8G12, July, 1948.
[4] Boyd, J. W., Katzen, E. D., and Frick, C. W., "Investigation at Supersonic Speed
(M=1.53) of the Pressure Distribution over Swept Airfoil of Biconvex Section at
Several Angles of Attack," NACA RM A8F22, September, 1948.
[5] Vincenti, W. G., "Comparison Between Theory and Experiment for Wings at
Supersonic Speeds," NACA Report 1033, May, 1950.
[6] Ulmann, E. F. and Lord, D. R., "An Investigation of Flow Characteristics at Mach
Number 4.04 over 6- and 9-percent-thick Symmetrical Circular-arc Airfoils Having 30-
percent-chord Trailing-edge Flaps," NACA RM L51D30, July, 1951.
[7] Chapman, D. R., "Aerodynamic Characteristics of Bodies at Supersonic Speeds, A
collection of Three Papers: Base Pressure on Wings and Bodies with Turbulent
Boundary Layers," NACA RM A51J25, November, 1951.
[8] Goin, K. L., "Effects of Plan Form, Airfoil Section, and Angle of Attack on the
Pressures Along the Base of Blunt-trailing-edge Wings at Mach Numbers of 1.41, 1.62,
and 1.96," NACA RM L52D21, September, 1952.
[9] Eggers, A. J. Jr., Syvertson, C. A., and Kraus, S., "A Study of Inviscid Flow About
Airfoils at High Supersonic Speeds," NACA Report 1123, January, 1952.
[10] Chapman, D. R., "Airfoil Profiles for Minimum Pressure Drag at Supersonic Velocities
– General Analysis with Application to Linearized Supersonic Flow," NACA Report
1063, October, 1952.
[11] Katzen, E. D., Kuehn, D. M., and Hill, W. A. Jr., "Investigation of the Effects of Profile
Shape on the Aerodynamic and Structural Characteristics of Thin, Two-dimensional
Airfoils at Supersonic Speeds," NACA RM A54B08a, May, 1954.
[12] Dutt, H. N. V. and Sreekanth, A. K., "Design of Supersonic Airfoils by Numerical
Optimization," Computer Methods in Applied Mechanics and Engineering, Vol. 19,
1979, pp. 417-427.
[13] Pittman, J. L., "Supersonic Airfoil Optimization," Journal of Aircraft, Vol. 24, No. 12,
1987, pp. 873- 879.
[14] Tai, T. and Moran, M., "Supersonic Low-density Flow Over Airfoils," AIAA paper 89-
0530, 1989.
[15] Hu, R., Jameson, A., and Wang, Q., "Adjoint Based Aerodynamic Optimization of
Supersonic Biplane Airfoils," AIAA paper 2011-1248, 2011.
[16] Ivey, H. R., Stickle, G. W., and Schuettler, A., "Charts for Determining the
Characteristics of Sharp-Nose Airfoils in Two-Dimensional Flow at Supersonic
Speeds,". NACA TN 1143,1947.
[17] ANSYS 14.5.7 user guide.