investigating the efficiency of indian equity futures … the efficiency of... · investigating the...
TRANSCRIPT

Investigating The Efficiency of Indian Equity Futures Market
Kapil Guptaa
Dr. Balwinder Singhb
Abstract:
The current study investigates the efficiency of the Indian equity futures market. Price
discovery efficiency has been considered as the predominant feature of the efficient futures
market (Telser (1981), Garbade and Sibler (1983)). The current study observed significant
bilateral causality between the S&P CNX NIFTY and S&P CNX NIFTY Futures during June,
2000 and December, 2005. By applying Vector Autoregression (VAR) methodology, it has
been observed that futures market is relatively more efficient as compared to the cash market.
In addition, this papers reports the efficient price discovery through futures market during the
high volatile periods, viz; one year around 11th Sept. 2001 (Terrorist Attack on America) and
17th May, 2004 (Biggest ever stock market crash in India due to unexpected Parliament
election results). Efficient price discovery in the futures market implies that traders can take
significant hedging positions to minimize the risk exposure in the cash market.
a Research Scholar, Department of Commerce and Business Management, Guru Nanak Dev University, Amritsar.Punjab. 143005. Email: [email protected] Reader, Department of Commerce and Business Management, Guru Nanak Dev University, Amritsar. Punjab.143005. Email: [email protected]
Price discovery and risk transfer (i.e. Hedging) have been considered as the pivot
functions of the futures market in all the economies (Telser (1981)). As we know, futures are
the standardized forward contracts which are traded on stock exchanges. Cost-of-Carry model
is followed to determine the price of the futures contract, which implies that futures represent
the prospective price of the underlying asset in the cash market (Garbade and Sibler (1983)).
For example; if the futures is traded at 2500 and the cash market at 2450, (if cost-of-carry
model holds good) it implies that the futures will direct the next price move in the cash market,
thus the next price of the underlying asset will be approximately 2500.
Price discovery is a function of the cost-of-carry model, which implies that price
discovery will be true only if cost-of-carry model holds good (Turkington and Walsh (1999)).
In other words, if at any time the futures are mispriced then lead-lag relationship between
futures and cash market may be disturbed, which will result into wrong decision for the traders
to take position in the cash market on the basis of the price movement in the futures market. In
addition, if the futures are mispriced then hedging through arbitrage positions in the cash and
the futures market will not work in the interest of the traders.
In addition, an efficient cost-of-carry relationship between the futures and cash market
results in the comovement of price series in two markets. Comovement of price series of both
markets is an evidence that price movement in both markets is cointegrated, but evidence of
cointegration does not tell anything regarding the speed of price discovery in the market; rather
it conveys very significant information regarding the strength of the basis (i.e. Futures Price –
Cash Price) (Booth et al., (1999)). If on the date of the maturity of the contract, price series in

two markets converges (see figure I), it implies that cost-of-carry model holds good and both
the series have long run relationship. If reverse holds, then it implies that the futures are
mispriced and may not be an efficient price discovery vehicle (Garbade and Sibler (1983)). For
an efficient convergence on the maturity date the basis is required to be predictable, but
predictable basis does not necessarily imply that speedier price discovery takes place in the
futures market (Fortenbery and Zapata (1997)).
Figure I
Price discovery mechanism refers to absorbing the new information, and reflecting it
into the market prices. Price discovery in the cash market has been a serious issue for debate
for the traders, professionals, regulatory bodies and the academicians. Three different schools
(i.e. Fundamental Analysis, Technical Analysis and Efficient Market Hypothesis) have
emerged to analyze the reaction of the prices to new information. Fama made significant
efforts in this regard and in 1970, he came out with formal definitions of the market efficiency.
He classified the market efficiency into three categories i.e. Weak Form Efficiency, Semi-
Strong Form Efficiency and Strong Form Efficiency.
Futures Price
Equity Price
Price
Timet1 t2 t3

A market is said to be weak form efficient if the current market price and past price are
uncorrelated (i.e. the asset price movements are random). A market is known as semi-strong
efficient, if it absorbs and reflects the market information as well as the public information
(viz; corporate actions, political announcement etc.). Strong form efficient market is one which
neglects the chances of even insiders to make abnormal profits on the basis of first hand
information.
In the developed economies viz; U.S.A. and U.K., markets are found to be efficient but
reverse holds in case of the emerging markets like India, Taiwan, Bangladesh etc. (Mobarek
and Keasey (2000)). Thus in the emerging markets, relative pricing efficiency of the futures
market may work like a lantern in the dark coal mine. If in emerging markets, futures market is
able to react to the market information immediately, when these becomes available then, it will
certainly help the regulators to control the volatility in the cash market and the confidence of
the traders can be restored in a market like India, where people burnt their hands in early and
mid 90’s due to the overwhelming participation in the market by one trader (i.e. Harshad
Mehta). If in India, futures market acts as an efficient price discovery vehicle, traders will be
getting more confidence to trade in the cash market because they will know that futures market
is their to guide their prospective actions in the market and they can protect themselves from
the possible loss by taking (Beta weighted) reverse positions in the futures market (Brannen
and Ulveling (1984)).
Efficient price discovery in the futures market has many advantages for the traders as
well as for the regulators. Traders can manage their risk exposure in the cash market by taking
reverse positions in the futures market. In many stock markets it has been observed that the
volatility in the cash market has reduced in the post futures trading era as compared to the
volatility in the pre futures trading era (Gulen and Mayhew (2000)). Reduction in the
magnitude of volatility will certainly work for the benefit of all traders (both retail as well as
big traders). Reduction in volatility ensures relatively stable price movements in the market,
which will help the traders to take their decision in the market (subject to the experience and
exposure of the trader in the market) (Jong and Donders (1998)). The regulatory bodies can
also be benefited through efficient price discovery in the futures market (Raju and Karande
(2003)). They can simulate the reforms through futures market and then directly implement the
same in the cash market. The reaction of the futures market to such reforms will certainly help
the regulatory bodies to evaluate the probability of success/failure of the reform in the cash
market, thus they can make appropriate modifications, if necessary.
In India, equity futures are of relatively recent origin and were introduced in the phased
manner. In the first phase index futures trading was introduced on 12th June, 2000 and in the
second phase, stock futures trading was permitted on 9th Nov., 2001. The trade volume in both
the markets has been increasing by leaps and bounds. These days significant efforts are being
made to investigate the efficiency of Indian equity futures market. Raju and Karande (2003)
investigated the price discovery efficiency of the Indian equity futures market but they could
not conclude anything on the basis of short time dimension. Gupta and Singh (2006) also made
an attempt to investigate the price discovery efficiency of the Nifty futures by considering
lengthy time frame and their results showed lead-lag relationship between the two markets.
The current study is an attempt to investigate whether Indian equity futures market is
efficient and to study whether it provides any significant information during the high volatility
period. For this purpose the current study has been divided into four sections. First section
reviews the literature, second section discusses the data base and research methodology,
section three discusses the results and section four deals with the summary and policy
implications.
Section I: Review of Literature: Investigation of causal relationship between futures and cash
prices is not a new phenomenon. At the international as well as at national level, significant
efforts have been made to evaluate the price discovery efficiency of different futures markets
(viz; commodity futures, currency futures, equity futures, etc.). Stensis (1983), Garbade and
Sibler (1983), Protopapadakis and Stoll (1983), French (1986), Kawaller (1987), Mohd.
Fatimah (1994), Cheung and Fung (1997), Hall (2001), Yang Jian (2001), Singh (2001),
Thomas and Karande (2001), Sahadevan (2002), Campbell and Diebold (2002), Zhong (2004),
and Isabel and Gilbert (2004) investigated the price discovery efficiency of commodity futures
market in different countries viz; America, United Kingdom, Malaysia, India, Mexico etc.
respectively. All researchers (except for Sahadevan (2002)) found strong lead-lag relationship
between the futures and spot prices.
Granger et al., (1998), Covrig and Melvin (2001), Anderson et al., (2002) and Yan and
Zivot (2004) examined the price discovery efficiency of currency futures market in various
economies like; Hong Kong, Indonesia, Japan, South Korea, Malaysia, Philippines, Singapore,
Thailand, Taiwan, America respectively and they observed strong bilateral causality between
both markets. Moreover, they found that futures market is efficient for underlying currencies,
in the sense that it leads the cash market.
Chan (1992), Hasbrouck (1995), Jong and Donders (1998), Booth (1999), Turkington
and Walsh (1999), Menkveld (2003), Chuang (2003), Raju and Karande (2003), Barclay and
Hendershott (2004), Sharma and Gupta (2005), So and Tse (2005) and Gupta and Singh (2006)
evaluated the prices discovery efficiency of equity futures in different countries namely;
America, Netherlands, Germany, Australia, Taiwan, India, Hong Kong respectively. Except for
Barclay and Hendershott (2004), all researchers observed significant evidence of efficient price
discovery through equity futures market. They all found that equity and futures prices were

cointegrated and the causality from the futures to cash market was significant as compared to
the causality from reverse side.
Citing the above studies makes one thing very clear that investigating the causal
relationship between futures and cash market is not a new phenomenon. For many markets in
different economies at different time frames, price discovery efficiency of the futures market
has been investigated and the review of literature provides strong evidence favoring the
argument that futures market is an efficient price discovery vehicle.
In America, price discovery efficiency of futures market has been far investigated for
all types of futures viz; commodity futures, equity futures and currency futures etc. Stensis
(1983), Garbade and Sibler (1983), French (1986), Chan (1992), Cheung and Fung (1997),
Hall et al., (2001), Yang Jian et al., (2001), Campbell and Diebold (2002) and Isabel and
Gilbert (2004) examined the causal relationship between the spot and futures price on Chicago
Board of Trade (CBOT) and they observed that spot market significantly followed the futures
market and the futures market price movements provides a basis for predicting the prospective
spot market price changes.
In addition to commodity futures, Hasbrouck (1995), Menkveld (2003) and Barclay and
Hendershott (2004) investigated the price discovery efficiency of the equity futures market on
NYSE and NASDAQ during 1993, 1997-98 and 1993-99 and except for Barclay and
Hendershott (2004), all found significant causal relationship between the cash and futures
prices, which is an essential condition for price discovery efficiency of futures market.
Although Barclay and Hendershott (2004) found weak lead-lag relationship between cash and
futures prices but their study does not completely reject the hypothesis rather their results are
statistically significant and have little economic use. Moreover, first order cointegration is one
of the essential features of the cash and futures prices, which reflects that both futures as well
as cash prices are non-stationary as found by different scholars in various speculative markets.
In addition to America, significant efforts have been made to investigate the price
discovery efficiency of the equity futures market in different economies viz, India, Taiwan,
Mexico and Hong Kong. Raju and Karande (2003) investigated the causality relationship
between equity futures and cash market on NSE, but found mixed results regarding the
causality relationship between two markets. The reason for the confusing results may be the
short time period (i.e. Three Years) considered for the study but when the same market was
examined by considering lengthy time frame (i.e. Five Years) by Gupta and Singh (2006), they
found strong bilateral causality between cash and futures market. Moreover by applying
Impulse Response Analysis, they found that the causality from the futures to cash market was
stronger as compared to the causality from cash market to futures market.
Chuang (2003) examined the price discovery efficiency of TAISEX (Taiwan Stock
Exchange Capitalisation Weighted Index Futures) and MSCI (Morgan Stanley Capital
International Taiwan Index Futures) during 1998-99 and found strong statistical evidence of
bilateral causality and inferred that basis movement was an efficient predictor of the
prospective cash market price movements. So & Tse (2005) made an attempt to examine the
causality relationship between cash and futures market on Hang Seng Index Market, and by
considering the time frame of three years (i.e. 1999-2002), they found significant bilateral
causality between these two markets.
Booth et al., (1999) and Upper & Werner (2002) conducted studies on German stock
markets and found strong evidence of information traveling from the futures market to the spot
market and they evidently highlighted and supported the price discovery role of the futures

market. Gulen and Mayhew (2000) conducted a wonderful study considering the behaviour of
cash market prices during the post futures trading era for 25 countries. They observed that
except for America and Japan, in all countries, the magnitude of volatility during post futures
trading era has gone down. Gupta (2001), Shenbagaraman (2003) and Raju and Karnade
(2003) observed the same in Indian capital market. Kiran and Nagaraj (2003) observed that
futures market could do better during the market crash due to terrorist attack on America on
11th Sept.,2001 and concluded that futures market provides better information during the high
volatility period and the basis looks very strong during the high volatility period, which means
that both markets moves into same direction.
Thus, the review of literature provides sufficient evidences that equity futures market
has been an efficient price discovery vehicle. Even in India, the studies conducted by Raju and
Karande (2003) and Gupta and Singh (2006) found significant causal relationship between
these two markets. The current study examines specifically the price discovery efficiency of
Indian equity futures market during high volatility periods i.e. period around 11th Sept., 2001
(Terrorist attack on America) and 17th May, 2004 (Ever highest Indian stock market crash) and
to the best of author’s knowledge, there is no study available which examined the same
hypothesis. Thus, the current study will be of great benefit for the traders and will help to fill
the gap in the literature.
Section II Data Base and Methodology: Index futures on S&P CNX Nifty were permitted for
trading on National Stock Exchange (NSE) on 12th June, 2000. For the purpose of the current
study on price discovery, Index futures on S&P CNX Nifty. Daily closing values of Index
futures and S&P CNX Nifty have been taken from June, 2000 till 31st Dec., 2005 (i.e. 1397
observations), Returns (Rt) have been calculated as log of ratio of present day’s price to
previous day’s price (i.e. Rt = ln (Pt /Pt-1)). Data relating to the price series have been obtained
from website of NSE (www.nseindia.com).
Methodology: A nonstationary time series is said to be integrated in order one, often denoted
by I(1), if the series is stationary after the first-order differencing. An (n x 1) vector time series
Yt is said to be cointegrated if each of the series taken individually is I(1) while some linear
combination of the series A` Yt is stationary for some nonzero vector A (Hamilton, 1994). The
theory of cointegration relates to the study of the efficiency of a futures market in the following
way. Let St be the cash price at time t and Ft-i be futures price taken at i periods before the
contract matures at time t, where i is the number of periods ahead, then some linear
combination of St and Ft-i is expected to be stationary- that is there exist a and b such that Zt is
stationary with mean 0:
Zt = St – a - bFt-i (1)
If both St and Ft-i are I (1), a condition that usually holds for prices, the vector process
(St, Ft-i) is cointegrated. This cointegration between St and Ft-i is a necessary condition for
market efficiency (Lai and Lai (1991)). Cointegration ensures that there exists a long-run
equilibrium relationship between the two series. If St and Ft-i are not cointegrated, they will drift
apart without bound, so that the futures price provides little information about the movement of
the cash price.
In addition to cointegration, market efficiency also requires an unbiased forecast of
futures price on cash price i.e. a = 0 and b =1 in equation (1). Therefore, the market efficiency
should be tested in two steps: first to examine the cointegration relationship between the two
price series St and Ft-i, if cointegration exists then parameters restriction a = 0 and b = 1 is
tested. The second step may consist of multiple tests: a = 0 and b = 1 jointly or each
individually. The constraint b = 1 is a more important indicator of market efficiency, because A

is non-zero under the existence of risk premium and/or transportation costs even when the
market is efficient. That is why we also test them separately through a = 0 and b = 1 are often
tested jointly. The cointegration relationship and the parameter restrictions can be tested using
Johansen’s approach as outlined below.
Cointegration Tests: Before testing for cointegration, each individual price series should be
examined for I (1) first. Phillips-Perron unit root test is the common method (Booth et. al.,
(1999)). If both the futures and cash price series are I (1), Johansen’s cointegration tests can be
conducted. Consider a general kth order VAR model:
K-1
Yt = D + Yt-1 + i Yt-i + t (2)i=1
Where Yt is an (n x 1) vector to be tested for cointegration, and Yt = Yt - Yt-1; D is the
deterministic term which may take different forms such as a vector of zeros or non-zero
constants depending on properties of the data to be tested; and are matrices of coefficients;
and k is chosen so that t is a multivariate normal white noise process with mean 0 and finite
covariance matrix.
The cointegration relationship can be detected by examining the rank of the coefficient
matrix , because the number of cointegration vectors equals the rank of . In particular, the 0
rank i.e. = 0 implies no cointegration. In a bivariable case, i.e. n = 2, the two variables are
cointegrated only if the rank of equals 1 (Johansen and Juselius (1990)).
Johansen (1998) suggested two test statistics to test the null hypothesis that there are at
most r cointegration vectors. The null hypothesis can be equivalently stated as the rank of is
at most r, for r = 0, 1, ….., n-1. The two test statistics are based on trace and maximum
eignvalues, respectively,
K-1
Trace = -T ln(1- i) (3) i=r+1
Max = -T ln(1- r+1) (4)
Where 1 …. r are the r largest squared canonical correlations between the residuals
obtained by regressing Yt and Yt-1 on Yt-1 , Yt-2 , ….., Yt-k-1 and 1 respectively. The
critical values have been taken from Johansen and Juselius (1990).
In our test for efficiency of futures market, Yt = (St, Ft-i), n = 2, and the null hypothesis
should be tested for r = 0 and r = 1. If r = 0 cannot be rejected, we will conclude that there is no
cointegration vector, and therefore, no cointegration. On the other hand, if r = 0 is rejected, and
r = 1 cannot be rejected, we will conclude that there is a cointegration relationship.
Section III: Results and Discussion: Prior to discussing the lead-lag relationship between the
futures and cash markets, table 1 discusses the descriptive statistics of the Indian cash as well
as the futures market and the spread between futures and the cash prices (i.e. Basis). The
results of table 1 clearly show that the futures and cash market returns are asymmetric and
highly volatile. Asymmetry in the cash market and futures market returns is not a new
phenomenon. Risk averse nature of the traders in the market may be the prominent cause for
the asymmetric returns (Moolman (2004)). Asymmetric behavior has been observed in basis as
well, which implies that the comovement of both series does not have constant variance.
Significance of the Jarque-Bera (JB) test statistics does not only imply that the returns are
asymmetric, but it also means that the returns are not normally distributed, which is the
precondition for any market to be efficient in the weak form (Fama (1965), Stevenson and Bear
(1970), Reddy (1997) and Kamath (1998).
Coefficient of Box-Ljung (LB) statistic provides very interesting and useful
information. Basis is predictable for full period as well as for all sub periods. Basis are serially
correlated at 1 % significance level, which means for full period as well as for all sub periods
there is strong comovement between futures market and the cash market. Figure II provides
same information through the plot of futures and cash prices and the spread between these two.
Both futures and cash market shows upward comovement trend and more or less basis seems to
be stationary during the whole period (see table 2). In figure II comovement between cash and
the futures market is so strong that it is very difficult to see the curve of cash and futures
market separately.
Table I Descriptive Statistics

* Significant at 1% level of significance, ** Significant at 5% level of significance and *** Significant at 10% levelof significance.
Comovement of two series is one of the pre-condition for the relatively speedier price
discovery in one market. Comovement of futures and cash market price series implies that long
run relationship exists between both the markets. Johansens cointegration has been applied and
table no. 2 discusses the cointegration results.
Figure II
VARIABLE N MEAN VARIANCE
SKEWNESS
KURTOSIS J-B LB(1)
FUTURES 1397 4.753E-04 2.152E-04 -1.350 14.262 7807.06* 4.615**
CASH 1397 4.854E-04 1.987E-04 -0.976 7.774 1548.42* 19.106*FULL
PERIODBASIS 1397 -1.9116 58.808 -1.219 2.735 350.07* 842.110*
FUTURES 202 -1.17E-03 3.007E-04 -0.901 3.826 32.91* 0.501CASH 202 -1.13E-03 2.998E-04 -0.444 1.440 26.99* 1.469
00-01
BASIS 202 2.1787 47.137 -2.327 9.536 539.17* 76.606*
FUTURES 247 3.464E-05 1.971E-04 -0.597 3.081 14.68* 2.640CASH 247 -3.07E-05 1.979E-04 -0.576 2.428 16.96* 7.175*
01-02
BASIS 247 -3.8506 57.211 -0.922 0.899 80.10* 159.699*
FUTURES 253 -6.04E-04 8.339E-05 0.149 0.230 80.85* 0.392CASH 253 -6.09E-04 9.852E-05 0.101 0.757 52.83* 0.310
02-03
BASIS 253 1.0859 13.368 -0.263 1.282 33.63* 109.726*
FUTURES 252 2.318E-03 2.166E-04 -0.215 -0.244 112.88* 1.477CASH 252 2.324E-03 2.061E-04 -0.347 0.135 91.61* 5.177**
03-04
BASIS 252 0.7010 31.484 0.159 0.348 75.21* 121.703*
FUTURES 253 4.590E-04 3.427E-04 -2.693 27.306 6507.80* 0.004CASH 253 4.451E-04 2.679E-04 -2.290 20.022 3262.61* 17.465*
04-05
BASIS 253 -4.1866 66.822 -1.627 4.781 144.49* 148.207*
FUTURES 190 1.661E-03 1.434E-04 -0.562 0.731 50.49* 0.057CASH 190 1.673E-03 1.165E-04 -0.696 0.866 51.12* 2.337
05-06
BASIS 190 -8.1629 70.736 -3.22 -0.463 421.04* 92.343*
FUTURES 250 -1.09E-03 2.370E-04 -0.836 4.470 51.63* 2.637CASH 250 -1.09E-03 2.469E-04 -0.398 1.830 20.86* 5.404**
One Year Pre11th Sept.,2001 BASIS 250 -0.1248 66.732 -1.624 3.593 113.55* 179.981*
FUTURES 255 1.279E-03 2.526E-04 -0.769 2.865 25.33* 0.094CASH 255 1.260E-03 2.276E-04 -0.832 2.825 29.74* 0.763
One Year Post11th Sept.,2001 BASIS 255 -3.9508 39.033 -0.373 -0.759 156.05* 63.967*
FUTURES 253 1.910E-03 2.572E-04 -0.659 1.550 40.48* 1.145CASH 253 1.922E-03 2.445E-04 -0.863 2.748 32.07* 3.275***
One Year Pre17th May,2004 BASIS 253 -5.83E-02 42.150 -0.353 0.858 53.62* 145.059*
FUTURES 252 2.640E-03 2.673E-04 0.848 10.158 568.19* 0.178CASH 252 2.337E-03 2.036E-04 0.837 7.198 214.47* 1.108
One Year Post17th May,2004 BASIS 252 -6.7853 81.425 -1.651 4.185 129.23* 68.195*

Table 2 Unit Root Test Results
Philips Perron Test ResultsAt Levels First Difference
VariablesWith Drift With Drift and
Trend With Drift With Drift and Trend
Full Period (Close to Close)Futures 2.40 -3.27 -1370.28* -1307.36*
Nifty 2.52 -2.98 -1241.67* -1182.50*
Basis -570.68* -610.13*
2000-01Futures -6.03 -9.87 -75.02* -75.14*
Nifty -6.18 -9.94 -83.97* -84.21*
Basis -98.41* -92.06*
2001-02Futures -6.31 -6.05 -220.03* -215.84*
Nifty -6.65 -6.31 -192.37* -88.19*
Basis -54.34* -59.97*
2002-03Futures -6.24 -6.31 -266.80* -264.19*
Nifty -6.74 -6.88 -251.08* -248.85*
Basis -119.10* -119.63*
2003-04Futures -0.99 -8.08 -228.91* -224.51*
Nifty -0.94 -8.31 -200.82* -197.04*

* Significant at 5 % Significance level. ** Significant at 10 % Significance level.
From table no. 3 it is clear that both markets have stable long run relationship, though
in the short run they may be in the disequilibrium. Presence of the cointegration between two
price series implies that both the series are integrated of order 1, which has already been shown
with the help of unit root testing in table no. 2.
Presence of long run relationship implies that if both the price series contribute to same
nature of information the there may exist causality relationship between these two. For this
purpose Grange Causality test has been applied. Table no. 4 discusses the results of Granger
causality. The results of Granger causality as presented in table no. 4 are very interesting. Bi-
Basis -116.34* -120.11*
2004-05Futures -1.82 -7.77 -216.59* -207.72*
Nifty -1.70 -7.42 -199.57* -190.08*
Basis -92.80* -116.22*
2005-06Futures 0.12 -19.53** -178.56* -176.77*
Nifty 0.25 -17.85 -160.62* -158.85*
Basis -82.15* -85.53*
One Year Pre 11th Sept., 2001Futures -3.70 -15.35 -268.72* -269.02*
Nifty -3.67 -15.77 -241.91* -242.24*
Basis -108.59* -119.95*
One Year Post 11th Sept., 2001Futures -1.39 -27.24* -230.24* -212.37*
Nifty -1.60 -23.75* -223.04* -206.20*
Basis -95.98* -108.71*
One Year Pre 17th May, 2004Futures -2.69 1.46 -250.05* -213.80*
Nifty -2.65 1.41 -227.05* -193.79*
Basis -83.27* -83.32*
One Year Post 17th May, 2004Futures -4.06 -35.65* -199.11* -195.71*
Nifty -2.83 -23.99* -94.03* -100.65*
Basis -199.11* -195.71*

Table 3 Johansens Cointegration Test Resultsc
* Significant at 5% level of significance.
directional causality has been observed, which implies that both futures and cash market
contributes to the price movement in other series. In order to study the extent of causality
between both the markets VAR methodology has been applied, the results of which have been
attached in the appendix.
c Critical values for the Johansens cointegration test have been taken from Johansen S. and K. Juselius (1990).
Vector (r) max TraceFull Period (Close to Close)
0 71.30* 76.10*
1 4.90 4.902000-01
0 49.70* 52.40*
1 2.70 2.702001-02
0 29.70* 33.00*
1 3.30 3.302002-03
0 44.00* 48.50*
1 4.50 4.502003-04
0 42.90* 46.60*
1 3.70 3.702004-05
0 22.20* 22.90*
1 0.70 0.702005-06
0 40.60* 46.00*
1 5.40 5.40One Year Pre 11th Sept., 2001
1 23.50* 26.60*
0 3.10 3.10One Year Post 11th Sept., 2001
1 24.30* 31.20*
0 6.90 6.90One Year Pre 17th May, 2004
1 22.00* 27.70*
0 5.70 5.70One Year Post 17th May, 2004
1 20.80* 24.20*
0 3.50 3.50

Table 4 Granger Causality Results
* Significant at 1% level of significance.
VAR results for the aggregate period (i.e. 2000-2005) clearly shows that both markets
affect each other upto 4 lags (see figure 2(a) and 2(b)), which implies that there is no preferable
market for the traders and they can not rely upon the price movement of the futures
Independent
DependentFutures Cash
Full Period (Close to Close)Futures ---- 16.06*
Cash 17.04* ----2000-01
Futures ---- 13.80*
Cash 13.38* ----2001-02
Futures ---- 11.06*
Cash 10.56* ----2002-03
Futures ---- 13.28*
Cash 13.90* ----2003-04
Futures ---- 25.50*
Cash 24.90* ----2004-05
Futures ---- 37.78*
Cash 34.96* ----2005-06
Futures ---- 20.72*
Cash 18.18* ----One Year Pre 11th Sept., 2001
Futures ---- 11.23*
Cash 11.08* ----One Year Post 11th Sept., 2001
Futures ---- 14.05*
Cash 13.84* ----One Year Pre 17th May, 2004
Futures ---- 29.45*
Cash 29.73* ----One Year Post 17th May, 2004
Futures ---- 26.42*
Cash 25.41* ----

Figure 3 (a)
Figure 3 (b)
market. In figure 3(a) shows that a unit shock in futures market destabilized the cash market
upto 4 lags and thereafter the cash market price curve established. Similar observation can be
made from a unit shock to price series in the cash market and its effect to the futures market, as
shown through figure 3(b). The notable consideration is that cash market reacted
instantaneously from very upward point to a unit shock in the futures market whereas, reverse
seems to be the case of shock to the cash market and its reaction to the futures market.
However, when disaggregate price series were evaluated then significant price
discovery behaviour has been found in few sub periods viz; in 2000-01 futures market lead the
cash market by 4 days (see figure 4(a) and 4 (b)), in 2001-02 by 6 days (see figure 5(a) and 5
(b)), in 2002-03 by 2 day (see figure 6(a) and 6(b)), in 2003-04 by 1 day (see figure 7(a) and
7(b)) and in 2004-05 by 11 days (see figure 8(a) and 8(b)), whereas in 2005-06 (see figure 9(a)
and 9(b)) there is no preferable market available to the traders. These results are very
significant from the traders view point because 2001-02 and 2004-05 witnessed highest

volatility in the capital market. In 2001-02 stock markets crashed due to the terrorist attack in
America on 11th Sept, 2001 and in 2004-05 Indian economy observed Black Monday on 17th
May, 2004 when Indian markets had to be closed due to the ever highest selling pressure
because of unexpected election results.
One Year Pre 11th September, 2001
In order to confirm the impact of these abnormalities in the market and to verify
whether during this period futures market was actually able to provide significant information
regarding the prospective price movements in the cash market, we studied the causality
relationship between the futures and cash market by taking sub periods as one year pre
abnormal event and one year post abnormal event.

One Year Post 11th September, 2001
From above pictures it is clear that during one year prior to the 11 September attack on
America, futures market could lead the cash market by 1 day but during one year after the
attack Indian futures market was leading the cash market by 2 days. Similar evidence has been
observed during 2004-05 when Indian capital market observed biggest ever market crash on
17th May, 2004.
One year prior to 17 May, 2004, futures market was leading the cash market by one
day, whereas one year after the date of abnormality, futures market lead the cash market by 2
days, which supports the evidences available in the literate, that if efficient cost-of carry exists
between futures and cash markets then futures market plays key role to stabilize the cash
market and traders prefer to take hedging positions through futures market. Existence of
cointegration relationship clearly indicates that cost-of-carry relationship between both markets
is efficient and further evidences from the periods of abnormalities implies that when Indian
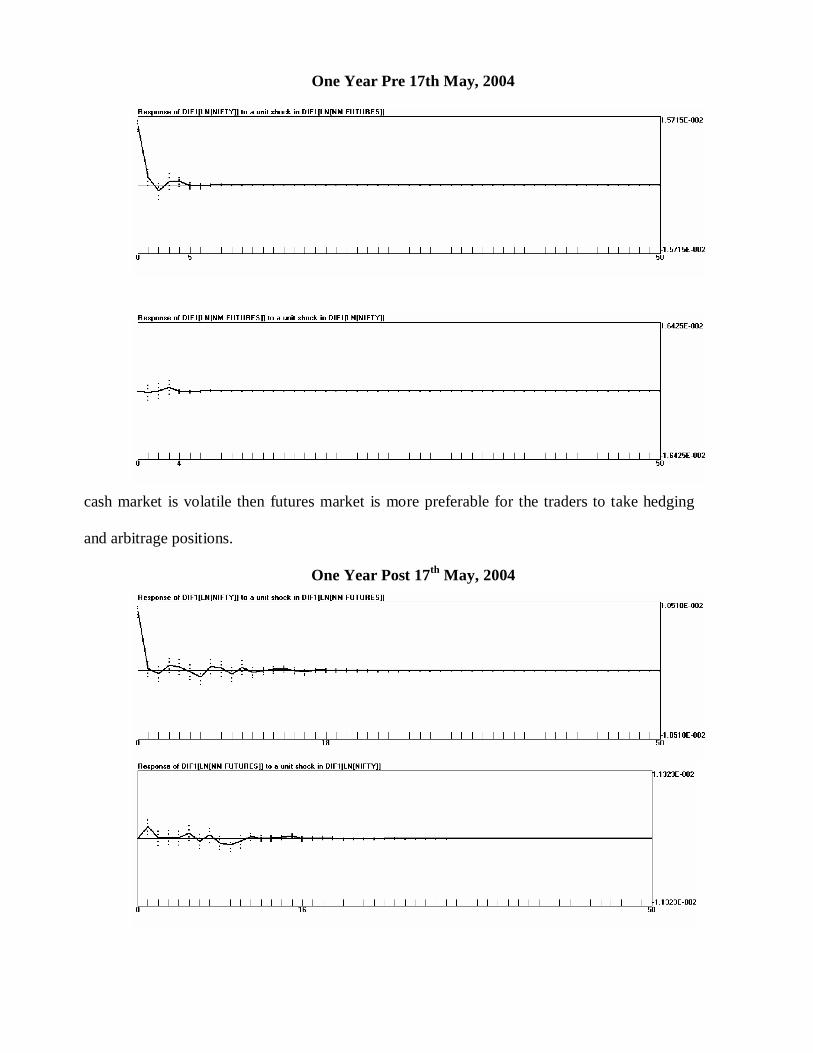
One Year Pre 17th May, 2004
cash market is volatile then futures market is more preferable for the traders to take hedging
and arbitrage positions.
One Year Post 17th May, 2004

Section IV: Summary and Conclusion: Introduction of derivatives in the Indian capital
market had been a very well planned decision. Prior to introducing derivatives in the Indian
capital market, its prospective impacts on the market were thoroughly evaluated; L. C. Gupta
Committee Report and J. R. Verma Committee Reports are one of the significant evidences in
this regard. After thorough review and serious debate on the issue the derivatives were
introduced in five phases viz, in the first phase index futures were introduced, followed by
index options, stock options, stock futures respectively and in the last interest rate futures.
Shenbagaraman (2003), Raju and Karande (2003) and Bandivadekar and Ghosh (2005)
observed significant decline in the spot market volatility during the post futures treading era.
The current study provides significant support to the decline in volatility hypothesis by
evaluating the price discovery performance of Indian equity futures market during the period of
high volatility. The results of the study are beneficial for the traders as well as the regulators.
The above results assures the traders that in the event of high fluctuations in the market
they can rely upon the direction of the futures market because it would provide them
significant information regarding the prospective move in the cash market. Thus the retail as
well as Indian institutional traders can design their portfolio and can take positions in the
futures market to safeguard themselves from the fluctuations in the cash market. In addition,
the regulators will in advance come to know regarding the prospective price movement in the
cash market and when they feel market overreacting to the information, they can take
appropriate action in the interest of the common investor. Moreover from the price movements
in the futures market they can adjudge the expected volatility in the cash market.
Thus on the basis of above observations, it can be concluded that Indian futures market
is an efficient price discovery vehicle and it will certainly help the traders to take hedging and
arbitrage positions to secure maximum returns at minimum risk exposure. In addition, the
contribution of the futures market to minimize the volatility of the cash market is an important
implication of the efficient price discovery. Though futures market has been found relatively
efficient price discovery vehicle but investigation of the behaviour of spread between the
futures and cash market (i.e. Basis) will provide significant information regarding the exact
extent of price discovery of the Indian equity futures market.
References:1. Anderson, G. T. et al., (2002),“Micro Effects of Macro Announcements: Real-Time Price
Discovery in Foreign Exchange,” The Rodney L. White Center for Financial Research, TheWharton School, University of California, 1-26.
2. Bandivadekar S. and Ghosh S. (2005),“Derivatives and Volatility on Indian Stock Markets,RBI Ocassional Papers.
3. Barclay, J. M. and Hendershott, T. (2004),“Comparison of Trading and Non-TradingMechanisms of Price discovery,” http://faculty.haas.berkeley.edu/hender/ After_Hours_Over_Time.pdf., 1-24.
4. Booth G. G. et al., (1999),“Price Discovery in the German Equity Index DerivativeMarkets,” The Journal of Futures Market, Vol. 19, No. 6, 619-643.
5. Brannen, P. P. and Ulveling, F. E. (1984),“Considering an Informational Role for a FuturesMarket,” the Review of Economic Studies, Vol. 51, No. 1, 33-52.
6. Campbell D. S. & Diebold X. F. (2002),“Weather Forecasting for Weather Derivatives,”Working Paper, The Wharton School, University of Pennsylvania, The Rodney L. WhiteCentre for Financial Research, 1-43.
7. Chan, K. (1992),“A Further Analysis of the Lead-Lag Relationship Between the CashMarket and Stock Index Futures Market,” The Review of Financial Studies, Vol. 5, No. 1,123-152.
8. Cheung, W. Y and Fung, G. H. (1997),“Information Flows Between Eurodollar Spot andFutures Markets,” Multinational Finance Journal, Vol. 1, No. 4, 255-271.
9. Chuang, Chung-Chu (2003),“International Information Transmissions Between StockIndex Futures and Spot Markets: The Case of Futures Contracts Related to Taiwan Index,”Journal of Management Science, Vol. 19, No. 1, 51-78.
10. Covrig, V. and Melvin, M. (2001),“Asymmetric Information and Price Discovery in the FXMarket: Does Tokyo know more About the Yen?,” Journal of Empirical Finance, Vol. 9,271-285.
11. Fama, E. F. (1965),“The Behavior of Stock-Market Prices,” The Journal of Business, Vol.38, No. 1, 34-105.
12. Fama, E. F. (1970),“Efficient Capital Markets: A Review of Theory and Empirical Work,”Journal of Finance, Vol. 25, No. 2, 383-417.

13. Fortenbery T. R. and Zapata H. O. (1997),“An Evaluation of Price Linkages BetweenFutures and Cash Markets For Cheddar Cheese,” The Journal of Futures Markets, Vol. 17,No. 3, 279-301.
14. French, R. K. (1986),“Detecting Spot Price Forecasts in Futures Prices,” The Journal ofBusiness, Vol. 59, No. 2, Part 2, S39 - S54.
15. Garbade, D. K. and Sibler, L. W. (1983),“Price Movements and Price Discovery in Futuresand Cash Markets,” The Review of Economics and Statistics, Vol. 65, No. 2, 289 - 297.
16. Granger, C. W. J. et al., (1998),“A Bivariate Causality Between Stock Prices and ExchangeRates: Evidence from Recent Asia Flu,” Discussion Paper, Deptt. of Economics, Universityof California, San Diego, 1-24.
17. Gulen, H. and Mayhew, S. (2000),“Stock Index Futures Trading and Volatility inInternational Equity Markets,” The Journal of Futures Markets, Vol. 20, No. 7, 661-685.
18. Gupta, K. and Singh, B. (2006),“Price Discovery and Causality in Spot and futures Marketin India,” ICFAI Journal of Derivatives Market, Vol. III, No. 1, 30-41.
19. Hall, D. A. et al., (2001),“Migration of Price Discovery with Constrained Futures Market,”Research Paper Series, No. 70, Quantitative Finance Research Center, University ofTechnology, Sydney, 1-37.
20. Hamilton J. D. (1994),“Time Series Analysis, Princeton University Press, Princeton, NewJersey.
21. Hasbrouck, J. (1995),“One Security, Many Markets: Determining The Contribution toPrice Discovery,” The Journal of Finance, Vol. 50, No. 4, 1175-1199.
22. Isabel, F. F. and Gilbert, L. C. (2004),“Price Discovery in European Aluminium Market,”Discussion Paper No. 6, Department of Economics, University Degli Studi, 1-24.
23. Johansen S. and K. Juselius (1990),“Maximum Likelihood Estimation and Inference onCointegration-with Applications to the Demand for Money,” Oxford Bulletin of Economicsand Statistics, Vol. 52, 169-210.
24. Jong, De F. and Donders, M. W. M. (1998),“Intraday Lead-Lag Relationships Between theFutures, Options and Stock Market,” European Finance Review, Vol. 1, 337-359.
25. Kamath R. R. et al., (1998),“Return distribution and the Day-of-the-Week Effects in theStock Exchange of Thailand,” Journal of Economics and Finance, Vol. 22, No. 2-3, 97-106.
26. Kawaller, G. Ira et al., (1987),“The Temporal Price Relationship Between S&P 500 Futuresand the S&P 500 Index,” The Journal of Finance, Vol. 42, No. 5, 1309 -1329.
27. Kiran K. K. and Nagaraj K. S. (2003),“Index Futures Trading and Spot Market Volatility:Evidence From an Emerging Market,” Proceedings of International Conference, 2003 onBusiness and Finance, Vol., III, 307-325.
28. L. C. Gupta (1998),“Report of the Committee on Derivatives,” Securities and ExchangeBoard of India, 1-53.
29. Lai, K. S. and Lai, M. (1991),“A Cointegration Test for Market Efficiency,” The Journal ofFutures Markets, Vol. 11, 567-575.

30. Menkveld, J. A. et al., (2003),“Modelling Round-the Clock Price Discovery for Cross-Listed Stocks using State Space Methods,” Working Paper, Vrije Universiteit, Amsterdam,1-28.
31. Mobarek, A. and Keasey, K. (2000),“Weak-Form Market Efficiency of an EmergingMarket: Evidence from Dhaka Stock Market of Bangladesh,” Paper Presented at the ENBSConference held on Oslo, May 2000, 1-30.
32. Mohd. Fatimah et al., (1994),“The Efficiency of the Crude Palm Oil Futures Market inEstablishing Forward Prices,” Journal of Malaysian Agricultural Economics, 8, 25-39.
33. Moolman H. C. (2004),“An Asymmetric Econometric Model of the South African StockMarket,” Ph. D Thesis submitted to Faculty of Economics and Management Science atUniversity of Pretoria, 1-195.
34. Protopapadakis, A. and Stoll, R. H. (1983),“Spot and Futures Prices and the Law of OnePrice,” The Journal of Finance, Vol. 38, No. 5, 1431-1455.
35. Raju, M. T. and Karande, K. (2003),“Price Discovery and Volatility on NSE FuturesMarket,” SEBI Working Paper No. 7, 1-17.
36. Reddy, S. Y. (1997),“Efficiency of Indian Stock Markets: An Empirical Analysis of Weak-Form EMH of the BSE,” UTI Indian Capital Market Conference December, 91-115.
37. Sahadevan, K. G. (2002),“Derivatives and Risk Management: A Study of AgriculturalCommodity Futures in India,” Research Project Report, Indian Institute of Management,Lucknow, 1-21.
38. Sharma, S. and Gupta, K. (2005),“Determinants of Futures Pricing-An EconometricalAnalysis,” In Balwinder Singh and Jaspal Singh (Ed.), “Securities Market Operation andReforms,” Deep and Deep Publications Pvt. Ltd., 38-46.
39. Shenbagaraman P. (2003),“Do Futures and Options Trading Increase Stock MarketVolatility,” http://www.nseindia.com/content/research/Paper60.pdf.
40. Singh, J. R. (2001),“Weak Form Efficiency of Indian Commodity Futures,” UTI IndianCapital Market Conference December, 3-23.
41. So, W. R. and Tse, Y. (2005),“Price Discovery in the Hang Seng Index Markets: Index,Futures, and the Tracker Fund,” The Journal of Futures Markets, Vol. 24, No. 9, 887-907.
42. Stensis, E. A. et al., (1983),“The Futures Market and Price Discovery in the TextileIndustry,” American Journal of Agricultural Economics, Vol. 65, No. 2, 308-310.
43. Stevenson, A. R. and Bear, M. R. (1970),“Commodity Futures: Trends or RandomWalks?,” The journal of Finance, Vol. 25, No. 1, 65-81.
44. Telser G. Lester (1981),“Why there Are Organized Futures Markets,” Journal of Law andEconomics, Vol. 24, No. 1, 1-22.
45. Thomas, S. and Karande, K. (2002),“Price Discovery Across Multiple Spot and FuturesMarkets,” Proceedings of Capital Market Conference, 2002, UTI Institute of CapitalMarket, 1-26.
46. Turkington, J. and Walsh, D. (1999),“Price Discovery and Causality in the AustralianShare Price Index Futures Market,” Australian Journal of Management, Vol.24, No. 2, 97-113.
47. Upper, C. and Werner, T. (2002),“Time-Varying Information Share in the Bund Market,”Discussion paper, 24/02, Economic Research Centre of the Deutsche Bundes Bank, 1-23.
48. Yan, B. and Zivot, E. (2004),“The Dynamics of Price Discovery,” AFA, 2005, PhiladelphiaMeeting, Social Science Research Network (SSRN), 1-74.
49. Yang, J. et al., (2001),“Asset Storability and Price Discovery in Commodity FuturesMarkets: A New look,” Journal of Futures Market, Vol.21, 279 - 300.
50. Zhong M. et al., (2004),“Price Discovery and Volatility Spillovers in Index FuturesMarkets: Some Evidence from Mexico,” Journal of Banking and Finance, Vol.28, Issues12, 3037-3054.

Appendix
Figure 4 (a)
Figure 4 (b)
Figure 5(a)
Figure 5 (b)

Figure 6 (a)
Figure 6 (b)
Figure 7 (a)
Figure 7 (b)
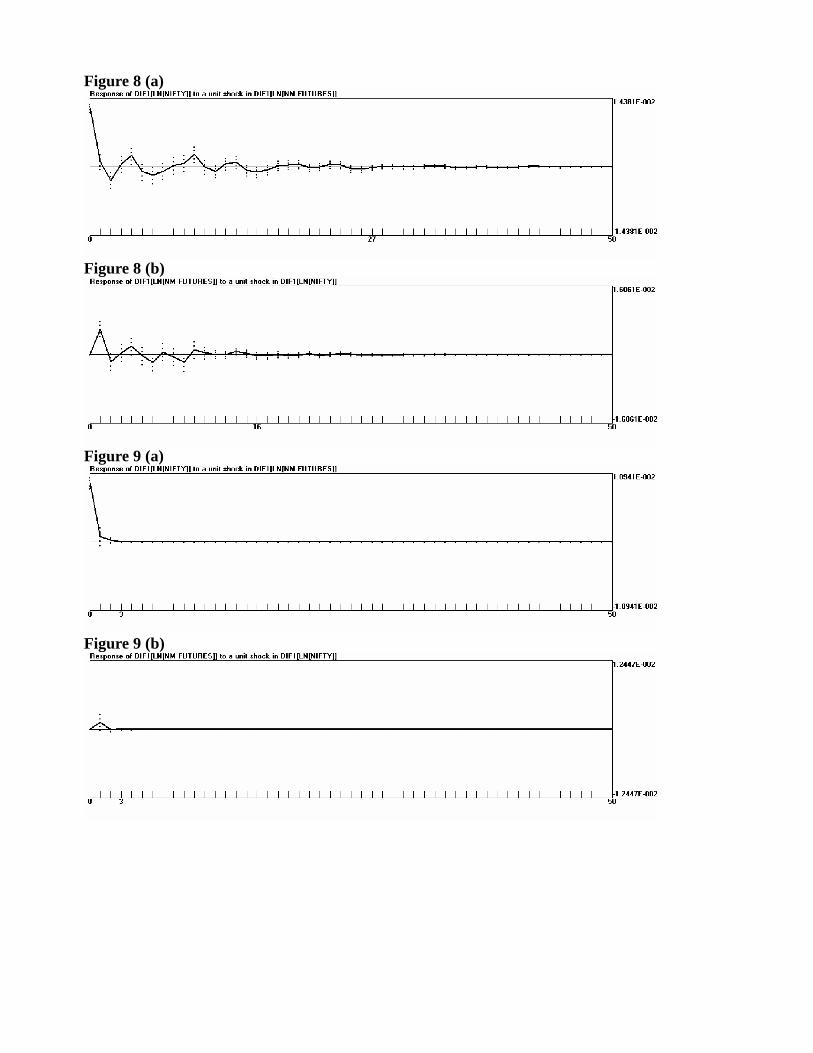
Figure 8 (a)
Figure 8 (b)
Figure 9 (a)
Figure 9 (b)