investigating the factors affecting readiness for lean ... · 2.15.5 the kuwaiti industrial context...
TRANSCRIPT

Investigating the factors affecting
readiness for lean system adoption
within Kuwaiti small and medium-
sized manufacturing industries
Mohamad AL-Najem
The thesis is submitted in partial fulfilment of the requirements for the award
of the degree of Doctor of Philosophy of the University of Portsmouth
February 2014

I
Abstract
The central belief in lean systems (LS) is that the implementation of lean
practices will reduce different type of wastes. However, LS implemented without an
evaluation of organisational readiness may lead to failure. In this study, a
measurement framework to evaluate the lean readiness (LR) and LS within Kuwaiti
small and medium-sized manufacturing industries (K-SMMIs) has been developed.
This measurement framework encompasses the quality and management practices
related to LS (processes; planning and control; human resources (HR); top
management and leadership; customer relations; and supplier relations) to assess the
practices in K-SMMIs and determine whether they have the foundation to implement
LS.
Mixed methods are adopted in this study, including quantitative approaches
(questionnaire administered to 50 K-SMMIs and structured observation conducted in
27 K-SMMIs), and qualitative approaches (two case studies (observation and semi-
structured interviews with staff of various levels), and semi-structured interviews
with 27 managers of K-SMMIs and 26 experts). In addition, a comprehensive
literature review has been carried out. The findings indicate that current quality and
management practices within K-SMMIs are not very supportive towards LS. Many
factors are revealed, both external and internal, that affect K-SMMIs with respect to
LS readiness, including language barriers, and deficiencies in aspects including
quality workers in terms of education and skills; technology; government attention;
know-how regarding LS; market competitiveness; and urgency for adopting LS.
This LS and LR measurement framework relating to K-SMMIs provides a
unique effort in the area of lean system, and the study’s findings can be used as an
internal checklist prior to and during LS implementation. However, this research
study contains some obvious limitations, such as very limited information being
available on LS and quality initiatives in Kuwait, and small sample size. Further, the
LR framework should be tested in small and medium-sized manufacturing industries
that have successfully used LS, in order to provide a benchmark.
Keywords – Lean system, Kuwaiti small and medium-sized manufacturing
industries, lean assessment framework, critical success factors, lean readiness,

II
Kuwait, national culture, organisational culture, Toyota production system, small
and medium-sized enterprises.

II
Table of Contents
Abstract ........................................................................................................................ I
Table of Contents ........................................................................................................ II
Declaration ................................................................................................................. IX
List of tables ................................................................................................................ X
List of figures .......................................................................................................... XIII
Abbreviation ............................................................................................................ XIV
Glossary ................................................................................................................... XV
Acknowledgements ................................................................................................. XVI
Dissemination ........................................................................................................ XVII
Chapter One Introduction ........................................................................................ 1
1.1 Introduction ................................................................................................... 1
1.2 Background, and the need for this study ....................................................... 3
1.3 Aims and objectives ...................................................................................... 7
1.4 Gaps and motives .......................................................................................... 7
1.5 Research questions ........................................................................................ 8
1.6 Research hypotheses ...................................................................................... 8
1.7 Research methodology .................................................................................. 9
1.8 Expected contribution and originality of the research ................................. 10
1.9 Implications ................................................................................................. 11
1.10 Organisation of the thesis ........................................................................ 11
Chapter Two Literature Review ............................................................................. 14
2.1 Introduction ................................................................................................. 14
2.2 Overview of lean system ............................................................................. 14
2.3 Definition of lean ......................................................................................... 17
2.4 Benefit of LS ............................................................................................... 20
2.5 Eight wastes associated with LS ................................................................. 21

III
2.5.1 Defects.................................................................................................. 23
2.5.2 Overproduction .................................................................................... 24
2.5.3 Waiting ................................................................................................. 24
2.5.4 Wasted talent ........................................................................................ 25
2.5.5 Transport .............................................................................................. 26
2.5.6 Inventory .............................................................................................. 26
2.5.7 Motion .................................................................................................. 27
2.5.8 Overprocessing ..................................................................................... 28
2.6 Lean principles ............................................................................................ 28
2.6.1 First principle: Specify value ............................................................... 30
2.6.2 Second principle: Identify the value stream ......................................... 31
2.6.3 Third principle: Create flow ................................................................. 31
2.6.4 Fourth principle: Respond to customer pull ......................................... 32
2.6.5 Fifth principle: Pursue perfection......................................................... 33
2.7 Lean tools (lean building blocks) ................................................................ 34
2.7.1 5S ......................................................................................................... 34
2.7.2 Just-in-time (JIT) .................................................................................. 35
2.7.3 Total productive maintenance (TPM) .................................................. 35
2.7.4 Value Stream Map (VSM) ................................................................... 36
2.7.5 Kaizen .................................................................................................. 37
2.7.6 Standardised work ................................................................................ 38
2.7.7 Visual management (VM) or visual control (VC) ............................... 38
2.7.8 Cellar design......................................................................................... 39
2.7.9 Quick changeover, Single Minutes Exchange of Dies (SMED) and set-
up reduction) ...................................................................................................... 39
2.7.10 Pull system ........................................................................................... 39
2.7.11 Point of use storage (POUS) ................................................................ 40
IV
2.7.12 Batch sized reduction ........................................................................... 40
2.8 Toyota system .............................................................................................. 41
2.8.1 First pillar: Respect for people ............................................................. 43
2.8.2 Second pillar: Continuous Improvement (CI) ...................................... 46
2.8.3 What Toyota’s culture looks like ......................................................... 49
2.9 Lean within the SME context ...................................................................... 54
2.9.1 The role of the SMEs in economies ..................................................... 55
2.10 Inhibiting factors for SMEs that may prevent the implementation of lean
system ................................................................................................................. 57
2.10.1 Enabling factors for SMEs that may help them to adopt LS................ 60
2.10.2 Applicability of lean systems within the SME context ........................ 66
2.11 Requirements, CSFs and barriers associated with LS ............................. 71
2.11.1 Essential requirements for implementing lean systems ....................... 72
2.11.2 Barriers and obstacles .......................................................................... 76
2.11.3 CSFs for LS .......................................................................................... 77
2.12 Organisational culture .............................................................................. 86
2.13 National culture........................................................................................ 92
2.13.1 What kind of national culture does lean system require? .................... 93
2.14 How can LS be assessed? ...................................................................... 100
2.14.1 Review of lean assessment framework .............................................. 101
2.15 The context of Kuwait ........................................................................... 113
2.15.1 Kuwait’s historical background ......................................................... 114
2.15.2 The effect of religion on the management system ............................. 115
2.15.3 Managerial problems in Kuwait ......................................................... 116
2.15.4 Family and non-family businesses, and their affects on promoting
improvement .................................................................................................... 120
2.15.5 The Kuwaiti industrial context ........................................................... 122
2.15.6 Kuwaiti small and medium sized enterprises (K-SMEs) ................... 123

V
2.15.7 Government support for SMEs .......................................................... 124
2.15.8 Potential barriers that contribute to delaying the development of K-
SMEs ............................................................................................................ 125
2.15.9 Kuwaiti business environment ........................................................... 130
2.15.10 Quality initiatives in Kuwait .......................................................... 135
2.15.11 Can ISO 9000 help K-SMMIs to implement LS? .......................... 138
2.16 Chapter summary ................................................................................... 139
Chapter Three Development of the LR framework ............................................ 142
3.1 Introduction ............................................................................................... 142
3.2 Importance of assessing the organisational readiness ............................... 146
3.3 Measurement framework ........................................................................... 146
3.4 Lean readiness measurement framework .................................................. 147
3.4.1 Category 1: Processes ........................................................................ 149
3.4.2 Category 2: Planning and control ....................................................... 151
3.4.3 Category 3: Customer relations .......................................................... 153
3.4.4 Category 4: Supplier relations ............................................................ 155
3.4.5 Category 5: HR .................................................................................. 157
3.4.6 Category 6: Top management and leadership: ................................... 160
3.5 Development of the research hypothesises................................................ 162
3.5.1 Hypothesis 1 ....................................................................................... 162
3.5.2 Hypothesis 2 ....................................................................................... 162
3.5.3 Hypothesis 3 ....................................................................................... 163
3.5.4 Hypothesis 4 ....................................................................................... 164
3.5.5 Hypothesis 5 ....................................................................................... 164
3.6 Chapter summary ...................................................................................... 165
Chapter Four Methodology .................................................................................. 166
4.1 Introduction ............................................................................................... 166
VI
4.2 Purpose of the research .............................................................................. 170
4.3 Research questions .................................................................................... 172
4.4 Research process ....................................................................................... 174
4.4.1 First-layer philosophy ........................................................................ 174
4.4.2 Second-layer research approach ......................................................... 180
4.4.3 Third-layer research strategy.............................................................. 181
4.4.4 Fourth-layer choice of method ........................................................... 186
4.4.5 Fifth-layer time horizon ..................................................................... 197
4.4.6 Sixth-layer techniques and procedures............................................... 198
4.5 Sampling techniques .................................................................................. 198
4.5.1 Snowball sampling ............................................................................. 202
4.5.2 Purposive sampling ............................................................................ 204
4.6 Data collection and analysis ...................................................................... 205
4.6.1 Interview ............................................................................................ 205
4.6.2 Questionnaire ..................................................................................... 211
4.6.3 Observation ........................................................................................ 213
4.6.4 Concluding remarks for data collection ............................................. 215
4.7 Reliability .................................................................................................. 216
4.8 Validity ...................................................................................................... 217
4.8.1 Triangulation ...................................................................................... 219
4.8.2 Pilot study .......................................................................................... 221
4.8.3 Expert opinion .................................................................................... 224
4.8.4 Bias avoidance tactics ........................................................................ 224
4.9 Response rate ............................................................................................. 225
4.10 Ethical considerations ............................................................................ 228
4.11 Chapter summary ................................................................................... 228
Chapter Five Results and findings ....................................................................... 230

VII
5.1 Introduction ............................................................................................... 230
5.2 Phase one: questionnaire ........................................................................... 231
5.2.1 Demographics: Company Background .............................................. 233
5.2.2 Demographics: Respondent Background ........................................... 241
5.2.3 Cronbach’s alpha value for the variables ........................................... 245
5.2.4 Descriptive analysis ........................................................................... 245
5.2.5 Crosstab analysis ................................................................................ 270
5.2.6 Testing the Hypotheses ...................................................................... 272
5.2.7 Phase one concluding remarks ........................................................... 287
5.3 Phase two: semi-structured interviews and structured observations ......... 287
5.3.1 Interview findings .............................................................................. 287
5.3.2 Structured Observation....................................................................... 292
5.3.3 Phase two concluding remarks ........................................................... 299
5.4 Phase three: case studies ............................................................................ 300
5.4.1 Brief background of the case study firms .......................................... 302
5.4.2 Current situation for F1 and F2 .......................................................... 303
5.4.3 Phase three concluding remarks ......................................................... 318
5.5 Phase four: Expert panel ............................................................................ 320
5.5.1 Phase four concluding remarks .......................................................... 333
5.6 Chapter summary ...................................................................................... 334
Chapter Six Discussion ...................................................................................... 336
6.1 Introduction ............................................................................................... 336
6.2 Discussion of the findings ......................................................................... 336
6.2.1 Processes ............................................................................................ 340
6.2.2 Planning and control .......................................................................... 342
6.2.3 Customer relations ............................................................................. 344
6.2.4 Supplier relations ............................................................................... 345

VIII
6.2.5 HR ...................................................................................................... 347
6.2.6 Top management and leadership ........................................................ 350
6.2.7 ISO 9000 accreditation ....................................................................... 358
6.2.8 Firm size ............................................................................................. 359
6.2.9 Sector and type of products ................................................................ 359
6.2.10 Ownership structure ........................................................................... 361
6.3 Chapter summary ...................................................................................... 362
Chapter Seven Conclusions ................................................................................. 364
7.1 Introduction ............................................................................................... 364
7.2 Aims and objectives .................................................................................. 365
7.3 Research questions .................................................................................... 368
7.4 Contribution to the body of knowledge ..................................................... 370
7.5 Implications ............................................................................................... 371
7.6 Recommendations ..................................................................................... 373
7.7 Limitations ................................................................................................. 374
7.8 Future research .......................................................................................... 375
References ................................................................................................................ 376
Appendix-A Questionnaire items ............................................................................. 427
Appendix-B Survey questionnaire ........................................................................... 432
Appendix-C Ethics statement checklist ................................................................... 438
Appendix-D Ethical review certificate..................................................................... 440

IX
Declaration
I, Mohamad AL-Najem, hereby clarify that I personally carried out the work
presented in this thesis, entitled “Investigating the factors affecting readiness for lean
system adoption within Kuwaiti small and medium-sized manufacturing industries”.
I confirm that all of the material contained herein is my own work, and was
written by me. I also declare that all of the quotations used in this thesis have been
properly acknowledged.
This thesis has not been submitted for the award of any degree or diploma, or
its equivalent, to any other university or institution prior to this date.
Signed: ____________________________ Date: _________________
X
List of tables
Table 1 Perceptions of lean system. ........................................................................... 18
Table 2 Five lean principles ....................................................................................... 30
Table 3 SMEs vs. large organisations. ....................................................................... 63
Table 4 Recommended practices for SMEs. .............................................................. 69
Table 5 CSFs for LS identified from different regions .............................................. 80
Table 6 Lean measurement frameworks and models ............................................... 105
Table 7 Key areas addressed by the different researchers in assessing organisational
leanness .................................................................................................................... 109
Table 8 Industrial assessment tools .......................................................................... 111
Table 9 Distribution of industrial enterprises by activity......................................... 123
Table 10 Kuwait business environment compared with other GCC countries. ....... 134
Table 11 Important factors for LS ............................................................................ 145
Table 12 Process – critical practices ........................................................................ 150
Table 13 Planning and control – critical practices ................................................... 152
Table 14 Customer relations – critical practices ...................................................... 154
Table 15 Supplier relations – critical practices ........................................................ 156
Table 16 HR – critical practices ............................................................................... 158
Table 17 Top management and leadership – critical practices ................................ 161
Table 18 Research methodology characteristics. ..................................................... 171
Table 19 Research questions. ................................................................................... 173
Table 20 Comparison of research philosophies in management research. .............. 178
Table 21 Relevant situations for different research strategies. ................................ 182
Table 22 Key features of qualitative and quantitative research. .............................. 188
Table 23 Strengths and weaknesses of quantitative and qualitative methods. ......... 188
Table 24 Strengths and weaknesses of the mixed method. ...................................... 190
Table 25 Comparison between case study and survey. ............................................ 193
Table 26 Strategic Management Journal .................................................................. 193
Table 27 Journal of Operations Management .......................................................... 194
Table 28 Methodology adopted for assessing the organisational readiness for quality
initiatives. ................................................................................................................. 195
Table 29 Impact of various factors on choice of probability sampling techniques . 200

XI
Table 30 Impact of various factors on choice of non-probability sampling techniques.
.................................................................................................................................. 201
Table 31 Reliability test for all variables ................................................................. 245
Table 32 Process summary item statistics ................................................................ 246
Table 33 Process: mean and standard deviation for each item ................................ 246
Table 34 Descriptive statistics for process variables ............................................... 250
Table 35 Planning and control summary item statistics........................................... 252
Table 36 Planning and control: mean and standard deviation for each item ........... 252
Table 37 Descriptive statistics for planning and control variables .......................... 254
Table 38 Customer relations summary item statistics.............................................. 255
Table 39 Customer relations: mean and standard deviation for each item .............. 255
Table 40 Descriptive variables for customer relations variables ............................. 257
Table 41 Supplier relations summary item statistics................................................ 258
Table 42 Supplier relations: mean score and standard deviation for each item ....... 258
Table 43 Descriptive statistics for supplier relations variable ................................. 261
Table 44 HR summary item statistics ...................................................................... 262
Table 45 HR: mean score and standard deviation for each item.............................. 262
Table 46 Descriptive statistics for HR variables ...................................................... 265
Table 47 Top management and leadership summary item statistics ........................ 267
Table 48 Top management and leadership: mean score and standard deviation for
each item .................................................................................................................. 267
Table 49 Descriptive statistics for top management and leadership variable .......... 269
Table 50 Job position vs. awareness of lean system ................................................ 271
Table 51 Type of product produced (sector) vs. awareness of lean system ............. 271
Table 52 Ownership structure vs. awareness of lean system ................................... 271
Table 53 Firm size vs. awareness of lean system..................................................... 271
Table 54 ISO 9000 certification vs. awareness of lean system ................................ 272
Table 55 Quality and management practices currently adopted vs. awareness of lean
system ....................................................................................................................... 272
Table 56 Levene’s test ............................................................................................. 274
Table 57 Independent sample t-test for ISO 9000-accredited and non-ISO 9000-
accredited firms ........................................................................................................ 276
Table 58 Current practices for top management and leadership .............................. 278
Table 59 Independent sample t-test for K-SMMIs (small vs. medium) .................. 279

XII
Table 60 Test for homogeneity of variances ............................................................ 280
Table 61 One-way ANOVA test for different sectors ............................................. 282
Table 62 Independent sample t-test (family- and non-family-owned firms) ........... 284
Table 63 K-SMMIs vs. lean companies ................................................................... 286
Table 64 Total mean score for the 47 items ............................................................. 286
Table 65 Observed areas .......................................................................................... 297
Table 66 Observed areas in F1 and F2 ..................................................................... 319
Table 67 Inhibitors for QI in Arab countries ........................................................... 356
Table 68 Research objectives ................................................................................... 366

XIII
List of figures
Figure 1 Stages for developing the LR framework .................................................. 143
Figure 2 Research Process. Source: Saunders et al. (2009, p. 108). ........................ 167
Figure 3 Research Methodology scenario ................................................................ 169
Figure 4 Research process for this study (Saunders et al., 2009, p. 108). ............... 216
Figure 5 Triangulation approach for this study. ....................................................... 221
Figure 6 Firm Age .................................................................................................... 234
Figure 7 Sector and Product Produced ..................................................................... 235
Figure 8 Legal Structure of Company ...................................................................... 236
Figure 9 Ownership Structure .................................................................................. 236
Figure 10 Firm size .................................................................................................. 237
Figure 11 ISO 9000 and non-ISO 9000-certified firms ........................................... 238
Figure 12 Number of suppliers ................................................................................ 239
Figure 13 Awareness of lean system ........................................................................ 239
Figure 14 Quality and management practices already implemented ....................... 240
Figure 15 Organisational Type................................................................................. 241
Figure 16 Gender...................................................................................................... 242
Figure 17 Years of Experience ................................................................................. 242
Figure 18 Years of employment in this firm ............................................................ 243
Figure 19 Job position/current title .......................................................................... 244
Figure 20 Education Level ....................................................................................... 244
Figure 21 Production flow process (F1)................................................................... 302
Figure 22 Production flow process (F2)................................................................... 303
Figure 23 Raw materials and finished parts stored in a location that is difficult to
access when needed.................................................................................................. 306
Figure 24 Materials stored in an improper way ....................................................... 307
Figure 25 Flammable liquids stored within a closed storage area for raw and finished
materials ................................................................................................................... 317
Figure 26 Factors affecting K-SMMIs' readiness towards LS ................................. 335

XIV
Abbreviation
Acronym Definition
5s Sort, set in order, shine, standardise, and sustain
CI Continuous improvement
CSFs Critical success factors
FDI Foreign direct investment
GBP Great British Pound
GCC Gulf Cooperation Council
GDP Gross domestic product
HR Human resources
HRM Human resources management
ISO International organisation for Standardisation
JIT Just in time
KD Kuwaiti dinar
KPAI Kuwait public authority of industries
KPIs Key performance indicators
KSA Kingdom of Saudi Arabia
K-SMEs Kuwaiti small and medium sized enterprises
K-SMMIs Kuwaiti small and medium sized manufacturing
industries
LR Lean readiness
LS Lean system
M Mean
MIT Massachusetts Institute of Technology
MRP Materials requirement planning
OEE Overall equipment effectiveness
PDCA Plan-do-check-act
POUS Point of use storage
QC Quality circles
QI Quality initiative
QM Quality management
SD Standard deviation
SMED Single Minutes Exchange of Dies
SMEs Small and medium sized enterprises
SMMIs Small and medium sized manufacturing industries
SPC Statistical process control
TPM Total productive maintenance
TPS Toyota production system
TQM Total quality management
UAE United Arab emirates
UK United kingdom
US United states
USD United States dollar
VC Visual control
VM Visual management
VSM Value Stream Map
WIP Work in progress
XV
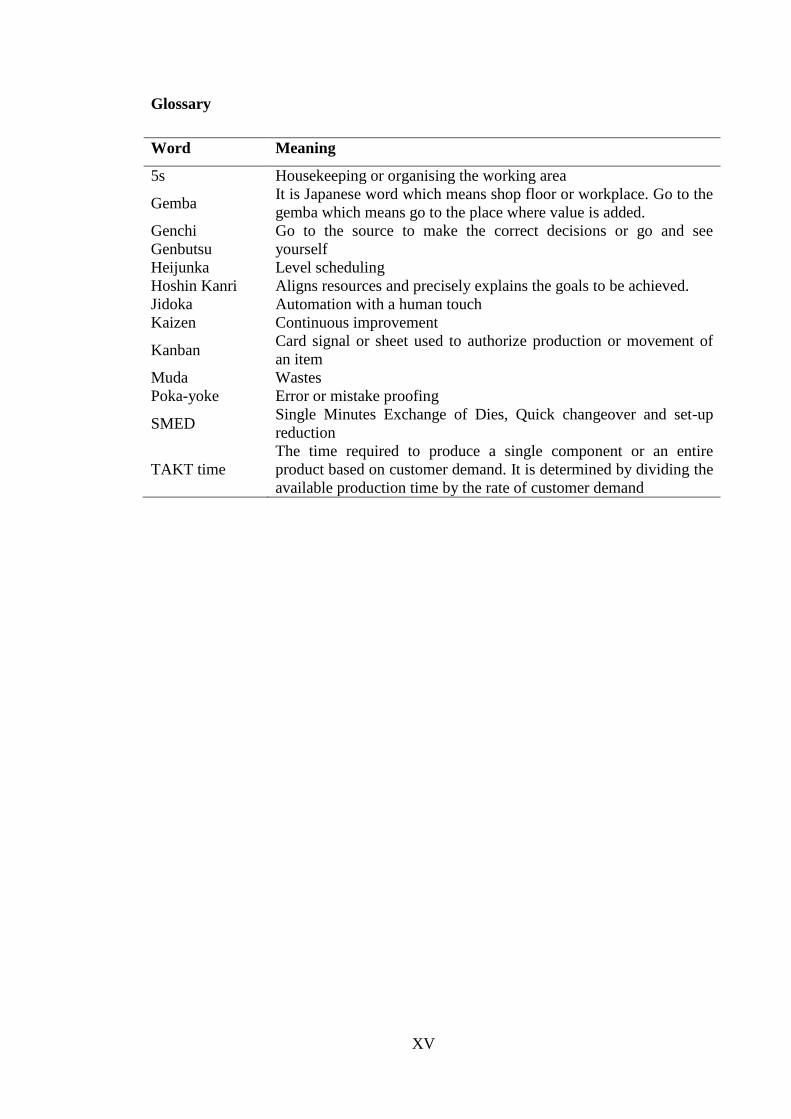
Glossary
Word Meaning
5s Housekeeping or organising the working area
Gemba It is Japanese word which means shop floor or workplace. Go to the
gemba which means go to the place where value is added.
Genchi
Genbutsu
Go to the source to make the correct decisions or go and see
yourself
Heijunka Level scheduling
Hoshin Kanri Aligns resources and precisely explains the goals to be achieved.
Jidoka Automation with a human touch
Kaizen Continuous improvement
Kanban Card signal or sheet used to authorize production or movement of
an item
Muda Wastes
Poka-yoke Error or mistake proofing
SMED Single Minutes Exchange of Dies, Quick changeover and set-up
reduction
TAKT time
The time required to produce a single component or an entire
product based on customer demand. It is determined by dividing the
available production time by the rate of customer demand

XVI
Acknowledgements
First, I would like to express my sincere thanks to my supervisor, Dr Hom
Dhakal, for his support and help, both personally and technically. He is not only a
supervisor, but also a great friend.
I would like to thank my parents for their endless support and love. They
have always given me their love and encouraged me in all my pursuits. They have
been waiting since 1999 to see me fulfil my dream of achieving a PhD, and I hope
that I have done them proud, and that after the long absence we can finally be
together again. I want to thank my brothers and sisters for their full support and care,
and for the sweet messages I receive from them on a daily basis. I also want to
acknowledge the support and encouragement I have received from my sisters in law
– thank you all.
I would like to thank my true friends, who never forgot me throughout my
long absence and kept asking about and supporting me during my very long journey.
Special thanks goes to Ziad, Faisal, Fatma, Abdullah, Meshaal, Nawaf and Youssef.
You are brilliant boys and girls!
I would like to thank all the people who have helped me with, and
participated in, my research: managers and workers from the Kuwaiti manufacturing
industries; experts from Kuwait University, the Industrial Union, the Public
Authority of Industries, and the Chamber of Commerce; and consultants. A special
thanks goes to the general managers from the firms that allowed me to spend a few
days in their companies to conduct the case study. I must also express my thanks to
Jinny Hayman of Stickler Proofreading for her hard work in proofreading my thesis.

XVII
Dissemination
Publications in peered reviewed scientific journals
Mohamad AL-Najem, Hom Dhakal, Ashraf Labib, Nick Bennett, (2013)
Lean readiness level within Kuwaiti manufacturing industries, International
Journal of Lean Six Sigma, Vol. 4 Iss: 3, pp.280 – 320
Al-Najem, M., Dhakal, H. N., and Bennett, N. (2012). The role of culture and
leadership in lean transformation: a review and assessment model.
International Journal of Lean Thinking, 3(1), 119-138
Publications in conferences and symposium papers
Al-Khadar, A., Dhakal, H. N., Al-Najem, N., and Kluaypa, P. (2012). Study
of quality management systems (QMS) in GCC countries. The 6th Quality
Conference in the Middle East, 30 Jan -2 February, Dubai, United Arab
Emirates.
AL-Najem, M., Dhakal, H. N., and Dibia, I. K. (2011). Effect of culture in
implementation of lean manufacturing. The 3rd European Research
Conference on Continuous Improvement and Lean Six Sigma and Lean, 28
March, Glasgow, UK.
Dibia, I.K., Onuh, S., Al-Najem, M. and Dhakal, H.N. (2010). Lean
Production System and the Human Resource Aspects. 2nd
International
Conference on the Role of Social Sciences and Humanities in Engineering
(ICoHSE) 12-14 November, Penang, Malaysia.
Submitted publications in peer review scientific journals (under review)
Mohamad AL-Najem, Hom Dhakal, Ashraf Labib, Nick Bennett. The
readiness of Kuwaiti manufacturing industries towards lean system: case
studies, International Journal of Operations and Production Management.
Mohamad AL-Najem, Hom Dhakal, Ashraf Labib, Nick Bennett. Is Kuwaiti
manufacturing industries ready to adopt LS?: according to consultants’
perspective, International Journal of Quality and Reliability Management.
Mohamad AL-Najem, Hom Dhakal, Ashraf Labib, Nick Bennett. The impact
of ownership and type of industry on readiness towards lean in Kuwaiti
manufacturing industry, International Journal of lean six sigma.

1
Chapter One Introduction
1.1 Introduction
In the last decade, lean systems (LS) have made a noteworthy impact in both
the academic and industrial community (Hines et al., 2004). Organisations around
the globe are opting to implement LS to eliminate waste and increase productivity in
their businesses. Most of these organisations have adopted LS because the approach
has demonstrated an overwhelming influence on the restructuring of the global
industry, as it basically aims to increase production efficiency via the elimination of
wastes in all its forms (Abdul Raman and Jamaludin, 2008), and, if properly
implemented, could lead the organisation towards global manufacturing excellence
(Papadopoulou and Ozbayrak, 2005). As stated by Womack et al. (1990, p. 225):
[LS] is a superior way for humans to make things. It provides better products, in
wider variety at lower cost. Equally important, it provides more challenging and
fulfilling work for employees at every level, from the factory to headquarters. It
follows that the whole world should adopt lean production, and as quickly as
possible.
The success of Toyota (the inventor of LS) has drawn the attention of
academics, researchers, and executives seeking to benchmark the company’s famous
Toyota production system (TPS), or “LS” (Bartezzaghi, 1999; Liker and Hoseus
2010; Bicheno et al., 1997; Emiliani, 2006; Womack et al., 1990; Stone, 2012a).
However, despite its pervasiveness, there is increasing concern in the corporate
world about the implementation of LS in both large firms, and small and medium-
sized enterprises (SMEs). According to Stone (2012b), there is still a lack of
empirical study with regard to the subject of LS.
Many researchers and LS practitioners have covered lean topics from
different perspectives; despite the large amount of articles on LS that have emerged
over the past four decades, however, lean practices within the SME context is a very
under-researched area (Boughton and Arokiam, 2000; Stone, 2012b). According to
Bakås et al. (2011), in the past 20 years there have been only 16 journal articles that
have addressed LS within SMEs. Moreover, there are only a few studies that contain

2
empirical evidence regarding factors that affect the implementation of lean practices
within SMEs (Shah and Ward, 2003; Achanga et al., 2006; Golicic and Medland,
2007; Stone, 2012b).
Some of the extant articles cover different areas of LS, such as lean practices,
lean benefits and lean critical success factors (CSFs), in both large companies and
SMEs that are primarily based out of expansive premises. These studies have
considered various country contexts, including India (Antony, 2006; Dhandapani et
al. 2004; Upadhye et al., 2010a), the US (Zhou, 2012; Golicic and Medland, 2007;
White et al., 1999), Australia (Sohal and Egglestone, 1994), Canada (Stuart and
Boyle, 2007), Europe (Bakås et al., 2011; Bonavia and Marin, 2006; Achanga et al.,
2006; Johansen et al., 2004; Bhasin, 2012), Saudi Arabia (Karim et al., 2011), and
Asian countries (Wickramasinghe and Wickramasinghe, 2012; Perera et al., 2010;
Nordin et al., 2010; Wong et al., 2009; Rose et al., 2011; Ferdousi, 2009; Yang and
Yu Yu, 2010; Rahman, 2010; Wong, 2007).
However, in some parts of the world, such as Kuwait, the term “lean” is still
relatively unheard of. Indeed, according to Tannock and Ahmed (2008), very limited
resources cover quality management (QM) in the Arab world, and, more precisely,
Kuwait. Furthermore, research on implementing LS in Kuwaiti small and medium-
sized manufacturing industries (K-SMMIs) is non-existent.
Notwithstanding the popularity of LS; many organisations around the world
have faced difficulties in implementing LS. Several researchers (e.g. Balle, 2005;
Papadopoulou and Ozbayrak, 2005; Emilliani, 008) have emphasised that despite the
huge benfits of LS, there have been a number of failures in LS implemention.
According to Vermaak (2010), there is no agreement amongst researchers about the
source of failures, which suggests that each country in general, and in each firm in
particular, requires some form of customisation with respect to LS in order to cope
with it. As Womack and Jones (2003, p. 281) suggest, “the various industrial
traditions are very different”; thus, LS implementation problems are different from
one place to another.
Despite the complexities of LS, however, the initiative is still applicable to
every organisation; Womack and Jones (2003) conclude, based on many case
studies, that LS are applicable to different countries, and regardless of the firm’s

3
activity. However, an organisation that wants to adopt LS must understand key
issues of LS such as CSFs, principles, and more importantly recognising the need to
adopt LS.
Many researchers (e.g. Nordin et al. 2012; Stone, 2012a; Abrahamsson and
Isaksson, 2012), have emphasised that urgency is required in order to drive
organisations to implement LS.
LS consists of a number of tools and techniques, and many studies have
identified the CSFs for successful lean implementation, understanding of which is
vital for the success of LS. But more importantly, organisations need to know
exactly what they require and expect from LS, and then choose the tools and
techniques that best fit their situation (Balle, 2005); this requires strategic thinking,
awareness of lean tools and their benefits, commitment, and relationship-building
with external factors such as suppliers and customers. According to Womack et al.
(1990, p. 225), “we are convinced that the chances of lean production prevailing
depend critically on a wide public understanding of its benefit”.
The objective of LS is to do what the customer is willing to pay for, and via
identifying and eliminating wastes from the process. Most of these wastes are
attached to human factors, and in order to eliminate them, organisations need to give
more respect and empowerment to the human resources in their organisation by
promoting favourable working cultures and continuous improvement (CI).
Reseachers shows that LS is a social technical system that requires huge attention to
the human aspect (Shah and Ward, 2007; Shah and Ward, 2003; Poppendieck, 2002;
Dibia, 2012); neglecting this will lead to failures in impelmenting LS (Emiliani and
Stec, 2005; Bamber and Dale, 2000; Parks, 2002; Dibia, 2012).
1.2 Background, and the need for this study
Researchers and practitioners have shown that, despite the benefits that LS
can offer to organisations, there have been a large number of failed implementations
of it (Balle, 2005; Papadopoulou and Ozbayrak, 2005; Emilliani, 2008). These arise
from different sources, such as ignorance of lean concepts, CSFs and LS
requirements (this ignorance has often arisen as a result of the different perspectives

4
taken by researchers when considering LS, which has caused confusion regarding
LS) (Hines et al., 2004; Wong et al., 2009; Stone, 2012b), and poor external
relationships with suppliers and customers (Panizzolo, 1998; Nordin et al., 2010).
Other researchers suggest that failure can arise from the cultural differences
highlighted during the transition (Herron and Braiden, 2007).
All of these aspects can be attributed to one single cause, which is lack of
understanding of the key elements of LS. Knowing the requirements of LS is key
before trying to implement it; in other words, the organisation must measure its
readiness for LS and try to understand its requirements, which could save them time,
effort and money.
There is a lack of in-depth research on lean readiness (LR) and CSFs,
especially with respect to the SME context (Anand and Kodali, 2008). As mentioned
earlier, in order to minimise the lean failure rate, there is a need to assess the current
practices/realities within the organisation to see whether these are supportive of LS,
or in need of adaptation in order to cope with LS. In other words, organisations need
to assess their readiness and preparedness before implementing LS (Radnor et al.,
2006).
How can an organisation measure its LR? Many researchers, such as Radnor
et al. (2006), have emphasised the need to understand LR before attempting LS;
however, there is currently no definitive model to enable an organisation to
understand its readiness. This suggests that there is a need for a tool or framework
that organisations can adopt prior to lean implementation, and this leads to the
primary aim of this study: i.e. to develop an LR measurement framework, and to
understand LR within K-SMMIs.
In order to understand how LR can be measured, and then to see if it is
applicable to K-SMMIs, it is necessary to understand how Toyota started; this can be
done by identifying key issues such as the eight wastes that hinder improvement, and
that Toyota has fought to minimise (What are they? Where do they come from?
What are the requirements to tackle and get rid of them?). It is also necessary to
understand the principles behind lean/TPS, and the requirements for LS, such as the
factors that help to initiate LS success and the factors that the organisation must
understand before starting LS, as well as the key tools and techniques of LS.

5
In that sense, an understanding of the situation in Kuwait is required in order
to identify the LR level in K-SMMIs. This entails a deep understanding of several
issues, such as processes, planning and control, human resources (HR), top
management and leadership, customer relations and supplier relations, as well as of
the national and organisational culture, management style and other issues. These
will be addressed in the following chapters of this study.
Isaa (2007) claimed that many Kuwaiti industries have implemented quality
initiatives (QI) such total quality management (TQM), Six Sigma, and the
International Organisation for Standardization’s (ISO’s) certification, ISO 9000.
However, there have not been any reports that show the results of those initiatives in
Kuwait with regards to seeing if the initiatives have an impact on K-SMMIs, such as
enhancing quality, reducing wastes, increasing efficiency, and decreasing cycle time,
etc.
The dearth of research on QI in general, and LS in particular, within the
Kuwait context leads to the question of why Kuwaiti organisations have not yet
started to use LS, despite the widespread use of LS among most developed and
developing countries. Although Kuwait is considered a developing county, it has
many distinctive features that could enable K-SMMIs to match the progress seen in
other countries.
Kuwait has a small population, but its inhabitants are very open to Western
cultures; the country also has money and technology, and thus the potential to
become one of the most successful countries in the world. However, with regard to
LS, it is unclear whether the country has what it takes to make Kuwaiti organisations
successful in terms of implementing LS. Thus, in order to identify the LR level
within K-SMMIs, it is necessary to understand whether Kuwaiti firms are
considering the key aspects required by LS in their business.
Kuwait has a huge amount of wealth, which can enable it to compete with
world-class industries; however, it is still lagging behind even the least developed
countries. Addressing the reasons for the delay in development of the manufacturing
industries could help the Kuwaiti government to solve this issue and consider K-
SMMIs as a new source of economic development, especially in light of the benefits

6
of SMEs, as highlighted by many researchers (Ghobadian and Gallear, 1997; Wang
et al., 2007).
Kuwaiti industries are still in the early stages in terms of competing with
other world-class industries. Kuwait is considered a newly emerging industrial
market. It is one of the smallest but richest countries, with the highest per-capita
gross domestic product (GDP) in the world (Burney et al., 2010); this could help the
country to compete with top industries around the world. Because of its wealth,
Kuwait is highly dependent on international trade and expatriate labour for
economic growth; this has led it to ignore SMEs in both service and manufacturing
sectors, and these sectors have received little attention from the government to date,
with the role of SMEs in the economy considered to be very modest (Rampurwala
and Marafi, 2011). According to a report published by the Industrial Bank of
Kuwait (2001), and also highlighted by Eltony (2007), the country’s industrial
manufacturing sectors contribute only 2.8 per cent to its GDP (excluding the
petrochemical and petroleum sectors).
The Kuwaiti economy is largely dependent on the export of natural resources
such as gas and oil. These two products make a huge contribution to the national
income, which has led the Kuwaiti government to concentrate heavily on these
sectors and pay far less attention to the SMEs in both service and manufacturing
sectors. This is very risky because Kuwait is still dependent on oil, and the Kuwaiti
government will soon face a deficit (Blair, 2009). Thus, it must pay attention to other
sectors in order to create diversity.
In the past, the Kuwaiti government has tried to create diversity and boost the
non-oil sectors, but has failed to make this a success (Eltony, 2007). QI such as LS,
Six Sigma, and TQM could be a key for restructuring and enhancing the role of K-
SMMIs and increasing their contribution to the Kuwaiti economy. According to
Zairi (1996), Arab organisations can enjoy huge benefits from implementing QI, as it
will help them to address their weaknesses, and eventually make them competitive at
an international level.
This is why countries like Kuwait need to focus on this initiative to boost this
sector and create diversity in the market. Womack and Jones (2003) suggest that LS
is a solution for every company around the world, as it gives companies a

7
competitive edge by which to compete in the global market, via enhancing efficiency
and productivity and reducing errors, defects and mistakes. However, applying LS is
not an easy task, and many companies around the globe have failed to follow
Toyota’s lead (Balle, 2005; Spear and Bowen, 1999).
The literature shows that Kuwait, like other Arab countries, has yet to
consider the importance of QI (Tannock and Ahmed, 2008). This can be attributed to
a number of reasons, including the country’s high dependency on oil, ignorance
towards QI, or feeling that there is no real need for QI in Kuwait. The failure to
consider QI could include all of the above. In order to address the issues affecting
QI, this study aims to unveil the reasons and to identify K-SMMIs’ readiness
towards LS.
1.3 Aims and objectives
This research project aims to consider the general situations of K-SMMIs to
identify their readiness for adopting LS, and to identify the factors that are affecting
this readiness. The study further aims to examine how the introduction of LS to K-
SMMIs could create awareness about the benefits that LS could bring, and help them
to improve their businesses.
In order to achieve the aims of this research, the main objectives are outlined as
follows:
1. To identify the essential factors required by LS.
2. To investigate the general state of K-SMMIs.
3. To get a clear understanding of current quality and management practices
used by K-SMMIs.
4. To develop an LR framework to measure K-SMMIs’ readiness towards LS.
5. To identify and analyse the different barriers and enablers for implementation
of LS in K-SMMIs.
1.4 Gaps and motives
This study aims to address the gaps that have been identified in the reviewed
literature. The first gap is the development of a measurement framework to enable

8
the manufacturing industries to measure their readiness prior to the adoption of LS,
which will help to reduce the failure rate and enable the organisation to address the
LS requirements, and see whether they are willing to adopt LS. If they cannot meet
the requirements for LS, they should not try to begin to implement it.
The subject of LS has not been studied within the Kuwaiti context to date, so
the second gap is to evaluate the applicability of LS within K-SMMIs by identifying
their readiness towards LS, and by shedding light on the external and internal factors
that may impede the success of lean within the Kuwaiti context.
1.5 Research questions
In order to achieve the research aims and objectives, the following research
questions (RQs) have been formulated:
1. How far are K-SMMIs from a lean system?
2. What factors relating to quality and management practices inhibit K-SMMIs
from adopting LS?
3. Why has LS not been practised within K-SMMIs to date?
4. What is the urgency for K-SMMIs to adopt LS?
5. What is the level of awareness of LS within K-SMMIs?
6. What are the potential barriers and enablers for K-SMMIs to adopt LS?
1.6 Research hypotheses
As this study is the first of its kind, it aims to describe K-SMMIs in terms of the
quality and management practices deployed by different industries, and to explore
which of them has the best foundation for LS. To this end, five hypotheses have been
developed by which to evaluate LR in firms who have not yet started LS, and to
learn how to distinguish between these firms; i.e. to understand whether ISO 9000-
accredited firms have better readiness towards LS compared to non-accredited firms,
and learn whether the firm structure (family vs. non family), size and sector affect
readiness towards LS.
The quality and management practices have been clustered into six categories
(processes; planning and control; HR; top management and leadership; customer

9
relations; and supplier relations), and these incorporate most of the requirements that
represent the foundation of LS, as extracted from the literature review. Some of these
requirements include: housekeeping (5s) (Furlan et al., 2011), cellular manufacturing
(Monden, 1998), skilled workers for running and leading processes (Saurin et al.,
2011), total productive maintenance (Shah and Ward, 2007), documentation (Saurin
et al., 2011), production based on pull (Womack and Jones, 2003). Problem solving
(Shah and Ward, 2007), benchmarking (Hines et al., 1999), standardised activity
(Liker, 2004), customer involvement (Shah and Ward, 2007), customer feedback
(Panizzolo, 1998), number of suppliers (Shah and Ward, 2007), supplier
involvement (Nordin et al., 2010), involvement and participation (Ichimura et al.,
2007), training (Bhasin, 2011), skilled workers (Achanga et al., 2006), visible
management (Scherrer-Rathje et al. 2009), knowing workers’ capabilities (Achanga
et al., 2006), and job security (Radeka, 2009).
In order to understand the differences in LR amongst K-SMMIs, five hypotheses
(H) have been developed, as follows:
H1: There is a significant difference in the quality and management practices
used by ISO 9000 firms compared to non-ISO 9000 firms in Kuwait.
H2: Small firms and medium-sized firms in Kuwait differ significantly in
terms of their quality and management practices.
H3: Firms in different sectors in Kuwait differ significantly in terms of their
quality and management practices.
H4: There is a significant difference in the quality and management practices
used by non-family-owned firms compared to family-owned firms in Kuwait.
H5: K-SMMIs are not using quality and management practices to a very
significant extent.
1.7 Research methodology
In order to answer the research questions, test the hypotheses, and achieve the
aims and objectives of this research, following the literature review, mixed methods
have been adopted; quantitative (questionnaire and structured observation) and
qualitative (case studies, semi-structured interview and observation). A mixed-
method design was adopted to avoid the weaknesses of a single method and to
10
enhance credibility and validity by collecting data from multiple sources; the forms
of validity used were triangulation, experts’ panel and pilot testing. Four phases were
followed to achieve the aims of this research:
Phase one: questionnaire (administered to 50 K-SMMIs)
Phase two: semi-structured interview (27 managers in K-SMMIs) and
structured observation (27 K-SMMIs)
Phase three: two case studies (including interviews with personnel from
different levels and structured and unstructured observations)
Phase four: expert panel (interview with 26 experts)
The four phases will make it possible to answer the RQs and hypotheses and
verify the results to ensure the validity and reliability, as well as the robustness, of
these findings.
1.8 Expected contribution and originality of the research
The contribution of this study to the body of knowledge on LS is expected to
be significant. The contribution of this study can be summarised as follows:
As far as the author is aware, no LR framework exists in the literature to date,
and this LS and LR measurement framework relating to K-SMMIs thus
represents a unique effort in the area of LS. This study aims to address this
gap by developing an LR framework that can be used by organisations prior
to attempting LS, as it contains most of the LS requirements that represent
the foundation of LS, as extracted from the literature review.
Most LS studies have been conducted with reference to organisations that
have implemented LS already, and have identified the critical factors based
on this fact. Organisations who have not yet started LS and want to
implement LS in future have not received much attention; hence, this study
will show the LR of non-lean organisations.
LS has not been covered within the Kuwaiti context, and no studies have
been conducted to date regarding K-SMMIs. This study will thus contribute
to the body of knowledge with respect to QI within the Kuwaiti context,

11
which will also reflect the situation in the wider Gulf Cooperation Council
(GCC) region.
Considering the non-existence of LS studies within the Kuwaiti context, this
study will add a new dimension by showing the readiness within K-SMMIs
towards LS, and identify the factors that are preventing Kuwaiti
manufacturing firms from being lean.
There is a lack of studies regarding LS within the SME context, especially in
the Arab world where no studies have considered LS within small and
medium sized manufacturing industries (SMMIs). Thus, this study will
contribute to the literature on lean in the developing-country context,
especially for those in the Arab world, as Arab countries share many
similarities in terms of culture and other traits, and the findings of this study
can be used as guidance for other Arab countries.
Finally, due to the diversity of the data collection sources adopted, this study
will add new insight regarding the inhibitors faced by K-SMMIs, which may
prevent them from implementing LS, and address the source of those
inhibitors.
1.9 Implications
This study can serve as a guideline for the Kuwaiti government on the benefits
of LS, and the obstacles that can impede the implementation of LS within K-SMMIs.
Further, the LR framework can be used for any manufacturing industries, regardless
of location, as it incorporates all LS requirements. Furthermore, the findings of this
study will provide insight into Arab manufacturing industries in general, and GCC
countries in particular, as most of those countries share similar aspects, especially
with regard to external factors. Finally, the LR framework can be used as a checklist
for managers who want to consider LS in the future, as it will enable them to learn
whether their organisation meets the requirements for LS.
1.10 Organisation of the thesis
This study contains seven chapters, as follows:

12
Chapter one provides an overview of the study, including the motives, the
expected contribution and implications, the need for this research, the aims and
objectives, the research questions and hypotheses that the research is aiming to
address, and most importantly the gaps that this research is aiming to fill.
Chapter two contains a critical review of the literature on areas including:
Toyota’s system, LS principles, LS requirements, critical success factors, and the
eight wastes associated with LS, as well as their sources, so as to allow an
understanding of the key aspects of lean. Lean assessment frameworks and models
developed by several researchers have been reviewed and explained, which will help
in designing the framework. The chapter also includes a review of LS within SMEs,
the characteristics of SMEs, and their weakness and strengths with respect to
adopting LS. Furthermore, it contains key issues regarding Kuwaiti industries, the
Kuwaiti business environment, and QI within the Kuwaiti context.
Chapter three includes explanations and the rationale behind the
development of the LR framework. Each element of the LR framework is explained
and highlighted. It also includes an explanation of each category and element, and
why they are important for LS.
Chapter four describes the methodology employed to help answer the
research questions, by testing the hypotheses to meet the objectives of the study and
to fill the identified gaps. It outlines the research philosophy, research approach,
choice of methodology, research strategy and finally the techniques and procedures
used to conduct the data collection and analysis. Additionally, this chapter justifies
the chosen research method by highlighting the key features, weaknesses and
strengths of different approaches and methods.
The chapter further explains the process followed to collect the required data,
and outlines the reasons behind the choice of certain methods, techniques and
approaches. Furthermore, it shows how difficulties faced in obtaining respondents
was overcome, and how any potential bias was mitigated. Several tactics have been
followed in this study to enhance the validity and reliability of the outcome, such as
triangulation, pilot testing and consulting with an expert panel.

13
Chapter five includes explanations and a presentation of the data collected
from the respondents in Kuwait. This includes data from the questionnaire, the semi-
structured interviews with 27 managers in K-SMMIs, the observations within the
same 27 K-SMMIs, the case studies, and the opinions from the expert panel.
Chapter six contains an in-depth discussion and analysis of the findings in
order to understand and compare the findings with those of other researchers to see
how the findings of this study agree and/or disagree with other researchers.
Chapter seven provides the conclusion of the study, which includes how the
aims of the study have been achieved and how the RQs have been answered, with
reference to the methodology. Further, the contribution and implications of the study,
and finally recommendations, limitations, and directions for future research, are
highlighted.

14
Chapter Two Literature Review
2.1 Introduction
In this chapter, the literature will be critically reviewed on areas including:
Toyota’s system, the principles and requirements of LS, critical success factors, and
the eight wastes associated with LS, as well as their sources, to make it possible to
understand the key aspects of LS. Lean assessment frameworks and models
developed by several researchers have been reviewed and explained, which will help
in designing the framework. The chapter also includes a review of LS within SMEs,
the characteristics of SMEs, and their weakness and strengths with respect to
adopting LS. Furthermore, it contains key issues regarding Kuwaiti industries, the
Kuwaiti business environment, and QI within the Kuwaiti context.
2.2 Overview of lean system
In the 1940s, Taiichi Ohno started working on the TPS, or what is now called
“lean”. The development if this system took until the 1980s; the main driver for
creating this system was Toyota’s desire to be more efficient in its process as the
company realised that only a small fraction of efforts and time add value to the end
customer, and wished to be more efficient and produce in a continuous flow (Melton,
2005).
According to Brophy (2012), the term “lean” was first used by Massachusetts
Institute of Technology (MIT) graduate John Krafcik in 1988; the term “lean” is
used because the Toyota system uses less of everything, including capital, human
effort, space, etc. (Anvari et al., 2011; Papadopoulou and Ozbayrak 2005).
In the 1990s, James Womack, Daniel Roos, and Daniel Jones published a
book called The Machine that Changed the World, which has become the most-used
reference for all lean researchers and practitioners. The book outlined the Toyota
production system and compared it to the traditional mass method that was being
followed by Western companies, showing the huge gap between the Toyota system
and companies in the West and thoroughly explaining the process of LS. In 1996,

15
James Womack and Daniel Jones released a book entitled Lean Thinking: Banish
Waste and Create Wealth in your Organisation; this explained the core principles of
LS, which are specify the value, identify the value stream, create product flow,
respond to customer pull, and pursue perfection.
The LS originated on the shop floor at Toyota, the Japanese automotive
company (Hines et al., 2004; Ohno, 1988). The philosophy arose from a scarcity of
resources and huge competition at both domestic and international levels (Sugimori
et al., 1977; Hines et al., 2004). Further, the innovative system is a multidimensional
approach that includes many practices and techniques, such as just-in-time (JIT), pull
system, Kanban, respect for people, problem solving, quality systems, team working,
cellular manufacturing, supplier management, etc. – all of which come together as an
integrated system that aims to eliminate all types of wastes and achieve customer
satisfaction (Shah and Ward, 2003).
After World War II, Toyota recognised that it had some weaknesses and
believed that in order to take competitive advantage it needed to acknowledge a
sense of urgency and benchmark its automobiles against leading companies in
Europe and America (such as Ford). According to Abdullah (2003), the first and the
most important challenges that Toyota faced included a lack of natural resources in
Japan, such as shortages of material, finances and human resources, which forced
Toyota to import most of its materials and represented disadvantages for Japan as it
cost the country a lot compared to America and European countries. In order to
overcome this weakness, Toyota believed that it had to focus on producing high-
quality, value products (by eliminating wastes) at minimum cost in order to compete
with other countries (Sugimori et al., 1977). It was this urgency that forced Toyota to
think outside the box, and this represents the stimulus that drove the development of
LS.
Prior to the implementation of LS, Toyota assessed its strong points and
found that it offered great value that was not available elsewhere; this was one of the
key features that allowed Toyota to start LS. The concept comes from Japanese
culture, which emphasises a consciousness and attitude that differs from that in
America and European countries. Japanese’ traits include:

16
1. A group consciousness, or a sense of equality, desire to improve, and
diligence born from a long history of a homogeneous race;
2. A high degree of ability resulting from higher education, brought about by a
desire to improve; and
3. A daily living centred around work.
These traits are reflected in the organisational culture of Toyota, and are
reflected in aspects such as its lifetime employment policy, labour union, lack of
discrimination between workers of different levels, great unity between workers and
organisations, and the fact that workers within Toyota have the chance to be
promoted to managerial positions (Sugimori et al., 1977).
Thus, Toyota recognised its potential to improve and realised that it had the
right culture through which to do so, and, most importantly, that it had capable staff
that it encouraged to work to their full capabilities and potential to help the company
implement new ideas and achieve its goals. Toyota also recognised that empowering
people and allowing them to participate in running and improving their own
workplace could lead them to triumph in other regions (Europe and America) that
lacked these distinctive characteristics (Sugimori et al., 1977, p. 553). As explained
by Womack et al. (1990), after LS became a proven success in Toyota, companies
around the world began to try and emulate the system on the shop floor, however
they struggled due to difficulties relating to changing their culture and mindset in
order to support the system.
Toyota’s success in turn led many companies around the world to pay attention
to LS and attempt to imitate it (Liker and Hoseus, 2010; Stone, 2012a). However,
not all of these attempts have been successful (Balle, 2005; Emiliani, 2008). There
are a number of different reasons for these failures, such as ignorance of lean
concepts, CSFs and LS requirements; this ignorance has often arisen as a result of
the different perspectives taken by researchers when considering LS, which has
caused confusion regarding LS (Hines et al., 2004; Wong et al., 2009; Stone,
2012b). Thus, it is important to understand the meaning of LS and how different
researchers have viewed it.

17
2.3 Definition of lean
Lean philosophy has been accepted and applied successfully by many
manufacturers (Poppendieck, 2002). There is no concise definition for LS, as many
researchers have commented and explained the term from their own point of view
(Wong et al., 2009), which sometimes causes problems relating to understanding it.
According to Stone (2012b), different explanations and interpretations of LS have
resulted in the development of different approaches, giving rise to confusion in terms
of understanding the exact meaning of lean and how it should be implemented. Table
1 shows the different perceptions of LS proposed by various authors.

18
Table 1 Perceptions of lean system.
Source: Dibia (2012)
Author(s) Perception on the essential component of lean
philosophy
Sugimori et al. (1977);
Ohno and Kumagai (1980)
JIT, respect for human systems
Monden (1981) JIT
Ohno (1988) JIT, respect for people
Womack et al. (1990)
Leadership, teamwork, communication, efficient use
of
resources, continuous improvement, supplier
management, customer management
Womack and Jones (1996) Value, efficient value stream flow, customer pull
system,
pursuit of perfection
Shah and Ward (2003) JIT, TQM, total productive maintenance (TPM) and
human resource management (HRM)
Fullerton (2003) JIT, TQM and cellular manufacturing
Liker (2004)
Long-term philosophy, excellent process flow, pull
system,
quality, employee empowerment, continuous
improvement, culture, visual control, respect for
people
(including suppliers), leadership, teams, continuous
learning
Schonberger (2007) Employee involvement, quality, JIT
Holweg (2007) Leadership, clear vision
Liker (2008) Culture, continuous improvement
Understanding the definition of lean is important as a first step. According to
Womack and Jones (2003, p. 15), lean thinking:
Provides a way to do more and more with less and less human effort, less
equipment, less time, and less space […], provid[es] customers with exactly what
they want, [and also offers] a way to make work more satisfying by providing
immediate feedback on efforts to convert muda [waste] into value.

19
Other definitions for LS have appeared in the research literature as well.
Among these, LS can be defined as a set of processes that add or create value by
removing unnecessary work and preventing future wastes (Emiliani, 1998). Stone
(2012a) defines lean as a system for identifying and eliminating wastes that affect
productivity. Atkinson (2010, p. 36) explained lean as:
A commitment, a process of continuous improvement that can significantly impact
an organisation’s competitiveness. Lean is a strategic tool for resolving severe
organisational problems and can unite several change initiatives that are running
currently in a business.
According to Taj (2005), LS means the organisation must manufacture
without generating wastes during processes, while wastes are anything that add no
value to the end customer (Womack and Jones, 2003). Anvari et al. (2011, p. 1588)
explained “Lean is about controlling the resources in accordance with the customers’
needs and to reduce unnecessary wastes”. According to Sun (2011, p. 160), the Lean
Aerospace Initiative (2002) defined LS as:
The dynamic, knowledge-driven, and customer-focused process through which all
people in a defined enterprise continuously eliminate waste with the goal of creating
value.
Shah and Ward (2003) suggested that LS is an integrated system consisting
of different elements combined together, and involving a variety of management
practices such as teamwork, JIT, cellular manufacturing and quality systems. LS as
defined by Liker and Wu (2000) is a manufacturing philosophy that focuses on
delivering the final product to customers on time, at the lowest cost and highest
quality.
Wong et al. (2009) described LS as a process that can offer high value to the
customer by eliminating wastes from the process and from the human design
element. Hayes and Pisano (1994) defined LS as a process that uses less or a
minimum of everything to produce a final product, while requiring involvement from
all organisational departments.
According to Papadopoulou and Ozbayrak (2005), MIT defined LS as aiming
to eliminate wastes in a production area, including wastes regarding customer

20
relations, product design, management and suppliers, wherein the main objective is
to provide the customer with a good-quality product at minimum cost by using less
of everything, including inventory, human effort, lead time to develop the product,
and space.
Upadhye et al. (2010a) defined LS as an approach that requires multi-skilled
workers and high flexible machines that will drive the organisation towards
producing a high variety of products with less lead time, at a competitive price, and
that ensure customer satisfaction. Finally, Drew et al. (2004, p. 6) defined LS as:
An integrated set of principles, practices, tools and techniques designed to address
the root cause of operational underperformance. It is a systematic approach to
eliminating the sources of loss from entire value stream in order to close the gap
between actual performance and requirements of customers and shareholders […]
lean tries to eliminate three key sources of loss from operating system, not only
waste but also variability and inflexibility.
It can be concluded that LS can be explained with reference to all of the
above definitions, depending on where it is needed and what is need from it within
the specific organisation in question. All of the above-mentioned definitions are
consistent with Toyota’s main principles, since Toyota developed a flexible culture
that focuses on pursuing perfection through eliminating all forms of wastes, by
focusing solely on responding to customer demands (Vermaak, 2010).
2.4 Benefit of LS
[LS] is a powerful tool designed to meet recent manufacturing enterprises'
challenges in reducing lead-time, human errors, cost, and delivery times while
increasing the quality of the final product and continuous flow in the manufacturing
process (Ichimura, 2008, p. 31).
Knowing the benefits of lean practices can create a more in-depth
understanding of them within an organisation. By adopting LS, an organisation can
improve customer responsiveness and quality, and reduce cycle time (Spann et al.,
1999). Increasing levels of customer satisfaction, financial savings and knowledge
management, and reducing inventories and process wastes, are some of the benefits
suggested by Melton (2005). There are many other benefits relating to the adoption

21
of LS; it can complement human efforts, create manufacturing space and improve
quality (Zayko et al., 1997). According to Monden (1983), LS can play a great role
towards the improvement of production activities, not only in automobile industries
but also in other types of industries if it is adapted.
According to Bergmiller and McCright (2009), LS can help to increase
efficiency, reduce customer response time, cut costs, improve profitability and
enhance the organisation’s image. Moreover, LS can lead to sustainable development
by increasing customer satisfaction and communication, and reducing cost and
delivery time, as it is a systematic approach that helps managers to identify wastes
and omit them from the organisation at every stage in the operation, which will lead
to better organisational performance and make the company waste-free (Upadhye et
al., 2010a).
However, these benefits cannot be achieved unless the organisation addresses
the important issues involved in LS. However, before going through the individual
requirements, principles and CSFs for LS, there is a need to understand the eight
wastes that are associated with LS so that the organisation can measure them and
learn where they are coming from.
2.5 Eight wastes associated with LS
The main objective of LS is to eradicate and eliminate wastes from within the
organisation that add no value to the end customer (Womack and Jones, 2003;
Benson and Kulkarni, 2011). Knowing the source of wastes and the consequences of
those wastes are very important, and this knowledge represents the first step to
tackling them.
According to Benson and Kulkarni (2011, p. 1), “the most effective way to
reduce cost while keeping up with the competition is to become lean by reducing,
and preferably eliminating, waste”.
Womack and Jones (2003) believe that any activity that does not create value
is considered waste in an LS, while value should be defined based on the customer
perspective; in other words every step, movement or activity that the customer is not
willing to pay for is considered waste, and the organisation must therefore remove it.

22
However, although the concentration in LS is totally on the value added
activity that the customer is ready to pay for, several activities are required to
produce the product; these are called “essential non-value-added activities”.
Moreover, there are some activities that are considered “non-value-added activities”;
these do not add value to either the customer or the product, but the organisation
should not remove them as they are required by rules and regulations (Benson and
Kulkarni, 2011).
Thus, there are three types of value: valued added, essential non-value added
and non-value added activity. In order to be lean, the organisation needs to
differentiate between these activities and try to eliminate all non-value-added activity
that does not add value to the product or to the customer, and is not required by rules
and regulations (Benson and Kulkarni, 2011; Ferdousi and Ahmed, 2010).
The prime objective of LS is to identify the non-value-added activities and
eventually eliminate them, and to minimise the essential non-value-added activities
(Benson and Kulkarni, 2011). Moreover, LS involves trying to shorten lead times
and cycle times, and improve overall organisational performance – and this can only
happen by eliminating wastes (Ferdousi and Ahmed, 2010).
There are eight types of LS wastes that have appeared in lean literature,
namely: defects; overproduction; waiting; wasted talent; transport; inventory;
motion; and over-processing (Benson and Kulkarni, 2011; George, 2003; Womack
and Jones, 2003; Kilpatrick, 2003; Stack, 2012). According to Ohno (1988), these
wastes have accounted for 95 per cent of costs in non-lean manufacturing
environments. Thus, keeping wastes within the organisation will have a huge
negative impact on cost, delivery and quality, and will prevent the organisation from
being lean, while elimination of these wastes will result in higher levels of customer
satisfaction, profitability, throughput and efficiency (George, 2003).
Benson and Kulkarni (2011) explained that regardless of type, all eight
wastes will contribute negatively to the productivity, profitability and flexibility of
the process; in addition, not all wastes can be easily recognised, as some contribute
to value-added activities, and one type of waste could lead to other wastes (for
example, overproduction leads to inventory waste). As LS aims for perfection, even
value-added activities can be improved.

23
As explained by George (2003), the causes of these wastes are from different
sources and areas in the organisation such as:
Poor layout
Long set-up times
Poor workplace
Nonexistence of equipment maintenance
Absence or lack of training
Use of improper methods
Vague procedures, instructions and information
Lack of proper planning
Supplier problems in terms of delivery and quality
Inaccurate gauges
Poor working condition (cleanliness, mass, heat, etc.)
In order to eliminate the eight wastes, the organisation must first understand
where the wastes are coming from. The following section provides an explanation of
the sources of waste, and the effects if they are not fixed and removed.
2.5.1 Defects
This type of waste is the most prominent for any business, and most
companies are likely to face it. It can be identified easily from anywhere in the firm,
from process to management level, and can be seen in non-compliant products or
damaged goods (Benson and Kulkarni, 2011). The source of this type of waste
comes from a lack of: preventive maintenance, standards, inventory control, design,
documentation, quality control, documentation of changes made, awareness of
customer needs, or proper inventory control (Stack, 2012).
Ignoring this type of waste could cost the firm dearly by causing delays in
processes, discarded defective items, extra work for staff, and delays to shipments to
the end customer (Ferdousi and Ahmed, 2010).
To eradicate this type of waste, firms need to have countermeasure activities in
place. This requires: standardising work, activities and changes; ensuring rigorous

24
quality control; being fully aware of work requirements and customer needs; and
providing workers with a checklist to simplify the work (Stack, 2012).
2.5.2 Overproduction
One of lean principles is “pull”, wherein firms need to produce based on
customer demand so that overproduction cannot occur. Anything extra, such as
safety stock, buffers, or work in progress (WIP) inventories, is considered waste in
terms of time, labour and material resources which may be used more effectively in
other departments (Kilpatrick, 2003). Stack (2012) outlined the sources that cause
overproduction to include: producing products that exceed requirements;
unawareness of customer demands and needs; producing based on forecasting, rather
than actual demands; long set-up times; producing to make the most of machines and
keep the finished product on shelves; and poor automation.
The effect of this type of waste can be seen as increasing inventory level,
which eventually leads to high cost (Ferdousi and Ahmed, 2010). Producing more
than needed is a very common practice, as firms usually like to keep safety stock;
however, this can be risky as customer demands can change and there is also a risk
that the products will remain in stock for a long time, which could affect quality.
Moreover, it adds extra works for staff in terms of transportation and inventory, as
well as WIP (Benson and Kulkarni, 2011).
Stack (2012) recommended that in order for an organisation to avoid
overproduction they need to: establish a clear and well-established procedure to
follow for every process at all levels, and create a workflow that will add value to
customers, whether internal or external.
2.5.3 Waiting
According to Kilpatrick (2003), a number of factors could lead to this type of
waste, such as waiting for material, equipment, information, tools, etc. All of these
are considered wastes in LS, as LS requires producing in flow and on a JIT basis.
Stack (2012) showed that this waste could arise from: poor communication; poor
layout; long set-up times; inadequate staff; incompatible production rate; and work

25
absence. Benson and Kulkarni (2011) added that this type of waste could be due to a
lack of planning and scheduling, which will contribute to mismatching between
workers and other departments.
This waste will lead to longer lead times and poor flow, as well as a waste of
time for the company (by not getting the best from its workers) (Ferdousi and
Ahmed, 2010). This will result is the firm’s losing money as they must pay workers
even when they are doing nothing due to delays from other sources (e.g. waiting for
material, information or equipment to become available) (Benson and Kulkarni,
2011).
Stack (2012) recommended several steps to eliminate waiting waste: if there
is a shortage of staff the company must provide an adequate number of workers to
help smooth out the workload; people at lower levels should be empowered to make
decisions when needed, rather than waiting for information and instruction to come
from the upper level; adequate quality controls should be in place to ensure the
reliability of machines and systems; workers should be encouraged to multitask so
that an absence of other workers can be compensated for; and good supply control
should be provided so that staff have the materials or equipment they need.
2.5.4 Wasted talent
Not fully utilising creativity, skills and talent is an important aspect that
companies need to pay attention to. This type of waste can arise when a company
assigns overqualified persons for less demanding jobs (according to George (2003),
this means that the company is not using employees’ mental creativity, experience or
skills, which is considered waste), or pays for training that adds no value to the
current process (Benson and Kulkarni, 2011). Although the assessment of talent is
sometimes a tedious job, companies who understand their people’s capabilities can
do more with less. Thus, the most important thing is to understand people’s potential
and make the most of their skillset by asking for suggestions and ideas to improve
the process (Benson and Kulkarni, 2011).
Failure to address this issue could affect organisational performance and
productivity; this waste is particularly crucial for the organisation, as it may lead to

26
all types of waste if not addressed properly and carefully (Stack, 2012; Benson and
Kulkarni, 2011).
The causes of this waste come from sources such as: poor workflow;
inadequate hiring practices; poor or lack of training; and high employee turnover
(Kilpatrick, 2003). To this list, Stack (2012) added poor communication and
teamwork; poor top management; lack of involvement in problem solving; and lack
of job description, which will result in worker confusion and, ultimately, wasted
talent.
In order to eradicate this waste from the organisation, Stack (2012) suggested
that the top management must empower people and avoid micromanaging them;
treat expert people as experts of the system and try to get the best of them; and
involve people, especially experts.
2.5.5 Transport
Raw materials and finished products should be delivered to the point of use,
rather than going from place to place which adds no value to the customer in LS.
This technique is known as point-of-use storage (POUS) (Kilpatrick, 2003).
Excessive transportation adds cost to the organisation, and wastes time as
well as affecting product quality (Ferdousi and Ahmed, 2010). The causes of this
waste come from: poor layout; poor system design; misaligned process flow; and
unnecessary handling and steps in the system (Stack, 2012; Benson and Kulkarni,
2011).
To get rid of this waste, organisations need to: simplify the process; fix or
amend plant layout to help smooth out the process; handle products only when
needed; and try to make distances between each stage as short as possible (Stack,
2012).
2.5.6 Inventory
This waste arises as a result of overproduction. It can have a negative impact
on the organisation in terms of: affecting cash flow; using valuable space; increasing

27
product lead time; and adding extra work, such as making sure that finished goods or
raw materials are in good shape, which involves employees receiving, inspecting and
moving them, which in turn adds extra cost and moreover might need extra care as
some items require certain conditions to avoid affecting their quality (Kilpatrick,
2003; Benson and Kulkarni, 2011).
For most companies, excessive inventory is due to uncertainties in terms of
customer demands, or a desire to cover variability in the process (Benson and
Kulkarni, 2011). The main sources are: overproduction; unawareness of customer
needs; unreliable suppliers; mismatches in production speeds; and long set-up times
(Stack, 2012).
The organisation can overcome and reduce inventory wastes by applying JIT
and producing only according to direct customer orders (Stack, 2012). Benson and
Kulkarni (2011) suggested that orgnsiations must orders raw material when they are
needed and that finished goods should be sent directly to the target customer.
2.5.7 Motion
This type of waste occurs when there is poor workflow; bad layout; bad
housekeeping lack of documentation of work method; lack of standards; poor
process design and control; and shared tools, equipment and machines (Kilpatrick,
2003; Stack, 2012).
Benson and Kulkarni (2011) suggested that in order to maximise
productivity, workers and operators must wait until the required parts arrive so they
can avoid unnecessary movement; however, this is not always easy to do. However,
the organisation can reduce motion that adds no value to processes or to the product
itself by: improving the workstation layout (for example implementing a U-shaped
layout); ensuring tools, parts and materials are available when needed, in an obvious
place; standardising files, equipment, and work procedures; ensuring an organised
workplace; and keeping everything clean and tidy (Benson and Kulkarni, 2011;
Stack, 2012).

28
2.5.8 Overprocessing
Kilpatrick (2003) showed some common examples of overprocessing waste,
and suggested that it occurs when organisations rework or inspect products when
they should be right first time. Ferdousi and Ahmed (2010) said that using incorrect
procedures, processes or tools in a process leads to overprocessing waste, which add
no value to end customers
Benson and Kulkarni (2011) added that most organisations have some kind
of overprocessing waste as they want to be safe and product excess products as a
precautionary measure. According to George (2003, p. 30), “extra effort that adds no
value to the product (or service) from the customer’s point of view” is considered a
waste in LS.
Other forms of over-processing wastes can include producing incorrect
products, and unnecessary documentation and over-inspection of products. This type
of waste has many negative effects on the firm’s performance in terms of increased
cycle time and impacts on the inventory level.
2.6 Lean principles
For any organisation that wants to implement LS, regardless of its sector,
activities and size, it must understand several things, such as what LS is, how the
organisation can benefit from LS, what type of wastes LS aims to remove, and, more
importantly, the lean principles.
The sections below will shed light on the lean principles that must be fully
understood prior to attempting to implement LS. According to Womack and Jones
(2003), there are five principles of LS: specify value; identify the value stream;
create flow; respond to customer pull; and finally pursue perfection (Table 2). These
principles can only work successfully if there is a culture of empowerment and trust
within the organisation, rather than a command and control culture (Jones et al.,
1999). Oppenheim et al. (2011) claimed that lean thinking is all about understanding
value and waste and how to create value without waste; and this can only be
achieved by applying the lean principles. In conclusion, lean principles aim to
prevent and eliminate the eight wastes.
29
The most important thing to understand with relation to the principles of LS
is not to imitate tools by copying and pasting them in different working areas – there
is a need to understand the requirements behind the principles in order to achieve the
best results. Thus, LS needs to be understood as a socio-technical system, rather than
a bunch of tools (Lander and Liker, 2007), as it consists of two aspects: technical
(for example JIT and Jidoka), and social, which requires the organisation to use the
full capabilities of its workers (Sugimori et al., 1977).
According to Lander and Liker (2007, p. 3696):
Instead of trying to implement kanban [card signal], heijunka [level Scheduling], 5s
[sort, set in order, shine, standardise, and sustain], and poke-yoke [error- or
mistake-proofing], the idea is to design a comprehensive system that satisfies the
principles [...] By understanding Toyota’s system at a principles level we can make
the right choices to ensure that the tools implemented fit the organization and
support its people while achieving the objectives they were designed for.
For example, one of the main principles of LS is to create “flow”, which can
be achieved by moving information and materials quickly and by linking people and
processes (Lander and Liker, 2007). Thus, creating flow does not force the
organisation to go for a specific shape or layout, because every organisation has
different needs, and flow may be achieved by implementing a “U-shape” layout, by
following the first-in-first-out approach, or by simply improving communication.
Organisations can therefore create flow by different means; the most important thing
is to understand the exact meaning of lean principles and then identify the most
suitable way to implement them (Lander and Liker, 2007).
This leads to a promotion of the concept of the learning organisation
(another distinctive feature of Toyota), as the company aims to improve based on
input from employees, and can easily improve its ways of doing things and thereby
eliminate wastes and enhance productivity. For instance, Toyota sees its principles as
a philosophy, rather than as a set of rigid tools; changes in the work routine to
improve performance has been described as the trademark of Toyota (Fujimoto,
1999). According to Lander and Liker (2007, p. 3697), any organisation that wants
to emulate Toyota needs to have three ingredients: “continuously improving,
constantly learning, and relentlessly learning to learn”.

30
Table 2 Five lean principles
Lean principle Definition
Value
“capability provided to customer at the right time at an
appropriate price, as defined in each case by the customer”
(Womack and Jones, 1996, p. 311)
Value stream
“specific activities required to design, order, and provide a
specific product, from concept to launch, order to delivery,
and raw materials into the hands of the customer” (Womack
and Jones, 1996, p. 311)
Flow
“progressive achievement of tasks along the value stream so
that a product proceeds from design to launch, order to
delivery and raw materials into the hands of the customer
with no stoppages, scrap or backflows” (Womack and Jones,
1996, p. 306)
Pull
“system of cascading production
and delivery instructions from downstream to upstream in
which nothing is produced by the upstream supplier until the
downstream customer signals a need” (Womack and Jones,
1996, p. 309)
Perfection
“complete elimination of muda [wastes] so that all activities
along a value stream create value” (Womack and Jones, 1996,
p. 308)
2.6.1 First principle: Specify value
Specifying value is the most crucial point in LS; in addition, “value can only
defined by the ultimate customer” (Womack and Jones , 2003, p. 16). Thus, in order
to define value correctly, the organisation needs to be fully aware of its customers in
terms of their demand and needs; customers are either internal, and thus waiting for
the next process, or external, and thus waiting to pay for the product (Liker, 2004).
Failure to correctly specify value will lead to wastes that, sooner or later, will
cost the organisation dearly. The common mistake for most organisations is to
produce products using already purchased machines, without real orders from
customers; if the customer does not respond the company will decrease the price and
try to sell the product again. According to Womack and Jones (2003), LS helps to
avoid this common mistake by specifying the value that the customer is willing to
pay for.
31
Lean [system] must start with a conscious attempt to precisely define value in terms
of specific product with specific capabilities offered at specific prices through a
dialogue with customers (Womack and Jones, 2003, p. 19).
This step is crucial, as it will help the organisation to focus on what adds
value to its customers so that it can move on to the next step, “identification of the
value stream”.
2.6.2 Second principle: Identify the value stream
Identification of all the activities needed to produce a service or product, and
removing the non-value-added activity, can be done through mapping three main
tasks: problem solving (from concept to detailed design, engineering and launching
the product); information management (from taking orders to scheduling and
delivery); and finally physical transformation (from the raw materials to the end
customers) (Womack and Jones, 2003). By mapping the value stream of the product
or family of products, the organisation will be able to expose the non-value-added
activities that are occurring and creating waste.
Once again, this step is very important as it will allow the organisation to see
the process from start to finish, which in turns will make the non-value-added
activities visible so that they can be removed. The company can then move on to the
third step, “creating flow”.
2.6.3 Third principle: Create flow
This step occurs after the company specifies the value from the customer
standpoint, maps the value stream for the products, and eliminates the unnecessary
steps (Womack and Jones, 2003). The aim of LS is to make products follow a
continuous flow from the raw material to the end customer (Rother and Harris,
2001).
In order to achieve this, Womack and Jones (2003) suggested that firms
must: focus on the whole value stream from raw material to end customer; remove
obstructions to the continuous flow from each department; and apply specific work
practices and tools to eradicate backflows that cause stoppages.
32
All areas within the organisation, such as design, order taking, production,
and distribution, need to participate in creating the flow (Womack and Jones, 2003),
otherwise there will be no benefit to having one department producing products in a
continuous flow and other departments that do not, and the whole process will be
ruined. According to Oppenheim et al. (2011, p. 33), flow means that the
organisation needs to “work through the planned and streamlined value-adding steps
and processes, without stopping or idle time, unplanned rework, or backflow”.
Certain tools in LS serve to enhance the flow, such as 5s, visual control (VS),
standardisation and status indicators (Womack and Jones, 2003).
This step should come after the first two steps, since by that time the
organisation will have specified the value, plotted the value stream and identified the
wastes; in this step, the organisation can identify and remove the non-value-adding
activities, ready for the fourth step: “responding to customer pull”.
2.6.4 Fourth principle: Respond to customer pull
Hopp and Spearman (2004, p. 13) defined a pull system as one that:
Explicitly limits the amount of work in process that can be in the system. By default,
this implies that a push production system is one that has no explicit limit on the
amount of work in process that can be in the system.
Pull is epitomised as a lean principle, and more precisely JIT, as it means
only producing what customers have asked for (which could be raw materials or
products). Having a pull system in place will decrease inventory levels and allow the
organisation to know exactly what the customers are willing to pay for, avoid the
need to produce products based on forecasting, which may lead to products ending
up on the shelf for very long time (Womack and Jones, 2003), and save human effort
and improve staff schedules (Oppenheim et al., 2011). Moreover, pull systems allow
the organisation to have less inventory and WIP, which are considered two forms of
LS wastes, and thus smooth out the production flow (Hopp and Spearman, 2004).
After creating flow, the organisation can manage the pull system as it will
have acknowledged the value and identified and removed the associated wastes.

33
2.6.5 Fifth principle: Pursue perfection
Once the organisation has successfully specified value, identified the whole
value stream, achieved a continuous flow, and let the customers pull their products,
they have to pursue perfection by combining the previous four principles with each
other (continuous flow is not possible if there is waste; nor is pull if there is no flow;
and so on). This means that there will always be some form waste between each step,
and again perfection is a core concept of lean thinking as it urges the organisation to
strive for CI (Womack and Jones, 2003).
Having explained the meaning of each element of LS principles, it can be said
that each element of LS requires:
Customer relationships: all departments within the organisation are working
for customers, so they all need to understand the customers’ needs and
requirements
Supplier relationships: successes in terms of flow and pull are not possible if
there is a delay in raw material or poor-quality raw material, which will
affect the whole process
Skilled and multitasking people: this is necessary in order to be able to
specify value, map the value stream, and solve problems
Empowerment and training: this promotes flow and pull
Good layout: poor layout will lead to difficulties in creating flow, which will
lead to wastes
Efficient management and leadership: these are needed to promote the
implementation as they need to assign people to the right tasks, empower
people, invest in training, and create strategies and vision to promote lean
culture.
In a nutshell, by following the five principles of LS the organisation will be
able to eliminate waste and create value for customers; moreover, it will be able to
analyse its processes and seek perfection on a continuous basis, which will
eventually help the organisation to sustain LS.
34
2.7 Lean tools (lean building blocks)
LS offers the organisation a set of tools and techniques that can be used to
help achieve the objectives of LS – i.e. eliminate the eight wastes and create value.
These tools and techniques are consistent with the main LS pillars, which promote
respect for people and continuous improvement (CI), and with the five LS principles
(value, value stream, flow, pull and perfection). In other words, by implementing
these tools the organisation should be able to follow the five principles effectively
and achieve the LS pillars. According to Karim et al. (2013) the choice of tools is
highly dependent on the manufacturing process; the organisation needs to understand
what it must achieve from LS, and assess its processes before using the tools, in
order to avoid failure.
According to Pojasek (2003), LS building blocks have been explained by
many authors and consultants, so there is some degree of difference in terms of what
to include in them. However, some tools have been used in many authors’ research
(e.g. Kilpatrick 2003; Ferdousi and Ahmed, 2010; Pojasek, 2003). According to
Emiliani and Stec (2005, p. 372), the aim of these tools is to:
simplify work and the workplace, improve quality, reduce lead-time, and focus
people on performing only those activities that create value. Importantly, they also
help people realize their full potential and actualize innate desires to make positive
contributions to the workplace.
The tools below are the most commonly used in the literature, and will enable
the organisation to eliminate wastes and create value.
2.7.1 5S
This relates to visual housekeeping and is the first step of the lean journey
(foundation of LS), as it helps to bring focus to the shop floor to formulate
standardised work procedures that will help in controlling the workplace. 5s is
considered to be the basis of LS as many lean tools, such as visual management,
TPM and standard works cannot be implemented without it; these tools are essential
for removing wastes and creating flow, as well as helping to create a pull system.

35
The benefits of 5s include improving productivity, reducing wastes and enhancing
variation.
5s consists of five activities namely: sort (Seiri), set in order or simplify
(Seiton), shine (Seiso), standardise (Seiketsu), and sustain (Shitsuke) (Bicheno and
Holweg, 2009).
Sort focuses on removing items from the workplace that are not needed for
current production operations (Bayo-Moriones et al., 2010).
Set in order is about placing machines, tools, and storage shelves to reduce
the waste of motion. It focuses on creating efficient and effective storage
methods to arrange items so that they are easy to use, and to label them so
they are easy to find and put away (Bayo-Moriones et al., 2010).
Shine (and inspect) is about cleaning up the storage areas, equipment and
surrounding areas to sustain this improvement (Bayo-Moriones et al., 2010).
Standardise is about putting in place simple, clear and visual standards for
easier visual management – in other words to standardise best practices in the
workplace (Bayo-Moriones et al., 2010).
Sustain involves making a habit of properly maintaining correct procedures,
and is often the most difficult step to implement and achieve (Bayo-Moriones
et al., 2010).
2.7.2 Just-in-time (JIT)
JIT is a pull system, which means production only occurs when customers
initiate demand. This helps to reduce inventory level and increase competitive
advantage in the marketplace by increasing productivity (Gunasekaran et al., 2000).
2.7.3 Total productive maintenance (TPM)
The idea of TPM is to carry out maintenance on a regular basis to avoid any
malfunction or machine breakdown. By following TPM, the focus of the
organisation will be changed from “fixing” to “preventing” equipment faults, which
will save time and money for the organisation. According to Spear and Bowen
(1999), Toyota used TPM as a countermeasures system, rather than to react to

36
problems. The reliability of equipment is very important to keep the flow going
(Abdullah, 2003).
This technique requires participation and contribution from everyone within
the organisation; the key element of TPM is that each worker is responsible for
maintaining their own machine and equipment (Nakajima, 1988), so empowerment
is highly necessary (Ferdousi and Ahmed, 2010).
According to (Duffuaa et al., 1999), TPM is a management approach that
requires participation from all employees to maintain and ensure the productivity of
the equipment. The objectives of TPM are to:
Improve overall equipment effectiveness (OEE) in terms of time availability,
performance efficiency and quality rate.
Take a systematic approach to reliability, maintainability, and life cycle cost.
Involve operations, materials management, maintenance, engineering, and
administration staff in equipment management.
Engage management and workers from all levels to enhance equipment
performance through small group activities and team performance.
TPM is an essential part of maintaining the flow and pull system. Via
successful implementation of TPM the organisation can enjoy several benefits, such
as improving the consistency, reliability and the capacity of machines (Duffuaa et
al., 1999; Bhasin and Burcher, 2006).
2.7.4 Value Stream Map (VSM)
VSM is one of the most powerful lean tools for reducing and eliminating
wastes. It focuses on the process of product flow to the customer, and helps to
analyse and identify waste from non-value-added activities within the process, get
rid of them by looking at the current state as described by a map of the product flow,
and improve the process by establishing a future state map. It requires close
monitoring of the activities that are involved, ultimately, in delivering the service or
the final product to the end customer (Garbie, 2010).

37
The process happens by understanding what adds value to the customer; in
other words, what the customer is willing to pay for. By understanding customer
needs, the organisation can use VSM to identify the value-added, essential non-
value-added and non-value-added activity.
However, despite the benefits of VSM it has some limitations and
shortcomings, as different researchers have explained. For example, according to
Woehrle and Abou-Shady (2010), VSM has several limitations that inhibits it
application within a wider perspective. McDonald et al. (2002) explained that VSM
is not always useful, especially when it is applied in a production line that has
different product families and processes, and different set-up times. Lian and Van
Landeghem (2007) highlighted that VSM is time consuming and incapable of
dealing with the detailed dynamic behaviour of production processes, nor of
incorporating their complexity. Gurumurthy and Kodali (2011) explained that VSM
is static, as it can only capture a snapshot of the shop floor; they further explained
that working on the shop floor is not static, and can change from day to day. Thus,
conducting VSM alone may not tell the whole story about the real action in the shop-
floor.
2.7.5 Kaizen
Kazien is a Japanese term that refers to continuous improvement involving
everyone – including managers and workers; it is both a philosophy and a set of
tools, as it should include all lean tools to help improve the process (Bicheno and
Holweg, 2009). According to Pojasek (2003), Kaizen involves minor adjustments to
the process on a continuing basis.
Kaizen is the concept of improving a process by a series of small continuous steps.
Often times these improvements are small and hard to measure, however the
accumulated effect is significant. (Wilson, 2009, p. 65)
Thus, it helps to continue working to remove all kinds of wastes, which will
eventually help the company to achieve flow, pull and perfection. “Lean cannot be
sustained unless continuous improvement becomes an integral part of an
organisation’s cultural norm” (Radnor et al., 2006, p. 76).

38
2.7.6 Standardised work
Work should be carried out according to an approved standard in terms of
methods used, employee movement and production rate (Takt time, cycle time, work
sequence and in-process stock) (Dennis, 2002; George, 2003). Standardisation
should be applied to work processes as well as management processes, and involves
“creating a precise and commonly understood way to conduct every essential step in
every process” (Womack et al., 2007, p. 290). Bicheno and Holweg (2009)
explained the key aspects that must be understood in relation to standardisation
work:
Standard work is not static; it should be updated when a better way is found.
Standard work supports stability and reduces variations since the work is
performed exactly the same way each time.
Standard work is essential for CI by moving from one standard to better
standards.
According to Dennis (2002), standardised work will help the organisation to
achieve:
Process stability by having clear stop and start points for each process
Kaizen
Better training
Better audit and problem solving
Employee involvement
Poka-yoke (error or mistake proofing)
Organisational learning
Standardised work is essential to promote CI and enable it to occur. As
Taiichi Ohno (cited in Womack et al., 2007, p. 290) suggested, “without standards
there can be no Kaizen”.
2.7.7 Visual management (VM) or visual control (VC)
LS aims to make everything visible in the workplace so that it can be found
straight away when needed (Ferdousi and Ahmed, 2010); several aspects of

39
information and activity could be visually managed in order to help the workflow,
such as production schedules, backlogs, resource utilisation, inventory level, etc.
(Kilpatrick, 2003). All activities should be clearly visible to all workers so that they
can understand the process (Pojasek, 2003) at a glance, which will help to achieve CI
(Grief, 1991). VM is very important for helping with product flow, and is linked
with 5s (Bicheno and Holweg, 2009; Pojasek, 2003).
2.7.8 Cellar design
This refers to the layout being designed according to best possible sequence
to help the flow of material, tools, information, raw material, parts etc. The design
should be based on one-piece flow (Pojasek, 2003). Thus, all material, tools and
information should be placed according to on similar functions in order to increase
efficiency and help avoid non-value-added activities (George, 2003). The most
appropriate design is to use U-shape cells, which will improve communication
between people and enable better utilisation of materials and equipment (Kilpatrick,
2003).
2.7.9 Quick changeover, Single Minutes Exchange of Dies (SMED) and set-up
reduction)
This aspect refers to flexibility in relation to changing tools and fixtures in
order to help with producing multiple products in smaller batches (one of the
objectives of LS) that can be run on the same equipment (Pojasek, 2003; George,
2003). This technique allows more frequent changeovers, which in turn will increase
production flexibility by allowing smaller batch flows (Kilpatrick, 2003; Bicheno
and Holweg, 2009). Thus, it concentrates on reducing production lot sizes and
improving the flow by providing a changeover reduction technique form running the
current product to shift for the next product (Upadhye et al., 2010a).
2.7.10 Pull system
This technique is highly connected with JIT and batch size. Within a pull
system, the supplier only provides material when needed and the organisation only
produces what customers have demanded (Kilpatrick, 2003; Womack and Jones,

40
2003; Pojasek, 2003; George, 2003). It is the opposite of a push system, wherein the
product is produced and kept in stock without customer orders (based on the
forecasts) (Kilpatrick, 2003; Bicheno and Holweg, 2009).
Kanban is a technique and tool that is connected to pull systems, as it helps to
enable process flow. Kanban is used as a signal to indicate material order points in
terms of material needed, where the material is ordered from, and where it should be
delivered to (Kilpatrick, 2003). In order to implement pull, the organisation must
meet two prerequisites: reducing batch sizes and producing fault-free parts
(Åhlström, 1998).
2.7.11 Point of use storage (POUS)
All materials, parts, tools, information standards, and procedures should be
kept and stored in the place they are most needed (George, 2003; Kilpatrick, 2003).
This technique will help to reduce non-value activities such as motion and transport
(Kilpatrick, 2003). It is reliant on 5s and VM, since without proper housekeeping
POUS will not work.
2.7.12 Batch sized reduction
Batch sized is connected to quick changeover techniques, pull, and cell
layout (Åhlström, 1998). The benefit of this tool is that it can reduce the amount of
WIP and thus have a positive impact on the cycle time and lead time, which will
enable the company to deliver required items to customers when needed.
As explained above, the main objective of LS is to produce what customers
want, and batch size reduction can help in this regard. However, LS will not work
unless there is CI in house to reduce batch size (Kilpatrick, 2003). Reducing batch
size will help to move the product to the next process faster, so that it can be
completed quicker and give the organisation better agility in terms of responding to
customer demands, which is key in LS. If the organisation is producing products in
large batches, on the other hand, it will affect the quality of the product and increase
errors, which will lead to overproduction, defects, and waiting wastes, since defects
41
lead to reproducing products, while smaller batches allow the company to avoid
unnecessary steps (Coons, 2007).
2.8 Toyota system
According to Womack et al. (1990), LS is the “Japanese secret weapon” that
led Toyota to success and prosperity and stimulated many organisations around the
world to try to apply LS within their organisation. Liker and Hoseus (2010)
explained that many companies around the world see Toyota as a role model in this
regard, while Bicheno et al. (1997) suggested that Toyota has been regarded as a
benchmark and an example of best practices for companies who want to adopt LS,
and Emiliani (2006) credited Toyota’s success to its creation of LS.
However, most companies who have tried to emulate the Toyota model have
failed, due to the fact that they have been ignorant of the internal culture of Toyota
(Spear and Bowen, 1999). Liker (2004) and Hino (2005) attributed Toyota’ success
to its persistent application of lean principles. Takeuchi et al. (2008, p. 101) stated
that:
[Toyota] values include the mindset of continuous improvement (Kaizen); respect
for people and their capabilities; teamwork; humility; putting the customer first; and the
importance of seeing things first hand (Genchi Genbutsu).
In this regard, it is important to understand the Toyota way of organisational
management, and identify the reasons behind its success in order to understand how
to create a desirable lean culture in any organisation and to understand the
requirements for LS. Understanding the relationships in Toyota among core people
(workers, customers and suppliers) is also important. In addition, it is vital to
identify what respect for people means in Toyota, in terms of knowing how the
leaders lead, how the system works, and finally how Toyota has achieved and
sustained its CI’s culture.
According to Emilliani (2008), few successful LS transformations have been
witnessed in the past years due to this lack of understanding about LS as a
philosophy, since it is often viewed purely as a manufacturing system. More

42
importantly, most companies have failed to successfully implement LS because they
have not understood the concept of value and respect for people as Toyota does.
Schein (1992) emphasised that organisations’ leaders need to focus on the
core of the organisation, which is its basic underlying assumptions. Without
addressing these assumptions, the organisation is unlikely to change or maintain its
culture (Young, 2000). Thus, studing “the Toyota way” is key to enabling the
organsiation to be aware of the requirements for adopting LS.
Liker (2004) explained that the underlying assumptions of Toyota’s culture
are reliant upon two parts: the first is external, and thus starts with customers, and
the second is internal, and thus starts with respecting people and striving for a
continuous improvement in internal culture. Ohno (1988, p. ix) described Toyota’s
culture as follows:
All we are doing [in Toyota] is looking at the timeline from the moment the
customer gives us an order to the point that we collect the cash. And we are reducing
that timeline by removing the non-value-added wastes.
According to Liker and Hoseus (2010), Toyota relies on two main pillars to
drive its business, and these should be embraced by every worker in Toyota – not
only in Japan but also in all their branches around the globe (Toyota, 2005). The first
pillar is “respect for people” and the second is “continuous improvement”. Respect
for people is reflected in two values: respect and teamwork. Respect refers to
“mak[ing] every effort to understand each other, take responsibility and do our best
to build mutual trust” (Hunter, 2013, p. 16); according to Toyota (2005), this can be
achieved by:
Respect for stakeholders
Mutual trust and mutual responsibility
Sincere communication.
Teamwork, on the other hand, refers to “stimulat[ing] personal and
professional growth, shar[ing] the opportunities of development and maximiz[ing]
individual and team performance” (Hunter, 2013, p. 16). According to Toyota
(2005), this can be achieved by:

43
Commitment to education and development
Respect for the individual; realizing consolidated power as a team.
The second pillar, “continuous improvement”, is reflected in three values:
challenge, Kaizen (continuous improvement), and Genchi Genbutsu (going to the
source to make correct decisions) or close to the site (Yoshimori, 2005). In the
following section, these two pillars will be explained in detail.
2.8.1 First pillar: Respect for people
Always treat your employees exactly as you want them to treat your best customers
[…] You can buy a person's hand, but you can't buy his heart. His heart is where his
enthusiasm, his loyalty is. You can buy his back, but you can’t buy his brain. That’s
where his creativity is, his ingenuity, his resourcefulness. (Covey, 2004, p. 58)
Many definitions of respect for people have been posited by authors who
have studied and worked in Toyota (e.g. Sugimori et al., 1977; Takeuchi et al. 2008;
Ohno, 1988; Liker, 2004; New, 2007; Lander and Liker, 2007; Black, 2007; Liker
and Hoseus, 2010).
Sugimori et al, (1977, p. 554) highlited that Toyota embraces respect for
people by “treat[ing] the workers as human beings and with consideration [and]
Build[ing] up a system that will allow the workers to display their full capabilities by
themselves”.
Takeuchi et al. (2008, p. 98) explained the importance of respect for people
in terms of seeing “employees not just as pairs of hands but as knowledge workers
who accumulate chie – the wisdom of experience – on the company’s front lines”.
Hunter (2013, p. 16) described the meaning of respect for people in Toyota as
“refer[ring] to our own staff as well as the communities and stakeholder groups that
surround us and we are part of. We respect our people and believe the success of our
business is created by individual efforts and good teamwork”.
According to New (2007), respect for people in Toyota comes from making
full use of workers’ capabilities and empowering and trusting them through Jaidoka.
Workers in Toyota are given the authority to run and improve the processes they use,

44
which makes them satisfied and motivated to work to the best of their capabilities to
produce as efficient a job as possible. New (2007, cited in Vogel, 1971, p. 668)
stated that:
[Japanese] employees [have] little sense of individual responsibility; but by
stimulating a sense of the involvement in the company’s general effort they excel in
maintaining high motivation to work for the company.
According to Lander and Liker (2007), respect for people in Toyota means
ensuring people’s safety, minimising unnecessary movement, and empowering them
so that they can use their full capabilities to improve and participate in their daily
work. Black (2007) suggested that in Toyota everyone understands his or her role;
they are highly involved and motivated, which is thought to be the best way to get
the most from everyone; this why the company has made respect for people a pillar
in its system.
Takeuchi et al. (2008) stated that Toyota fostered the teamwork approach
early on, and that this has been seen as a guiding principle when problems are found,
since the workers have authority and empowerment to find a solution. According to
Toyota (2005), the main pillars and principles must be followed by every employee
at all levels in their daily work.
The basic HR principles within Toyota that should be followed by all
companies around the world can be summarised as follows (Toyota, 2005):
1. Creating a workplace environment where employees can work with their trust
in the company
Stable employment where layoffs and dismissals are not readily made
Steadily maintain and improve working conditions from a medium- to long-
term perspective
Ensure fairness and consistency.
2. Creating a mechanism for promoting constant and voluntary initiatives in
continuous improvements
Share the management mindset and sense of critical urgency through
thorough communication

45
Reflect business results in working conditions.
3. Fully committed and thorough human resources development
Promote personal growth through work
Communication of the Toyota Way/role.
4. Promoting teamwork aimed at the pursuit of individual roles and
optimisation of the entire team
Thorough consensus building and achievement in a single thrust
Team results and creating a sense of unity.
In Toyota, trust between employees at different levels, as well as
management, represents a fundamental principle. One of the reasons behind the
mutual trust in Toyota is the “job security” policy, which means avoiding layoffs and
terminations to the maximum extent possible, as the company sees its people as the
driver of every change, and without whom the business will not last. Within
Toyota’s stable employment policy, the prime objective is to make people feel
secure, which in turn creates trust (Toyota, 2005).
Moreover, in Toyota, people are highly appreciated and regarded as assets of
the company; the Toyota system is dependent upon people, and thus the company
maximises their ability, skills and creativity, so that its success throughout the years
can be attributed to individual efforts and good teamwork (Toyota, 2005). Takeuchi
et al. (2008, p. 103) stated that in Toyota, “confronting your boss is acceptable;
bringing bad news to the boss is encouraged; and ignoring the boss is often
excused”, which highlights the mutual trust between subordinates and superiors, and
shows that people are empowered to express their views without fear of losing their
job. Toyota believes that providing job security will unleash employee creativity and
ability; if people do not feel secure they will hinder their skills, and thus it is
Toyota’s policy to retain employees for as long as possible. To this end, Toyota has
created an employee moral survey, as well as monitoring job satisfaction (Toyota,
2005).
Strong relationships between top management and employees are highly
required within LS. These relationships can be achieved by showing workers that

46
they are assets to the organisation so they can heavily contribute to the lean process
in terms of providing ideas and suggestions, as well as solving problems, which will
allow them to aid CI. Another type of relationship involves trust between
management and the workforce, which is a fundamental principle in the Toyota
system (Toyota, 2005). Most of the time workers do not share their opinion if they
are not trusted, so they keep silent rather than giving ideas that might cost them their
jobs. Job security or lifetime guaranteed employment is an essential value in the
Toyota culture, and this job security encourages workers to participate and improve
in work processes, which leads to better relationships with top management
(Ichimura et al., 2006).
Some researchers have suggested that promising “lifetime employment” is
risky, as it might make people feel complacent; Toyota realised this concern at early
stages, and has always encouraged its people to work hard, bring new ideas to the
table, and never feel satisfied with results. It encourages this by setting challenging
targets and continuously raising the game, as it believes there is always room for
improvement. According to Radeka (2009, p. 357), “human resources policies that
guarantee long-term employment [in Toyota] create a stable base of accumulated
knowledge to draw from”.
In Toyota, every worker from the top levels to the bottom must feel able to
bring new ideas to the table, which forces people to give maximum effort; this
represents the Toyota culture, in which people have to work and operate in the face
of challenges (Radeka, 2009; Takeuchi et al., 2008). This is how Toyota has
managed to create a distinctive culture that is able to attain CI, as it has succeeded in
encouraging its employee to keep working without fearing of making mistakes, and
encourages open communication, which is a core value of the Toyota culture
(Takeuchi et al., 2008).
2.8.2 Second pillar: Continuous Improvement (CI)
CI is “a company-wide process of focused and continuous incremental
innovation sustained over a long period of time” (Bessant et al., 1994, p. 17).
Bhuiyan and Baghel (2005, p. 761) defined CI as:

47
A culture of sustained improvement targeting the elimination of waste in all systems
and processes of an organization. It involves everyone working together to make
improvements without necessarily making huge capital investments [... which can
be] achieved through the use of a number of tools and techniques dedicated to
searching for sources of problems, waste, and variation, and finding ways to
minimize them.
According to Hunter (2013, p. 15), Toyota declares that:
Continuous Improvement means that we never perceive current success as our final
achievement. We are never satisfied with where we are and always improve our
business by putting forth our best ideas and efforts: we are keen to create better
alternatives, question our accomplishments and investigate future definitions of
success.
The CI in Toyota can be said to comprise three practices:
Challenge – by forming a long-term vision, meeting challenges with courage
and creativity to realise [Toyota’s] dreams.
Kaizen – by improving the business operations continuously, always driving
forward innovation and evolution.
Genchi Genbutsu – by going to the source to find the facts to make correct
decisions, build consensus and achieve goals.
The main enablers for CI are the supportive culture (Hyland et al., 2000),
which is represented in leadership, structure and shared organisational value
(Jabnoun, 2001). The three aspects above can be summarised as follows.
Challenge: “Toyota often sets tough goals to raise employees’ consciousness
and self-worth” (Takeuchi et al., 2008, p. 100). As LS is a never-ending journey, the
pursuit of perfection is an obsession in LS, which means that the organisation has to
challenge its people to keep improving; this is a key issue in Toyota. According to
Balle (2005), Toyota has formed a long-term vision and challenges its workers to
achieve, so that they will never be satisfied even if they reach their goals. Balle
(2005, p. 18) added, “I have yet to meet a lean sensei satisfied with the results of
improvement activity”.

48
Kaizen: this involves “focused and structured improvement project, using a
dedicated cross-functional team to improve a targeted work area, with specific goals,
in an accelerated timeframe” (Farris et al., 2008, p. 10). Toyota is always striving to
be better, and Kaizen in Toyota means that it is improving continuously.
Toyota has huge respect for and understanding of its customers’ needs and
requirements, as customers are the main reason for the existence of any organisation,
and CI involves working to achieve customer satisfaction (Jabnoun, 2001).
In order to achieve customer satisfaction, Jabnoun (2001) advised
understanding the three factors that underlie CI: i.e. driving value, enabling value
and infusion value. Driving value consists of respect, empathy and responsibility; the
enabling values are humbleness, trust, openness and cooperation; and infusion values
are leadership, structure support, control system and explicit behavioural change.
The driving values push people to commit themselves to achieving customer
satisfaction, while the enabling values enable the organisation to achieve the aim of
CI, which is to meet customer satisfaction. Infusion value relates to the top
managements’ responsibility to make the organisation meet the driving and enabling
values, which can be achieved through effective communication at all organisational
levels; leaders should be the first people to demonstrate these values (Jabnoun,
2001).
Several suggestions have been made to help organisation to sustain CI;
Jabnoun (2001) suggested that organisations should have an unambiguous rewards
system to help people commit to CI, while top management must create facilities that
help CI, and promote empowerment, cooperation and trust so that people can
participate, and be challenged through an explicit behavioural change programme
with measured targets.
Bhuiyan and Baghel (2005) believed that Kaizen or CI can be performed at
three levels: group, individual and in management. Group-oriented Kaizen can be
represented as a quality circle in which a group of people work to solve problems or
improve processes; individual-oriented Kaizen is followed in Japanese systems in
which the shop floor worker individually makes a recommendation to solve
problems or improve processes; and finally management-oriented Kaizen focus on

49
the company’s strategy, in which every member should be involved to form and
approve; it is considered a very important aspect of Kaizen.
Genchi Genbutsu: this approach is followed by Toyota to identify the source
of problems and improve incrementally on the production site (Yoshimori, 2005). In
Toyota, shop-floor staff deal with problems on site so that they can see problems for
themselves, rather than relying on books and theories, so Toyota follows an “on-the-
job training” method so its people can experience problems in real time and
eventually learn to solve them (Yoshimori, 2005). Further, Balle (2005) said that the
Genchi Genbutsu approach involves an “anti-meeting room” in which discussions
and meetings happen with the involved people in the working area in front of the real
situation.
Takeuchi et al. (2008) said that this approach is an essential aspect of
Toyota’s success, as “if you have not seen something first hand, your knowledge
about it is suspect”, and this approached is deeply instilled in all Toyota workers,
from top management to shop-floor workers. Further, this approach allows everyone
in Toyota to follow the same procedures to solve problems so that there is a standard
for every problem (Radeka, 2009).
2.8.3 What Toyota’s culture looks like
Liker (2004) described the details of Toyota’s culture that make it extremely
strong. He highlighted Toyota’s endeavours to make its people feel part of the
company and vice versa (ownership) by mixing and socialising them with different
departments from an early stage. Liker (2004) further highlighted that Toyota’s
leaders believe and have trust in their people, and understand that investing in people
is key to the company’s success.
Marksberry et al. (2011) explained that Toyota’s success lies in its culture,
which offers long-term vision, incentives and rewards to help managers encourage
people to participate in ongoing activities undertaken in the organisation.
Liker and Hoseus (2010) described the importance of trust in Toyota’s
culture as distinctive. They said the trust in the company has not come through

50
words, but rather through policy and daily interaction among members, which
eventually encouraged them to feel part of Toyota’s family.
The strength of Toyota’s culture relies on many aspects, one of which is the
encouragement of managers and the fact that they lead their colleagues by example;
solve problems in a collective way; and make decisions based on fact, hearing all
voices and being patient. Most importantly, Toyota tends to encourage its managers
to view every action in the real working area, rather than getting feedback from shop
floor workers (Marksberry et al., 2011), as the managers in Toyota are educated
from the early stage to perform problem solving in their own department (Womack
et al., 2007).
Furthermore, managers in Toyota always have time to listen to their
employees’ problems and recommendations. Takeuchi et al. (2008) explained the
characteristics of Toyota’s executive which allow them to earn respect from and
sustain CI. Thus, in Toyota, the managers have the following:
Willingness to listen and learn from others
Enthusiasm for constantly making improvements
Comfort with working in teams
Ability to take action quickly to solve a problem
Interest in coaching other employees
Modesty
Additionally, Toyota amplifies management’s focus on the CI system by
challenging people to look outside the box to identify innovative approaches to
improve the current system (Marksberry et al., 2011). In doing so, the management
system in Toyota puts efforts into making sure that managers are creative and highly
committed to attaining the goals of the company.
The core competence of Toyota is the organisational culture, which is
represented in its respect for people and continuous improvement, which has not
changed since its origins (Liker and Hoseus, 2010). Similarly, Emiliani (2008) says
that people at all levels, including employees, suppliers, customers, investors and
communities, are included in the organisational cohesive culture. Toyota’s vigour

51
has come from its people, and each employee in the company is called a team
member. Each of them is also aware of the company’s annual and future plans in
order to achieve the desired success. Random movement or behaviours are not
accepted in Toyota, and each worker performs according to the company’s
philosophy and principles (Liker and Hoseus, 2010).
Due to the fact that people are the key assets of the company, Toyota’s
approach is to wisely select people and to be patient in developing their capacity,
which takes a long time, as it believes that people can drive the wheel of
improvement that will lead the company to a competitive advantage. This principle
is represented in Toyota’s basic underlying values (Liker and Hoseus, 2010). Liker
(2004) and Liker and Meier (2007) suggested that the key driver for competitive
competency of Toyota is its way of developing team members; “[Toyota] places
humans, not machines, at the centre of the company” (Takeuchi et al., 2008, p. 104).
According to Young (2000), Toyota makes small but constant improvements
in its plants in order to allow its workers to understand and be aware of these
improvements. This principle is crucial and significant for LS.
Another distinctive characteristic of Toyota is its “learning culture”, which is
linked directly to customer management. In doing so, the company can swiftly cope
with the fluctuations of customer demand (Young, 2000), and this may not be easy
to imitate, particularly for companies who wish to follow Toyota’s practices.
According to Liker (2004), Toyota’s success in maintaining a learning organisation
environment has come from its philosophy of understanding its people and being
aware of the motivational factors of human resources in any manufacturing
organisation. This has enabled the company to foster a leadership and teamwork
culture that has helped the company to build a robust relationship with its suppliers.
Yamamoto and Bellgran (2010) explained the fundamental mindset of LS
that has been driven by experienced TPS consultants; they suggested that there must
be a need to start the improvement, which should be led by people on the shop-floor,
and that this can happen by allowing people to solve problems, which will result in
developing their capabilities and improving the operation, as well as the
organisational learning capability. Yamamoto and Bellgran (2010, p. 124) suggested
that LS is driven “occasionally by force, creat[ing] a situation where people have no

52
choice (or little choice) but to feel the need of improvement”. Thus, instead of
creating detailed plans which, most of the time, make no sense to the workers, the
organisation needs to create a need or sense of urgency, and challenge its people to
rise to this.
Marksberry et al. (2011) described Toyota as a distinctive example, since it is
widely recognised as a learning organisation which keeps improving over time and
strives to develop a challenging environment for people. This has helped the
company to react and respond to market changes more effectively than other
companies.
Sugimori et al. (1977) emphasised that the most distinctive feature of Toyota
is the human element, in which the workers are respected and empowered as they are
allowed to present and express their ideas for improving the process through active
contribution.
Furthermore, Spear and Bowen (1999) confirmed that Toyota is a learning
organisation as it tends to encourage people to take innovative, learn novel skills,
and perform efficiently. Thus, in Toyota, every improvement tool, such as problem
solving, process improvement and machine/worker connection, works according to
the proper techniques/procedures. These are mandatory for people at every level in
the company (Spear and Bowen, 1999).
As explained above, a number of companies in various sectors have tried to
imitate Toyota, but due to a lack of understanding the core principles, such as
organisational culture, these attempts have been unsuccessful (Spear and Bowen,
1999). Further, Spear and Bowen (1999) suggested that there are four key rules that
must be understood for an organisation to be successful in LS. These rules are as
follows:
i) How people work;
ii) How people connect;
iii) How the production line is connected; and
iv) How to improve.
Spear and Bowen (1999) found that these four rules are the secret weapons
of Toyota that have driven the company to be successful throughout the years. By

53
following these rules, Toyota has made clear to its people how to work on a daily
basis in order to avoid ambiguity and misunderstanding. According to Marksberry et
al. (2011), Toyota has achieved this by instilling the teamwork spirit in each
employee, and applying a strategy called Hoshin Kanri, which aligns resources and
precisely explains the goals to be achieved; therefore, each worker aims and
contributes to achieving the same level of outcome. Spear and Bowen (1999) further
explained that nothing is hidden in Toyota, and all workers are aware of the ideal
production rate required in order to perform accordingly, and improve their approach
if required.
Many traits and attitudes have driven Toyota to succeed and made Toyota’s
workers different from other workers around the globe. Some of these traits include a
sense of fairness at work, a willingness to improve, security at work, with Toyota’s
lifetime employment policy, no barriers between senior management and shop floor
workers, and the chance to be promoted to managerial positions. These attitudes and
traits have consolidated senior management with workers, and made them a robust
unit (Sugimori et al., 1977). This has helped Toyota to execute its targets; however,
some of these traits are not easy to imitate. According to Briggs (1988), a number of
traits and attitudes are not exportable commodities, as they are so tightly bound to
the Japanese culture and values.
Another issue that makes Toyota exceptionally distinctive is its relationship
with suppliers. Toyota believes that suppliers are the cornerstone of its production
system and that without a strong relationship with suppliers, LS is unlikely to happen
(Vaghefi et al., 2000). Strong relationships with suppliers means involving them in
processes, and an institutionalised set of practices between both parties to help
transfer knowledge, and to learn quickly in engineering, designing and
manufacturing (Vaghefi et al., 2000). These practices are not easy to achieve by
other companies unless they also transfer their culture and values.
Further, Toyota looks at communication in the workplace with employees as
the backbone for every activity, and communication is highly appreciated in Toyota,
so that the company has established formal ways in which to promote
communication, such as Labour-Management Councils, Joint Labour-Management

54
Round Table Conferences, and various subcommittees, as well as establishing a
hotline that employees can use to complain if they face problems (Toyota, 2005).
According to Takeuchi et al. (2008, p. 100), Toyota considers open
communication as “a core value, [and] has made its culture remarkably tolerant of
failure” (Takeuchi et al., 2008, p. 100), where people can freely present their ideas
and communication is easy between all departments. Furthermore, Takeuchi et al.
(2008) suggested that information in Toyota flows freely from top to bottom and
across functional and seniority levels, as well as between suppliers and customers.
Another issue that highlights Toyota’s respect for people is its health and
safety policy, which is considered one of the main foundations that Toyota
concentrates on. As respect for people is one of the two pillars that Toyota stands on,
the company has striven to create a healthy and energetic workplace; every member
in Toyota is responsible for safety, from senior executives to shop-floor workers
(Toyota, 2005; Liker and Hoseus, 2010).
2.9 Lean within the SME context
Due to globalisation, the market has become more accessible for everyone; in
order for SMEs to enjoy the benefits of globalisation, it is imperative that they adopt
quality QI, as many large companies around the globe are highly reliant on SMEs as
suppliers or sub-contractors, and large companies require a quality guarantee from
SMEs in terms of services, materials, products, deliveries, etc. (Sohail and Hoong,
2003).
There are many ways for SMEs to contribute to the world’s economic
development, as they are the key to economic prosperity, and most leading
companies were SMEs before they evolved. The significant contribution of SMEs
can be seen in areas such as reducing poverty by creating jobs, providing
sustainability by generating sustainable sources of revenue and development
processes, and motivating workers towards innovation. Acs and Audretsch (1990)
declared that SMEs act in a positive way with respect to innovative activity, and that
these contributions by SMEs benefit the whole economy.
55
2.9.1 The role of the SMEs in economies
SMEs are vital for the prosperity of economies (Ghobadian and Gallear,
1997). Culkin and Smith (2000) declared that SMEs make up the largest business
sector in every world economy; the importance of SMEs has been well documented,
as many governments around the world have shown interest in promoting them by
supporting their growth and making them part of the country’s national development
(Wang et al., 2007).
The impact of SMEs on the economy is very obvious, and a number of
empirical studies have shown how large the impact of SMEs is in terms of
developing economies. SMEs make major contributions to GDPs; according to Fida
(2008), in high-income countries SMEs contribute over 55 per cent of the GDP and
65 per cent of total employment; in middle-income countries SMEs account for 70
per cent of the GDP and 95 per cent of employment; and in low-income countries
they contribute over 60 per cent of the GDP and over 70 per cent of employment.
In most industrialised economies there is a great reliance on SMEs, as bring
a great deal to the economy in terms of creating jobs, reducing poverty and the
increasing societal welfare (Fida, 2008). SMEs have been praised by many
researchers (e.g. Wang et al., 2007; Peacock, 2004; Hashim and Abdullah, 2000) for
their role in promoting economic growth, which reflects on the GDP and leads
governments around the world to acknowledge the importance of SMEs and make
them part of their national economy (Abdullah, 2000).
In addition, SMEs can have a direct impact on the world’s economy as a
whole, as they have the power to alleviate poverty by creating jobs; moreover, they
serve as a machine for economic growth as they promote trading, employment,
developing and innovating. According to Wang et al. (2007), SMEs have shown
tremendous results around the world and are vital for creating economic growth and
employment. As a good example of this, SMEs in the United Arab Emirates (UAE)
created 86 per cent of jobs in the country, while this figure was 51 per cent in the
US, 52 per cent in the UK, 75 per cent in Egypt, 77 per cent in Turkey, 80 per cent in
Pakistan and 48 per cent in Morocco (Rampurwala and Marafi, 2011).

56
In terms of GDP, SMEs’ contribution accounted for 51 per cent in the USA
and UK, 30 per cent in New Zealand and Australia, 57 per cent in Japan and Canada
(Wang et al., 2007), 28 per cent in Saudi Arabia, 30 per cent in the UAE, 25 per cent
in Egypt, 32 per cent in Turkey, and 30 per cent in Pakistan (Rampurwala and
Marafi, 2011). From these sample statistics, how effective SMEs are in each
economy (especially in developed countries) can be determined, and this is not
restricted to certain countries.
Hashim and Abdullah (2000, p. 193) highlighted the importance of SMEs,
and this was summarised by Ibilski (1997, p. 1), who stated that SMEs are:
Mighty minnows, reflecting the competitive spirit that a market economy needs for
efficiency; they provide an outlet for entrepreneurial talents, a wider range of
consumer goods and services, a check to monopoly inefficiency, a source of
innovation, and a seedbed for new industries; they allow an economy to be more
adaptable to structural change through continuous initiatives embodying new
technologies, skills, processes or products.
Notwithstanding the contributions of SMEs, they also face a huge shortfall.
According to Jocumsen (2004, p. 659), SMEs are “plagued by high failure rates and
poor performance levels”, and this has been attributed to their lack of strategic
planning and a general lack of acknowledgment of the importance of SMEs (Wang
et al., 2007). The lack of strategic planning within SMEs comes as a result of many
factors, such as a shortage of time, inadequate knowledge of the planning process,
and the fact that SMEs sometimes are unwilling to share strategic plans with
external consultants and employees (Robinson and Pearce, 1984).
Other researchers (e.g. Stonehouse and Pemberton, 2002) have suggested
that SMEs struggle due to the small size of their business, while Shrader et al.
(1989) believe that the type of business affects SMEs in terms of clear strategic
planning. Wang et al. (2007) declared that strategic planning is the main factor that
is lacking within SMEs, and suggested that ownership motivation is key to creating
effective strategic planning within SMEs.

57
2.10 Inhibiting factors for SMEs that may prevent the implementation of lean
system
According to Ghobadian and Gallear (1997), SMEs are slow at embracing QI,
and this can be attributed to factors such as a lack of resources, a lack of skilled
people, and ineffective relationships with customers and suppliers – the opposite of
which is required to succeed in LS and most of QI. Achanga et al. (2006) declared
that LS is not implemented in SMEs with any conviction, and SMEs are reluctant
and unwilling to adopt LS unless they know the exact benefits of it.
SMEs face huge difficulties when it comes to the implementation of QI such
as LS, including financial constraints and limitations in terms of other required
resources (Ghobadian and Gallear, 1997) especially when it comes to suppliers and
customers (Golicic and Medland, 2007).
Yusof and Aspinwall (1999) identified some of the factors that have affected
Qatari SMEs with respect to the implementation of QI. Among these factors are:
human and technical aspects, lack of resources, and shortage of finance.
SMEs are usually constrained by their size, and lack of technical expertise,
managerial time, financial resources, and human resources, which affect their QI
(Moreno-Luzon, 1993; Lee and Oakes, 1995).
Introducing LS requires cultural change (Abrahamsson and Isaksson, 2012)
at different levels within the organisation, and top management needs be aware of
this. Ghobadian and Gallear (1997) suggested that it is more difficult for top
management in SMEs to acknowledge a need for change, and this can be attributed
to factors such as their limited resources and external contacts, pressures on top
management’s time, and the style of management. Without buy-in from top
management, LS cannot be introduced.
Karlsson and Åhlström (1997) declared that customer input and relations are
highly recommended by LS, and SMEs face difficulties in involving their customers
in product design; however, the authors emphasised that “size does not exclude the
usage of significant end-users for feedback” (Karlsson and Åhlström, 1997, p. 948),
so integrating customers should be achievable by SMEs.

58
Lee and Oakes (1995) pointed out that there are some other factors that can
prevent SMEs from implementing TQM, such as lack of finances (for example to
provide training) and technical resources (such as expertise that would help to
initiate and improve the system), and a lack of know-how.
Achanga et al. (2006) pointed out the inhibitors as a lack of leadership and
funding, which prevent SMEs from creating cultural awareness towards LS and
developing employee skills. According to Ghobadian and Gallear (1997), there are
several factors that can affect SMEs’ culture with respect to TQM, such as:
Education and training
Employee participation programmes
Enhanced communication programmes
Revision of procedures and policies
Modification of evaluation and reward systems
Behaviour of top managers.
Antony et al. (2008) explained that SMEs have some weaknesses towards
readiness for quality, and that these come from different sources such as planning,
employee perspective, top management and human development.
In terms of planning, SMEs’ main focus is on operational matters; they do
not have a long-term vision and their main concern is on the short term, while their
strategy is mainly based on intuition, rather than logic or analysis, and they lack
standardised and documented work. Thus, since LS is a long-term journey, it can be
difficult for SMEs as they are short-term, rather than long-term, oriented (Ghobadian
and Gallear, 1997).
In terms of employee perspective, it is difficult for SMEs to offer job
guarantees, so workers can be made redundant easily and this will affect quality, as
highly skilled workers may prefer not to work in unstable companies and this could
prevent SMEs from attracting highly skilled workers. In addition, due to their lack of
resources they also lack reward systems and incentives. Another difficulty relates to
the fact that employees’ career goals may not be attainable within SMEs (e.g. being
promoted to managerial level), which makes it difficult to hire and retain high-
calibre people (Ghobadian and Gallear, 1997).

59
In terms of top management, managers in SMEs are often stubborn; this is
not healthy for LS, which require flexibility between superiors and subordinates.
Although SMEs have fewer layers of management, which should make them
flexible, they can often be rigid and inflexible due to the fact that owners and top
management mainly dominate the culture (Moreno-Luzon, 1993). Moreover SMEs’
owners and top management are not highly trained, and are unaware of the
management aspect required to initiate QI (Ghobadian and Gallear, 1997).
Finally, in terms of human development, SMEs have difficulty in providing
employees with training due to their lack of finances, vision and awareness of QI
needs (Antony et al., 2008).
LS requires people who can multi-task, since in SMEs employees are often
responsible for different areas (Moreno-Luzon, 1993). Although this is a good thing
for LS, it can be negative if employees are not well trained. Haksever (1996)
explained SMEs’ inhibitors in relation to a lack of business experience and
knowledge by owners and managers, as well as a shortage of human resources and
financial requirements.
Guardian and Gallear (1997) declared that SMEs always struggle to achieve
QI (such as ISO 9000) due to several factors, such as the requirements of these
systems, which are sometimes beyond SMEs’ abilities and require huge management
commitment and buy-in. Furthermore, in order to be successful in QI, SMEs need to
have skilled people and necessary technical equipment (Price and Chen, 1993),
which is not always obtainable by SMEs.
Schollhammer and Kuriloff (1979) found that the barriers for SMEs lie in
their lack of knowledge and technical expertise. Another obstacle is the availability
of time, as quality management requires a large amount of time to implement and
sustain, and SMEs might not be able to afford this (Deshpande et al., 1986; Powell
and Gran, 2012). The time constraint is also likely to preclude SMEs from deploying
the performance measures required by LS. Ghobadian and Gallear (1997) took a
similar view, and discovered that the main resource that SMEs lack is time, which
delays their progress of TQM. However, the authors believed that lack of resources
does not preclude SMEs from adopting TQM and other QI.

60
2.10.1 Enabling factors for SMEs that may help them to adopt LS
On the other hand, several researchers (e.g. Ghobadian and Gallear, 1997;
Oviatt and McDougall 1994; Karlsson and Åhlström, 1997; Ahire et al., 1996;
Haksever, 1996) have suggested that SMEs have fewer barriers to succeed in QI.
According to Oviatt and McDougall (1994), SMEs have a better chance of adapting
to change compared with large companies, as they can internalise and crystallise
information across entire departments more efficiently. Moreover, SMEs are less
hierarchical and bureaucratic than large firms, which means that they are better at
responding to change (Ghobadian and Gallear, 1997).
Antony et al. (2008) suggested that SMEs have the potential and dynamism
to adopt any QI, such as LS and Six Sigma, as they have some strengths that should
given them advantages. Some of these strengths include: their size, which gives them
the ability to accept change; their flexibility, which means that they do not need
radical change and can take what they want from LS, and have low resistance to
change; and their ambitiousness to learn, which allows them to compete in the
market and adapt new systems to stay alive.
Lee and Oakes (1995) showed that TQM is applicable to SMEs as they have
the ability to build the required culture in terms of leadership and work force
involvement much more easily than large companies, since they have relatively little
functional differentiation, which makes the management very close to workers.
Antony et al. (2008) shared the same view, suggesting that the organisational culture
in SMEs is full of energy and that they are willing to “learn and change” rather than
“control”; the SME culture is more friendly, since relationships between workers and
top management are loose and informal.
Bonavia and Marin (2006) and Lee (1997) declared that LS is applicable to
SMEs as they have their own strengths on which they can capitalise when they are
attempting to introduce new changes. They are more flexible, able to respond
quickly, have versatile human resources, and suffer less bureaucracy than larger
organisations.
Top management and leadership are essential for any QI implementation;
SMEs have an advantage in this regard as top management is highly visible, unlike

61
in large organisations where top management has to make an effort to be visible in
working areas. The level of horizontal and vertical visibility is higher in SMEs than
in large organisations, which in turn enhances the level of commitment and support
towards other departments, which can directly and indirectly influence changes in
corporate culture; this is an important factor in the successful implementation of
quality management initiatives (Antony et al. 2008; Ghobadian and Gallear, 1997).
Due to their smaller size, SMEs have more chances to be closer to customers,
as their employees are close to the products which will enhance employees’
responsibility and market awareness, and make them more motivated to produce
what the customer wants, which is essential for QI (Antony et al., 2008; Garvin,
1991).
Another distinctive feature of SMEs is the small number of staff and
management layers, which allows them to implement effective cross-functional
training (Ghobadian and Gallear, 1997). Smaller numbers of employees make
changes easier and faster, as changes can be transferred to other groups easily. In
addition, the company’s strategy can be easily understood by all employees, so that
SMEs have better chances to create an atmosphere that helps employees to develop
and implement new ideas. Further, it is easier for SMEs to empower people (Phillips
et al., 1983), compared to large organisations.
Employees in SMEs can also easily be made aware of the company’s
profitability, which can motivate them to reach the organisation’s target and become
more committed to improving the business (Garvin, 1991; Antony et al., 2008), and
will make their efforts and results be seen more easily (Antonyet al., 2008;
Ghobadian and Gallear, 1997).
Another distinction is the organisational structure: SMEs are flat, and
decision making is shorter as a result of fewer management layers, which lead to
better organisation between departments as well as less resistance to change
compared with larger organisations. It is also simpler for SMEs to implement TQM
(Ghobadian and Gallear, 1997; Haksever, 1996), as the SMEs are less bureaucratic
than large organisations, which makes coordination and communication between
staff smoother (Phillips et al., 1983; Haksever, 1996). This is consistent with
Åhlström’s (1998) findings, which suggested that hierarchical level is linked to
62
organisational culture; LS requires as little hierarchy as possible, since the
responsibilities and authority in lean culture come through the lowest level of the
organisation to avoid delaying processes.
In a nutshell, Ghobadian and Gallear (1997) compared ability to achieve, and
chances to succeed in, QI implementation between large firms and SMEs based on
six areas, namely: structure, procedures, behaviours, processes, people and contact.
Table 3 shows the characteristics of both types of organisation in relation to the
many factors required by LS, as well as other QI. It shows that SMEs have great
chances to succeed in LS, as most of the lean requirements shown in Table 3 are
within SMEs’ capabilities.

63
Table 3 SMEs vs. large organisations.
Source: Ghobadian and Gallear (1997
Large SMEs
Structure
Hierarchical, with several layers of management. Flat, with very few layers of management.
Clear and extensive functional division of activities. Division of activities limited and unclear.
High degree of specialisation. Low degree of specialisation.
Rigid structure and information flows. Flexible structure and information flows.
Top management a long distance away from the point of delivery. Top management close to the point of delivery.
Top management’s visibility limited. Top management highly visible.
Multi-sited and possibly multinational. Single-sited.
Many interest groups. Very few interest groups.
Normally slow response to environmental changes. Normally rapid response to environmental changes.
Low incidence of innovativeness. High incidence of innovativeness.
Cultural diversity. Unified culture.
Procedures
Activities and operations governed by formal rules and procedures.
High degree of standardisation.
Activities and operations not governed by formal rules and procedures.
Low degree of standardisation and formalisation.
System-dominated. People-dominated.
Rigid and unadaptable processes. Flexible and adaptable processes.
Incidence of fact-based decision making more prevalent. Incidence of “gut feeling” decisions more prevalent.
Fragmented decision makers. Few decision makers.
Behaviour
Mostly bureaucratic. Mostly organic.
Strong departmental/functional mindset. Absence of departmental/functional mindset. Corporate mindset.

64
Cultural inertia . Fluid culture.
Meritocratic. Patronage.
Rigid corporate culture dominating operations and behaviours. Operations and behaviour of employees influenced by
owners’/managers’ ethos and outlook.
Process
Extended decision-making chain. Short decision-making chain.
Complex planning and control system. Simple planning and control system.
Strategic process generally deliberate and formal.
Strategic process incremental and heuristic.
Formal evaluation, control and reporting procedures. Informal evaluation, control and reporting procedures.
Control-oriented. Result-oriented.
People
Personal authority mainly low. Personal authority mainly high.
Individual creativity stifled. Individual creativity encouraged.
Dominated by professionals and technocrats. Dominated by pioneers and entrepreneurs.
Range of management styles: directive, participative, paternal. Range of management styles: directive, paternal.
Individuals normally cannot see the results of their endeavours. Individuals normally can see the results of their endeavours.
Ample human capital, financial resources and know. Ample human capital, financial resources and know.
Training and staff development is more likely to be planned and large-
scale.
Training and staff development is more likely to be ad hoc and small
scale.
Specified training budget. No specified training budget.
High incidence of unionisation. Low incidence of unionisation.
High degree of resistance to change. Negligible resistance to change.
Potentially many internal change catalysts. Very few internal change catalysts.
Contact

65
Wide span of activities. Narrow span of activities.
Extensive external contacts. Limited external contacts.
Large customer base.
Small customer base.

66
2.10.2 Applicability of lean systems within the SME context
Lean concepts and techniques have been extensively discussed in the past,
with particular attention given to large organisations (White et al., 1999; Conner,
2001; Achanga et al., 2006); however, there is a lack of empirical studies on lean
CSFs focused on SMEs (Achanga et al., 2006; Bruun and Mefford, 2004; Anand and
Kodali, 2008; Upadhye et al., 2010b; Golicic and Medland, 2007).
According to Rose et al. (2011), LS is considered to be the best
manufacturing system in the 21st century, and entails 17 practices that are
specifically applicable to SMEs, plus hundreds of lean practices that are available
and being implemented by many different-sized industries (Pavnaskar et al., 2003).
Table 4 demonstrates the applicability of lean practses within SMEs.
Upadhye et al. (2010a), in their study on the importance of lean
manufacturing system to achieve sustainable development of organisations in India,
suggested that although lean tools are well known and very popular in India,
especially among large companies, SMEs in India do not fully use them.
Many authors have alleged that LS are more suitable for large industries than
SMEs (e.g. Shah and Ward, 2003; Achanga et al., 2006; Wong et al., 2009; Powell
and Gran, 2012); they argue that there is difficulty for SMEs to cope with LS due to
their lack of required resources and capabilities. However, other researchers disagree
(e.g. Ghobadian and Gallear, 1997; Karlsson and Åhlström, 1997; Ahire et al.,
1996), stating that size does not affect a firm’s ability to implement LS/QI, and that
SMEs can implement these systems as effectively as large organisations can.
According to Karlsson and Åhlström (1997), lean principles are within
SMEs’ capabilities, and just because LS came from a large multinational company
(Toyota), it is not the case that it cannot be implemented in smaller firms. Ghobadian
and Gallear (1997) took the same view, stating that the essential requirement for
TQM is within SMEs’ capabilities.
Due to aspects including financial constraints and limitations in terms of
resources such as skilled people, especially when it comes to suppliers and
customers (Golicic and Medland, 2007), SMEs could face huge difficulties in

67
implementing LS, though they can undoubtedly benefit from at least some of the
lean tools available (Bonavia and Marin, 2006; Lee, 1997).
Furthermore, according to Oviatt and McDougall (1994), SMEs have a better
chance of adapting to change compared to large companies, as they are less
hierarchical and less bureaucratic than large firms, and can thus internalise and
crystallise the information across entire departments more efficiently than large
corporations can.
With regards to SMEs themselves, Mallur et al. (2011) found that there is no
notable difference between small firms and medium-sized firms in terms of their
implementation and perceptions of TQM. However, Kumar and Antony (2008)
found that, due to their lack of resources, smaller firms pay less attention to quality
departments and the formation of problem-solving teams (factors that are essential
for LS) than medium-sized firms do.
Similarly, Temtime and Solomon (2002) found that there is a significant
difference in TQM behaviour between medium-sized and small firms, as medium-
sized firms are able to obtain more top management and leadership commitment;
have a better quality culture and philosophy; and are more able to focus on process
quality and improvement.
Gunasekaran and Lyu (1997) suggested that in order for any organisation to
establish LS, the organisation must have certain factors in place, such as strong
relationships with suppliers and customers, a readiness to invest and provide
training, top management buy-in and commitment, purchasing only required
materials and parts in order to enable JIT, revisiting the layout to ensure that the
process helps the flow of materials, ensuring there is a clear process to identify
value- and non-value-added activities, and finally well-educated and skilled workers.
Rose et al. (2011) pointed out that there is currently no standard model for
LS implementation that SMEs can adopt, as different researchers take varying
perspectives, but they do show that SMEs should go for the least costly practices,
such as 5s, VC or VM, standardisation of operation, statistical process control (SPC)
and quality circles (QC).

68
Lee (1997) suggested that SMEs should be focusing on the feasible practices
that are relatively low-cost and still manageable. These practices include 5s, QC,
preventive maintenance and employee involvement. A similar suggestion was made
by White et al. (1999), who suggested that most US SMEs are adopting QC and
getting employees to multitask.
A study undertaken by Herron and Braiden (2007) specifically suggested that
the five practices that should be followed by SMEs are: employee involvement,
standardisation, QC, set-up reduction, and 5’s.
Although, some researchers (e.g. Anand and Kodali, 2009; Liker, 2004) have
suggested that lean practices should be implemented as a full package, Golicic and
Medland (2007) believed that LS can be applied partially; by applying those
practices suggested earlier, SMEs can improve their performance gradually, and
eventually be ready for more advanced practices (Rose et al., 2011).
From the literature, it appears that there is no unified agreement about what
tools SMEs should use. Thus, organisations must understand their needs before they
attempt LS, which may save them money and effort.
However, based on Rose et al. (2011), there are several recommended tools
and practices that have been used mostly by SMEs, as shown in Table 4.

69
Table 4 Recommended practices for SMEs.
Source: adapted from Rose et al., 2011)
Recommended Practices for SMEs from the
Literature
Author(s)
1 2 3 4 5 6 7 8 9 10 11 12 13 14 15
Multi-tasking by employees *
*
*
*
*
*
*
Quality circles * *
*
*
*
* * * * *
Set-up time reduction *
*
*
*
* *
5s *
*
*
*
* * *
Kanban *
*
*
*
Continuous flow *
*
*
*
Preventive maintenance *
*
*
* *
Small lot size *
*
*
Total Quality Control (TQC) *
*
Kaizen (CI) *
*
*
Cell layout *
*
*
Standardisation *
*
*
* *
Training *
*
*
Focused factory *
Supplier management *
*

70
Visual control *
* *
Employee involvement * * *
Note: [1] Womack et al. (1990); [2] Taj (2005); [3] Dankbaar (1997); [4] Papadopoulu (2005); [5] Billesbach (1991); [6] Bamber and Dale
(2000); [7] Soriano-Meier and Forrester (2002); [8] Motwani (2003); [9] Achanga et al. (2006); [10] Anthony et al. (2005); [11] Rose et al.
(2011); [12] Lee (1997); [13] White et al. (1999); [14] Herron and Braiden (2007); [15] Upadhye et al. (2010b)

71
According to Upadhye et al. (2010b), the above practices are suitable for
SMEs, and if adopted they can offer the organisation many benefits on the shop
floor, and in HR. In terms of the shop floor, these practices can help to reduce cycle
and lead time, increase quality, and improve efficiency in terms of machines and
people. In terms of HR, they can help to increase employees’ morale, as well as their
efficiency and reliability. According to Womack et al. (1990, p. 225), “lean
production is a superior way for humans to make things. It provides better products,
in wider variety at lower cost”.
2.11 Requirements, CSFs and barriers associated with LS
Many organisations have implemented LS, and there are several success
stories relating to different regions of the world, as well as many examples of
failures. The transformation from traditional systems to LS is filled with tremendous
challenges and obstacles (Nordin et al., 2010); thus, the organisation must
understand the requirements of LS, as well as having an awareness of the barriers
that could impede it. Most importantly, the organisation needs to have CSFs in place
that will ensure the success of implementation, as several authors have emphasised
that LS and QI require an understanding of the systems themselves, as well as their
benefits, requirements (technical and cultural) and CSFs (Achanga et al., 2006).
According to Holweg (2007), the biggest challenge facing organisations is
understanding the core of LS as a philosophy, and appreciating how the organisation
can deal with national and organisational culture differences. Indeed, organisational
culture is the main driver for creating strategies to achieve the goals of the
organisation (Wong, 2007).
LS represents a useful philosophy that can be employed in any organisation,
regardless of its activity, size or sector. However, a great deal of effort needs to be
made when implementing LS in order to avoid failure. Despite the enormous
benefits that can be gained from LS, the literature cites a huge number of examples
of failures from problems arising during the implementation process (Papadopoulou
and Ozbayrak, 2005; Balle, 2005).

72
According to Bhasin and Burcher (2006), the success rate in LS is only 10
per cent. Failure may arise for different reasons, such as a bad external relationship
with suppliers and customers (Panizzolo, 1998; Nordin et al., 2010). Other
researchers suggest that failure can arise from the cultural differences highlighted
during the transition (Herron and Braiden, 2007). The most important thing to be
aware of is that LS is a long journey that may never end (Saurin et al., 2011), and
that it requires a huge, long-term commitment (Eisenhardt and Martin, 2010), since it
can take up to five years before the company begins to reap the benefits (Ohno,
1988; Womack and Jones, 2005).
2.11.1 Essential requirements for implementing lean systems
LS requires planning, vision, skilled workers and an awareness of the cost
involved (Holland and Light, 1999; Bakås et al., 2011). In addition, and most
importantly, the organisation needs to have management involvement and
commitment in order to succeed in its lean journey (Coronado and Antony, 2002).
These factors are essential, and can make or break organisations; for instance,
according to Al-Mashari et al. (2003), although QI can be very beneficial to
organisations that opt to use them, their implementation requires huge amounts of
money.
Nordin et al. (2012a) identified several requirements for LS, such as: top-
management support, multi-skilled workers, teamwork, strong relations with
customers and suppliers, transparency of information, rewarding, open
communication and information sharing, a culture to support CI, decentralised
responsibilities, knowledge learning and leadership. Nordin et al. (2012b) suggested
there are certain requirements for LS which represent an essential source for LS
success, such as: leadership and direction, a change agent system, a effective
communication, worker empowerment, and clear systems and controls.
Dahlgaard and Dahlgaard-Park (2006) suggested that leadership, involvement
of people, strong relationships with customers and suppliers, plus cross-functional
management are essential to create lean culture, although empowerment is a pre-
condition for creating this culture. The key to adopting lean culture is having clear
top management strategies and a focus on individuals in terms of involving people,

73
empowering them and motivating them. These things are imperative for a company
that wishes to benefit from LS (Höök and Stehn, 2008). Angelis et al. (2011)
suggested that in order to build a lean culture, there is a need for employee and top
management commitment, and a clear strategy.
Ohno (1988) stated that the objectives and key principles of Toyota are to
eliminate waste and to enhance efficiency in production, in addition to respecting
human resources. Meanwhile, respect for people requires an intelligent leader who
listens to employees and transfers the organisational vision to them so that they can
participate in the process. These practices make up a healthy organisational culture,
in which each part of an organisation plays a major role towards the CI mission (Al-
Najem et al., 2012).
Kundu and Manohar (2012) stressed that LS requires certain things, such as:
visible management; the establishment of a mechanism that encourages and enables
autonomy; continual evaluation; communication of lean wins at the outset; the
establishment of a mechanism to enable the organisation to sustain changes; and
open disclosure of LS goals.
According to Black (2007), in order to establish LS the change should start
from top management, and leadership is required to drive the change. Black (2007)
further detailed some of the requirements to establish LS. For instance, the
organisation needs: top-level management to communicate with everyone in the
organisation; employee involvement; training in problem solving and waste
identification; empowerment; sharing successes; and rewarding teams.
Forza (1996) identified several essential practices that have been found in the
lean organisation, as follows:
There are teams for problem solving
Employees’ suggestions are taken very seriously
There is a heavy reliance on quality feedback both for workers and
supervisors
Production procedures are carefully documented
Employees are able to perform a greater variety of tasks, including statistical
process controls

74
Forza (1996) asserted the importance of empowerment, and said that people’s
productivity is affected if they have less empowerment. Thus, they should be
assigned to jobs in which they can use their full capabilities, and they must be
provided with training.
Forza (1996) added that in order to achieve successful LS the organisation
requires certain aspects, such as:
Commitment to continuous improvement: employees must believe that
improving quality is part of their daily job.
The formation of teams that are responsible for problem solving.
Employee suggestions (realisation and feedback), which are taken seriously.
Supervisors that encourage teamwork, and take the best of each employee by
encouraging them towards improving and teamwork.
Interactions between management, technicians and workers/supervisors,
which is simple and visible.
Feedback about quality performance to supervisors regarding aspects of
quality performance such as waste reduction.
Regular feedback to workers on the current processes, defect rates, machine
breakdowns, etc., and the use of visible communication tools such as charts
and diagrams.
Decentralisation of authority, so that employees are given a degree of
freedom in order to make decisions without consulting supervisors.
Worker autonomy (or empowerment) to stop any machines if they notice a
defect.
Multifunctional employees who are trained to perform different jobs and
tasks so that they can cover other people in case of absence or illness.
Workers performing statistical process control, and an awareness of how to
perform statistical process control autonomously.
Machine maintenance performed by people on the shop floor, rather than
assigning other people to do the job.
Documentation on production procedures, which are well written, clear,
accessible by all employees and up to date.

75
Bhasin and Burcher (2006) explained several requirements that are esstential
for LS. They divided these into two groups, technical and cultural, and suggested
that these must be met in order to achive the prime objective of LS – which is,
according to Liker (1996, p. 481) “to [reduce] the time from customer order to
delivery by eliminating sources of waste in the production flow”. The organisation
must also meet certain technical requirements as represented in:
Kaizen continuous improvement: the organisation must continually pursue
improvement in terms of cost, quality, design and delivery.
Cellular manufacturing: in order to reduce waiting, transport, and process
time, the organisation must group the equipment and facilities required to
produce a product or family of products proximally close to one another.
Reduction of lead time and improvement in flow: the organisation should
eliminate delays in change-over times by adopting SMED.
Single piece of flow must be fully operated by producing one complete
product at a time and kanban system must be operated too.
Process mapping and radical changes and improvements to eliminate waste.
Strong relationships with suppliers: this can be achieved by working closely
with and reducing the number of suppliers.
5s and visual management: these must be in place to enable the organisation
to mitigate confusion, clutter and inefficiency within production or within the
office environment.
TPM: this has to be practiced efficiently in order to improve the consistency,
reliability and capacity of the machines.
Specifying value: most importantly, the organisation must specify the value
that the customer is will to pay, and focus on eliminating wastes.
Bhasin and Burcher (2006) also stated that in order to meet the above
technical requirements, the organisation must also meet certain cultural
requirements, such as:
Decisions must be made at the lowest level.
A clear vision and strategy must be shared by the organisation so that
everyone knows how to achieve their goals and understands exactly what
they must do after implementing LS.
76
Responsibility should be assigned to workers.
The organisation needs to establish supplier relations based on commitment
and mutual trust.
A learning environment should be created, and training provided.
There should be a focus on the customer by involving them in projects and
understanding exactly what they need.
Leadership is highly required to drive the change.
2.11.2 Barriers and obstacles
Many issues have been recognised as barriers to LS implementation. For
instance, Atkinson (2010) and Vinodh and Balaji (2011) declared that the most
prominent factor in LS is culture, which can have a positive or negative impact
during the lean journey; they believe that there is a misconception of LS, and
ignorance about the cultural requirements of LS.
Liker (2004) saw subculture as a potential source of problems, while
Womack and Jones (2005) highlighted resistance to accepting new ideas in this
regard. Bhasin (2012) identified several factors that could impede LS, including: cost
of investment; management time; supervisory, senior management and workforce
skills; employee attitudes/resistance to change; external and internal funding;
cultural issues; shareholders and owners; and finally lack of implementation
knowledge.
Research carried out by Deloitte and Touche (2002) suggested that the main
barriers to LS are company culture, investment and cost, staff attitudes, change
issues, and a misunderstanding of the process and its benefits. Moreover, the Lean
Enterprise Institute (2005, cited in Bhasin, 2012) suggested that barriers include a
lack of implementation knowledge, backsliding into old ways of working,
management resistance, a failure to recognise the financial value of lean practices, a
lack of crisis to create a sense of urgency, and employee resistance.
Boyer and Sovilla (2003) said that the main obstacles for LS include
misunderstanding and undervaluing the managerial and cultural impacts of it, and the
fact that many organisations do not know the requirements for creating a lean
77
culture; conflicting measures and illusions regarding the progress; a failure to
maintain lean principles; and using LS as a set of tools, rather than a philosophy for
doing business.
Atkinson (2010) suggested that there has been a misconception of LS which
may have a negative impact on LS implementation; many organisations view LS as a
set of tools within a rigid system, rather than as a philosophy that is tailored to help
the needs of the business. Atkinson (2010) further added that organisations view LS
solely as a cost-reduction system, and misunderstand the core requirements, as well
as the benefits of LS.
2.11.3 CSFs for LS
It is vital for the organisation to understand the CSFs in order to mitigate the
risk of failure (Kundu and Manohar, 2012). However, the first thing that
organisations need to know is the meaning of the CSFs. Boynton and Zmud (1984, p.
17) stated that CSFs are:
Those few things that must go well to ensure success for a manager or an
organization […] therefore, they represent those managerial or enterprise areas that
must be given special attention to bring about high performance.
Table 5 provides a sample of the findings from the literature review; these
reveal common CSFs and barriers for LS and other QI (such as TQM and Six Sigma)
that organisations should be aware of. TQM and Six Sigma are included in Table 5
as they share the same target as LS, which is increasing customer satisfaction and
aiming for CI (Chiarini, 2011a). Further, the three approaches involve similar
practices, such as teamwork, brainstorming, statistical process control, and
management tools, as well as basic tools such as cause and effect diagrams, Pareto
charts, flow charts, etc. (Ricondo and Viles, 2005). According to (Mefford, 2009),
LS has similarities to TQM and Six Sigma, and acts as a complement for QI.
The CSFs in Table 5 are based on data from different regions (developed and
developing countries) and from different sizes of organisations (small, medium and
large). It has been identified that there are no notable differences between developed
and developing countries, which highlights the importance of CSFs, as most of these

78
factors represent a platform for LS. According to Mefford (2009), LS can be
implemented in developing countries in exactly the same way as in developed
countries; for example, Toyota has had success in many developing countries, and
Ford has had successes in implementing JIT in Mexico.
However, Mefford (2009) also stated that developing countries are likely to
face more difficulties as they lack several key factors, such as skilled people and
managers, as well as deficiencies in the required infrastructures. Furthermore,
developing countries face a challenge in terms of political and economic instability,
but both developed and developing countries have similar requirements for success
in LS (Mefford, 2009). Further, the results shown in Table 5 and the literature review
do not highlight any notable differences between SMEs and large industries; all
agree on the importance of essential factors such as suppliers, customers, skilled
workers, training, etc., which again indicates the importance of these factors for
starting LS.
From the literature reviewed above, as well as the findings in Table 5, it is
evident that the most important factors in LS are top management commitment and
leadership; supplier relations; customer relations; people (in terms of skills, training,
empowerment, and involvement); communication (including teamwork and
communication between people and between departments); motivation
(empowerment, reward and recognition); financial capabilities; and strategic vision.
As shown in Table 5, top management and leadership is the factor that has
been most frequently emphasised by researchers, which is unsurprising as LS cannot
be implemented unless there is support, initiative and commitment from those who
are leading the way in the firm, believe in the system, and are trying to create the
right culture for LS, and are skilled, trained and motivated towards driving the
change (Wilson, 2009). Moreover, researchers have stressed the importance of the
role of suppliers (as the main feeders) and customers (as any company aims to
maintain happy customers) within LS.
In addition, the organisation needs to have financial capability to begin the
change, as it might need to involve external expertise and provide appropriate
training for employees, as well as changing the layout of the firm if the current
structure does not support the new system.

79
These factors represent essential requirements for creating the quality culture
that is required for LS (Bhasin and Burcher, 2006); if they are not properly
addressed, LS implementation is likely to be less effective, or even fail. However,
surprisingly, none of the researchers in Table 5 have considered national culture as a
critical factor; the importance of the national factor has been emphasised by many
researchers (e.g. Yoshiaki et al., 2000; Adler et al., 1986; O'Connor, 1995; Jabnoun
and Al Khafaji 2005; Ngowi, 2000; Abrahamsson and Isaksson, 2012), who have
alleged that national cultre is an important factor for LS, and QI in general.
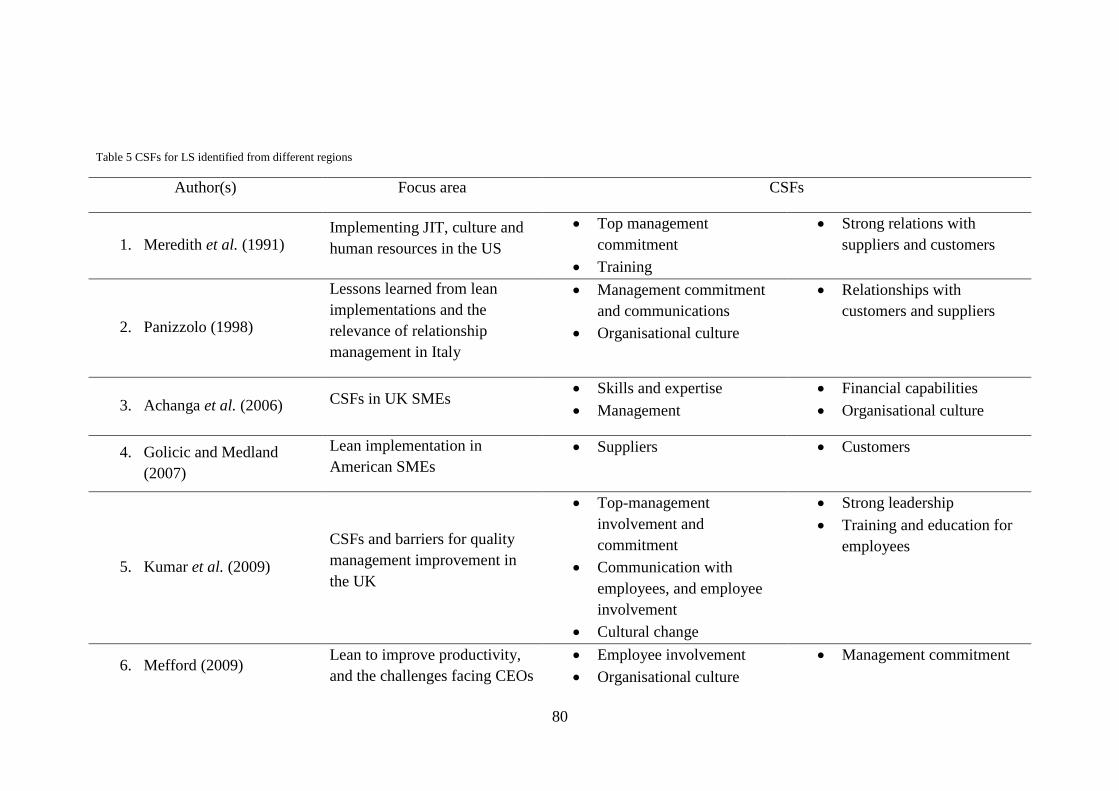
80
Table 5 CSFs for LS identified from different regions
Author(s) Focus area CSFs
1. Meredith et al. (1991) Implementing JIT, culture and
human resources in the US
Top management
commitment
Training
Strong relations with
suppliers and customers
2. Panizzolo (1998)
Lessons learned from lean
implementations and the
relevance of relationship
management in Italy
Management commitment
and communications
Organisational culture
Relationships with
customers and suppliers
3. Achanga et al. (2006) CSFs in UK SMEs Skills and expertise
Management
Financial capabilities
Organisational culture
4. Golicic and Medland
(2007)
Lean implementation in
American SMEs
Suppliers Customers
5. Kumar et al. (2009)
CSFs and barriers for quality
management improvement in
the UK
Top-management
involvement and
commitment
Communication with
employees, and employee
involvement
Cultural change
Strong leadership
Training and education for
employees
6. Mefford (2009) Lean to improve productivity,
and the challenges facing CEOs
Employee involvement
Organisational culture
Management commitment

81
in developed and developing
countries
change Communication
7. Zu et al. (2010)
Critical links between
organisational culture and total
quality management
(TQM)/Six Sigma practices in
the US
Top-management
commitment
Workforce management
Supplier and customer
relations
8. Bakås et al. (2011)
Success factors for lean
implementation in European
SMEs
Strong management
involvement
Employee participation
Offering adequate time for
preparing the organisation
Creating motivation to
complete initiatives
Internal competency
Establishing evaluation
systems for performance
9. Laureani and Antony
(2012) CSFs for lean Six Sigma
Management commitment
Cultural change
Linking lean Six Sigma to
business strategy
HR rewards
Extending lean Six Sigma
to the supply chain
Leadership styles
10. Zhang et al. (2012) CSFs for lean Six Sigma in
Pakistan
Top-management
commitment
Reward and recognition
Financial capabilities
Organisational culture
11. Chin and Pun (2002) CSFs for TQM in Chinese
enterprises
Committed management
and leadership
A shared vision and clear
An empowered and trained
workforce
Management of cultural

82
sense of direction dynamics
12. Vermaak (2010)
CSFs for lean system in
Johannesburg manufacturing
industries
Philosophy and principles
People (or soft issue)
Strategic driver and
promotions office
Basic stability
13. Mittal et al. ( 2011)
CSFs for TQM in Indian SMEs
(service and manufacturing)
Lack of top-management
commitment
No supporting infrastructure
for cultural change
Lack of synergy between
quality improvement
programmes and overall
business strategy
Poor management
leadership
Lack of focus on the
process
Fear of change
Misconception that TQM is
a set of tools rather than a
way of thinking
Inconsistent management
commitment from
department to department
Lack of rewards and
recognition
Organisations are more
concerned about short-term
business returns rather than
long-term sustainability of
business performance
14. Zakua et al. (2012) CSFs for TQM implementation
in Malaysian higher education
Management commitment
and leadership
Continuous improvement
Total customer satisfaction
Training
Communication
Teamwork

83
Employee involvement
15. Antony et al. (2002)
CSFs for TQM implementation
in Hong Kong organisations
Training and education
Quality data and reporting
Management commitment
Customer satisfaction
Role of quality department
Communication
Continuous improvement
16. Sohail and Hoong (2003)
CSFs within Malaysian SMEs
Employee training and
development
Process management
Quality measurement and
benchmarking
Top management
commitment
Customer involvement and
satisfaction
Strategy and planning
17. Salaheldin (2009) CSFs for TQM in Qatari SMEs
Leadership and top-
management support
Organisational culture
Continuous improvement
Benchmarking
Quality goals and policy
Team building and problem
solving
Employee empowerment
involvement and training
Use of information
technology
Product and service design
Enterprise performance
metrics for TQM
Process control
Customer orientation and
customer relationships
Resources value addition
process
Realistic implementation
schedule
Customer and market
knowledge

84
Supplier relationships and
quality of suppliers
Assessing suppliers’
performance
Resource conservation and
utilisation
Inspection and checking
work
18. Hodgetts et al. (1999) CSFs of TQM implementation
in the SMEs
Top-management
involvement
Customer focus
Employees in terms of
training, empowerment and
generating new ideas
19. Yusof and Aspinwall
(1999) CSFs for TQM within SMEs
Management leadership
Continuous improvement
system, education and
training
Supplier quality
management system and
process
Measurement and feedback
Human resource
management
Improvement tools and
techniques
Resources
Work environment and
culture
20. Rahman (2001) CSFs for TQM in Australian
SMEs
Leadership
Strategy and planning
Employee empowerment
and employee involvement
Employee training and
development
Information and analysis
Customer management
21. Demirbag et al. (2006) CSFs for TQM in Turkish
SMEs
Quality data and reporting Supplier quality

85
Role of top management
Employee relations
management
Training
Quality policy and process
management
22. Ahire and Golhar (1996) Important constructs for small
and large firms
Top-management
commitment
Supplier quality
management
Supplier performance
Customer focus
Statistical process control
usage
Benchmarking
Internal quality information
usage
Employee involvement
Employee training
Design quality management
23. Radnor et al. (2006) CSFs in health care
organisation in Scotland
Organisational culture and
ownership
Developing organisational
readiness
Management commitment
and capability
Providing adequate
resources to support change
External support from
consultants in the first
instance
Effective communication
and engagement throughout
the organisation
Strategic approach to
improvements
Teamwork and joined-up
whole-systems thinking
Setting realistic timescales
for change and making
effective use of
commitments and
enthusiasm for change

86
2.12 Organisational culture
As discussed above, LS arose from Toyota Production System (TPS) and
gained popularity as one of the best strategic practices in manufacturing sectors. Its
tools and techniques have been widely used in both the manufacturing and service
sectors, regardless of size and activity. The proven success of Toyota has driven the
attention of many managers in all types of businesses to emulate and implement the
system in their organisation (Emiliani, 2006).
According to Jabnoun (2001), cultural value was not given huge attention until
the emerging success of the Japanese system, wherein authors and researchers began
to study the Japanese culture to understand the values underlying it because
“people's behaviour is a reflection of their values and priorities” (Jabnoun, 2001, p.
381).
Although LS has been used all over the globe, many authors and researchers
have viewed it from different angles, which proves that this system cannot be copied
or emulated. Hence, serious attention needs to be paid to the variables that might
affect the lean journey.
One of the most prominent factors that could impact directly on the lean journey is
the organisational culture; furthermore, when organisational culture is talked about,
the role of leadership cannot be ignored, as lean processes require a substantial
leadership role from managers who fully understand the system and strive to gain
benefits from it.
Abrahamsson and Isaksson (2012) suggested that organisational culture plays
a major role in implementing LS, as controls the ways of doing things within an
organisation; in addition, studying the organisational culture before lean
implementation could help to improve the change success rate.
Atkinson (2010, p. 35) said that:
Organisations stand little chance of implementing ‘Lean’ unless they have paid at
least equal attention to creating the right culture, and the conditions and
circumstances which can become the foundation for implementing change.

87
Boyer and Sovilla (2003) took a similar view, stating that failures in LS come
from different sources, or which underestimating cultural issues is one.
It is rare to study LS articles without coming across the concepts of top-
management commitment and leadership, people, and the organisational culture.
However, only a few researchers – if any – have explained what sort of leadership is
required for the LS implementation journey. According to Dahlgaard and Dahlgaard-
Park (2006), many studies have focused on the requirements of LS in terms of
training people in techniques and tools, but less attention has been paid to the human
factor and building the right culture to support the lean journey.
According to the literature, the initial step for creating a lean culture should
come from the senior- and mediocre-level management and the leaders of the
organisation. Mokhtar and Yosof (2010) suggested that involvement and buy-in are
key features of LS to create the right working environment. In order to start this
process, the senior management must show full commitment to and belief in
providing the required support, and adequate resources, budget and investment for
employee training. Assigning appropriate tasks to the right manager and leader is
also believed to be a key quality within LS (Mokhtar and Yusof, 2010).
Mullins (1999) suggested that before trying to evaluate the organisational
culture, it is important to examine which factors affect the culture, as there are a
number of issues which can have a direct impact on organisational culture. Mullins
(1999) further outlined the possible factors affecting organisational culture, such as
history, goal and objective, size, location, management and staffing, primary
function and adjective, and finally the organisational environment.
According to Taleghani (2010), only 10 per cent of UK companies have
successful implemented LS, as the remainder have failed to understand lean
philosophy properly. The reasons behind the majority of failures are cultural and
management issues; as Mejab (2003) stated, these issues can cause real obstacles in
the lean implementation path, since organisational culture and management are
correlated to one another. Majab (2003) further insisted that top management must
show some dedication to LS. Similar to Talegani (2010), Mejabi (2003) advocated
addressing these issues first and also stressed that each of these issues should be
taken into account to avoid LS failures.

88
Organisational culture has been extensively reviewed by researchers, which
reflects its importance. It has been accentuated as a vital factor in implementing a
successful strategy (Al-Swidi and Mahmood, 2011) such as LS or any QI. As these
kinds of techniques require a long-term strategy, only good organisational culture
can cope with it and eventually sustain it.
As explained above, LS has its origins in Japanese culture and was then
imported to the rest of the world; it is therefore important to recognise that lean
culture needs to be understood thoroughly for successful adoption and
implementation. Due to globalisation, nothing is exclusive to one country any more,
as LS and other QI have shifted from Japan and Western countries to different parts
of the world, such as Middle Eastern, Indian, Latin American, Eastern European and
Asian regions (Lacksonen et al., 2010). Each of these regions is different and unique
in terms of organisational culture and national culture; therefore, in order to
accomplish successful LS, each region needs to have appropriate and feasible ways
of implementing it in line with the company organisational culture and the Japanese
corporate culture: “successful implementation of lean will require a unique blend of
Japanese corporate culture with their societal and organisational culture” (Lacksonen
et al., 2010, p. 1).
Rodner et al. (2006) explained, with reference to the CI in culture within the
organisation, that workers from all departments must be willing to accept the
initiatives for lean implementation. Considering this fact, people are thus the most
powerful tool to help in changing the culture towards CI. Furthermore, they need to
be engaged in the process from the very early stages to become more effective and
motivated toward generating a culture of CI (Radnor et al., 2006).
Organisational culture is one of the hardest parts in the lean journey, and may
lead to its failure. The culture in LS includes encouraging people to participate in the
process; if the organisation can engage people to participate, and convince them to
accept the changes, it will result in creating a lean culture with more people
motivated towards the change, and will change people’s mindsets towards CI’s
“organisational and cultural factors [that] shape the degree of success of Lean”
(Radnor et al., 2006, p. 3). Other factors have been found that help in sustaining LS
89
success: skilled and trained workers, strong leadership, and communication (Radnor
et al., 2006).
According to Ghobadian and Gallear (1997), several issues can influence the
organisational culture and make it ready for QI, such as:
Education and training
Employee participation programmes
Enhanced communication programmes
Revision of procedures and policies
Modification of evaluation and reward system
Behaviour of top managers.
LS requires changes to the corporate culture, from passive and defensive to
open and proactive, where people’s involvement is essential, customer satisfaction is
a priority and CI is a daily job for all departments. Likewise, leadership must be
present on a day-to-day basis (Dahlgaard and Dahlgaard-Park, 2006).
Moreover, it is expected that an organisation must be exposed to the CSFs of
LS in order to be able to understand how to create a Toyota-style culture. As
explained above, lean culture is about changing mindsets, and the organisational
approach should be “outside in”, which means concentrating on customers and
making them feel that they are the highest priority – which is exactly what has been
done in Toyota (Takeuchi et al., 2008). It is particularly about creating CI, a flat
organisation with fewer barriers between senior management and workers,
empowerment of people, and proper utilisation of time and undertaking the right
assignments and activities. At prima facie, it seems as though these are common
practices; however, in reality, they are not found to be applicable everywhere.
Cultural adaption is key to successful lean implementation (Wong, 2007).
The main condition for building and achieving an excellent lean enterprise is to
create a suitable organisational culture that is built on empowerment of people,
partnership with stakeholders, and CI manner where all employees participate in the
day-to-day decision-making process. This helps a company to achieve customer
satisfaction and to reap the desired benefits from LS. It is believed that if the culture

90
is built in this way, leaders will be able to gradually get rid of the traditional
management style.
Schein (2004, p. 12) defined organisational culture as:
a pattern of shared basic assumptions that has been learnt whilst solving problems,
that has worked well enough to be considered valid, and therefore, to be taught to
new members as the correct way to perceive, think, and feel in relation to those
problems.
This definition is very consistent with the lean concept, as LS involves
pursuing perfection, and it is unlikely to be attained unless organisations are ready to
learn from their mistakes and develop a habit of solving problems on a daily basis.
Developing habits of problem solving may not be easy, however, as they require a
great deal of sacrifices and continuous efforts not only from leaders and managers,
but also from the entire organisation. CSFs, therefore, are key for LS implementation
in order to understand what type of culture any organisation needs adopt.
Moreover, research conducted by Appelbaum et al. (1998) revealed that poor
communication and lack of leadership has a direct impact on company culture. This
view is supported by Swe and Kleiner (1998), who suggested that strong leadership
is a key element to achieving the desired culture within a company.
Some researchers have shown that in order to be lean, the organisational
culture has to be supportive of education, training, involvement and teamwork
(Thompson, 2000; Peters and Waterman, 1982; Dale et al., 1997; Crosby, 1979;
Dale, 1999). Further, Bounds et al. (1994) added that for a business to stay
competitive in any market, CI must be a way of life for all its employees.
Lacksonen et al. (2010) suggested that the industry’s management dedication
to promoting a culture of CI and investing in people are more vital for lean
implementation than tools and techniques, and that changes towards LS will be more
effective if they are supported by top management. The main requirements for LS
deployments are respecting people, knowing their capabilities what is best for them,
assigning them to the right tasks, and taking a long-term vision, which requires
patience and CI by focusing on processes. Liker (2004) suggested that these
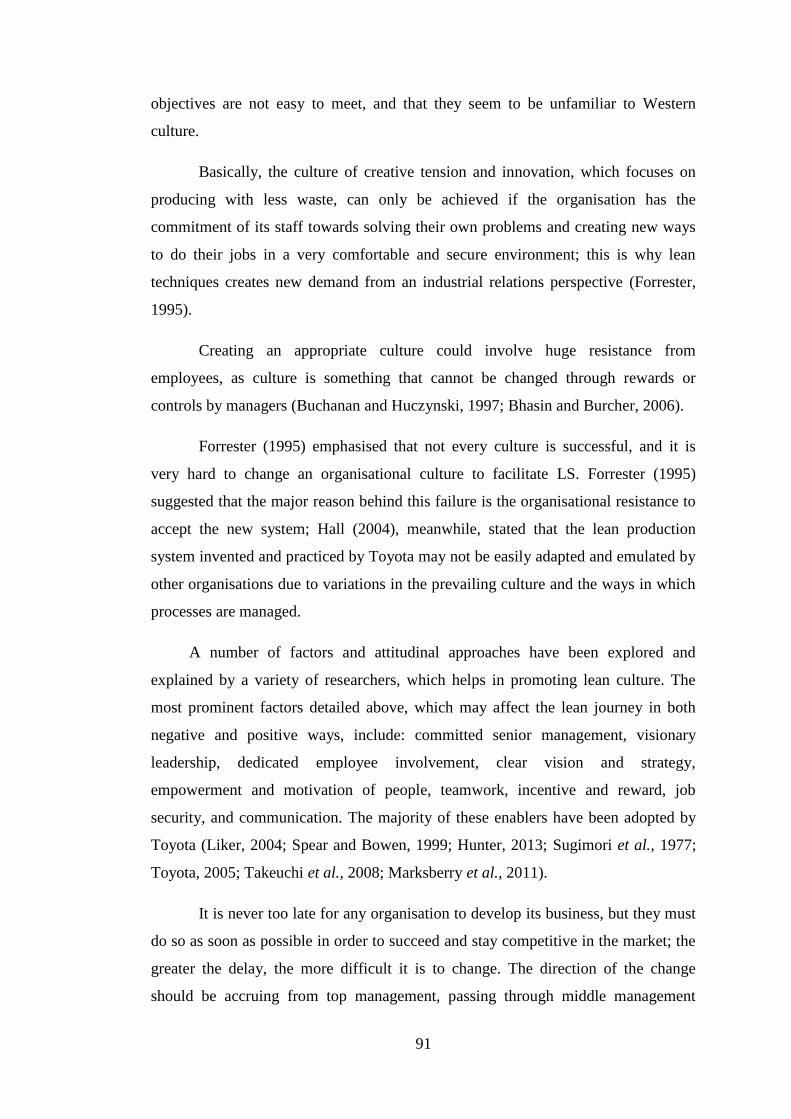
91
objectives are not easy to meet, and that they seem to be unfamiliar to Western
culture.
Basically, the culture of creative tension and innovation, which focuses on
producing with less waste, can only be achieved if the organisation has the
commitment of its staff towards solving their own problems and creating new ways
to do their jobs in a very comfortable and secure environment; this is why lean
techniques creates new demand from an industrial relations perspective (Forrester,
1995).
Creating an appropriate culture could involve huge resistance from
employees, as culture is something that cannot be changed through rewards or
controls by managers (Buchanan and Huczynski, 1997; Bhasin and Burcher, 2006).
Forrester (1995) emphasised that not every culture is successful, and it is
very hard to change an organisational culture to facilitate LS. Forrester (1995)
suggested that the major reason behind this failure is the organisational resistance to
accept the new system; Hall (2004), meanwhile, stated that the lean production
system invented and practiced by Toyota may not be easily adapted and emulated by
other organisations due to variations in the prevailing culture and the ways in which
processes are managed.
A number of factors and attitudinal approaches have been explored and
explained by a variety of researchers, which helps in promoting lean culture. The
most prominent factors detailed above, which may affect the lean journey in both
negative and positive ways, include: committed senior management, visionary
leadership, dedicated employee involvement, clear vision and strategy,
empowerment and motivation of people, teamwork, incentive and reward, job
security, and communication. The majority of these enablers have been adopted by
Toyota (Liker, 2004; Spear and Bowen, 1999; Hunter, 2013; Sugimori et al., 1977;
Toyota, 2005; Takeuchi et al., 2008; Marksberry et al., 2011).
It is never too late for any organisation to develop its business, but they must
do so as soon as possible in order to succeed and stay competitive in the market; the
greater the delay, the more difficult it is to change. The direction of the change
should be accruing from top management, passing through middle management

92
towards the lower level of the whole organisation. Once the change has been applied,
the whole organisation, including all managers, must be involved in the
improvement process – they should not sit back and wait for results to come
instantaneously. Above all, they should have commitment to change, rather than
carrying out change for change’s sake (Sohal and Egglestone, 1994).
2.13 National culture
Many cultural aspects can have a direct impact on organisational culture, and
one of the most important aspects in this regard is national culture, which plays an
essential role in forming corporate culture (Adler et al., 1986; O'Connor, 1995). Van
Oudenhoven (2001) suggested that differences between organisational cultures arise
as a result of perceived individual inconsistencies in the national culture. The
national culture can have a direct impact on managers, which may hinder the transfer
of production systems (Yoshiaki et al., 2000). Similarly Ali et al. (1997) and Abdalla
and Al‐Homoud (2001) suggested that the national culture is more effective in
shaping employee attitudes and behaviours than the organisational culture, and can
have an influence for both managers and employees.
According to Hofstede (1997, p. 262), the national culture is “the collective
programming of the mind acquired by growing up in a particular country”, which
become part of its inhabitants and it is difficult to change, since it is acquireed from
childhood and increases over the years. Organisational culture is “the collective
porgramming of the mind that distinguishes the members of one organsiation from
another” (Hofstede, 1997, p. 262).
Jabnoun and Al Khafaji (2005, p. 4) defined national culture as “shared
assumptions that have been formed by common experience and history of events”.
According Jabnoun and Al Khafaji (2005) and Ngowi (2000), national culture is one
of the key elements to determine the success or failure of QI implementation.
Jabnoun and Al Khafaji (2005) and Ngowi (2000) showed that national culture has
an effect on the implementation of TQM, and suggested that because of national
culture, TQM could fail in some countries. Many authors have also highlighted the
importance of national culture in implementing QI: according to Ralston et al.
(1997), national culture influences the organisational value; Michael and College

93
(1997) suggested that national culture is a determinant for managers’ behavior; while
Baba and Falkenburg (1996) believed that it can influence organisational structure.
Many authors (e.g. Jabnoun and Al Khafaji, 2005; Al Khafaji, 2001; Collins,
1994) have asserted the important of culture in designing, producing and improving
products to reach customer satisfaction. This type of culture requires empowerment
and CI to meet the aim of any QI, which is customer satisfaction, as customers are
the main reason for any company’s existence (Jabnoun and Al Khafaji, 2005).
Juran (1989) said that there are two type of customers: internal and external
customers. To achieve the satisfaction of external customers, the organisation needs
to provide quality products that the customers have asked for, and deliver these at the
right time; in order to achieve this a vibrant culture and conductive structure is
needed (Jabnoun, 2001). In order to achieve the satisfaction of internal customers
(people within the organisation), the organisation must promote a teamwork culture
and empowerment (Parker and Price, 1994). Jabnoun and Al Khafaji (2005) asserted
that empowerment must be rooted in the organisational culture to achieve customer
satisfaction; Parker and Price (1994) found that empowerment is positively
correlated with employee pleasure.
LS implementation will have an effect on the culture, as it requires changing
strategies and altering ways of work to meet LS objectives, for instance by
empowering people, promoting involvement, providing training, etc.; these practices
can easily be influenced by the national culture, and LS can be influenced by many
other factors, such as geographical location, organisational size, type of product
(sector) and organisational tradition (Abrahamsson and Isaksson, 2012).
Although national culture is an important determinant for ensuring successful
implementation of QI, QI also relies on other factors such leadership, knowledge and
awareness of quality management, corporate culture and structures (Jabnoun and Al
Khafaji, 2005).
2.13.1 What kind of national culture does lean system require?
Hofstede (1980) developed five dimensions to measure national culture in 66
countries from 1967–1973, which resulted in 116,000 responses; his framework has

94
been applied to branches of IBM companies around the world and the participants
were from different levels (Chiang, 2005). This model has been demonstrated by
many researchers as one of the most valid and accurate, especially in relation to
workplace behaviour (Chiang, 2005), and is one of the most cited models to date
(Obeidat et al., 2012).
Hofstede (1980) started with four dimensions, namely Power Distance Index
(PDI), Individualism (IDV), Masculinity (MAS), and Uncertainty Avoidance Index
(UAI), and later on Hofstede and Bond (1988) added another dimension, Long-Term
Orientation (LTO).
Hofsted categorised all Arab countries together, as he assumed that most Arab
countries share same values, principles and religion, which in turn form the national
culture. In order to understand how national culture can influence the organisational
practices and culture, it is necessary to understand the dimensions developed by
Hofsted (1980).
1. Power Distance Index (PDI)
PDI is “The extent to which the less powerful members of institutions and
organisations within a country expect and accept that power is distributed
unequally”(Hofstede, 1997, p. 28).
This dimension can provide an indication of what should be seen in an
organisation that has high or low PDI. In countries where PDI is low, there is
expected to be a consultative decision-making style, less hierarchy, and managers
who conduct discussions with subordinates before making decisions. On the other
hand, organisations with high PDI have the opposite traits, with appreciation for
hierarchical orders, employees who are afraid to disagree with managers as managers
are mainly autocratic, and employees who prefer not to be consulted.
Thus, in low PDI countries, the relationships between managers and
employees are flatter, and employees have less dependence on managers and more
freedom; in other words, they are empowered and have the authority to disagree with
bosses. The top and bottom levels of the organisation see each other equally; though
there may still be a hierarchy, it helps to get the work done and can be easily

95
changed and modified if it does not fit the job. Organisation is decentralised, in terms
of salary there is no huge gap between top and bottom levels, and workers are highly
qualified (Hofstede, 1997).
In high PDI countries there is a high dependency on managers, who are
“always right”; the power is only a few hands due to the centralised structure, less
empowerment for employees who are expected be told what to do, and workers who
are normally not well educated. In terms of salaries, there are normally big
differences between top and bottom levels of the organisation. As a result, there are
huge distances between managers and employees (Hofstede, 1997).
Kuwait scored high in the PDI dimension (80 out of 100, where 100 means
high power distance), which indicates that there is huge respect for vertical
organisation and an acceptance of the top-down management style. In addition, the
workers expect to be told what they should do, and the organisation is centralised.
Managers are expected to have the full power, with minimum delegation to
employees.
The high power PDI in Kuwait could be attributed to the natural system in the
country, as it is considered to be politically centralised and ruled by families (At-
Twaijri and Al-Muhaiza, 1996). High PDI levels indicate huge respect for managers’
orders and work that is mainly done because the boss has asked for it, without
negotiation. This in turn is not very supportive of LS, which requires delegation,
empowerment and input from employees at all levels.
2. Individualism (IDV)
“Individualism pertains to societies in which the ties between individuals are
loose: everyone is expected to look after himself or herself and his or her immediate
family”; on the other hand, collectivism means “people from birth onwards are
integrated into strong, cohesive in-groups, which throughout people’s lifetime
continue to protect them in exchange for unquestioning loyalty” (Hofstede, 1997, p.
51).
In high-IDV societies or organisations, people tend to concentrate on
themselves. In the workplace, people act according to their own interests and the
assigned work should match these. The family and work should not be joined, in

96
order to avoid nepotism which in turns may cause conflicts of interest. Hiring and
promotion should be based on skills and qualifications, and incentive and rewards on
individual performance. They (people in high IDV societies or organisations) are
more focused on success than on building strong relations.
Low IDV means that people are tied to groups and take care of each other.
Workers are hired based on their groups (relatives and relations), and the work
assigned to the employee does not have to coincide with his/her interests. Incentives
and rewards are based on group performance. Relationships prevail over tasks, and
the group is taken into account for hiring and promotion (Hofstede, 1997).
Kuwait scored 38 out of 100 in this regard, which indicates that Kuwait is
collectivist country where employees are more loyal to the manager than the
organisational objective.
The prevalence of collectivism in Kuwait can be attributed to the Islamic
religion, which emphasises unity and encourages people to work together and help
each other. It can also be attributed to the nature of Kuwait society, which is based
on tribes and families. According to Abdalla and Al‐Homoud (2001), Kuwait has
been heavily influenced by its tribal society, which promotes collectivism; in
addition, Kuwait is very small and rich, and threats from outside have made its
inhabitants close to one another.
According to At-Twaijri and Al-Muhaiza (1996), collectivist countries tend to
promote people based on the number of years they have spent in the organisation,
rather than their performance; this is why Arab managers appreciate people’s loyalty
over their efficiency and productivity at work (At-Twaijri and Al-Muhaiza, 1996).
Once again, collectivism is good for LS, but it has to come with low power distance
so that people can express their opinions freely.
3. Masculinity (MAS)
This is not related to gender, but rather to social value, or:
the extent to which the dominant values in the society are [masculine], that is,
assertiveness, the acquisition of money and things, and not caring for others, the
quality of life, or people. (Hofstede, 1980, p. 46)

97
In a masculine culture, results are the most important thing and rewards are based on
quality (everyone is awarded based on his/her performance). Masculine managers
are more decisive, assertive and aggressive, and more likely to ignore other opinions
and rely on their own decisions. Further, they resolve conflict by fighting things out,
and their main concern is on equity, competition and performance. They strive for a
performance society.
Managers in low masculine (i.e. “feminine”) cultures are less decisive and
more intuitive, and always look for consensus. They stress on equality, solidarity and
quality of work. In addition, their methods of conflict resolution include negotiation
and compromise. They strive for a welfare society.
Masculine countries are believed to be have the better chance to succeed in
manufacturing industries, as their principle is more towards doing things quickly,
accurately and more efficiently, while feminine countries are believed to do well in
service organisations as they are better at dealing with customers, consulting, etc.
(Hofstede, 1997).
Kuwait scored 53 out of 100 in this regard, which means that Kuwait is
feminine; this can be attributed to the Islamic religion again, as well as the tribal
society, as these factors encourage people to strive for togetherness and help and take
care of each other. According to Hofstede (1997) the feminine culture involves
“working to live”, whereas in masculine culture which people “live to work”.
4. Uncertainty Avoidance Index (UAI)
This refers to “the extent to which the members of a culture feel threatened
by uncertain or unknown situations” (Hofstede, 1997, p. 113).
High UAI means that the organisation feel threatened when it comes to
pursuing uncertain things (i.e. afraid of changes), which in turn leads to the
prevention of innovation and new ideas. These types of culture are motivated by
security, belongingness or esteem. The workplace and employees are controlled by
many rules and regulations; these rules are not based on logic, but rather on psych-
logic (wherein rules are normally inconsistent and nonsensical), which makes people
are more robotically programmed with regards to accepting certain rules and
attitudes. People have very high anxiety under high UAI.

98
Under low UAI, rules are only created if there is a serious need for them.
People have very low levels of anxiety, and there is a more supportive culture for
developing new ideas and innovation. Motivation can be seen in terms of
achievement and belongingness or esteem (Hofstede, 1997).
Kuwait scored 68 out of 112 for UAI, which indicates that the country has
strong or high UAI. This can be attributed to several reasons: for instance, Kuwaiti
managers are not risk takers, which is why they have high UAI as they afraid of
trying new things and of unknowns, and their wealth makes them cautious about
losing their money. This is in line with findings by Welsh and Raven (2004), who
belive that Arab managerss are not risk takers.
Another factor that can be said to contribute to the high UAI score in Kuwait
is the government practice of giving Kuwaitis lifetime job security, regardless of
their performance; employees can only be terminated if they have committed a
crime. According to Adler (1986), lifetime employment is widespread in countries
with high UAI. Although lifetime employment is very helpful for LS, it has to be
offered only to people who are productive and contribute to the organisation.
Further, Ali (1989b, 1990) said that employees in the GCC are not innovative
whatsoever; instead of creating their own strategy, they prefer to hire someone else,
and most GCC employees avoid responsibility, believing that “centralization
encourages respect” (Ali, 1989b, 1990). Welsh and Raven (2004) agreed with Ali
(1989b, 1990) by saying that although Kuwaiti employees do like flexibitilty, they
are not risk takers . Another factor that creates the high UAI score includes Kuwait’s
status as a country that is surrounded by mighty nations such as Iraq and Iran.
In high UAI and PDI countries, there are huge distances between top
management and employees, and the lines of communication run vertically. In this
type of culture, people do not have a high level of involvement as the organisation is
not flat; it is like a pyramid rather than a family (Adler, 1986). In this type of culture,
people need to go to the top if they want to complain or get something done (At-
Twaijri and Al-Muhaiza, 1996), and this is not very supportive towards LS.
5. Long-Term Orientation (LTO)

99
The organizations that rely on Long-Term Orientation demonstrate a pattern of
major goals and objectives, and a clear road map to attain these goals and objectives
over a period of time. (Jabnoun and Al Khafaji, 2005, p. 8)
In a long-term-oriented culture, organisations are mainly concerned with
future results, and are more focused on the long term than the short term. In addition,
they normally invest to make long-term changes in their organisation (Waarts and
Van Everdingen, 2005).
According to Obeidat et al. (2012), organisations with a long-term culture are
usually patient and prefer take stable steps towards achieving their goals; on the
other hand, short-term-orientated firms have a main focus on short-term planning
and quick results, as well as relaying on the past. Arab countries were not included in
this dimension in Hofsted’s study, but according to Obeidat et al. (2012) they can be
classified as long-term-oriented.
Abrahamsson and Isaksson (2012) conducted an interesting study that
compared 14 lean principles based on Liker’s (2004) definition, and using the
Hofsted national culture model to identify the requirements for LS in terms of
national culture. They found that high PDI and MAS cultures negatively affect LS;
strong UAI and LTO have positive effects; and there is no effect on IDV, which can
be said to be due to the Japanese culture, which has low PDI, high UAI and high
LTO. Thus, LS works better under conditions of low PDI, low MAS (or feminine
culture), high UAI, and high LTO. According to Abrahamsson and Isaksson’s (2012)
results, PDI and UAI have the greatest effect on lean principles. Teamwork and
development, as well as consensus decisions, are required in cultures with low PDI.
Jabnoun and Al Khafaji (2005) found that TQM works well or is
implemented more effectively in national cultures with low PD, low UA, and
femininity. Customer satisfaction is largely dependent on CI and empowerment,
which requires a culture of low uncertainty avoidance, low power distance, and
femininity. Empowerment can be more effective in cultures of low power distance,
low uncertainty avoidance and femininity. In order for CI to work, low levels of
uncertainty avoidance and power distance are required (Jabnoun and Al Khafaji,
2005).

100
Similarly, Jung et al. (2008) found that quality management is influenced by
the national culture, or, more precisely, by PD. In low-PD firms, employees were
found to be more committed towards change as they were empowered; while in
high-PD firms employees tended to rely on guidance from superiors. In an
individualist culture, organisations are less likely to prevail in implementing QI,
while in TQM teamwork and standardisation are essential, so low individualism or
collectivism serve as better foundations.
2.14 How can LS be assessed?
According to Wan (2006), the evaluation of levels of leanness has not been
given a great deal of attention compared to that dedicated to tools and techniques,
benefits, and other aspects of LS.
Many measurement frameworks have appeared in the literature to date (e.g.
Furlan et al., 2011; Shah and Ward, 2003, Shah, 2007; Mady, 2009; Anad and
Kodali, 2008; Nordin et al., 2010; Goodson, 2002; Panizollo, 1998; Saleeshya et al.,
2013; Karim et al., 2013), each of which target different aspects and contain
different elements.
Furthermore, many articles relating to lean assessment measurement tools and
frameworks have been developed by leading organisations, such as the ISI Lean
Value Assessment (Industrial Solutions Inc.), Assessment (Lean Enterprise Inc.),
Stratergos Assessment (StrategosInc), Lean Self-Assessment Throughput Solutions,
Shingo Assessment, Sai Global Assessment, etc. Despite the empirical results of
these frameworks, they are not always applicable to every organisation, as each
individual firm has different requirements, and sometimes the different sectors affect
the applicability of the frameworks. Furthermore, the frameworks are not always
helpful as they consist of too-complex elements and are too immense (Jaitly et al.,
2008; Wan 2006).
Several researchers (e.g. Connor, 2001; Feld, 2000; Jordan and Michel, 2001)
have suggested lean assessment surveys which could help organisations through lean
implementation; each of these surveys contains scores that indicate the level of
leanness in the organisation. However, some of the indicators used may be not be

101
helpful or appropriate for every organisation; further, the responses of survey
questionnaires could be subjective, and the results could be biased (Wan et al.,
2007).
2.14.1 Review of lean assessment framework
This section will review the available assessment framework to see how LS
practitioners, authors and researchers have assessed organisational leanness to
provide an idea about the key areas that it is necessary to focus on in order to
measure the LR of K-SMMIs.
According to Karim and Arif-Uz-Zaman (2013), it is very important to
measure organisational performance to realise the benefits of LS, while measuring
leanness must be based on an appropriate measurement method.
As mentioned in the previous section, a number of frameworks have
appeared in the literature to date (e.g. Sohal and Egglestone 1994; Boyer 1996;
Karlsson and Åhlström 1996; Panizzolo 1998; Sánchez and Pérez 2001; Goodson
2002; Bohemia 2002; Soriano-Meier and Forrester 2002; Shah and Ward 2003; Lee
2004; Doolen and Hacker 2005; Shah and Ward 2007; Shahram 2008; Anad and
Kodali 2009; Wong et al. 2009; Nordin et al. 2010; Saurin et al. 2011; Saleeshya et
al., 2013; Karim et al. 2013).
Table 6 lists these frameworks and explains how the researchers developed
them to assess organisational performance in relation to practising LS. Some are
similar, however each framework takes a different approach in terms of the
categories used or the ways of asking questions; this can be attributed to the fact that
leanness measurements depend on how the problem is identified by the researcher
(Karim and Arif-Uz-Zaman, 2013).
Some researchers have assessed organisational leanness based on VSM (e.g.
Wan et al., 2007; Kuhlang et al., 2011), while others (e.g. Levinson and Rerick,
2002; Fogarty, 1992; Marvel and Standridge, 2009) have measured it based on an
evaluation of the operational efficiency and productivity.

102
Measuring the leanness of an organisation based on lean principles had not
been done (Womack and Jones, 2003) until 2013 (Saleeshya et al., 2013; Karim and
Arif-Uz-Zaman, 2013). Further, Karim and Arif-Uz-Zaman (2013, p. 176) declared
that “most of the methods proposed were not supported by practical implementation
and therefore validation could not be guaranteed”. Saurin et al. (2011) suggested that
most lean assesssemnt models have not assessed lean practices (such as visual
management) that take place on the shop floor.
In 2013, Saleeshya et al. (2013) and Karim and Arif-Uz-Zaman (2013)
published a research study regarding the assessment of organisational leanness. Their
study was based on the five lean principles (specify value; identify value stream;
create flow; respond to customer pull and finally pursue perfection).
Behrouzi and Wong (2011) suggested that three types of approaches have
been used by researchers to measure lean performance. The first approach is to
measure LS based on the lean techniques and tools that have been implemented (e.g.
Doolen and Hacker, 2005; Jordan and Michel, 2001); the second is to measure LS
based on an evaluation of the performance output (e.g. cost, quality, delivery,
flexibility, reliability and continuous improvement) (e.g. Wan, 2006; Bayou and de
Korvin, 2008); the third mixes the two approaches (e.g. Gurumurthy and Kodali,
2009).
There are huge number of articles that explain lean techniques, concepts and
principles for developing their frameworks, and there is no consistency between
authors, researchers and practitioners. This can be attributed to difficulties in
creating general, accurate, and simple frameworks (Weick, 1979). Furthermore,
according to Doolen and Hacker (2005), there is no agreement among researchers
about the importance of lean practices, and many researchers have developed a
framework to assess the leanness of the organisation based on different key areas.
For example, Womack et al. (1990) emphasised the importance of shop-floor
organisation, total quality management, identifying the value added, set-up time
reduction and error-proofing equipment, while other researchers (e.g. James-Moore
and Gibbons 1997; Panizzolo 1998; Karlsson and Ahlstrom 1996) have emphasised
the importance of cellular manufacturing, cycle time and total productive

103
maintenance. Finally, Allen et al. (2001) emphasised productivity, quality, cost, and
safety.
Taj (2005) developed a lean assessment tool to assess the current state of the
production plant within specific perspectives. This tool determines the gap between
the current state and the target one, and identifies opportunities for improvement.
However, it does not suggest any specific lean tools to improve the current state.
Wan et al. (2007) developed a new way of evaluating the leanness of an
organisation, which proceeds by applying different templates of LS indicators. In
order to do this, they developed a web-based tool; however, they admitted that this
model is not wholly effective and has some weaknesses, as it requires many
templates for different environments.
Karlsson and Ahlstrom (1996) developed a framework to assess changes
toward lean implementation based on nine key areas: elimination of waste; CI;
multifunctional teams; vertical information systems; decentralised responsibilities;
integrated functions; pull; zero defects; and JIT.
Soriano-Meier and Forrester (2002) followed similar approaches to those
developed by previous researchers. They developed a framework to measure the
leanness of the organisation using nine groups similar to those developed by
Karlsson and Ahlstrom (1996), and added four groups identified by Boyer (1996)
(quality leadership on the part of management; the use of small groups or teams for
problem solving; training; and worker empowerment). The aim of their model was to
measure the degree of LS adoption.
Sanchez and Perez (2001) created a checklist for lean assessment in Spanish
firms; their measurement tool was based on six key areas: elimination of zero-value
activities; continuous improvement; multifunctional teams; JIT production and
delivery; integration of suppliers; and flexible information system. These key areas
include 36 indicators. According to Wan (2006), however, this mdoel is subjective
and only provides an estimate of the characteristics of the organisational leanness.
Bergmiller and McCright (2009) saw the Shingo prize model as the best way
in which to measure the leanness of an organisation. This model diluted leading
models, such as those by Womack and Jones (1996), Liker (2004) and the SAE
104
(Society of Automotive Engineers, 1999) into one coherent model, The Shingo prize
is named after Shigeo Shingo, and is awarded for excellence in manufacturing. It
aims to creates awareness of lean manufacturing concepts for companies, and the
evaluation criteria for the prize is based on quality, organisational culture, cost,
customer satisfaction, leadership, empowerment, manufacturing strategies and
system integration.
Thus, it can be concluded that measurement of leanness can be done in many
ways, all of which depend on the objective of the study. In Table 7, the practices
have been categorised into six categories, and show the key areas that the researchers
in Table 6 considered to assess the leanness of organisations, as identified from the
literature review. This shows the important of these areas for starting and sustaining
LS.

105
Table 6 Lean measurement frameworks and models
Author(s) Assessment purpose and approach
Sohal and Egglestone
(1994)
Assessed the level of lean implementation within Australian firms based on five key areas: inventory; human resources;
product design; suppliers; and methods.
Boyer (1996) Considered four types of investment in the manufacturing infrastructure: quality leadership on the part of management;
the use of small groups or teams for problem solving; training; and worker empowerment.
Karlsson and
Åhlström (1996)
Created an assessment tool based on nine key areas: elimination of waste; CI; multifunctional teams; vertical
information systems; decentralised responsibilities; integrated functions; pull; zero defects; and JIT.
Panizzolo (1998) Explored how lean has been adopted by Italian firms, based on six areas categorised as internal or external: human
resources; processes and equipment; planning and control; product design (internal factors); suppliers; and customers
(external factors).
Sánchez and Pérez
(2001)
Created a check list for lean assessment in Spanish firms based on six key areas: elimination of zero-value activities; CI;
multifunctional teams; JIT production and delivery; integration of suppliers; and flexible information system.
Jordan and Michel
(2001)
Developed a survey (36 questions) to assess organisational leanness. They stated the question in five different ways
considered appropriate for different participants, such as employees, customers, suppliers, investors and executives. The
key areas measured include: CI; waste reduction and identification; value stream management; flow; leadership; and
employee development.
Goodson (2002) Created a structured measurement tool to evaluate the level of leanness based on 11 key areas: customer satisfaction;
inventory management; safety, environmental, cleanliness, order; visual management; supplier focus; commitment to

106
quality; scheduling; flow and space; teamwork and motivation; condition and maintenance; and management of
complexity.
Bohemia (2002) Measured the leanness of Australian organisations based on three key areas: management techniques/systems; design
methods/tools; and production technology.
Soriano-Meier and
Forrester (2002)
Developed a measurement framework to measure the level of leanness and level of lean adoption within UK ceramic
firms based on work done Boyer (1996) and Karlsson and Åhlström (1996). They concentrated on 13 key areas: quality
leadership; problem solving; training; empowerment; elimination of waste; CI; multifunctional teams; vertical
information systems; decentralised responsibilities; integrated functions; pull; zero defects; and JIT.
Shah and Ward
(2003)
Studied the effect of plant size, plant age and unionisation on lean based on four bundles (JIT, TQM, HRM, TPM) in US
firms.
Lee (2004) Created a measurement framework based on nine key areas; inventory; team approach; processes; maintenance; layout
and material handling; suppliers; set-up and lot size; quality; and production control and scheduling.
Doolen and Hacker
(2005)
Assessed the level of lean implementation in the Pacific northwest region based on six areas: shop-floor management;
manufacturing equipment and process; product development; workforce management; customer relations; and supplier
relations.
Shah andWard (2007) Developed a measurement tool for large manufacturing industries based on five areas: suppliers; customers; human
resources; processes (pull, flow, scheduling); and planning and control (ensuring product quality).
Bayou and de Korvin Compared production leanness of General Motors and Ford Motor Company, benchmarked against Honda Motor

107
(2008) Company. Their measurement was based on 3 areas: JIT, Kaizen, and quality controls.
Shahram (2008) Investigated the level of lean adoption by assessing current practices within Chinese firms of different sectors based on
nine key areas: inventory; team approach; processes; maintenance; layout/handling; suppliers; setups; quality; and
scheduling and control.
Gurumurthy and
Kodali (2009)
Developed a measurement formwork and benchmarked investigated firms against Toyota based on eight key areas that
contain 65 practices: design; production engineering; suppliers; production planning and control; operation; quality; top
management; and human resources.
Wong et al. (2009) Investigated the adoption and implementation of lean systems within different organisations in Malaysia based on 14
key areas: work processes; scheduling; inventory; equipment; layout; material handling; employees; quality; product
design; suppliers; tools and techniques; customers; ergonomics and safety; and management and culture.
Nordin et al. (2010) Explored the extent of lean implementation within Malaysian automotive firms; followed Panizzolo’s (1998) approach
by using external and internal factros. Their study was based on five key areas: processes and equipment; manufacturing
planning and control; human resources (internal factors); customer relations; and supplier relations (external factors).
Saurin et al. (2011) Assessed the use of lean production within manufacturing cells based on three key areas that include 18 practices:
human resources; planning and control; and process technology.
Stone (2012b) Developed a framework to measure the leanness of the organisation based on organisational change and organisational
performance in medium-sized manufacturing industries. Considered 12 key areas: external environment; mission and
strategy; leadership; culture; individual and organisational performance; task requirements and individual skills/abilities;
management practices; system; work group climate; motivation; structure; and individual needs and value.
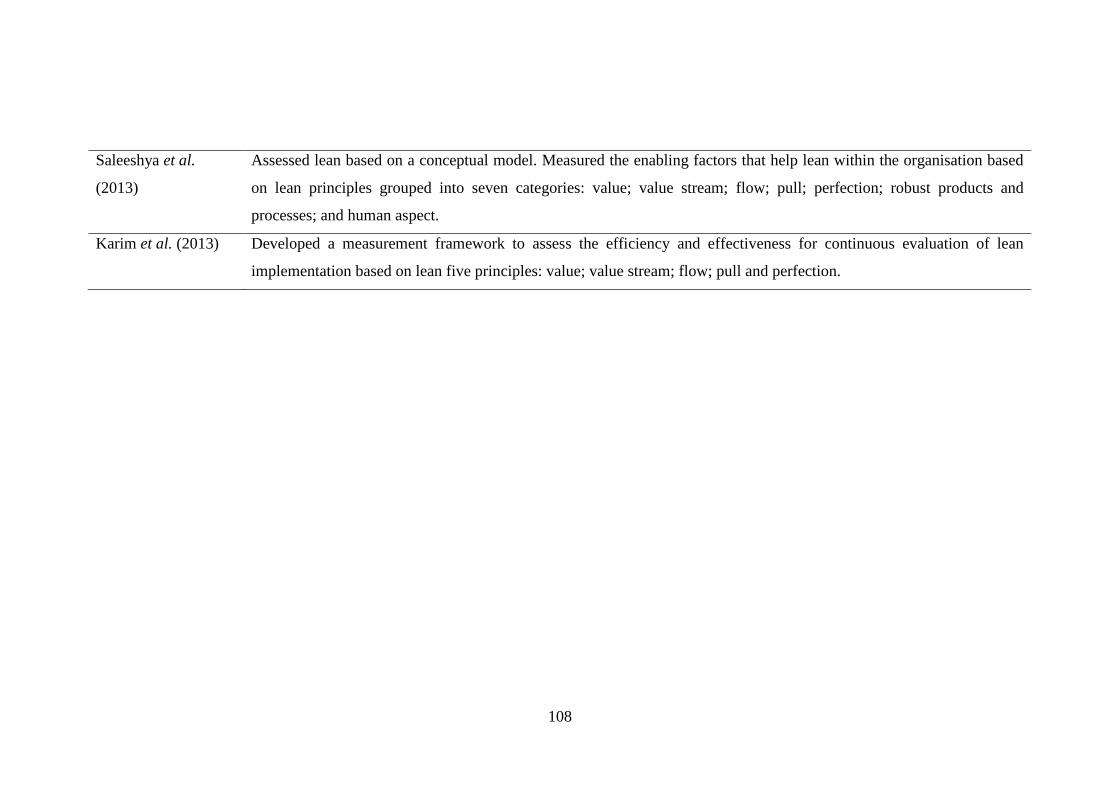
108
Saleeshya et al.
(2013)
Assessed lean based on a conceptual model. Measured the enabling factors that help lean within the organisation based
on lean principles grouped into seven categories: value; value stream; flow; pull; perfection; robust products and
processes; and human aspect.
Karim et al. (2013) Developed a measurement framework to assess the efficiency and effectiveness for continuous evaluation of lean
implementation based on lean five principles: value; value stream; flow; pull and perfection.

109
Table 7 Key areas addressed by the different researchers in assessing organisational leanness
Key areas Appears in the reviewed literature
1 2 3 4 5 6 7 8 9 10 11 12 13 14 15 16 17 18
Processes * * * * * * * * * * * * * * * * *
Planning and control * * * * * * * * * * * * * * * * *
Human resources * * * * * * * * * * * * * * * * *
Top management and leadership * * * * *
Customer relations * * * * * * * * *
Supplier relations * * * * * * * * * * * * *
Note: [1] Sohal and Egglestone (1994); [2] Boyer (1996); [3] Karlsson and Åhlström (1996); [4] Panizzolo (1998); [5] Sánchez and Pérez
(2001); [6] Goodson (2002); [7] Bohemia (2002); [8] Soriano-Meier and Forrester (2002); [9] Shah and Ward (2003); [10] Lee (2004f); [11]
Doolen and Hacker (2005); [12] Shah andWard (2007); [13] Shahram (2008); [14] Gurumurthy and Kodali (2009) ; [15] Wong et al. (2009);
[16] Nordin et al. (2010); [17] Saurin et al. (2011); [18] Jordan and Michel (2001); [18] Stone (2012b)

110
Other models have also been developed by popular organisations and
researchers that have aimed to assess LS aspects relating to organisational culture
and administration actions, such as creating a learning environment to support LS.
Among those models is the Shingo Prize, the Lean Enterprise Model and the SAE
standards (Saurin et al., 2011).
Doolen and Hacker (2005) summarised key features of the available
industrial assessment tools: Table 8 shows the key areas that these models have
concentrated on. Apart from the study by Jordan and Michel (2001), these
frameworks could not be reviewed due to the lack of availability of the models.

111
Table 8 Industrial assessment tools
Conducted by Title Assessment tools and investigated areas
Jordan and Michel
(2001)
Survey of Perceptions of a
Company's Leanness
Developed a survey (36 questions) to assess organisational leanness; their survey can be
applied to different stakeholders such as employees, customers, suppliers, investors and
executives. The key areas measured are: continuous improvement, waste reduction and
identification, value stream management, flow, leadership and employee development.
Lean Enterprise
Implementation Group
(1999)
The 360 Lean Audit
Aimed to identify the implementation level in terms of lean techniques and tools (e.g.
plan-do-check-act (PDCA), wastes, flow, pull, level production, quality, workplace
organisation and maintenance in terms of equipment effectiveness and reliability), as
well as assessing policies and process management.
Northwest High
Performance
Enterprise
Consortium (2002)
HPEC Assessment
Aimed to measure the outcome of lean implementation based on several issues, such as
maintenance practices, product development processes, flexible manufacturing
practices, quality achievements, employee involvement and inventory management.
Robert Abair
Associates, Inc. (2002)
Lean Checklist Self-
Assessment
This model consisted of lean principles (e.g. pull and flow) and many practices such as
JIT, Kaizen, 5s, level production (heijunka), performance measures, poka-yoke,
workforce flexibility, lean education and training, and aimed to helped organisations to
measure progress in lean implementation.

112
Wisconsin
Manufacturing
Extension Partnership
(2002)
Lean Business Assessment
According to Doolen and Hacker (2005), this survey allows organisation to prioritise
the important activities that help LS. This self-assessment tool is based on many lean
practices and principles such as pull system, flow production, Kaizen, quick
changeover, automation with human touch (Jaidoka), and maintenance.
Wisconsin
Manufacturing
Extension Partnership
(2001)
How Lean is Your Culture? According to Doolen and Hacker (2005), this survey aimed to help managers to identify
the factors that enable and/or inhibit LS.

113
Having reviewed the available frameworks for measuring LS, it appears that
there are different ways of conducting such measurements. According Wan (2006),
many of the available frameworks are not applicable to all industries, and many
measurement frameworks and models may also be outdated as the management
techniques, as well as technology, are improving every day. Further, Jaitly et al.
(2008) mentioned that most of the measurement frameworks follow the same logical
patterns in terms of structuring the parameters and asking questions; however, these
are not free from criticism. The weaknesses include: a lack of structure in terms of
questions and parameters; a failure to relate to the LS wastes in question; repetition
of parameters/questions, which may lead to misunderstandings; inappropriate
weights given to parameters, which do not always reflect their importance; too much
emphasis on lean tools, and not enough on the role of the people involved; questions
that are too complex; and tools that are too bulky.
According to Lander and Liker (2007), the best procedure is to understand
the lean principles and assess the organisation based on those principles, as every
organisation has different needs and requirements in order to be lean – though the
organisation must stick with lean principles.
2.15 The context of Kuwait
Kuwait is a rich Middle Eastern oil country located in the north-western region
of the Arabian Gulf; the area of the state of Kuwait is approximately 18,000 km2. It
is a small country with a small population: the total number of people living in
Kuwait is about 3,000,000, while Kuwaiti people account for 1,000,000, which is
one-third of the total population. Despite its small size and number of people,
however, Kuwait is one of the richest countries in the world, and its people have
social stability and a high standard of living. In addition, people in Kuwait are
considered to be more open to the Western world compared to other countries in the
same region, and this has created diversity in the culture (PAI, 2008).
The main religion in Kuwait is Islam, while the main language is Arabic,
though English is widely used as well. Kuwait and the GCC countries are considered
to consists of tribal societies. In terms of regime, Kuwait is the only democratic state
in the GCC region that has sovereignty and a constitution. Laws in Kuwait are

114
endorsed by the National Assembly, which comprises 50 members who are elected
every four years by free ballot (PAI, 2008).
The marketplace in the Middle East is growing quickly, which has caught the
attention of the whole world as it is seen as a lucrative market and offers great
opportunities to businesses (Welsh and Raven, 2006). This region has a high level of
diversity and uniqueness in terms of its culture; Westerners must understand the
region’s cultural and religious issues before starting businesses in the country, as
these two factors have a great impact on shaping business in the region (Welsh and
Raven, 2006). According to Abbasi and Hollman (1993), many Westerners have
viewed the region as oil-rich, however very few attempts have been paid towards
recognising the business opportunities within it.
The Middle East region – or, more precisely, the GCC region – has been
flourishing since the discovery of oil in the 1930s, which converted the region from a
desert society to a more modernised and civilised one in terms of lucrative economy,
as well as ethnic variation (Welsh and Raven, 2006). As a result, many expatriates
have come to the region to seek job and business opportunities; according to Welsh
and Raven (2004), Kuwait was one of the first countries in the region to hire people
from overseas based on qualifications, rather than links. The country experienced a
particular influx of expatriates and migrants after the discovery of oil; most of these
have come from Arabic countries such as Syria and Egypt, as well as Asian countries
such as the Philippines, Indonesia, India, Pakistan, and other nearby nations.
2.15.1 Kuwait’s historical background
According to Welsh and Raven (2004), prior to the discovery of oil the Kuwait
market was based on trading, mainly with India and East Africa. The Kuwaiti people
have always been involved in business, even before oil was discovered, and thus
they have an entrepreneurial spirit that has allowed them to survive and has provided
basic needs for their families. This has also exposed them to more new ideas and
aspects of Western culture when compared to neighbouring countries (Welsh and
Raven, 2004; Al-Kazemi and Ali, 2002; At-Twaijri and Al-Muhaiza, 1996).
Kuwaitis started by forming micro and small businesses, which were then expanded
to larger businesses after the discovery of oil in the 1930s (Welsh and Raven, 2004).

115
However after the discovery of oil, and as a result of business activity being
reshaped, the contribution of small businesses declined; many small businessmen
expanded their businesses to become the leading companies in the Kuwait market,
while others, such as craftsmen, decided to leave their micro and small businesses
and work for the government (Welsh and Raven, 2006).
Culture and religion are major issues in the GCC region, and is considered to
be very important in shaping the management systems, human relations, customer
relations, and employee management (Welsh and Raven, 2006). The region has been
in transition since the discovery of oil, which resulted in radical changes in GCC
countries in terms of creating huge revenues, and industrialisation (Abbasi and
Hollman, 1993).
GCC countries have built solid relationships with Western countries (e.g. the
UK and USA), which they have benefited from and which have allowed them to
improve their health and education systems, as well as to have greater mobility
through better communication with other parts of world (Ali, 1990).
One of the distinctive features of GCC culture is the dualities, as the
countries strive to have a modern life while maintaining their tradition values, which
can be seen as a contradiction as some requirements of modern life require values
and religion to be compromised. According to Welsh an Raven (2006, p. 30)
“Contradiction is an inherent part of Islamic culture”; however, people tend to
adhere to Islamic rules and values when conflicts with other issues arise (Ali, 1993).
The Arab culture highly values fatalism, which can be expressed by saying
“Allah (God) willing”, which sometimes means “I will do it if the boss wills it”, and
in Kuwait is used “to delay or reposition responsibility and decision making” (Welsh
and Raven, 2006, p. 44).
2.15.2 The effect of religion on the management system
The GCC region’s Islamic culture has guided it in how to treat people and
how to operate business in terms of employee reward systems, employee relations
and customer services, business transactions, financial aspects, etc. (Welsh and
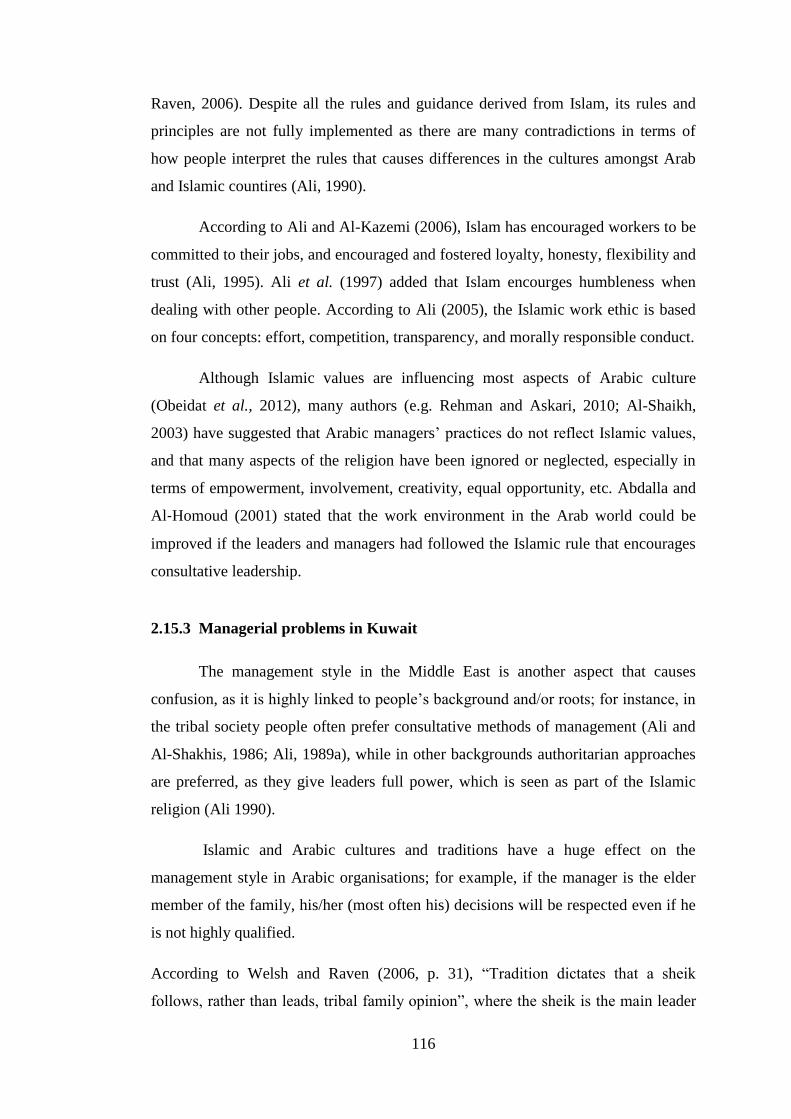
116
Raven, 2006). Despite all the rules and guidance derived from Islam, its rules and
principles are not fully implemented as there are many contradictions in terms of
how people interpret the rules that causes differences in the cultures amongst Arab
and Islamic countires (Ali, 1990).
According to Ali and Al-Kazemi (2006), Islam has encouraged workers to be
committed to their jobs, and encouraged and fostered loyalty, honesty, flexibility and
trust (Ali, 1995). Ali et al. (1997) added that Islam encourges humbleness when
dealing with other people. According to Ali (2005), the Islamic work ethic is based
on four concepts: effort, competition, transparency, and morally responsible conduct.
Although Islamic values are influencing most aspects of Arabic culture
(Obeidat et al., 2012), many authors (e.g. Rehman and Askari, 2010; Al-Shaikh,
2003) have suggested that Arabic managers’ practices do not reflect Islamic values,
and that many aspects of the religion have been ignored or neglected, especially in
terms of empowerment, involvement, creativity, equal opportunity, etc. Abdalla and
Al‐Homoud (2001) stated that the work environment in the Arab world could be
improved if the leaders and managers had followed the Islamic rule that encourages
consultative leadership.
2.15.3 Managerial problems in Kuwait
The management style in the Middle East is another aspect that causes
confusion, as it is highly linked to people’s background and/or roots; for instance, in
the tribal society people often prefer consultative methods of management (Ali and
Al-Shakhis, 1986; Ali, 1989a), while in other backgrounds authoritarian approaches
are preferred, as they give leaders full power, which is seen as part of the Islamic
religion (Ali 1990).
Islamic and Arabic cultures and traditions have a huge effect on the
management style in Arabic organisations; for example, if the manager is the elder
member of the family, his/her (most often his) decisions will be respected even if he
is not highly qualified.
According to Welsh and Raven (2006, p. 31), “Tradition dictates that a sheik
follows, rather than leads, tribal family opinion”, where the sheik is the main leader

117
of the group. Welsh and Raven (2006, p. 31) added “[Islam] encourage[s] respect of
elder family members and stress[es] a father’s authority within a family”; in
addition, the authoritarianism style is predominant in the Middle East organisation.
Raven and Welsh (2004) suggested that a pseudo-consultative style has been
followed by most Kuwaiti organisations; despite this, however, the final decision has
to be made through the top management, and a large number of consultations are
conducted for the sake of the consultation (Ali, 1989a).
There are several problems associated with management in the Middle East
in general, and in Kuwait precisely, that prevent creativity and foster bureaucracy.
According to Obeidat et al. (2012), managers in Kuwait are not up to date with
modern management systems, and lack motivation to adopt these systems as
managers do not usually like to change, since they are happy and afraid of the
unknown and what new systems could bring to their business.
Al-Rasheed (2001) saw the relationship between superiors and subordinates
in Kuwait as main reason for poor coordination between tasks. Further, the lack of
performance evaluation and clear objective in terms of organisational direction and
career path, and the shortage of planning and policies for human resources symbolise
the managerial problems in Kuwait.
Another problem that Kuwaiti organisations face relates to centralisation,
which is very common in Arabic organisations and results in a lack of empowerment
and employee involvement (Al-Rasheed, 2001). Obeidat et al. (2012) identified
another serious problem that has been largely neglected in Arab organisations, which
is the lack of training that meets work needs. According to Al-Rasheed (2001),
training is never a priority in Arab organisations as they see it as a waste of time and
money rather than a means of human development and investing in people that will
eventually reflect on the whole organisation.
In Kuwait, training programs are considered as standalone systems with no
links to other activities and systems; this makes such programs ineffective, since
their effectiveness is not evaluated (Abdalla and Al-Homoud, 1995).
Ali et al. (1997) conducted a study to examine the management style in
Kuwait. They showed that the managerial approach tends to be consultative and

118
participative, as this is seen as being more effective. However, Ali et al. (1989b) and
Al-Kazemi and Ali (2002) found that the management style in Kuwait is pseudo-
consultative, which means that the manager or the leader in the organisation has the
full power to make a decision and will consult others only when it has already been
made, and thus only for the sake of it and not to aid in making the decision. Abdalla
and Al‐Homoud (2001) supported this view by saying that workers in Kuwaiti
organisations are not allowed to comment on decisions, and relationships between
managers and workers are mainly either based on fear or admiration.
Abdalla and Al‐Homoud (2001, p. 512) stated:
Those who are allowed to establish stronger relationships with the boss are chosen
according to the boss's whims rather than for their willingness to cooperate, their
competence, or relevance to the work tasks.
Further, Abdalla and Al‐Homoud (2001) emphasised that though workers do
not mind these attitudes, they will ruin the organisation as they have an effect on
employee involvement and commitment.
Abdalla and Al‐Homoud (2001) suggested that there is a contradiction in
Arab managers, as they manage, hire and motivate based on their tribal culture,
rather than on performance or qualifications, but at the same time want to their
organisation to be successful. Abdalla and Al‐Homoud (2001) further said that
tribalism promotes nepotism and favouritism, which is the main reason behind
failures to develop teamwork and improve the organisation. An example of this
negative affect is that Kuwaitis will often be assign to an important position
regardless of their performance and qualifications, as highlighted by many
researchers (e.g. Al-Kazemi and Ali 2002; Blair, 2009, Kinninmont, 2012).
According to Al-Kazemi and Ali (2002), the managerial problems in Kuwait
come from different sources, such as the fact that personal relationships are
prioritised over work relationships; favouritism; lack of delegation and
empowerment; subjectivity in promotion and evaluation (normally based on sects
and tribes); too many useless rules and regulations; rigidity and non-innovation
within the organisation; outdated administrative systems and policies; and influences
from cliques in the organisation.

119
These problems have enhanced frustration among workers within Kuwaiti
organisations, which leads to a lack of improvement within the organisation; Al-
Kazemi and Ali (2002) stated that the source of these problems come firstly from
government policies that offer Kuwaiti residents everything “on a golden plate”,
such as lifetime employment and other privileges; and secondly from traditional
norms and practices.
Abdalla and Al-Homoud (1995) highlighted the sources that cause and
promote bureaucracy in Kuwait, suggesting that most expatriates in Kuwait have
brought their own cultures, traditions, and bureaucratic and power practices, which
has adversely affected Kuwaiti organisations. Another problem is the
“Kuwaitisation” system, wherein Kuwaitis are assigned to managerial jobs, rather
than expatriates, regardless of their experience and the unwillingness of Kuwaitis to
exert effort to execute tasks. They added that there is no proper evaluation system in
Kuwaiti organisations that assess training programmes to see whether they are
effective so that they can be transferred to other department or improved if needed,
and this is not considered a priority. These problems can be attributed to the lack of
planning and clear strategies set forth by the Kuwaiti government (Abdalla and Al‐
Homoud 2001).
Another indication that highlights the lack of planning and strategy by the
Kuwaiti government is that they started campaigns to encourage Kuwaitis to work in
private sectors, but after a short period of time increased the salaries for people in
government sectors, which causes reverse migration, with Kuwaiti workers moving
from the private to the public sectors (Switzerland Global Enterprise, 2012).
Harry (2007) suggested that the rapid demographic changes, highs and lows
of oil prices, inequalities in relation to wealth, inadequate education systems and
ineffective government policies are the main sources of managerial and human
problems in the GCC region.
120
2.15.4 Family and non-family businesses, and their affects on promoting
improvement
In the GCC region there is a large number of family-owned businesses;
according to Abdalla and Al‐Homoud (2001), in Kuwait 85 per cent of SMEs are
considered to be family owned. Family buisness has some advantages and
disadvantages in terms of runing the business in the Middle East, considering the
management style, religion and traditions described in previous sections.
According to Welsh and Raven (2006), customers and employees in the
Middle East are distinctive in many aspects, such as their behaviour, and in order to
perform and be committed to the organisation they require a proper and unique
management motivation and reward system. Welsh and Raven (2006) added that
organisations in the Middle East are usually able to successfully manage their
employees, which in turn will lead to happy customers, and this is simply because
most companies are run by families and are small business, which gives them
flexibility and an edge with respect to fulfilling their customers’ demands by
working more efficiently.
Welsh and Raven (2006, p. 44) stated
Competitive advantage [in Middle Eastern organisations] is not in the huge buying
power and extensive research capabilities, but in their ability to intimately know
their customers and their needs. Price competition is unlikely to be their advantage,
but service can be.
Ali (1990) suggested that managers in the GCC region prefer flexibility and
low formality in work as they have little respect for procedures and rules. In
addition, family values promote and encourage conformity and discourage creativity.
As they see flexibility and low formality in work is enhancing the stability of the
organisation, since commitment and stability are highly valued in Islamic culture
(Ali, 1990). Abbasi and Hollman (1993) suggested that family-owned businesses
also have some negatives, as family members in the Middle East mainly hold key
positions within organisations and, regardless their quality and qualifications, enjoy
the privilege of high pay even if they do not make a real contribution to the
121
organisation (Ali, 1990). This in turn affects the morale of other employees,
especially those who have better qualifications.
Ellington et al. (1996) conducted a study into the adoption practices of
family-owned manufacturing firms, and found that family businesses are less likely
to adopt TQM due to requirements of TQM such as cost and commitment. In
addition, family-owned businesses are mainly centralised, whereas TQM requires
decentralised decision making. They added that quality and management practices
are likely to differ between family- and non-family-owned firms.
Ward (1988) suggested that family-owned businesses are not always willing
to fulfil the requirements of TQM, as the techniques require investment and long-
term planning, while family businesses favour short-term planning. As described by
Ellington et al. (1996), family-owned businesses take a rather “status quo attitude”,
and their main focus is on the short term. Levinson (1987) suggested that family
businesses are more resistant to change and, although they always adopt
improvement practices, they do not do so convincingly.
Hofer and Charan (1984) suggested that problems in family businesses arise
from their methods of decision making and planning as they are more centralised,
which is not very supportive to QI, as well as their lack of managerial skills and
training, since their management methods are mainly informal.
Ellington et al. (1996) stated that characteristics such as centralisation are an
impediment for family businesses to implement TQM holistically, since TQM
requires empowerment and delegation to employees. However, Ellington et al.
(1996) added that family-owned firms have great advantages in terms of successful
adopting TQM, as they have high level of organisational flexibility and management
informality. In order to succeed, therefore, they need less centralisation and more
empowerment.
Cooper et al. (2005) highlighted differences between family- and non-family-
owned businesses in terms of the implementation of strategies for customer
relationship management (CRM), they found that the non-family-owned companies
have better practices in dealing with customers.

122
Several authors (e.g. Welsh and Raven, 2006; Chua et al., 1999; Davis, 1983)
are in favour of family businesses, and think that they are more flexible and have a
better understanding of their customers. Davis (1983) and Chua et al. (1999) stated
that family businesses tend to place more focus on individuals, are more long-term
oriented, and have great emphasis on creating quality and value for their business.
Further, Welsh and Raven (2006) stated that family businesses are far better at
understanding customers and have better relations with them; moreover, family
businesses are more focused on their employees and, in return, have better employee
commitment and are more focused on quality and service.
2.15.5 The Kuwaiti industrial context
Kuwait is a newly emerging industrial market, and one of the smallest but
richest countries, with the highest per capita GDP in the world (Burney et al., 2010).
Because of its wealth, Kuwait is highly dependent on international trade and
expatriate labour for economic growth. According to a report published by the
Industrial Bank of Kuwait (2001) and Eltony (2007), the country’s industrial
manufacturing sectors contribute 2.8 per cent to its GDP (excluding the
petrochemical and petroleum sectors), which is very low when compared to other
developing countries; for instance, the manufacturing sector in India accounts for 17
per cent GDP, while for China this figure is 35 per cent, Thailand 34 per cent,
Malaysia 31 per cent, and Indonesia 25 per cent (Upadhye et al., 2010b).
According to the Public Authority for Industry (PAI, 2008), the total number
of manufacturing industries in Kuwait is 1031. The main non-oil manufacturing
industries are food, paper (processing and printing), chemical products, building
materials and fabricated metallic products (Mady, 2009). Table 9 shows the total
number of Kuwaiti manufacturing industries and how these are distributed by
activity in Kuwait.

123
Table 9 Distribution of industrial enterprises by activity.
Source: (PAI, 2008)
Industry No. of enterprises as of 2005
Food and beverage 109
Textiles, clothing and leather 25
Wood and wood products, furniture 100
Paper and paper products 78
Chemicals, coal, rubber and plastic 159
Non-metallic minerals 247
Machinery, equipment and basic metals 295
Other manufacturing industries 18
Total 1031
2.15.6 Kuwaiti small and medium sized enterprises (K-SMEs)
SMEs play a vital role in shaping economies around the globe (Ghobadian
and Gallear, 1997), and Kuwait is no exception. There are more than 30,000
registered SMEs in Kuwait; 85 per cent of these are family businesses (Kuwait
Times, 2007; Abdalla and Al‐Homoud, 2001). Harry (2007) suggested that SMEs in
the GCC are neglected by the government, and if the government wants to create
diversity and mitigate their reliance on oil they need to enhance the role of the
SMEs.
Burney et al. (2010) asserted that the level of internal competition is very low
in Kuwaiti manufacturing sectors. This is because there is a very low concentration
of Kuwaiti SMEs (K-SMEs) in both service and manufacturing sectors, and thus K-
SMEs are considered to be in an infant stage (Rampurwala and Marafi, 2011). This
is revealed by several indicators, such as limited job creation for Kuwaiti people, and
the low impact of K-SMEs on the economy: K-SMEs accounted for only 7 per cent
of the country’s job creation (Al-Saif, 2002). Compared to other regions this
contribution is very low; for example, in the UAE, SMEs created 86 per cent of jobs,
while this figure was 51 per cent in the US, 52 per cent in the UK, 75 per cent in
Egypt, 77 per cent in Turkey, 80 per cent in Pakistan and 48 per cent in Morocco
(Rampurwala and Marafi, 2011).

124
Recently, there have been huge efforts to enhance the role of SMEs in the
Kuwaiti context, as the government realised that SMEs may be able to improve the
economy and ease the burden of government expenditure, since SMEs can create
jobs and alleviate poverty, as well as raising living standards (Ibrahim, 2010).
According to Fasano and Goya (2004), jobs in the GCC region can only be created in
the non-oil sectors.
2.15.7 Government support for SMEs
In 2006, members of the Kuwait parliament presented a draft bill to establish
an independent authority for SMEs. They highlighted the role and the importance of
SMEs around the globe; according to Ibrahim (2010), most countries have benefited
from SMEs via the creation of jobs, stronger productivity base, and the fact that they
provide support and act as feeders for the larger industries.
The bill consisted of four chapters and 14 articles that covered most of the
problems faced by K-SMEs, and included solutions for these such as enhancing the
role of government to support SMEs financially, simplifying procedures, providing
incentives and legislation to support SMEs, etc. However, this bill has not been
approved by the government.
Al-Tamimi (2013) declared that despite the fact that the Kuwaiti government
has agreed to establish funds to support SMEs, its efforts will not help to boost the
economy as it lacks a clear strategic vision, which is needed to understand the roles
of such projects in the economic context. In the mean time, the government is
disbursing money in order to solve structural problems, which is not enough in itself
to overcome the relevant problems.
Further, in order to address these problems properly, the Kuwaiti
government needs to fix a number of issues, such as improving the education system
in order to produce a new Kuwaiti workforce for the projects. Currently, most of
those projects assigned to SMEs are run by expatriates, who do not spend their
income locally but rather transfer it back to their home, which does not help to boost
the economy (Al-Tamimi, 2013). Similarly, Harry (2007) suggested that the
employment of foreigner labour will not help the economy to prosper, as many

125
foreigners are not spending their money in the host country as they send it home.
Thus, Kuwait has not benefited from SMEs in terms of job creation and boosting the
economy, unlike other countries in nearby regions.
The SME sector is like other sectors in Kuwait, in that the government has
set a budget for funding, but failed to make this work. According to reports
published by the Industrial Bank of Kuwait (2011), most projects in Kuwait have
failed due to several factors, among which are instabilities in the political
environment, the lengthy approval cycle for procedures, the scarcity of land, and
most importantly the lack of strategic planning from the government, as there is an
overlap of work in different government departments.
2.15.8 Potential barriers that contribute to delaying the development of K-
SMEs
Many inhibitors have contributed to impeding the contributions of SMEs to
the Kuwaiti economy. One of these is related to government policy, which has failed
to encourge Kuwaiti workers to etsablish or work in SMEs, since most Kuwaitis
prefer to work in the public sector, where there are better wages, a lower workload
and, more importantly, job security. According to Harry (2007), the main problem in
the GCC region relates to human resource management, since companies struggle to
manage and develop their people.
Ali and Al-Kazemi (2006) declared that several factors affect Kuwaiti
productivity in work and that have instilled the concept of obtaining wealth without
hard work. These include Kuwaitis’ high dependency on foreign labour for every
activity, and the fact that Kuwaiti people have been treated and rewarded lavishly by
the government regardless of their efficiency in work or productivity. These factors
have reinforced a mentality that appreciates leisure, enjoyment and affluence,
without hard work. According to Eltony (2007), the fact that government policy has
not placed a demand on Kuwaiti workers to be productive has left them less
interested in making an effort and acquiring skills to improve their productivity
levels, as they are given full employment benefits without being creative or
productive.

126
Ali and Al-Kazemi (2006) suggested that the majority of government
attention is on keeping the concept of the welfare state alive, which means taking
care of everything, including housing, electricity, secures jobs and providing
education, for free or at minimal prices. Al-Tarah (2003) added that the government
not only provides these services at minimal cost, but also seek to distribute wealth
among Kuwaitis. According to Ali and Al-Kazemi (2006), the welfare state clearly
has a different meaning in Kuwait compared to in Westerns countries.
Another reason for the slow growth of K-SME sectors is that the government
policies are disjointed, as various SME institutions have implemented their own
policies and programmes, which sometimes contradict those of other institutions
(Rampurwala and Marafi, 2011). Ali et al. (1997) and Kinninmont (2012) suggested
that most of Kuwait’s inhabitants are merchants, as they set rules based on their own
interests, rather than those of the country.
Many barriers are faced by K-SMEs, such as a lack of capital, training,
information in the market and expertise, as well as deficiencies in terms of support
from the government and banks in terms of finances, winning government contracts,
legislation, and exporting (Al-Saif, 2002). According to Kinninmont (2012, p. 12),
“private contracts [in Kuwait] are awarded on the basis of nepotism and personal
connections rather than efficiency or cost”. Blair (2009) shared a similar view.
Ibrahim (2010) revealed several factors that are affecting K-SMEs, and these can
be summarised as follows:
Lack of management skills, which leads to bad planning;
Fluctuation of raw materials prices, which leads SMEs to produce relatively
high-cost products that eventually affect their competitiveness;
Lack of skilled workers that have the ability to add value to the business in
terms of improving production;
Lack of funding from financial institutions;
Poor collaboration between SMEs and government research institutions.

127
The government has participated in sponsoring training programs and
development seminars to improve its human capital by improving skills and
productivity, however, despite this support from the Kuwait government:
These regulations and instructions have been mostly undertaken within a traditional
framework and outlook, rendering some of them, on many occasions, a useless
exercise and a waste of resources (Ali and Al-Kazemi, 2006, p. 88).
Ali and Al-Kazemi (2006) emphasised that another inhibitor in the Kuwait
environment is the hiring and promotion system for government jobs, which is based
mainly on social connections, tribal identity, sectarian allegiance and political
allegiance, rather than on performance or contribution. Al-Tarah (2003) asserted that
the main challenges in the Kuwaiti working environment are cultural and social, and
in order to eliminate these hiring and promotion have to be based on performance,
rather than links and connections or background.
Ali and Al-Kazemi (2006) stated that this behaviour can be attributed to the
fact that Kuwait is a small society in which everyone knows everyone, so they can
easily get jobs without having high qualifications or meeting required standards,
which is why in most Kuwaiti organisations, both private and public, essential things
such as development, motivation and performance evaluation are ignored.
Other indicators that highlight the lack of vision and long-term strategy in the
Kuwaiti government can be seen in the government policy of reducing the number of
expatriates and replacing them with citizens. This has resulted in creating
bureaucracy, overstaffing, reliance on the government and apathy towards hard work
(Ali and Al-Kazemi, 2006). According to Harry (2007), instead of getting rid of
expatriates the government should set a clear strategy that allows them to build a
capable, indigenous workforce, and this can be done through providing a proper
education system.
Ali and Magalhaes (2008) carried out a study to identify the barriers faced in
Kuwaiti business environments for adopting e-learning for the training and learning
process within. They found that lack of management support (in terms of strategic
planning, developing people and investing in training) and language barriers (as most
new systems and training are in English language, which is not widely understood),
as well as the lack information technology (IT), and lack of time and workload are

128
the main inhibitors to adopting the system. The first two (lack of management
support and language barriers) are specific problems in Kuwait, while the remaining
factors can be seen around the world.
Kuwait has fallen behind many neighbouring countries due to its very poor
innovation and productivity capability, and if the companies want to survive they
must adopt new technologies and ways of doing things, which of course requires
skills, knowledge and tools, and, more importantly, commitment (Ali and
Magalhaes, 2008).
As a result of these issues with government policy, another problem has
emerged recently with respect to Kuwaiti manufacturing sectors: many firms are
migrating to neighbouring countries, such as Saudi Arabia. This is also caused by the
lack of attention and support towards the manufacturing sectors themselves
(Shammas, 2012).
Additional barriers that may affect K-SMMIs’ adoption of LS include an
unsupportive business environment, low foreign direct investment (FDI), and low
labour quality. The Kuwaiti business environment is very weak when compared to
the newly industrialised economies of South East Asia. In addition, in order to start a
business in Kuwait it is necessary to go through lengthy bureaucratic procedures
which can take days or months, and this applies to all sectors (World Bank, 2013).
This leads to low FDI, as foreigners do not see the non-oil sectors as attractive
opportunities to invest in (Eltony, 2007). According to Tannock and Ahmed (2008),
FDI can create a number of advantages for businesses, and can increase the level of
knowledge, as well as technology and modern management techniques, and, most
importantly, enhance competitiveness in the market. Thus, the low FDI in Kuwait
may also have delayed LS in K-SMMIs.
The Kuwaiti government does not see FDI as a priority, or has misunderstood
what FDI can bring to Kuwait, which is not only capital but also skills, expertise and
technology. These are necessary if the country is serious about creating
diversification in the market and mitigating its high reliance on oil. This neglect of
FDI could be due to a number of different reasons: according to Kinninmont (2012),
the frequent clashes between government and parliament MPs have created an
instability that has affected business in Kuwait, while countries around Kuwait have

129
become attractive to FDI and attracted many investors. Kuwait is at a standstill, and
feels no urgency to attract FDI due to the increasing oil prices that have enabled the
Kuwaiti people to have high standard of living.
In addition, the quality of labour in Kuwaiti manufacturing sectors is highly
dependent on expatriates, who comprise 92 per cent of manufacturing employees
(Eltony, 2007). The reason for this is that expatriates have no problem with working
longer hours, unlike local workers, and will accept lower wages and physically
demanding jobs, as well as tolerating poorer working conditions (McMurray, 1999).
The vast majority of expatriates in Kuwait perform either unskilled or fairly
low-skilled tasks; their level of education is also very low, with 74 per cent having
failed to complete secondary education and only 8 per cent having higher education
(Baldwin-Edwards, 2011, Blair 2009). This, in turn, affects firms’ productivity;
according to Burney et al. (2010), there has been a decline in labour productivity
within Kuwaiti industries, due to the fact that the quality of labour in terms of
education and skills has decreased, with the main focus moving to cheap labour from
abroad (Mady, 2009). According to Lopez-Claros (2005), the productivity of labour
in the GCC region is very modest, as most of the labour is unskilled due to the
countries’ preference to hire low-cost labour, rather than high-skilled labour that can
offer higher productivity.
Another factor that might have had a direct impact on the low contribution of
labour in Kuwait, according to Harry (2007), is that labours are not given proper
training to perform their jobs. In addition, Kuwaiti law gives Kuwaitis great
opportunities to enjoy the wealth while controlling the labour; labour in Kuwait
cannot freely move from job to job, as they require legal permission from their
guarantor (Kuwaiti who brought them to work in Kuwait). If the guarantor refuses to
release the worker, the worker cannot force the guarantor to do so, so they accept the
situation and remain silent in order to avoid losing their job. Thus, they often prefer
to stay unproductive rather than going back home; they are happy to serve number of
years regardless of the type of the job, and make money before leaving the country;
this has prevented expatriates from fully using their skills and qualifications (Ali and
Al-Kazemi, 2006). Harry (2007) supported this view by stating that foreign labour
130
“will often accept low pay and low skill jobs as these jobs offer better pay and
savings potential than are available at home”.
2.15.9 Kuwaiti business environment
According to Ali and Al-Kazemi (2006), Kuwait does not have a healthy
business environment that motivates people to work hard and encourages productive
work involvement. Abdalla and Al‐Homoud (2001) suggested that the factors
affecting the business environment in Kuwait include: lack of competitiveness; lack
of innovation, as the majority of technology is imported; unnecessary government
protection; and a lack of separation between ownership and management control.
Tony Blair, the ex-prime minister of the UK, has been hired by the Kuwaiti
government to analyse and set a plan and vision for Kuwait to achieve by 2030. He
and his team have made a large number of recommendations to be implemented by
the Kuwaiti government to help them achieve their vision for Kuwait by 2030.
According to ALSHALL (2009), Blair has written an accurate description of
Kuwait, and provided guidance to take the country out of its problematic situation to
superiority. Blair (2009) has noted several issues that are impeding the development
of Kuwait in different sectors, among which are lack of transparency in doing
business, as well as lengthy procedures and bureaucracy, and heavy reliance on the
government, which are affecting creativity and productivity and need to be
considered by the Kuwaiti government.
During his time in Kuwait, Blair identified certain other issues, among which
are lack of land to start businesses (or establish industries), since all land is under
government control. He also noted that there is great deal of intervention by the
government, which creates corruption and low transparency. If the government is
serious about creating diversity and reducing its reliance on oil, it needs to create a
healthy business environment that will attract FDI. Harry (2007) held a similar view,
stating that governments in the GCC frequently interfere with businesses, which has
led to corruption and inefficiencies; moreover, Harry (2007) added that because of
the power of oil, the GCC countries have come to be controlled by a small number of

131
people, and this has promoted nepotism as people can get what they want by having
links with the people who run the country.
More importantly, there is a need to reduce the number of Kuwaiti workers in
public organisations and encourage them to move to private sectors, and this can
only be achieved if there is education reform. According to Harry (2007), the
education system in the GCC is mainly used for developing national identity, rather
than developing the work force. Another point addressed by Blair is that there is a
reliance on cheap labour and low skills, and he has advised that companies hire
highly skilled people so that they can transfer their knowledge to Kuwait, which can
be seen as part of human development (Blair, 2009).
Kuwait relies greatly on oil; according to Blair, sooner or later the oil will
disappear and the country will not survive if it does not create diversity: “[the]
government expenditures could turn current fiscal surpluses into deficits within 5 to
8 years” (Blair, 2009, p. 7).
Another issue raised by Blair is that the government is investing heavily in
areas such as human capital by providing training, but there is a “mismatch between
the quality of the training provided and the requirements of the market” (Blair, 2009,
p. 203), which equates to a lack of vision.
Further, Blair (2009) noted that there is the lack of measurement in relation to
work; there are no performance measures in place to evaluate individual
performance, and there is a high incidence of nepotism and favouritism in hiring and
promoting, which reinforces a culture full of corruption and lacking in transparency
which leads to low morale and cynicism (Blair, 2009). This has also been
emphasised in other reports (Kinninmont, 2012; Switzerland Global Enterprise,
2012).
Blair’s study also highlighted a lack of vision, and the government practice of
“splashing” money without identifying true needs relates to “the education and
health systems [in Kuwait, which] have higher levels of expenditure than the EU
average but much lower outcomes” (Blair, 2009, p. 4). This has also been identified
by Harry (2007), who stated that GCC countries invest heavily in the education
132
system, but have failed to create the advanced technical, professional and managerial
skills needed by modern economies.
Aldowaisan (2012) identified several statistics that reflect the weak business
environment in Kuwait; ironically, these came three years after Blair’s (2009)
recommendations for Kuwait in terms of creating diversity in the market and
decreasing the dependence on oil. Kuwait scored 4.8 out of 10 on the corruption
perception index (CPI), 2.8 out of 7.0 for favouritism in decisions of government
officials, and 4.6 out of 7.0 for business cost of corruption.
Compared to other GCC countries (Saudi Arabia, United Arab Emirates,
Qatar, Oman, Bahrain), Kuwait scored embarrassing results: it cam fifth in terms of
general competitiveness (GCI), human development (HDI), electronic government
(EGOV), and corruption perception (CPI); and sixth in terms of knowledge economy
index (KEI), business environment (EODB), ease of trading (ETI), technology
employment (NRI), and travel and tourism sector (TTGI).
Surprisingly, Kuwait has moved backwards following the recommendations
from Tony Blair; however this is no surprise for those who have a thorough
understanding of Kuwaiti policies and predicted that Blair’s report would be kept on
shelves, as other studies have been in the past. In 2012 Mr Jassem Al-Saadoun
(Chairman of AlSHALL Economic Consultants) highlighted in Alam Alyawm
newspaper that despite the warnings from Tony Blair to the Kuwaiti government that
government expenditures could turn current fiscal surpluses into deficits within five
to eight years, the government had not implemented any of the suggestions, which
shows that it lacks planning ability and understanding of its needs (Al-Saadoun,
2012).
Mr. Blair's vision and his team will be added to the stock of good studies on the
government's shelves and which she cannot market because she is unaware of their
significance (ALSHALL, 2009, p. 2).
Moreover, recent statistics published by the World Bank (2013 (Table 10)
show that the business environment in Kuwait remains far from good, which has
resulted in low FDI and industrial migration from Kuwait. The statistics focus on
key aspects of business in any country; among these are ease of doing business,

133
starting business, dealing with construction permits, getting electricity and
registering property, which are essential for starting businesses and attracting FDI.
According to the figures, Kuwait does not have a healthy business
environment, especially compared to nearby countries in the GCC region. It is
particularly lacking in relation to creating diversity in the market. The figures in
Table 10 also indicate a lack of government strategy, which may reflect negatively
on the manufacturing sectors, and this is this research aims to address.

134
Table 10 Kuwait business environment compared with other GCC countries.
Source: (World Bank, 2013
Country
Ease of doing
business
Starting a business Dealing with construction permits
Rank Rank No. of procedures Time needed
(Days)
Rank No. of procedures Time needed
(Days)
Saudi Arabia 22 78 9 21 32 14
103
United Arab
Emirates 26 22 6 8 13 14 46
Qatar 40 109 8 9 18 16
62
Bahrain 42 88 7 9 7 12
43
Oman 47 73 5 8 59 13
174
Kuwait 82 142 12 32 119 24
130
Country
Getting electricity Registering property
Rank No. of procedures Time needed
(days)
Rank No. of procedures Time needed (days)
Saudi Arabia 12 4 61 12 5
8
United Arab
Emirates 7 4 40 12 2 10
Qatar 25 4 90 40 7
13
Bahrain 48 5 90 29 2
31
Oman 54 6 62 18 2
16
Kuwait 55 7 42 89 8
47

135
2.15.10 Quality initiatives in Kuwait
K-SMMIs have the potential to play an important role in Kuwait’s economy;
therefore, improvements in K-SMMIs could have an enormous impact in this regard,
which would eventually contribute towards minimising Kuwait’s dependence on oil.
According to Eltony (2007), Kuwait is expecting to rely on oil as its main product
for another two decades, which is very risky, as pointed out by researchers such as
Blair (2009), who said that failures to create new resources would result in deficits as
early as 2017. In the meantime, oil is the backbone of the Kuwaiti economy, as it
accounts for about 92 per cent of total Kuwaiti export (Switzerland Global
Enterprise, 2012).
The Kuwaiti government has tried and failed to encourage the non-oil
sectors, as most Kuwaiti policy has been built on reactions to situations, rather than
on proper study (Eltony, 2007). Harry (2007) declared that the governments in the
GCC region prefer to take an expediency approach, rather than providing solutions,
and this has become a serious problem for them. Developing SMMIs is key to
creating diversity, but if the K-SMMIs want to compete globally they must
implement QI, as this will increase K-SMMIs’ chances to gain competitive
advantage (Ghobadian and Gallear, 1997).
With regard to QI, Isaa (2007) claimed that many manufacturing companies
in Kuwait (mostly large enterprises) have implemented one or more QI, such as
TQM, Six Sigma, or business process reengineering (BPR). From the figures
published by ISO (2008a), it can be seen that there are only 254 ISO 9000-accredited
companies across the service and manufacturing sectors in Kuwait, whereas Egypt
has 1944 ISO 9000-accredited companies, Saudi Arabia has 876, the UAE has 3283,
Tunisia has 848, Oman and Morocco have 405, Pakistan has 2268, and India has
37,958 – this shows the slow pace at which companies are moving towards QI in
Kuwait.
The adoption of QI initiatives such as LS might be a solution for improving
productivity and quality within the manufacturing industries in Kuwait, as well as
the other GCC countries that have begun to emerge. According to Ghobadian and
Gallear (1997), QI can improve the competitive advantage of SMEs.

136
Given the modest role of K-SMMIs in the national economy, implementing
QI in these industries is vital (Zairi, 1996). Mady (2009) emphasised that, for
Kuwait, adaptation of manufacturing systems and the various related tools is
inevitable. However, applying LS might not be an easy task, especially for SMMIs,
since they can face more barriers than large organisations, as outlined above.
Few researchers have studied QI in Kuwait; however, although they have not
focused on SMMIs specifically, their studies do provide insight. According to Garza-
Reyes et al. (2011), Kuwaiti industries, as well as those in other GCC countries, are
still in the early stages of understanding ISO/TQM. Zairi (1996) reported that
implementation of QI in the Arabic region has occurred more slowly than in Western
and Asian countries. Al-khalifa and Aspinwall (2000) concurred that the maturity
level towards QI is very low in Arabic countries, and stated that this can be
particularly attributed to cultural factors and language barriers, especially when
translating those systems to Arabic (Tannock and Ahmed, 2008).
The barriers for TQM when implemented in the Kuwaiti oil sector have been
identified by Garza-Reyes et al. (2011) as relating to a lack of understanding of such
systems, as well as deficiencies in terms of quality strategies, strong management
commitment, and acceptance and willingness to change.
Another study conducted by Youssef and Zairi (1995) on five GCC
countries, including Kuwait, revealed that the main problems pertain to senior
managers, such as low level of education; lack of commitment, available leadership,
and clear missions and goals; resistance to change; lack of recognition and reward
programmes; and insufficient know-how in terms of identifying problems. Further,
Jaeger et al. (2013) explained that TQM does not play an important role in GCC
organisations, since they do not consider the key issues for TQM, such as leadership,
strategic planning, customer and market focus, and measurement and analysis, to be
important. The lack of strategic planning in GCC organisations has also been
addressed by Loosemore and Al Muslmani (1999) and Youssef and Zairi (1995).
According to Garza-Reyes et al. (2011), manufacturing industries in Kuwait
do not emphasise customer and supplier relations, benchmarking, CI, empowerment
and top management responsibility. These aspects are seen as key for successfully
implementing LS systems (Liker, 2004; Shah and Ward, 2007; Nordin et al., 2012a).

137
Garza-Reyes et al. (2011) further showed that Kuwaiti industries do not consider the
use of technology, tracking cost of quality, quality teams and employee enthusiasm
and commitment as critical factors for TQM.
Mady (2009) suggested that some adaptations are needed by Kuwaiti
industries in order for them to be successful in TQM implementation. These include:
more focus on customer and human resources, continued process improvement, and
the adoption of accurate quality measures. The study further indicated that K-SMMIs
have implemented some quality management practices such as customer focus
(understanding customers’ needs, taking customer feedback seriously, and customer
service), HR (practising teamwork, and shared vision with employees), and process
quality (focus on CI, the use of SPC, and process improvement), but large Kuwaiti
industries use quality and management practices to a much greater extent than
SMMIs do. Mady’s (2009) findings are consistent with those of other researchers,
such as Yong and Wilkinson (2001) and Zhao et al. (2004).
Al-Nofal et al. (2004) suggested a number of CSFs for TQM in Kuwait, such
as: top management commitment, CI, decision making at lower levels, employee
commitment, quality teams, and closer relationships with suppliers and customers.
Developing countries like Kuwait offer great opportunities for foreign
investment (Abbas, 1996); indeed, Kuwait has the potential to become a new source
of goods and services exported to Europe and other parts of the world due to the
availability of low-cost labour in the country, as well as its prime geographical
location (Youssef and Zairi, 1995). However, in the meantime the image of GCC
countries resembles as rich countries wasting their wealths (Harry, 2007).
In addition, Kuwaiti industries that wish to expand to be more competitive
only need to implement innovation and quality approaches, and have know-how in
terms of managing their resources. As suggested by Welsh and Raven (2006),
organisations in the GCC region are in a transition period as they are mainly led by
young managers who have obtained their qualifications from Western universities,
seem to use a participative style, and focus more on teamwork and involvement
(decentralised organisation). However participative management is rare within the
Gulf region.

138
According to Youssef and Zairi (1995), it is encouraging that there has been
increased attention in Middle Eastern countries towards the adoption of QI such as
ISO 9000 and TQM; this represents a radical change taking place in oil-producing
countries (Al-Khalifa and Aspinwall, 2000). However, Tannock and Ahmed (2008)
stated that Arab organisations have yet to feel the pressure to implement QI, and this
can be attributed to the lack of awareness of QI by senior staff, a lack of customer
awareness towards quality, and limited competition in the market.
2.15.11 Can ISO 9000 help K-SMMIs to implement LS?
A report published by ISO (2008a) showed that there are currently 254 ISO
9000 certified companies in Kuwait, including manufacturing and service industries.
According to Ho (1994), ISO 9000 can serve as a foundation for the CI journey, as it
helps to improve internal processes and monitor maintenance levels. According to
Vincent and Reza (2004), there is a commonality between ISO 9000 and quality
management techniques, and ISO 9000 can drive organisations towards
implementing quality management practices (Lee, 1999; Sun, 2000).
Magd (2006) stated that ISO 9000 forms the basis of successful QI, as it
improves the efficiency of quality systems used within firms, as well as the
organisations’ quality awareness and documentation procedures. Furthermore,
Kunnanatt (2007) suggested that firms have been shown to have a better quality
culture after implementing ISO 9000, while Gotzamani and Tsiotras (2001) pointed
out that ISO 9000 can be an effective first step towards TQM, as it enables
significant improvements regarding most of the TQM elements; indeed, their study
showed that ISO 9000 improved the quality culture and quality commitment in
Greek firms. Similarly, Mallur et al. (2011) and Ilkay and Aslan (2012) found that
ISO 9000-certified firms have better usage of TQM practices and perform better than
non-ISO firms, and that ISO 9000 firms are expected to have better quality and
management practices than non-ISO firms.
Chiarini (2011b) found that LS is related to ISO 9000 in terms of affecting
quality manuals, work instructions and procedures. Moreover, the main process of
ISO 9000 follows the lean PDCA methodology (ISO, 2008b). Chiarini (2011b)
added that many manufacturing companies have implemented LS after reaching ISO

139
9000 certification. McTeer and Dale (1996) found that ISO 9000 allowed SMEs to
better define employee roles, and that employees were better trained and more
committed to their jobs following ISO 9000 certification.
According to Kumar and Antony (2008, p. 1158), “ISO may be the
foundation or building block before embracing lean”. They also found that ISO 9000
firms perceived the importance of CSFs in the same way as lean organisations (i.e.
ISO 9000 firms acknowledged the importance of top management, training and
education, linking QI with employees, communication, customer and supplier
relations, and vision and planning). However, organisations can only benefit from
ISO 9000 if it is used for stimulating internal improvements (i.e. for increasing
productivity, efficiency, management control, definition of responsibilities and tasks,
and employee motivation) (Gotzamani and Tsiotras, 2001; Mcadam, 1999).
Moreover, ISO 9000 should be considered a long-term investment that requires
continuous effort and employee involvement (Mcadam, 1999).
2.16 Chapter summary
This chapter covered several aspects that are essential to LS, in order to
develop the LR framework and identify how to implement it in K-SMMIs. In order
to understand the essential requirements of LS the chapter studied the Toyota
system, lean principles, lean requirements, CSFs, and the eight wastes associated
with LS, as well as their sources, in order to facilitate an understanding of the key
aspects of LS. After understanding the above-mentioned issues, the chapter
considered the LS assessment frameworks and models developed by several
researchers, which will help in designing this research’s framework.
QI and LS within SMEs have been studied in this chapter in order to draw a
clear picture of lean implementation within SMEs. Following this, quality
management in the Kuwaiti context was studied so as to identify the potential
barriers that may delay the implementation of QI.
The literature revealed several factors and issues that can inhibit LS
implementation, and several essential aspects that need to be taken into account to
start LS. These factors are the bases of LS; in order to be ready for LS, organisations

140
need to consider these factors, as without them LS cannot be established or
sustained. Based on the previous research, the required factors for starting LS were
extracted, as follows:
Internal soft issues
HR: empowerment, communication, incentive and reward, suggestion,
training, skilled and multi-tasked workers.
Top management commitment and leadership: visible management,
providing support, investment in training and expertise, and leading by
example.
Internal technical issues
Process layout (equipment): grouped equipment and items, production
based on customer demand.
Planning and control: problem solving, standardising work, and VM
External issues
Customer involvement: involvement, feedback (such as dealing with
complaints), understanding customers by building strong relations, and
mutual trust
Supplier involvement: reducing number of suppliers, quality suppliers,
mutual trust and long-term relations.
With regard to the Kuwaiti context, the literature highlights some potential
obstacles and barriers that could contribute to impeding the K-SMMIs from adopting
LS. Some of those inhibitors include the business environment, which precludes new
entrants from entering the Kuwaiti market as well as preventing Kuwaiti people from
establishing their businesses, and has in turn resulted in low FDI.
Managerial and leadership issues also appeared to be aspects that might
prevent K-SMMIs from adopting LS. Despite the fact that Kuwait is one the most
open countries in the GCC region, previous research shows that the dominant
management style is a “one man show” that is not very supportive towards LS, as LS
requires a certain type of management that encourages involvement, empowerment
and respect by allowing everyone to express their opinions and ideas and by
providing a reward and training system to encourage people to work to the maximum
level. Furthermore, traits that have been found to be instilled in the Kuwaiti culture,

141
such as nepotism and favouritism for promoting and hiring people, have endorsed
corruption.
Moreover, the literature shows that financial aspects are not key in delaying
the development of SMMIs; more inhibitive are the lack of attention and strategies
from the government to make this sector active. Finally, it has been shown that
Kuwait relies heavily on foreign workers, which helps to delay development as a
high percentage of workers are unskilled and poorly educated; even skilled works
often perform jobs that are not related to their specialties, as the Kuwaiti government
does not allowing foreign workers to move freely from one job to another, unless
they have permission from their Kuwaiti guarantor.
Furthermore, the literature highlights several quality and management
practices adopted by Kuwaiti firms, mainly large ones, but these have not been
adopted efficiently, while quality and management practices within SMEs seem to be
very modest.
If close consideration is paid to the potential problems in Kuwait that may
contribute negatively towards development of K-SMMIs, it is clear that most come
from similar sources, which include lack of strategy and mainly arise as a result of
the national culture. Further, most of those factors contrast lean philosophy. Thus,
this research study aims to identify how these factors are related to K-SMMIs, and
how they delay K-SMMIs’ improvement.

142
Chapter Three Development of the LR framework
3.1 Introduction
Prior to the development of the LR framework, a great deal of literature was
reviewed to demonstrate what key practices are required for LS to be established;
Figure 1 shows the stages for developing the LR framework. Further, this chapter
explains the rationale behind the development of the LR framework. Each element of
the LR framework is explained and highlighted. It also includes an explanation of
each category and element, and why they are important for LS.
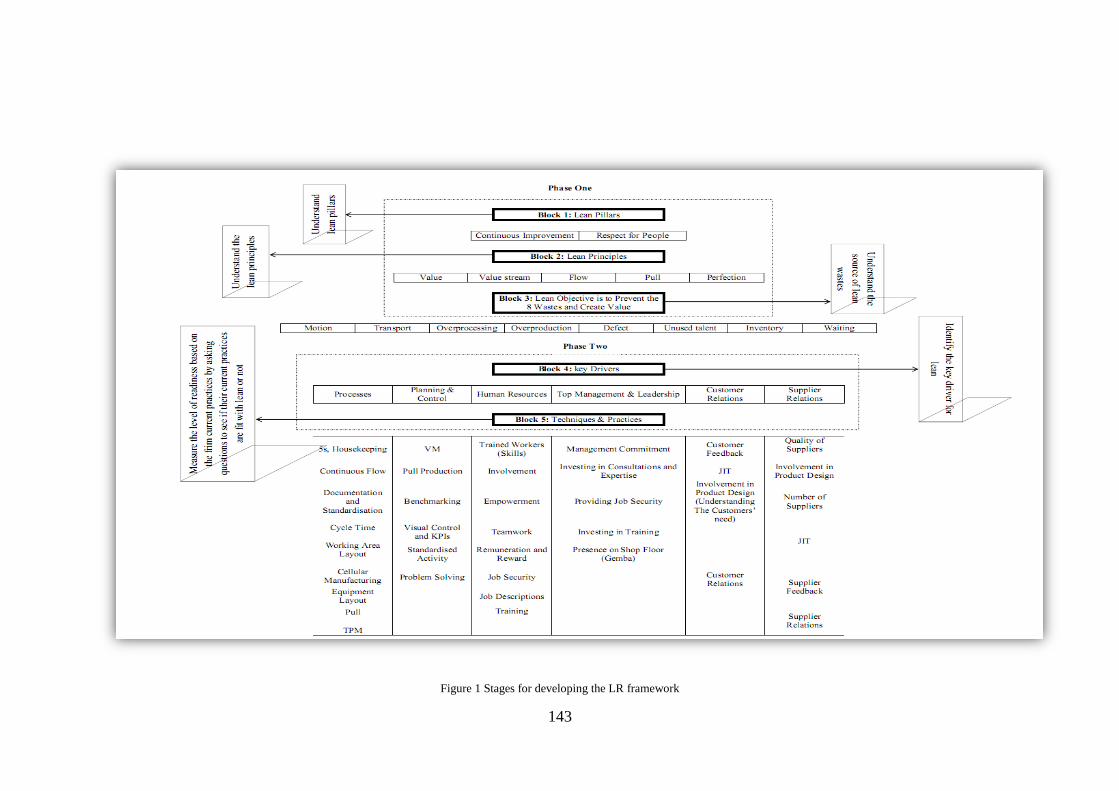
143
Figure 1 Stages for developing the LR framework
144
Table 11 summarises the essential factors for LS and other QI that have been
addressed by different researchers, and have used in this study to identify the
readiness of K-SMMIs towards LS. In the section that follows, a description will be
provided of how the readiness of K-SMMIs towards LS is measured based on the six
key areas (drivers).

145
Table 11 Important factors for LS
Factors Author(s)
1 2 3 4 5 6 7 8 9 10 11 12 13 14 15 16 17 18 19 20 21 22 23 24 25
Management commitment
and leadership
* * * * * * * * * * * * * * * * * * * * * * *
Suppliers * * * * * * *
Customers * * * * * * * * * *
Training and skilled people * * * * * * * * * * * * * * * *
Communication
(employee/department) and
teamwork
* * * * * *
Involvement, participation
and empowerment
* * * * * * * * *
Motivation, reward,
recognition and incentive
* * * *
Expertise * *
Financial * * * * *
Strategy and vision * * * * * * * *
Culture * * * * * * * * * *
Note: [1] Meredith et al. (1991); [2] Panizzolo (1998); [3] Achanga et al. (2006); [4] Golicic and Medland (2007), [5] Kumar et al. (2009), [6]
Mefford (2009); [7] Zu et al. (2010); [8] Bakås et al. (2011); [9] Angelis et al. (2011); [10] Bhasin (2012); [11] Laureani and Antony (2012);
[12] Zhang et al. (2012); [13] Chin and Pun (2002); [14] Vermaak (2010); [15] Mittal et al. ( 2011); [16] Zakua et al. (2012); [17] Antony et al.
(2002); [18] Sohail and Hoong (2003); [19] Salaheldin (2009); [20] Hodgetts et al. (1999); [21] Yusof and Aspinwall (1999); [22] Rahman
(2001); [23] Demirbag et al. (2006); [24] Ahire and Golhar (1996); [25] Radnor et al. (2006).
146
3.2 Importance of assessing the organisational readiness
Organisational readiness is a key factor in the success of lean [journey]. This includes
generating a vision of a fully integrated Lean organisation at the outset of
implementation; being realistic about the timescales involved in making changes and
embedding the process; engaging staff and helping them to understand how the Lean
approach may impact upon the organisation and; evaluating the degree to which a
process and customer view already exist within the organisation. (Radnor et al., 2006,
p. 4)
Holt et al. (2007, p. 290) stated that:
By assessing readiness for change, change agents, managers, human resource
management professionals, and organizational development consult ants can identify
gap s that may exist between their own expectations about the change effort and
those of other organizational members.
Furthermore:
The readiness for change [towards lean] can be addressed by identifying and
understanding the need for change, having clear and consistent leadership and
direction, and creating a strong change agent team. (Nordin et al., 2012b, p. 862)
Although many researchers have mentioned the importance of organisational
readiness before implementing LS (e.g. Nordin et al., 2012a; Radnor et al., 2006),
none have developed a framework or model to show how readiness can be assessed
before lean implementation. One of those who addressed the importance of readiness
is Radnor et al. (2006, pp. 65-66), who identified potential dimensions for
organisational readiness towards LS in a study on the Scottish public sector,
including: acceptance of need to change, capacity for improvement, team working,
supportive culture, understanding the customers, process-based view, and
improvement data.
3.3 Measurement framework
As mentioned in the literature review, many measurement frameworks have
appeared in the literature to date (Furlan et al., 2011; Shah and Ward, 2007; Shah
and Ward, 2003; Mady, 2009; Anad and Kodali, 2009; Nordin et al., 2010; Goodson,
147
2002; Panizollo, 1998). Furthermore, many articles relating to lean assessment
measurement tools and frameworks have been developed by leading organisations,
such as Industrial Solutions Inc., Lean Enterprise Inc., and StratergosInc. Other
assessments include Lean Self-Assessment Throughput Solutions, the Shingo
Assessment, and the Sai Global Assessment.
According to Jaitly et al. (2008), most of these measurement frameworks
follow the same logical pattern in terms of structuring the parameters and asking
questions; however, the frameworks are not free from criticism. Their weaknesses
include a lack of structure in terms of questions and parameters; a failure to relate to
the LS wastes in question; repetition of parameters/questions, which may lead to
misunderstandings; inappropriate weights given to parameters, which do not always
reflect their importance; too much emphasis on lean tools, and not enough on the
roles of the people involved; questions that are too complex; and tools that are too
bulky.
The lean concept is new to K-SMMIs, as mentioned above, and no studies
have been carried out to date that show the suitability of LS in the Kuwaiti context.
Thus, in order to fill this gap, this exploratory study aims to assess LR within K-
SMMIs.
3.4 Lean readiness measurement framework
The assessment tools used in this study are inspired by frameworks set forth
by Mady (2009), Shah and Ward (2007), Nordin et al. (2010) and Anad and Kodali
(2009). These frameworks follow similar principles to assess the quality and
management practices in firms; however, the frameworks can’t be used as they stand
as none of them include top management, which is an essential factor, and all of
them have been designed for firms who have already implemented LS/QI, which is
not the case in this study.
This study does not aim to assess the leanness of firms, but rather to evaluate
their quality and management practices and see whether K-SMMIs have the
capabilities to implement LS; therefore, following the exact principles of the above-
mentioned frameworks may lead to negative results and confuse the respondents.

148
There are also inconsistencies in terms of LS definitions in the extant literature,
which leads to misunderstandings regarding the real benefits of LS, and, in turn,
knowing whether a firm has what it takes to implement LS (Pettersen, 2009).
Thus, it has been decided to use simple questions which will form a basis
from which to implement lean tools such as 5s, VM, problem solving,
empowerment, etc.
The LR framework consists of six categories (key drivers) containing 47
elements (see Appendix-A and B for the questionnaire items) that were developed
based on discussions with a panel of experts including academics from Kuwait
University and Portsmouth University, as well as an extensive literature review
focusing on the technical and cultural requirements of LS, CSFs for LS, and
elements associated with the eight wastes (defects, overproduction, waiting,
overprocessing, transportation, inventory, motion, and unused employee creativity)
which LS works to eradicate, and finally by reviewing Toyota’s system in terms of
how it implemented its CI and promotes respect of people, and by understanding the
Toyota culture. This framework tries to overcome the weaknesses outlined by Jaitly
et al. (2008) by associating the questions with lean wastes, placing less stress on LS,
and concentrating more on the practices that complement the implementation of LS,
rather than the tools themselves.
Furthermore, this framework targets the whole chain of LS, from suppliers,
through internal processes/practices, and finally to customers. This should make it
possible to understand how K-SMMIs operate in terms of supplier and customer
relations, process flows, the use of scientific tools to deal with problems, CI, top
management commitment and leadership, and finally respecting people via
involvement, empowerment, reward systems and training. The technical and cultural
requirements for LS that have been found in the literature are outlined below
(Categories 1–6), with special emphasis paid to the aspects suggested by Bhasin and
Burcher (2006).

149
3.4.1 Category 1: Processes
Process management is one of the most important factors in terms of
identifying non-value-adding activities and increasing quality. Ineffective processes
lead to more waste and lower productivity per employee (Zhang et al., 2000;
Goodson, 2002; Gotzamani and Tsiotras, 2001; Lewis et al., 2006).
A total of 12 questions were included in this category to evaluate the firms’
practices with respect to whether they support lean practices in terms of process
flow, housekeeping, production rate, cycle time, TPM, flow of material, designated
area and labelled items. Table 12 shows the key areas covered in this category.

150
Table 12 Process – critical practices
Processes Definition Source
Housekeeping (5s) The workplace must be tidy and well organised.
Items and equipment should be labelled to ensure that they are located in the
right zone.
The organisation needs to have an auditing routine to ensure that every item is
returned to where it belongs so that it can be found easily if needed to avoid
“motion wastes”.
6, 12, 13, 14, 16, 18, 19,
22, 46
Cellular manufacturing The processes should be designed to help the flow, so equipment/items must be
placed where they are needed and processes using similar activities should be
conducted close to each other to help eliminate unnecessary movement.
6, 12, 14, 16, 18, 22, 46
Skilled workers running
and leading the process Each process should be operated by qualified people.
12, 14, 16, 18
Total Productive
Maintenance (TPM) Routine maintenance should be performed by skilled people.
Equipment records should be shown on the shop floor, to avoid confusion and to
keep employees up to date, which will mitigate the risk of equipment breakdown.
4, 13, 16, 18, 19
Documentation The organisation should have a well-documented system that includes machine
settings and any information needed to change these.
In order to improve, the organisation should revise the cycle time for each
process on a regular basis.
2, 16
Production based on pull Production should be based on external and internal customer demand. 18
Note: [2] Almström and Kinnander (2011); [4] Black (2007); [6] Furlan et al. (2011); [12] Liker (2004); [13] Miltenburg (2001); [14] Monden
(1998); [16] Saurin et al. (2011); [18] Shah and Ward (2007); [19] Spear and Bowen (1999); [22] Nordin et al. (2010); [46] Forza (1996).

151
3.4.2 Category 2: Planning and control
Many authors (e.g. Chin and Pun, 2002; Gotzamani and Tsiotras, 2001;
Lewis et al., 2006; Goodson, 2002) have highlighted the importance of this factor.
According to Chong and Rundus (2004), the use of quality control systems and
scientific methods to solve problems, as well as VM, help to ensure CI as it is key
for enhancing the firm’s performance and eventually leads to higher levels of
customer satisfaction.
This category consists of five questions, with the aim of shedding light on
quality and management practices in terms of VM, a scientific method for solving
problems, focus groups, benchmarks, etc. Table 13 shows the areas covered in this
category.

152
Table 13 Planning and control – critical practices
Planning and control Definition Source
Problem solving
Using problem-solving techniques is key to helping the organisation with respect
to CI. Problem solving needs skilled people and involvement and should be
conducted as a group, which in turn will help to reduce waste within the
organisation.
6, 18, 22, 44
Benchmarking
In order to improve, the organisation needs to be aware of its competitors.
Benchmarking performance against other top-class industries will allow the
organisation to understand any threats from competitors, which could drive
improvement.
29, 34, 35, 36, 37, 45
Standardised activity In order to avoid misunderstanding regarding work processes and procedures,
which could result in waste, the organisation should implement standards such as
specific routes for loading raw materials and removing end products, and
standard picking time.
12, 16, 35, 45
VM
Managing the workplace visually is highly recommended by LS as it can help to
keep the process smooth and reduce defect rates; this can take many forms, such
as showing the defect rate, key performance indicators, next job activity, etc.
18, 43, 47
Note: [6] Furlan et al. (2011); [12] Liker (2004); [16] Saurin et al. (2011); [18] Shah and Ward (2007); [22] Nordin et al. (2010); [29] Salaheldin
(2009); [34] Gurumurthy and Kodali (2009); [35] Knuf (2000); [36] Hines et al. (1999); [37] Spencer and Loomba (2001); [43] Radnor et al.
(2006); [44] Yoshimori (2005); [45] Smalley (2004); [47] Moser and Dos Santos (2003).

153
3.4.3 Category 3: Customer relations
As highlighted by many authors (Zu et al. 2010; Golicic and Medland, 2007;
Panizzolo, 1998; Meredith et al., 1991; Goodson, 2002), maintaining happy
customers is the aim of any company, since all departments are ultimately working
to satisfy their customers’ needs. To this end, the company must understand its
customers’ requirements (Zhang et al., 2000; Found and Harrison, 2012). Moreover,
the organisation needs to respond quickly to customer complaints. According to
Anvari et al. (2011), LS will not be applicable if the customer demands are unstable
or unpredictable, so they organisation must have close relationships with its
suppliers.
There are eight questions under this category, which aims to identify the level
of awareness about customers in terms of understanding them, identifying the level
of customer involvement and participation, and dealing with customer complaints.
Table 14 shows how the organisations’ customer relations were measured.

154
Table 14 Customer relations – critical practices
Customer relations Definition Source
Understanding the
customer
The organisation must understand its customers’ needs and requirements and
ensure production is in line with customers’ orders and demands, as LS is about
creating the value that customers are willing to pay for, with any excess
considered waste.
7, 18, 29, 30
Customer involvement The organisation needs to build a relationship with its customers in order to
understand them. This can be done by involving them in product design, which
will ensure that they will be willing to pay for the product.
7, 18, 22, 30
In order for the company to produce based on customer demand (pull and JIT)
strong relations and mutual trust must be built with customers.
7, 8, 30
Customers’ complaints need to be taken seriously to avoid future mistakes and to
retain the customer base.
Customer feedback To retain customers, the organisation should involve them and use their feedback
and suggestions.
7, 18, 29, 30
Note: [7] Golicic and Medland (2007); [18] Shah and Ward (2007); [22] Nordin et al. (2010); [29] Salaheldin (2009); [30] Panizzolo (1998).

155
3.4.4 Category 4: Supplier relations
Again, this factor has been mentioned in many articles (Zu et al., 2010;
Golicic and Medland, 2007; Panizzolo, 1998; Meredith et al., 1991). Quality
suppliers enable companies to produce quality products (Zhang et al., 2000); this is
important in LS, as the long-term relationships with suppliers will enable the
company to perform JIT, which is essential for LS (Dayton, 2001; Found and
Harrison, 2012).
In this category there are eight questions, which aim to identify the quality of
the companies’ suppliers, the number of suppliers they work with, the suppliers’
involvement, and the companies’ long-term relations with its suppliers. According to
Taj (2005), having fewer suppliers and long-term relationships with them, and
making suppliers’ part of the firm’s team, is healthy and essential for LS. Table 15
shows the items used in this research to identify how the K-SMMIs deal with
suppliers.

156
Table 15 Supplier relations – critical practices
Supplier relations Definition Source
Quality suppliers The quality of suppliers is very important for LS. Quality means providing goods
on time, without a need for further inspection. To this end, the organisation
should have a clear strategy to deal with suppliers.
18, 22, 29, 48, 49
Supplier location This aspect is very important, as many authors suggest dealing only with
suppliers in close proximity to enable them to perform JIT manufacturing
effectively.
3, 18, 50
Number of suppliers Many authors have emphasised dealing with small numbers or a single supplier
for each item, as this will help in building long-term relationships with suppliers,
and in turn will make suppliers more committed to supplying quality products
and providing JIT delivery.
18, 51, 52, 53
Supplier relationship Maintaining long-term relationships with suppliers is essential in LS, as it will
reflect positively in supplier performance and in terms of finances. Many authors
have stressed the importance of relationships with suppliers as it is a critical
factor for lean implementation, and is essential for JIT manufacturing.
7, 17, 18, 20, 23, 48, 49
Supplier involvement It is highly recommended to involve suppliers in area, such as product design and
development, inventory management, etc. This could help organisations to
improve the quality of their products.
18, 22, 49
Supplier feedback Shah and Ward (2007) emphasised providing suppliers with regular feedback on
delivery and the quality of products, as this will help to improve the relationship
and avoid mistakes in the future.
18
Note: [3] Bhasin (2011); [7] Golicic and Medland (2007); [17] Scherrer-Rathje et al. 2009); [18] Shah and Ward (2007); [20] Vanichchinchai
(2012); [22] Nordin et al. (2010); [23] Nordin et al. (2012a); [29] Salaheldin (2009); [48] Burman (1995); [49] Sharma et al. (2011); [50] Levy
(1997); [52] Cooper and Slagmulder (1999); [53] Lubben (1988).

157
3.4.5 Category 5: HR
Training, empowerment, involvement and recognition are important factors
in terms of LS success (Kumar et al., 2009; Zu et al., 2010; Mefford, 2009; Zhang et
al., 2012; Goodson, 2002), and are required in order to produce high-quality
products. Employees are the core of the company, and therefore need to be
encouraged and involved in company strategy and direction, especially when
implementing LS. Without skilled workers, LS will not last (Tsang and Antony,
2001).
This category contains 11 questions, and aims to evaluate the level of
employee involvement, training, empowerment and teamwork, as well as incentive
and reward systems, communications between employees and communications
between departments. This category represents the core of LS, as many authors and
researchers have stressed the role of HR. Table 16 shows the items and key areas
tested in this research.

158
Table 16 HR – critical practices
HR Definition Source
Involvement and
participation Involvement and participation have been emphasised in the literature, since LS
requires everyone in the organisation to be involved by providing suggestions
to improve the system; to do this, employees need to be aware of their roles in
the organisation, as well as having the right skills.
8, 18, 22, 23, 29, 35, 38,
46
Skills and multi-skilled
workers Workers need to be skilled to participate in improving the system and to
contribute to problem solving; further, LS requires multi-skilled people that are
able to perform different tasks.
1, 4, 12, 13, 14, 16, 20,
22, 23, 24, 41, 43, 46
Training In order to perform different tasks and contribute to problem solving, workers
need to be trained in problem solving and cross-trained in different sections of
the company.
3, 8, 11, 18, 21, 22, 24,
27, 28, 35
Motivation Motivation is essential to encourage people to participate and provide new
ideas; workers need to be highly motivated and rewarded for their efforts, and
this can done via empowerment and by having a clear rewards system and
incentives.
4, 12, 14, 16, 18, 21, 22,
23, 24, 25, 26, 27, 28, 29,
35, 40, 43, 46
Communication Effective communication between employees and departments is essential.
Without it, LS cannot be successful, since communication enables workers to
understand their job requirements and avoid conflict with other departments
(for example, there has to be communication between the sales and production
department, since the sales department needs to understand the capacity of the
production department). This could save the organisation time and money.
6, 17, 21, 23, 26, 28, 33
Teamwork Teamwork is needed in LS, as it will help employees to share knowledge and
ideas. According to Ichimura et al. (2007), teamwork helps to improve work by
providing suggestions to develop processes, and is essential for CI. It also
creates challenges between workers, which can serve to motivate them.
6, 17, 22, 23, 29, 33, 35,
43
Note: [1] Achanga et al. (2006); [3] Bhasin (2011); [4] Black (2007); [6] Furlan et al. (2011); [8] Ichimura et al. (2007); [11] Kundu and
Manohar (2012); [12] Liker (2004); [13] Miltenburg (2001); [14] Monden (1998); [16] Saurin et al. (2011); [17] Scherrer-Rathje et al. 2009);

159
[18] Shah and Ward (2007); [20] Vanichchinchai (2012); [21] Ghobadian and Gallear (1997); [22] Nordin et al. (2010); [23] Nordin et al.
(2012a); [24] Dahlgaard and Dahlgaard-Park (2006); [25] Balle (2005); [26] Papadopoulou and Ozbayrak (2005); [27] Puvanasvaran et al.
(2009); [28] Sim and Rogers (2008); [29] Salaheldin (2009); [33] Worley and Doolen (2006); [35] Knuf (2000); [38] New (2007); [41]
Yamamoto and Bellgran (2010); [43] Radnor et al. (2006); [46] Forza (1996).

160
3.4.6 Category 6: Top management and leadership:
The level of top management commitment and leadership is crucial for LS.
This commitment is manifest in many forms, such as providing clear vision,
allocating resources and funding, and providing strategic leadership (Tsang and
Antony, 2001). To ensure the success of LS implementation, it is essential for top
management to create a quality culture by empowering other employees (Zhang et
al., 2000). This factor has been emphasised in various articles (e.g. Chin and Pun,
2002; Angelis et al., 2011; Bakås et al., 2011; Zu et al., 2010; Mefford, 2009; Kumar
et al., 2009; Achanga et al., 2006; Panizzolo, 1998; Meredith et al., 1991; Snee,
2010).
This category contains five questions that aim to identify the level of top
management commitment in terms of appearance in the working area, locating the
right people in the right place, providing job security, investing in consultancy and
expert advice, and investing in training. Without top management and leadership
commitment, LS implementation will not succeed. Table 17 summarises the items
highlighted in this category.
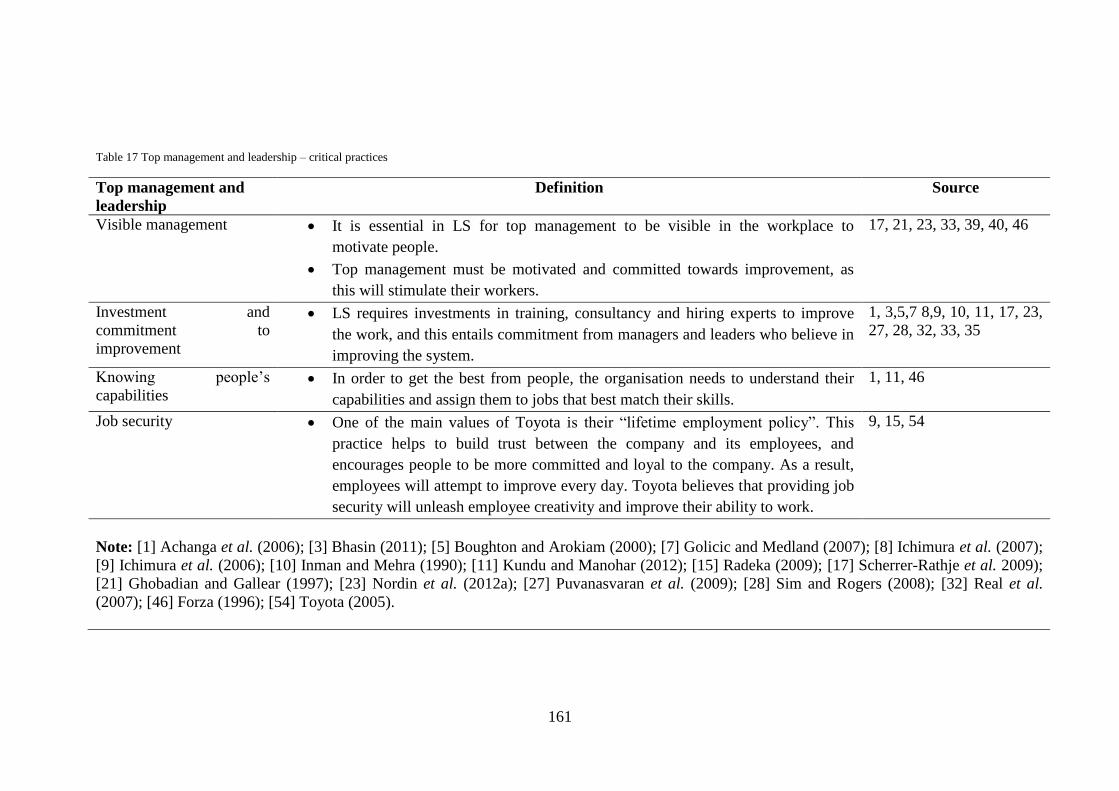
161
Table 17 Top management and leadership – critical practices
Top management and
leadership
Definition Source
Visible management It is essential in LS for top management to be visible in the workplace to
motivate people.
Top management must be motivated and committed towards improvement, as
this will stimulate their workers.
17, 21, 23, 33, 39, 40, 46
Investment and
commitment to
improvement
LS requires investments in training, consultancy and hiring experts to improve
the work, and this entails commitment from managers and leaders who believe in
improving the system.
1, 3,5,7 8,9, 10, 11, 17, 23,
27, 28, 32, 33, 35
Knowing people’s
capabilities In order to get the best from people, the organisation needs to understand their
capabilities and assign them to jobs that best match their skills.
1, 11, 46
Job security One of the main values of Toyota is their “lifetime employment policy”. This
practice helps to build trust between the company and its employees, and
encourages people to be more committed and loyal to the company. As a result,
employees will attempt to improve every day. Toyota believes that providing job
security will unleash employee creativity and improve their ability to work.
9, 15, 54
Note: [1] Achanga et al. (2006); [3] Bhasin (2011); [5] Boughton and Arokiam (2000); [7] Golicic and Medland (2007); [8] Ichimura et al. (2007);
[9] Ichimura et al. (2006); [10] Inman and Mehra (1990); [11] Kundu and Manohar (2012); [15] Radeka (2009); [17] Scherrer-Rathje et al. 2009);
[21] Ghobadian and Gallear (1997); [23] Nordin et al. (2012a); [27] Puvanasvaran et al. (2009); [28] Sim and Rogers (2008); [32] Real et al.
(2007); [46] Forza (1996); [54] Toyota (2005).

162
Most of the practices outlined above rely on human efforts and participation;
thus, it is essential to keep workers motivated, and this motivation can be achieved
through empowerment, rewards and incentives, and involvement. Though not all of
the practices above are prerequisites of LS, they can be said to represent essential
aspects of LS. This means that it is necessary to consider them in order to understand
K-SMMIs’ LR.
3.5 Development of the research hypothesises
As this study is the first of its kind, it aims to describe K-SMMIs in terms of
the quality and management practices deployed by different industries, and to
explore which of them has the best foundation for LS. To this end, five hypotheses
have been developed by which to evaluate readiness for LS in firms who have not
yet started LS, and to learn how to distinguish between these firms; i.e. to know if
ISO 9000-accredited firms have better readiness towards LS, and learn whether the
firm structure (family vs. non family), size and sector affect readiness towards LS.
3.5.1 Hypothesis 1
The literature shows that 254 Kuwaiti organisations practise ISO 9000 (ISO,
2008a). Further, ISO 9000 can help the companies to start other QI such as LS
(Ho,1994 ; Lee, 1999; Sun, 2000; Magd, 2006; Gotzamani and Tsiotras, 2001;
Chiarini, 2011b).
From the ISO 9000 literature in the previous chapter, it is expected that ISO
9000-certified firms in Kuwait will have better quality and management practices in
place, and therefore a higher level of lean readiness. Thus, hypothesis one (H1) is as
follows:
H1: There is a significant difference in the quality and management practices
used by ISO 9000 firms compared to non-ISO 9000 firms in Kuwait.
3.5.2 Hypothesis 2
This hypothesis has been developed to see whether differences in size will
have an impact on LS readiness within Kuwait industries. The literature contains
163
many arguments that insist on the applicability of LS to SMEs; for instance, as some
authors (e.g. Ghobadian and Gallear, 1997; Oviatt and McDougall, 1994; Karlsson
and Åhlström, 1997; Ahire et al., 1996; Haksever, 1996) have suggested, the smaller
size of these organisations means that they can better manage their resources. On the
other hand, some researchers have suggested that LS works better in large
organisations due to availability of the resources required by LS.
In this sense, applying the above premises to the Kuwaiti context, hypothesis
two (H2) is as follows:
H2: Small firms and medium-sized firms in Kuwait differ significantly in
terms of their quality and management practices.
3.5.3 Hypothesis 3
Sector has not been emphasised as a factor that affects LS, as many authors
have suggested that LS can apply to many different types of industries (Womack et
al., 1990; Soriano-Meier and Forrester, 2002). In previous studies (e.g. Prajogo,
2005; Pino, 2008; Woon, 2000; Talib et al., 2011; Huq and Stolen, 1998),
researchers have attempted to distinguish between QI practices across different
sectors, but the main focus has been on the manufacturing and services industries
rather than different manufacturing sectors; i.e. there are no studies that differentiate
between the applicability of LS or QI to different types of manufacturing industries,
such as paper, plastic, metal, etc.
Many researchers (e.g. Reed et al., 1996; Corbett and Rastrick, 2000;
Curkovic et al. 2000) have shown that different quality and management practices
are used in different industries, depending on the activities of firms due to the
uniqueness of their business, as different industries may have different needs. Mady
(2009) showed that there is a difference in TQM usage between the food and
refractor sectors. Thus, the third hypothesis has been developed as follows:
H3: Firms in different sectors in Kuwait differ significantly in terms of their
quality and management practices.

164
3.5.4 Hypothesis 4
The literature shows that there is a difference between family- and non-
family-owned businesses. Several authors (e.g. Ward, 1988; Cooper et al., 2005;
Ellington et al., 1996; Hofer and Charan, 1984; Levinson, 1987) have found that
non-family-owned businesses are more successful in implementing QI as they have
certain characteristics that family businesses do not have, or are not willing to
compromise on.
Other researchers (e.g. Welsh and Raven, 2006; Chua et al., 1999; Davis,
1983) believe that family businesses are better able to manage their resources,
especially in terms of customer relations and organisation stability. Therefore, the
fourth hypothesis is as follows:
H4: There is a significant difference in the quality and management practices
used by non-family-owned firms compared to family-owned firms in Kuwait.
Once again, it is worth mentioning that this study is the first to deal with LS
in the Kuwaiti context, so it is necessary to build a foundation from which to obtain a
better understanding of Kuwaiti firms. Thus, the above hypotheses have been
developed to identify which K-SMMIs have better readiness towards LS, and by
distinguishing the firms according to four categories – i.e. ISO 9000-accredited firm,
size of the firm, firm activity (sectors) and ownership of firms – it will then be
possible to identify whether these factors have an effect on readiness towards LS.
3.5.5 Hypothesis 5
After reviewing the literature, especially with regards to the Kuwaiti context,
many aspects have been identified that do not support LS. For example, the
management and leadership style in Kuwait is based on a “one man show” approach;
there is little respect for empowerment and delegation, and a lack of strategies and
awareness of QI and of governmental support; the role of K-SMMIs within the
economy is modest; there is a lack of skilled people to run the business, both at
managerial and shop-floor level; etc. These inhibitors affect LS. Thus, the final
hypothesis has been developed as follows:

165
H5: K-SMMIs are not using quality and management practices to a very
significant extent.
3.6 Chapter summary
This chapter explained how the LR measurement framework was developed and
showed how each element in the questionnaire was developed. Further, the
hypotheses have been explained.

166
Chapter Four Methodology
4.1 Introduction
This chapter describes the methodology employed to help answer the
research questions, by testing the hypotheses to meet the objectives of the study.
Moreover, it outlines the research philosophy, research approach, choice of
methodology, research strategy and finally the techniques and procedures used to
conduct the data collection and analysis. Additionally, this chapter justifies the
chosen research method by highlighting the key features, weaknesses and strengths
of different approaches and methods.
The chapter explains the process followed to collect the required data, and
outlines the reasons behind the choice of certain methods, techniques and
approaches. Furthermore, it shows how the difficulty of obtaining respondents was
overcome and how any potential bias was mitigated. Several tactics have been
followed in this study to enhance the validity and reliability of the outcome, such as
triangulation, pilot testing and consulting with an expert panel.
Researchers and authors have used many definitions in the literature to define
and describe research methodology and the research process. Hussey and Hussey
(1997) defined research methodology as the entire process covered in a particular
study. Clough and Nutbrown (2007) defined research as a process of investigating
and studying an issue or phenomenon. Leedy and Ormrod (2001) defined research as
an organised process of collecting, analysing and interpreting data to understand an
issue or phenomenon. Saunders et al. (2009) defined research as a process of
collecting data in a systematic fashion and then interpreting it in a way that helps the
researcher to answer the research question and meet the objectives of the research.
So the characteristics of research are:
1. Collecting data systematically;
2. Interpreting data systematically; and
3. Having a clear purpose for collecting and interpreting the data.

167
The prime objective of a research project is to answer particular research
questions (Yates, 2004). According to Saunders et al. (2009), the research process
can be symbolised as an onion, the layers of which need to be peeled off to reach the
core, which is data collection and data analysis. So the process consists of six layers,
as can be seen in Figure 2, namely research philosophy, research approach,
methodological choice, research strategy, time horizons and finally techniques and
procedures.
Figure 2 Research Process. Source: Saunders et al. (2009, p. 108).
Most researchers plan their studies to enable them to answer the research
questions and meet the objectives of their research. Then they choose the most
appropriate method to collect the data, which is the core of the onion (Saunders et
al., 2009). Crotty (1998) emphasised that the researcher needs to explain the reason
behind choosing the data collection method adopted, and that the explanation should
be based on the outer layers of the onion, as Saunders et al. (2009) asserted.
This research adopted the above research process framework. The six layers
are explained thoroughly in the following sections to allow the right decision to be
made about the most appropriate method to help answer the research questions,
establish the hypotheses and meet the aims of the study. Thus, this chapter discusses

168
and explains the above-mentioned methodologies and provides a justification for
choosing them.
The prime aim of this research was to identify the factors that are affecting
the readiness to adopt LS by describing the current practices within K-SMMIs to see
how far they are from a LS and exploring the reasons behind it. In order to achieve
the objectives of the study, it was decided to conduct it based on mixed methods
(qualitative and quantitative).
A quantitative method (survey questionnaire) was used to assess the current
practices in K-SMMIs and to see how far they are from LS. This gives an insight
into how Kuwaiti firms are run before digging deeper using a qualitative method.
Qualitative methods enabled evaluation of the readiness within K-SMMIs for LS by
identifying the factors that are affecting and delaying the implementation of LS and
other QI in Kuwaiti industries.
The qualitative strategy used in this research was based on case studies and
was achieved by conducting semi-structured interviews with managers in K-SMMIs,
academics from Kuwait University and experts from a consultancy companies to
establish their views on K-SMMIs. Figure 3 illustrates the research methodology
adopted in this research.

169
Figure 3 Research Methodology scenario

170
Before explaining the research methods and techniques adopted and used in
this study, one thing needs to be clarified: most researchers and authors who have
written about research methodology have used different definitions and terms to
explain the research process, method and techniques. Thus, in order to be consistent
in definition, the researcher has decided to stick with the terms used in Saunders et
al. (2009), as many researchers and authors use these terms interchangeably.
The term “technique” in this research refers to a method used to collect and
analyse data, such as an interview, observation or questionnaire; and the term
“method” refers to qualitative, quantitative and mixed methods; while the term
“methodology” as used in this research means the way in which the research should
be conducted.
4.2 Purpose of the research
According to Robson (2002), the purpose of research could be exploratory,
explanatory or descriptive. While research could have more than one purpose, that
all depends on the research questions and what the research is trying to identify.
1. Exploratory: “what is happening; to seek new insights; to ask questions and
to assess phenomena in a new light” (Robson, 2002, p. 59). According to
Saunders et al. (2009), an exploratory purpose will help the researcher to
understand the problem, especially when the researcher is not sure about the
causes of the problem due to the lack of existing research and knowledge of
the subject matter.
Saunders et al. (2009) have pointed out that researchers who opt to use
exploratory research have to follow three principles: they need to review the
available literatures; conduct interviews with experts in the subject; and hold focus
group interviews. The good aspect of exploratory research is that it allows
researchers to be more flexible.
Researchers using exploratory research normally start with a broad view of
the problem, then narrow it down as the research progresses. According to Adams
and Schvaneveldt (1991), that does not mean that the research does not have a clear
direction; rather, it indicates the flexibility of exploratory research, as the researcher

171
begins with minimal knowledge due to the lack of existing knowledge of the subject
matter.
2. Descriptive study: the main objective of a descriptive study is “to portray an
accurate profile of persons, events or situations” (Robson, 2002, p. 59). The
aim of a descriptive research study is to study the current situation to see
what exists in the current state (Williams, 2007). Moreover, this kind of study
can be done by conducting a survey.
3. Explanatory study: this type of study is where the researcher is trying to
identify a relationship between variables in order to go beyond describing the
phenomenon by analysis to see how and why it happens. In explanatory
research, researchers have the authority to control the variables to see exactly
how they affect a certain problem (Hussey and Hussey, 1997).
The latter type (explanatory) will not help in this research study, as the K-
SMMIs have not experienced LS, so it is not possible to identify the variables that
are affecting its implementation; rather, it is possible to envisage what factors could
be potential barriers, obstacles or enablers for LS. Although in this study a
hypothesis was developed, that was only to see whether firms with different
characteristics (such as ISO 9000-certified firms, size, sector, management style etc.)
have a better chance of implementing LS or not.
Based on the above explanations of the purpose of research and due to the
nature of the research questions and the fact that there is no information with regard
to LS in the Kuwaiti context and very little information about quality management in
Kuwait, the purpose of this study is exploratory and descriptive in nature, as it aims
to explore the current situation of K-SMMIs and how far that is from LS.
Furthermore, it aims to explore the reasons that are hindering or delaying LS or
might have the potential to prevent K-SMMIs from adopting LS. Table 18 shows the
purpose of the research.
Table 18 Research methodology characteristics.
Source: Runeson and Höst (2009).
Methodology Purpose Primary data Design
Survey Descriptive Quantitative Fixed
Case study Exploratory Qualitative Flexible

172
In addition, the prime aim of this study is to look for hypotheses and ideas,
rather than testing hypotheses to help provide guidance for future research.
Moreover, the researcher’s focus in being exploratory and descriptive is to be
familiar with and gain an insight into K-SMMIs’ situation to enable a more rigorous
investigation at a later stage, as this may give guidance for future research (Hussey
and Hussey, 1997).
4.3 Research questions
Table 19 shows the research questions of this study and demonstrates the
way in which the paper aims to answer each question in terms of target respondents,
method, strategy and techniques employed.
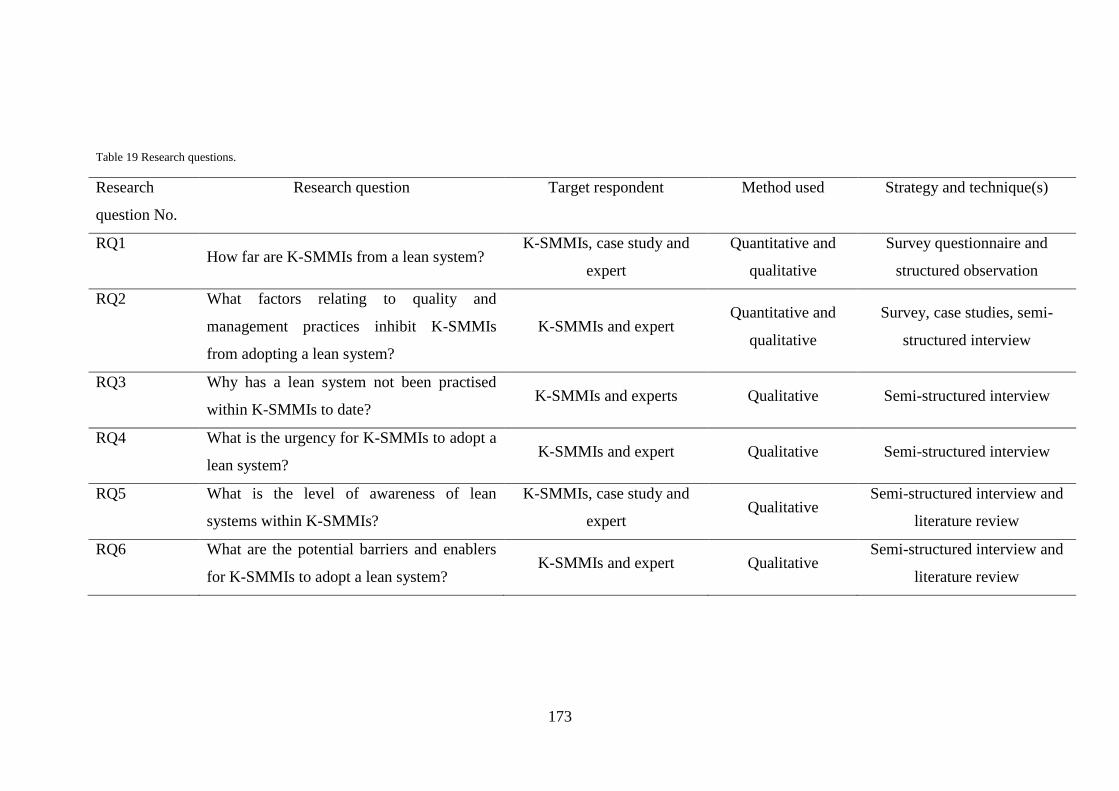
173
Table 19 Research questions.
Research
question No.
Research question Target respondent Method used Strategy and technique(s)
RQ1 How far are K-SMMIs from a lean system?
K-SMMIs, case study and
expert
Quantitative and
qualitative
Survey questionnaire and
structured observation
RQ2 What factors relating to quality and
management practices inhibit K-SMMIs
from adopting a lean system?
K-SMMIs and expert Quantitative and
qualitative
Survey, case studies, semi-
structured interview
RQ3 Why has a lean system not been practised
within K-SMMIs to date? K-SMMIs and experts Qualitative Semi-structured interview
RQ4 What is the urgency for K-SMMIs to adopt a
lean system? K-SMMIs and expert Qualitative Semi-structured interview
RQ5 What is the level of awareness of lean
systems within K-SMMIs?
K-SMMIs, case study and
expert Qualitative
Semi-structured interview and
literature review
RQ6 What are the potential barriers and enablers
for K-SMMIs to adopt a lean system? K-SMMIs and expert Qualitative
Semi-structured interview and
literature review
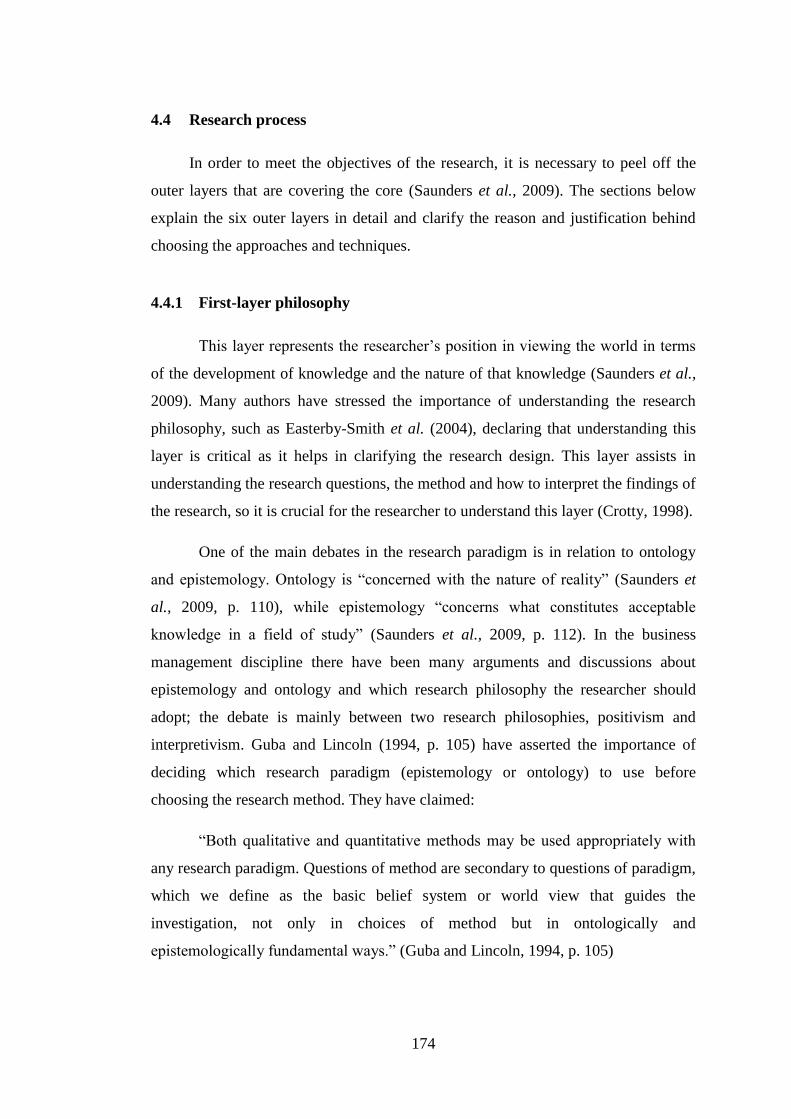
174
4.4 Research process
In order to meet the objectives of the research, it is necessary to peel off the
outer layers that are covering the core (Saunders et al., 2009). The sections below
explain the six outer layers in detail and clarify the reason and justification behind
choosing the approaches and techniques.
4.4.1 First-layer philosophy
This layer represents the researcher’s position in viewing the world in terms
of the development of knowledge and the nature of that knowledge (Saunders et al.,
2009). Many authors have stressed the importance of understanding the research
philosophy, such as Easterby-Smith et al. (2004), declaring that understanding this
layer is critical as it helps in clarifying the research design. This layer assists in
understanding the research questions, the method and how to interpret the findings of
the research, so it is crucial for the researcher to understand this layer (Crotty, 1998).
One of the main debates in the research paradigm is in relation to ontology
and epistemology. Ontology is “concerned with the nature of reality” (Saunders et
al., 2009, p. 110), while epistemology “concerns what constitutes acceptable
knowledge in a field of study” (Saunders et al., 2009, p. 112). In the business
management discipline there have been many arguments and discussions about
epistemology and ontology and which research philosophy the researcher should
adopt; the debate is mainly between two research philosophies, positivism and
interpretivism. Guba and Lincoln (1994, p. 105) have asserted the importance of
deciding which research paradigm (epistemology or ontology) to use before
choosing the research method. They have claimed:
“Both qualitative and quantitative methods may be used appropriately with
any research paradigm. Questions of method are secondary to questions of paradigm,
which we define as the basic belief system or world view that guides the
investigation, not only in choices of method but in ontologically and
epistemologically fundamental ways.” (Guba and Lincoln, 1994, p. 105)
175
Saunders et al. (2009, p. 119) have explained four philosophies related to
management research, as can be seen in Table 20: positivism, interpretivism, realism
and pragmatism.
1. Positivism
According to Cooper and Schindler (2006), this philosophy is associated with
the idea of objectivism; researchers adopting this approach are mainly evaluating the
world with the help of objectivity. This philosophy is mainly used with a quantitative
approach. Furthermore, this philosophy requires the researcher to conduct research
based on a large sample and the data collection method is based on highly structured,
large samples, measurement and a quantitative approach, although a qualitative
approach can also be employed; the researcher’s own beliefs do not affect or
influence the research study (Saunders et al., 2009).
The aim of the positivist philosophy is to prove or disprove a hypothesis and
it emphasises scientific method, statistical analysis and generalisation of the
findings. Moreover, researchers in this position are trying to explain phenomena
rather than understanding them (Mack, 2010).
2. Interpretivism/constructivism
In this philosophical position, the researcher understands the differences
between humans, not objects (Saunders et al., 2009). Mack (2010, p. 8) advocated
this view and said: “Interpretivism’s main tenet is that research can never be
objectively observed from the outside, rather it must be observed from inside
through the direct experience of the people.”
According to Saunders et al. (2009), many researchers see this philosophy as
appropriate to business management research. Researchers who adopt this position
are trying to understand phenomena rather than explain them (Mack, 2010).
3. Realism
The main concern of this philosophy lies in the reality that already exists,
where the reality is independent from the mind. There are two type of realism: direct
realism, where the researcher believes that what he/she sees is true; and critical

176
realism, where the experience of the researcher is viewed as sensations (Sekaran and
Bougie, 2010).
4. Pragmatism
Saunders et al. (2009, p. 109) said: “Pragmatism argues that the most
important determinant of the research philosophy adopted is the research question.
One approach may be ‘better’ than the other for answering particular questions.”
This is consistent with the author’s view, as it will give the author more freedom in
choosing the most appropriate methodology. Moreover, the pragmatic position will
help the researcher to stay between two different paradigms; Tashakkori and Teddlie
(1998) suggested that it is better for the researcher to avoid being in different
philosophical positions.
Saunders et al. (2009) claimed: “if the research question does not suggest
unambiguously that either a positivist or interpretivist philosophy is adopted this
confirms the pragmatist’s view that it is perfectly possible to work with both
philosophies”. Furthermore, Tashakkori and Teddlie (1998) said that a pragmatic
position is employed largely because it avoids the researcher being involved in
pointless debates about epistemology and ontology (in the concept of truth and
reality), as they think that focusing on how to answer the research questions and the
aim of the research is more important, which is what the pragmatist position allows
the researcher to achieve. They claimed that it is important to “study what interests
you and is of value to you, study in the different ways in which you deem
appropriate, and use the results in ways that can bring about positive consequences
within your value system” (Tashakkori andTeddlie, 1998, p. 30).
5. Selected philosophy
Due to the nature of this research, which is mainly about exploring,
describing and trying to identify the factors that are affecting K-SMMIs’ readiness
for LS by shedding light on current practices within K-SMMIs and how far they are
from LS, data needs to be gathered from different resources to enrich understanding
of the situation, since this is the first study in this field within the Kuwaiti context.
The researcher had to adopt different methodologies; in that sense, the research
philosophy is pragmatic. This pragmatism allows a concentration on the main target

177
of the study, which is answering the research questions. Table 20 shows the
differences between the four philosophical positions in terms of ontology,
epistemology and data collection.

178
Table 20 Comparison of research philosophies in management research.
Source: Saunders et al. (2009, p. 119).
Positivism Interpretivism Realism Pragmatism
Ontology External, objective and
independent of social actors
Socially constructed,
subjective, may change,
multiple
Objective. Exists
independently of
human thoughts and
beliefs or knowledge
of their existence
(realist), but is
interpreted through
social conditioning
(critical realist)
External, multiple, view
chosen to best enable
answering of the research
questions
Epistemology Observable phenomena can
provide credible data, facts. Focus
on causality and law-like
generalisations, reducing
phenomena to simplest elements
Subjective meanings and
social phenomena. Focus
on the details of the
situation, the reality
behind these details,
subjective meanings
motivating actions
Observable,
phenomena provide
credible data, facts.
Insufficient data means
inaccuracies in
sensations (direct
realism). Alternatively,
phenomena create
Either or both observable
phenomena and subjective
meaning can provide
acceptable knowledge
dependent on the research
question. Focus on applied
research, integrating
different perspectives to

179
sensations which are
open to
misinterpretation
(critical realism).
Focus on explaining
within a context or
contexts
help interpret the data
Data
collection
technique
Highly structured, large samples,
measurement, quantitative, but can
use qualitative
Qualitative small
samples, in-depth
investigation
Quantitative or
qualitative method can
be chosen, the chosen
method must fit the
subject matter
Quantitative or qualitative
mixed or multiple design

180
4.4.2 Second-layer research approach
Deductive and inductive are the main approaches that researchers can use to
conduct research. The deductive approach is associated mainly with quantitative
methods, while the inductive approach is mainly associated with qualitative
methods. According to Cavana et al. (2001), in the deductive approach the
researcher starts by developing a theory, then formulates hypotheses, then collects
and analyses the data and finally accepts or rejects the hypotheses, which will lead
the researcher to possess empirical evidence of certain phenomena. In the inductive
approach, the researcher starts with observing phenomena, then analyses a pattern
and themes, then formulates a relationship and finally develops a theory (Cavana et
al., 2001).
The differences between deductive and inductive approaches have been
explained in Saunders et al.’s book (2009, p. 127); it has been found that the
deductive approach is based on scientific principles, a need to explain the
relationship between variables, and is a highly structured approach. The researcher
needs to be independent, and in order to generalise the findings of the research the
researcher has to select an adequate sample size.
In the inductive approach, the researcher will be able to have a deep
understanding of the research by collecting data qualitatively, interacting with
people, and use a more flexible structure where the researcher can change the
research emphasis as the process progresses. The researcher is part of the research
and finally is less concerned with generalising from the outcomes of the research.
In order to achieve the research objectives, in this study both inductive and
deductive approaches have been considered when conducting the research.
According to Hussey and Hussey (1997), researchers have the freedom to move from
one approach to another. Saunders et al. (2009) have the same view, and assert that
mixing both approaches in one piece of research would be beneficial to the study.
The deductive approach was used in the first phase of the research. By reviewing the
research literature several factors and facts were identified that might affect the
implementation of LS within K-SMMIs; based on those factors a measurement

181
framework has been developed to measure the current practices and whether they
match lean principles or not.
The inductive approach was used in the second phase of the research, as the
researcher was interested in knowing the causes and effects of practices within K-
SMMIs and how these could affect the introduction of LS to the industries visited.
4.4.3 Third-layer research strategy
There is a different form of research strategy in which the researcher can
choose the best strategy or strategies to help them answer the research questions and
meet the aim of the research (Saunders et al., 2009). Research strategies include
survey, case study, experiment, action research, grounded theory and archival
research.
Saunders et al. (2009) pointed out a number of factors that affect the choice
of research strategies. What is most important is to choose the appropriate strategies
that enable the researcher to answer the research questions and meet the research
objectives. The strategy or strategies need to be consistent with the researcher’s
philosophy, research approach and the purpose of the research. Moreover, the choice
of research strategies could be influenced by other factors, such as the amount of
knowledge available to the researcher, availability of time and required data, and the
accessibility of the potential participants. Yin (2003) declared that there are many
forms of research strategy, as shown in Table 21. However, the differentiation
between strategies is subject to three factors: (1) the type of research questions; (2)
the degree of control over events; and (3) the research focus if it is on historical or
contemporary events.

182
Table 21 Relevant situations for different research strategies.
Source: Yin (2003, p. 5).
Strategy Form of research
questions
Does it require
control of
behaviour events?
Does the research
focus on
contemporary
events?
Experiment How, why? Yes Yes
Survey Who, what, where,
how many, how
much?
No Yes
Archival analysis Who, what, where,
how many, how
much?
No Yes/No
History How, why? No No
Case study How, why? No Yes
This study has its focus on contemporary events and due to the exploratory
and descriptive nature of this study, the researcher opted to go for survey and case
study strategies, as the researcher is aiming to enrich his knowledge of the situation
of K-SMMIs in terms of knowing their current practices and revealing the reasons
behind it, which may affect positively or negatively the current practices in relation
to LS.
1. Survey
A survey is one of the most popular strategies used in the business and
management field (Saunders et al., 2009). According to Yin (2003), a survey can
help in answering questions such as who, what, where, how many and how much.
This strategy is linked with the deductive approach and quantitative method. The
main method of data collection for the survey strategy is the questionnaire, although
there are more techniques such as structured observation and structured interview
(Saunders et al., 2009).
The major benefit of a survey is that it helps the researcher to generalise the
findings at minimum possible cost; another advantage of the survey is that the
researcher will be independent once he/she finishes collecting the data, unlike other

183
strategies that depend on other factors and information, and once the data is ready
the researcher will be free to analyse the data that will help in answering the research
questions and meet the main objective of the research (Saunders et al., 2009).
Despite the privileges that the researcher can enjoy when adopting a survey strategy,
there are some limitations and weaknesses. Remenyi (1995) has argued that the
outcome of the survey could be shallow if it is compared with other strategies such
as the case study. Robson (1993) says that this strategy might not be the most
appropriate method for collecting data, especially in providing real-world accounts.
This strategy has been chosen in this study to understand the factors that are
affecting the readiness for LS by establishing how far K-SMMIs’ current practices
are from a LS and by measuring and shedding light on the key areas associated with
LS that have appeared and been emphasised in the literature review, which will
eventually reveal whether K-SMMIs are following the same principles or not.
2. Case study
A case study is “an empirical inquiry that investigates a contemporary
phenomenon within its real-life context, especially when the boundaries between
phenomenon and context are not clearly evident” (Yin, 2003, p. 13). Denscombe
(2003) argued that a case study would allow the researcher to use different types of
data with different resources to achieve the required information. Moreover, it would
offer the researcher a rich understanding of the research context and the process
(Morris and Wood, 1991). Robson (2002, p. 178) defined a case study as “a strategy
for doing research which involves an empirical investigation of a particular
contemporary phenomenon within its real life context using multiple sources of
evidence”.
There are various data collection techniques to be employed in a case study,
such as interview (semi-structured and unstructured interview), observation and
documentation analysis; in some cases a questionnaire can also be considered as part
of the case study technique (Saunders et al., 2009).
The case study strategy was chosen in this research to complement and
validate the main findings of the survey. The techniques used in the case study were
semi-structured interview and observation. According to Saunders et al. (2009),
184
researchers who decide to adopt a case study are likely to combine more than one
source of data to triangulate the findings and validate them. Additionally, this
strategy was chosen to allow the researcher to understand in depth the reasons that
might have prevented K-SMMIs from adopting LS, which might not be able to be
identified through the survey questionnaire: “Survey approach provides only a
‘snapshot’ of the situation at a certain point in time, yielding little information on the
underlying meaning of data” (Gable, 1994, p. 2/16). Another reason for adopting the
case study alongside a survey is that if the survey alone was relied upon it would
provide a snapshot of the situation, but would not demonstrate the causes and effects
that are driving K-SMMIs to have this kind of practice (Gable, 1994).
According to Yin (2003), a case study is useful when the researcher is posing
“why” and “how” questions, as it will allow the researcher to understand the reasons
and motives behind adopting such an approach or not adopting another approach. In
the present case it will make it possible to understand why K-SMMIs are running
their business as revealed in the survey findings. Yin (2003) added that when the
research is focusing on contemporary phenomena, the case study is an appropriate
strategy to adopt: “case study is preferred in examining contemporary events” (Yin,
2003, p. 7). In this research the focus is on contemporary phenomena, to understand
the current situation of K-SMMIs and to see how far they are from LS, and to focus
on the factors that are affecting their readiness for LS.
According to Bardoel and Sohal (1999), the case study approach has gained
momentum in identifying issues related to quality management, as it provides details
and reveals information that other strategies such as a survey cannot provide
(Mellahi and Eyuboglu, 2001). In addition to the above reasons, this is the first study
of LS within the Kuwaiti context and a case study is appropriate in the development
of this particular research area (Ben Jaber, 2010). Mellahi and Eyuboglu (2001)
adopted the case study strategy, as they found that there is a lack of valid and reliable
instruments to be used in developing countries, which is the same case in the present
research.
The strength of the case study approach is that it allows the researcher to
collect information from different sources and gain a “full variety of evidence –

185
documents, artifacts, interview, and observations” (Yin, 2003, p. 8). There are four
types of case study strategies (Yin, 2003):
1. Single case study;
2. Multiple case study;
3. Holistic case study; and
4. Embedded case study.
A single case study is where the researcher needs to investigate a unique
case; it is sometimes used where there is a case which no one or only a few people
have come across before, so it can allow the researcher to observe and analyse a
phenomenon. Multiple case studies are used when the researcher wants to generalise
the findings from other case studies (Saunders et al., 2009). Voss et al. (2002)
argued that, despite the fact that a single case study can offer deeper understanding,
it has limitations, such as the fact that the findings of a single case cannot be
generalised and there is a danger of bias and misjudgement; in order to avoid these
weaknesses of a single case study, multiple case studies could be the solution, as
they will provide more valid findings and attenuate the bias. Yin (2003) believes that
multiple case studies are more beneficial for researchers than a single case study.
Nevertheless, multiple case studies also suffer from some weaknesses, such as less
attention by the researcher on the subject under study, which may lead to less in-
depth information about the case; moreover, multiple case studies require more
resources and time (Voss et al., 2002).
In this study multiple case studies have been conducted to allow to have a
better picture and to see whether the findings from the survey match the firms
visited. Furthermore, this will help to validate the overall findings of the study.
However, there is no reference to guide the researcher to know how many cases
should be taken into account for multiple case studies, as Perry (1998) pointed out.
Voss et al. (2002) believe that the smaller the number of cases the better for the
research, as far as in-depth findings are concerned. In that sense, this research has
opted to go for two case studies as representative of the sample of 50 K-SMMIs,
which will provide a better picture of current practices and to align the other findings
from the survey to provide better validity and generalisability.
186
During the survey, the researcher asked respondents if they were interested to
participate further in the research study and take part as a representative of K-
SMMIs. Initial agreement was obtained from four firms, then two firms withdrew
due to different reasons, such as time constraints and confidentiality. The
researcher’s initial idea was to have four firms, two ISO 9000-certified firms and two
non-ISO 9000-certified firms, but this was not possible.
The justifications behind the choice of these two firms were:
1. Both firms showed a desire to take part in the research;
2. Both firms were interested in LS and they thought it would be a good idea to
obtain suggestions and to understand whether they were ready for LS; and
3. Both firms were ISO 9000 certified. The first firm had implemented ISO
9000 for five years and the second firm had implemented ISO 9000 for 4
years.
The case study strategy allowed the researcher to gain a better view and
understanding of why K-SMMIs have yet to consider implementing LS; furthermore,
it added validity to the findings from the survey.
4.4.4 Fourth-layer choice of method
According to Williams (2007), there are three methods for conducting a
research study; quantitative, qualitative and mixed methods. Each of those methods
has its own strengths and weaknesses. However, mixing methods (quantitative and
qualitative) would enable the researcher to overcome and minimise the weaknesses
of a single method (Johnson and Onwuegbuzie, 2004). Before choosing the method
to be adopted in this research, the researcher thoroughly reviewed the weaknesses
and strengths as well as key features of those methods to see which method would
help to meet the objective of this research, bearing in mind the philosophical position
of the researcher, which is pragmatism.
1. Qualitative and quantitative methods
Qualitative research is subjective in nature and is mostly aimed at
understanding human and social behaviours (Collis and Hussey, 1997). It reflects on

187
perceptions by examining feelings and meaning (Kumar, 1999). This method is
based in an inductive approach, as it emphasises the generation of theories, unlike
the quantitative method. The main concentration in this method is on words, feeling
and behaviours, without paying attention to numbers. Researchers who decide to
adopt the qualitative method need to be aware that this method requires skill and
time (Sharma, 2009). Yauch and Steudel (2003) declared that the drawback of the
qualitative approach is that it takes more time and a particular issue could be
overlooked.
Patton (2002, p. 49) claimed: “Qualitative research is an effort to understand
situations in their uniqueness as part of a particular context and the interactions there.
This understanding is an end in itself, so it is not attempting to predict what may
happen in the future necessarily, but to understand the nature of that setting – what it
means for participants to be in the setting. The analysis strives for depth of
understanding.”
On the other hand, the quantitative method involves the collection of data so
that information can be quantified and subjected to statistical treatment in order to
support or refute “alternate knowledge claims” (Creswell, 2003, p. 153). The
quantitative method is based on a positivist philosophy and the deductive approach
(Neuman, 1997). This method is objective, concentrating on measuring phenomena
and/or testing theories (Hussey and Hussey, 1997). The data analysis associated with
the quantitative method is a statistical procedure (Kumar, 1999).
In this research, the quantitative method will make it possible to understand
the current practices in comparison to LS, but it would not reveal the reasons behind
them; this is where the qualitative method comes in. Furthermore, the qualitative
method would give participants the chance to open up new areas for researchers to
help in understanding the situation, unlike the quantitative method in which
participants respond to closed-ended questions. Table 22 shows the key features of
quantitative and qualitative methods and Table 23 highlights the strengths and
weaknesses of both methods.

188
Table 22 Key features of qualitative and quantitative research.
Source: Hussey and Hussey (1997, p. 54).
Quantitative Qualitative
Uses large samples Uses small samples
Concerned with hypothesis
testing
Concerned with generating
theories
Data is highly specific and
precise
Data is rich and subjective
Location is artificial Location is natural
Reliability is high Reliability is low
Validity is low Validity is high
Generalising from sample to
population
Generalising from one setting
to another
Table 23 Strengths and weaknesses of quantitative and qualitative methods.
Source: Marsh (1988).
Strengths Weaknesses
Quantitative
Quick and cheap
Simple and offers a
useful overview
Helpful when used as
a prelude to
qualitative research
Subjectivity
Requires skills for
interpretation
Bias could be high
Statistical accuracy
can be reduced
Qualitative
Better accuracy
Detailed results and
help to provide facts
Margin of error can
be calculated
Good range for
prediction
Slow
Relatively expensive
More complicated
Low response rate

189
2. Mixed method
The mixed method is “an approach to knowledge (theory and practice) that
attempts to consider multiple viewpoints, perspectives, positions, and standpoints
(always including the standpoints of qualitative and quantitative research)” (Johnson
et al., 2007). The mixed method is deemed to be the most appropriate method for
doing research (Denzin, 1970; Bryman, 1988) and researchers who adopt the mixed
method approach are likely to come out with superior results (Johnson et al., 2007).
Prior to designing and conducting the research, the researcher should know
the best method to answer the research questions (Molina-Azorín, 2010). He or she
also needs to be aware of the effort required to use the mixed method: it asks for a
great deal of effort by the researcher as it demands extensive time, resources, effort
and skills (Creswell and Clark, 2007; Molina-Azorín, 2010). Many researchers and
authors have shown the benefits of adopting the mixed method, such as Molina-
Azorín (2010); Creswell and Clark (2007); Patton (2002); and Tashakkori and
Teddlie (2003). Creswell and Clark (2007) said that applying the mixed method
would help researchers to have a better understanding of the research problem and
complex phenomena. Moreover, it would add insights and better understanding, as
well as enhancing the validity of the research and helping to reduce the problems that
may come from a single method (Molina-Azorín, 2010). Table 24 shows the
weaknesses and strengths of the mixed method that researchers need to know.

190
Table 24 Strengths and weaknesses of the mixed method.
Source: Migiro and Magangi (2011).
Strengths Weaknesses
Mixed method research can answer a broader and more
complete range of research questions, because the researcher is
not confined to a single method or approach.
A researcher can use the strengths of an additional method to
overcome the weaknesses in another method by using both in a
research study.
Mixed method research can provide stronger evidence for a
conclusion through convergence and corroboration of findings.
Mixed method research can add insight and understanding that
might be missed when only a single method is used.
Mixed method research can be used to increase the
generalisability of the results.
Qualitative and quantitative research used together produce
more complete knowledge necessary to inform theory and
practice.
Researchers can generate and test a grounded theory.
Words, pictures and narrative can be used to add meaning to
numbers.
Numbers can be used to add precision to words, pictures
and narrative.
A researcher has to learn about multiple methods and
approaches and understand how to mix them appropriately.
Methodological purists contend that one should always work
within either a qualitative or a quantitative paradigm.
Some of the details of mixed method research remain to be
worked out fully by research methodologists (for example,
problems of paradigm mixing, how to qualitatively analyse
qualitative data, how to interpret conflicting results and
report them).
Mixed method research can be difficult for a single researcher
to carry out, especially if the two approaches are expected to
be used concurrently.
The application of mixed methods in a single study is a
difficult issue, since the rationales for methodological
decisions are often justified by the questions addressed and the
way data have to be analysed.
191
The mixed method could be adopted for different reasons. Swanson and
Holton (2005) classified the mixed method into four types:
1. Complementary: where the results of qualitative and quantitative approaches
are combined to complement each other;
2. Development: the results from one method help to develop the other method;
3. Initiation: where the results from one method are used to question the result
from the other method; and finally
4. Expansion: where the researcher uses both methods to expand the range or
breadth of the inquiry.
Researchers often adopt the mixed method for two reasons: to achieve
validation or triangulation by combining different sources of data to study the same
phenomenon, which enables them to have a complete understanding of it (Denzin,
1970); and to achieve complementary results by strengthening one method to boost
the other method by overcoming weaknesses (Morgan, 1998). Moreover, Greene et
al. (1989) mentioned that there are three main purposes of conducting the mixed
method:
2. For triangulation purposes, to ensure validity by combining the results;
3. For complementary purposes, to enable the researcher to thoroughly explain
the results of the analysis; and
4. For development purposes, to guide further data collection and analysis.
According to Carey (1993), qualitative and quantitative methods are simply
tools that help the researcher to answer the questions that are very important to the
research. These methods are often combined to produce the best research, although
the fact that methods can be combined does not mean that doing so is always
appropriate (Sale et al., 2002). Jick (1979) declared that qualitative and quantitative
approaches must be viewed as complementary rather than rival methods.
Some researchers have claimed that both methods are based on different
paradigms (ontology and epistemology) and that each method has a different
philosophy and does not study the same phenomena, as the quantitative method is
based on positivism while the qualitative method is based on interpretivism (Sale et
al., 2002). However, Sale et al. (2002, p. 50) added: “the fact that the approaches are

192
incommensurate does not mean that multiple methods cannot be combined in a
single study if it is done for complementary purposes”.
Creswell et al. (2011) share the same view as Sale et al. (2002) and say that
the mixed method leads researchers to have diverse philosophical positions, as the
mixed method requires researchers to use a quantitative methodology, which lies in a
positivist philosophical position (and a mainly deductive approach), and a qualitative
methodology, which takes an interpretivist philosophical position (mainly an
inductive approach). Thus researchers need to be careful when deciding to use this
method.
Many authors, such as Johnson and Onwuegbuzie (2004); Maxcy (2003);
Rallis and Rossman (2003); and Johnson et al. (2007), have argued that a pragmatist
philosophy is a greater partner to the mixed method, as it underpins the mixed
method by providing assumptions about knowledge and inquiry. Moreover,
researchers who are from a pragmatist philosophical position are not tied to one
approach; rather, they will be focusing on the right methodology that helps them
answer the aim of the research (Denscombe, 2008).
Many researchers switch from one method to another and the researcher’s choice
of a specific method could be affected by many factors, such as time, money,
resources, staff and the preferences of those requesting the study, so it does not
necessarily reflect the researcher’s philosophical position (Schulze, 2003).
Denscombe (2008) claims: “The choice of research methodology is seen as a
reflection of factors such as career interests, funding opportunities, training, and
personal skills rather than a purely ‘rational’ choice based on the respective merits of
the available alternatives.”
Jick (1979) has encouraged researchers in the organisational management
field to adopt a mixed method and triangulation, as it helps gain a better
understanding of the subject and the researcher will be more confident of the results
and interpretation. Jick (1979) stated: “[triangulation] can stimulate us to better
define and analyze problems in organisational research”.
Gable (1994) has made a great comparison between a case study strategy and
a survey strategy, which shows how the mixed method can be beneficial for the

193
research and that the weaknesses of one strategy are compensated by the strengths in
the other strategy; see Table 25.
Table 25 Comparison between case study and survey.
Source: Gable (1994, p. 3/16).
Factors Case study Survey
Controllability Low Medium
Deductibility Low Medium
Repeatability Low Medium
Generalisability Low High
Exportability High Medium
Representability High Medium
Despite the benefits of the mixed method and the fact that it can add value to
the outcome of the research in terms of richness and greater validity, Molina-Azorín
(2010) has claimed that there is a limited amount of mixed method research in the
management discipline, because the requirements of journals force authors to write a
limited number of pages. This is why most researchers rely on a single method.
The author believes that relying on a single source of data would not be
enough to conduct the research study and would not make it possible to meet the
objectives of the research. Table 26 and Table 27 show the articles in the business
management field that have adopted the mixed method, and Table 28 shows the
methods adopted in the studies that have been conducted to assess the readiness for
QI.
Table 26 Strategic Management Journal
Source: Molina Azorín and Cameron (2010).
Strategic
Management
Journal
Non-empirical
articles
Empirical articles
No. of non-
empirical
articles
No. of
empirical
articles
Quantitative
articles
Qualitative
articles
Mixed
method
2003/2009 53 365 365 16 64

194
Table 27 Journal of Operations Management
Source: Cameron and Molina-Azorin (2010).
Journal of
Operations
Management
Empirical articles
No. of
empirical
articles
Quantitative
articles
Qualitative
articles
Mixed method
2003/2007 187 146 23 18

195
Table 28 Methodology adopted for assessing the organisational readiness for quality initiatives.
Authors/year Title Method adopted
Weeks et al. (1995a) A physical examination of health care's readiness for a TQM program: A case study Qualitative
Weeks et al. (1995b) Is your organization ready for TQM? An assessment methodology Quantitative
Elgamal (1998) An examination of organization and sub-organization readiness for total quality
management
Quantitative
Radder and Lynette
(2000)
The readiness of selected South African organisations to mass customise Quantitative
Pheng and Chuan
(2001)
A study of the readiness of precasters for just-in-time construction Quantitative
Aksu (2003) TQM readiness level perceived by the administrators working for the central
organization of the Ministry of National Education in Turkey
Quantitative
Hensley and Dobie
(2005)
Assessing readiness for Six Sigma in a service setting Quantitative
Lameei (2005) Assessment of organization readiness for TQM implementation Quantitative
Bayazita and Karpak
(2007)
An analytical network process-based framework for successful TQM): An assessment
of Turkish manufacturing industry readiness
Quantitative
Djerdjori and Aleter
(2007)
TQM readiness assessment in the public sector in the United Arab Emirates Quantitative

196
Abdolvand et al.
(2008)
Assessing readiness for business process reengineering Quantitative
Aria et al. (2009) Readiness of Iran universities of medical sciences for conducting total quality
management (TQM) according to educational managers’ point of view
Quantitative
Ben Jaber (2010) Investigating the factors affecting the readiness for TQM implementation within Libyan
higher education institutions (doctoral dissertation)
Qualitative
Poole and Mazur
(2010)
Assessing readiness for lean change in emergency department Quantitative
Hanafizadeh and
Ravasan (2011)
A McKinsey 7S model-based framework for ERP readiness assessment Quantitative
Lagrosen et al.
(2011)
Organisational learning and Six Sigma deployment readiness evaluation: A case study Qualitative
Lee et al. (2011) Developing a readiness self-assessment model (RSM) for Six Sigma for China
enterprises
Quantitative
Farhadi et al. (2012) Presenting a model determining readiness level of personnel admission to establishment
TQM in Isfahan Behr a spinning and weaving company
Quantitative
Monsef et al. (2012) Evaluation of readiness for implementation of TQM at Islamic Azad University Quantitative

197
3. Selected method
As has been mentioned earlier, this study is based on a pragmatist position,
where the research method is mixed method, which means that it adopts a
quantitative deductive approach and an inductive approach by qualitative method.
The mixed method is used in this research as a complement to the findings and to
validate the results. Johnson et al. (2007) declared that the results of the mixed
method enhance the validity of results and show that the results are not an artifact.
For example, the current practices in K-SMMIs can be measured via a
quantitative method, but it would not provide a deep understanding of what is
affecting these practices unless a qualitative method is adopted to enrich the
knowledge and to provide more room to ask about and explore the factors that might
affect performance or delay the use of LS. Vidich and Shapiro (1995, p. 31) stated,
“Without the survey data, the observer could only make reasonable guesses about his
area of ignorance in the effort to reduce bias.” In addition, having different sources
of data will make it possible to identify the reasons, obstacles and enablers within K-
SMMIs.
Additionally, via the mixed method the problem can be viewed from different
perspectives, which will enhance the meaning and enrich understanding, and in turn
complete the whole picture of the situation being explored. Moreover, it will help to
validate, compare and triangulate the results from different perspectives (Clark,
2010). Additionally, the mixed method will help in reducing the bias that may come
from a single source and increase validity (Yauch and Steudel, 2003; Eisenhardt,
1989).
4.4.5 Fifth-layer time horizon
According to Saunders et al. (2009), the time horizon of a study is highly
dependent on the purpose of the study. There are two types of time horizon studies:
longitudinal and cross-sectional. If the purpose of the research is to look for
something over a period of time, for example the process of manufacturing industries
over time, then the researcher would be likely to go for a longitudinal study; if the

198
research purpose is to provide a snapshot, then a cross-section is the best. In a cross-
sectional study researchers often adopt an employee survey strategy (Robson, 2002).
As the purpose of this study is to have a snapshot of the current practices of
K-SMMIs, the researcher opted to use a cross-sectional approach. The move to a
cross-sectional study was not randomly chosen by the researcher, but was done
because there was no previous information regarding LS in the Kuwaiti context that
the researcher could build on to see what had improved over time. According to
Bouma and Atkinson (1995, p. 114), in a longitudinal study researchers need to ask
“Has there been any change over a period of time?" which is not possible in the
present case.
4.4.6 Sixth-layer techniques and procedures
The researcher is trying to answer the research questions by identifying how
far current practices are from a LS and what factors are delaying LS implementation
within K-SMMIs; in other words, to assess the readiness of K-SMMIs. To do so, it is
necessary to identify the best method to help capture the required information. There
are different types of data collection techniques that are used in the business and
management field, such as questionnaire, structured interview and structured
observation (quantitative data collection), while the analysis can be conducted by
associated quantitative graphs and statistical analysis to generate numerical data. In
the qualitative method data collection is done by semi-structured and unstructured
interview and observation and data analysis are by categorising data (Saunders et al.,
2009).
In this research the researcher chose closed-ended questionnaire, open-ended
semi-structured interview and observation as the main techniques for collecting the
required data to enable him to answer the research questions and meet the objectives
of the research.
4.5 Sampling techniques
Before conducting data collection, researchers need to consider sampling
techniques to enable them to obtain the appropriate data. According to Palys (1997),

199
research questions and the objectives of the research are the determinants of the
sampling frame. Abu-Hussin (2010) stated that after identifying the target
population, the researcher must categorise the sample by using a proper technique.
As Kumar (1999, p. 148) claimed:
“Sampling is the process of selecting a sample (small or few respondents) from
a big group (population) to become the basis for estimating or predicting a fact,
situation, or outcome regarding the big group (population).”
There are two different types of sampling technique available to researchers:
probability sampling (representative) and non-probability sampling (judgemental).
Probability sampling ensures that the whole population has an equal opportunity to
be selected, while non-probability sampling is the opposite and is used where there is
difficulty in obtaining or including the whole sample, so that not all the population
can be represented in the sample (Abu-Hussin, 2010).
Choosing between these two techniques is highly dependent on the
availability of the resources and accessibility to the populations; other factors that
affect the choice between the two techniques are if the research requires face-to-face
contact with participants and if the population is geographically concentrated
(Saunders et al., 2009).
There are five different sampling techniques under non-probability sampling:
quota, purposive, snowball, self-selection and convenience. There are five sampling
techniques under probability sampling: simple random, systematic, stratified
random, cluster and multi-stage (Saunders et al., 2009), Table 29 shows the
comparison between probability sampling techniques and Table 30 shows the
comparison between non-probability sampling techniques.

200
Table 29 Impact of various factors on choice of probability sampling techniques
Source: Saunders et al. (2009, p. 224).
Sample technique Sampling frame required Size of sample needed Geographical area to which suited
Simple random Accurate and easily accessible Better with over a
few hundred
Concentrated if face-to-face contact
required, otherwise does not matter
Systematic Accurate, easily accessible and not containing
periodic patterns; actual list not always needed
Suitable for all sizes Concentrated if low face-to-face contact
required, otherwise does not matter
Stratified random Accurate, easily accessible, divisible into
relevant strata
Suitable for all sizes Concentrated if low face-to-face contact
required, otherwise does not matter
Cluster Accurate, easily accessible, relates to
relevant clusters not individual population
members
As large as
practicable
Dispersed if face-to-face contact required
and geographically based cluster used
Multi-stage Initial stages: geographical. Final stage: needed
only for geographical areas selected, see
comments for simple random and systematic
Initial stages: as large
as practicable
Dispersed if face-to-face contact required,
otherwise no need to use this technique

201
Table 30 Impact of various factors on choice of non-probability sampling techniques.
Source: Saunders et al. (2009, p. 236).
Sample type Possibility of sample being representative When useful
Quota The chance of being representative is very high in this type and that
depends on the selection of quota variable
Used if there are cost and time constraints
Purposive The chance of being representative is low and is dependent on the
research decision of choosing the sample:
When the researcher is working with small
samples
Extreme cases When the researcher is focusing on unusual or
special cases
Heterogeneous When the researcher is focusing on key
themes
Homogeneous When the researcher is focusing on in-depth
cases
Critical cases When the researcher is focusing on important
cases
Typical cases When the researcher is focusing on illustrative
cases
Snowball The chance of being representative is low but the case will have the
characteristics desired
When there is difficulty in identifying cases
Self-selection The chance of being representative is low Where exploratory research is needed
Convenience The chance of being representative is very low When there is very little variation in the
population

202
Based on the above explanations and differentiation between techniques, this
research has adopted non-probability sampling by using snowball and purposive
techniques. The two sections below explain why this study relied on these two
sampling techniques.
4.5.1 Snowball sampling
The researcher faced difficulty in contacting and inviting participants to his
study. At the early stage of the research, the researcher looked in the Kuwaiti
governmental database to make a list of target industries that he wanted to approach.
A number of manufacturing industries were listed to make an initial contact via
email to gain permission from the selected industries. The researcher explained the
nature and motive of the study by giving a short explanation of LS and the brief of
the survey. 30 emails were sent to the firms that were found in the Kuwaiti industrial
guide list; surprisingly, no responses were received. Some of the email addresses
were found to be wrong and some information within the industrial guide was found
to be inaccurate and out of date.
The researcher then flew to Kuwait and went to the industrial authorities to
seek help in finding participants, as the researcher had never worked within the
industrial field. Unfortunately, he only received an industrial guidebook that contains
all listed industries until 2009, which represents the sample framework for the
researcher.
As a final step, the researcher took the sample framework that included all
the registered industries (small and medium only) and the snowball technique was
used by relying on personal contacts that were able to lead to the identification of
more participants (within the sample framework), which worked well for some time,
until the researcher reached the level where he could not increase the number of
participants; in other words, the referral cycle ended. So he decided to follow a more
pragmatic approach, a “knocking door” approach, by going directly to the firms,
which worked well for increasing the number of participants to 50 firms.
The snowball approach was used for the expert-panel interview as well, as
the researcher went to the first few participants and asked them to provide him with

203
potential respondents that they might know. Venter et al. (2005, p. 291) followed the
snowball sampling technique when they struggled to find respondents to participate
in their research. They stated: “Following up on referral proved to be the most
effective approach and eventually yielded the majority of the potential respondents
listed on the sampling frame.” In this approach the research would not have an
accessible sampling frame for the population. One of the problems with this
technique is that it might be not very representative of the whole population.
However, while such a sampling approach could work perfectly well with qualitative
data, as it is normally not generalizable, that does not mean that the snowball
approach cannot be applied for a quantitative methodology (Bryman and Bell, 2011).
According to Saunders et al. (2009), a snowball sampling technique, as
already discussed, is commonly used when the researcher has difficulty in capturing
the desired population, but the problem with this technique is that it could lead to
huge bias, as participants are most likely to refer the researcher to other potential
participants who are or may be similar to their situation, which may result in a
homogenous sample. Having said that, the researcher did not have a better technique
to use due to the lack of support from governmental industrial institutions in
identifying potential participants; and due to the fact that the researcher was under
time constraints which required him to establish his work then write it up. In order to
mitigate the bias that might occur from the snowball technique, during the project the
researcher realized that he could visit companies without a referral from other
people, which worked well. This technique was followed particularly in the survey
and the interviews with the expert panel.
Sarantakos (1998) believes that researchers predominantly use the snowball
technique for the following reasons:
When there is a lack of sampling frame which makes it impossible for the
researcher to achieve a probability sample;
When the target population is unknown; and/or
When it is difficult to approach the respondents in any other way.
204
4.5.2 Purposive sampling
Although this research used the snowball technique to get more participants,
the researcher followed purposive techniques in addition to the snowball in an
attempt to have 50 per cent of participants as ISO 9000-certified firms. Purposive
sampling allows the researcher to choose cases that will best answer the research
questions and enables the researcher to meet the objectives of the research (Saunders
et al. 2009). In purposive sampling, the researcher is making an effort to find the
most appropriate sample for his/her research and the one that will best help in
achieving the objectives of the research, thus the samples used in this technique
could be representative of the population (Parasuraman et al., 2004). Kumar (2010,
p. 207) added: “this type of sampling [purposive] is extremely useful when you want
to construct a historical reality, describe a phenomenon or develop something about
which only a little is known”.
Neuman (1997) stated that there are certain occasions when purposive
sampling is helpful for researchers, which include when the researchers are using it
to:
1. Select unique cases that are especially informative;
2. Select members of a difficult-to-reach, specialised population; or
3. Identify particular types of cases for in-depth investigation.
Although some authors declare that a non-probability sample could be biased
and in most cases cannot be generalised, the author believes that for this particular
study the outcome can still be generalised and can be representative, as it has been
derived from a population that is from within the registered industries in Kuwait.
Even though he used the snowball technique, that was only for gaining more contacts
(the author does not think that this will affect the sample) and purposive techniques
were employed to make sure that the selected sample fitted the research criteria,
which is that the industries had to be small and medium and half of them must be
ISO 9000-certified firms.
Using snowball and purposive sample techniques, which are types of non-
probability sampling, helped in identifying respondents and specifying the available
population (K-SMMIs). These two sampling techniques seemed to be appropriate,
205
bearing in mind the descriptive and exploratory nature of this study, and to satisfy
the needs of the research, as the snowball technique provided more participants and
the purposive technique gave the researcher the opportunity to make his own
judgement when selecting the samples.
Kumar (2010, p. 206) stated: “Non-probability sampling designs are used
when the number of elements in a population is either unknown or cannot be
individually identified… [and is] commonly used in qualitative and quantitative
research.”
4.6 Data collection and analysis
In this study several sources of data (primary and secondary) were used to
collect the required information. A survey of K-SMMIs, a case study of K-SMMIs,
and expert-panel interviews (governmental institutions, academics and consultants)
were used for the primary data. The techniques included questionnaire, semi-
structured interview, observation (structured and unstructured) as well as a literature
review (secondary data). With regard to the credibility and validity of the research,
several tactics were employed, such as triangulation, pilot testing and the solicitation
of expert opinions on the final outcome to ensure that the data that would be as
credible and valid as possible. The sections below explain how the data were
collected and analysed.
4.6.1 Interview
What is most important is that researchers need to avoid bias when
conducting an interview by having clearly phrased questions so that respondents can
properly understand the questions. Moreover, the researcher needs to use a natural
tone to avoid influencing the respondents’ answers (Saunders et al. 2009). The
advantage of the interview technique is that the researcher can obtain a deeper
understanding of the phenomena that he/she is investigating, as open-ended
questions allow respondents to talk more about the topic, which the researcher can
benefit from. Easterby-Smith et al. (2004) argued that open-ended questions can
eliminate bias. Moreover, Saunders et al. (2009) added that the questions should be
short and jargon and complexity free, and that the researcher should avoid questions

206
that contain theoretical concepts. According to Axinn and Pearce (2006), an
interview can offer an opportunity for respondents to shed light on other factors that
have not been mentioned in the survey.
Patton (1990, p. 278) commented: “The purpose of interviewing is to find out
what is in and on someone else’s mind… We interview people to find out from them
those things we cannot directly observe” and highlighted the significance of
interviews as follows:
“We interview people to find out from them those things we cannot directly
observe. The fact is that we cannot observe everything. We cannot observe feelings,
thoughts and intentions. We cannot observe behaviour that took place at some
previous point in time. We cannot observe situations that preclude the presence of
the observer. We cannot observe how people have organised the world and the
meaning they attach to what goes on in the world. We have to ask people questions
about those things. The purpose of the interview then is to allow us to enter into
another person’s perspective.” (Patton, 2002, pp. 340-341).
This technique has been adopted to help in answering the research questions
(RQ1, RQ2, RQ3, RQ4, RQ5 and RQ6).
4.6.1.1 Type of interview
There are three types of interview that can be deployed in research: structured
interview, semi-structured interview and unstructured interview (Saunders et al.,
2009). The structured interview is referred to as a quantitative technique, as the
researcher tends to ask structured, standardised questions to collect quantifiable data.
While semi-structured and unstructured interviews are part of qualitative
methodology, the researcher in those types is using non-standard questions to get as
much information as possible.
The differences between these types are that in the semi-structured interview
the researcher should prepare key questions that would lead him/her to answer the
research question or the aspect he/she wants to investigate, while in the unstructured
interview the researcher does not need to have a list of questions, but merely requires

207
a clear idea of the subject and what he/she is trying to achieve. This kind of question
would provide the research with in-depth information about the investigated area.
In order to get the desired information, the researcher decided to adopt a
semi-structured interview, as it seemed to be the most appropriate method to give the
researcher deep knowledge about the investigated area. Moreover, it would open
new areas that the researcher may have not considered when listing the questions.
After reviewing the available literature, the researcher prepared a list of questions
that are related to lean principles, lean CSFs that are required to start and sustain LS
and other issues related to Kuwaiti manufacturing industries.
However, the researcher did not restrict himself only to the area that was
investigated in the first phase (questionnaire), in which the researcher was trying to
understand the current situation based on six factors – processes; planning and
control; human resources; top management and leadership; customer relations; and
supplier relations – as those six factors would not reveal the factors that are delaying
a LS implementation. Thus, the interview would provide more details about the
situation. After preparing the questions, they were sent to the researcher’s supervisor
and experts in the field in Kuwait to gain their feedbacks. The feedbacks from both
parties were incorporated and eventually the questions were modified according to
their suggestions.
A face-to-face semi-structured interview was adopted to enable the
researcher to reveal the reasons, obstacles and enablers that represent the potential
barriers or the potential enablers for driving a LS implementation in K-SMMIs. As
this is the first research study that has tried to explore K-SMMIs’ current practices
and measure them against LS, this technique was chosen to enable the researcher to
understand the situation in depth.
4.6.1.2 Interview data collection
According to Saunders et al. (2009), researchers must interview participants
who have decent knowledge of the subject area, who are interested in the research
and who can articulate their views precisely. In this research study the researcher
was trying to conduct interviews with people who fitted Saunders et al.’s (2009)

208
criteria in order to avoid wasting time and gaining misleading and inaccurate
answers. It is essential for researchers to conduct interviews at all levels (Saunders et
al., 2009); however, in this research it was not possible to maximise the number of
participants due to language barriers and a lack of knowledge at the lower level.
In this study interviews were conducted with three different groups. The first
group consisted of managers (such as plant, quality, production and HR managers)
from the 50 K-SMMIs that were surveyed in the first stage (lasting between 30 and
45 minutes). The target respondents here were managers who are involved in
decision making and have a good knowledge of the strategy of the firm and a desire
to participate in the interview.
Among the 50 participants in the survey, 27 managers agreed to participate in
an interview, although other managers refused for different reasons, such as lack of
time and desire. The aim behind choosing a representative from each firm involved
in the questionnaire was to enhance the validity of the results and to understand their
situation and try to make sense of it, since by collecting data from different
companies the researcher can strengthen the internal consistency of the research
(Yin, 2003). Furthermore, some aspects cannot be measured (or it will not be
possible to obtain an accurate answer) by a questionnaire, such as the level of
knowledge and awareness of lean and quality systems; better results can be gained
from face-to-face interviews.
The second group were in the two case study firms where the researcher had
the chance to conduct an interview at different levels in the firm (lasting between 15
and 90 minutes). Although there was a difficulty due to a language barrier, the author
managed to overcome this problem by inviting the supervisor of this research to
attend the interviews, as he can speak different languages (Urdu, Hindi and Nepali),
which made it possible to cover the whole level of the first case study; in the second
case study the author was escorted by the production manager, who is Indian and
acted as an interpreter.
Finally, the third group of interviewees was the expert panel, which included
a quality management practitioner, academic staff from Kuwait University who are
teaching lean subject and quality management subjects and have publications related
to quality management within the Kuwaiti context, ISO and quality management

209
consultants, and finally people from the governmental institutions who are directly
involved in Kuwaiti industry and are aware of the relevant policies (lasting between
1 and 3 hours).
To ensure that the most honest answers were obtained, the researcher assured
the participants that neither their name nor their company’s name would be
mentioned in the research. The researcher started by explaining the motives behind
conducting this kind of research and how this could help Kuwaiti industries, and in
addition they were assured that the prime objective of the study was not to know
how each firm was performing, but rather to have a deep understanding of the
reasons behind their current practices and how they could benefit from implementing
a LS.
4.6.1.3 Interview analysis
A researcher has to choose the right method for analysing the data collected
(Sadeghian, 2010; Eisenhardt, 1989). Proper analysis of the data collected will allow
the researcher to identify any gaps and cover them by collecting other data from
different resources. The data analysis process is to find “patterns, coherent themes,
meaningful categories, and new ideas and in general uncovers better understanding
of a phenomenon or process” (Suter, 2006, p. 327).
Prior to conducting the interviews, the researcher asked permission to record
the discussion (Malhotra and Peterson, 2001); the researcher was eager to record all
the interviews to ensure that he did not miss any important aspects or information.
However, not all of the participants agreed to be recorded, so the researcher had to
rely on writing notes and comments. After the interviews finished, the researcher
started to summarise the important aspects in the interview without listening to the
recordings and to plot the findings in categories. After that, he listened to the
recorded interviews and updated the list.
The researcher offered participants a copy of the transcript to ensure that their
answers were not incorrectly interpreted. Most of the participants decided not to
review the transcript; only two participants asked for a summary of the interview.

210
They were provided with a summary of the findings that would be included in the
study and eventually they agreed with the content.
The method of interview analysis was based on coding and clustering the
findings from the interviews (Sadeghian, 2010; Glaser and Strauss, 1999; Strauss
and Corbin, 1998). The researcher went through the transcript and notes and started
eliminating unnecessary words and phrases that did not answer the questions; what
was left was categorised and labelled with codes into a number of clusters.
Bryman and Bell (2011, p. 485) commented:
“Some interviews or at least large portions of them are sometimes not very useful,
perhaps because interviewees are reticent or their answers are not as relevant to your
research topic as you had hoped… for many of your interviews, it would be better to
listen to them closely first, at least once or more usually twice, and then transcribe
only portions that you think are useful or relevant.”
So the concentration was on the aspects that had direct relevance to the
research questions and questions asked in the interview. For example, the researcher
asked about the reasons behind adopting ISO 9000; the answers to this question were
different depending on the interviewee’s perspective and the vision of the company,
but most answers were to maximise sales or improve quality, so the researcher coded
them “sales”, “quality” etc.
After completion of the interview, the outcome of the discussion was a
transcript and the data obtained were labelled with codes. The open answers were
analysed by a content analysis approach. Content analysis is “a thorough research
technique which allows replicable and valid inferences from data to their context”
(Krippendorff, 1980, p. 21); according to Bryman and Bell (2007, p. 304), content
analysis is “an approach to the analysis of documents and texts that seeks to quantify
content in terms of predetermined categories and in a systematic and replicable
manner”.
In using content analysis the researcher followed steps similar to those
offered by Psychogios and Priporas (2007):

211
1. The researcher has listened to the available recorded discussion and
compared it with handwritten notes;
2. Defining units for general meaning and for aspects that are relevant to LS;
3. Grouping units according to the aspects related to LS; and finally
4. Formatting them from the groups of meaning and identifying them from the
interviews.
Using this analysis helped the researcher to develop a clear picture of the
factors that are affecting the readiness level for a lean system.
4.6.2 Questionnaire
Neelankavil (2007, p. 160) claimed: “A questionnaire is defined as a series of
questions on specific topic, based on specific information needs of research goals
that respondents answer.” According to Saunders et al. (2009), questionnaire
techniques tend to be used for descriptive or explanatory research studies.
In descriptive research, the questionnaire helps in knowing attitudes, opinions
or organisational practices (Saunders et al., 2009). There are different types of
questionnaire, such as self-administered questionnaire, structured interview and
telephone questionnaire. In business and management studies, if the purpose of the
research is to be descriptive, the researcher needs to administer the questionnaire to
the sample that could be representative of the population (Saunders et al., 2009).
Bell’s view (1999, p. 245) is that “the questionnaire is a widely used and
useful instrument for collecting survey information providing structured, often
numerical data, being able to be administered without the presence of the
researcher, and often being comparatively straight forward to analyse”. This
technique has been adopted to help in answering the research question (RQ1).
In this study, the questionnaire was distributed to 200 randomly selected K-
SMMIs; valid responses were received from 50 firms, which resulted in a response
rate of 25 per cent. A total of 25 firms were ISO 9000 accredited. The total mean
score for firms who are successfully practising LS activities was assumed to be M ≥
4 for each of the constructs.

212
To validate this assumption, the survey was sent to 15 successful lean
manufacturing companies (all of which are large in size) in different regions (three
from Kuwait, seven from Saudi Arabia, two from the UAE, two from Nigeria and
one from the UK) to use as a proxy. It would have been more accurate to test the
survey on successful lean K-SMMIs, or SMMIs from the nearby region, but this was
not possible due to a lack K-SMMIs who are practising LS, and limitations on time.
However, the quality and management practices used in his study are derived from
different studies around the world, and it is believed that most of the elements in the
questionnaire are important to LS regardless of the firms’ size and region.
The criterion used to select the 15 firms was that they were successfully
using LS. In other words, they had to be satisfied with the results they had achieved
after LS implementation; this was verified via contacting the firms’ managers by
phone and email. The total mean score for the 15 firms was M≥4 for each construct,
which shows that lean firms regard these practises as important for LS, supporting its
use as a benchmark; this meant that firms who scored M≥4 in the main study could
be considered ready to implement LS. It should be noted that the 15 firms were used
purely to validate the assumption that a lean company would score M≥4, and were
not used for comparison purposes.
The surveys used five-item Likert scales to identify the extent to which the
company had adopted quality and management practices, and to set up valid and
reliable numeric results for statistical analysis. Five-Likert scales were chosen to
give the participants the freedom to choose the appropriate rating for their current
situation. For the first two constructs (processes, and planning and control), the scale
was as follows: never (1), very rarely (2), sometimes (3), frequently (4) and always
(5); for the remaining constructs the scale was: strongly disagree (1), disagree (2),
neutral (3), agree (4) and strongly agree (5).
The responses were entered into SPSS software to generate different
analyses, including Cronbach’s alpha, descriptive analysis, Crosstab analysis,
independent sample t-test and one-way ANOVA test.
Cronbach’s alpha is used to check reliability and internal consistency. This
test is very important and the researcher needs to make sure that there is
internal consistency to carry on doing further analysis; a value above 0.7 is
considered to be acceptable (Pallant, 2010).

213
Descriptive analysis is recommended to be used before conducting further
statistical analyses such as t-test, ANOVA, or correlation, as it helps to
confirm that the researcher has not violated the assumption. In this study it
was used to gain information in order to describe the sample (Pallant, 2010).
It is also used to organise and summarise the data that have been gathered;
this test helps to organise respondents’ answers into statistical data to see the
frequency of answers (Coakes, 2005).
Crosstab analysis was carried out with different variables to understand the
responses between two variables.
An independent sample t-test was used to compare the mean scores for two
different groups to see if there was a significant difference between groups
such as ISO 9000-accredited firms and non-ISO 9000-accredited firms,
between firms of different sizes, such as small and medium-sized firms, and
ownership structure i.e. family and non-family owned firms. This test
allowed knowledge of whether the two groups show statistically significant
differences in mean score, which made it possible to test the hypothesis
(Pallant, 2010).
A one-way ANOVA test was used to identify whether there is a statistically
significant difference in mean score between more than two groups (i.e. in
the present case, testing the effect of different sectors). The ANOVA test is a
mean analysis of variance, which means comparing the variability in scores
for different groups to test the hypothesis to see whether the sector has an
effect on current practices and readiness for LS (Pallant, 2010). This test was
used to see whether the different sectors and management style demonstrated
statistically significant differences in mean score.
4.6.3 Observation
Observation comes in two forms: quantitative (structured observation) and
qualitative (participant observation), according to Saunders et al. (2009). Hussey and
Hussey (1997, p. 159) defined observation as “a method for collecting data
associated with either positivist [quantitative] or a phenomenological [qualitative]”
and claimed that there are two types of observation: participant observation and non-
participant observation. In non-participant observation the role of the researcher is to

214
observe and record people’s actions and behaviours without being involved; while
participant observation is the opposite and the researcher is involved in the subject or
phenomenon being researched.
In this study, non-participant structured observation (direct observation) was
adopted to allow validation of the findings. By adopting the observation technique,
the researcher would have the opportunity to see for himself the working area within
industries and be able to notice if there is a visual management guide in place (health
and safety, designated area, inventory etc.), which would help him to make sense of
how K-SMMIs are running their businesses and eventually what sort of potential
barriers are in place. For example, if the researcher noticed that there were no signs
and labels for items and equipment, that would be likely to contribute to delaying the
process and cause wasted time; as another example, if equipment was not clean but
was full of dirt, this would mean that firms were not following any preventive
maintenance, and so on.
Observation is “a systematic process of recording behavioral patterns of
people, objects, and occurrences as they happen. No questioning or communicating
with people is needed” (Zikmund et al., 2012, p. 239). Zikmund et al. (2012, p. 239)
declared that the observation technique is useful when it meets the conditions below:
1. The observation serves a formulated research purpose;
2. The observation is planned systematically;
3. The observation is recorded systematically and related to general
propositions, rather than simply reflecting a set of interesting curiosities; and
4. The observation is subjected to checks or controls on validity and reliability.
In the present case, observation was used primarily for two reasons: to serve
the research purpose and to check the reliability and validity of the findings. This
technique helped in answering the research questions (RQ1, RQ2, RQ3, RQ4, RQ5
and RQ6). The main advantage of observation is that it allows the researcher to
obtain an accurate result, as the data is obtained by the researcher directly, unlike
other techniques that depend on memory, such as interview, and avoids the
respondent bias which can come from a questionnaire (Zikmund et al., 2012).
Moreover, observation can provide accurate information for the research. For
example, the present study used a survey questionnaire, in which one of the

215
questions asked was: “Do you use visual management in place?” In a questionnaire
the respondents can easily answer in the affirmative, but in observation the
researcher would be able to judge this for himself, which would add more credibility
and validity to the outcome.
Zikmund et al. (2012, p. 242) noted: “Many types of data can be obtained
more accurately through direct observation than by questioning.” In this study the
research used direct observation by collecting data without asking questions.
4.6.4 Concluding remarks for data collection
At certain points the researcher needed to stop the data collection process
bearing in mind three factors: the time needed to analyse the data, time for writing up
and the saturation which happens when no new insights can be obtained. According
to Glaser and Strauss (1999), research reaches the point of theoretical saturation
when no new information can be obtained. After a certain amount of time and after
interviewing 27 managers and the expert panel, as well as conducting the case
studies and the questionnaire, the researcher felt that the information, reasons and
obstacles were repeating themselves, and that he had reached the point where he
understood the causes of the problem, so he decided to stop collecting data and move
forward to the analysis phase. Figure 4 summarises the whole research process that
was followed in this research.

216
Figure 4 Research process for this study (Saunders et al., 2009, p. 108).
4.7 Reliability
Reliability is “the extent to which your data collection techniques or analysing
procedures will yield consistent findings” (Saunders et al., 2009, p. 156), so reliable
and consistent results should be obtained if the research is applied in different time
periods. In order to assess the reliability of the research, the researcher must ask
himself/herself three questions (Easterby-Smith et al., 2008, p. 109):
1. Will the measures yield the same results on other occasions?
2. Will similar observations be reached by other observers?
3. Is there transparency in how sense was made of the raw data?
Robson (2002) pointed out factors that may influence the reliability of
research, such as participant error or bias and observer error or bias. In order to
check the reliability of research, researchers can adopt the most used method to
check internal reliability, which is Cronbach’s alpha, as mentioned by Saunders et al.
(2009). In addition, pilot testing could enhance reliability (Abu-Hussin, 2010).
In this research study, Cronbach’s alpha was used to evaluate the overall
reliability of the measurement scale of each construct, and to examine the reliability
of the findings and ensure that the instrument used in the research was reliable.

217
Cronbach’s alpha provides an approximation of the proportions of the total variance,
which represents the reliability of the scale (Oppenheim, 1992). Where the alpha
value is computed from 1-0 value, a figure above 0.7 is considered reliable and
sufficient (Schutte et al., 2000). Moreover, in order to enhance the reliability, the
researcher conducted a pilot study to avoid misinterpretation by respondents (Abu-
Hussin, 2010).
Maylor and Blackmon (2005) have said that the quantitative method has a
better chance to gain reliability compared with the qualitative method; in the
qualitative method researchers are unlikely to follow same procedure in conducting
the study. Yin (2003, p. 33) recommended some steps that the researcher should
follow to enhance the reliability of research: by using case study protocol and by
developing a case study database. In this research the research made sure to use the
case study protocol.
4.8 Validity
Saunders et al. (2009, p. 57) claimed that “validity is concerned with whether
the findings are really about what they appear to be”. Thus, validity shows that the
findings of the research represent what is happening in the situation being studied.
According to Ben Jaber (2010), validity has received more attention than reliability
in qualitative research. Flick (2007) showed that three types of error could be
committed by a researcher which can lead to low validity:
1. The researcher sees a relation, a principle and so on where this is not correct;
2. The researcher rejects relationships where they are indeed correct; and
3. The researcher may ask the wrong question.
There are three different types of validity in empirical research: content validity,
criterion validity and construct validity (Srivastava, 2010).
1. Content validity is an important step in assessing a construct (Garver and
Mentzer, 1999), as it ensures that there is enough coverage of the issue under
study (Srivastava, 2010). Sekaran and Bougie (2010) declared that the
validity of the content could be reached by having more of the scale items
representing the domain. Sadeghian (2010) said that in order to get content

218
validity, the researcher needs to review intensively the available literatures to
be able to set scale items that can represent the whole domain.
In this research, the researcher made sure that he covered the maximum
amount of literature to ensure validity; moreover, the researcher conducted a pilot
test prior to the actual conduct of the study. Most of the items in the qualitative
method and in the quantitative method were developed based on other researchers’
work and recommendations.
2. There are two types of criterion validity: predictive validity and concurrent
validity. Predictive validity indicates the success of the measuring
instrument, while concurrent validity is an indication of the present status
(Srivastava, 2010).
3. Construct validity “is one of the most significant researchers in development
of measurement theory and practice. It links psychometric notions and
practices to theoretical notions” (Srivastava, 2010, p. 5.10). Yin (2003, p. 33)
has recommended some tactics to be considered by researchers to ensure
construct validity, such as using multiple data resources, establishing a chain
of evidence and having key informants review a draft case study report.
The researcher in this study believes that the instruments used have content
validity, as it was based on reviewing an extensive literature, and the questionnaire
and interview questions were piloted. Moreover, the researcher followed the
recommendation by Yin (2003) that there should not be a reliance on a single source
of data. In addition, the researcher offered respondents the opportunity to review the
outcome of the interview, as well as summarising the overall findings of the study
and sending that to an expert panel to see whether the results found match the reality
of K-SMMIs.
Additionally, for each data collection process pre-testing procedures were
conducted, as recommended by Sekaran and Bougie (2010), by piloting the survey
and interview questions. Furthermore, triangulation was adopted more than once at
each stage during this research to ensure its validity (Creswell et al., 2011). The
sections below show the validity procedures (triangulation, pilot test and expert
panel) followed in this study.

219
4.8.1 Triangulation
The triangulation method is inspired by and has its roots in military and
navigation strategy, which uses several reference points to locate the exact position
of an object (Smith, 1975). Jick (1979) declared that triangulation would improve
researchers’ findings and interoperation in the organisational field by collecting
multiple viewpoints to enhance the accuracy of results.
Triangulation is a combination of different methods/techniques used to study
the same phenomenon (Denzin, 1970). According to Saunders et al. (2009, p. 146),
triangulation “refers to the use of different data collection techniques within one
study in order to ensure that the data are telling you what you think they are telling
you”. As Hussein (2009, p. 3) states, triangulation “is defined as the use of multiple
methods mainly qualitative and quantitative methods in studying the same
phenomenon for the purpose of increasing study credibility. This implies that
triangulation is the combination of two or more methodological approaches,
theoretical perspectives, data sources, investigators and analysis methods to study the
same phenomenon.”
Thus, triangulation was deployed in this research by combining different data
collection techniques, such as questionnaire, observation and interviews, as well as
collecting data from different sources, such as from key personnel within K-SMMIs,
and from experts, including people from governmental institutions, university
members and consultants. This step was used to ensure that the study obtained the
most rigorous data possible.
The reason for adopting triangulation was that the researcher’s attention was
focused on ensuring the validity (Biggs, 2009) of the data gathered, as well as the
fact that there was not enough information with regard to LS on which the researcher
could rely. Moreover, this method made it possible to overcome any weaknesses that
might have arisen by relying on one approach; as Jack and Raturi (2006, p. 345)
explained: “Complementary methods are deployed under the assumption that
weaknesses inherent in one approach will be counterbalanced via strengths in
another”. Thus, the adoption of triangulation helped to increase the credibility of the
research outcomes. As Hussein (2009, p. 10) explained, “triangulation can indeed
increase credibility of scientific knowledge by improving both internal consistency

220
and generalizability through combining both quantitative and qualitative methods in
the same study”.
Within this study, triangulation was achieved by carrying out: a survey
(questionnaire and structured observation) as the first stage of the research; semi-
structured interviews with firms’ managers as the second step; a case study (semi-
structured interview and observation) as the third step; and finally semi-structured
interviews with key personnel in governmental institutions, academics at Kuwait
University and consultant companies as the fourth step.
In this study, triangulation was used to study the same phenomenon, which is
the readiness of K-SMMIs towards LS and the factors that are affecting or delaying
their use of LS, by collecting data from various sources (see Figure 5). According to
Denzin (1970), triangulation can be used between methods (qualitative and
quantitative), or within one method (by using multiple techniques). Triangulation
can be used not only to measure the same phenomenon, but can also to enrich
understanding and enforce findings, whereas relying on a single method may lead to
an important aspect being neglected (Jick, 1979). As Eisenhardt (1989, p. 538)
commented: “Triangulation made possible by multiple data collection methods
provides stronger substantiation of the constructs and hypotheses”. Furthermore,
triangulation enhanced the study’s credibility (Jick, 1979).

221
Figure 5 Triangulation approach for this study.
4.8.2 Pilot study
A pilot study is a "small scale version[s], or trial run[s], done in preparation
for the major study" (Polit et al., 2001, p. 467). It can be used as a pre-test for an
instrument such as a survey questionnaire to ensure the clarity of the questions
(Baker, 1994). Van Teijlingen and Hundley (2001) said that the pilot study can be
used as a feasibility study; they pointed out the advantages of the pilot study and
how it can help researchers to avoid failure in research. They stated: “One of the
advantages of conducting a pilot study is that it might give advance warning about
where the main research project could fail, where research protocols may not be
followed, or whether proposed methods or instruments are inappropriate or too
complicated.”

222
Moreover, van Teijlingen and Hundley (2001) advised researchers to adopt a
pilot study prior to conducting their main research in order to:
Develop and test the adequacy of research instruments;
Assess the feasibility of the survey;
Design a research protocol;
Assess whether the research protocol is realistic and workable;
Establish whether the sampling frame and technique are effective;
Assess the likely success of proposed recruitment approaches;
Identify logistical problems which might occur using the proposed
methods;
Estimate variability in outcomes to help in determining sample size;
Collect preliminary data;
Determine what resources (finance, staff) are needed for a planned study;
Assess the proposed data analysis techniques to uncover potential
problems;
Develop a research question and research plan;
Train a researcher in as many elements of the research process as possible.
This research study used a pilot test to enable the researcher to have questions
that were as reliable and robust as possible in order to lead to valid and reliable
results. As this study adopted the mixed method, there were two forms of pilot test:
the first for the questionnaire and the second for the interview questions. According
to van Teijlingen and Hundley (2001), a pilot study can be conducted for both
qualitative and quantitative methods.
4.8.2.1 Questionnaire pilot test
For the questionnaire, the survey was sent to academic members of Kuwait
University and 15 firms who were similar to the target population. The pilot study in
this research followed the guidelines proposed by Peat et al. (2002, p. 123), as cited
in van Teijlingen and Hundley (2001):
Administer the questionnaire to the pilot participants in exactly the same
manner as it will be administered in the main study.
223
Obtain feedback from the participants to help in identifying any
ambiguities and difficult questions.
Make sure that the time needed to complete the questionnaire is
reasonable.
Abandon all unnecessary, difficult or ambiguous questions.
Assess whether each question gives an adequate range of responses.
Establish that replies can be interpreted in terms of the information that is
required.
Make sure that all questions are answered.
Rephrase and modify questions that are not answered properly.
Incorporate the comments provided by the participants in the pilot study
and if needed shorten, revise and, if possible, pilot again.
Response and feedback were critical in the research directions. The feedback
and suggestions were as follows:
1. The questions included jargon and complex words which showed
ambiguities; non-lean firms would not be able to understand them, so those
types of questions should be asked of companies that are practising a lean
system; and
2. There were far too many questions, which might lead to a decrease in the
response rate or less credibility in the answers.
The researcher agreed with the suggestions from the pilot test and thought
them very valid comments. In the first draft of the questionnaire, the researcher used
direct questions regarding lean tools and techniques. For example, the researcher
asked: have you implemented 5s; are you practising kaizen continuous improvement;
have you implemented SMED etc. As a result of the feedback, the researcher
decided to ask indirect questions that would help him to meet the objective of the
research. The second draft was developed and modified and sent to a similar group,
and their feedback was incorporated, some of the questions being further reworded
and modified.

224
4.8.2.2 Interview pilot test
After preparing the interview questions, they were sent to the researcher’s
supervisor and experts in the field from Kuwait to gain their feedback. That feedback
was incorporated and eventually the questions were modified according to these
suggestions.
4.8.3 Expert opinion
According to Oxford Dictionaries (2014), the definition of an expert is “a
person who is very knowledgeable about or skilful in a particular area”, or a person
“having or involving a great deal of knowledge or skill in a particular area”.
The reason behind using an expert panel’s opinion and knowledge is to add
trustworthiness about the findings of the research, which will enhance the robustness
of the outcome as well as guiding the researcher’s perspective (Achanga, 2007). The
experts should be knowledgeable in the subject matter being addressed and discussed
in the research (Fink, 1998).
The researcher targeted experts who are involved in the subject area and
aware of Kuwaiti manufacturing sectors (consultants), those who have published
studies regarding Kuwaiti manufacturing sectors and QI (academics from Kuwait
University), and key personnel from Kuwaiti governmental institutions who are
policy makers and policy implementers, since Achanga (2007) argued that experts
have to have be knowledgeable (have studied or worked) and up to date in the area
under study.
4.8.4 Bias avoidance tactics
Biggs (2009) demonstrated that there are threats to the validity of research
which can came in different forms, such as researchers altering what has been
observed in reality; researcher bias, as the researcher’s presumptions and
preconceptions can affect his/her understanding; and respondent bias, as the
respondent may alter their behaviour or statements, which may lead to misleading
conclusions.

225
Several tactics can be adopted in research to enhance its validity and mitigate
the risk of bias, such as:
Prolonged involvement: researchers should spend a long time in the
investigated field to reach a better understanding and accurate conclusion;
Triangulation: having different sources of data in terms of respondents,
theories, methods etc. so that the research can obtain more accurate results
which will enhance the validity and eliminate the bias;
Peer debriefing/support: discussing the work with fellow researchers; and
Audit trail: showing other researchers or experts in the field the outcomes of
the research.
In this research two tactics were adopted: triangulation and an audit trail.
Prolonged involvement could not be adopted, as the researcher is based in the UK
and the target respondents for this research are in Kuwait. Peer debriefing tactics
could also not be adopted, as there were no fellow researchers in the same
department and due to the fact that the researcher is undertaking a PhD, so there are
time constraints. The researcher felt that triangulation and audit trail tactics could
provide a good, valid and bias-free outcome, as with triangulation he would be able
to mitigate respondent bias and an audit trail would enable him to moderate
researcher bias, as it would be approved by an expert in the field.
4.9 Response rate
The response rate is the number of valid questionnaires as a percentage of the
total number of questionnaires sent; in other words, it is the number of actual
questionnaires divided by usable questionnaires (Fink, 1995). According to Baruch
(1999), there is no agreement among scholars about what is the right percentage for
the response rate and what is considered to be acceptable or not. A lower response
rate could affect the research’s reliability (Bowling, 2005).
The reason that people do not respond is simply explained by Baruch (1999)
as either the respondent’s unwillingness to participate or that he or she has not
received the questionnaire. The researcher cannot do much about the former reason,
although this research tried to convince respondents by explaining the importance of

226
their participation. Bowling (2005) added other factors that decrease the response
rate, such as the researcher’s inability to contact respondents and communication
barriers.
So the researcher needs to be aware of certain factors before conducting the
questionnaire. In order to increase the response rate, the researcher can plan his or
her visit for an appropriate time and avoid holidays (Akl et al., 2001). Furthermore,
researchers can avoid a low response rate by having good planning prior to
conducting the questionnaire, which can easily overcome a low response rate by
choosing the most suitable time (Akl et al., 2001).
There are several ways to employ a questionnaire, such as postal mail,
electronic mail, online surveys, phone interviews (Akl et al., 2011) and distributing
in person. Mail surveys show a low response rate (Baruch, 1999). Bowling (2005)
has alleged that a face-to-face interview allows the reseracher to have a higher
response rate: “A friendly interviewer on the doorstep can be motivating, and it may
be easier to convince respondents of the legitimacy of the study in person, which
should increase response rates” (Bowling, 2005, p. 285). A study conducted by
Sykes and Collins (1988, cited in Bowling, 2005) showed that response rate via face-
to-face interview is higher than the telephone method.
Ranchhod and Zhou (2001) explained why email and telephone surveys have
a low response rate, and said that it could be due to many reasons, such as:
Lack of anonymity;
Lack of formal image;
Lack of incentive; and
Lack of cosmetic features.
The response rate in this study was 25 per cent. The questionnaire was sent to
200 respondents and the number of usable returned questionnaires was 50. The low
response could be attributed to different reasons:
1. Some of the firms said that they were not interested.
227
2. Some firms said that top management does not allow them to participate due
to confidentiality, as they have had bad experiences in the past with a number
of students.
3. It was not possible to reach a large number of firms, as their details were
drawn from the industrial guide provided by the Kuwait Public Authority of
Industries (KPAI) and phone numbers and email addresses were invalid.
4. Other firms said that they were very busy as the time chosen (December-
February) was their peak season.
In the pilot test, the researcher noticed that sending the questionnaire via
email failed, as no responses were received due to the invalidity of the email
addresses and other reasons, possibly including a lack of interest from the respondent
or the lack of informality of the approach. However, to overcome this problem the
questionnaire was distributed in person, as explained in the snowball sampling
section. The author followed certain tactics to increase the response rate, including:
1. Attaching a letter from the University of Portsmouth (written by the
supervisor of this research) that contained the formal university logo;
2. Explaining the motives of the study, both on the phone and in the attached
letter;
3. Assuring the respondent anonymity and confidentiality;
4. Offering the respondents a copy of the identified results, which might help
them to improve their processed;
5. Making the questionnaire readable by using an appropriate font size, a
simple design and straightforward words;
6. Trying to make the questionnaire as short as possible; and
7. Avoiding sending the questionnaire by email without also calling the
respondents (to avoid wasting time). After sending the questionnaire by
email, the respondents were reminded about it via phone, when they were
asked whether they had received it and requested to return it. Twelve usable
questionnaires were received by email and the remaining 38 were conducted
in person.

228
4.10 Ethical considerations
According to Merriam (1998), ethical issues emerge in the data collection
process. In the management and social science disciplines, ethics are directly linked
with the integrity of the subject matter and with research (Bryman and Bell, 2007).
In qualitative studies, ethical dilemmas are likely to emerge with regard to the
collection of data and in the dissemination of findings (Merriam, 1998). In social
science or management research, this is directly related to the integrity of the
research and the subject matter (Bryman and Bell, 2007).
So in order to avoid ethical dilemmas, the researcher has to have an
agreement prior to collecting data. A cover letter outlining the motives and purpose
of the research study was sent to the participants and they were assured that their
name as well as their company would be kept anonymous and would be dealt with in
a highly confidential matter. Moreover, the researcher informed participants that they
could withdraw at any time without having to give a reason. Furthermore based on
the requirements of University of Portsmouth, the researcher has applied for an
ethical approval prior conducting the study.
4.11 Chapter summary
This research study relied on the research process explained by Saunders et al.
(2009); see Figure 4 Research process for this study (Saunders et al., 2009, p. 108).
Therefore this study is based on a position of pragmatism, and inductive and
deductive approaches were used to help reach the objectives of this research. The
mixed method was adopted to avoid the weaknesses of a single method and to
enhance credibility and validity by collecting data from multiple sources; the forms
of validity used were triangulation, expert panel and pilot test. Several techniques
were considered in this research, such as questionnaire, observation and interview,
while the strategies employed were case study and survey.
Several issues have been discussed and covered in this chapter, such as
research philosophy, approach, methodological choice, strategy and finally the
techniques and procedures used for conducting data collection and the analysis of the
data in order to justify the choice of each process in the research. Furthermore, this

229
chapter explained the tactics used to enhance the validity and to increase the
response rate. It also shows how the difficulty faced in increasing the number of
respondents was overcome, and how the bias that might have arisen was mitigated in
order to enhance the validity and reliability of this research.

230
Chapter Five Results and findings
5.1 Introduction
In this chapter, the data collected from respondents in Kuwait are discussed.
Several techniques and sources have been used for the data gathering: the first phase
used a questionnaire, the second phase entailed a semi-structured interview with 27
managers in K-SMMIs and observations in the same 27 K-SMMIs, the third phase
conducted two case studies, and the fourth phase considered suggestions from an
expert panel.
In order to answer the research questions and test the hypotheses, following
the literature review, quantitative (questionnaire and structured observation) and
qualitative (case studies, semi-structured interviews and observations) approaches
were conducted. The data were gathered from different sources, such as managers in
K-SMMIs, academics from Kuwait University, key personnel in governmental
institutions, consultants, and quality practitioners, in order to provide rich, valid and
reliable results.
The four phases made it possible to answer the research questions (RQs) and
verify the results to ensure the results’ validity and reliability. This research posits
six researches questions, as follows:
1. RQ1: How far are K-SMMIs from a lean system?
2. RQ2: What factors relating to quality and management practices inhibit K-
SMMIs from adopting a lean system?
3. RQ3: Why has a lean system not been practised within K-SMMIs to date?
4. RQ4: What is the urgency for K-SMMIs to adopt a lean system?
5. RQ5: What is the level of awareness of lean systems within K-SMMIs?
6. RQ6: What are the potential barriers and enablers for K-SMMIs to adopt a
lean system?

231
5.2 Phase one: questionnaire
The initial phase of data collection used a quantitative survey method.
Questionnaires were designed and distributed, and the responses received were
entered into SPSS software to generate different analyses such as descriptive,
Cronbach’s alpha (reliability test), Crosstab, independent sample t-test, and one-way
ANOVA. This technique made it possible to test the hypotheses and answer RQ1, as
well as to understand the demographics of the respondents to learn how certain
variables or characteristics are affecting K-SMMIs’ readiness towards LS.
The following sections discuss these aspects based on outputs generated from
SPSS advanced static software version 20. The discussions begin with demographic
details pertaining to both the companies and the respondents. No personal
information that discloses respondent identity was collected, or will be discussed
here – the data collection was anonymous.
The questionnaire was developed to collect data fit for the purpose of study,
which is exploratory and descriptive. K-SMMI firms were selected from the Kuwait
Public Authority of Industries (KPAI) database as the population. There is currently
no legal definition for K-SMEs, but they can be defined based on capital (small =
150,000 Kuwaiti Dinar (520,000 USD); medium = 150,000-500,000 Kuwaiti Dinar
(520,000 -1,7 million USD) (Hertog, 2010)). In addition, Mady (2009) defined K-
SMEs based on number of employees (small = fewer than 30 employees; medium =
31–70 employees; large = greater than 71 employees). In this research, both Hertog’s
and Mady’s definitions have been used.
The respondents involved in the survey and in the interview are plant
managers, production managers, quality managers and CEOs who are involved in
decision making and have a good knowledge of their firm’s strategy and QI, and
were willing to participate in the interview. In addition, the respondents chosen for
interview had to have had at least five years’ experience working in Kuwait to ensure
they have good knowledge and awareness of the Arabic culture, and thus would give
useful answers.
The survey questionnaire consisted of three sections: (1) company
background information, (2) information on the respondents, and (3) quality and

232
management practices used. Section 3 was divided into six constructs (47
statements): processes; planning and control; human resources; top management and
leadership; customer relations; and supplier relations. The contents of section (3)
were selected in order to assess the companies’ practices so that the preparedness
and readiness towards the adoption of LS could be identified.
In order to provide valid and reliable results, this research study used a pilot
test for both the questionnaire and the semi-structured interview questions, which
ensured that the questions were as reliable and robust as possible. Before conducting
the survey, the questionnaire and the interview questions were sent to academic
members of Kuwait University, plus 15 firms who are similar to the target
population. Their feedbacks led to some of the questions being removed or modified.
After the modifications were made, the survey was distributed to 200 K-SMMIs who
were randomly selected from the KPAI database. Valid responses were received
from 50 firms, which equated to a response rate of 25 per cent. A total of 25 of these
firms were ISO 9000 accredited.
Nordin et al. (2010) conducted a study on Malaysian manufacturing
industries; their work was based on five lean practices (processes and equipment;
manufacturing processes and control; human resources; supplier relations; and
customer relations). With respect to whether the firms in their study considered
quality and management practices to be important, the authors found that the total
mean (M) score for firms who were practising LS was 4.29, while the total mean for
non-lean firms was 2.81. This study followed a similar approach, but included top
management and leadership as a construct. Therefore, it was assumed that the total
mean score for firms who are successfully practising LS would be equal to or greater
than 4 for each of the constructs (where such a score indicates that they do consider
the constructs to be important). This will provide an understanding of whether the K-
SMMIs consider the quality and management practices as important factors for their
business.
To validate this assumption, the survey was sent to 15 successful lean
manufacturing companies (all of which are large in size) in different regions (three
from Kuwait, seven from Saudi Arabia, two from the UAE, two from Nigeria and
one from the UK) to use as a proxy. It would have been more accurate to test the

233
survey on successful lean K-SMMIs, or SMMIs from the nearby region, but this was
not possible due to a lack of K-SMMIs who are practising LS, and limitations on
time. However, the quality and management practices used in his study are derived
from different studies around the world, and it is believed that most of the elements
in the questionnaire are important to LS regardless of the firms’ size and region.
The criterion used to select the 15 firms was that they were successfully
using LS. In other words, they had to be satisfied with the results they had achieved
after LS implementation; this was verified by contacting the firms’ managers via
phone and email. The total mean score for the 15 firms was M≥4 for each construct,
which shows that lean firms regard these practices as important for LS, supporting
its use as a benchmark; this meant that firms who scored M≥4 in the main study
could be considered ready to implement LS. It should be noted that the 15 firms were
used purely to validate the assumption that a lean company would score M≥4, and
were not used for comparison purposes.
The surveys used five-item Likert scales to identify the extent to which the
company had adopted quality and management practices, and to set up valid and
reliable numeric results for statistical analysis. Five-item Likert scales were chosen
to give the participants the freedom to choose the appropriate rating for their current
situation. For the first two constructs (processes, and planning and control), the scale
was as follows: never (1), very rarely (2), sometimes (3), frequently (4) and always
(5); for the remaining constructs the scale was: strongly disagree (1), disagree (2),
neutral (3), agree (4) and strongly agree (5). The responses were entered into SPSS
software to conduct different statistical analyses, including a descriptive analysis,
Cronbach’s alpha, independent sample t-test and one-way ANOVA.
5.2.1 Demographics: Company Background
Within the section on company background, 10 variables were provided: (1)
age of company, (2) type of product produced, (3) legal structure of the company, (4)
ownership structure, (5) number of employees, (6) ISO 9000 accredited (yes/no), (7)
number of suppliers, (8) awareness of lean manufacturing system, (9) quality
practices implemented, and (10) organisation type. The analyses are discussed below
using pie and bar charts.

234
1. Firm age
The first variable was the age of the firm (in years). As shown in Figure 6,
most of the firms (86 per cent) were more than 10 years old, while 6 per cent were in
the 3–5 years age group 8 per cent were in the 5–10 group. Therefore, information
was received from companies that have been in product manufacturing in Kuwait for
many years, which suggested that their answers would be useful for the study.
Figure 6 Firm Age
2. Sector
In terms of the types of products being manufactured, most fall into Sector 2
(chemicals, petroleum products, coal and rubber) at 36 per cent, as indicated in
Figure 7. There are 32 per cent within Sector 1 (paper, paper products and printing),
and a further 18 per cent and 14 per cent in Sector 3 (non-metallic minerals except
petrol activity) and Sector 4 (metal product machinery and equipment activity),
respectively. This represents a variety of sectors, which will reveal whether the type
of product affects the use of quality practices and the firms’ readiness towards LS.
3 4
43
6.0 8.0
86.0
3-5 Years 5-10 Years Above 10 Years
Frequency Percent

235
Figure 7 Sector and Product Produced
3. Legal structure
Figure 8 displays the firms’ legal structure. There are many local companies
in Kuwait that are family-owned and operated and others who have different
ownership structures. The legal and ownership structure of the firm affects the
decision-making process and also the internal structure of the firm. From the
responses, it is clear that most of the firms are limited liability companies (52 per
cent), with the remaining 48 per cent indicating that they are shareholding firms.
16 18
9 7
32.0
36.0
18.0
14.0
Sector 1 Sector 2 Sector 3 Sector 4
Frequency Percent

236
Figure 8 Legal Structure of Company
4. Ownership structure
From Figure 9, it can be seen that most of the firms are family owned (62 per
cent) with 38 per cent non-family-owned firms. The ownership structure might affect
the firms’ performance, as well as affecting their motive for adopting QI, as shown
in Chapter 2. Using a sample consisting of 62 per cent family- and 38 per cent non-
family-owned firms will help to identify whether this factor affects readiness
towards LS.
Figure 9 Ownership Structure
5. Firm size
48%
52%
Shareholding Limited Liability
62%
38%
Family Non-family

237
Most of the firms (54 per cent) are considered as medium-sized, while 46 per
cent are small companies. This will help to support or disprove other studies that
have found a difference in terms of size between companies adopting quality
practices, and will also identify which firms – small or medium – have better
readiness towards LS.
Figure 10 Firm size
6. ISO 9000-certified and non-ISO 9000-certified firms
Figure 11 indicates that 50 per cent of the firms are ISO 9000 certified. This
indicates that some kinds of quality and management practices are being
implemented and used in these firms. This will help in drawing a comparison
between these firms to see if ISO 9000 has an impact on LS readiness.
46%
54%
Small Medium

238
Figure 11 ISO 9000 and non-ISO 9000-certified firms
7. Number of suppliers
Suppliers are key players with respect to LS, as was shown in the literature
review chapter, since having strong relations with suppliers could help organisations
to more easily manage their resources. Number of the suppliers can also be a factor
in building strong relations, and many researchers have advised that maintaining a
small number of suppliers leads to more effective LS.
Based on the results in Figure 12, it can be seen that 96 per cent of the firms
had more than five suppliers, followed by 2 per cent who indicated that they have
less than three, and a further 2 per cent stating that they have between three and five.
This factor may affect their supplier relations, and this will be examined in the
following sections.
50% 50%
Yes No

239
Figure 12 Number of suppliers
8. Awareness of lean system
One of the most prominent questions of this research is provided in Figure
13. This research is about LS, and from the results it can be seen that only 28 per
cent indicated a knowledge of LS.
Figure 13 Awareness of lean system
1 1
48
2.0 2.0
96.0
Less than 3 3-5 Above 5
Frequency Percent
28%
72%
Yes No
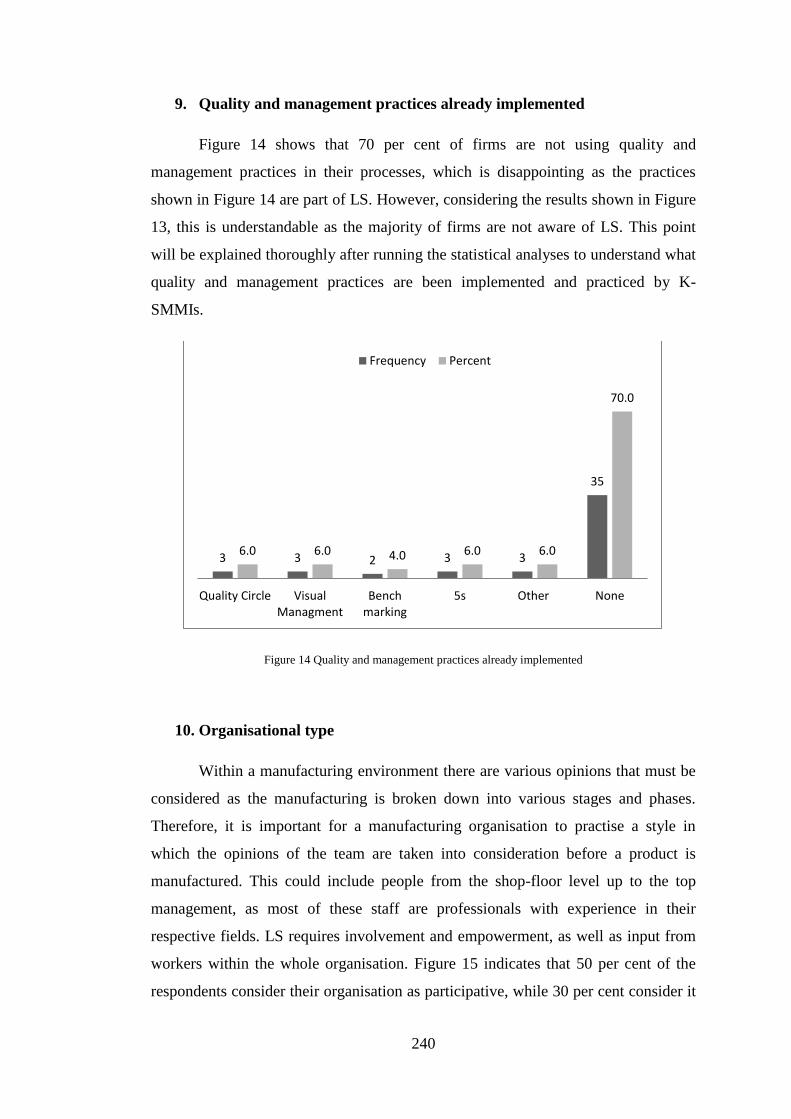
240
9. Quality and management practices already implemented
Figure 14 shows that 70 per cent of firms are not using quality and
management practices in their processes, which is disappointing as the practices
shown in Figure 14 are part of LS. However, considering the results shown in Figure
13, this is understandable as the majority of firms are not aware of LS. This point
will be explained thoroughly after running the statistical analyses to understand what
quality and management practices are been implemented and practiced by K-
SMMIs.
Figure 14 Quality and management practices already implemented
10. Organisational type
Within a manufacturing environment there are various opinions that must be
considered as the manufacturing is broken down into various stages and phases.
Therefore, it is important for a manufacturing organisation to practise a style in
which the opinions of the team are taken into consideration before a product is
manufactured. This could include people from the shop-floor level up to the top
management, as most of these staff are professionals with experience in their
respective fields. LS requires involvement and empowerment, as well as input from
workers within the whole organisation. Figure 15 indicates that 50 per cent of the
respondents consider their organisation as participative, while 30 per cent consider it
3 3 2 3 3
35
6.0 6.0 4.0 6.0 6.0
70.0
Quality Circle VisualManagment
Benchmarking
5s Other None
Frequency Percent

241
to be bureaucratic and 18 per cent consultative. The participative style could work
very well within the LS environment, as it welcomes teamwork and input from
employees across all levels within the organisation. However, this is of course
subject to certain practices, and the questionnaire was intended to identify whether
the K-SMMIs are using a participative style.
Figure 15 Organisational Type
5.2.2 Demographics: Respondent Background
The respondent section had six variables: (1) gender, (2) total years of
experience, (3) years of employment with the current firm, (4) current job
position/title, and (5) education level. These are discussed here using bar and pie
charts.
1. Gender
Based on Figure 16, most of the respondents are male (96 per cent), which is
probably due to the physical demands that manufacturing sectors place on
employees.
1
15
9
25
2.0
30.0
18.0
50.0
Exploitive Bureaucratic Consultative Participative
Frequency Percent

242
Figure 16 Gender
2. Total years of experience
Based on the results in Figure 17, 76 per cent of the respondents have
had experience of over 10 years. This is promising in terms of the aims of the
present research, as the results will come from people who are highly
experienced in the field, which will contribute on the validity of the
outcomes.
Figure 17 Years of Experience
96%
4%
Male Female
1 2
9
38
2.0 4.0
18.0
76.0
Less than 3 Years 3-5 Years 5-10 Years Above 10 Years
Frequency Percent

243
3. Years of employment in this firm
This question was asked to ensure that results were coming from people who
had a good level of knowledge about their companies. Figure 18 indicates that the
majority of the respondents (38 per cent) had more than 10 years’ experience in their
current position, which again gives confidence that the answers are coming from
people who know what they are talking about.
Figure 18 Years of employment in this firm
4. Job position/current title
Figure 19 displays the job positions of the respondents. In the questionnaire,
the following job positions/titles were provided in addition to an “others” category:
CEO/managing director; quality control manager; production manager; inventory
manager; and supervisor. Responses were received only for production manager (74
per cent), CEO/managing director (10 per cent), quality control manager; and
supervisor (8 per cent each). It can be said that the questionnaire was completed by
key personnel within the firm, who must therefore be aware of the firm’s strategy
and the key aspects addressed in this study.
14
10 7
19
28.0
20.0
14.0
38.0
Less than 3 3-5 Years 5-10 Years Above 10 Years
Frequency Percent

244
Figure 19 Job position/current title
5. Education level
As per the education levels shown in Figure 20, most of the respondents (82
per cent) have a bachelor’s degree, followed by 10 per cent with a master’s/PhD.
Again, this increases confidence that the questionnaire was answered by well-
educated people.
Figure 20 Education Level
5 4
37
4 10.0 8.0
74.0
8.0
CEO/ managingdirector
Quality controlmanager
Production manager Supervisor
Frequency Percent
5
41
1 2 10.0
82.0
2.0 4.0
Master’s/PhD Bachelor's degree High school Other
Education Level
Frequency Percent
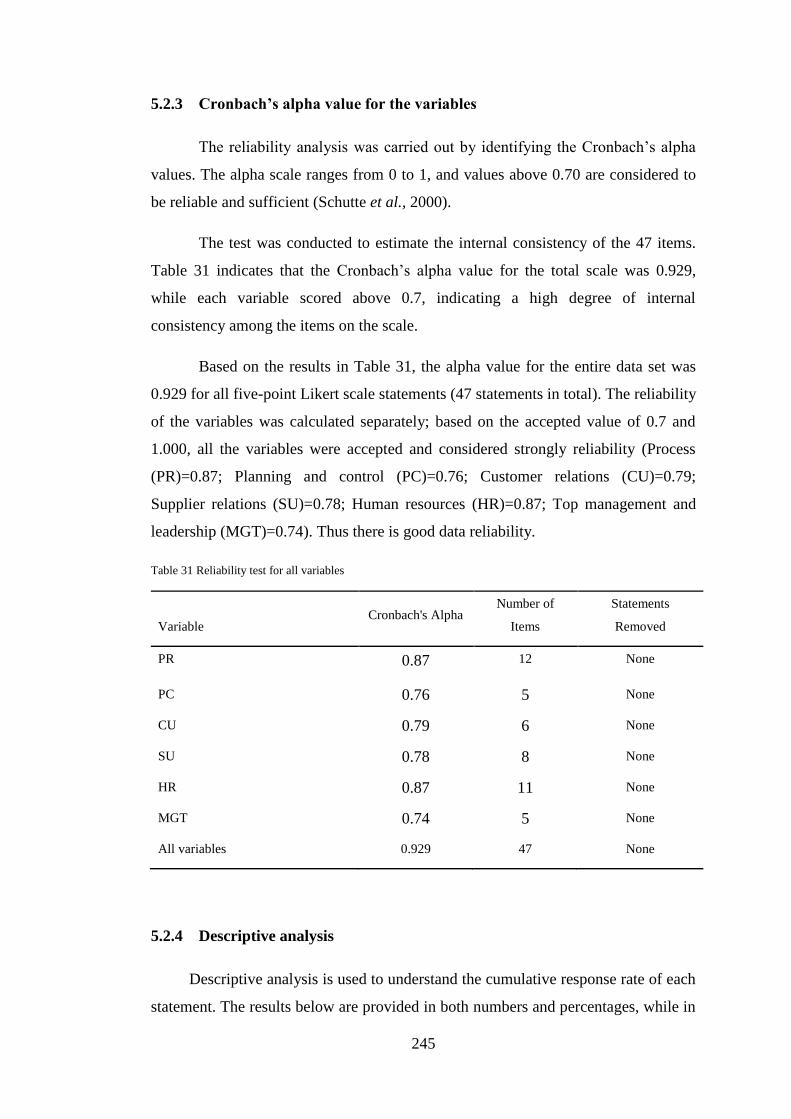
245
5.2.3 Cronbach’s alpha value for the variables
The reliability analysis was carried out by identifying the Cronbach’s alpha
values. The alpha scale ranges from 0 to 1, and values above 0.70 are considered to
be reliable and sufficient (Schutte et al., 2000).
The test was conducted to estimate the internal consistency of the 47 items.
Table 31 indicates that the Cronbach’s alpha value for the total scale was 0.929,
while each variable scored above 0.7, indicating a high degree of internal
consistency among the items on the scale.
Based on the results in Table 31, the alpha value for the entire data set was
0.929 for all five-point Likert scale statements (47 statements in total). The reliability
of the variables was calculated separately; based on the accepted value of 0.7 and
1.000, all the variables were accepted and considered strongly reliability (Process
(PR)=0.87; Planning and control (PC)=0.76; Customer relations (CU)=0.79;
Supplier relations (SU)=0.78; Human resources (HR)=0.87; Top management and
leadership (MGT)=0.74). Thus there is good data reliability.
Table 31 Reliability test for all variables
Variable Cronbach's Alpha
Number of
Items
Statements
Removed
PR 0.87 12 None
PC 0.76 5 None
CU 0.79 6 None
SU 0.78 8 None
HR 0.87 11 None
MGT 0.74 5 None
All variables 0.929 47 None
5.2.4 Descriptive analysis
Descriptive analysis is used to understand the cumulative response rate of each
statement. The results below are provided in both numbers and percentages, while in

246
some cases the positive results were accumulated (e.g. “strongly agree” added to
“agree”) and compared with the total negative results (e.g. “strongly disagree”
combined with “disagree”) to give a better understanding and a clearer picture. The
discussion will be based on the percentage figures.
1. Process (PR)
Table 32 shows the total mean for the 12 statements within the “process”
variable (PR01, PR02, PR03, PR04, PR05, PR06, PR07, PR08, PR09, PR10, PR11,
and PR12). Based on the five-point Likert scale (1= Never; 2= Very rarely; 3=
Sometimes; 4= Frequently; 5= Always), the mean results indicate that most of the
responses fall into the “Sometimes” category. Further, Table 33 shows the mean (M)
and standard deviation (SD) values for the 12 items; from this table it can be seen
that PR01 is most frequently practised by K-SMMIs, while PR10 is the least
practised.
Table 32 Process summary item statistics
Mean Minimum Maximum Range Maximum/
Minimum
Variance N of
Items
Item
Means 3.07 1.58 4.18 2.60 2.64 0.448 12
Table 33 Process: mean and standard deviation for each item
PR01 PR02 PR03 PR04 PR05 PR06 PR07 PR08 PR09 PR10 PR11 PR12
M 4.18 2.84 2.82 3.82 2.96 3.1 3.02 3.78 3.02 1.58 2.56 3.2
SD 1.11 1.40 1.69 1.36 1.79 1.51 1.59 1.25 1.47 .73 1.55 1.62
In order for K-SMMIs to be ready for LS, they need to have good processes
in place in terms of having an organised workplace and cellular manufacturing;
processes that follow a flow and are based on customer demands; clear standards;
and thorough records of important figures, such as cycle time, so that they can
monitor and improve. Equally important is that they must follow a clear strategy to
keep their machines and equipment in good working condition. The next section will
shed the light on how K-SMMIs are doing with respect to their processes.

247
Within the “Process” variable, 12 items related to the processes are followed
by K-SMMIs are discussed. Table 34 shows the results obtained from K-SMMIs for
each element. This begins with PR01, which aimed to identify whether the firms
divide their workplace based on the requirements of the task. Based on the
responses, most of the firms (50 per cent) “Always” use such division, while 36 per
cent “Frequently” do. This indicates that the most of the firms divide their
workplaces based on tasks, and that each zone has a specific job to do. In turn, this
reveals that the various processes are split across different workplaces, with each of
the designated areas having specific work to do in most of the K-SMMIs. The
processes are organised in such a way that sections are associated with each other
seamlessly and jobs that have similar functions are close to each other. The basic
structure of the manufacturing segment can be understood from these responses, and
is also a positive indication as LS requires designation in order to cut wastes such as
motion, which might result from workers’ movement during the process.
PR02 will reveal whether the firms are following the cellular manufacturing
method, which is a key part of LS. In this regard, 38 per cent of the respondents
showed that they “Very rarely” use cellular manufacturing, and 18 per cent selected
“Never”, which means that 56 per cent in total provided negative responses (i.e. the
K-SMMIs either have never, or have rarely, used cellular manufacturing). On the
other hand, 44 per cent of the firms’ respondents replied positively in relation to
cellular manufacturing; 30 per cent selected “Frequently”, and 14 per cent chose
“Always”. In summary, this means that some of the firms use cellular manufacturing
and the rest do not.
PR03 shows that the working zone and the processes are not run by highly
qualified or well-trained workers, as the 32 per cent of the respondents showed that
they do not have skilled people in this regard. If the negative responses are added
together, the result is 58 per cent who do not use skilled people to run their
processes; on the other hand, 42 per cent of the firms stated that their processes are
run by skilled people. Skilled people are highly required within LS.
One foundation of LS is 5s, which can be adapted to many different forms –
one of which refers to equipment and items, and states that the working area should
have the required equipment only. From PR04, the majority of firms (40 per cent)

248
were found to “Always” follow this maxim, while 36 per cent do so “frequently”,
which indicate that the firms do consider this factor as an important part of their
processes.
PR05 shows that production within the firms is not based on demand from
the next station or the next stage of the process, as 38 per cent selected “Never” in
this regard and 12 per cent chose “Very rarely”, which is not positive as it could
result in buffering or miscommunication between stations. LS insists on working
based on demand – either from the next stage or from the customer – and in this case
the K-SMMIs are missing this point, which causes wastes and results in non-value-
added activities, in contrast with lean principles.
For PR06 48 per cent of the respondents selected “Frequently” and 14 per
cent chose “Always”, which means that K-SMMIs ensure that they return equipment
and items back to where they belong by assigning them to specific people, which
helps to maintain a smooth workflow and makes things easier for the next shift. This
is a form of 5s, which represents a key aspect of LS.
In order for firms to avoid machine and equipment breakdown they must
have planned maintenance, since TPM is a key aspect of LS. In PR07 it was shown
that 32 per cent of the firms “Frequently” have such a system in place, while 14 per
cent “Always” do. On the other hand, 46 per cent of the firms indicated negatively in
response to this – i.e. 28 per cent chose “Never” and 18 “Very rarely”. This yields a
mixed response, as more than half of the firms show a great awareness towards
maintaining their machines by posting equipment maintenance records, while 46 per
cent are ignoring this aspect. However, PR10 shows that the vast majority of the
firms (52 per cent) who selected “Never” and “Very rarely” (42 per cent) do not
have scheduled maintenance times. This means that the K-SMMIs do not have a
great awareness of TPM.
The results for PR08 show that the process flow of material and equipment
are smooth, as the equipment is grouped based on similar operations; this can be
understood from the fact that 82 per cent (56 frequently + 26 always) of firms have
continuous flow.

249
Production based on customer demand is one of the prime objectives of LS,
and entails using “pull” and “JIT”. LS requires firms to work based on customer
demand and to do only what the customer has asked for, while pull is one of main
lean principles. From the responses to PR09 it can be seen that 60 per cent (50
Frequently + 10 Always) of the firms are working based on customer demand, and
this is highly positive for K-SMMIs.
Documentation is important for LS. From the responses to PR11 it can be
seen that there is no proper documentation within most of the K-SMMIs, as 60 per
cent (38 Never + 22 Very rarely) suggested that they do not have a documentation
system for machine and equipment, while 40 per cent do have a well documented
system for keeping machine records and configuration notes. Keeping a record of
cycle time is very important in terms of monitoring the process pace, and the results
of PR12 show that 56 per cent of the firms are monitoring the cycle time for each
product. However, 40 per cent are not keeping records of the cycle time, which gives
a mixed response overall. This should be investigated at a later stage.
This variable highlights many negative and positive practices carried out
within K-SMMIs, but when looking at the bigger picture it is possible to see that
many things need to be considered by K-SMMIs that are important towards LS. For
example, the overall M score lies in the “Sometimes” range, and this is not a good
indicator that firms are ready for LS. Some of these aspects relate to TPM, which
should be run by skilled workers, and documentation, which is also important and
required by LS. In addition, failure to address these issues will affect other
operations; in other words, machines might work well, but will not last forever
unless there is periodic maintenance, and, in order to avoid the breakdown or
malfunction of the machine and equipment, there is a need to have a proper
maintenance system in place.

250
Table 34 Descriptive statistics for process variables
Items Never Very Rarely Sometimes Frequently Always
Frequency % Frequency % Frequency % Frequency % Frequency %
PR01 The workshop is divided into different workplaces and
each zone has a specific task.
2 4 5 10 0 0 18 36 25 50
PR02 The processes used within similar operations are placed
close to each other in order to eliminate unnecessary
steps.
9 18 19 38 0 0 15 30 7 14
PR03 Each working zone is controlled and operated by
qualified and well-trained workers. 16 32 13 26 0 0 6 12 15 30
PR04 Each item/piece of equipment is labelled to ensure it is
located in the right zone/location in the workplace. 5 10 7 14 0 0 18 36 20 40
PR05 Production at each station is pulled by demand from the
next station. 19 38 6 12 0 0 8 16 17 34
PR06 A certain person is assigned as a part of his daily
activities to ensure that the workplace is clean and all
tools/pieces of equipment are put back in their
appropriate places.
14 28 5 10 0 0 24 48 7 14
PR07 Equipment maintenance records are posted on the shop
floor to be actively shared with employees. 14 28 9 18 0 0 16 32 11 22
PR08 The process flow of material and components is smooth
and continuous, as the equipment is grouped.
6 12 3 6 0 0 28 56 13 26
PR09 Products are not produced unless orders for them are
received from customers. 14 28 6 12 0 0 25 50 5 10
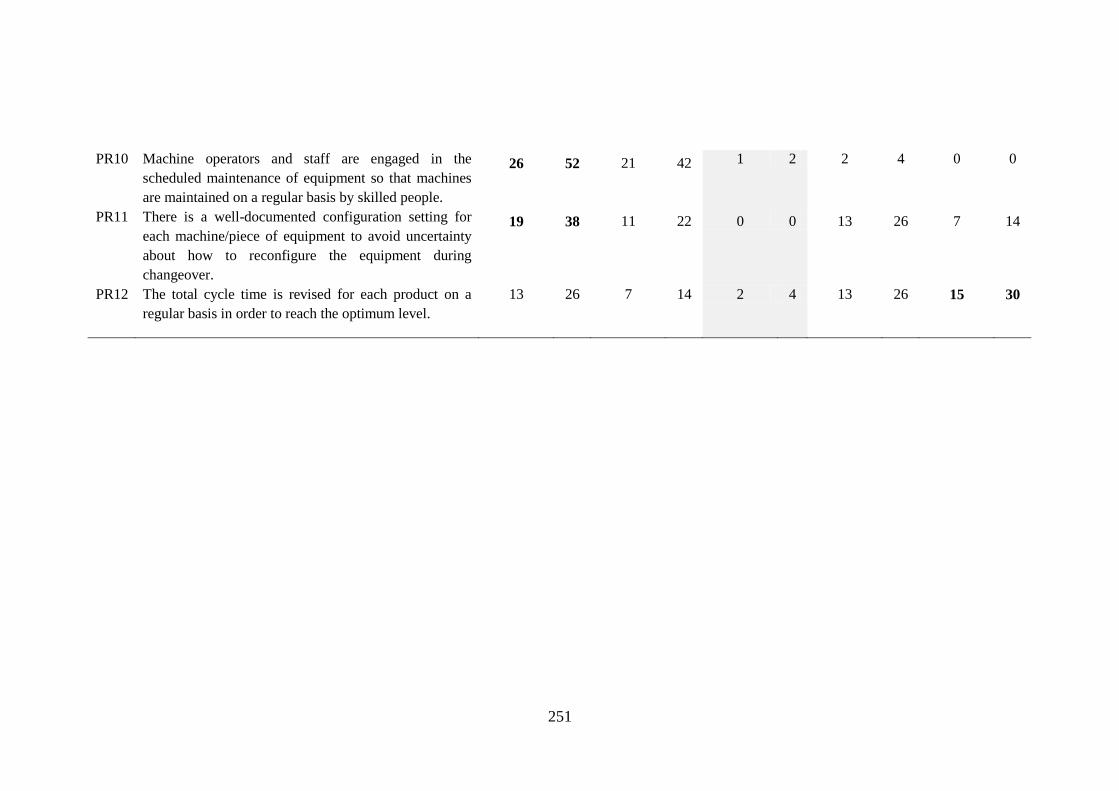
251
PR10 Machine operators and staff are engaged in the
scheduled maintenance of equipment so that machines
are maintained on a regular basis by skilled people.
26 52 21 42 1 2 2 4 0 0
PR11 There is a well-documented configuration setting for
each machine/piece of equipment to avoid uncertainty
about how to reconfigure the equipment during
changeover.
19 38 11 22 0 0 13 26 7 14
PR12 The total cycle time is revised for each product on a
regular basis in order to reach the optimum level.
13 26 7 14 2 4 13 26 15 30
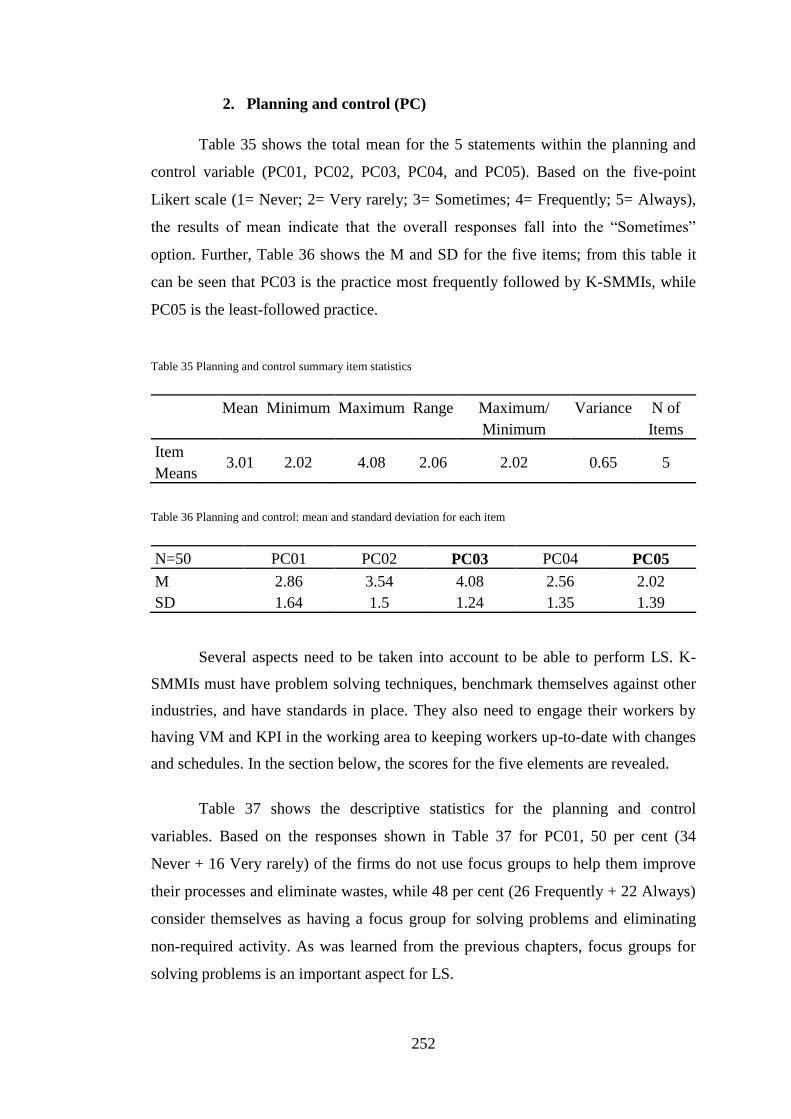
252
2. Planning and control (PC)
Table 35 shows the total mean for the 5 statements within the planning and
control variable (PC01, PC02, PC03, PC04, and PC05). Based on the five-point
Likert scale (1= Never; 2= Very rarely; 3= Sometimes; 4= Frequently; 5= Always),
the results of mean indicate that the overall responses fall into the “Sometimes”
option. Further, Table 36 shows the M and SD for the five items; from this table it
can be seen that PC03 is the practice most frequently followed by K-SMMIs, while
PC05 is the least-followed practice.
Table 35 Planning and control summary item statistics
Mean Minimum Maximum Range Maximum/
Minimum
Variance N of
Items
Item
Means 3.01 2.02 4.08 2.06 2.02 0.65 5
Table 36 Planning and control: mean and standard deviation for each item
N=50 PC01 PC02 PC03 PC04 PC05
M 2.86 3.54 4.08 2.56 2.02
SD 1.64 1.5 1.24 1.35 1.39
Several aspects need to be taken into account to be able to perform LS. K-
SMMIs must have problem solving techniques, benchmark themselves against other
industries, and have standards in place. They also need to engage their workers by
having VM and KPI in the working area to keeping workers up-to-date with changes
and schedules. In the section below, the scores for the five elements are revealed.
Table 37 shows the descriptive statistics for the planning and control
variables. Based on the responses shown in Table 37 for PC01, 50 per cent (34
Never + 16 Very rarely) of the firms do not use focus groups to help them improve
their processes and eliminate wastes, while 48 per cent (26 Frequently + 22 Always)
consider themselves as having a focus group for solving problems and eliminating
non-required activity. As was learned from the previous chapters, focus groups for
solving problems is an important aspect for LS.

253
As it stands, the percentages of PC01 are almost the same, which means that
nearly half of the firms are following the right steps towards LS. The responses to
PC04 reveal more about the problem-solving techniques used in K-SMMIs; they
show that the majority of firms do not follow clear problem-solving techniques,
however 44 per cent do.
With regard to benchmarking, responses to PC02 reveal that 72 per cent (40
Frequently + 30 Always) of the firms are aware of the top-class firms around them,
and are benchmarking themselves against them, which again represents a great
awareness from the firms of ways in which to improve. Moreover, Table 37 shows,
in response to PC03, that the vast majority of the firms are following clear standards
in terms of where to load raw materials and removing end products. This shows
some positive aspects of K-SMMIs with respect to LS, as LS requires an
understanding of the standards and benchmarking against other firms.
The results for PC05 also show that the vast majority of the firms are not
using VM or KPIs on the shop floor, or maybe do not consider these to be an
important aspect of their processes. VM is a key aspect of LS; it helps to make
everything visible in the workplace, while preventing employees from wasting their
time searching for information by making the right information visible to everyone.
This variable demonstrates a mix of responses, some of which were good and
supportive of LS, while others were unsupportive. From the total M score for this
variable, it can be seen that it lies within the “Sometimes” part of the scale. In order
for the K-SMMIs to be ready for LS, they must get most practices right, as these
practices represent a foundation for LS, as discussed in Chapters 2 and 4.
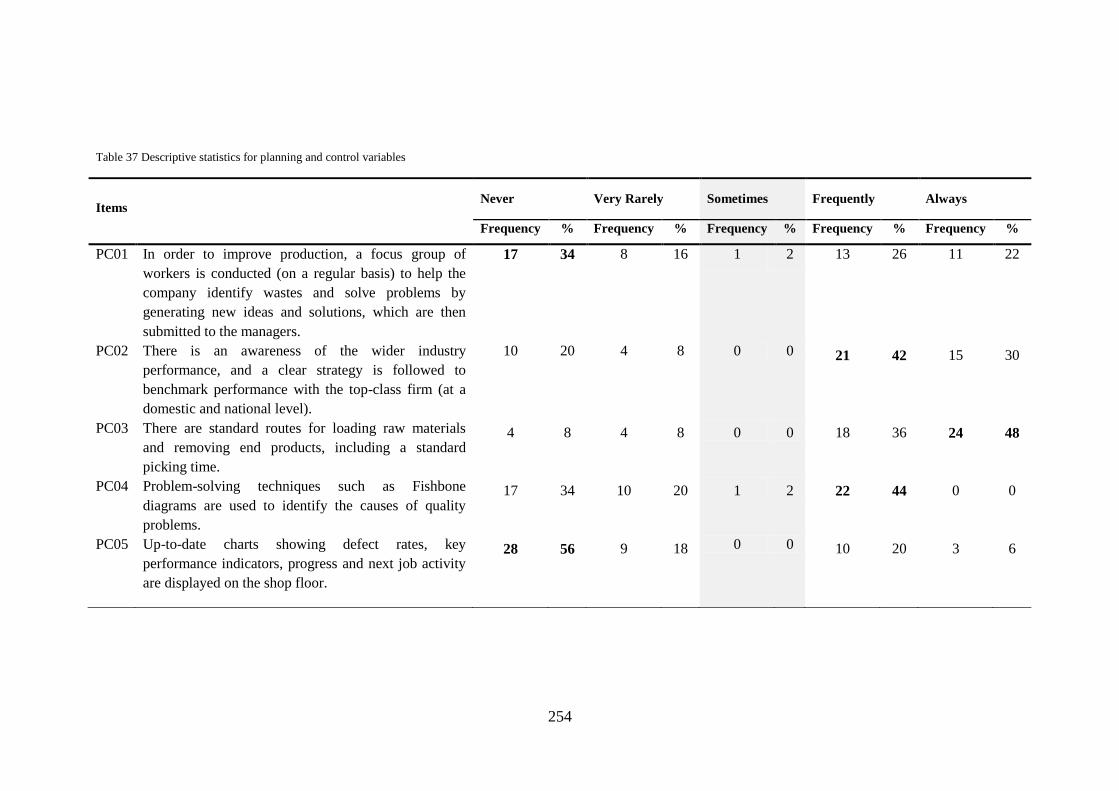
254
Table 37 Descriptive statistics for planning and control variables
Items Never Very Rarely Sometimes Frequently Always
Frequency % Frequency % Frequency % Frequency % Frequency %
PC01 In order to improve production, a focus group of
workers is conducted (on a regular basis) to help the
company identify wastes and solve problems by
generating new ideas and solutions, which are then
submitted to the managers.
17 34 8 16 1 2 13 26 11 22
PC02 There is an awareness of the wider industry
performance, and a clear strategy is followed to
benchmark performance with the top-class firm (at a
domestic and national level).
10 20 4 8 0 0 21 42 15 30
PC03 There are standard routes for loading raw materials
and removing end products, including a standard
picking time.
4 8 4 8 0 0 18 36 24 48
PC04 Problem-solving techniques such as Fishbone
diagrams are used to identify the causes of quality
problems.
17 34 10 20 1 2 22 44 0 0
PC05 Up-to-date charts showing defect rates, key
performance indicators, progress and next job activity
are displayed on the shop floor.
28 56 9 18 0 0 10 20 3 6

255
3. Customer relations (CU)
Table 38 shows the total mean for the six statements within the customer
relations variable (CU01, CU02, CU03, CU04, CU05, and CU06). Based on the
five-point Likert scale (1= Strongly disagree; 2= Disagree; 3= Neutral; 4= Agree;
5=Strongly agree), the mean results indicate that, overall, the responses fall into the
“Disagree” end of the scale. Further, Table 39 shows the M and SD scores for the six
items; from this table it can be seen that CU01 is the practice most frequently
followed by K-SMMIs while CU06 is the least-followed practice.
Table 38 Customer relations summary item statistics
Mean Minimum Maximum Range Maximum/
Minimum
Variance N of
Items
Item
Means 2.46 2.06 3.96 1.9 1.92 0.54 6
Table 39 Customer relations: mean and standard deviation for each item
CU01 CU02 CU03 CU04 CU05 CU06
M 3.96 2.22 2.16 2.16 2.2 2.06
SD 1.19 1.14 1.20 .997 0.98 1.09
Customer satisfaction is one of the strongest objectives for any organisation.
Maintaining good relations with customers is always good for keeping them happy.
LS requires organisations to produce based on customer demand, and to know
exactly what the customer is will to pay for. In order to do this, K-SMMIs must have
strong relations with customers by engaging them in the product design, inviting
them to the workplace, conducting surveys, taking customer feedback seriously, and
incorporating feedback and complaints. In the following section, the responses
obtained from the K-SMMIs are highlighted for the six elements related to customer
relations.
Table 40 shows the descriptive statistics for customer relations variables. The
responses to CU01 show that the vast majority of the firms agreed to having good
customer awareness and knowing what their customers are willing to pay for, which
is highly required by LS. However, the responses to CU02 show otherwise, as 78 per

256
cent of the firms do not have great communication with their customers in terms of
taking customer feedback, meeting with customers, and conducting surveys.
Further, Table 40 shows that with regard to customer involvement (CU03),
74 per cent of the firms are not involving their customers in the product design, and
this may affect the firm’s understanding of the customer needs.
Similarly, in CU04 the responses show that the vast majority of the firms are
not inviting their customers to their plant, which again indicates a weak relationship
between the firms and their customers. On the other hand, the customer are not
helping the firms, as the responses to CU05 show that 80 per cent of the firms
suggested that their customers are not sharing their future plans with the firms’
management. This could be a result of the fact that the firms do not heavily involve
their customers in their plans either, and do not work hard to build relations with
customers, as can be seen from their responses to CU02, CU03, and CU04.
Finally, in response to CU06, it can be seen that the firms do not have proper
systems in place to collect customer complaints. Dealing with customer complaints
is always good to build relationships with customers, and failures in this regard
might lead losing customers.
This variable shows many negative practices by K-SMMIs that are not
supportive of LS, as it can be observed that the total M score lies on the “Disagree”
end of the scale. Customers are key players for LS, and keeping tight relations with
them leads to many good things that firms can benefit from. However, maintaining
strong relations with customers requires huge efforts from firms. As it stands, K-
SMMIs are not doing enough to maintain good customer relations.

257
Table 40 Descriptive variables for customer relations variables
Items
Strongly
Disagree Disagree Neutral Agree Strongly Agree
Frequency % Frequency % Frequency % Frequency % Frequency %
CUO1 There is an awareness of what product features
customers value and are willing to pay for. 4 8 4 8 0 0 24 48 18 36
CUO2 Feedback is sought regularly, and surveys/meetings
are often held with customers to improve product
design and quality, and service.
13 26 26 52 0 0 9 18 2 4
CUO3 Customers participate in the initial design process. 18 36 19 38 1 2 11 22 1 2
CUO4 Valued customers are brought in to visit the plant in
order to give them some ideas about quality control
that the company can follow.
11 22 29 58 2 4 7 14 1 2
CUO5 Customers help the company by providing
information about their future demands. 10 20 30 60 0 0 10 20 0 0
CUO6 There is a system in place for collecting customer
complaints so that problems can be avoided in the
future.
18 36 21 42 1 2 10 20 0 0
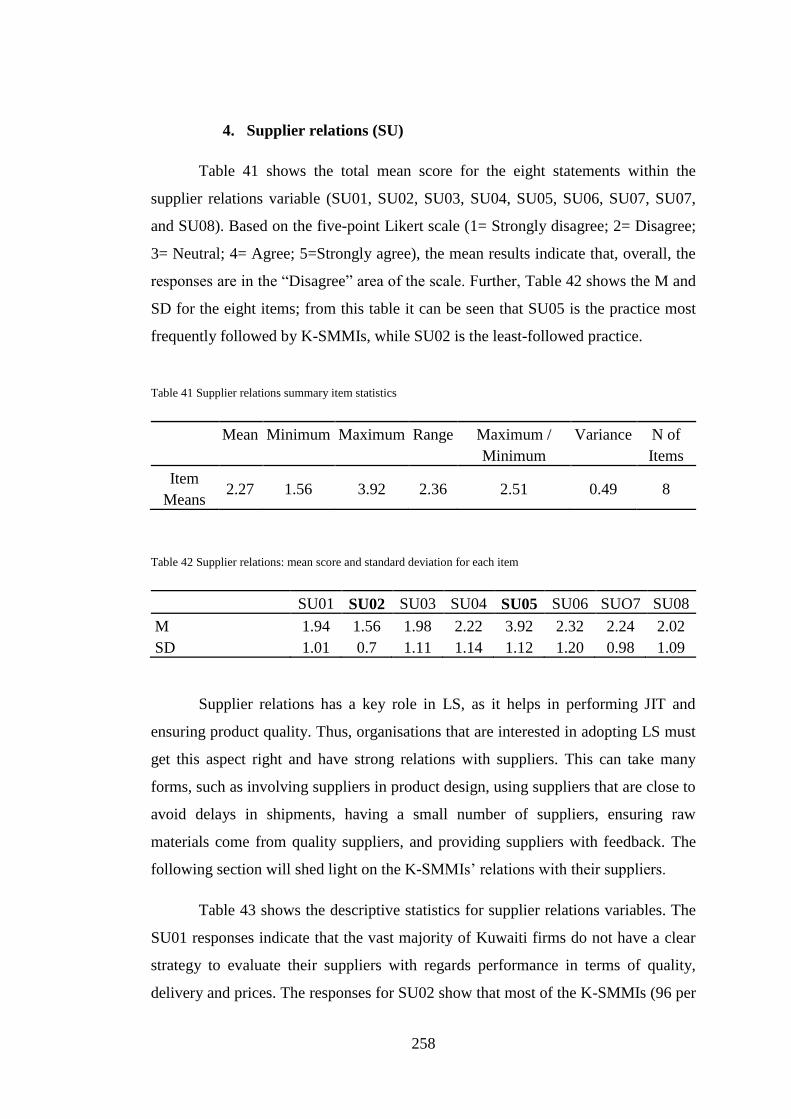
258
4. Supplier relations (SU)
Table 41 shows the total mean score for the eight statements within the
supplier relations variable (SU01, SU02, SU03, SU04, SU05, SU06, SU07, SU07,
and SU08). Based on the five-point Likert scale (1= Strongly disagree; 2= Disagree;
3= Neutral; 4= Agree; 5=Strongly agree), the mean results indicate that, overall, the
responses are in the “Disagree” area of the scale. Further, Table 42 shows the M and
SD for the eight items; from this table it can be seen that SU05 is the practice most
frequently followed by K-SMMIs, while SU02 is the least-followed practice.
Table 41 Supplier relations summary item statistics
Mean Minimum Maximum Range Maximum /
Minimum
Variance N of
Items
Item
Means 2.27 1.56 3.92 2.36 2.51 0.49 8
Table 42 Supplier relations: mean score and standard deviation for each item
SU01 SU02 SU03 SU04 SU05 SU06 SUO7 SU08
M 1.94 1.56 1.98 2.22 3.92 2.32 2.24 2.02
SD 1.01 0.7 1.11 1.14 1.12 1.20 0.98 1.09
Supplier relations has a key role in LS, as it helps in performing JIT and
ensuring product quality. Thus, organisations that are interested in adopting LS must
get this aspect right and have strong relations with suppliers. This can take many
forms, such as involving suppliers in product design, using suppliers that are close to
avoid delays in shipments, having a small number of suppliers, ensuring raw
materials come from quality suppliers, and providing suppliers with feedback. The
following section will shed light on the K-SMMIs’ relations with their suppliers.
Table 43 shows the descriptive statistics for supplier relations variables. The
SU01 responses indicate that the vast majority of Kuwaiti firms do not have a clear
strategy to evaluate their suppliers with regards performance in terms of quality,
delivery and prices. The responses for SU02 show that most of the K-SMMIs (96 per

259
cent) do not see dealing with local suppliers as an advantage for their business.
Using proximally close suppliers (i.e. local suppliers) is always good to help firms
receive the required items and materials on time, and this is essential for JIT and for
keeping low levels of inventory, since instead of ordering safety stock the firm can
order only the required items and materials; of course, this requires strong relations
with suppliers. Whereas for international suppliers, orders have to be placed with due
consideration of time, and adequate stock has to be maintained by the manufacturers
as backup.
Further, from the responses to SU03 it can be seen that the K-SMMIs are not
involving their suppliers in their product design, as is shown from the high
percentage (82 per cent) of responses in this regard. By involving suppliers in
product design the firms can save a lot, as the suppliers might be able to provide the
firm with a better solution which could save them time and effort, along with better-
quality products. K-SMMIs seem to be missing this important aspect.
With regard to the quality of suppliers, most of the K-SMMIs agreed that
they are not receiving good materials from their suppliers, as shown from the SU04
responses. This results in carrying out inspections for each delivery, which of course
is considered a waste as far as LS is concerned, as this step does not add value to the
end customer.
Similarly, most of the firms agree that they are not receiving materials at the
right time, and this can be seen from the responses to SU06, as 72 per cent of the
firms said that they are not happy with their deliveries. Further, the responses to
SU05 reveal that most of the K-SMMIs (80 per cent) are working towards reducing
their numbers of supplier; as far as LS is concerned, this step will help the firms to
build better relations with suppliers, as focusing on keeping the number of suppliers
low might help to improve service and quality.
Sometimes dealing with suppliers is not an easy task, and the firms are not
only ones to be blamed for the failures in terms of good relations. In SU07, most of
the firms (78 per cent) said that their suppliers are not cooperative towards
maintaining long relationships. However, from the responses to SU08 it can be seen
that the K-SMMIs are also not doing enough to keep the relationship tight, since the

260
responses to this question show that 80 per cent of the firms are not providing their
suppliers with feedback.
This variable indicates a lot of negatives towards LS, as can been seen from
the total M score, which lies on the “Disagree” end of the scale. In order for any
organisation to implement LS it must have a great relationship with its suppliers, but
in the Kuwaiti case this is not reflected.

261
Table 43 Descriptive statistics for supplier relations variable
Items
Strongly
Disagree Disagree Neutral Agree Strongly Agree
Frequency % Frequency % Frequency % Frequency % Frequency %
SU01 A clear strategy is in place by which to evaluate
supplier performance in terms of quality, delivery and
prices.
19 38 23 46 0 0 8 16 0 0
SU02 Local suppliers are used to avoid shipment delays. 26 52 22 44 0 0 2 4 0 0
SU03 Suppliers are aware of product designs and participate
heavily during design and development. 20 40 21 42 0 0 8 16 1 2
SU04 Raw materials and purchased parts are not subject to
incoming inspection as they come from qualified
suppliers.
13 26 26 52 0 0 9 18 2 4
SU05 Active steps are taken to reduce the number of
suppliers in each category. 4 8 3 6 0 0 29 58 14 28
SU06 Raw materials are received on time from the date of
order. 13 26 23 46 1 2 11 22 2 4
SU07 Suppliers are cooperative and committed to
maintaining a long-term relationship. 9 18 30 60 1 2 10 20 0 0
SU08 Suppliers are provided with feedback regarding quality
and delivery performance. 19 38 21 42 0 0 10 20 0 0
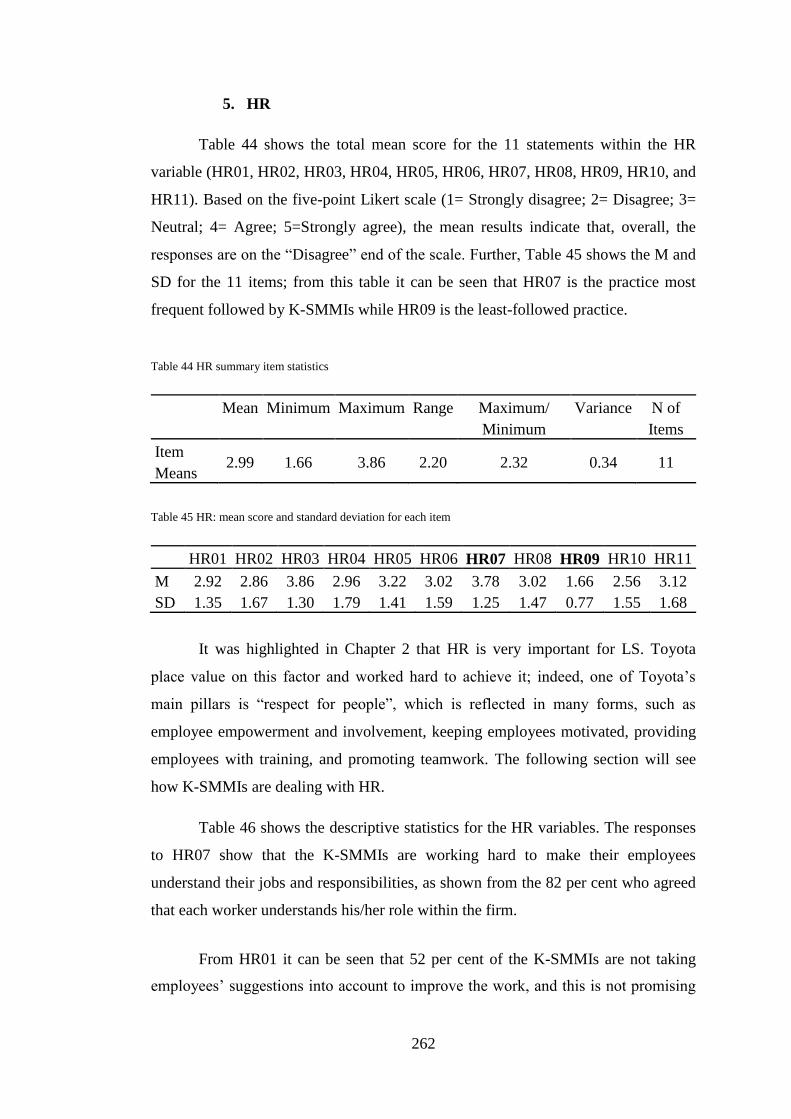
262
5. HR
Table 44 shows the total mean score for the 11 statements within the HR
variable (HR01, HR02, HR03, HR04, HR05, HR06, HR07, HR08, HR09, HR10, and
HR11). Based on the five-point Likert scale (1= Strongly disagree; 2= Disagree; 3=
Neutral; 4= Agree; 5=Strongly agree), the mean results indicate that, overall, the
responses are on the “Disagree” end of the scale. Further, Table 45 shows the M and
SD for the 11 items; from this table it can be seen that HR07 is the practice most
frequent followed by K-SMMIs while HR09 is the least-followed practice.
Table 44 HR summary item statistics
Mean Minimum Maximum Range Maximum/
Minimum
Variance N of
Items
Item
Means 2.99 1.66 3.86 2.20 2.32 0.34 11
Table 45 HR: mean score and standard deviation for each item
HR01 HR02 HR03 HR04 HR05 HR06 HR07 HR08 HR09 HR10 HR11
M 2.92 2.86 3.86 2.96 3.22 3.02 3.78 3.02 1.66 2.56 3.12
SD 1.35 1.67 1.30 1.79 1.41 1.59 1.25 1.47 0.77 1.55 1.68
It was highlighted in Chapter 2 that HR is very important for LS. Toyota
place value on this factor and worked hard to achieve it; indeed, one of Toyota’s
main pillars is “respect for people”, which is reflected in many forms, such as
employee empowerment and involvement, keeping employees motivated, providing
employees with training, and promoting teamwork. The following section will see
how K-SMMIs are dealing with HR.
Table 46 shows the descriptive statistics for the HR variables. The responses
to HR07 show that the K-SMMIs are working hard to make their employees
understand their jobs and responsibilities, as shown from the 82 per cent who agreed
that each worker understands his/her role within the firm.
From HR01 it can be seen that 52 per cent of the K-SMMIs are not taking
employees’ suggestions into account to improve the work, and this is not promising

263
with regard to employee involvement, which is a requirement for LS. Only 44 per
cent of the firms see it as important to improve work based on input from workers.
HR10 yielded similar responses, since the majority (60 per cent) of firms do
not implement suggestions made by their workers.
Contrary to HR10, the responses to HR03 show that 76 per cent of the firms
believe that employees on the shop floor are driving suggestions programmes, and
this suggests that the K-SMMIs are asking their employees to provide suggestions
and recommendations to improve the work, but their suggestions are largely ignored.
This can also be seen in the responses to HR09, as the vast majority of firms (90 per
cent) stated that their workers do not have the authority to take action when needed
in their work, which shows that they do not empower their workers. The mixed
responses can be seen as arising either from the fact that top management do not
trust their employees, or the fact that the workers are not good enough to be trusted.
The responses to HR04 were also mixed: 50 per cent of the firms do not have
an awards and incentives programme in place to motivate workers, while the other
firms do have a rewards system. The literature review chapter highlighted that
keeping people motivated is conducive to making them work to their maximum
capacity, and helps to contribute to developing the work process.
Skilled and multi-tasking workers, and the ability to work as a team, is
required by LS; the responses to HR05 show that 62 per cent of firms believe their
workers are qualified enough and skilful enough to contribute to problem solving.
However, in response to HR02 56 per cent of the firms feel their employees are not
able to perform different tasks.
From the responses to HR11 it can be seen that 56 per cent of the firms
believe their employees are working based on group interest, and this can also be
identified from the responses to HR06, as 54 per cent of the firms have good
relations at both employee and departmental level. That represents mixed responses,
since most of the firms are supportive towards LS in some areas but not others.
The responses to HR08 reveal that 60 of the firms offer their employees
quality training to enable them to contribute to problem solving and identify non-
value-added activities, while 40 per cent do not.

264
In this variable some positive and negative signs from K-SMMIs have
identified, however the total M score is unfavourable as it lies on the “Disagree” end
of the scale. Key features, such as motivation, empowerment, involvement, skills and
multitasking workers are highly valued in LS. In the K-SMMIs’ case it was found
that they are lacking some of these key aspects, which might affect their readiness
towards LS. Further investigation should be carried out to understand the reason
behind the lack of empowerment, motivation and employee involvement within K-
SMMIs.

265
Table 46 Descriptive statistics for HR variables
Items
Strongly
Disagree Disagree Neutral Agree Strongly Agree
Frequency % Frequency % Frequency % Frequency % Frequency %
HR01 Workspace layout is reconfigured regularly based on
feedback from employees. 7 14 19 38 2 4 15 30 7 14
HR02 Workers are able to perform different tasks. 15 30 13 26 1 2 6 12 15 30
HR03 Shop-floor employees drive suggestion programme. 4 8 7 14 1 2 18 36 20 40
HR04 Numerous awards, incentive programmes and annual
bonuses are available for employees who help to
improve processes and eliminate unnecessary steps.
The evaluation is based on group performance.
19 38 6 12 0 0 8 16 17 34
HR05 Workers are qualified enough to contribute to solving
problems, and are able to work as a team. 11 22 5 10 3 6 24 48 7 14
HR06 Departmental and employee relations are good, and
conflict barely occurs. 14 28 9 18 0 0 16 32 11 22
HR07 Each employee has a clear understanding of his job
description. 6 12 3 6 0 0 28 56 13 26
HR08 Employees have undergone quality training in terms
of developing their problem-solving capabilities and
identifying non-value-adding activities.
14 28 6 12 0 0 25 50 5 10
HR09 Workers are empowered to stop the production line if
abnormalities occur. 24 48 21 42 3 6 2 4 0 0

266
HR10 Suggestions and ideas from shop-floor employees are
actively used and implemented. 19 38 11 22 0 0 13 26 7 14
HR11 Employees act according to the interests of the group,
rather than their individual interests. 15 30 7 14 0 0 13 26 15 30

267
6. Top management and leadership (MGT)
Table 47 shows the total mean score for the five statements within the top
management and leadership variable (MGT01, MGT02, MGT03, MGT04, and
MGT05). Based on the five-point Likert scale (1= Strongly disagree; 2= Disagree;
3= Neutral; 4= Agree; 5=Strongly agree), the mean results indicate that, overall, the
responses lie within the “Neutral” area of the scale. Further, Table 48 shows the M
and SD for the six items; from this table it can be seen that MGT01 is the practice
most frequently followed by K-SMMIs, while MGT04 is the least-followed practice.
Table 47 Top management and leadership summary item statistics
Mean Minimum Maximum Range Maximum/
Minimum
Variance N of
Items
Item
Means 3.20 2.30 4.26 1.96 1.85 0.506 5
Table 48 Top management and leadership: mean score and standard deviation for each item
MGT01 MGT02 MGT03 MGT04 MGT05
M 4.26 3.38 3.10 2.98 2.30
SD 0.96 1.51 1.68 1.51 1.35
Top management and leadership is the most important factor for LS, as
acknowledge by several researchers (e.g. Chin and Pun, 2002; Angelis et al., 2011;
Bakås et al., 2011; Zu et al., 2010; Mefford, 2009; Kumar et al., 2009; Achanga et
al., 2006; Panizzolo, 1998; Meredith et al., 1991; Snee, 2010). Without top
management commitment LS cannot be established, and without leadership LS
cannot be sustained. Important factors such as visible management (Gemba),
commitment, knowing people’s capabilities, committing to providing training, and
investment in consultants and expertise can help the organisation to improve, and
avoid wastes such as “wasted talent”. The following section will identify whether the
K-SMMIs have good quality and management practices towards LS.

268
One of the important factors required by LS is visible management, or
“Gemba”. Table 49 shows the descriptive statistics for the top management and
leadership variables. The responses to MGT01 show that 94 per cent of the firms
consider this practice, and 44 per cent always adopt it. This practice is good to keep
employees motivated and to identify any problems on site, as followed closely by
Toyota.
Knowing people’s capabilities is another important practice that helps to
prevent wasted talent. By knowing people’s capabilities, top management and
leaders can easily assign the right people to the right tasks. MGT02 shows that 70
per cent of the firms acknowledge this practice and believe they know the
capabilities of each worker; however 30 per cent of the firms do not see it as
important.
Commitment from top management is highly required by LS. This can take
many forms, such as investing in training and investing in expertise and consultants.
MGT04 shows that 50 per cent of the firms are committed towards investment in
training and encouraging cross-job training, while the remaining 50 per cent ignore
this aspect. In terms of using expertise and consultants, the responses to MGT05
show that the majority of the firms (70 per cent) are not investing in consultants and
expertise.
Another practice that appeared in the literature review chapter is job security,
which promotes loyalty to the organisation. From the responses to MGT03, it can be
seen that 46 per cent of Kuwaiti firms do not offer formal job security, and their
employees are unlikely to be promoted to a managerial position; however, 42 per
cent say they do offer job security and their employees have the chance of achieving
a managerial job.
Similar to the previous variables, the top management and leadership variable
shows that K-SMMIs gave mixed responses in this respect, with some being positive
and supportive of LS, and other important factors being ignored. From the total M
score it can be seen that top management and leadership lie within the “Neutral” area
of the scale, which is again not very supportive towards LS.

269
Table 49 Descriptive statistics for top management and leadership variable
Items
Strongly
Disagree Disagree Neutral Agree Strongly Agree
Frequency % Frequency % Frequency % Frequency % Frequency %
MGT01 Top management encourages and coaches workers
by visiting the workplace on a regular basis. 3 6 0 0 0 0 25 50 22 44
MGT02 We locate our workers where they can use their
skills, qualifications and experience. 12 24 3 6 0 0 24 48 11 22
MGT03 People have job security and workers are regularly
promoted to managerial positions. 14 28 9 18 1 2 10 20 16 32
MGT04 The company invests in training programmes and
encourages cross-job training. 11 22 14 28 0 0 15 30 10 20
MGT05 The company uses external experts/consultants on a
regular basis to evaluate the overall company
performance and to improve production and quality
level.
17 34 19 38 1 2 8 16 5 10

270
As mentioned above, having some positive practices in place is not enough
for firms to be considered ready for LS, as most of the items in the questionnaire
represent essential requirements for starting and sustaining LS. From the total M
score for all variables, it can be seen that they score less than 4, which is not a great
indication of LS readiness.
The following section will help to provide a firmer understanding of the
firms’ readiness towards LS, by testing the hypothesises to see whether the mix of
responses is subject to certain characteristics, such as ISO 9000 accreditation,
ownership type, firm size or type of product produced (sector).
In order to gain a better picture another form of data collection was
conducted to identify the reason behind the mixed responses obtained from the
questionnaire. Part of this took the form of the observation technique, which was
used to indicate whether the responses to the questionnaire are accurate, and to
validate the findings.
Furthermore semi-structured interviews were conducted to help provide a
better understanding from those in charge in the firms, as well as those outside, such
as consultants, academics and people working in governmental institutions that are
linked to Kuwaiti industries.
5.2.5 Crosstab analysis
Crosstab analysis was carried out to help obtain an understanding of the
responses for two variables. The test was carried out using one statement:
“Awareness about lean system”. Here, the aim was to see whether the job position,
firm size, sector, ownership, ISO, and quality and management practices adopted
affect firms’ awareness of LS; this was based on a Pearson’s chi-square value. The
results are displayed in Table 50–Table 55.
The tables below show that ISO 9000 accreditation is the only factor that
affects firms’ awareness of LS. For example, in Table 54 it can be seen that р< 0.05
and ISO 9000 accredited firms have a better awareness than those who do not have
ISO 9000 in place, while in Table 50, Table 51, Table 52, Table 53 and Table 55 the
P-value is greater than 0.05, which shows that job position, sector, ownership, firm
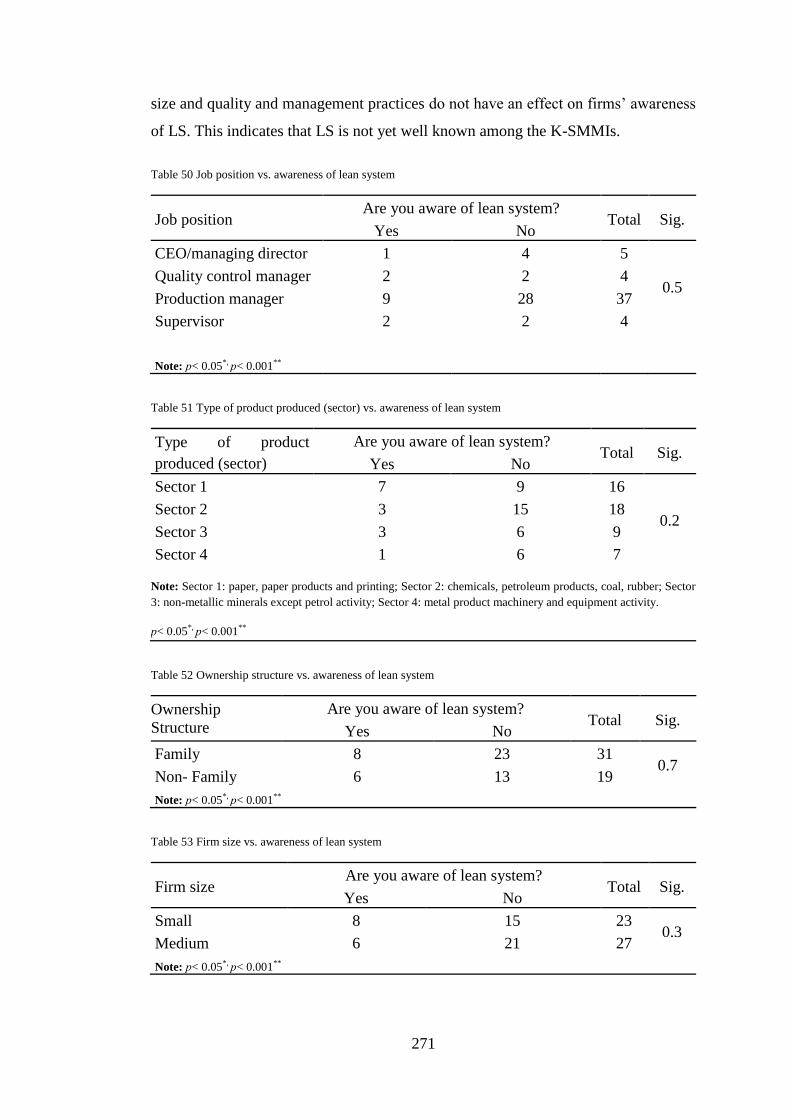
271
size and quality and management practices do not have an effect on firms’ awareness
of LS. This indicates that LS is not yet well known among the K-SMMIs.
Table 50 Job position vs. awareness of lean system
Job position Are you aware of lean system?
Total Sig. Yes No
CEO/managing director 1 4 5
0.5 Quality control manager 2 2 4
Production manager 9 28 37
Supervisor 2 2 4
Note: р< 0.05*, р< 0.001**
Table 51 Type of product produced (sector) vs. awareness of lean system
Type of product
produced (sector)
Are you aware of lean system? Total Sig.
Yes No
Sector 1 7 9 16
0.2 Sector 2 3 15 18
Sector 3 3 6 9
Sector 4 1 6 7
Note: Sector 1: paper, paper products and printing; Sector 2: chemicals, petroleum products, coal, rubber; Sector
3: non-metallic minerals except petrol activity; Sector 4: metal product machinery and equipment activity.
р< 0.05*, р< 0.001**
Table 52 Ownership structure vs. awareness of lean system
Ownership
Structure
Are you aware of lean system? Total Sig.
Yes No
Family 8 23 31 0.7
Non- Family 6 13 19
Note: р< 0.05*, р< 0.001**
Table 53 Firm size vs. awareness of lean system
Firm size Are you aware of lean system?
Total Sig. Yes No
Small 8 15 23 0.3
Medium 6 21 27
Note: р< 0.05*, р< 0.001**

272
Table 54 ISO 9000 certification vs. awareness of lean system
ISO 9000 Certification Are you aware of lean system? Total Sig.
Yes No
Yes 11 14 25 0.01*
No 3 22 25
Note: р< 0.05*, р< 0.001**
Table 55 Quality and management practices currently adopted vs. awareness of lean system
Quality and
Management Practices
Currently Adopted
Are you aware of lean system?
Total Sig. Yes No
Quality Circle 0 3 3
0.3
Visual Management 1 2 3
Benchmarking 1 1 2
5s 2 1 3
Other 1 2 3
None 8 27 35
Note: р< 0.05*, р< 0.001**
5.2.6 Testing the Hypotheses
In this research five hypotheses (H) have been developed:
H1: There is a significant difference in the quality and management practices
used by ISO 9000 firms compared to non-ISO 9000 firms in Kuwait.
H2: Small firms and medium-sized firms in Kuwait differ significantly in
terms of their quality and management practices.
H3: Firms in different sectors in Kuwait differ significantly in terms of their
quality and management practices.
H4: There is a significant difference in the quality and management practices
used by non-family-owned firms compared to family-owned firms in Kuwait.
H5: K-SMMIs are not using quality and management practices to a very
significant extent.
In the following section, the hypotheses will be tested using an independent
sample t-test for H1, H2 and H4, and a one-way ANOVA test for H3. H5 will be

273
tested based on the overall mean score, and this will be compared to the results
obtained from the 15 lean firms, and from the findings of Nordin et al. (2010).
1. Independent sample t-test
Prior to conducting the independent sample t-test it was assumed that the
samples were drawn from a normally distributed population. In order to run the t-
test, it was necessary to decide whether equal variance could be assumed (i.e. by
testing a null hypothesis, H0). To this end, Levene’s test was carried out for the six
constructs to see whether the p-value was greater or less than 0.05. The test was
conducted for the ISO 9000-certified and non-ISO 9000 firms, for the small and
medium-size firms, and for family- and non-family-owned firms.
For the ISO 90000-certified and non-ISO 9000 firms, Table 56 shows that the
variance can be assumed equal for all factors except for suppliers, where the p-value
is less than 0.05, indicating that the variances are significantly different for ISO 9000
and non-ISO 9000 firms. In this case, the null hypothesis (“There is no significant
difference in the quality and management practices used by ISO 9000 firms
compared to non-ISO 9000 firms in Kuwait”) cannot be rejected for processes,
planning and control, customers, HR, and top management and leadership, and is
rejected only for suppliers.
For small firms vs. medium-sized firms, and for family and non-family,
Table 56 shows that the variance can be assumed equal for all constructs, as the p-
value was greater than 0.05, indicating that there is no significant difference with
respect to firm size and ownership. Thus, the null hypothesis (“There is no
significance difference in the quality and management practices of small and
medium-sized firms” and “There is no significant difference in the quality and
management practices used by non-family-owned firms compared to family-owned
firms in Kuwait”) cannot be rejected.

274
Table 56 Levene’s test
Levene's Test for Equality of Variances
ISO and non-ISO Small and medium Family and non-family
F Sig. F Sig. F Sig.
Processes Equal variances assumed 0.2 0.67 0.45 0.50 0.103 0.75
Equal variances not
assumed
Planning and Control Equal variances assumed 0.1 0.79 0.79 0.37 4.57 0.03
Equal variances not
assumed
Customer relations Equal variances assumed 1.1 0.30 0.34 0.56 .21 0.64
Equal variances not
assumed
Supplier relations Equal variances assumed 0.0 0.98 1.0 0.30
Equal variances not
assumed 4.9 0.03
*
HR Equal variances assumed 0.1 0.73 0.21 0.64 0.14 0.70
Equal variances not
assumed
Top management and
leadership
Equal variances assumed 0.1 0.78 0.10 0.74 0.23 0.63
Equal variances not
assumed
Note: р< 0.05*

275
5.2.6.1 The effect of ISO 9000 towards LS readiness for ISO 9000-certified
firms vs. non-ISO 9000-certified firms: independent sample t-test
An independent sample t-test was carried out to identify whether ISO 9000-
accredited firms have better readiness with respect to LS than non-ISO 9000 firms
by testing H1. The results of the independent sample t-test are shown in Table 57.

276
Table 57 Independent sample t-test for ISO 9000-accredited and non-ISO 9000-accredited firms
Current Practices
ISO
(n=25)
Non-ISO
(n=25)
Entire Sample
(n=50)
Independent Sample T-
test Results
M SD M SD M SD
t Sig. (2-
tailed)
Processes 3.3 0.9 2.9 0.9 3.1 0.9 1.4 0.2
Planning and control 3.2 0.9 2.8 0.9 3.0 0.9 1.5 0.1
Customer relations 2.4 0.6 2.6 0.8 2.5 0.7 -1.1 0.3
Supplier relations 2.2 0.4 2.4 0.6 2.3 0.5 -1.1 0.3
HR 3.2 0.9 2.8 0.9 2.9 0.9 1.4 0.2
Top management and
leadership 3.6 0.9 2.9 0.9 3.2 0.9 2.8 0.01
*
Note: р< 0.05*, р< 0.001**

277
Based on the variance results, the mean score was examined. The
independent sample t-test shows that the quality and management practices within
the K-SMMIs have a total mean of 2.8, which indicates that the current quality and
management practices (M<4) are not very supportive towards LS.
The mean scores within the two groups were also found to be almost
identical. Top management and leadership (M=3.6) was found to be the most-used
practice within ISO 9000 firms, and the second most-used practice in non-ISO 9000
firms (M=2.9). The supplier relations factor was found to be the lowest in the two
groups (M=2.2 in ISO-accredited firms and M=2.4 in non-ISO-accredited firms).
However, the t-test results, as shown in Table 57, confirm that there is only one area
that shows a significant difference between the two groups, which is top
management and leadership (р<0.05).
From the 47 items tested, the ISO 9000 firms were found to have better
practices in terms of providing training and involving consultants/experts to help
improve firm performance only (MGT04 and MGT05), as shown in Table 58 below.
This makes sense, as the ISO 9000 requirements entail that companies maintain
certain standards and have a clear strategy regarding training.
Hence, H1 can only be accepted for one construct (top management and
leadership), and is rejected for the remaining constructs (processes, planning and
control, customer relations, supplier relations and HR). According to these results,
ISO 9000 certification does not reflect heavily on the practices used within the K-
SMMIs.
The motives behind adopting ISO 9000 were identified from the semi-
structured interviews; in accordance with Yusof and Aspinwall (2000), it was found
that many SMEs implemented ISO 9000 in order to avoid losing customer contracts,
without understanding its primary purpose. According to Gotzamani and Tsiotras
(2001), organisations will only benefit from ISO 9000 if they implement it to
improve their internal operations and quality.
This result is consistent with the literature (Carr et al., 1997; Quazi et al., 2002;
Martinez-Lorente and Martinez-Costa, 2004), which suggests that there is no relation
between ISO 9000 and TQM; companies who are ISO accredited do not necessarily

278
have a better chance of success with respect to TQM. This result is supported by
Garza-Reyes et al. (2011), who pointed out that Kuwaiti manufacturing industries
are aware of QI, but do not really understand its purpose, which is why it has not
improved their internal operations and processes.
Table 58 Current practices for top management and leadership
Current
Practices
ISO
(n=25)
Non-ISO
(n=25)
Independent
Sample T-test
Results
M SD M SD t Sig. (2-
tailed)
MGT01 4.48 0.50 4.04 1.24 1.64 0.108
MGT02 3.48 1.47 3.28 1.56 0.46 0.644
MGT03 3.40 1.65 2.80 1.68 1.27 0.210
MGT04 3.60 1.38 2.36 1.41 3.13 0.003*
MGT05 2.80 1.60 1.80 0.81 2.77 0.008*
Note: р< 0.05*, р< 0.001**
5.2.6.2 The effect of size (small vs. medium) on LS readiness: independent
sample t-test
The second independent sample t-test was carried out to test H2, in order to
learn whether the difference in size (small or medium) has an effect on LS readiness.
Table 59 shows the results of the independent sample t-test for K-SMMIs (large
firms were excluded from this research as the study focused on the context of small
and medium-sized firms only).

279
Table 59 Independent sample t-test for K-SMMIs (small vs. medium)
Current Practices
Small
(n=23)
Medium
(n=27)
Independent Sample T-test
Results
M SD M SD t Sig. (2-tailed)
Processes 3.1 0.9 3.0 0.9 0.4 0.6
Planning and control 3.1 0.9 2.9 0.7 0.3 0.7
Customer relations 2.5 0.7 2.5 0.7 0.1 0.9
Supplier relations 2.3 0.6 2.3 0.5 -0.1 0.9
HR 3.1 0.9 2.9 1.0 0.4 0.6
Top management and
leadership 3.2 0.9 3.2 0.9 -0.2 0.7
Note: р< 0.05*, р< 0.001**

280
Based on the variance results, the mean score was examined. Table 59 shows the
mean and standard deviation values for each construct in terms of the two different
firm sizes, along with the t-test results. When considering the mean value, it can be
seen that there is barely any difference between small and medium-sized firms for
any of the constructs; both small and medium-sized firms show M<4, which again
shows that the current quality and management practices in both small and medium-
sized firms are not supportive towards LS.
These results are consistent with those of Nordin et al. (2010), which were M<4
for non-lean firms; however, the findings contradict Mady’s (2009), which suggested
that Kuwaiti medium-sized firms use quality and management practices more
extensively compared to small firms. Moreover, the results show that there were no
significant differences between the different-sized firms in terms of their use of
quality and management practices; thus, H2 is rejected for all constructs.
2. One-way ANOVA
A test for homogeneity of variances was carried out to see whether H0 can be
rejected. Table 60 shows that H0 (“Firms in different sectors in Kuwait do not differ
significantly in terms of their quality and management practices”) can be rejected for
supplier relations only, since this has a р-value of less than 5 per cent, and not for the
remaining five constructs; this means that equal variance for all sectors is assumed
for all constructs except supplier relations.
Table 60 Test for homogeneity of variances
Constructs Levene Statistic Sig.
Processes 1.4 0.2
Planning and control 0.1 0.9
Customer relations 1.5 0.2
Supplier relations 8.5 0.0*
HR 2.1 0.1
Top management and leadership 0.3 0.8
Note: р< 0.05*

281
5.2.6.3 The effect of different types of firms towards LS readiness (different
sectors): one-way ANOVA
A one-way ANOVA was carried out to test H3 in order to learn whether
sector (product produced) has an effect on LS readiness. Table 61 shows the results
of the one-way ANOVA for K-SMMIs.
Table 61 shows the M and SD values for each construct in terms of four
different sectors, along with the ANOVA results. When considering the mean value
for all of the six constructs, it can be seen that the values are almost identical, and
there are no significant differences between the four sectors. All of the four sectors
show M<4, which indicates that the current quality and management practices in all
sectors are not supportive towards LS.
This result is inconsistent with Mady’s (2009), which showed that there is a
difference in the quality and management practices used by different sectors in
Kuwait. Furthermore, this result disagrees with Reed et al. (1996), Corbett and
Rastrick (2000) and Curkovic et al. (2000), who demonstrated that different sectors
have different use of quality and management practices. More importantly, it can be
seen from the table below that there is no significant difference between the four
different sectors in terms of their use of quality and management practices. Thus, H3
is rejected.

282
Table 61 One-way ANOVA test for different sectors
Current practices
Sector 1 Sector 2 Sector 3 Sector 4 ANOVA Test
Results (n=16) (n=18) (n=9) (n=7)
M SD M SD M SD M SD F Sig.
Processes 3. 1 0.8 2.9 0.9 3.1 0.9 3.2 1.2 0.2 0.8
Planning and
control 2.9 0.7 2.8 0.8 3.5 0.9 2.9 0.8 1.5 0.2
Customer relations 2.5 0.8 2.4 0.7 2.5 0.5 2.3 0.7 0.2 0.8
Supplier relations 2.4 0.7 2.2 0.5 2.2 0.2 2.1 0.3 0.6 0.5
HR 3.0 0.8 2.8 1.0 3.1 1.1 3.1 1.3 0.1 0.9
Top management
and leadership 3.2 1.1 3.1 0.9 3.2 1.0 3.5 1.0 0.3 0.8
Note: Sector 1: paper, paper products and printing; Sector 2: chemicals, petroleum products, coal, rubber; Sector 3: non-metallic minerals (except petrol activity); Sector 4: metal product
machinery and equipment activity.
Note: р< 0.05*, р< 0.001**

283
5.2.6.4 The effect of different ownership types (family and non-family) on lean
readiness: independent sample t-test
A third independent sample t-test was carried out to test H4, in order to learn
whether the difference in ownership (family vs. non-family owned firms) has an
effect on LS readiness. Table 62 shows the results of the independent sample t-test
for K-SMMIs.
Based on the variance results, the mean score was examined. Table 62 shows the
mean and standard deviation values for each construct in terms of the two different
ownership structures, along with the t-test results. When considering the mean value,
it can be seen that there are no huge differences between family-owned and non-
family-owned firms for any of the constructs; both type of firms show M<4, which
again indicates that the current quality and management practices in both family- and
non-family-owned firms are not supportive towards LS.
These results disagree with those of Ellington et al.(1996), Levinson (1987),
Ward (198), and Hofer and Charan (1984), who found that there are differences in
the implementations of quality and management practices by the two type of firms,
with non-family-owned organisations having a better chance of adopting quality and
management practices. Moreover, the results show that there were no significant
differences between the different ownership types in terms of the firms’ use of
quality and management practices. Thus, H4 is rejected for all constructs.

284
Table 62 Independent sample t-test (family- and non-family-owned firms)
Current Practices
Family
(n=31)
Non-family
(n=19)
Independent Sample T-test
Results
M SD M SD t Sig. (2-tailed)
Processes 3.1 0.9 2.9 0.9 0.8 0.4
Planning and control 2.9 0.7 3.1 1.1 -0.5 0.5
Customer relations 2.5 0.7 2.3 0.6 1.2 0.2
Supplier relations 2.3 0.5 2.2 0.5 0.9 0.3
HR 3.1 1.0 2.8 0.9 1.0 0.2
Top management and
leadership 3.2 0.9 3.1 1.0 0.1 0.8
Note: р< 0.05*, р< 0.001**

285
5.2.6.5 Are K-SMMIs prepared and ready for LS?
Based on mean score, H5 was tested to see whether the K-SMMIs are using
quality and management practices to a very significant extent. Table 63 shows the
mean score for the K-SMMIs (M=2.8) and the 15 lean companies (M=4.5), and the
findings of Nordin et al. (2010) (M=4.3). Further, Table 64 shows the total mean for
the 47 statements based on the five-point Likert scale. It is clearly noticeable that the
K-SMMIs do not consider quality and management practices to be important. This
means that in terms of their quality and management practices, K-SMMIs are not
well prepared to implement LS. Thus, H5 is accepted.
This is consistent with Zairi (1996) and Garza-Reyes et al. (2011), who
claimed that Kuwaiti industries are still in the early stages of understanding QI, and
are largely unaware of QI. This also agrees with Al-khalifa and Aspinwall (2000),
who suggested that the maturity level towards QI is very low in Arabic countries,
and with Jaeger et al. (2013), who said that QI does not play an important role in
GCC organisations. Moreover, this result proves the findings of Tannock and Ahmed
(2008), who found that Arab countries have yet to feel pressure to implement QI.
In order to understand the reasons for this, and to understand the factors that
affect K-SMMIs’ readiness towards LS; semi-structured interviews, observations,
case studies and expert-panel interviews were conducted.

286
Table 63 K-SMMIs vs. lean companies
Current Practices
K-SMMIs
(n=50)
Lean Companies
(n=15)
Nordin et al. (2010) (lean companies)
(n=16)
M M M
Processes 3.1 4.6 4.3
Planning and control 3.0 4.5 4.4
Customer relations 2.5 4.4 4.4
Supplier relations 2.3 4.4 4.1
HR 2.9 4.4 4.4
Top management and leadership 3.2 4.4 --
Total mean 2.8 4.5 4.3
Note: Top management and leadership was not tested by Nordin et al. (2010)
Table 64 Total mean score for the 47 items
Mean Minimum Maximum Range Max/Min Variance N of Items
Item Means 2.84 1.56 4.26 2.70 2.73 0.53 47

287
5.2.7 Phase one concluding remarks
From the questionnaire outcome, it can be seen that quality and management
practices (namely processes, planning and control, human resources, top
management and leadership, customer relations, and supplier relations) within K-
SMMIs are not very supportive towards LS, as can be seen from the low mean score
(M<4) for each of the constructs. This shows that K-SMMIs lack the infrastructure
and readiness for LS, and rarely use the necessary quality and management practices.
In order to be ready for LS, K-SMMIs need to address many of the weaknesses that
were highlighted from questionnaires.
5.3 Phase two: semi-structured interviews and structured observations
In this phase two techniques were used – semi-structured interview and
structured observation – to gain a better picture and answer RQ1, RQ2, RQ3, RQ4,
RQ5 and RQ6, and to triangulate the findings from the questionnaire, the interviews
and the observations.
5.3.1 Interview findings
Semi-structured interviews (lasting between 30 and 45 minutes each) were
conducted with 27 firm managers in Kuwait (out of the original sample of 50 K-
SMMIs), to understand why LS has not been implemented in K-SMMIs, and what
factors are delaying LS implementation in Kuwait from the managers’ point of view.
Moreover, the interviews were used to validate the survey findings, which show that
only 28 per cent of the respondents were aware of LS.
After analysing the survey results it was found that the K-SMMIs have not
adopted many of the quality and management practices related to LS; further
investigation was needed in order to explain this. Thus, interview questions were
prepared based on the questionnaire responses, and were reviewed (i.e. pilot tested)
by experts in the field from Kuwait who were involved in the subject area and were
aware of Kuwaiti manufacturing sectors (consultants), as well as those who had
published studies regarding Kuwaiti manufacturing sectors and quality management
systems (academics from Kuwait University). The questions were modified

288
according to the suggestions received. The questions and responses can be
summarised as follows.
Question 1: What was the driver for adopting or choosing ISO 9000 for future
implementation, and how does/will it affect your internal processes?
The vast majority of the respondents agreed that the main purpose for
adopting ISO 9000 was to expand sales and gain government contracts. According to
the respondents, their main target customers are government institutions and other
authorities such as oil sectors, ministries and cooperative societies. One of the
interviewees stated: “ISO 9000 didn’t help us to improve internally; it was a key to
gain government contracts only”.
When asked about the effect of ISO 9000 on their quality and management
practices, the vast majority of respondents said it had not positively affected their
quality and management practices, but that it adds more work for employees, and the
only benefit of ISO 9000 has been gaining more contracts.
Question 2: Do you feel any urgency to adopt new QI?
Most of the answers to this question were negative. For example: “there is no
real urgency as we produce simple products”; “the Kuwaiti market is very small and
the competition is very low, at the moment we are doing great”; “In Kuwait you can
gain government contracts without having great quality systems; all you need is links
with personnel in government”.
From the interviewees’ answers, it can be seen that they feel there is no real
urgency or pressure to adopt QI such as LS. This can be attributed to the low FDI in
Kuwait, which equates to a lack of pressure for local firms to improve, and the lack
of transparent systems in Kuwaiti government in terms of dealing with contracts and
projects.
Question 3: Do you intend to implement new QI in your firm?
Most of the interviewees agreed that there is no real urgency to implement
new QI. Moreover, they added that they deal with simple products, and feel that
introducing QI could confuse and negatively affect their systems. In addition, QI
requires highly skilled people, which K-SMMIs do not have at present; as one
289
general manager said: “New systems such as lean are useful for large companies that
have complex processes but it requires very skilled workers and technology which
we don’t have and can’t afford”.
Question 4: What is your recruitment strategy?
All the respondents stated that they do not have a clear recruitment strategy;
due to budgetary constraints, they compromise the quality of their workers for lower
cost. There is a lack of skilled workers in the Kuwaiti market as a whole, and
industries tend to go overseas to hire. This represents a problem in that most of the
shop-floor workers do not speak Arabic or English, which leads to
miscommunications between workers and affects teamwork. This problem was
found to be present in most of the K-SMMIs.
Question 5: What are your rewards criteria, and are these known by workers?
How often are improvement suggestions received from shop-floor workers?
The vast majority of respondents stated that they assess firm performance as a
whole, and that if they reach their sales targets they reward all workers – they do not
implement individual rewards system for workers who come up with new ideas or
suggestions, which is a key to improving processes. Most of the K-SMMIs do not
follow a clear procedure such as conducting focus groups, or provide a clear system
through which to solicit suggestions; most suggestions are informal. One manager
stated:
Our workers do not have the desire to participate and provide us with
suggestions, and the reason behind this is that they are working for us for short
periods of time so their main concern is to make money and leave the country.
Moreover, they don’t have the required skills and education; most of our
workers don’t feel as though they are part of the company.
Question 6: How do you drive continuous improvement programmes?
Most of the firm managers seem to be ignorant about CI; some are aware of
CI but state that it is too difficult to drive as it requires skilled workers who can
participate in improving the current processes and identifying non-value-adding
activities.

290
Question 7: What is your training policy?
The respondents perceive that training occurs via participation in workshops
held by government institutions, and feel that there are no training systems within
the firms, as these require financial resources. One manager said: “The government
provided us with training in the past but not on a regular basis; most training
programmes are for the senior level and are not related to our business”.
Question 8: Are your workers empowered to take action when needed? Please
provide an example of this.
Most of the respondents revealed that their employees are empowered, but
said that any decisions have to be approved by the top management, which
contradicts the empowerment concept.
Question 9: Please describe what teamwork and departmental relations look
like at your firm.
Most of the respondents said that it is very difficult to work as a team when
the majority of workers do not speak a common language, though work between
departments is relatively less problematic as it is conducted between managers.
However, one manager said:
We are striving for teamwork and work between departments, but sometimes it is too
difficult due to two factors; the first is the language barrier and the second is the fact
that we don’t have the technology to use between departments.
Question 10: What are the key performance indicators for your firm?
The vast majority of K-SMMIs do not follow specific criteria to measure their
performance. This factor is very important when implementing LS, since without
having a scientific method or KPIs by which to evaluate production rate, they will
not be able to improve their processes or identify non-value-added activities. One of
the managers stated that:
This kind of tool requires skilled people, training and commitment and on top of that
we have to be realistic; we are not dealing with complex processes so I don’t think
we need KPIs to improve them.

291
Question 11: How do you specify customer needs?
Most of the managers believe they know their customers’ requirements;
however, none of the interviewees mentioned that they have a specific strategy in
place through which to involve their customers. One of the managers stated:
After […] many years of being in business of course we understand the customers’
requirement […] I don’t believe we need to have survey or a system […] we are the
only firm that produce this products.
Question 12: How do you deal with customer complaints?
The responses to this question show that most of the interviewees believe
customer complaints are important to them, but once again the vast majority do not
have a clear system or strategy in place to deal with these complaints. Only one
manager showed great maturity in this regard:
The customer is the most important factor for our business to stay alive […] we
have implemented a clear strategy to collect […] customers’ complaints and […]
deal with them to prevent similar mistakes from happening in future.
The same manager explained that in Kuwait, and especially in K-SMMIs,
little attention is paid towards dealing with customer complaints as most firms do
not feel at risk in this regard as the market is too small, and sometimes customers
are forced to use the company even if they are not happy with its quality or service.
The firms are driving the business rather than the customers, as the customers do not
have many options.
Question 13: To what extent are your suppliers involved in your business?
Most of the interviewees complained about their suppliers in terms of
delivery and product quality. However, none of the managers gave any indication of
taking specific actions to build strong relations with suppliers. All of the managers
prefer to deal with large numbers of suppliers in order to get better prices. It seems
that the suppliers and firms are highly disjointed.
Question 14: In your opinion, how effective is current government support?

292
The interviewees stated that the government authorities are not serious about,
and are not aware of, the industrial market, and suggested that most of their rules are
made to tick boxes rather than be implemented. As one interviewee explained that
the government sets many rules and regulations to organise and improve industries
but they are never serious and never conduct follow up visits to see if their
initiatives have been implemented or ignored by the firms. Another interviewee
said: “the government has provided us with training programmes but these are never
related to our business”. Thus, it appears that the government does offer help to
Kuwaiti industries, but without studying their needs from a realistic point of view.
Furthermore, one manager explained that the government is one of the main
hindrances for K-SMMIs with respect to improvement; he stated:
We asked the industrial authority to expand our plant as we have shortages on space
and this has affected the storage of the raw materials and finished products because
in the mean time we have to move our finished products to another store which is far
away from our firm which is not ideal […] it takes far too long to get […]
permission and only God knows when I will get it.
Another manager complement this view by saying “In order to get the
approval for expansion you need to pay a bribe […] it is highly corrupted and the
government is not taking any measures to deter the unethical approaches.”
5.3.2 Structured Observation
In this study, non-participant structured observation (direct observation) was
adopted to allow validation of the findings. By adopting the observation technique,
the researcher was able to have the opportunity to see the working areas within the
firms for himself, and identify whether there are any a visual management guides in
place (e.g. health and safety, designated area, inventory, etc.), and in turn make
better sense of how K-SMMIs are running their businesses and eventually what sort
of potential barriers are in place. For example, if there are no signs or labels for items
and equipment, it is likely to contribute to delaying the process and cause wasted
time; as another example, if equipment is not clean this means that the firm is not
following any preventive maintenance.

293
In the present case, observation was used for two primary reasons: to serve
the research purpose and to check the reliability and validity of the findings. This
technique helped in answering the research questions (RQ1, RQ2, RQ3, RQ4, RQ5
and RQ6). The main advantage of observation is that it allows the researcher to
obtain an accurate result, as the data is obtained by the researcher directly, unlike
other techniques that depend on memory, such as interview. In addition, it avoids the
respondent bias which can arise within a questionnaire (Zikmund et al., 2012).
Moreover, observation can provide accurate information for the research. For
example, in the present study used a survey questionnaire in which one of the
questions asked was: “Do you have visual management practices in place?” In the
questionnaire the respondents could easily have answered in the affirmative, but via
observation the researcher could judge this for himself, which helped to add
credibility and validity to the outcomes.
The observations were conducted after the questionnaire collected from the
50 K-SMMIs were analysed. After the questionnaire, interviews were conducted
with 27 managers in K-SMMIs. During the interview sessions the managers were
asked to show their working areas, as the author wanted to see for himself what these
looked like. During the tour the author did not talk to anyone, since he just wanted to
observe. Specific attention was paid to certain things, such as the care of the
equipment, which can be observed by checking whether there is dirt on the
equipment; according to Goodson (2002), this is a good indcation of whether the
firm is carring out TPM or taking care of its equipement (in fact, this approach
within the firm observations was inspired by Goodson (2002)).
Table 65 shows the aspects that have been observed, such as labelled items
and equipment and floor; designated area for tools and equipment; condition of tools
and equipment (to see whether the company cares for its equipment); VM methods
(such as charts, instructions, schedules, etc.); safety environment (ventilation, health
and safety clothes, etc.); process layout (flow, low amounts of WIP); storage area;
workers’ uniforms; cleanness and tidiness of the workplace, storage, etc.;
suggestions system; workers’ break room (such as facilities); and records of
important issues such as cycle time, lead time, etc. In other words, the aim was to
identify any easily observable issues out of those that appeared in the questionnaire

294
in order to better understand the K-SMMIs’ practices and to validate the outcomes
from the questionnaire, while walking around the firm.
From Table 65, it can be seen that the 27 K-SMMIs visited are lacking in
many aspects; in fact, as it is stands, the firms have everything that opposes the
requirements of LS. From the observation, it was seen that 85 per cent of the firms
do not have labels for their items, equipment and floor. In addition, 81 per cent of the
firms do not have designated areas for equipment and tools, and the same percentage
of firms do not care for their equipment and machines, as was observed from the dirt
on the equipment, which indicates that it has not been maintained for some time.
Furthermore, 92 per cent of the firms are not using VM. Only two firms are
using it. The was a clear lack of any sorts of instructions, targets, etc. in the
workplace, which shows the firms’ ignorance regarding the important of displaying
important information to help with smooth running of work and to avoid employees
having to waste time searching for information.
With regard to the working environment, it was found that 88 per cent of the
firms are ignoring this aspect. For example, it was observed that there is no proper
ventilation in many of the firms, and also many hazardous materials were identified
around the working area, rather than these materials being put in an isolated, secure
place. This clearly shows that many of the firms are not taking this issue (the
working environment) seriously considering the bad weather in Kuwait, as the
temperatures can reach 52 degrees Celsius in summer, and there is often a great deal
of dust and wind; it has been found that staff are working without minimal health
and safety standards in place.
The firms do not seem to be trying to make the working environment more
efficient or pleasant. Many authors have said that workers’ productivity is affected
by the working environment; according to Haynes (2008, p. 37), “There is enough
evidence to support the claim that office comfort can affect productivity”.
Based on the author’s observations, it can be said that the vast majority of
firms have many issues that are affecting the process flow, including high levels of
WIP and poor layout. It was found that most of the firms do not have clear standards
to follow; the stages between the processes are disconnected and the production is

295
not based on pull. In most of the firms the products were also found to face long wait
times when being moved from one stage to another, as the next stage is often not
ready to receive them.
Further, during the visit identified several common factors were identified in
the firms in relation to storage: raw materials and finished products were witnessed
being stored outdoors, with no special care giving to them. This will affect the
quality of products, as some products contain materials that require special care.
Furthermore, it was observed that the storage areas were often untidy and not set in
order, and there were no designated areas for finished products, so that they were
mixed in together with the raw materials in most firms, which will lead to many
types of wastes. Further, in some of the firms (12), it was noted that hazardous
materials are stored close to other storage areas, and do not have any labels or codes
to identify them. As can be seen from Table 65, only four firms have tidy and well-
organised storage areas.
With regards to employee uniform, the aim was to see whether the workers
had special clothes in terms of uniforms, masks, safety shoes, goggles, helmets, etc.
However, it was found that only three firms are taking this issue seriously, with the
remainder largely ignoring this aspect. During the visit, and from the first
impressions obtained, it was noticed that most of the companies are not taking care
of their employees. A special uniform will would reflect the company image; three
firms did have a uniform, and these three firms were among the best among of the 27
firms in relation to many aspects.
Again, most of the companies are not taking care of the cleanliness and
tidiness in the workplace and storage areas. It was found that most of the firms do
not have periodic cleaning: there are materials and items all over the place, greasy
floors, and dust covering the storage areas and even the equipment. This is not a
good sign for implementing LS, and will also affect the workers’ morale and
productivity.
As was learnt from the literature review chapter, employee involvement is
crucial in the lean journey; one form of employee involvement is to have a system in
place through which to collect suggestions and recommendations made by
employees. During the visits the author asked whether there is a suggestion box or

296
any other system that allows employee to provide recommendations. Surprisingly,
only two firms have a suggestion system – one if which is a suggestion box that has
never been used, as evidenced by the lack of paper inside – which shows that the
company is not serious about this aspect; on the other hand, one firm has a clear
suggestions box that is checked on a daily basis, and many of the suggestion have
been implemented and the people who made those suggestion rewarded. The
remaining 25 firms seem not to believe in this system at all, as such a way in which
people could provide their suggestions could not be found.
LS highly relies on people; one way of demonstrating respect for people is to
provide them with good facilities and create a pleasant working environment. This in
turn will be good for employee productivity. During the tour the author decided to
observe the areas in which people spend their breaks, in order to see whether there
are any areas for socialising, in which the workers can meet and see workers from
other departments. However, this aspect was found to be unavailable in K-SMMIs:
most of the firms either do not have these facilities or the break rooms are in poor
condition, and there is no socialising whatsoever. Furthermore, it was learnt that the
break rooms are only for the shop-floor workers so they do not mix with the firms’
top management.
Finally, during the time spent in the firms attention was paid to whether there
were any records of important issues, such as visual charts or diagrams on areas
including production rate, the cycle time for each product or stage, etc. Apart from
two firms, none keep such records. This shows a lack of the awareness about this
issue, and the fact that providing employees with information about production,
defect rates, and cycle time for each product can challenge them to improve.

297
Table 65 Observed areas
Firm Observed Areas
1 2 3 4 5 6 7 8 9 10 11 12
F1 × × √* × × × × × × √*
× ×
F2 √* × √*
× × × × × × × × ×
F3 × × × × × × √ × × × × ×
F4 × × × × × × × × × × × ×
F5 × × × × × × × × × × × ×
F6 × × × × × × × × × × × ×
F7 √ √ √ × √ × √ √ √ × √ √
F8 × √ × × × × × × × × × ×
F9 × × × × × × × × × × × ×
F10 × × × × × × × × × × × ×
F11 × × × × × × × × × × × ×
F12 × × × × × × × × × × × ×
F13 × × × × × √ × × × × × ×
F14 × × × × × × × × × × × ×
F16 √ √ √ × √ √ × √ √ √ √ √
F17 × × √ × × × × × × × × ×

298
F18 × × × × × × × × × × × ×
F19 × × × × × × × × × × × ×
F20 × × × × × × × × × × × ×
F21 × × × × × × × × × × × ×
F22 × × × × × × × × × × × ×
F23 × × × × √ × × × × × × ×
F24 × × × × × × × × × × × ×
F25 × × × × × × × × × × × ×
F26 × √ × × √ × × × × × × ×
F27 √ √ × × × × × √ √ × √ ×
Note: × firm does not have, or keeps in very poor condition; √ firm has this aspect, and it is well organised; √*
this is available, but not to a great
extent.
Note: [1] Labelled items, equipment and floor; [2] Designated area for tools and equipment; [3] Condition of tools and equipment; [4] VM
(charts, instructions, schedules, etc.); [5] Safety environment (ventilation, health and safety clothes, etc.); [6] Process layout (flow, low levels of
WIP, etc.); [7] Storage area; [8] Workers’ uniform; [9] Cleanliness and tidiness (workplace, storage, etc.); [10] Suggestions system; [11]
Workers’ break room (facilities); [12] Records of important issues (cycle time, lead time etc.)
299
5.3.3 Phase two concluding remarks
From the semi-structured interviews it was found that understanding and
awareness of the benefits and principles of LS are very low, and knowledge of LS is
missing, in K-SMMIs. Additionally, K-SMMIs are facing many issues, such as:
Language barriers, as well as a lack of quality workers in terms of education
and skills
No empowerment or real involvement from employees
No use of technology to communicate between departments
No government attention towards K-SMMIs
Low or modest knowledge of QI
No real competitiveness or urgency to adopt QI
No clear strategy in terms of involving employees in improving processes, or
in promoting CI
No use of scientific methods to solve problems and improve processes.
From the observation, it was learnt that most of the K-SMMIs are lacking
many aspects such as labelled items and equipment and floor; designated area for
tools and equipment; condition of tools and equipment (to see whether the company
cares for its equipment); VM methods (such as charts, instructions, schedules, etc.);
safety environment (ventilation, health and safety clothes, etc.); process layout (flow,
low amounts of WIP); storage area; workers’ uniforms; cleanness and tidiness of the
workplace, storage, etc.; suggestions system; workers’ break room (such as
facilities); and records of important issues such as cycle time, lead time, etc. This
made it possible to make more sense of the results obtained from the questionnaire
and semi-structured interviews.
These two techniques used made it possible to answer RQ1, RQ2, RQ3, RQ4,
RQ5 and RQ6, and to make sense of the outcomes of phase one. Despite some
positives obtained from the questionnaire, the interviews and the observations
highlighted more negatives; furthermore, some of the answers given by the firms in
the questionnaire were shown not to reflect reality. It was found that the vast
majority of the firms are far from being LS ready.

300
5.4 Phase three: case studies
A field case study was then conducted by the researcher with two medium-
sized firms in Kuwait. The names of the two firms will be kept anonymous for
confidentiality reasons, and thus the first firm will be labelled (F1) and the second
(F2).
In January 2011, 50 K-SMMIs were visited to conduct the survey to identify
their level of readiness towards LS and to understand what quality and management
practices are being used by them, in order to see how lean they are. During the
surveys, the researcher asked the respondents if they were interested in participating
further in the research study by taking part in the case study stage as a representative
of K-SMMIs. An initial agreement from four firms has been obtained, however two
firms withdrew for reasons such as time constraints and confidentiality. The
researcher’s initial idea was to use four firms, two ISO 9000-certified firms and two
non-ISO 9000-certified firms, but, due to the withdrawals, this turned out not to be
possible.
Thus, multiple case studies were conducted to obtain a better picture and to
see whether the findings from the survey match those obtained for the firms visited.
Furthermore, this will help to validate the overall findings of the study and answer
RQ1 and RQ5, as well as increasing the study’s generalisability.
The aim was to answer some questions that had arisen from the questionnaire
outcomes, and to validate these. In addition, in the questionnaire the respondents
were mainly those who hold a senior position, and this meant that the viewpoint of
the shop-floor workers had not been accessed. The reason for this came from the
initial investigation and from the pilot test; here, it was discovered that the vast
majority of shop-floor workers do not speak English or Arabic, so it was so difficult
and challenging to obtain their point view.
In case study F1 the author managed to overcome this problem by inviting
the supervisor of this research, who can speak different languages such as Urdu,
Hindi and Nepali, to attend; in F2 the researcher were escorted by the production
manager, who is Indian and acted as an interpreter.

301
The main motive for using the case study strategy in this research was to
complement and validate the main findings of the survey. The case study strategy
allowed the researcher to obtain a better view and understanding of why K-SMMIs
have yet to consider implementing LS; furthermore, it added validity to the findings
from the survey.
The techniques used within the case study were semi-structured interviews
and observations. Semi-structured interviews were conducted with selected
personnel, from the top-management level to the shop-floor level, in the two K-
SMMIs, which made it possible to investigate the readiness towards LS and to
identify any important issues to be tackled before LS can be implemented.
Furthermore, it helped in interpreting the outcomes of the questionnaire. The case
study helped to identify the various forms of waste in the firms, and consider ways to
reduce it.
The interviews were focused on the managements’ approach with respect to
LS, as well as the general views of the key personnel and of shop-floor staff. The
author wanted to obtain their opinion on issues such as how they feel about working
for the firm, whether they are highly involved, whether they are aware of the
company’s strategy, etc.
The author spent four days in each firm; during his time in F1 he spoke to the
general manager, HR manager, quality manager, and production manager, along with
16 workers from the shop floor. In F2 he was able to speak with the general
manager, HR manager, sales manager, quality manager, production manager and 11
shop-floor workers.
At the end of the four days of the case study, the outcome was shared with
the general managers of the firms in the form of observations and suggestions on the
various issues. In addition, a report was provided that detailed the findings,
suggestions and recommendations, as well as explanations of how they can start the
lean journey by adopting key tools and techniques such as 5s, VM, VSM, fishbone
diagrams, TAKT time, etc., which they are not considering at the moment. The brief
reports submitted to the firms will not be included in this study, as they include some
confidential information and would not add any value to this research study.

302
5.4.1 Brief background of the case study firms
F1 is a non-family-owned firm and is ISO 9000 accredited. It produces
different types of plastic bags made from three main polymers (HDPE, LDPE and
LLDPE) of different grades, which are the main raw materials. These raw materials
are purchased from seven different suppliers who are based in Kuwait and abroad.
The customers are mainly from within the Kuwait, such as ministries, oil companies
and co-ops. Product volumes are dominated by the capacity for mixing. There are
some standard bags, but also many bags that are produced to customers’ specific
requirements. The bags are produced through two different processes, as illustrated
in Figure 21.
The current production capacity of the company has increased from 125
tonnes per month two years ago, to 200 tonnes per month. Currently, the firm is
failing to reach the required productivity despite a huge investment in buying new
machines and equipment.
Figure 21 Production flow process (F1)
F2 is a family-owned, ISO 9000-accredited firm. It produces a corrugated
carton, of which there are two major products: standard and die cut. The firm
produces a standard carton as well as customised cartons based on customer demand.
Its raw materials are purchased from 11 different suppliers, all of whom are based in
Kuwait. The firm’s main customers are restaurants, ministries, co-ops and oil
companies.
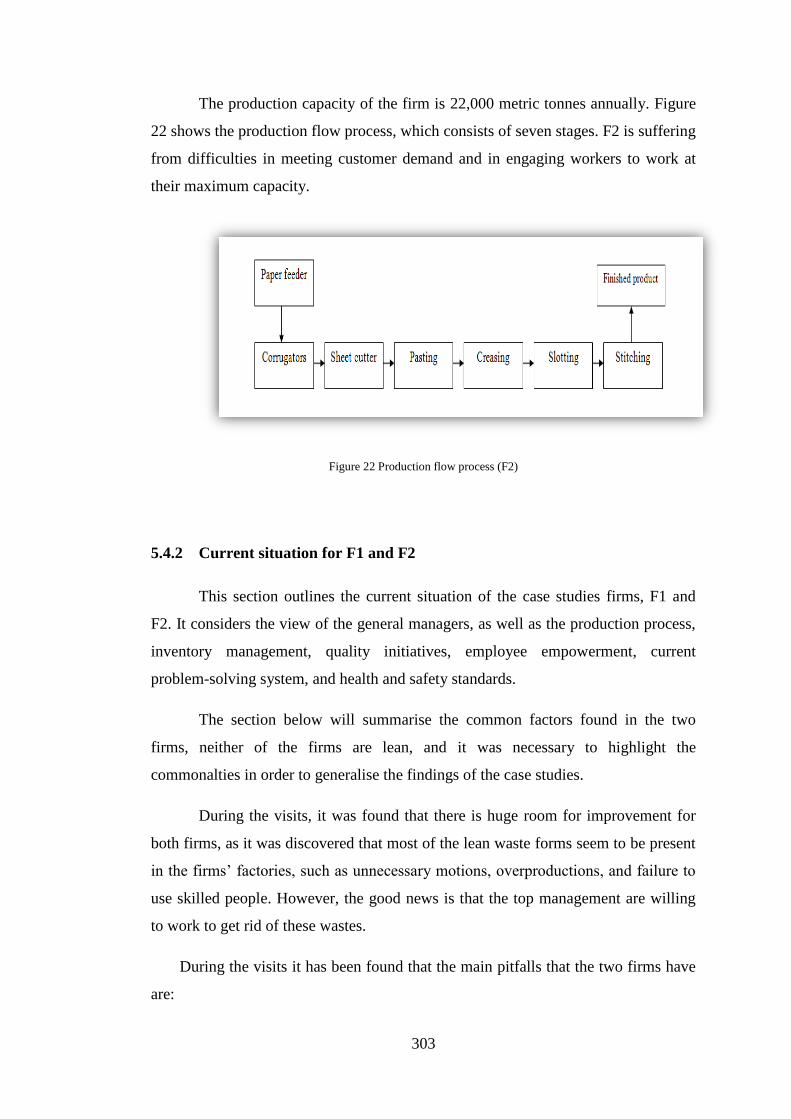
303
The production capacity of the firm is 22,000 metric tonnes annually. Figure
22 shows the production flow process, which consists of seven stages. F2 is suffering
from difficulties in meeting customer demand and in engaging workers to work at
their maximum capacity.
Figure 22 Production flow process (F2)
5.4.2 Current situation for F1 and F2
This section outlines the current situation of the case studies firms, F1 and
F2. It considers the view of the general managers, as well as the production process,
inventory management, quality initiatives, employee empowerment, current
problem-solving system, and health and safety standards.
The section below will summarise the common factors found in the two
firms, neither of the firms are lean, and it was necessary to highlight the
commonalties in order to generalise the findings of the case studies.
During the visits, it was found that there is huge room for improvement for
both firms, as it was discovered that most of the lean waste forms seem to be present
in the firms’ factories, such as unnecessary motions, overproductions, and failure to
use skilled people. However, the good news is that the top management are willing
to work to get rid of these wastes.
During the visits it has been found that the main pitfalls that the two firms have
are:

304
A lack of communication between workers and departments, as it is clearly
noticeable that both firms have diversity in terms of their shop floor, where
most workers do not speak a common language. Strong communication is
vital for any improvement tools to be deployed.
Health and safety issues seem not to be considered a requirement, which
could have a negative impact on the workers’ performance and efficiency. In
storage rooms, finished goods and raw materials are mixed together without
partitions or signs. Finished goods kept for a long time in the storage areas.
ISO 9000 standards have been introduced as a brand and image strategy for
the company only, and workers in the factory do not seem to believe in them.
Furthermore, there are some issues that both firms can do little about, as they
come from external factors. These include space constraints in the factories, and
supplies of raw materials not arriving on time. The following section highlights the
current situation and the main findings in the important areas of production and
processes. Images will be included to show some of the findings, however these are
all from F1 as the manager of F2 did not wish to include images of his firm despite
the assurance that the researcher gave that firm will remain anonymous.
1. General managers’ view
Discussions were conducted with the general managers in both firms, in order
to obtain their views on LS and why they are interested in it. F1’s manager showed
great motivation towards LS, and seemed to have good knowledge about LS.
However, he was concerned about the requirements and what they would need to do
to adopt LS. When asked about his motives for using LS, he said:
We have made huge investments in the equipment but we haven’t been able to reach
the optimum production levels and after reading many […] lean success stories we
believe LS can have good impact […] however we are not […] sure if LS can be
implemented in our firm as we have struggled to get our workers to digest […] ISO
9000.
From this discussion, it appears that F1 does not incorporate its people as it
should, and some negative signs indications were given by the manager. For

305
instance: the firm does not have regular meetings or focus groups to tackle problems,
and when problems occur they improvise to figure out how to solve it.
F2’s manager is interested in LS as he never believed in ISO 9000, but he
only had a little knowledge of LS so the author had to explain to him what it is, how
it can be achieved and what the benefits of adopting such a system are. The main
problem facing F2 is its difficulty in meeting customer demand and in engaging
workers to the maximum level possible.
After a thorough discussion, the general manager said:
This system [LS] […] despite all its benefits, […] wouldn’t work in our firm and I
don’t think it can work in K-SMMIs […] we have far too many limitations to make
it happen, such as skilled workers that we can trust, and more importantly the
business environment doesn’t help.
Similarly, F2 indicated that the firm does not have regular meetings or focus
groups, which will certainly limit employee effectiveness. In F2’s case the general
manager is not keen on LS, unlike F1’s manager who shows a great motivation in
this regard.
As highlighted previously, supplier relations are required by LS. The strategy
in both F1 and F2 is to have as many suppliers as possible, so they do not have close
relations with them as they believe that by expanding the number of suppliers they
will be able to get a good price and faster delivery. Equally important is customer
relations; both managers have been asked about their whether they have a system in
place to deal with customer complaints, and whether they have a feedback system.
The reply from both was negative on each count.
2. Inventory management system
Here, the aim was to learn whether the firms have proper storage system, in
terms of accessibility to the needed item, storage conditions, and level of inventory,
and to learn how long the items are kept in the store. An additional aim was to learn
what type of inventory system the firms follow.

306
Both firms’ current inventory planning system is more or less based on
materials requirement planning (MRP), without using MRP software. Three different
levels of planning are involved:
1. Demand planning based on weekly demand: the firms plan what needs to be
produced in upcoming weeks to fulfil the demand
2. Capacity planning: the firms consider the capacity available on the shop floor
3. Distribution planning: the firms decide how the products will be delivered to
their customers.
Within the current situation, a simple Excel spreadsheet is used to plan. It
was noted that there are high levels of inventory in both firms, including raw
materials and finished products. The materials are stored in locations that are
difficult to access, which will result in wasting time in terms of picking up the
required items or products. Figure 23 and Figure 24 shows the storage area for F1
(no real differences were noted for F2’s case).
Both firms are clearly not producing based on customer demands, as they
produce standard-sized items and keep these in stock, often before an order is
received. In F1’s case the production manager declared that some items are held for
more than six months. For F2, the production managers said: “we can’t wait for the
order from the customer to come we need to be ready as our customers are not
predictable”.
Figure 23 Raw materials and finished parts stored in a location that is difficult to access when needed

307
Figure 24 Materials stored in an improper way
3. Facility or production layout
The production layout is a key to helping produce according to flow and
minimising WIP. In this area the aim was to learn whether the firms have good
processes in place that support LS. For instance, is there a clear maintenance policy
to be followed? Are they working based on cell manufacturing? Are they producing
based on customer demand? To do this, observations were conducted as to how the
firms are laid out, and interviews conducted people at different levels within the
firms.
Presently, in F1 the facilities are laid out according to the process required,
from the beginning (mixing) to the end (cutting). It could be seen that from the raw
materials input to final product output, there are a number of wastes in the form of
motion and also large amounts of WIP, especially in the printing section. After
cutting, the finished products are transported back to the store, which again entails a
lengthy route. Similar machines are grouped together, which is good, but there is a
bottleneck between printing and cutting. There is always some WIP inventory in the
printing area.
In F2, the process starts with paper feeder and ends with end stitching. It was
found that from start to end there are clear wastes: for instance, between the sheet
cutter to pasting there seems to be a buffer, however when the production manager

308
was asked about this he replied that it is due to a lack of workers at the pasting stage.
Further, in F2 it was found that the equipment is not located in sequence. In Figure
22, it can be seen the process flow, but on the shop floor it was found that the
creasing machine is located before the sheet cutter, which causes waste in terms of
motion.
It was further observed that the production process at both firms was hindered
due to the following reasons:
Necessary and unnecessary items mixed together in the work area;
Tools, supplies, books and materials randomly located;
Workplace areas untidy and disorganised;
Minimal attention spent on overall housekeeping.
No recording of cycle time.
Currently, the process layouts for both firms are not efficient, one and
production is clearly not based on customer demand, which causes overproduction
and finished products that have to be kept in storage. Further, it has been found that
there is lack of information with regard to exact lead and cycle time, change-over
time, and so on; however, neither production managers revealed exactly what cycle
time is needed to produce particular products. Implementation of 5s is very
important. F1 had begun sorting out tools (part of 5s) a couple of years ago, but he
did not complete the task. As the general manager stated, “we have tried to make
people digest the 5s but we failed”. 5s can be an important tool to use as a part of the
lean journey or for LS implementation.
Some sort of labelling of equipment was found in both firms, but there is too
much equipment in areas where it is not needed. The production manager in F2
commented that “we have to leave the equipment here because there is no room for
it”. Further, the tools and equipment are not kept in specific places; most of the tools
are stored in large boxes, which will cause wastes of motion if other workers want to
use certain pieces of equipment, since they have to spend large amounts of time
searching for it. Again, this applies in both firms.

309
4. Quality initiatives
Both firms are ISO 9000 accredited. The aim here was to see whether ISO
9000 has helped the firms to excel to different QIs such as LS by looking at the
quality and management practices they are using; i.e. whether ISO 9000 has given
them a solid foundation from which to manage their resources. Further, it was
necessary to see what ISO 9000 has had on the company, and what employees think
about it (i.e. whether they are fully behind it). An additional aim was to see whether
employees have better working conditions following ISO implementation; to this
end, several workers from different levels were interviewed.
From the respondents it was learnt that ISO 9000 has not had a great impact in
terms of process improvement and quality; thus, apart from better sales and extra
documentation, nothing has been gained from ISO 9000.
The firms’ quality systems and procedures are ruled by the ISO 9000
certification. ISO 9000 was introduced by F1 five years ago, and by F2 four years
ago. According to the general manager, F1’s motivation to embark on ISO 9000 was
a proactive move, as the company wanted to ensure the quality of their products and
provide better-quality products to its customers. Moreover, it wanted to be eligible to
gain contracts from the government.
In F2, meanwhile, the general manager was straightforward in saying that the
firm was sure that ISO 9000 would not add value to its products, as the company has
no issues with quality. However, the firm made the decision to embrace ISO 9000 on
a reactive basis, as the government will not allow firms to bid on government
contracts without having ISO 9000 in place.
Both managers stated that there is no customer pressure on them to implement
ISO 9000; they said that the customers do not have a great deal of knowledge about
ISO 9000, and that though they care about the quality of the products, ISO 9000
means nothing to them.
Despite having ISO 9000 in place in both firms, it seems that not everyone has
been involved in the process of achieving this award, and the objective of the
registration was not properly communicated to the all staff. It was noted that there
was some resistance from the workforce in terms of the implementation of this

310
quality tool; for instance in F1 it was found that the production manager was highly
frustrated by ISO 9000, saying that “our jobs were far better and faster before
adopting the ISO standard”. The quality manager agreed with this statement. Most
(75 per cent) of the respondents from F1 complained that it takes far too long to fill
in the forms required by ISO 9000. According to the personnel interviewed, many
are not fully behind the ISO 9000 registration. It was mentioned during the
interviews that it can takes up to three hours just to document the procedures
required by ISO 9000.
In F2, there was huge resistance from a senior member of staff as well: the
sales manager explained that ISO 9000 had enabled the firm to gain many contracts
from the, government but he admitted that not everyone in the firm is happy about
this as it takes them a long time to fill in the required forms. This frustration was
explained by one of the shop floor workers, who said: “we could have used the time
more efficiently if we hadn’t implemented the ISO standard in the mean time I have
to spend two hours after work to fill in the form which is upsetting me”. The quality
managers in both firms said that ISO 9000 has not improved quality, though it has
certainly improved sales.
It is important that the top management communicates to all levels of its work
force the reason behind the application for ISO 9000 registration. Once the benefits
of ISO are communicated, workers will soon realise that it not only involves filling
in forms, but is also a tool that can reveal the hidden problems in manufacturing and
maintenance. Additionally, it can help to increase customer demand, which will
reflect positively on the employees’ career.
The ISO 9000 series can be used to control and direct an organisation in order
to improve the effectiveness and efficiency of performance, with emphasis on
continuation of improvement. To make ISO 9000 successful, it requires effort from
all levels of the workforce. Therefore, it is imperative that the benefits of it are well
communicated to everyone concerned. Announcing the results of ISO projects,
including successes and challenges, will help future projects to avoid making similar
mistakes, and to adopt best practices. Employee empowerment is an important aspect
of any quality initiative, if it is to be successful.

311
It is also important for the company to make ISO 9000 one of its main
instruments for communicating quality to its customers. It is well accepted that an
organisation that has obtained ISO 9000 certification will gain competitive
advantage over its non-certified competitors. It is therefore recommended that both
firms display the ISO 9000 certificate in prominent locations within the company –
i.e. where people can easily see it. It has to be considered a quality tool that the
company has great pride in. It is envisaged that as the company grows year by year,
the benefits of ISO certification will be realised in terms of increasing productivity
and efficiencies.
ISO 9000 requires top management dedication and contribution in terms of
resources and effort. The discussions and meetings with the top management of F1
and F2 clearly show that they are committed to this, which is an important step
forward for the proposed lean journey. There is a general thought that management
in both firms are trying to squeeze the workers harder by implementing the ISO 9000
standard. However, it was noticed that there is full commitment from the top
management for this QI.
As was learnt from Chapter 2, LS requires buy-in from the whole organisation,
and people often will not accept it unless they see real requirements to do so. From
the ISO 9000 experience, it is acknowledged that the firms have not communicated
its features well to the companies’ people, and have not convinced them to accept the
QI; this is something they really need to overcome if they want to succeed in their
journey.
5. Employee empowerment and communication
There were many aspects of concern in terms of employee communication. For
instance, it was necessary to identify whether the firms have a clear policy for
collecting employee suggestions, and clear awards and bonus systems, and see
examples of suggestions that have been implemented by the firms. These aspects
could be identified by interviewing employees from different levels, as well as
seeing for ourselves how the employees submit their suggestions.
Moreover, it was necessary to know what the relationships between
departments are like; i.e. whether there are conflicts, and whether every department

312
is aware of the other departments. Furthermore, it was important to see where people
are spending their lunch breaks, and the condition of facilities offered by the
companies to their employees.
When QI are introduced, people will be facing cultural changes and
challenges, which they must fully understand. This requires having a clear
communication plan and channels, motivating individuals, and educating senior
managers, employees and customers on the benefits of quality initiatives.
Communication is important, as organisational members need to communicate in
order to accomplish their tasks efficiently.
During the course of the case study, it was found in both firms that there were
many employees who had specific skills in quality and improvement plans. In F1, for
example, the author spoke to a shop floor worker who has a great deal of knowledge
about LS, but the company had not identified this and had made him responsible for
filling out the required forms for IS9000, as he can speak and write English
perfectly.
In F2, one of the technical workers was asked whether this is the right job for
him in terms of fully utilising his skills; he replied as follows: “no I can do a much
better job within other areas of the firm but the boss wants me here so I have to
accept it”. As a result of a lack of meetings with shop-floor personnel, talented
workers are keeping silent because there is no environment in which they can openly
share their views. This untapped talent can be utilised if there is a system in place via
which where people can share or contribute. This can be very helpful in problem
solving. The best way to get people involved is to create and form a problem-solving
group, continuous improvement group, etc.
QI such as LS cannot be successfully implemented in the absence of good
communication. Communication and participation is important for LS success, since
people in the company depend on one another for effective flow of information.
People’s empowerment is another key to starting the lean journey. In the
empowerment process, the shop floor staff should have increased decision-making
authority.

313
In F1, there seemed to be no clear communication between departments, and it
was found that there is a conflict between the sales and production departments,
wherein the sales managers are pushing hard for orders, without knowing the current
situation in the production department. The production manager said, “This is
causing us to work extra hours and leading to stressed out workers which is not
ideal”.
With regard to the suggestion criteria, the general managers were asked to
show the researcher how many suggestions they had received from employees, and
what the procedures are for people to make suggestions or recommendations. F1’s
general manager explained that they do encourage their employees to provide new
ideas; however “it is really difficult to encourage people as our workers don’t speak
English or Arabic”. It was found that F1 does not keep a record of suggestions made
by employees, though they do have an old, dirty box called a “suggestion box”.
In F2, the situation is similar: there is no proper suggestion programme that
encourages people to participle. Both general managers were asked about bonus and
rewards systems, and said that the end-of-year bonuses are based on sales only.
When asked about the last bonus offered to their employees, the general manager of
F1 said that it was equal to 130 GBP, while in F2 was 60 GBP.
In both firms, workers do not have a great deal of authority or empowerment;
rather, the production manager makes decisions for every aspect, as explained by
most shop floor workers in F1 and F2. Further, it was noted that neither firms
follows a clear training strategy, and this was identified by asking both HR managers
in the two firms to show the author their training records. At the end of the session,
the author asked to see where the shop floor workers spend their time during breaks:
in F1 it was identified that the room is not in good condition, but is dirty and untidy,
with no TV or any other type of entertainment facilities; thus, people are lying down
and sleeping, and no one is talking to each other, which is not a great environment to
encourage people to work in. In addition, workers have to bring their own food with
them as there is no canteen.
In F2 the break room is in slightly better condition than in F1, but people are
still not socialising and all seem to be tired and bored. When asked about his future
at F2, one shop-floor worker said: “I am only here for a few years make money then

314
go home […] I can’t spend my whole life in a similar position life is going and I
have to move on […] I can’t see a clear organisational structure that would allow me
improve my situation in this company”.
It was sensed that the shop floor workers are deflated and unmotivated, and
this feeling came from the vast majority of the shop floor workers interviewed in
both firms. It is believed that this aspect must be taken seriously if both firms want
their employees to perform to the maximum level. Also, it is important that the roles
and responsibilities of each employee, whether engineer, technician, supervisor or
operator, are outlined in a clear job specification, which will help them to understand
how well they have done and what they are supposed to do. As shown in the
interviews, many workers do not know their responsibilities, but just wait for the
production manager or supervisor to assign them with tasks; this applies to both
firms.
In both cases (F1 and F2) there seems to be a distance between top
management and shop-floor workers. Both firms showed that they are following a
clear strategy and mission, however most of the shop-floor workers that were spoken
to showed they are not aware of the company strategy: one of the employees on the
shop floor in F1 was asked about what he knows about the company vision, and
replied: “I don’t know in the past we used to be offered overtime which we always
looked forward to but for the past two months the company has stopped the overtime
[…] I think the company is going bust and this is why they stopped”.
When a worker in F2 was asked the same question, he replied, “it is not my job
to ask about the general strategy I come here every day to do my job then leave”.
Both general managers said that they do communicate the companies’ strategy
to key personnel within the firms, but they also highlighted the difficulties in
communicating with people due to the language difference. In addition, F2’s
manager stated: “our workers don’t have great ideas, they are technicians and their
job is to work with the machines and our job is to set the strategy”. This indicates a
lack of communication, and this may be why both firms have difficulty convincing
their people about the benefits of ISO 9000 adoption; as it stands LS will not be
useful within such an environment.

315
It was realised during the case study visits that the vision, mission and strategy
of both firms is not publically stated. A clear indication of where the company would
like to be needs to be communicated to all stakeholders, which in turn will motivate
them to achieve the firms’ vision. It is advisable for firms to organise an away
vision/mission day for all staff in which the company’s vision, mission and strategy
is formally outlined. An experienced consultant could be utilised to facilitate this
event.
6. Problem-solving technique
In relation to problem solving, the aim was to see whether VM is being utilised
in the firms in terms of recording defect rates, future plans, instructions, problem-
solving techniques, charts, etc. Further, it was important to understand whether there
were records of meetings held for problem solving, and what the outcomes of these
meetings have been.
Currently, neither firm seems to have an established, coherent system for
production or quality-related problem solving. To improve efficiency and
productivity through QI, problems must be identified and taken care of. It seems that
there is currently no coherent or scientific method within the firms to identify
problems and tackle them using suitable tools and techniques.
In F1 there is some sort of VM, but this is mostly outdated. In both firms there
was a lack of any type of VM that shows clear instructions, such as charts, targets
etc. Both production managers in the two firms agreed that such tools could be a
good idea, and suggested that they may consider them in future as the tools could
help to improve communication. By visualising information, employees will be able
to access the information they need very easily, which will help them in
understanding their role without asking questions, and contribute in a positive way to
the success of the company.
Moreover, comparing monthly productivity can motivate employees to achieve
company targets and show them the current state vs. desired state. Many things can
be added to a VM board, such as process metrics, work instructions and general plant
information.

316
As mentioned above, neither firm has proper problem-solving or problem-
identification methods in place; without problem identification, there can be no
improvement. In order to be efficient, the system has to be accessible to every
employee and everyone should have a chance to share their own ideas. Identification
must come from numerous sources.
In addition, different methods have to be used to identify problems. Sometimes
the problem just shows up, but most of the time the problem is only a quiet risk
waiting for the worst moment to appear. Inspections, audits, brainstorming, Ishikawa
analysis (fishbone diagram), structured interviews and semi-structured interviews
with employees are all important in this regard. Using numerous sources and various
methods help contribute to efficient identification of workshop needs.
By using a system of visual cues and visual communication tools that impart
information at the time and place it is needed, improvements can be seen in
productivity, safety, quality, on-time delivery, profits and employee morale.
VM makes the process smoother, since it saves time in identifying
equipment, materials and locations; describing actions and procedures; and providing
safety warnings and precaution information. Visual controls help employees avoid
wasting time by giving them the information they need, where and when they need
it, especially when there are language barriers.
VM is a lean technique designed so that anyone entering a workplace, even
those who are unfamiliar with the detail of the processes, can very rapidly see what
is going on, understand it, and see what is under control and what is not. Essentially,
the current status of the operation can be assessed at a glance. More importantly, it
will make problems more visible.
7. Health and safety
This area addressed the working conditions within the firms, in terms of
employee clothes, safety shoes, mask and goggles, which is especially important in
this type of industry as it deals with hazardous materials. Increasing safety for
workers, diminishing the number of accidents, and protecting the environment is of
paramount importance to any company.

317
F1 and F2 have limited space, and are currently operating under the tight
available space in closed buildings. In F1, it was noted that there is no ventilation
system in the working area, despite it being a critical aspect, since the odour of
printing materials is hazardous to the health of employees, especially those in the
production line. Therefore, F1 should take address this problem by installing vacuum
suction equipment. In addition, a proper air conditioner or efficient fans in the
production line area would certainly enhance the production efficiency and comfort
of the work force.
F2, on the other hand, keep some hazardous material near the storage area. In
terms of uniforms and safety products for employees, both firms are lacking; for
example people working in the printing section in F1 do not wear masks. People on
the shop floor production line were also noted to be wearing slippers. Thus, there is
clearly a lack of awareness towards health and safety issues from both firms, which
needs to be considered. Figure 25 show some pictures taken from F1.
Figure 25 Flammable liquids stored within a closed storage area for raw and finished materials
It was found that both firms are lacking in the following areas:
Display of health and safety charts/posters;
Poor condition of staff break rooms;
Unclean and messy working areas;
No use of safety goggles, gloves or masks;

318
Flammable liquids and hazardous materials not stored in separate
designated area.
In order to increase safety for workers, the above issues need to be considered
by both firms. Implementing measures to overcome them should lead to an increase
in staff confidence in the firm, and eventually to increased efficiency and
productivity.
5.4.3 Phase three concluding remarks
These case studies investigated the readiness towards LS at F1 and F2, The case
study results show that both firms currently have many forms of lean wastes, such as
over-production, high inventory levels, high waiting time, unnecessary
transportation, lack of use of skilled people, and unnecessary motion.
Table 66 shows the areas observed during the visits. It shows that both firms
are lacking in, and ignoring, many aspects that are required by LS, which will affect
the smooth running of their businesses and contribute to creating wastes.

319
Table 66 Observed areas in F1 and F2
Observed area Firm
F1 F2
Labelled items, equipment and floor × √*
Designated area for tools and equipment × ×
Condition of tools and equipment (maintenance) √* √*
VM (charts, instructions, schedules, etc.) × ×
Safety environment (ventilation, health and safety clothes, etc.) × ×
Process layout (flow, low WIP, etc.) × ×
Storage area × ×
Workers’ uniforms × ×
Cleanness and tidiness (workplace, storage, etc.) × ×
Suggestions system √* ×
Workers’ break room (facilities) × ×
Records of important issues (cycle time, lead time, etc.) × ×
Note: × Firm does not have, or has but keeps in very bad condition; √ Firm has and keeps well organised; √* Available but not to a great extent

320
The case study observation and findings also suggest that there is a great
potential for LS to be implemented in F1 and F2, and it is highly likely to help both
firms to eradicate all type of wastes and improve their production rates. However,
the organisational culture in both firms is currently unsuitable for LS: shifting to LS
requires a structure that comprises strategic vision of management, leadership
commitment and skilled people. Further, the firms need to use funding for training
purposes and expertise, as well as improving in relation to their organisational
culture and empowerment of employees.
F1’s manager showed an interest in going further with this, and stated that he
will consider implementing LS in the future; in F2 the scenario is slightly different,
as the general manager shows less desire to adopt LS as he believes it will not work
within the Kuwaiti context, considering the requirements of LS.
Based on the visits, several tools and techniques within LS would help both
firms to move forward in their production. For example, they should adopt 5s, VM,
PDCA cycles, fishbone diagrams, and TAKT time. These tools and techniques
would help both firms to eradicate many wastes. The case study gives a better
picture about K-SMMIs’ readiness towards LS, and helps to reveal the outcomes
obtained from the questionnaires, observations and the semi-structured interviews.
The case study also helps to answer the RQ1 and RQ5: it was found that both firms
are far from being LS ready, and their awareness of LS is modest. This supports the
findings from phase 1 and phase 2.
Further records of important events and sharing this with other members staff
or teams is vital. Quality circles (QCs) should be formed, and the team leaders could
initiate these in both firms, and must make sure that all workers have access to all
required information.
5.5 Phase four: Expert panel
After collecting and analysing the data from the questionnaires, interviews,
observations and case studies, an expert panel was approached, including a quality
management practitioner, academic staff from Kuwait University who are teaching
lean and quality management subjects and have published papers relating to quality

321
management within the Kuwaiti context, ISO and quality management consultants,
and finally people from government institutions who are directly involved in Kuwaiti
industry and are aware of the relevant policies. Semi-structured interviews were
conducted with the experts (lasting between one and three hours).
The reason behind using an expert panel’s opinion and knowledge is to add
trustworthiness to the findings of the research, which will enhance the robustness of
the outcomes as well as guiding the researcher’s perspective. Furthermore, it will
help to answer RQ1, RQ2, RQ3, RQ4, RQ5, and RQ6, and unveil hidden areas that
could not be addressed in the previous phases.
The experts were divided into two groups. The first included people from the
government institution (14 persons), and will be referred to as (EXP1); the second
included experts from Kuwait University and consultants (12 persons), and will be
referred to as (EXP2). The participants were assured that their names would remain
totally anonymous. The first question was created to identify the experts’ opinion of
the performance of K-SMMIs.
Question 1: How would you value the current contribution of K-SMMIs
towards Kuwaiti economy?
Most of the respondents agreed that K-SMMIs are making no real
contribution or impact towards the economy. According to the respondents, K-
SMMIs do not play much of a role in this regard at all. One of the participants from
EXP1 stated: “we are planning to engage the K-SMMIs to enhance their role but it is
still early to talk about their impact”.
Question 2: During our visit to 50 K-SMMIs, we did not see a great deal of
quality practices. What are your thoughts on this?
The vast majority of respondents were not surprised about this; the general
thought about the lack of quality practices in K-SMMIs is that they lack knowhow
and feel there is no real need to adopt QI. According to one EXP1 “we have
encouraged […] firms to adopt QIs such as ISO 9000 but they are too slow to go for
it”. One EXP2 stated “there is nothing to force [firms] to adopt QI, their main
concern [is] to make the business go forward and they have that without real QI”.
Another EXP2 stated:

322
Kuwaiti industries are concentrating on generating profit for one main reason which
is the lack of competitors in the market […] in Kuwait there is no real pressure from
other industries as there is [a] very small number of foreign industries and this has
resulted in their ignoring the QI […] if you don’t feel pressure you don’t have to
develop […] quality is the last thing to consider when producing a product or
service as far as the Kuwaiti market is concerned.
Another EXP2 pointed out that, “[firms] can gain governmental contracts and
projects based on their links not their quality system”. Most of EXP1 believe that
despite all the drawbacks of the working environment in Kuwait, firms can still
improve; however, they are not considering these issues as they are not ambitious
enough.
Question 3: What are the barriers that are preventing the K-SMMIs from
adopting LS?
According to the respondents from EXP1 and EXP2, there are many aspects
that are preventing K-SMMIs from being world-class firms. However, all experts
agreed on the following points:
The lack of skilled workers in K-SMMIs
The lack of knowhow about implementing LS
The lack of leadership to drive the required changes
The lack of top-management commitment
The lack of quality culture.
One EXP2 stated: “in [K-SMMIs] there is a missing link between top management
and shop floor people, which is not useful for LS”.
One EXP1 stated:
The K-SMMIs are receiving a lot of support from the government and they [take] it
for granted […] they receive cheap electricity, water, fuel and even […] training
[…] they don’t want to go for LS to cut out a few steps in their process or to save
electricity bills or to save energy, those things don’t seem to be a problem for them
[…] their main concern is making a profit and they are making one, so why would
they turn their attention to difficult and complicated QI.

323
Question 4: Based on our analysis we could not see any differences between ISO
9000- and non-ISO 9000-accredited firms. Could you explain why? (Only
answered by EXP2 group)
One EXP2 said, “you are absolutely right, firms are opting to go for ISO
9000 for only one reason: to expand their sales […] by being ISO 9000 [accredited]
firms can […] bid for many governmental projects”. Another EXP2 stated:
ISO 9000 is a big problem in Kuwait, as it has been run by many corrupted
companies […] in Kuwait you can easily get an ISO 9000 certificate without
changing anything in your process, any company in Kuwait can purchase the ISO
certificate from one of the ISO agents and the company doesn’t have to worry about
the [application process] as the agents can arrange it with an auditing agent they
know personally […] it’s corrupted [and] this is why you can’t see a great impact
from ISO accreditation.
Another EXP2 said:
Many companies [in Kuwait] nowadays are going for ISO 9000 but they still lack
key ingredients such as […] buy-in from the top management and from shop floor
alike […] when we visited many companies for ISO 9000 implementation we found
that the top management are not serious and not committed and just wanted the ISO
certificate as soon as possible.
Most of the respondent concluded that ISO in Kuwait is a branding tool, not a
quality tool. As one EXP2 said “lately the government has forced […] industries
to have ISO certification so they bought the certificate only without gaining the
benefit from the certificate in terms of improving the quality of their product”.
Question 5: We did not come across any Kuwaiti workers within K-SMMIs
during our visits. Could you explain the reason for this?
Most of the respondents agreed that most Kuwaiti people prefer to work
within government sectors, where there is a minimum workload, security, and good
wages. According to one respondent from EXP1, the Kuwaiti government is lacking
in terms of strategic thinking; it spends a huge amount of money on education by
sending students to different universities in the UK and the US, without studying the
market needs. He added, “There is no great incentive to work within K-SMMIs as

324
these sectors are highly neglected by the government and we are doing our best to
make it attractive”. Another person from EXP2 highly attributed this issue to the
mentality of Kuwaiti people, stating that:
Kuwaiti people are lazy and not willing to use the qualifications that they have
gained from western universities. They want to work in governmental jobs so they
can build relationships and use them for their own benefit.
Question 6: Does the national culture prevent K-SMMIs from adopting LS?
Most of the respondents from EXP1 and EXP2 agreed that the national culture is one
of the most vital aspects inhibiting the adoption of LS. As EXP2 explained:
Let me put it this way, Kuwait […] highly values nepotism and favouritism. Why
would the firms go for LS which may cost them a lot and may not work well, when
they have […] contacts with key people and relatives in the government who can
help them in selling their products without having great quality systems in place.
Another EXP2 stated:
The Kuwaiti culture promotes laziness and not working hard because you will
always find someone to help you, plus we always believe that the future is in God’s
hand, and that’s why in K-SMMIs’ minds they […] won’t be able to sell their
products even if they adopted all of the QIs if it against […] God’s wish and they
will make money and sell all their products if […] God wants them to, even if their
products are not high quality.
The experts explained that LS requires delegation, empowerment and
participation. In Kuwait there is huge respect for managers, and workers always try
to make managers happy. In addition, managers are not willing to delegate
responsibilities to others.
Another EXP2 said:
If we want to know why the K-SMMIs are far away from lean we need to study the
Kuwait organisational culture and national cultures, foreign investment, corruption
and transparency so we can know why we are behind as far as LS is concerned […]
By knowing those things the fact that Kuwaiti SMMIs are far from LS would make
sense […] As the main concern in K-SMMIs is to have links with government so
325
they can provide them with the service and product […] once you have links you
don’t need to have LS.
Question 7: What is your opinion about the quality of labour within K-SMMIs,
and does it affect the K-SMMIs in terms of adopting LS?
There was general agreement among most of the respondents that in Kuwait,
and especially in K-SMMIs, there is no skilful labour, as most of the firms are not
producing complicated products. The experts believe that the quality of labour in
Kuwait is delaying the implementation of LS, as LS requires skilled workers to
implement, sustain and participate in improvement every day. One EXP1 said: “K-
SMMIs are opting for cheap labour as they want to keep the cost down […] with low
quality labour your business can’t improve so this is surely affecting the adoption of
LS”.
Another EXP2 explained that:
Skilful labour is always good for any business however the K-SMMIs are not doing
enough, there is no harm in keeping the cost down and recruiting cheap labour but
the K-SMMIs have to invest in training to improve the capabilities of their workers,
but this is not happening.
Another EXP2 said:
LS encourages […] empowerment and employee involvement. In the Kuwaiti case
this is very difficult as they are [relying] on low-quality labour and you can’t
empower people if they have nothing to offer and you can’t expect low-skilled
people to drive the business forward.
Again, most of the respondents believe that because of the lack of skilled
labour the top management cannot communicate their vision and strategy to their
employees; this in turn results in a huge gap between top management and shop-
floor people.
One EXP1 explained that it is the top management’s fault that they are not recruiting
highly skilled people, and now the government are considering issuing a rule that
will force industries to recruit people who can speak English, as most labourers do
not speak English or Arabic, which is almost certainly affecting the industries’
performance.

326
Another EXP2 said:
[Non-Kuwaiti] labourers are not highly motivated because their wages are very low
compared with Kuwaiti people. I have found that there is a gap between Kuwaiti
people who are satisfied and saturated [in terms of wages] and foreigners or
labourers who are discontented [since they get paid far less compared with
Kuwaitis], so there is injustice that affects the motivation negatively.
Question 8: How many K-SMMIs have asked for your consultancy with regard
to LS or QI implementation in recent years, and what was this consultancy
specifically for?
Most of the respondents declared that the K-SMMIs are ignorant about QI,
and that LS is barely known by those industries. QI can only be found in large
industries, where they are not adopted by choice, as most of these companies have
partnerships with foreign firms that force them to adopt QIs such as ISO 9000, six
sigma and TQM. According to the respondents, LS is not well known even in large
industries in Kuwait.
Another reason for the K-SMMIs’ failure to take advantage of consultancy is
the related charges, which K-SMMIs cannot afford. According to one EXP2,
“Kuwaiti organisations in general are not serious when they consult with experts;
this is exactly what Tony Blair’s study shows, they paid him for his consultancy but
it was kept in a drawer, nothing has been implemented yet”.
Question 9: During our site visits to K-SMMIs, we found that many firms are
not taking care of their premises in terms of storages or health and safety (e.g.
no ventilation and no work shoes). As a governmental institution, do you
conduct periodic visits to K-SMMIs, and do you issue fines to firms that are not
following industrial rules? (Only for EXP1 group)
Most of the respondents agreed that they do not conduct periodic visits, and
stated that they barely ever issue fines. They are fully aware that firms are breaking
the rules, but they can do little about it. As one EXP1 said:

327
I have got to be honest with you, our institution is like many other governmental
institutions, we set the rules but we never follow up as many times we have issued a
fine then […] discovered that the firm didn’t pay because they know people in
higher positions who have helped them to drop the fine […] and this has lead our
employees to feel that there is no need to make an effort and conduct visits if
nobody will respect them.
Another EXP1 said:
Managers are greedy. They only think about making money, not about creating the
right environment for their employees, and because most labourers are coming from
poor countries they don’t complain and just accept the situation […] most
importantly [labourers] are not fully aware of their job description and their rights.
Furthermore, one EXP1 admitted that:
Most of the firms are working in small spaces; they don’t have spacious storage
rooms so they cannot arrange them and make them tidy and we as governmental
institutions […] have to […] make it easy for […] firms to expand, but due the
lengthy procedures, expansion could take many months or years to be approved, and
this is not in our control.
Question 10: Are you satisfied with your role in developing the manufacturing
sectors? (Only for EXP1 group)
The respondents agreed that there is always room for improvement, and
pointed out that though the government has offered the manufacturing sector a
number of privileges, the managers of firms are not doing their best to improve.
However, one of the experts explained that there are many flaws in government
offerings, which have resulted in many firms immigrating to Saudi Arabia, which
offers a better business environment for them.
According to another expert, “the government are spending heavily to
develop this sector but not according to a proper plan […] Kuwait can create good
manufacturing industries as money is not an issue; the issue is how to manage the
resources and this is a mutual responsibility for the government and the business
owner alike”.

328
Question 11: During our visit we heard many stories regarding the disjointed
policies set forth by governmental institutions. Do you agree with this?
Most of the respondents agreed with this and attributed it to a lack of
coordination between the different government institutions. One EXP1 said that it
“happens because there are many conflicts of interest, like for example one day you
find certain governmental institutions issue a rule, and on an other day you find other
governmental institutions issue different rules that contradict each other, and that is
because […] the governmental institutions are run by merchants”.
Further, many of the experts said that this conflict and contradiction in rules
is adversely affecting the manufacturing sectors; they attributed this to the fact that
some governmental institutions set rules based on merchants’ interests, which has
prevented FDI from coming to Kuwait, and when there is no FDI, there cannot be a
highly competitive market.
One EXP1 said:
I agree with you there are many disjointed policies and I can tell you the reason why
[…] there are some key positions held by incompetent people […] I worked in one
of the governmental institutions and I saw myself people who are working on the
industrial cases but have no qualifications regarding the manufacturing industries,
and yet they made crucial decisions.
Question 12: As you know, LS requires strong relations with suppliers and
customers. Do you think K-SMMIs have the potential to create these relations?
Many of the respondents said that it is too difficult for K-SMMIs to build
these kinds of relations. In terms of suppliers, they believe that in Kuwait there are
no quality suppliers in terms of delivery and quality; in addition, they said that these
suppliers are just like K-SMMIs – i.e. not highly educated and lacking awareness of
many aspects required by LS. In terms of customers, the respondents said that K-
SMMIs are mainly from governmental sectors and co-ops; in terms of governmental
sectors firms do not have to have great quality as they can easily snatch deals based
on links, and in terms of customers there is a lack of understanding about quality.
Customers do not care about having ISO 9000-certified products if it increases the
price; they rather go for lower quality for a better price.

329
One EXP2 stated:
The customer and supplier relations in Kuwait are not at a mature stage […] you
wouldn’t find any K-SMMIs conducting surveys with customers and you wouldn’t
see supplier involvement, which are essential for LS but unfortunately firms don’t
see this.
Question 13: Can you describe the ability of top management and leaders in K-
SMMIs? Do you think they have what it takes to adopt LS and be successful?
Once again, most of the respondents suggested that K-SMMIs are lacking in
these aspects. They agreed that LS requires huge attention from top management, as
well as strong leadership, however these factors cannot be seen in K-SMMIs. In
Kuwaiti large industries there is good management and leadership, as their
recruitment systems, as well as links with Western companies, forces them to have
these factors in place.
One EXP2 stated:
It’s difficult to find [top management commitment and leadership] within K-SMMIs
[…] they rely on one key player to drive the business and don’t encourage other
workers to participate […] I had met many of the workers in those industries and I
asked them about the company direction; apart from some key personnel in the
company none of the shop floor workers answered me and that shows that in Kuwait
we don’t have the maturity to deal with employees and demonstrate the weaknesses
of the management and leadership.
Another EXP2 said:
You would be surprised if you found a quality culture in K-SMMIs. You won’t find
top management delegating authority and responsibility […] you won’t find huge
commitment from top management and you won’t find leadership that creates a
quality culture.
Another EXP2 said:
People are the driver for any business; you have to understand the employees’ needs
and create an environment where they can perform and use their skills at the
maximum level […] that is not happening in Kuwait. Take a tour in K-SMMIs and
330
you will find people are not happy and many of them are assigned to jobs that don’t
use their skills.
One EXP1 stated:
Top management don't like to invest in training their people and workers. They don't
like to read and they don't like to be involved. They may invest in consultancy
programmes but they stay out of it and don’t get their hands dirty […] Plus they
don’t have […] strategic thinking ability, they are only concerned about short term
plans […] Kuwaiti leaders are not leading by example; they don't even understand
the value of the company and how things work or should work.
Other pitfalls were explained by an EXP2:
Managers only adapt systems that allow them to sell, so their main concentration is
external and they are ignoring the internal factor and respect for people, they follow
the show off principle […] Empowerment is not in place as managers in Kuwait like
to have the initial and final say on every aspect and the people only obey this and
don't have opinion.
Question 14: During our visit to the K-SMMIs’ shop floors we were unable to
find any visual management techniques, such as designated areas for keeping
items and equipment. In fact, we found the workplace to be untidy. How would
you explain this?
Most of the respondents believe that VM techniques require huge amounts of
effort and knowledge that are not available in K-SMMIs, as many do not consider
these issues important. One EXP2 said:
K-SMMIs don’t care about the working area; they don’t see keeping the workplace
tidy or using visual management as a factor to create a better environment […]
basically once the orders arrive from the sales department the production line have
to respond to them even if they have to work extra time […] K-SMMIs don’t have
the mentality of taking precautions […] they would rather leave the situation as it is
and if they need to work harder they have no problem, as their workers will never
complain about getting overtime.
One EXP1 stated that:

331
These things don’t represent problems to K-SMMIs, considering the low skill levels
of employees and the uncomplicated products they produce […] they believe having
charts, results, etc. […] won’t have a positive impact […] I would say they are
ignorant.
Question 15: How would you describe K-SMMIs’ opinions on the importance of
training?
The respondents explained that most of the K-SMMIs do not follow a clear
training policy because they do not know what they want from it. As one EXP2 said:
“the main concern of […] K-SMMIs is to have training certificates, not to develop”.
The experts explained that small and medium-sized companies always face a limited
budget, which is why they do not invest in training; firms who do provide training
often do it for the sake of ISO 9000 requirements, rather than to meet a real need.
Question 16: As it stands, do you think K-SMMIs have the right foundations
and the potential to adopt LS?
Most of the answers to this question were “no”, but the experts agreed that K-
SMMIs could have potential if they are able to deal with the inhibitors that surround
the manufacturing sectors. According to the respondents, in Kuwait there are many
internal and external obstacles that prevent K-SMMIs from considering LS in their
firms. One EXP1 stated:
In order to achieve world-class firms, the Kuwaiti government must create a sense of
urgency and make the firms improve, and that won’t happen unless there is a
transparency from the government in terms of accepting deals and projects. If they
can do that the firms will be forced to implement LS and other QI to improve […] in
the mean time the firms don’t feel any pressure to improve.
EXP2 added:
The firms’ management has to change; they must understand the potential that LS
can give to their company […] the recruiting policy has to change so that they
recruit highly qualified people […] the business environment has to change to be
more competitive so the companies […] feel the pressure and improve to survive
[…] as it stands this is not available in Kuwait.
Furthermore, another EXP2 added:

332
K-SMMIs are run by people who are not ambitious enough […] let me give an
example: can you run 10,000 meters after eating a heavy meal? […] This is the case
in K-SMMIs; the management are satisfied and full, they can’t move and they don’t
think outside the box because they don’t need to as there is no real urgency or
pressure […] pressure can be created by the government but they don’t want to as
they are not serious about this sector.
The respondents explained that the change has to come from within the
organisations by enhancing awareness in order to be ready for changes; at the
moment, the vast majority of organisations are far from being ready to follow what
other organisations around the world have achieved. The top management have to
have buy-in, show real commitment, and lead by example; there is a need to
implement intensive leadership training so they can convince their people of the
merit of their ideas.
Furthermore, one EXP2 explained that if top management asks for help from
consultants they must participate in the programme themselves, discuss it with their
people and show them why they are trying to implement such a system, as well as
what benefits they are trying to achieve. They also need to have good measurement
systems in place so they can assess their progress and modify it, then sustain it and
make it their way of life; they will only achieve this if they develop their human
capital, create a better working environment and involve employees in formulating
the organisation’s strategy. However, many Kuwaiti organisations – not only K-
SMMIs – are currently lacking key aspects; they do not have a quality culture in
place.
Confidence levels in K-SMMIs’ managers and workers are very low; K-
SMMIs’ managers do not like to be innovative and use initiative, and instead prefer
to follow others in terms of their successes. For example, most companies that have
adopted ISO have done so based on external motives – i.e. to improve sales – but
have not changed their internal processes. EXP2 suggested that this is a critical issue,
since ignoring the internal aspect will not lead an organisation to long-term success,
whereas changing the internal factors will lead to external success by default. Other
EXP1s believe that most of the K-SMMIs are not yet ready for change; their main
concern is not to sustain the business in the long term, but rather strive to generate
instant profit.

333
5.5.1 Phase four concluding remarks
Meeting with the expert panel yielded a more thorough understanding of the
K-SMMIs, as well as the factors that are affecting or delaying their introduction of
LS, which are external factors as well as internal.
The external factors arise from corruption in dealing with governmental projects and
contracts, as well as corruption from the ISO agents, who can easily offer the ISO
certificate without forcing firms to actually make the required internal changes.
Firms can go and buy a certificate just to show to customers that they are ISO
accredited. Furthermore, because of nepotism and favouritism, firms can gain more
projects regardless of their quality; this is in line with several researchers (e.g., Al-
Kazemi and Ali, 2002; Harry, 2007; Blair, 2009; Kinninmont, 2012) who claimed
that the corruption level is very high in Kuwait. The experts also emphasised that
there is no real urgency for firms to go beyond ISO, and no real competition in the
Kuwaiti market. Furthermore, they highlighted the lack of attention from the
government, as the Kuwaiti government does not see this sector as contributing to
the economy due to the country’s high dependency on oil.
The experts further explained that the firms themselves have huge
responsibilities to educate themselves, since, as it stands, most firms are relying on
government support. They are lacking the necessary leadership and commitment
from top management, as well as knowhow with respect to using and adopting QI
such as LS. They need to take things seriously, and must pay attention to involving
their employees and delegating responsibilities, as well as implementing training
systems. They also need to mature in terms of building relations with suppliers and
customers.
Finally, the experts concluded that K-SMMIs are not ready to adopt LS, but
emphasised that there is huge potential for them in this area, though this potential is
conditional on the creation of urgency from the government, as well as transparency
in terms of offering projects to qualifying firms regardless of links. Further, the
government needs to monitor the ISO agents to make sure they are working in a
clear way.

334
5.6 Chapter summary
This section explained how the results were obtained through the four phases,
and from different sources, and discussed the data collected from the respondents in
Kuwait. The techniques used for the data gathering included questionnaires (first
phase), semi-structured interviews with 27 managers in K-SMMIs, and observation
of the same 27 K-SMMIs (second phase), two case studies (third phase) and finally
interviews with an expert panel (fourth phase).
These techniques helped to answer the research questions and test the
hypotheses. The results show that K-SMMIs are not currently ready, and do not have
the right foundation, to start LS. Several issues need to be addressed, some of which
lie within the organisation and others outside it.
It was found that the K-SMMIs are lacking many of the requirements for LS,
as identified from an intensive data analysis, interviews with different personnel, and
observations, which made it possible to obtain an understanding of the current
situation within the K-SMMIs and to see how far they are from LS, and to
understand the reasons that are impeding the K-SMMIs from competing with world-
class industries.
Figure 26 shows the main aspects that are affecting the K-SMMIs with
respect to the six constructs used to measure firms’ readiness towards LS, including:
processes; planning and control; human resources; top management and leadership;
customer relations; and supplier relations. The results show that these factors within
the firms are far from being lean, and there are too many inhibiting factors, as can be
seen from Figure 21.
The following chapters will discuss the results to complete the final picture
of K-SMMIs, and to see whether the findings of this research study support or
disapprove those of other researchers.

335
Figure 26 Factors affecting K-SMMIs' readiness towards LS

336
Chapter Six Discussion
6.1 Introduction
In this chapter, the research findings from the questionnaires, semi-structured
interviews (with 27 K-SMMI managers), observations (27 K-SMMIs), case study,
and expert interviews will be discussed. After reviewing a great deal of literature, six
RQs and five hypothesises have been developed to derive an understanding of the
situation within K-SMMIs regarding their readiness and preparedness with respect to
LS. Several techniques for data collection were adopted to help answer the RQs and
hypotheses.
6.2 Discussion of the findings
Several issues were identified from the reviewed literature; this chapter will
consider whether the findings are in agreement with the findings from other
researchers.
In the first phase, the data collected from the survey questionnaire indicates
that quality and management practices (namely processes; planning and control;
human resources; top management and leadership; customer relations; and supplier
relations) within K-SMMIs are not very supportive towards LS, as can be seen from
the low mean score (M<4) for each of the constructs. This shows that K-SMMIs lack
the infrastructure and readiness for LS, and rarely use quality and management
practices. Thus, the research moved on to phases 2, 3 and 4 to understand why the K-
SMMIs do not have the right infrastructure for LS.
Many factors affecting the implementation of quality and management
practices in K-SMMIs have been revealed in this study. The semi-structured
interviews with the 27 managers in K-SMMIs revealed factors including language
barriers, as well as a lack of quality workers in terms of education and skills,
technology, government attention towards K-SMMIs, knowledge of QI,
competitiveness and urgency to adopt QI.

337
A lack of skilled workers, language barriers, and a lack of technology were
the dominant factors highlighted in the interviews, since these factors affect the
firms’ ability to create a quality culture due to the constraints they place on
teamwork and effective communication. Moreover, it was found that the firms do not
follow a clear strategy in terms of involving employees in improving processes, nor
in promoting CI.
It was found that there is no real pressure or urgency to adopt LS within the
K-SMMIs due to the small size of the market and a lack of competitiveness; this is
consistent with Tannock and Ahmed’s (2008) findings, and also supports other
findings (e.g. Nordin et al. 2012; Stone, 2012; Abrahamsson and Isaksson, 2012)
that urgency is what stimulates organisations to pursue LS.
Toyota itself invented TPS due to urgency; according to Hines et al. (2004),
TPS was invented due to a scarcity and shortage of resources and the intense
competition in the Japanese market, which equated to a pressure and urgency for
Toyota to create a new system within its business.
Likewise, the Lean Enterprise Institute (2005) and Mersha (1997) have
claimed that companies around the world adopt LS/QI if there is urgency and
competitiveness in the market. Moreover, the business conditions in Kuwait have
been found to be unsupportive for K-SMMIs to implement LS; according to Cooney
(2002), LS has had limited success globally, as it is highly dependent on business
conditions that are not always available. This could be one of the main reasons why
K-SMMIs have not yet considered LS, and is understandable as the reviewed
literature shows that Kuwait is heavily focusing on producing oil, which has resulted
in other sectors being ignored (Harry, 2007; Kinninmont, 2012).
The lack of readiness towards LS was also revealed from the structured
observations conducted in 27 K-SMMIs, where an even worse picture was found
with respect to LS readiness. Most of the firms do not have good practices in place,
and too many issues have been ignored, such as labelling items, equipment and floor,
providing designated areas for tools and equipment, ensuring the condition of tools
and equipment is good (i.e. caring about their equipment), using VM methods (such
as charts, instructions, schedules, etc.), providing a safe working environment
(ventilation, health and safety clothes etc.), using a process layout (with good flow,

338
low WIP, etc.), providing storage areas and workers’ uniforms, keeping the
workplace, storage areas, etc., clean and tidy, implementing suggestions systems,
providing workers’ break rooms, and keeping records of important issues, such as
cycle time, lead time, etc. The structured observations led to a better understanding
of the outcomes from the questionnaires and the semi-structured interviews.
Furthermore, the case study gave an even clearer picture with respect to what
is going on within K-SMMIs; it has been found that shop-floor workers are generally
ignored by the top management; in addition, no real contribution is forthcoming
from them, for reasons such as a lack of quality in terms of the workers themselves,
language barriers, and the fact that top management are not trying get workers
involved.
Furthermore, the case studies show that top management are not involving
people as they should, and this was manifest in the fact that many workers within the
firms do not agree with or believe in ISO 9000, but have been forced to accept it by
top management. This was also shown in the semi-structured interviews with the 27
managers of K-SMMIs.
The expert panel revealed many factors that are delaying the use of LS within
K-SMMIs. Some of these are internal, and thus relate to the firms themselves, while
others are external. Some of the external factors that were revealed by the experts
include corruption in dealing with government projects and contracts, as well as
corruption from ISO agents, who can easily offer the ISO certificate without
ensuring internal changes have been made. Firms can go and buy an ISO certificate
just to show customers (which are mainly the government) that they are ISO
accredited. These findings are in agreement with those of other researchers (e.g., Al-
Kazemi and Ali, 2002; Harry, 2007; Blair, 2009; Kinninmont, 2012), who have
found that Kuwaiti businesses are suffering from corruption that inhibits
improvement in many sectors.
Furthermore, it was revealed that because of nepotism and favouritism, firms
can gain more projects regardless of their quality; this was also revealed in the
interviews with the 27 managers, most of whom said that they can easily gain
contracts based on links rather than quality. The experts also emphasised that there is
no real urgency for firms to go beyond ISO, and no real competition in the Kuwaiti
339
market – and this was also highlighted by the K-SMMIs’ managers themselves.
Furthermore, the experts highlighted lack of attention from the government as an
issue, as the Kuwaiti government does not see the K-SMMI sector as important due
to the country’s reliance on oil sectors only; again, this factor was also highlighted
by the managers.
The experts further explained that the firms are lacking many of the aspects
needed to initiate LS, such as:
Leadership and commitment from top management.
Knowhow and understanding of using and adopting LS.
Acknowledgement of the prerequisites of LS, such as empowerment,
involvement and training, which must be taken seriously.
Strong relations with suppliers and customers.
Finally, the experts concluded that K-SMMIs are currently not ready to adopt
LS, but emphasised that they have huge potential in this regard. However, this is
conditional on the government creating a sense of urgency and putting pressure on
firms, and also requires transparency from the government in terms of offering
projects to qualified firms, regardless of links. Further, the government needs to
monitor the ISO agents to make sure they are working with integrity.
Moreover, a shortage of training and recognition was highlighted in this
study, and it was found that K-SMMIs are not adopting scientific methods to solve
problems and improve processes. According to Mersha (1997), QI requires skilled
people with an ability to work as a group and solve problems. This finding is
consistent with Antony et al. (2008), who found that SMEs do not provide enough
training, due to financial constraints.
Additionally, understanding and awareness of the benefits and principles of
LS have been found to be very low, and knowledge of LS is missing in K-SMMIs.
This finding is consistent with previous literature (Youssef and Zairi, 1995; Al-
Khalifa and Aspinwall, 2000; Garza-Reyes et al., 2011), which suggests that Kuwait
and nearby regions are far from maturity in terms of QI.

340
Most companies around the world opt to utilise LS because there is a sense of
urgency and pressure from the market; this urgency can take the form of new
entrants to the market, high levels of competitiveness, attention from the government
to improve the industrial sector, and so on. None of these are a reality in Kuwait,
since the market is very small, FDI is very low, and no attention is paid by the
government towards the industrial sector. This is consistent with Mersha (1997),
who asserted that if QI is to be successfully employed and sustained, the government
must recognise its benefits.
As has been discussed in previous chapters, the LR framework that has been
outlined in this study is based on six categories (processes; planning and control;
human resources; top management and leadership; customer relations; and supplier
relations), which represent the foundation of LS. It was found that the K-SMMIs
scored less than 4 for each of the constructs. The following sections will show the
reasons and justifications for the findings, with reference to the results obtained from
every source (i.e. interviews, observations, case studies, and experts’ panel).
It is worth mentioning that the questionnaire was conducted first; although
the outcome shows that the K-SMMIs are not ready for LS, some of the aspects in
the questionnaire show some positive signs. However, these were contradicted by the
other sources of data. The positives obtained from the questionnaire can be attributed
to one reason, which is that Arab managers are sometimes reluctant to complete
questionnaires, and most prefer to talk (Altarawneh, 2009), so they may not have
taken the questionnaire seriously, and completed it merely as a favour.
The following sections will provide a discussion of the main findings on
processes, planning and control, customer relations, supplier relations, HR, and top
management and leadership, as well as the effect of ISO 9000, firm size, sector, and
ownership type with respect to lean readiness within K-SMMIs.
6.2.1 Processes
The results from the questionnaire show that processes had the highest mean
score, however this construct still scored less than 4. In relation to this factor, the aim
was to identify issues such as process flow, housekeeping, production rate, cycle

341
time, TPM, flow of material, documentation, designated areas and labelled items, in
order to evaluate the firms’ practices with respect to whether they support LS.
The questionnaire outcome showed positives signs in this category, as
detailed in the results and findings chapter. However, the total mean is not
satisfactory. According to Nordin et al. (2010), the 15 large lean companies they
studied scored M>4, so in the present case the processes are not very supportive
towards LS.
Many practices are considered a foundation of LS, such as housekeeping (5s)
(Furlan et al., 2011; Liker, 2004; Miltenburg, 2001; Monden, 1998; Saurin et al.,
2011, Shah, 2007; Spear and Bowen, 1999; Nordin et al., 2010; Forza, 1996),
cellular manufacturing (Furlan et al., 2011; Liker, 2004; Monden, 1998; Saurin et
al., 2011; Shah, 2007; Nordin et al., 2010; Forza, 1996), skilled workers for running
and leading processes (Liker, 2004; Monden, 1998; Saurin et al., 2011; Shah, 2007),
TPM (Black, 2007; Miltenburg, 2001; Saurin et al., 2011; Shah, 2007; Spear and
Bowen, 1999), documentation (Almström and Kinnander, 2011; Saurin et al., 2011),
and production based on pull (Shah, 2007; Womack and Jones, 2003).
From the observation, it was learnt that most of the K-SMMIs are lacking
many aspects with regard to processes, such as labelling items, equipment and floor,
providing designated areas for tools and equipment, ensuring the condition of tools
and equipment is good (i.e. caring about their equipment), using a process layout
(with good flow, low WIP etc.), keeping the workplace, storage areas, etc., clean and
tidy, implementing suggestions systems, providing workers’ break rooms, and
keeping records of important issues, such as cycle time, lead time, etc. The expert
panel attributed this to the lack of the knowhow, plus the lack of competition in the
Kuwaiti market.
This variable highlights many negative aspects within K-SMMIs that can be
perceived from the low mean score (M<4), and are indicative that these firms are not
ready for LS. One of the aspects that are not supportive of LS is TPM; according to
LS, this process should be run by skilled workers, with clear documentation of all
aspects. Failure to address these issues is almost certain to affect other operations in
turn. The processes within K-SMMIs do not seem to be run efficiently; there is too

342
much WIP, and many types of lean wastes were observed during the case study visit
and the observation.
6.2.2 Planning and control
From the questionnaire, it was found that the responses to the planning and
control category also scored less than 4. This shows that there a lot of things missing
in this category. The results show that there is a lack of understanding of many
aspects that are required by LS, such as using VM, using scientific methods for
solving problems, conducting focus groups, using benchmarks, etc., and most of
these activities are largely ignored by K-SMMIs. Several authors (e.g. Furlan et al.,
2011; Shah, 2007; Nordin et al., 2010; Yoshimori, 2005) have stressed the
importance of efficient problem solving; however, it was found that K-SMMIs are
lacking in this respect.
The interviews with managers suggested that these factors are being ignored
as there are not enough skilled workers to contribute to solving problems in a
scientific way; in addition, and importantly, they showed that they are not utilizing
sophisticated production techniques that require them to adopt scientific methods for
solving problems.
Benchmarking is another important method for keeping a close eye on the
competitors; this factor is regarded as important by several researchers (e.g.
Salaheldin, 2009; Gurumurthy and Kodali, 2009; Knuf, 2000; Hines et al., 1999;
Spencer and Loomba; 2001; Smalley, 2004). In the questionnaire, the K-SMMIs
stated that they are adopting the benchmarking method, however the interviews with
managers showed that this is not the case: the managers know who their competitors
are, but have no clear strategy for measuring themselves against these competitors.
Further, the expert panel agreed that benchmarking is not used in K-SMMIs
for one simple reason: they are not aware of their competitors because there is no
real competitive environment in Kuwait. They stated that the K-SMMIs are short-
sighted because they do not consider external industries (outside Kuwait) as
competitors, as they are not ambitious enough to think outside the box.

343
Furthermore, VM is not used in the vast majority of K-SMMIs, as can be
seen from the negative responses to the questionnaires, and the observations. Further,
the lack of VM was noted during the case study visit; most of the firms are ignoring
this factor, and this is similarly due to a lack of knowhow and awareness. Many
researchers have declared the importance of VM (e.g., Shah; 2007, Radnor et al.,
2006; Moser and Dos Santos, 2003). According to Moser and Santos (2003), lack of
VM control may cause poor understanding of the process.
Tezel et al. (2009) declared that the main use of VM in LS is for enhancing
disciplines and transparency. In Toyota, VM is heavily used at workstations to show
the work procedures, standard inventory and cycle time (Ohno, 1988). In addition,
standard operations and manuals are posted at workstations so that supervisors and
workers can follow standards without wasting time (Fujimoto, 1999). Problem-
solving techniques such as cause and effect diagrams, flowcharts, check sheets,
Pareto diagrams, histograms, scatter diagrams, and control charts are also employed
within Toyota; yet none of these practices are being utilised within K-SMMIs.
According to Tezel et al. (2009), VM is employed to allow managers and
supervisors to monitor work at a glance, as well as to simplify the process for
employees; this helped Toyota to solve 95 per cent of its problems related to quality.
Tezel et al. (2009) suggested that VM can support LS by enhancing the
transparency in the workplace, as it allows workers to understand the process at a
glance, without the need to go back and ask, which wastes time. In addition, VM
makes people more disciplined in relation to working based on correct procedures
and standards.
As as result of this transparency and discipline, any problems will be more
visible and workers will be motivated to solve them and keep improving, as they are
following visible standards that will mitigate improvisation, and in turn help to
sustain CI.
VM can also enhance job facilitation, as employees will save huge amounts
of time by having everything visible at workstations; further, it can help with
performing on-the-job training as people will learn from their mistakes. It can make
344
workstations tidier and easier to work in, and make the organisation work as one
unit, as the boundaries will be removed between organisational layers.
VM can be achieved by making the process flow visible from start to finish
by posting the related information in a visible place. In turn, this can reflect
positively on employees as they will be more motivated to participate in improving
the process. Any problems will also be more visible and easier to solve.
Moser and Santos (2003) highlighted the benefits that can be gained by
employing VM, in that it: improves simplification and coherence in decision
making; stimulates informal contacts throughout different hierarchical levels;
contributes to the introduction of decentralisation policies; helps to broaden
employee participation and autonomy in management; enhances effective
distribution of responsibilities; increases employee morale; improves the
effectiveness of production scheduling; simplifies production control systems; and
ensures rapid comprehension of, and response to, problems.
Once again, the managers’ responses within the interviews show that their
processes and activities are simple and they do not wish to make them complicated
by using VM, which requires time and updates on a regular basis. However, the K-
SMMIs will most certainly be missing out on the benefits of adopting VM.
From the responses on planning and control, it was learnt that the K-SMMIs’
planning and control practices are not supportive towards LS since the total mean
score for this variable was again less than 4, and from the structured observations
and the semi-structured interviews it can be confirmed that many things are missing
within K-SMMIs. In order for the K-SMMIs to be ready for LS, they must get most
of these practices right as they represent a foundation for LS, as was discussed in
Chapters 2 and 4. As it stands, the K-SMMIs are missing key aspects that would help
them to improve their production.
6.2.3 Customer relations
Many researchers have highlighted the importance of customer relations (e.g.
Zu et al. 2010; Golicic and Medland, 2007; Panizzolo, 1998; Meredith et al., 1991;
Goodson, 2002) for LS. K-SMMIs scored very low (M=2.5) in this variable, which

345
shows their lack of awareness towards this factor. It was found that the K-SMMIs
are not involving their customers and are not dealing with customer complaints or
feedback in a serious manner. Several researchers (e.g. Zhang et al., 2000; Found
and Harrison, 2012) have stated that organisations need to respond quickly to
customer complaints, and understand their customers’ needs.
This variable revealed that there are many related negative practices by K-
SMMIs that are not supportive of LS, as can be observed from the total mean score,
which was less than 4. Further, in the interviews with the 27 managers, none were
able to cite a clear strategy for dealing with customers; the expert panel explained
that customers in Kuwait are unlike customers in the rest of world; there is little
diversity in the market for them to find better service or quality, so companies do not
fear losing them.
Customers are key players for LS, and keeping tight relations with customers
will lead to many good things that the firms can benefit from. However, achieving
these strong relations with customers requires huge efforts from firms. As it stands,
K-SMMIs are not doing enough to maintain customer relations.
6.2.4 Supplier relations
Supplier relations are considered to be one of the important factors for LS
(e.g. Zu et al., 2010; Golicic and Medland, 2007; Panizzolo, 1998; Meredith et al.,
1991). Quality suppliers enable companies to produce quality products (Zhang et al.,
2000); this is important in LS, as the long-term relationships with suppliers will
enable the company to perform JIT, which is essential for LS (Dayton, 2001; Found
and Harrison, 2012).
This variable had the lowest mean score (M=2.3), which shows that the
companies lack awareness towards the importance of these factors. Most of the
interviewees from the 27 K-SMMIs complained about their suppliers’ quality, and
there were specific complaints regarding the delivery speed and quality of products.
Nevertheless, none of the K-SMMIs gave any evidence of trying to build strong
relations with suppliers. All the managers prefer to deal with large numbers of

346
suppliers to get better prices. It seems that the suppliers and firms are highly
disjointed.
This is again not very supportive towards LS. According to the expert panel,
supplier relations in Kuwait are not yet in a mature stage, due to a lack of awareness
towards the importance of building strong relations with suppliers to help the
company save effort and money. According to Wu (2003), it is essential for LS for
firms to have dependence, mutual trust, and long-term relationships with their
customers and suppliers; Sharma et al. (2011) further stated that suppliers are willing
to reduce their prices if there is a long-term relationship, and can contribute to
enhancing the profitability and competitiveness of the company.
Helper (1991) suggested that in LS suppliers play a major role in terms of
JIT, design and subassembly, and that this is only achievable if there is a long-term
relationship. According to Burman (1995), having quality suppliers can save firms
time and money by providing them with quality goods, as most companies who are
dealing with lean suppliers do not have to inspect the goods received. Sharma et al.
(2011) asserted that there is a need to involve suppliers in quality improvement
programmes; this was not seen within K-SMMIs, as the responses to the
questionnaire, as well as to the interview, showed that supplier relations are highly
neglected.
Further, LS requires very close relations with suppliers and customers in
order to ensure quality (of products, items, raw materials, etc.) and fast delivery,
which are essential to performing JIT (Levy, 1997). Further, strong relationships
with suppliers can help the company to solve quality problems (Treleven, 1987).
According to Sharma et al. (2011), Toyota has highly involved and encouraged its
suppliers to share information and help in developing the design process.
Furthermore, it was found that most of the K-SMMIs prefer to deal with
large numbers of suppliers, which is not healthy for LS. Many researchers (e.g.
Barla, 2003; Cooper and Slagmulder, 1999; Lubben, 1988) have explained the
importance of dealing with single suppliers; the advantage can be seen in the
development of long-term relationships, which can in turn provide consistent quality,
lower costs, special attention, savings on tooling, etc. (Ansari and Modarress, 1998).
Further, Cooper and Slagmulder (1999) said that many lean organisations are dealing

347
with single suppliers for each part, and normally get perfect products that do not
require an inspection, and are delivered on time.
Again, there are a lot of negative practices in this area by K-SMMIs with
respect to LS, as can be observed from the total M score, which was less than 4. In
order for any organisation to implement LS, it must have great relationships with its
suppliers, but in the Kuwaiti case the survey does not reflect this, and neither do the
interviews with the managers.
6.2.5 HR
There are many aspects of HR that are required by LS, such as training,
empowerment, involvement and recognition (Kumar et al., 2009; Zu et al., 2010;
Mefford, 2009; Zhang et al., 2012; Goodson, 2002). These aspects are required in
order to produce high-quality products. As highlighted from the literature review,
employees are the core of the company, and therefore need to be encouraged and
involved in company strategy and direction, especially when implementing LS.
Without skilled workers, LS will not last (Tsang and Antony, 2001).
The outcome of the questionnaire shows that K-SMMIs are lacking in this
regard. This can be seen from the low mean score (M=2.9), which indicates that too
many issues are being ignored by K-SMMIs. Amongst these issues is training; as
Ichimura et al. (2007, p. 175) stated, “Training can also build loyalty to the
company, improve worker moral and develop motivation”. Similarly, according to
Pennathur and Mital (2003), loyalty is essential for LS as it provides stability for the
organisation and workers who are more committed towards solving problems and
continuing to participate in improving the process. It was found from the interviews
with the 27 managers that they do not have clear training systems in place, and most
of them are relying on training offered by the Kuwaiti government, which does not
always reflect company needs.
Ichimura et al. (2007) declared that training has to be based on the company’s
needs, so organisations must have a proper understanding of its requirements, and
understand the benefits of LS, lean philosophy and lean requirements to be able to
offer proper training; this can only be achieved if the organisation has a strategy and

348
vision. High-quality training will enhance the efficiency and productivity of the
organisation (Pennathur and Mital, 2003). Ichimura et al. (2007) further suggested
that workforce training is the “spine” of LS; and a huge number of lean proponents
have emphasised the importance of training (Pennathur and Mital, 2003).
Unfortunately, this aspect is highly ignored by K-SMMIs.
The managers attributed the lack of the training to several issues, with one of
the most prominent being that they do not really need training in place as their
machines are not complicated, and they lack financial support for training.
The lack of training was also noted in the case study visits, since neither of
the visited firms offers quality training for their workforce. Further, many of the
experts explained that K-SMMIs have a low-quality workforce, and management are
not doing enough to improve them.
The lack of motivation in K-SMMIs is also a serious hindrance to LS.
MacDuffie (1995) stressed the importance of boosting worker morale and
motivation; failure in this regard will impede the whole lean journey. Motivated
workers will collaborate to solve problems and help in CI, so the success of LS is
dependent on whether the workers are willing to participate; if they feel deflated,
they are likely to ignore or close their eyes to problems.
According to Takeuchi et al. (2008), Toyota encourages its managers to
motivate people and get the best from them; in Toyota, evaluations for managers are
based on process performance and learning ability, with less emphasis on results.
Toyota’s main concern is how managers deal with issues, how they foster people
skills, and how they develop and empower people. From the observations it was
found that many aspects relating to motivation and morale are being ignored. These
aspects include: ensuring a safe environment (ventilation, health and safety clothes,
etc.), providing worker uniforms, keeping the workplace and storage areas clean and
tidy, and providing workers with break rooms. These issues were also witnessed
during the case study visits. The expert panel commented that most firm managers
are only thinking about making money, and do not see soft issues, such as
motivation and workers’ morale, as an imperative. In addition, from talking with
many workers and managers it was found that because most of the workers come

349
from relatively poor countries they do not complain about working conditions, and
managers are taking advantage of them.
Another aspect of motivation is having a recognition and reward system in
place; from the interviews it was understood that in K-SMMIs that there are no clear
reward or recognition systems. If the firms do well and make a good profit the
workers will be rewarded with a small amount of money (as low as 60 GBP).
Workers are not offered a reward for coming up with new ideas or suggestions to
improve the process, or cut some stages, and this also indicates a lack of
empowerment and involvement. Most of the firms are not empowering their people;
the interviewed managers alleged that because their labourers are not highly skilled,
the managers do not tend to involve or empower them; in addition, most of the
workers do not speak a common language, which makes involvement even tougher.
The lack of communication and teamwork is highly affected by the lack of
common language. Radnor et al. (2006) suggested that communication is very
important, as it helps to ensure that LS is implemented successfully and ensures that
recognition is given for peoples’ efforts during the process. In addition, sharing
knowledge between departments helps to motivate other departments that are not
involved in the process, maintain the momentum of CI, and sustain changes.
Ghobadian and Gallear (1997) also highlighted the importance of efficient
communication, and regard it as an important factor for achieving QI, as the
employees are the engines of SMEs, and without proper communication that shows
them exactly what the company is expecting from them they might not be able to
perform to the best of their abilities.
Similarly, teamwork is very crucial in the lean journey, as it will help in
generating more buy-in from workers. “It was reported that team work allowed
organisations to generate capacity for improvement, it helped to reduce the
hierarchical boundaries between staff where improvements were required, and
developed a sense of joined-up working in a whole system” (Radnor et al., 2006, p.
5). According to Ichimura et al. (2007, p. 175), LS is “completely based on […]
team work; therefore, team work is considered as the heart of [LS].”

350
These issues are most certainly delaying the use of LS with Kuwaiti firms.
This was also shown in the observations and case study, where it was found that the
vast majority of firms do not have a clear suggestions system in place.
Within the HR variable, many negative signs were identified within K-
SMMIs, and again the total mean score is less than 4. Key features, such as
empowerment, motivation, involvement, skills and multitasking workers are highly
valued in LS but are lacking in the K-SMMIs, which might negatively affect their
readiness towards LS.
Further, the current investigation shows the reasons behind this lack of
empowerment, motivation and employee involvement within K-SMMIs. It is
understood that Kuwaiti firms do not pay attention to these aspects as there is a huge
distance between top-level people and shop-floor people, with some managers citing
the lack of quality labour and language barriers as a factor, and others highlighting
the simplicity of their businesses. The expert panel suggested that K-SMMIs lack
leadership and awareness from top management in relation to these issues.
6.2.6 Top management and leadership
As has been emphasised by the vast majority of prior research, top
management and leadership is the most crucial factor for LS. The role of top
management and leadership is manifested in many forms, such as providing clear
vision, allocating resources and funding, and providing strategic leadership (Tsang
and Antony, 2001). To ensure the success of LS implementation, it is essential for
top management to create a quality culture by empowering other employees (Zhang
et al., 2000). This factor has been emphasised in various articles (e.g. Chin and Pun,
2002; Angelis et al., 2011; Bakås et al., 2011; Zu et al., 2010; Mefford, 2009;
Kumar et al., 2009; Achanga et al., 2006; Panizzolo, 1998; Meredith et al., 1991;
Snee, 2010).
This factor, like the other factors, was not positive for K-SMMIs’ LR, as the
mean score was again low (M=3.2). The expert panel attributed this to a lack of
leadership to drive changes, and a lack of top management commitment, as they
believe that K-SMMIs are lacking a quality culture in these areas.

351
This was identified through the case study, and from the ISO 9000 example it
was found that most of the firms do not involve their employees in the decision to
become ISO accredited, which results in frustration, as well as a lack of buy-in from
workers.
Furthermore, the top management does not seem to be committed towards
QI, as can be seen again from the ISO 9000 example; most of the firms opted to
obtain ISO 9000 in order to increase sales, and not for improvement, which is why it
took their people by surprise. Most of the experts explained that there is no real top-
management commitment and leadership within K-SMMIs; they believe that the
majority of people at management level do not have a great deal of knowledge about
QI, and are not well educated about what QI can bring to them. This is reflected in
the failure to use certain practices within their organisation, such as empowerment,
involvement, teamwork, training, consultancy, etc., all of which are supportive
towards LS. This is in line with Al-Khalifa and Aspinwall (2000), who suggested
that QI may not work for the GCC region as countries in this region have
unfavourable environments that do not support QI due to the autocratic management
that is in place, as the organisation is always run by the boss, there is a very poor
level of communication between people and departments, and the top managers are
unaware of concepts around QI.
From this variable, it can be understood that the top management and
leadership variable is lacking in K-SMMIs; the low M score shows that K-SMMIs
are not very supportive towards LS in this regard.
Based on the six variables and the findings from the semi-structured
interviews (27 managers), structured observations, case study, and interviews with
the expert panel, the K-SMMIs’ practices do not support LS; they are lacking in
many aspects, which need to be given deep consideration. It was found that there are
many obstacles preventing K-SMMIs from being efficient in their working
processes. The managers showed a lack of understanding and awareness of how
small steps can help them to reach the optimum production level. Further, most of
the managers in K-SMMIs showed no real urgency to be lean, as the competition is
very low in Kuwait. It was also found that there are external reasons inhibiting the
potential of K-SMMIs towards LS, and the lack of quality and management practices

352
within K-SMMIs mainly comes from a lack of urgency. The findings in this area can
be summarised as follows:
There is no real urgency to force Kuwaiti firms to adopt LS, as their
customers do not have much knowledge about quality.
Firms can get contracts without having QI in place.
There is little competition in the market.
Firms can gain contracts based on links and nepotism.
The government does not see the manufacturing sector as a real source
for developing the economy, and the sector is thus largely ignored.
The K-SMMIs do not take government rules and regulations seriously, as
can be seen within different aspects, such the working conditions within
the firms and the implementation of ISO 9000. The ISO 9000-accredited
firms adopted ISO 9000 only for sales motives; it has not been reflected
in their product quality because they know the government does not place
emphasis on the quality of products.
These findings support those of Stone (2012, p. 230), who stated that,
“currently, many organizations are experiencing external forces overpowering
internal resistance to change, resulting in an opportunity for transformational
interventions focused on performance improvement to create sustainable, healthy
organizations”.
Futher, Nordin et al. (2012) said that organsiations only pursue LS if they
feel pressure to do so; this pressure can be either domestic, and arising from high
competitiveness market, or international. It was found that K-SMMIs are
overpowered by the external factors, which leads to their avoidance of LS. This has
meant that K-SMMIs are maintaining their current quality and management
practices, and are not considering implementing LS.
Furthermore, it was found that the K-SMMIs are lacking in many internal
respects, and this has led to a lack of quality culture. These issues include:
Lack of knowledge about LS in Kuwaiti firms.
353
Lack of knowledge about the key issues that are considered important for
LS in terms of respect for people, such as rewards, involvement,
motivation, empowerment, etc.
No means by which to solve technical issues, as there are no skilled
workers, training programmes, or scientific methods in place to solve
problems and improve processes.
Poor communication between top-level and shop-floor people, for
reasons such as language barriers, and mistrust between these levels.
Language barriers, as well as a lack of quality workers in terms of
education and skills.
Lack of empowerment or real involvement for employees.
No use of technology by which to communicate between departments.
Failure to follow a clear strategy in terms of involving employees in
improving processes, nor in promoting CI.
Lack of top-management support and leadership.
All of these factors are contributing towards the lack of quality and
management practices within the K-SMMIs. This disproves the findings of Mady
(2009), who stated that Kuwaiti manufacturing industries are using quality and
management practices (his study included large, medium and small industries).
Mady (2009) conducted his study with help from KPAI, who distributed his survey
questionnaire to firms to complete. This could be one reason why the findings
differed, since this help from KPAI might have made firms more likely to give
honest answers, or, alternatively, to hide facts and fail to answer based on the current
situation.
However, the present study relied on multiple sources of data, unlike Mady’s
(2009), so the findings may be more realistic and give a truer picture of K-SMMIs
with respect to quality and management practices. Further, Mady (2009) focused on
only two sectors, one of which was food, which could not be included in this
research as several food firms do not fall within the study’s size criteria (small and
medium), while others failed to show interest in participating.

354
The findings of this study support those of a number of other researchers,
such as Graza-Reyes et al. (2011), who claimed that Kuwait is still not mature
enough to understand QI. The low use of quality and management practices
identified within K-SMMIs also supports the claims made by Jaeger et al. (2013),
who found that quality and management practices are not taken seriously in the GCC
region, and are not really used. The findings regarding the lack of leadership, focus
on customers, and scientific methods for measurement and analysis, are also
consistent with Jaeger et al. (2013).
Further, the findings on the lack of CI, customer relations, supplier relations,
empowerment and top-management support are also in line with the findings of
Graza-Reyes et al. (2011). They also agree with those of AL-Nofal et al. (2004),
who similarly found that there is no involvement and commitment at the shop-floor
level, as well as a lack of commitment towards QI from the top management, a lack
of quality culture, and no close relationships with customers and suppliers.
Further, it was found that the K-SMMIs are lacking top-management
commitment and leadership quality, and this is consistent with Ghobadian and
Gallear (1997), who found that SME owners and top management are unaware of
key managerial aspects that are essential for initiating QI. This finding is consistent
with Yusof and Aspinwall (1999), who identified some of the factors that affect
Qatari SMEs with respect to the implementation of QI. Among these factors are:
human and technical aspects, lack of resources, and shortages of finance.
In addition, the lack of training found in K-SMMIs is consistent with Antony
et al.’s results (2008); they found that SMEs do not provide much training due to
financial constraints. Hill and Stewart (2000) also suggested that SMEs offer little
training and are reluctant to spend on this area; any training systems that are in place
in SMEs are unplanned, reactive, short-term oriented and informal. This supports the
present study’s results in relation to K-SMMIs, especially from the interviews with
the 27 managers, who claimed that they do not have enough money to spend on
training and are relying on government initiatives, which do not always fit their
firms’ needs.
Several issues have been identified in the research literature, such as
nepotism and favouritism (Abdalla and Al‐Homoud, 2001; Kinninmont, 2012);

355
though this was not identified in direct relation to LS within K-SMMIs, the findings
show that it inhibits the adoption of LS as most K-SMMIs can easily obtain contracts
and projects based on relatives or links. This in turn removes their motivation to
implement LS or other QI, since they can sell their products without having LS in
place, and thus do not need to spend money on it.
When the findings of this study are compared to those of other researchers in
the Arab world, similarities can be noted; for instance, in the K-SMMIs there is a
lack of top-management commitment and support, training and education, supplier
quality, worker empowerment and involvement, and customer relations. Kuwait
shares these problems with Palestine (Baidoun, 2004), the UAE (Badri et al., 1995),
Sauid Arbia (Al-Omaim, 2002) and Qatar (Al-Khalifa and Aspinwall, 2000). Table
67 summarises the factors that are affecting QI in the Arab world according to the
literature, which matches the findings of this study.

356
Table 67 Inhibitors for QI in Arab countries
Author Country Inhibitors
Al-Sulimani (1995) Saudi Arabia
No clear vision or objective
Lack of support from senior management
More focus on quick profit rather than quality
Less focus on service and quality
No documented policies or
procedures
Limited information about QI
Lack of understanding about QI
Al-Zamany et al.
(2002) Yemen
Lack of government support
Lack of understanding of TQM
No supportive organisational
culture for LS
AL-Nofal et al.
(2004) Kuwait
Lack of top-management commitment
No visible involvement of top management in
quality
No customer relations
No clear mission statement
Quality planning is missing
Decision making at lower levels is
missing
Lack of effective communication
between employees and
management
Employee commitment and
enthusiasm is missing
Baidoun (2004) Palestine
Lack of top-management commitment and
involvement
Lack of middle-manager and employee
commitment and involvement
Training and education is missing
Lack of quality infrastructure
Lack of formally documented
quality management system
No communication
Salaheldin (2005) Egypt
Limited knowledge about JIT
Problems with supplier relationships
Costs too high
Successful without JIT implementation
Benefits of JIT not deemed to be
worthwhile
Potential staff attitude problems
Lack of formal training/education

357
Lack of communication between workers and
management
for workers
Salaheldin (2009) Qatar
Lack of leadership and top-management support
Organisational culture is not supportive
CI is missing
No use of benchmarking
Quality goals and policies are missing
Team building and problem solving are missing
Lack of employee empowerment, involvement
and training
No customer relationships
Lack of market knowledge
Inspection and checking of work
is not carried out
Assessments of suppliers’
performance is missing
No use of information technology
No supplier relationships and
poor-quality suppliers
Hokoma et al.
(2010) Libya
Lack of senior managers’ support towards the
implementation process
Unfamiliarity with QI
Ab-Rahman et al.
(2011) Libya
Lack of employee involvement
Lack of recognition for employees
Lack of commitment from staff
Lack of resources, such as finances, technology
and governmental support
Lack of effective management
Inadequate knowledge of QI
Lack of leadership
Karim et al. (2011) Saudi Arabia
Organisational culture is not supportive towards
LS adoption
Resistance from shop-floor personnel
Employees not convinced about the benefits of LS
Lack of cooperation from suppliers
Lack of top-management commitment
High cost
Lack of time to implement
No recognition of financial
benefits
Lack of skilled manpower for LS
implementation
Lack of resources

358
6.2.7 ISO 9000 accreditation
Furthermore, ISO 9000-accredited firms have similar practices to non-ISO
9000 firms, but neither were found to be supportive of LS, and the only significant
differences were related to top management and leadership practices. This can be
attributed to the motives behind adopting ISO 9000; it was revealed in the semi-
structured interviews that K-SMMIs mainly adopt ISO 9000 to gain more contracts
and boost their sales – in other words, they are externally driven and do not adopt
ISO 9000 to improve their internal processes; this is in agreement with Gherbal et al.
(2012), who found that Libyan industries are adopting ISO 9000 for prestige
purposes only. This is also in line with Gotzamani and Tsiotras (2001), who claimed
that ISO 9000 only affects organisational performance positively and makes it ready
for other QI, such as LS and TQM, if it is adopted to improve internal processes.
Furthermore, the expert-panel interviewees suggested a new reason for ISO
9000 not affecting the K-SMMIs: the experts stated that a significant number of K-
SMMIs are buying ISO 9000 from corrupt agents, as the government is not
monitoring the quality of products, and firms only need to obtain the ISO certificate
to sell their products to the government.
However, the results contrast those of other researchers, who have suggested
that ISO 9000 has improved quality and management practices within firms. For
instance, Magd (2006) found that ISO 9000 improved the quality systems in Saudi
firms in terms of documentation procedures, quality awareness, quality of products
and customer service, working instructions and procedures, communication among
employees, quality of incoming materials, reduced defective rates and wastes,
leading to CI and expansion to international markets.
Ilkay and Aslan (2012) demonstrated a significant difference between
Turkish ISO and non-ISO firms in terms of using and understanding quality and
management practices. They found that ISO firms have better quality and
management practices in terms of top management, quality system processes,
supplier relations and process control improvement. Gotzamani and Tsiotras (2001)
found that there is a huge difference between Greek ISO and non-ISO firms, with
ISO firms performing better in terms of leadership, strategic quality planning, quality
359
data, human resource management, process management, supplier and customer
relations, and product design. Sohail and Hoong (2003) conducted a study in
Malaysian SMEs (ISO and non-ISO firms), and found that ISO firms have higher
customer management and quality satisfaction, as well as improved strategic
planning, leadership, information availability and analysis, employee empowerment
and development, and organisational control and performance.
6.2.8 Firm size
Firm size does not seem to have an impact on the quality and management
practices used; both types of firms were found to have a similar level of quality and
management practices, and there were no significant differences in terms of size,
which is in accordance with Mallur et al. (2011). However, this result contradicts
Mady’s (2009) findings, which suggested that there are significant differences
between small and medium-sized Kuwaiti industries, and that medium-sized firms
use quality and management practices more effectively. Further, Mady (2009)
demonstrated significant differences in customer focus between the two firm sizes,
especially in terms of dealing with customer complaints and process quality. He
found that medium-sized firms make better use of benchmarking, process
improvement, data-driven decisions and SPC.
6.2.9 Sector and type of products
The results show that there are no significant differences between the four
different sectors (Sector 1: paper, paper products and printing; Sector 2: chemicals,
petroleum products, coal, rubber; Sector 3: non-metallic minerals (except petrol
activity); Sector 4: metal product machinery and equipment activity) in terms of the
use of quality and management practices, since the mean score for the four sectors
was found to be almost identical, and none of them have great readiness towards LS.
This result is in agreement with Mady (2008), who found that there are no
differences among the different types of sectors in Kuwait in terms of their
perception of competitiveness priorities such as flexibility, on-time delivery, cost
reduction, innovativeness and quality improvement. The reason for this could be
attributed to the lack of competitiveness in the Kuwaiti market, and the fact that most

360
types of industries are supplying to the local market; however, these results differ
from those of other authors (Reed et al., 1996; Corbett and Rastrick, 2000; Curkovic
et al. 2000), who verified that different sectors have different uses of quality and
management practices.
Further, this result is not in agreement with Mady (2009), who found that
there is a difference in the quality and management practices used by different
sectors in Kuwait; as was explained in the previous section, Mady (2009) focused on
two sectors only, including food, while this study considered four sectors, of which
the food sector was not one. This finding also disagrees with those of Ab-Rahman et
al. (2011), who identified different quality and management practices within Libyan
manufacturing industries. Similarly, this study does not support the findings of
Paksoy et al. (2011), who found that there is a difference in terms of the perception
of TQM within four sectors (iron-steel, automobile, textile, and plastic); they
highlighted that the iron–steel sector is making the strongest TQM efforts, while the
textile sector was found to be the worst sector in this regard.
Furthermore, this study did not support the findings of Shahram (2008), who
found that there is a difference in terms of lean practice usage within different
sectors in China (electronics, telecommunication, wireless, computer, food/beverage,
garment, pharmaceutical, chemical, petroleum, printing, A/C and heating); Shahram
found that the petroleum industry was ahead of all other industries, followed by
computer, telecommunication/wireless, electronics, garment, food and beverages,
pharmaceutical, printing, and A/C and heating industries, respectively.
As was explained in Chapter 3, sector has not been emphasised as a factor
that affects LS, as many authors have suggested that LS can apply to many different
types of industry (Womack et al., 1990; Soriano-Meier and Forrester, 2002). Further,
this study is the first to deal with LS in the Kuwaiti context, so it is necessary to
build a foundation from which to obtain a better understanding of Kuwaiti firms.
Thus, the findings on sectors cannot be compared to any great extent with those of
previous studies.

361
6.2.10 Ownership structure
Moreover, it was found that ownership (family- vs. non-family-owned firms)
does not affect LR, as no real differences were noted between family- and non-
family-owned firms for any of the constructs. Both firm types scored M<4, which
again shows that the current quality and management practices in both family- and
non-family-owned firms are not supportive towards LS. As the results illustrate,
there were no significant differences between the different ownership structures in
terms of their use of quality and management practices.
This result is inconsistent with those of many researchers (e.g., Ellington et
al.,1996; Levinson, 1987; Ward, 1988; Hofer and Charan, 1984), who found
differences in the implementations of quality and management practices by the two
types of firms, and suggested that non-family-owned organisations have a better
chance of adopting quality and management practices. Ellington et al. (1996) found
that family-owned firms are adopting fewer quality and management practices,
because they are more short-term oriented. Further, Ellington et al. (1996) explained
that family-owned firms are more centralised in their decision making, as the top
managers are involved in every decision; this is why they cannot adopt a holistic
approach towards QI. Despite this, this study did not highlight any real differences
between family- and non-family-owned firms.
The findings also disagree with several authors (Welsh and Raven, 2006;
Chua et al., 1999; Davis, 1983) who have claimed that family-owned businesses are
likely to have better relations with customers and be better able to manage their
resources; neither of these were shown in this study. Also, the findings contradict
those of Reid and Adams (2001), who suggested that business practices with respect
to human resource management (HRM) differs between the two types of firms, with
family-owned businesses having distinctive HRM practices compared to non-family-
owned businesses – although the authors did not say which business type has better
practices.
Further, the findings disagree with Astrachan and Kolenko (1994), who
claimed that family-owned businesses have a shoratage of capabilities to implement
HRM practices, which makes them lag behind non-family-owned businesses. Graves
and Thomas (2006) also found that the non-family-owned firms have better

362
managerial capabilities compared to family-owned firms; this was not the case in the
present research study, as both types of firms in the Kuwaiti context were found to
be in a similar position with regard to the use of quality and management practices.
Based on the findings of this study, ISO 9000, firm size, ownership structure
and sector do not affect readiness towards LS within K-SMMIs, as there are no
significant differences between these categories. All of the firms showed low levels
of quality-practice adoption (M<4). This conclusion supports the findings from the
expert panel and case study, as well as from interviewing the 27 managers, which
suggest that K-SMMIs are overpowered by external factors, as explained in previous
sections, and that, due to their lack of urgency arising from the lack of competition in
the market, firms can gain contracts based on links and nepotism rather than quality;
in addition, the government does not see the manufacturing sector as a real
contributor to the economy. In this sense, it can be concluded that the level of K-
SMMIs’ readiness towards LS is very low, and it may be that LS will not work well
within them at this point.
6.3 Chapter summary
In this chapter, a discussion of the findings obtained from the different sources
of data (questionnaires, semi-structured interviews, observations, case study, and
expert-panel interviews) are presented, with reference to whether they agree or
disagree with those of other researchers. The main findings suggest that K-SMMIs
are far from being lean ready, and there are external and internal factors affecting
their readiness towards LS. Based on the findings of this study, ISO 9000, firm size,
ownership structure and sector do not affect readiness towards LS within K-SMMIs;
this finding is in agreement with some researchers’ findings, while disagreeing with
others. Furthermore, from this chapter it was learnt that the status of the K-SMMIs
as far as obstacles for adopting QIs is concerned is similar to firms in other nearby
regions (i.e. Arab and Gulf regions).
The chapter also discussed the external and internal reasons that are affecting
the K-SMMIs’ readiness towards LS. Several issues were identified in this chapter as
preventing K-SMMIs from adopting LS, and affecting the six categories considered

363
(processes, planning and control, customer relations, suppliers relations, HR, and top
management and leadership).
The outcome from the questionnaire survey and the findings from the semi-
structured interviews (27 managers), structured observations, case study, and
interviews with the expert panel, show that the K-SMMIs’ practices do not support
LS; they are lacking in many respects, which need to be given deep consideration.
Further, it was found that there are many impediments precluding K-SMMIs from
being efficient in their working processes. The identified factors include: no real
urgency to force Kuwaiti firms to adopt LS, as their customers do not have much
knowledge about quality; the firms can get contracts without having QI in place, and
can gain contracts based on links and nepotism; there is no real competition in the
Kuwaiti market; and the government does not see the manufacturing sector as a real
source for developing the economy, so that the sector is largely ignored.
Finally, the K-SMMIs do not take government rules and regulations
seriously, as can be seen in aspects such as the working conditions within the firms
and the implementation of ISO 9000, where ISO 9000-accredited firms adopted ISO
9000 for sales motives only; it has not been reflected in their product quality because
they know the government does not place emphasis on the quality of products.

364
Chapter Seven Conclusions
7.1 Introduction
This chapter presents the conclusions of the study, including a revision of the
main aims and objectives of the research, the RQs and methodology, as well as
directions for future research, recommendations, limitations, and the contributions
and implications of the study.
The main aim of this research was to consider the general situations of K-
SMMIs in order to identify their readiness to adopt LS, by measuring their current
situation (based on their quality and management practices), and by identifying the
factors that are affecting their readiness towards LS.
The study started by reviewing the available literature in order to build a
database of potential factors that may contribute towards LR. It is worth mentioning
that the literature review found a lack of studies relating to K-SMMIs, and LS within
the Kuwaiti context in general.
This study is based on a position of pragmatism, and inductive and deductive
approaches were used to help reach the objectives of the research. Mixed methods
were adopted to avoid the weaknesses of a single method and to enhance credibility
and validity by collecting data from multiple sources; the forms of validity used were
triangulation, expert-panel interviews, and pilot testing. Several techniques were
adopted in this research study, such as questionnaires, observations and interviews
(with K-SMMI managers and shop-floor staff, an expert panel, and personnel in the
Kuwaiti government), while the strategies employed were case study and survey.
These helped to answer the six main research questions within this study to draw a
complete picture of K-SMMIs’ readiness towards LS. As this study is the first of its
kind within the Kuwaiti context, it was unable to rely on one source of data as the
intention was to obtain a clear picture of K-SMMIs.
365
7.2 Aims and objectives
This research project aimed to consider the general situations of K-SMMIs to
identify their readiness to adopt LS and identify the factors that are affecting their
readiness towards LS.
Furthermore, this study aimed to examine how the introduction of LS to K-
SMMIs could create awareness about the benefits that LS could bring, and help them
to improve their businesses.
In order to achieve the aims of this research, the main objectives were
outlined as follows:
1. To identify the essential factors required by LS.
2. To investigate the general state of K-SMMIs.
3. To get a clear understanding of current quality and management practices
used by K-SMMIs.
4. To develop an LR framework to measure K-SMMIs’ readiness towards LS.
5. To identify and analyse the different barriers and enablers for implementation
of LS in K-SMMIs.
The results of the study show that K-SMMIs are not ready, or do not feel a
sense of urgency, to adopt LS. This conclusion was derived after reviewing a large
amount of literature, and gathering data from different sources such as
questionnaires, semi-structured interviews structured and unstructured observations,
a case study and a discussion with an expert panel. Table 68 shows how the
objectives of this research have been achieved.

366
Table 68 Research objectives
Objective How it has been achieved
1. To identify the essential factors required by LS The essential factors were identified by reviewing the research
literature; the researcher was able to extract and address the critical
requirements for LS.
2. To investigate the general state of K-SMMIs
In order to understand the readiness of K-SMMIs towards LS, there
was a need to understand and identify several issues, such as the
general state of K-SMMIs in terms of their contribution towards the
Kuwaiti economy and job creation, and the QIs adopted by those firms,
as well as identifying the factors that are inhibiting their potential to
compete with world-class organisations.
3. To get a clear understanding of current quality and management
practices used by K-SMMIs
The outcome of the survey questionnaire showed that K-SMMIs use
minimal quality and management practices. The reasons behind this
were identified and explained by obtaining data from different sources
such as questionnaires, semi-structured interviews, observations, case
study, and expert-panel interviews.
4. To develop an LR framework to measure K-SMMIs’ readiness
towards LS.
In order to develop a measurement framework to help achieve the aim
of this research, there was a need to review other researchers’ work

367
such as the measurement frameworks and CSFs that are crucial to
establish LS. The reviewed literature highlighted many of the CSFs
that are required by LS, and the author of this research categorised the
important factors into six categories (processes; planning and control;
human resources (HR); top management and leadership; customer
relations; and supplier relations) in order to identify the general
situation within K-SMMIs and see what quality and management
practices they are currently using.
5. To identify and analyse the different barriers and enablers for
implementation of LS in K-SMMIs
The use of mixed methods allowed the researcher to shed light on the
barriers (external and internal factors) that are likely to impede K-
SMMIs’ adoption of LS. Further, the expert panel showed that K-
SMMIs can still adopt and benefit from LS, under the condition that a
sense of urgency is created by the government in order to drive these
firms to improve.

368
7.3 Research questions
In order to achieve the main aims and objectives of this research, six research
questions were posed in order to obtain a clear understanding of K-SMMIs and their
readiness to adopt LS.
The first RQ was: “How far are K-SMMIs from a lean system?”. The answer
to this question showed that K-SMMIs are far from LS, their current practices do not
support LS, and there are many factors that are affecting their LR, as shown in the
outcomes to the questionnaires, case study, observations and expert interviews.
The second RQ was “What factors relating to the quality and management
practices inhibit K-SMMIs from adopting LS?”. The answer to this question shows
that many factors are affecting K-SMMIs, some of which come from within the
firms themselves, while others arise from the external environment. This question
was answered by interviewing managers within K-SMMIs, and experts. As
mentioned in the previous chapter (Discussion), it was found that all of the quality
and management practices, which are categorised as processes; planning and control;
customer relations; supplier relations; HR; and top management and leadership are
not supportive of LS. The issues include:
Lack of knowledge about LS in Kuwaiti firms.
Lack of knowledge about the key issues that are considered important for
LS in terms of respect for people, such as rewards, involvement,
motivation, empowerment, etc.
No means by which to solve technical issues, as there are no skilled
workers, training programmes, or scientific methods in place to solve
problems and improve processes.
Poor communication between top-level and shop-floor people, for
reasons such as language barriers, and mistrust between these levels.
Language barriers, as well as a lack of quality workers in terms of
education and skills.
Lack of empowerment or real involvement for employees.
No use of technology by which to communicate between departments.

369
Failure to follow a clear strategy in terms of involving employees in
improving processes, nor in promoting CI.
Lack of top-management support and leadership.
The third question was: “Why has LS not been practised within K-SMMIs to
date?”. Again, the answer to this question showed that there are many reasons why
K-SMMIs have not been practising LS. Some of these answers are related to the
firms themselves, while others are highly related to the external environment. To
answer this question; interviews were conducted with experts in Kuwait, and
managers of K-SMMIs. The issues in this area can be summarised as follows:
Lack of awareness about LS.
Lack of skilled workers.
Lack of knowhow.
Lack of pressure to adopt LS.
Lack of required resources to establish LS.
The fourth question was: “What is the urgency for K-SMMIs to adopt LS?”.
This is one of the most important questions in this study. The answer clearly
suggested that there is no real urgency to adopt LS within Kuwaiti firms yet, due to
the reasons explained in the Discussion and Results chapters. Data for this question
was obtained by interviewing key managers of K-SMMIs, and experts. The
following issues were identified:
There is no real urgency for Kuwaiti firms to adopt LS, as their customers
do not have much knowledge about quality.
The firms can get contracts without having QI in place.
There is little competition in the market.
They firms can gain contracts based on links and nepotism.
The government does not see the manufacturing sector as making a real
contribution to developing the nation’s economy, and this sector is thus
largely ignored.
The fifth question in the study was: “What is the level of awareness of LS
within K-SMMIs?”. This study mainly focused on LS, so understanding K-SMMIs’
awareness of it was key. From the interviews with the K-SMMIs managers, the case

370
study (which involved speaking with people at the shop-floor and managerial level),
and the interviews with the experts, it was found that the level of awareness is very
low, and LS is not very popular in Kuwait, unlike ISO 9000.
Finally, the sixth question of this study was: “What are the potential barriers
and enablers for K-SMMIs to adopt LS?”. Some of the potential enablers and
barriers were identified from the literature, and the interviews with the K-SMMI
managers and experts supported those findings.
Kuwait has the resources (such as money and technology) to implement LS,
but it is not easy to do so; LS will not be effective unless the government creates a
clear strategy to make it work. In the meantime, Kuwaiti firms will not be driven
towards adopting LS as there is no real need or pressure. The answer to the final RQ
was obtained from the interviews conducted with the K-SMMI managers, and
experts who are highly involved in the Kuwaiti government, as well as having great
knowledge about the Kuwaiti industrial environment.
7.4 Contribution to the body of knowledge
The contribution of this study to the body of knowledge on LS is expected to
be significant. Considering the nonexistence of LS studies within the Kuwaiti
context, this study has added a new dimension as it has shown the LR within K-
SMMIs and identified the factors that are preventing Kuwaiti firms from being lean.
Moreover, there has been a lack of studies regarding LS with an SME context to
date, especially in the Arab world where no studies have considered LS within
SMEs. This study makes a contribution to the literature on lean in the developing-
country context, especially in the Arab world, as Arab countries share many
similarities in terms of culture and other traits, and the findings of this study can be
used as guidance for other Arab countries.
Furthermore, many researchers (e.g., Nordin et al., 2012a; Radnor et al.,
2006) have pointed out the importance of readiness before implementing LS, though
there is lack of literature relating to how this readiness can be assessed and
measured. This study has addressed this gap by developing an LR framework that
organisations can use prior to attempting LS, as it contains most of the lean

371
requirements that represent the foundation of LS, as extracted from the literature
review.
It also contributes to knowledge about the failure of lean implementation.
Several researchers (e.g., Balle, 2005; Papadopoulou and Ozbayrak, 2005; Emilliani,
2008) have stated that despite the huge benefits of LS there are a large number of
failure stories in relation to lean implementation. To avoid failure, there is a need to
understand the organisation’s ability to adopt LS, and to understand the requirements
for it; the LR framework developed in this study will enable organisations to
evaluate their abilities before attempting LS, and to understand the requirements as
the LR framework can be used as a checklist for these.
Finally, due to the diversity of data-collection sources used, this study added
new insight to the inhibitors faced by K-SMMIs which may not enable them to
implement LS, and addressed the source of those inhibitors.
The contributions of this study can therefore be summarised as follows:
Firstly, an LR framework does not currently exist in the literature, and the LS
and LR measurement framework relating to K-SMMIs presented here thus
represents a unique effort in the area of LS.
Secondly, LS has not been covered within the Kuwaiti context, and no
studies have been conducted to date in relation to K-SMMIs.
Thirdly, most lean studies have been conducted with reference to
organisations that have implemented LS already, and the studies have
identified the critical factors based on this, leaving out organisations who
have not yet started LS and who may want to implement LS in future.
Fourthly, this study has contributed to the body of knowledge with respect to
QI within the Kuwaiti context, which can also be generalised to the GCC
region.
7.5 Implications
The LR framework provided here is simple and easy to use, and will allow
managers to understand their current practices to see whether they are supportive of
LS, or if things need to be addressed before implementation. This will make it

372
possible for managers to know whether they have the required resources for LS, and
also to learn whether they are able to afford these resources. For example, by using
the LR framework managers will be able to assess whether they have a tidy
workplace, labelled items, TPM, records of cycle times, skilled workers,
empowerment, investment funds for training, etc. If managers are not willing to
implement these they will have a minimal chance of success in LS, as LS requires
most of the aspects mentioned. The framework is not limited to use in Kuwait, as it
was derived from different studies around the world, and most of the items are
applicable to all types of manufacturing industries.
Moreover, the findings of this research can arguably be generalised to all K-
SMMIs, as several interviews were conducted with consultants in Kuwait to identify
the reasons why LS implementation has been delayed, which means that a general
view of the K-SMMIs was obtained, rather than data only on those visited. Further,
as most Arab countries – and, more precisely, those in the GCC region – share
similar cultures and values, the results can be generalised to them, bearing in mind
that LS requires certain types of cultures, in both an organisational and a national
sense.
The findings in this study show that one of the aspects that has prevented K-
SMMIs from adopting LS is nepotism and favouritism, alongside other
characteristics such as the country’s wealth and high dependence on expatriates; all
these issues are applicable to most of the GCC countries, so it is believed that the
findings can be applied to other Arab countries, especially GCC countries. Gherbal
et al. (2012) found that Libyan industries are adopting ISO 9000 for prestige
purposes, not for improvement, which supports the findings of this study. Further,
Jaber (2010) found that favouritism is affecting Libyan readiness towads TQM; this
can also be understood from a statement made by Bardot (2013, p. 21) regarding the
GCC:
GCC countries, despite some local nuances, follow some common characteristics.
Most of the population is made of expatriates [...] the local nationals often represent a
small fraction of the overall population and tend to work in highly paid and
prestigious government jobs. The local governments are making efforts to promote
the employment of their citizens in the private sector, which is often a challenge due
to cultural and financial reasons. Packages, even though under local law, are focused

373
on cash and built similarly to international assignee packages: basic pay, various
allowances from housing to transportation, education or furniture.
Additionally, Bardot (2013) explained that most of the GCC countries are
eager to improve and are striving to reach the right solutions, but also do not
understand these solutions and do not know how or where to start. LS could be one
of the solutions to boost the manufacturing sectors, so the findings of this study can
serve as guidance for the GCC countries, especially for small, local organisations
and government entities who do not have partnerships with Western companies. As
Bardot (2013) suggested, there is a need for intensive education so that GCC
countries will accept modern practices.
Furthermore, the LR framework can be applied in any manufacturing
industries regardless of location, as it contains key foundational aspects of LS; thus,
any firms that want to adopt LS can use the LR framework to assess their readiness
and to see whether they will be willing to address the areas in which they are lacking
in order to succeed in LS adoption.
7.6 Recommendations
The Kuwaiti government is trying to reduce its reliance on oil and gas, and
supporting K-SMMIs could be key to achieving this vision. Thus, in order to ensure
the success of LS and to enhance the role of K-SMMIs, the government needs to pay
attention to this sector by encouraging firms to adopt LS, and developing awareness
campaigns that highlight the importance of LS and explain the requirements for the
implementation process. This can be done by providing K-SMMIs with appropriate
training and workshops. The findings of this study show the weaknesses of K-
SMMIs and the requirements for LS, which can be used by the government to
formulate some action points in this direction. One of the main things that need to be
done by the government is to create a sense of urgency, and this can be achieved by
expanding the market by introducing FDI, which will increase the level of
competition. More importantly, the government needs to have transparency in
offering governmental projects and contracts, which should be based on quality
rather than links, and decrease the number of procedures required for firms to be
established or to expand.

374
With regard to K-SMMIs, they need to educate themselves in LS, as it can
help them to manage their resources more efficiently. They should rely on quality
labourers, and need to understand the importance of empowerment, CI, involvement,
training, and most of the other issues that have been identified in this study. Equally
important is the need for them to be aware of the use of essential tools, such as 5s
and VM, as these will help them to better manage their processes, which will in turn
reflect in their production rate.
7.7 Limitations
The findings of this study are limited in terms of generalisability to K-
SMMIs, as the study mainly considered SMMIs in Kuwait, and excluded large firms.
Another limitation of this study is the small sample size; the author faced difficulty
in convincing a larger number of companies to participate and could not cover the
whole manufacturing sector in Kuwait due to a lack of time and interest from many
firms, plus the fact that some firms did not fit the criteria (i.e. were not SMMIs).
There is also a lack of information and published studies regarding Kuwaiti
manufacturing industries; further, there is an absence of research regarding LS
within GCC countries, and this meant that it was not possible to compare the
findings with those of other researchers. Increasing the sample size would have
allowed better and more accurate results to be obtained, and would also have
provided more robust results with respect to the t-test and ANOVA.
In this study a semi-structured interview technique was adopted, along with
other data collection methods. Semi-structured interviews may lead to bias, however
different techniques were employed in order to keep this bias limited. Furthermore,
because a survey questionnaire was used in this study, the responses from the
respondents might not be completely accurate, as for some participants the subject
may not have been of interest, and they may have only completed the survey as a
favour, or out of politeness, which would have resulted in misleading answers. By
using different techniques, it is believed that an accurate picture of K-SMMIs has
been obtained – though this cannot be 100 per cent certain.
Furthermore, two firms were considered for the case study, but the initial
idea was to use four (two ISO-accredited, and two non-ISO-accredited firms). Initial

375
agreement was obtained from four firms, but two firms then withdrew due to time
constraints and confidentiality concerns.
Finally, due to time constraints it was not possible to validate the LR
framework in SMMIs who have already implemented LS to use as a benchmark.
7.8 Future research
Due to its exploratory and descriptive nature, this study highlights a number
of avenues for further empirical research; as a first step, the framework needs to be
applied to successful lean SMMIs in order to use it as a valid benchmark. Other
suggested avenues for future research include finding out why ISO 9000 has not
affected K-SMMIs’ internal processes, and this can be done by investigating the
motives behind ISO 9000 adoption, and measuring the effects of ISO 9000 (in terms
of quality of product, customer satisfaction, documentation, process improvement,
etc.) before and after implementation.
This study has not covered all of the manufacturing sectors within the
Kuwaiti context, and it is important to apply it to sectors such as food and beverages;
textiles, clothing and leather; wood and wood products; furniture, etc. Increasing the
sample size would be another avenue by which to provide more accurate results in
the future.
Further, the findings of this study show that there are many external factors
inhibiting the full potential of K-SMMIs, and that there is no real urgency for them
to adopt LS; thus, conducting studies measuring the readiness towards LS within
Kuwaiti service sectors would be good step to see whether the discovered factors are
affecting the manufacturing sectors only, or also the service industry.
Furthermore, Arab countries – and more precisely the GCC region – share
many values, traditions and cultural aspects with Kuwait, so finding out the LR for
firms in these countries would add a great deal of richness to the lean system
literature.

376
References
Abbas, A. (1996). Organizational development in the Arab world. The Journal of
Management Development, 15(5), 4-21.
Abbasi, S., and Hollman, K. (1993). Business success in the Middle East.
Management Decisions, 31(1), 55-60.
Abdalla, A., and Al‐Homoud, M. A. (2001). Exploring the implicit leadership theory
in the Arabian Gulf States. Applied Psychology, 50(4), 506-531.
Abdalla, I. A., and Al-Homoud, M. (1995). A survey of management training and
development practices in the State of Kuwait. Journal of Management
Development, 14(3), 14-25.
Abdolvand, N., Albadvi, A., and Ferdowsi, Z. (2008). Assessing readiness for
business process reengineering. Business Process Management Journal,
14(4), 497-511.
Abdul Raman, N., and Jamaludin, K. R. (2008). Implementation of Toyota
Production System (TPS) in the Production Line of A Local Automotive
Parts Manufacturer. International Conference on Mechanical and
Manufacturing Engineering (ICME2008). Malaysia: Faculty of Mechanical
and Manufacturing Engineering, Universiti Tun Hussein Onn Malaysia
(UTHM).
Abdullah, F. M. (2003). Lean manufacturing tools and techniques in the process
industry with a focus on steel (Doctoral thesis). Pittsburgh: University of
Pittsburgh.
Abrahamsson, S., and Isaksson, R. (2012). Implementing Lean – Discussing
Standardization Versus Customization with Focus on National Cultural
Dimensions. Management and Production Engineering Review, 3(4), 4-13.
Ab-Rahman, M. N., Shokshok, M. A., and Abd-Wahab, S. D. (2011). Barriers and
Benefits of Total Quality Management Implementation in Libyan
Manufacturing Companies. Middle-East Journal of Scientific Research, 7(4),
619-624.

377
Abu-Hussin, M. F. (2010). Exploring International Trade between Malaysia and
GCC Countries: Empirical Analysis on Trends, Developments and
Challenges (Doctoral thesis). Durham: Durham University.
Achanga, P. C. (2007). Development of an impact assessment framework for lean
manufacturing within SMEs (Doctoral thesis). Cranfield: Cranfield
University.
Achanga, P., Shehab, E., Roy, R., and Nelder, G. (2006). Critical success factors for
lean implementation within SMEs. Journal of Manufacturing Technology
Management, 17(4), 460-471.
Acs, Z. J., and Audretsch, D. B. (1990). Innovation and Small Firms, The MIT Press.
Cambridge, Massachusetts: MIT Press.
Adams, G. R., and Schvaneveldt, J. D. (1991). Understanding Research Methods.
(2nd ed.). New York: Longman.
Adler, N. J. (1986). International Dimensions of Organizational Behavior. Boston:
Kent Publishing.
Adler, N. J., Doktor, R., and Redding, S. G. (1986). From the Atlantic to the Pacific
century: cross-cultural management reviewed. Journal of Management, 12,
295-318.
Ahire, S. L., and Golhar, D. Y. (1996). Quality management in large vs small firms.
Journal of Small Business Management, 34(2), 1-11.
Ahire, S., Golhar, D., and Waller, M. (1996). Development and validation of TQM
implementation constructs. Decision Sciences, 27(1), 23-56.
Åhlström, P. (1998). Sequences in the implementation of lean production. European
Management Journal, 16(3), 327-334.
Akl, E., Gaddam, S., Mustafa, R., Wilson, M., Symons, A., Grifasi, A., . . .
Schünemann, H. (2011). The effects of tracking responses and the day of
mailing on physician survey response rate: Three randomized trials. PLoS
ONE, 6(2), 1-6.

378
Aksu , M. B. (2003). TQM readiness level perceived by the administrators working
for the centralorganization of the Ministry of National Education in Turkey.
Total Quality Management and Business Excellence, 14(5), 595-608.
Al Khafaji, A. (2001). Corporate Transformation and Restructuring: A Strategic
Approach. London: Greenwood Press.
Aldowaisan, T. A. (2012). The Path to Reform and Prosperity (Unpublished Report).
Kuwait: Gulf Lead Consultants.
Ali, A. (1993). Management theory in a transitional society: The Arab‘s experience.
International Studiesof Management and Organization, 20(3), 7-35.
Ali, A. (1995). Cultural discontinuity and Arab management thought. International
Studies of Management and Organization, 25(3), 7-30.
Ali, A. (2005). Islamic Perspectives On Management And Organization .
Cheltenham: Edward Elgar.
Ali, A. J. (1989a). A comparative study of managerial beliefs about work in the Arab
states. Advances inInternational Comparative Management, 4, 95-112.
Ali, A. J. (1989b). Decision style and work satisfaction of Arab executives: A cross-
national study. Interna-tional Studies of Management and Organization,
19(2), 22–37.
Ali, A. J. (1990). Decision-making style, individualism, and attitudes toward risk of
Arab executives. Inter-national Studies of Management and Organization,
23(3), 53-73.
Ali, A. J., and Al-Kazemi, A. (2006). Human resources management in Kuwait. In P.
S. Budhwar, and K. Mellahi (Eds.), Managing human resources in the
Middle East (pp. 79-96). London: Routledge.
Ali, A. J., Taqi, A. A., and Krishnan, K. (1997). Individualism, Collectivism, and
Decision Styles of Managers in Kuwait. The Journal ofSocial Psychology,
137(5), 629-637.

379
Ali, G. E., and Magalhaes, R. (2008). Barriers to implementing e-learning: a Kuwaiti
case study. International Journal of Training and Development, 12, 36-53.
Al-Kazemi, A. A., and Ali, A. J. (2002). Managerial problems in Kuwait. Journal of
Management Development, 21(5), 366-375.
Al-Khalifa, K. N., and Aspinwall, E. M. (2000). The development of total quality
management in Qatar. The TQM Magazine, 12(3), 194-204.
Allen, J., Robinson, C., and Stewart, D. (2001). Lean Manufacturing: A plant floor
guide . Dearborn, MI : Society of Manufacturing Engineers.
Al-Mashari, M., Al-Mudimigh, A., and Zairi, M. (2003). Enterprise resource
planning: taxonomy of critical factors. European Journal of Operational
Research, 146, 352-364.
Almström, P., and Kinnander, A. (2011). The productivity potential assessment
method: Assessing and benchmarking the improvement potential in
manufacturing systems at shop-floor level. International Journal of
Productivity and Performance Management, 60(7), 758-770.
Al-Najem, M., Dhakal, H., and Bennett, N. (2012). The role of culture and
leadership in lean transformation: a review and assessment model.
International Journal of Lean Thinking, 3(1), 119-138.
Al-Nofal, A., Zairi, M., and Ahmed, A. M. (2004). Critical Factors of TQM: An
international Comparative Benchmarking Analysis. University of Bradford
UK, School of Management. Bradford, UK: An International Comparative
Benchmarking Analysis.
Al-Omaim, N. (2002). An Empirical Investigation of Total Quality Management
Implementation in the Kingdom of Saudi Arabia (Doctoral thesis). Bradford:
University of Bradford.
Al-Rasheed, A. (2001). Features of traditional Arab management and organization in
the Jordan business environment. Journal of Translational Management
Development, 6(1-2), 27-53.

380
Al-Saadoun, J. (2012, July 11). Kuwait Economic. (M. Alwahishi, Interviewer)
Kuwait: Alam Alyawm.
Al-Saif, W. (2002). Creation: the experience of Kuwait small projects Development
Company. Kuwait: KSPDC.
Al-Shaikh, F. (2003). The practical reality theory and business ethics in non-Western
context. Journal of Management Development, 22(8), 679-693.
ALSHALL. (2009, July 5). ALSHALL Weekly Economic Report. 19. Kuwait:
ALSHALL Consulting Co.
Al-Sulimani, T. (1995). Total Quality Management in Saudi Manufacturing
Industry- A Survey Based Implementation Plan. In the Fourth Saudi
conference, (pp. 83-89). Saudi Arabia .
Al-Swidi, A. K., and Mahmood, R. (2011). How does Organizational Culture Shape
the Relationship between Entrepreneurial Orientation and the Organizational
Performance of Banks?. European Journal of Social Sciences, 20(1), 28-46.
Al-Tamimi, A. D. (2013). Plan to Support Small Businesses: In Kuwait Lacks Clear
Vision. London: Al-Hayat (Pan Arab).
Al-Tarah, A. (2003). Some social indicators for development in the Arab Gulf
Coopertaion Council between State domination and continuity of human
development: A case of Kuwait. In the proceedings of the Human
Development Arab Gulf Cooperation Council: Failure and Success (pp. 173-
24). Bahrain: Muntada Al-Tanmeha.
Altarawneh, I. (2009). Training and Development Evaluation in Jordanian Banking
Organisations. Research and Practice in Human Resource Management,
17(1), 1-23.
Al-Zamany, Y., Hoddell, S. E., and Savage, B. M. (2002). Understanding the
difficulties of implementing quality management in Yemen. The TQM
Magazine, 14(4), 240-247.

381
Anand, G., and Kodali, R. (2008). Performance measurement system for lean
manufacturing: a perspective from SMEs. International Journal of
Globalisation and Small Business, 2(4), 371-410.
Anand, G., and Kodali, R. (2009). Development of a framework for lean
manufacturing systems. International Journal Services and Operations
Management, 5(5), 687-716.
Angelis, J., Conti, R., Cooper, C., and Gill, C. (2011). Building a high-commitment
lean culture. Journal of Manufacturing Technology Management, 22(5), 569-
586.
Ansari, A., and Modarress, B. (1998). JIT purchasing as a quality and productivity
center. International Journal of Production Research, 26(1), 19-26.
Anthony, J., and Kumar, M. (2005). Six sigma in small and medium sized UK
manufacturing enterprises. International Journal of Quality and Reliability
Management, 22(8), 60-87.
Antony, J. (2006). Implementing the Lean Sigma Framework in an Indian SME: a
case study. Production Planning and Control, 17(4), 407-423.
Antony, J., Kumar, M., and Labib, A. (2008). Gearing Six Sigma into UK
manufacturing SMEs: results from a pilot study. Journal of the Operational
Research Society, 59 (4), 482-493.
Antony, J., Leung, K., Knowles, G., and Gosh, S. (2002). Critical success factors of
TQM implementation in Hong Kong industries. International Journal of
Quality and Reliability Management, 19(5), 551-566.
Anvari, A., Ismail, Y., and Hojjati, S. M. (2011). A study on total quality
management and lean manufacturing: through lean thinking approach. World
Applied Sciences Journal, 12(9), 1585-1596.
Appelbaum, S. T., Leblance, M., and Shapiro, B. T. (1998). The After math of
Downsizing: Disengagement - Disidentification - Disenfranchisement and
Disenchantment (A Case Study). Journal of Management Devlopment, 17(6),
402-431.

382
Aria, F. S., Lameei, A., Ghasemie, R. L., and Ekrami, M. (2009). Readiness of Iran
Universities of Medical Sciences for Conducting Total Quality Management
(TQM) according to Educational Managers’ Point of View. Strides in
Development of Medical Education , 6(1), 74-80.
Astrachan, J. H., and Kolenko, T. A. (1994). A neglected factor explaining family
business success: human resource practices. Family Business Review, 7(3),
251-262.
Atkinson, P. (2010). Lean is a cultural issue. Management Services, 54, 35-44.
At-Twaijri, M. I., and Al-Muhaiza, I. A. (1996). Hofstede's cultural dimensions in
the GCC countries: An empirical investigation. International Journal of
Value-Based Management, 9(2), 121-131.
Axinn, W., and Pearce, L. D. (2006). Mixed Method Data Collection Strategies. New
York : Cambridge University Press.
Baba, M. L., and Falkenburg, D. R. (1996). Technology management and American
culture: implications for business process redesign. Research Technology
Management, 39(6), 44-55.
Badri, M., Davis, D., and Davis, D. (1995). A study of Measuring the Critical
Factors of Quality Management. International Journal of Quality and
Reliability Management, 12(2), 36-53.
Baidoun, S. (2004). The implementation of TQM philosophy in Palestinian
organization: a proposed non-prescriptive generic framework. The TQM
Magazine, 16(3), 174-185.
Bakås, O., Govaert, T., and Van Landeghem, H. (2011). Challenges and success
factors for implementation of Lean manufacturing in European SMEs. In
MITIP 2011 (pp. 397-407). Trondheim, Norway: Tapir Academic Press,
Dreyer, H., Strandhagen, J. O., and Bjartnes, R. eds.
Baker, T. L. (1994). Doing Social Research (2nd ed.). New York: McGraw-Hill Inc.

383
Baldwin-Edwards, M. (2011). Labour Immigration and Labour Markets in the GCC
Countries: National Patterns and Trends. London: London School of
Economics.
Balle, M. (2005). Lean attitude [considering attitude in lean production].
Manufacturing Engineer , 84(2), 14-19.
Bamber, L., and Dale, B. G. (2000). Lean production: a study of application in a
traditional manufacturing environment. Production planning and control,
11(3), 291-298.
Bardoel, A. E., and Sohal, A. S. (1999). The role of the cultural audit in
implementing quality improvement programs. International Journal of
Quality and Reliability Management, 16(3), 263-277.
Bardot, S. (2013). Background on Work Life in the United Arab Emirates and Other
Gulf Countries (Gulf Cooperation Council). Compensation and Benefits
Review, 45(1), 21-25.
Barla, S. B. (2003). A case study of supplier selection for lean supply by using a
mathematical model. Logistics Information Management, 16(6), 451-459.
Bartezzaghi, E. (1999). The evolution of production models: is a new paradigm
emerging. Journal of Operations Management, 229–250.
Baruch, Y. (1999). Response Rate in Academic Studies: A Comparative Analysis.
Human Relations,, 52, 421-434.
Bayazita, O., and Karpak, B. (2007). An analytical network process-based
framework for successful total quality management (TQM): An assessment
of Turkish manufacturing industry readiness. International Journal of
Production Economics, 105(1), 79-96.
Bayo-Moriones, A., Bello-Pintado, A., and Merino-Díaz de Cerio, J. (2010). 5s use
in manufacturing plants: contextual factors and impact on operating
performance. International Journal of Quality and Reliability Management,
27(2), 217-230.
384
Bayou, M. E., and de Korvin, A. (2008). Measuring the leanness ofmanufacturing
systems: a case study of Ford Motor Company and General Motors. Journal
of Engineering and Technology Management, 25(4), 287-304.
Behrouzi, F., and Wong, K. Y. (2011). An investigation and identification of lean
supply chain An investigation and identification of lean supply chain
performance measures in the automotive SMEs. Scientific Research and
Essays, 6(24), 5239-5252.
Bell, J. (1999). Doing Your Research Project. A Guide for First Time Researchers
inEducation and Social Sciences. Buckingham: Open University Press.
Ben Jaber, A. A. (2010). Investigating the factors affecting the readiness for TQM
implementation within Libyan higher education institutions (Doctoral thesis).
Salford: University of Salford.
Benson, R., and Kulkarni, N. S. (2011). Understanding Operational Waste from a
Lean Biopharmaceutical Perspective. Pharmaceutical Engineering, 31(6), 1-
7.
Bergmiller, G. G., and McCright, P. R. (2009). Parallel Models for Lean and Green
Operations. Industrial Engineering Research Conference. Miami, Florida.
Bessant, J., Caffyn, S., Gilbert, J., and Harding, R. (1994). Rediscovering continuous
improvement. Technovation, 14(1), 17-29.
Bhasin, S. (2011). Performance of organizations treating lean as an ideology.
Business Process Management Journal, 17(6), 986-1011.
Bhasin, S. (2012). Prominent obstacles to Lean. International Journal of
Productivity and Performance Management, 61(4), 403-425.
Bhasin, S., and Burcher, P. (2006). Lean viewed as a philosophy. Journal of
Manufacturing Technology Management, 17(1), 56-72.
Bhuiyan, N., and Baghel, A. (2005). An overview of continuous improvement: from
the past to the present. Management Decision, 43(5), 761-771.

385
Bicheno, J., and Holweg, M. (2009). The Lean Toolbox (4th ed.). Buckingham, UK:
PICSIE Books.
Bicheno, J., Millman, T., and Ostrowski, S. (1997). The Dimensions of Lean
Manufacturing. Management Research News, 20(2/3), 76-76.
Biggs, C. (2009). Exploration of the integration of Lean and environmental
improvement (Doctoral thesis). Cranfield, UK: Cranfield University.
Billesbach, T. J. (1991). A study of the implementation of Just in Time in the United
States. Production and Inventory Management Journal, 32(3), 1-4.
Black, J. T. (2007). Design rules for implementing the Toyota Production System.
International Journal of Production Research, 45(16), 3639-3664.
Blair, T. (2009). Vision Kuwait 2030: Final Report.
Bohemia, E. (2002). Designer as integrator: reality or rhetoric?. Design Journal,
5(4), 23-34.
Bonavia, T., and Marin, J. A. (2006). An empirical study of lean production in the
ceramic tile industry in Spain. International Journal of Operations and
Production Managemen, 26(5), 505-531.
Boughton, N. J., and Arokiam, I. C. (2000). The application of cellular
manufacturing: A regional small to medium enterprise perspective. In the
proceedings of the Institution of the Mechanical Engineers, 214 (Part B), pp.
751-754.
Bouma, G. D., and Atkinson, G. B. (1995). A handbook of social science research :
a comprehensive and practical guide for students (2nd ed.). Oxford: Oxford
University Press.
Bounds, G., Ranney, G., Yorks, L., and Adams, M. (1994). Beyond Total Quality
Management (1st ed.). Singapore: McGraw-Hill.
Bowling, A. (2005). Mode of questionnaire administration can have serious effects
on data quality. Journal of Public Health, 27(3), 281-291.

386
Boyer, K. K. (1996). An assessment of managerial commitment to lean production.
International Journal of Operations and Production Management, 16(9), 48-
59.
Boyer, M., and Sovilla, L. (2003). How to identify and remove the barriers for a
successful lean implementation. Journal of ship production, 19(2), 116-120.
Boynton, A. C., and Zmud, R. W. (1984). An Assessment of Critical Success
Factors. Sloan Management Review, 25(4), 17-29.
Briggs, P. (1988). The Japanese at work: illusions of the ideal. Industrial Relations
Journal, 19(1), 24-30.
Brophy, A. (2012). FT Guide to Lean: How to Streamline Your Organisation,
Engage Employees and Create a Competitive Edge. Harlow: Pearson
Education Limited.
Bruun, P., and Mefford, R. N. (2004). Lean production and the Internet.
International Journal of Production Economics, 247–260.
Bryman , A., and Bell, E. (2007). Business Research Methods (2nd ed.). Oxfrod:
Oxford University Press.
Bryman , A., and Bell , E. (2011). Business Research Methods (3rd ed.). Oxford:
Oxford University Press.
Bryman, A. (1988). Quantity and quality in social research. London, England:
Unwin Hyman.
Buchanan, D., and Huczynski, A. (1997). Organizational Behaviour (3rd ed.).
London, New York: Prentice Hall.
Burman, R. (1995). Manufacturing Management: Principle and Systems. London:
McGraw-Hill.
Burney, N., Mohammed, O., and Al-Mussallam, N. (2010). Productivity in
manufacturing industries in Kuwait. Economia Internazionale/International
Economics, 59(1), 1-16.

387
Carey, J. W. (1993). Linking Qualitative and Quantitative Methods: Integrating
Cultural Factors into Public Health. Qualitative Health Research, 3(3), 298-
318.
Carr, S., Mak, T. Y., and Needham, E. J. (1997). Differences in strategy, quality
management practices and performance reporting systems between ISO
accredited and non-ISO accredited companies. Management Accounting
Research, 8, 383-403.
Cavana, R. Y., Delahaye, B. L., and Sekaran, U. (2001). Applied business research:
Qualitative and quantitative methods. Queensland: John Wiley and Sons.
Chiang, F. (2005). A critical examination of Hofstede's thesis and its application to
internationalreward management. International Journal of Human Resource
Management, 16(9), 1545-1563.
Chiarini, A. (2011a). Japanese total quality control, TQM, Deming's system of
profound knowledge, BPR, Lean and Six Sigma: Comparison and discussion.
International Journal of Lean Six Sigma, 2(4), 332-355.
Chiarini, A. (2011b). Integrating lean thinking into ISO 9001: a first guideline.
International Journal of Lean Six Sigma, 2(2), 96-117.
Chin, K. S., and Pun, K. F. (2002). A Proposed Framework for Implementing TQM
in Chinese Organizations. International Journal of Quality and Reliability
Management, 19(3), 272-294.
Chong, V. K., and Rundus, M. J. (2004). Total quality management, market
competition and organizational performance. The British Accounting Review,
36, 55-172.
Chua, J. H., Chrisman, J. J., and Sharma, P. (1999). Definingthe family business by
behavior. EntrepreneurshipTheory and Practice, 23(4), 19-39.
Clark, P. (2010). The adoption and practice of mixed methods: U.S. trends in
federally funded health related research. Qualitative Inquiry, 6(6), 428-440.
Clough, P., and Nutbrown, C. (2007). A Student's Guide To Methodology: Justifying
Enquiry (2nd ed.). London: SAGE.

388
Coakes, S. J. (2005). SPSS v. 12 for Windows: Analysis without Anguish. Singapore:
John Wiley and Sons.
Collins, P. (1994). Approaches to Quality. The TQM Magazine, 6(3), 39-43.
Collis, J., and Hussey, R. (1997). Business Research: A Practical Guide
forUndergraduate and Postgraduate Students. Basingtoke: Palgrave
Macmillan.
Conner, G. (2001). Lean manufacturing for the small shop. Dearborn, Michigan:
Society of Manufacturing Engineers.
Cooney, R. (2002). Is “lean” a universal production system?: Batch production in the
automotive industry. International Journal of Operations and Production
Management, 22(10), 1130-1147.
Coons, J. (2007). Beginning the Lean improvement journey in the Clinical
Laboratory. Techsolve: Cincinnati, Ohio.
Cooper, D. R., and Schindler, P. S. (2006). Marketing Research. New York:
McGraw– Hill.
Cooper, M. J., Upton, N., and Seaman, S. (2005). Customer Relationship
Management:A Comparative Analysis of Family andNonfamily Business
Practices. Journal of Small Business Management, 43(3), 242-256.
Cooper, R., and Slagmulder, R. (1999). Supply Chain Development for the Lean
Enterprise: Interorganizational Cost Management. Portland, OR:
Productivity Press.
Corbett, L. M., and Rastrick, K. N. (2000). Quality performance and organizational
culture: a NewZealand study. International Journal of Quality and Reliability
Management, 17(1), 14-26.
Coronado, R. B., and Antony, J. (2002). Critical success factors for the successful
implementation of six sigma projects in organisations. The TQM Magazine,
14(2), 92-99.

389
Covey, S. R. (2004). The 7 Habits of Highly Effective People . London: Simon and
Schuster.
Creswell, J. (2003). Research design: Qualitative, quantitative and mixed methods
approaches. Thousand Oaks, CA: SAGE.
Creswell, J. W., and Clark, P. (2007). Designing and conducting mixed methods
research. ThousandOaks, CA: SAGE.
Creswell, J., Klassen, A., Clark, P., and Smith, K. (2011). Best practice for mixed
methods research in the health sciences. Office of Behavioral and Social
Sciences Research (OBSSR): Bethesda, MD.
Crosby, P. B. (1979). Quality is free. New York: McGraw-Hill .
Crotty, M. (1998). The Foundations of Social Research: Meaning and Perspective in
the Research Process. London: SAGE.
Culkin, N., and Smith, D. (2000). An emotional business: a guide to understanding
the motivations of small business decision takers. Qualitative Market
Research: An International Journal, 3(3), 145-157.
Curkovic, S., Vickery, S., and Droge, C. (2000). An empirical analysis of
competitive dimensionsof quality performance in the automotive supply
industry. International Journal ofOperations and Production Management,
20(3), 386-403.
Dahlgaard, J. J., and Dahlgaard-Park, S. M. (2006). Lean production, six sigma
quality, TQM and company culture. The TQM Magazine, 18(3), 263-281.
Dale, B. G. (1999). Managing Quality (3rd ed.). Oxford: Blackwell.
Dale, B. G., Cooper, C., and Wilkinson, A. (1997). Managing Quality and Human
Resources. In A Guide to Continuous Improvement (First ed.). London:
Blackwell Publishing.
Dankbaar, B. (1997). Lean production: denial, confirmation or extension of
sociotechnical systems design?. Human Relations, 50(5), 567-585.
390
Davis, P. (1983). Realizing the potential of the family business. Organizational
Dynamics, 12(1), 53-54.
Dayton, N. A. (2001). Total quality management critical success factors,
acomparison: the UK versus the USA. Total Quality Management, 12(3),
293-298.
Deloitte and Touche. (2002). The Road to World Class Manufacturing. Birmingham:
Deloitte and Touche.
Demirbag, M., Tatoglu, E., Tekinkus, M., and Zaim, S. (2006). An analysis of the
relationship between TQM implementation and organizational performance:
evidence from Turkish SMEs. Journal of Manufacturing Technology
Management, 17(6), 829-847.
Dennis, P. (2002). Lean Production Simplified: A Plain Language Guide to the
World's Most Powerful Production System. New York: Productivity Press.
Denscombe, M. (2003). The Good Research Guide for small-scale social
researchprojects (2nd ed.). Maidenhead: Open University Press.
Denscombe, M. (2008). Communities of Practice: A Research Paradigm for the
Mixed Methods Approach. Journal of Mixed Methods Research, 2(3), 270-
283.
Denzin, N. (1970). The research act (1st ed.). Englewood Cliffs, NJ: Prentice Hall.
Deshpande, A. B., Dusting, F. J., and Younger, A. (1986). A co-operative quality
management system for small companies. International Journal of Quality
and Reliability Management, 3(1), 38-47.
Dhandapani, V., Potter, A., and Mohamed, N. (2004). Applying lean thinking: a case
study of an Indian steel plant. International Journal of Logistics: Research
and Applications, 7(3), 239-250.
Dibia, I. K. (2012). Implementation of the leadership, people, process and outcome
model of Lean using soft systems methodology in triangulation (Doctoral
thesis). Portsmouth: University of Portsmouth.

391
Djerdjori , M., and Aleter, A. M. (2007). TQM Readiness Assessment in the Public
Sector in the United Arab Emirates : The Case of the Ministry of
Environment and Water, the Ministry of Finance and Industry and the
Ministry of Public Works. International Journal of Excellence in Public
Sector Management, 1(2), 1-41.
Doolen , T. L., and Hacker, M. E. (2005). A review of Lean Assessment in
Organizations: An Exploratory Study of Lean Practices by Electronics
Manufacturers. Journal of Manufacturing System, 24(1), 55-67.
Drew, J., McCallum, B., and Roggenhofer, S. (2004). Journey to Lean: Making
Operational Change Stick. Hampshire: Palgrave Macmillan.
Duffuaa, S. O., Campbell, J. D., and Raouf, A. (1999). Planning and Control of
Maintenance Systems: Modeling and Analysis. New York: John Wiley and
Sons, Inc.
Easterby-Smith, M., Thorpe, R., and Lowe, A. (2004). Management Research (2nd
ed.). London: SAGE.
Easterby-Smith, M., Thorpe, R., Jackson, P., and Lowe, A. (2008). Management
Research (3rd ed.). London: SAGE.
Eisenhardt, K. M. (1989). Building theories from case study research. The Academy
of Management Review, 14(4), 532-550.
Eisenhardt, K., and Martin, J. (2010). Dynamic capabilities. Strategic Management
Journal, 1105-1121.
Elgamal, M. A. (1998). An examination of organization and suborganization
readiness for total quality management. International Journal of Technology
Management, 16(4), 556-569.
Ellington, E. P., Jones, R. T., and Dean, R. (1996). TQM Adoption Practices in the
Family-Owned Business. Family Business Review, 9(1), 5-14.
Eltony, M. N. (2007). The Economic Development Experience of Kuwait: Some
Useful Lessons. Journal of Economic and Administrative Sciences, 23(1), 77-
102.

392
Emiliani, B. (2008). Real Lean: The Keys to Sustaining Lean Management (Vol. 3).
Wethersfield, CT. USA: CLBM, LLC.
Emiliani, M. L. (1998). Lean behaviors. Management Decision, 36(9), 615 - 663.
Emiliani, M. L. (2006). Origins of lean management in America: The role of
Connecticut businesses. Journal of Management History, 12(2), 167-184.
Emiliani, M. L., and Stec, D. J. (2005). Leaders lost in transformation. Leadership
and Organization Development Journal, 26(5), 370-387.
Farhadi, F., Navabakhsh, M., and khayamBashi, B. (2012). Presenting a Model
Determining Readiness Level of Personnel Admission to Establishment
TQM in Isfahan Behr is Spinning and Weaving Company. International
Journal of Business and Social Science, 3(20), 280-287.
Farris, J. A., Van Aken, E. M., Doolen, T. L., and Worley, J. M. (2008). Learning
from less successful Kaizen events: a case study. Engineering Management
Journal, 20(3), 10-20.
Fasano, U., and Goya, R. (2004). Emerging Strains in the GCC Labor Markets.
Washington, DC: International Monetary Fund.
Feld, W. M. (2000). Lean Manufacturing: Tools, Techniques, and How To Use
Them. London: The St. Lucie Press.
Ferdousi , F., and Ahmed, A. (2010). A Manufacturing Strategy: An Overview of
Related Concepts,Principles and Techniques. Asian Journal of Business
Management , 2(2), 35-40.
Ferdousi, F. (2009). An investigation of manufacturing performance improvement
through lean production: a study on Bangladeshi garment firms. International
Journal of Business and Management, 4(9), 106-116.
Fida, B. A. (2008, December 29). The Importance of Small and Medium Enterprises
(SMEs) in Economic Development. The Free Library. Retrieved October 20,
2010, from http://www.thefreelibrary.com/:
http://www.thefreelibrary.com/The Importance of Small and Medium
Enterprises (SMEs) in Economic...-a01073924138

393
Fink, A. (1995). The survey handbook (Vol. 1). CA: Thousands Oaks, Sage.
Fink, A. (1998). Conducting Research Literature Reviews: From Paper to the
Internet. London: SAGE.
Flick, U. (2007). An Introduction to Qualitative Research (3rd ed.). London: SAGE.
Fogarty, D. W. (1992). Work in process: performance measures. International
Journal of Production Economics, 26(1-3), 169-172.
Forrester, R. (1995). Implications of lean manufacturing for human resource
strategy. Work Study, 44(3), 20-24.
Forza, C. (1996). Work organization in lean production and traditional plants: What
are the differences?. International Journal of Operations and Production
Management, 16(2), 42-62.
Found, P., and Harrison, R. (2012). Understanding the lean voice of the customer.
International Journal of Lean Six Sigma, 3(3), 251-267.
Fujimoto, T. (1999). The Evolution of a Manufacturing System at Toyota. New York,
NY: Oxford University Press.
Fullerton, R. (2003). Performance measurement and reward systems in JIT and non-
JIT firms. Journal of Cost Management, 17(6), 40-48.
Furlan, A., Vinelli, A., and Dal Pont, G. (2011). Complementarity and lean
manufacturing bundles: an empirical analysis. International Journal of
Operations and Production Management, 31(8), 835-850.
Gable, G. G. (1994). Integrating Case Study and Survey Research Methods: An
Example in Information Systems. European Journal of Information Systems,
3(2), 112-126.
Garbie, I. H. (2010). Enhancing the Performance of Industrial Firms through
Implementation of Lean Techniques. In the proceedings of the Industrial
Engineering Research Conference . Cancun, Mexico: A. Johnson and J.
Miller, eds.
394
Garver , M. S., and Mentzer, J. T. (1999). Logistics research methods: employing
structural equation modelling to test for construct validity. Journal of
Business Logistics, 20(1), 33-57.
Garvin, D. A. (1991). How the Baldrige Award really works. Harvard Business
Review, 80-93.
Garza-Reyes, J., Al-Jasser, A., Oraifige, L., Soriano-Meier, H., and Forrester, P.
(2011). A general evaluation of Total Quality Management (TQM) in the
Kuwait oil industry. In 21st International Conference on Flexible Automation
and Intelligent Manufacturing (FAIM 2011), (pp. 26-29). Taichung, Taiwan.
George, A. (2003). Create a Lean, Mean Machine. Quality Progress, 29-36.
Gherbal, N., Shibani, A., Saidani, M., and Sagoo, A. (2012). Critical Success Factors
of Implementing Total Quality Management in Libyan Organisations. In the
proceedings of the International Conference on Industrial Engineering and
Operations Management, (pp. 80-89). Istanbul.
Ghobadian, A., and Gallear, D. (1997). TQM and organization size. International
Journal of Operations and Production Management, 17(2), 121-163.
Golicic, S. L., and Medland, S. S. (2007). Size Might Matter: A Case Study of Lean
Implementation in an SME. In the proceedings of the Society for Marketing
Advances Proceedings (pp. 261-264). Kuala Lumpur, Malaysia: Society for
Marketing Advances.
Goodson, E. (2002). Read a plant fast. Harvard Business Review, 105-113.
Gotzamani, K. D., and Tsiotras, G. D. (2001). An empirical study of the ISO 9000
standards’ contribution towards total quality management. International
Journal of Operations and Production Management, 21(10), 1326-1342.
Graves, C., and Thomas, I. (2006). Internationalization of Australian Family
Businesses: A Managerial Capabilities Perspective. Family Business Review,
19, 207-224.

395
Greene, J. C., Caracelli, V. J., and Graham, W. F. (1989). Toward a conceptual
framework for mixed-method evaluation designs. Educational Evaluation
and Policy Analysis, 11, 255-274.
Grief, M. (1991). The Visual Factory. Portland: Productivity Press.
Guba, E., and Lincoln, Y. (1994). Competing paradigms in qualitative research. In
N. K. Denzin , and Y. S. Lincoln, In Handbook of Qualitative Research (pp.
105-117). London: SAGE .
Gunasekaran, A., and Lyu, J. (1997). Implementation of just-in-time in a small
company: a case study. Production Planning and Control, 8(4), 406-412.
Gunasekaran, A., Forker, L., and Kobu, B. (2000). Improving operations
performance in a small company: a case study. International Journal of
Operations and Production Management, 20(3), 316-335.
Gurumurthy, A., and Kodali, R. (2009). Application of benchmarking for assessing
the lean manufacturing implementation. Benchmarking: An International
Journal, 16(2), 274 -308.
Gurumurthy, A., and Kodali, R. (2011). Design of lean manufacturing systems using
value stream mapping with simulation: a case study. Journal of
manufacturing technology management, 22(4), 444-473.
Haksever, C. (1996). Total Quality Management in the small business environment.
Business Horizons, 39(2), 33-40.
Hall, R. (2004). Lean and the Toyota production system. Target, 20(3), 7-22.
Hanafizadeh, P., and Ravasan, A. Z. (2011). A McKinsey 7S Model-Based
Framework for ERP Readiness Assessment. International Journal of
Enterprise Information Systems, 7(4), 23-63 .
Harry, W. (2007). Employment creation and localization: the crucial human resource
issues for the GCC. The International Journal of Human Resource
Management, 18(1), 132-146.
396
Hashim, M. K., and Abdullah, M. S. (2000). In Development of SMEs: Research
issues and agenda. In M. A. Abdullah, and M. I. Bin Baker (Eds.), In Small
and Medium Enterprises in Asian Pacific Countries: v. 1: Roles and Issues
(pp. 193-210). Huntington, NY: Nova Biomedical.
Hayes, R. H., and Pisano, G. P. (1994). Beyond world-class – the new manufacturing
strategy. Harvard Business Review, 72(1), 77-86.
Haynes, B. P. (2008). The impact of office comfort on productivity. Journal of
Facilities Management, 6(1), 37-51.
Helper, S. (1991). How much has really changed between US automakers and their
suppliers?. Sloan Management Review, 15, 15-28.
Hensley, R. L., and Dobie, K. (2005). Assessing readiness for six sigma in a service
setting. Managing Service Quality, 15(1), 82-101.
Herron, C., and Braiden, P. M. (2007). Defining the foundation of lean
manufacturing in the context of its origins (Japan). In IET International
Conference on Agile Manufacturing (ICAM 2007) (pp. 148-157). Durham,
UK: Institution of Engineering and Technology.
Hertog, S. (2010). Benchmarking SME Policies in the GCC: A Survey of Challenges
and Opportunities. Brusells: EU-GCC Chamber Forum.
Hill, R., and Stewart, J. (2000). Human resource development in small organizations.
Journal of European Industrial Training, 24(2/3/4), 105-117.
Hines, P., Holwe, M., and Rich, N. (2004). Learning to evolve: A review of
contemporary lean thinking. International Journal of Operations and
Production Management, 24(10), 994-1011.
Hines, R., Rich, N., and Esain, A. (1999). Value stream mapping: a distribution
industry application. Benchmarking: An International Journal, 6(1), 60-77.
Hino, S. (2005). Inside the Mind of Toyota: Management Principles for Enduring
Growth. New York: Productivity Press.

397
Ho, S. K. (1994). Is the ISO 9000 Series for Total Quality Management?.
International Journal of Quality and Reliability Management, 11(9), 74-89.
Hodgetts, R., Kuratko, D., and Hornsby, J. (1999). Quality implementation in small
business: perspectives from the Baldrige award winners. SAM Advanced
Management Journal, 64(1), 37-47.
Hofer, C. W., and Charan, R. (1984). The transition to professional ma nagem e nt:
Missionimpossible?. American Journal of Small Business, 9(1), 1-11.
Hofstede, G. (1980). Motivation, leadership, and organization: Do American theories
apply abroad. Organizational dynamics, 9(1), 42-63.
Hofstede, G. (1997). Cultures and Organizations: Software of the mind. New York:
McGraw-Hill.
Hokoma, R. A., Khan, M. K., and Hussain, K. (2010). The present status of quality
and manufacturing management techniques and philosophies within the
Libyan iron and steel industry. The TQM Journal, 22(2), 209-221.
Holland, C. P., and Light, B. (1999). A critical success factors model for ERP
implementation. FOCUS, IEEE Software, 16(3), 5-30.
Holt, D. T., Bartczak, S. E., Clark, S. W., and Tren, M. R. (2007). The development
of an instrument to measure readiness for knowledge management.
Knowledge Management Research and Practice, 5(2), 75-92.
Holweg, M. (2007). The genealogy of lean production. Journal of Operations
Management, 25(2), 420-437.
Höök, M., and Stehn, L. (2008). Lean principles in industrialized housing
production: the need for a cultural change. Lean Construction Journal, 20-33.
Hopp, W. J., and Spearman, M. L. (2004). To pull or not to pull: what is the
question?. Manufacturing and Service Operations Management, 6(2), 33-
148.
Hunter, J. (2013). Management Matters: Building Enterprise Capability. Vancouver,
Canada: Lean Publishing.
398
Huq, Z., and Stolen, J. D. (1998). Total quality management contrasts in
manufacturing and service industries. International Journal of Quality and
Reliability Management, 15(2), 38-161.
Hussein, A. (2009). The use of Triangulation in Social Sciences Research: Can
qualitative and quantitative methods be combined. Journal of Comparative
Social Work, 1, 1-12.
Hussey, J., and Hussey, R. (1997). Business Research: A Practical Guide for
Undergraduate and Postgraduate Students. London: Palgrave Macmillan.
Hyland, P., Mellor, R., O’Mara, E., and Kondepudi, R. (2000). A comparison of
Australian firms and their use of continuous improvement tools. The TQM
Magazine, 12(2), 117-124.
Ibielski, D. (1997). So What about Small Business Productivity?. National
Productivity Review, 17(1), 1-4.
Ibrahim, A. A. (2010, February 10). Bill tabled on establishment of independent
authority for SMEs. Arab times, p. 3.
Ichimura, M. (2008). A model for workforce training in lean environment : A
empirical study (Doctoral thesis). London: University of East London.
Ichimura, M., Arunachalam, S., and Jahankhani, H. (2007). New training framework
for lean manufacturing: An empirical study. In the proceedings of the
Advances in Computing and Technology, (ACandT) The School of
Computing and Technology 2nd Annual Conference, University of East
London (pp. 174-183). London: ICGES Press.
Ichimura, M., Jahankhani, H., and Arunachalam, S. (2006). Training for successful
lean manufacturing implementation. In the proceedings of the Advances in
Computing and Technology, (ACandT) The School of Computing and
Technology 1st Annual Conference, University of East London (pp. 167-172).
London: ICGES Press.

399
Ilkay, M. S., and Aslan, E. (2012). The effect of the ISO 9001 quality management
system on the performance of SMEs. International Journal of Quality and
Reliability Management, 29(7), 753-778.
Industrial Bank of Kuwait. (2001). Industrial Bank of Kuwait. Kuwait: IBK.
Inman, R. A., and Mehra, S. (1990). The transferability of just-in-time concepts to
American small businesses. Interfaces, 20(2), 30-37.
Isaa, T. (2007). Quality assessment and waste reduction in Kuwaiti manufacturing
industries. Kuwait Institute for Scientific Research , Quantitative Methods
and Modelling Department. Kuwait: KISR.
ISO. (2008a). The ISO Survey of Certifications 2008. Genève, Switzerland:
International Organization for Standardization.
ISO. (2008b). ISO 9001:2008 Quality management systems Requirements. Geneva :
International Organization for Standardization.
Jabnoun, N. (2001). Values underlying continuous improvement. The TQM
Magazine, 13(6), 381-388.
Jabnoun, N., and Al Khafaji, A. (2005). National Cultures for Quality Assurance and
Total Quality Management. Journal of Transnational Management, 10(3), 3-
17.
Jack, E. P., and Raturi, A. S. (2006). Lessons learned from methodological
triangulation in management research. Management Research News, 29(6),
345-357.
Jaeger, M., Adair, D., and Al-Qudah, S. (2013). MBNQA criteria used in the GCC
countries. The TQM Journal, 25(2), 110-123.
Jaitly, P., Mittal, V., Rao, P., and Kulkarni, M. (2008). Development of a lean
assessment system for the shop floor. Delhi: IIT.
James-Moore, S. M., and Gibbons, A. (1997). Is lean manufacture universally
relevant? An investigative methodology. International Journal of Operations
and Production Management, 17(9), 899-911.

400
Jick, T. D. (1979). Mixing Qualitative and Quantitative Methods: Triangulation in
Action. Administrative Science Quarterly, 24(4), 602-611.
Jocumsen, G. (2004). How do Small Business Managers Make Strategic Marketing
Decisions? A Model of Process. European Journal of Marketing, 38(5/6),
659-674.
Johansen, E., Porter, G., and Greenwood, D. (2004). Implementing Lean: UK culture
and systems change. Helsingo, Denmark.
Johnson, R. B., and Onwuegbuzie, A. J. (2004). Mixed methods research: A research
paradigm whose time has come. Educational Researcher, 33(7), 14-26.
Johnson, R. B., Onwuegbuzie, A. J., and Turner, L. A. (2007). Toward a Definition
of Mixed Methods Research. Journal of Mixed Methods Research, 1(2), 112-
133.
Jones , C., Medlen, N., Merlo, C., Robertson, M., and Shepherdson, J. (1999). The
Lean Enterprise. BT Technology Journal, 17(4), 15-22.
Jordan, J. A., and Michel, F. J. (2001). The Lean Company: Making the Right
Choices. Dearborn, MI: Society of Manufacturing Engineers.
Juran, J. A. (1989). Juran on Leadership for Quality. New York: Free Press.
Karim, A., and Arif-Uz-Zaman, K. (2013). A methodology for effective
implementation of lean strategies and its performance evaluation in
manufacturing organizations. Business Process Management Journal, 19(1),
69-196.
Karim, M. A., Aljuhani, M., Duplock, R., and Yarlagadda, P. (2011).
Implementation of Lean Manufacturing in Saudi Manufacturing
Organisations: An Empirical Study. Advanced Materials Research, 339, 250-
253.
Karlsson, C. H., and Ahlström, P. (1996). Assessing changes towards lean
production2. International Journal of Operations and Production
Management, 16(2), 24-41.

401
Karlsson, C., and Åhlström, P. (1997). A lean and global smaller firm?. International
Journal of Operations and Production Management, 17(10), 940-952.
Kilpatrick, J. (2003). Lean principles. Utah: Utah Manufacturing Extension
Partnership.
Kinninmont, J. (2012). Kuwait’s Parliament: An Experiment in Semi-democracy.
London: Chatham House.
Knuf, J. (2000). Benchmarking the lean enterprise: organizational learning at work.
Journal of Management in Engineering, 16(4), 58-71.
Krippendorff, K. (1980). Content analysis. An introduction to its methodology.
Newbury Park, CA: SAGE.
Kuhlang, P., Edtmayr, T., and Sihn, W. (2011). Methodical approach to increase
productivity and reduce lead time in assembly and production-logistic
processes . CIRP Journal of Manufacturing Science and Technology, 4(1),
24–32.
Kumar, M., and Antony, J. (2008). Comparing the quality management practices in
UK SMEs. Industrial Management and Data Systems, 108 (9), 1153-1166.
Kumar, M., Antony, J., and Douglas, A. (2009). Does size matter for Six Sigma
implementation?: Findings from the survey in UK SMEs. The TQM Journal,
21(6), 623-635.
Kumar, R. (1999). Research Methodology: A Step-By-Step Guide for Beginner.
London : SAGE.
Kumar, R. (2010). Research Methodology: A Step-by-Step Guide for Beginners (3rd
ed.). London : SAGE Publications Ltd.
Kundu, G., and Manohar, B. M. (2012). Critical Success Factors for Implementing
Lean Practices in It Support Services. International Journal for Quality
research, 6(4), 301-312.
Kunnanatt, J. T. (2007). Impact of ISO 9000 on organisational climate. International
Journal of Manpower, 28(2), 175-92.

402
Kuwait Times. (2007, November 14). TMC Net. Retrieved May 8, 2010, from
http://www.tmcnet.com/:
http://www.tmcnet.com/usubmit/2007/11/14/3095544.htm
Lacksonen, T., Rathinam, B., Pakdil, F., and Gülel, D. (2010). Cultural Issues in
Implementing Lean Production. In the proceedings of the Industrial
Engineering Research Conference (p. Abstract ID: 97). Cancun, Maxico: A.
Johnson and J. Miller, eds.
Lagrosen, Y., Chebl, R., and Tuesta, M. R. (2011). Organisational learning and Six
Sigma deployment readiness evaluation: a case study. International Journal
of Lean Six Sigma, 2(1), 23-40.
Lameei, A. (2005). Assessment of Organisation Readiness for TQM Implementation.
Iranian Journal for Public Health, 34(2), 58-63.
Lander, E., and Liker, J. K. (2007). The Toyota Production System and art: making
highly customized and creative products the Toyota way. International
Journal of Production Research, 45(16), 3681-3698.
Laureani, A., and Antony, J. (2012). Critical success factors for the effective
implementation of Lean Sigma: Results from an empirical study and agenda
for future research. International Journal of Lean Six Sigma, 3(4), 274-283.
Lean Aerospace Initiative. (2002). Lean Enterprise Value: Insights from MIT’s Lean
Aerospace Initiative. New York: Palgrave.
Lean Enterprise Institute. (2005). The lean survey. Cambridge, MA: Lean Enterprise
Institute (LEI).
Lean Enterprise Research Center. (1999). The 360 Lean Audit. Cardiff: Lean
Enterprise Research Center.
Lee, C. Y. (1997). JIT adoption by small manufacturers in Korea. Journal of Small
Business Management, 35(3), 98-107.
Lee, G. L., and Oakes, I. (1995). The 'pros' and 'cons' of total quality management
for smallerfirms in manufacturing: Some experiences down the supply chain.
Total Quality Management, 6(4), 413-426.

403
Lee, Q. (2004). Strategos. Retrieved May 20, 2009, from www.strategosinc.com:
www.strategosinc.com
Lee, T. S. (1999). The convergent and predictive validity of quality and productivity
practices in Hong Kong industry. Total Quality Management, 10(1), 73-84.
Lee, T. Y., Wong, W. K., and Yeung, K. W. (2011). Developing a readiness self-
assessment model (RSM) for Six Sigma for China enterprises. International
Journal of Quality and Reliability Management, 28(2), 169 -194.
Leedy, P., and Ormrod, J. (2001). Practical research: Planning and design (7th ed.).
Upper Saddle River, New Jersey: Merrill Prentice HalL.
Levinson, R. E. (1987). Problems in Managing a Family-Owned Business. In C. E.
Aronoff, and J. L. Ward (Eds.), Family Business Sourcebook (pp. 169-175).
Detroit: Omnigraphics, Inc.
Levinson, W., and Rerick, R. (2002). Lean Enterprise: A Synergistic Approach to
Minimizing Waste. Milwaukee, WI: ASQ Quality Press.
Levy, D. L. (1997). Lean production in an international supply chain. Sloan
Management Review, 94-102.
Lewis, W. G., Pun , K. F., and Lalla, T. (2006). Exploring soft versus hard factors
for TQM implementation in small and medium-sized enterprises.
International Journal of Productivity and Performance Management, 55(7),
539-554.
Lian, Y. H., and Van Landeghem, H. (2007). Analysing the effects of Lean
manufacturing using a value stream mapping-based simulation generator.
International Journal of Production Research, 45(13 ), 3037-3058.
Liker, J. (2004). The Toyota Way: 14 Management Principles from the World’s
Greatest Manufacturer . New York, NY: McGraw-Hill.
Liker, J. K. (1996). Becoming Lean. New York, NY: Free Press.
Liker, J. K. (2008). Toyota Culture: The Heart and Soul of the Toyota Way. New
York: McGraw-Hill.

404
Liker, J. K., and Hoseus, M. (2010). Human Resource Development in Toyota
Culture. International Journal of Human Resources Development and
Management, 10(1), 34-50.
Liker, J. K., and Meier, D. (2007). Toyota talent: Developing your people the Toyota
way. New York: McGraw-Hill.
Liker, J. K., and Wu, Y. C. (2000). Japanese automakers, US suppliers and supply-
chain superiority. Sloan Management Review, 42(1), 81-93.
Loosemore, M., and Al Muslmani, H. S. (1999). Construction Project Management
in the Persian Gulf: inter-cultural communication. International Journal of
Project Management, 17(2), 95-100.
Lopez-Claros, A. (2005). Leveraging Liquidity in the Arab World: Investing in
Entrepreneurship Arab World Competitiveness Report. New York: Palgrave
Macmillan.
Lubben, R. T. (1988). Just in Time Manufacturing. New York, NY: McGraw-Hill.
MacDuffie, J. P. (1995). Workers’ Roles inLean Production: The Implications for
Worker Representation. In S. Babson (Ed.), In Lean Work: Empowerment
and Exploitation in the Global Auto Industry (pp. 54-69). Detroit, MI: Wayne
State University.
Mack, L. (2010). The Philosophical Underpinnings of Educational Research.
Polyglossia, 19, 1-11.
Mady, T. M. (2008). The impact of plant size and type of industry on manufacturing
competitive priorities: An empirical investigation. Competitiveness Review:
An International Business Journal incorporating Journal of Global
Competitiveness, 18(4), 351-366.
Mady, T. M. (2009). Quality management practices: An empirical investigation of
associated constructs in two Kuwaiti industries. International Journal of
Quality and Reliability Management, 26(3), 214 -233.
Magd, H. (2006). An investigation of ISO 9000 adoption in Saudi Arabia.
Managerial Auditing Journal, 21(2), 132-147.

405
Malhotra, N. K., and Peterson, M. (2001). Marketing research in the new
millennium:Emerging issues and trends. Marketing Intelligence and
Planning, 19(4), 216-235.
Mallur, S. B., Hiregouder, N. L., and Sequeira, A. H. (2011). The relationship
between TQM Practices and Business Excellence in Small and Medium
Sized Manufacturing Enterprises of north Karnataka region. SDM IMD
Journal of Management, 2(1), 18-31.
Marksberry, P., Badurdeen, F., and Magin, M. A. (2011). An investigation of
Toyota's social-technical systems in production leveling. Journal of
Manufacturing Technology Management, 22(5), 604-620.
Marsh, C. (1988). Exploring Data: An Introduction to Data Analysis for Social
Scientists. Cambridge: Polity Press.
Martínez-Lorente, A. R., and Martínez-Costa, M. (2004). ISO 9000 and TQM:
substitutes or complementaries?: An empirical study in industrial companies.
International Journal of Quality and Reliability Management, 21(3), 260-
276.
Marvel, J. H., and Standridge, C. R. (2009). A simulation-enhanced lean design
process. Journal ofIndustrial Engineering and Management, 2(1), 90-113.
Maxcy, S. J. (2003). Pragmatic threads in mixed methods research in the social
sciences: The search for multiplemodes of inquiry and the end of the
philosophy of formalism. In A. Tashakkori , and C. Teddlie, Handbook of
mixed methods in social and behavioral research (pp. 51-90). Thousand
Oaks,CA: SAGE.
Maylor, H., and Blackmon, K. (2005). Researching Business and Management.
London: Palgrave MacMillan.
Mcadam, R. (1999). Life after ISO 9000: An analysis of the impact of ISO 9000 and
total quality management on small businesses in Northern Ireland. Total
Quality Management, 10(2), 229-241.

406
McDonald, T., Van Aken, E. M., and Rentes, A. F. (2002). Utilising simulation to
enhance value stream mapping: a manufacturing case application.
International Journal of Logistics: Research and Applications, 5(2), 213-232.
McMurray, D. (1999). Recent Trends in Middle Eastern Migration, Trafficking, and
Transiting: New Perspectives on Labor Migration. Middle East Report 221.
McTeer, M. M., and Dale, B. G. (1996). The attitude of small companies to the ISO
9000 series. In the proceedings of the Institute Mechanical Engineering Part
B. 201, pp. 397-403. Bath, UK: Journal of Engineering Manufacture.
Mefford, R. N. (2009). Increasing productivity in global firms: The CEO challenge.
Journal of International Management, 15(3), 262-272.
Mejabi, O. (2003). Framework for a Lean Manufacturing Planning System.
International Journal of Manufacturing Technology and Management, 5,
563-578.
Mellahi, K., and Eyuboglu , F. (2001). Critical factors for successful total quality
management implementation in Turkey: Evidence from the banking sector.
Total Quality Management, 12(6), 745-756.
Melton, T. (2005). The Benefits of Lean ManufacturingWhat Lean Thinking has to
Offer the Process Industries. Chemical engineering research and design,
83(6), 662–673.
Meredith, P. H., Ristroph, J. H., and Lee, J. (1991). Implementing JIT: The
dimensions of culture, management, and human resources. Technology
Management : the New International Language, 448-451.
Merriam, S. B. (1998). Qualitative research and case study applications in
education. San Francisco: Jossey-Bass.
Michael, J., and College, W. (1997). A Conceptual Framework for Aligning
Managerial Behaviors with Cultural Work Values. International Journal of
Commerce and Management, 7(3/4), 81-101.

407
Migiro, S. O., and Magangi, B. A. (2011). Mixed methods: A review of literature
and the future of the new research paradigm. African Journal of Business
Management, 5(10), 3757-3764.
Miltenburg, J. (2001). U-shaped production lines: a review of theory and practice.
International Journal of Production Economics, 70(3), 201-214.
Mittal, D., Singla, V., and Goyal, A. (2011). Comparison Of TQM Success Factors
In Northern India In Manufacturing And Service Industries: A Survey.
International Journal of Engineering Science and Technology , 2, 1368-
1377.
Mokhtar, S. S., and Yusof, R. Z. (2010). The influence of top management
commitment, process quality management and quality design on new product
performance: A case of Malaysian manufacturers. Total Quality Management
and Business Excellence, 21(3), 291-300.
Molina-Azorín, J. F. (2010). The use and added value of mixed methods
inmanagement research. Journal of Mixed Methods Research, 5(1), 7-24.
Monden, Y. (1981). How Toyota shortened supply lot production time, waiting
andconveyance time . Industrial Engineering, 13(9), 22-31.
Monden, Y. (1983). Toyota Production System. Norcross, GA: Industrial
Engineering and Management Press.
Monden, Y. (1998). Toyota Production System An Integrated Approach to Just-In-
Time (3rd ed.). Norcross, Georgia: Engineering and Management Press.
Monsef, S. M., Amoopour, M., and Azizi, A. (2012). Evaluation of Readiness for
Implementation of Total Quality Management (TQM) At Islamic Azad
University, Rasht. Journal of Basic and Applied Scientific Research, 2(6),
5836-5842.
Moreno-Luzon, M. D. (1993). Can total quality management make small firms
competitive. Total Quality Management, 4(2), 65-181.

408
Morgan, D. L. (1998). Practical strategies for combining qualitative and quantitative
methods: Applications to health research. Qualitative Health Research, 8,
362–376.
Morris, T., and Wood, S. (1991). Testing the survey method: continuity and change
in British industrial relations. Work Employment and Society, 5(2), 259-282.
Moser, L., and Santos, A. D. (2003). Exploring the Role of Visual Controls on
Mobile Cell Manufacturing: A Case Study on Drywall Technology. In the
proceedings of the 11th International Group for Lean Construction (IGLC)
Conference (pp. 418-426). Blacksburg, Virginia: IGLC.
Motwani, J. (2003). A business process change framework for examining lean
manufacturing: a case study. Industrial Management and Data System,
103(5), 339-346.
Mullins, L. J. (1999). Management and orgnisational behaviour. Harlow: Person
Education Ltd.
Nakajima, S. (1988). Introduction to TPM: Total Productive Maintenance. Madras,
India: Productivity Press.
Neelankavil, J. (2007). International Business Research (1st ed.). New York: M.E.
Sharpe.
Neuman, L. W. (1997). Social Research Methods: Qualitative Approaches (3rd ed.).
Needham Heights, USA: Allyn and Bacon.
New, S. J. (2007). Celebrating the enigma: the continuing puzzle of the Toyota
Production System. International Journal of Production Research,, 45(16),
3545-3554.
Ngowi, A. B. (2000). Impact of Culture on the Application of TQM in the
Construction Industry in Bostwana. International Journal of Quality and
Reliability Management, 17(4/5), 442-452.
Nordin, N., Deros, B. M., and Abdul Wab, D. (2012a). A framework for managing
change in lean manufacturing implementation. International Journal of
Services and Operations Management, 12(1), 101-117.

409
Nordin, N., Deros, B. M., Wahab, D. A., and Rahman, M. N. (2012b). A framework
for managing change in lean manufacturing implementation. Changes,
16(19), 858-864.
Nordin, N., Md Deros, B., and Abd Wahab, D. (2010). A Survey on Lean
Manufacturing Implementation in Malaysian Automotive Industry.
International Journal of Innovation, Management and Technology, 1(4 ),
374-380.
Northwest High Performance Enterprise. (2002). HPEC Assessment . Oregon:
Northwest High Performance Enterprise Consortium.
Obeidat, B. Y., Shanna, R. O., Masa'de, R., and Al-Jarrah, I. M. (2012). Toward
Better Understanding for Arabian Culture:Implications Based on Hofstede's
Cultural Model. European Journal of Social Sciences, 28(4), 512-522.
O'Connor, N. G. (1995). The Influence of Organizational Culture on the Usefiilness
of Budget Participation by Singaporean-Chinese Managers. Accounting,
Organizations and Society, 20(5), 383-403.
Ohno, T. (1988). The Toyota Production System: Beyond Large-Scale Production.
Portland, OR: Productivity Press.
Ohno, T., and Kumagai, T. (1980). Toyota Production System. In the proceedings of
the International Conference on Industrial Systems Engineering in
Developing Countries. Bangkok.
Oppenheim, A. N. (1992). Questionnaire Design, Interviewing and Attitude
Measurement (2nd ed.). London: Pinter Publications.
Oppenheim, B., Murman, E., and Secor, D. (2011). Lean Enablers for Systems
Engineering. Systems Engineering, 14(1), 29-55.
Oviatt, B., and McDougall, P. (1994). Toward a theory o finternational new venture.
Journal of International Business Studies, 25(1), 45-64.
Oxford Dictionaries. (2014). Oxford Dictionaries. Retrieved 1 16, 2014, from
http://www.oxforddictionaries.com:
http://www.oxforddictionaries.com/definition/english/expert
410
PAI. (2008). Industrial Guide: State of Kuwait. Kuwait: Public Authority for
Industry (PAI).
Paksoy, H. M., Paksoy, S., Marangoz, M., and Özçalic, M. (2011). TQM perception
in Turkey: A comparison of industries. African Journal of Business
Management, 5(8), 3188-3198.
Pallant, J. (2010). SPSS Survival Manual: A step by step guide to data analysis using
SPSS (4th ed.). Maidenhead: McGraw Hill.
Palys, T. (1997). Research decisions: Quantitative and qualitative perspectives.
Toronto:: Harcourt Brace and Company Canada Ltd.
Panizzolo, R. (1998). Applying the lessons learned from 27 lean manufacturers: The
relevance of relationships management. International Journal of Production
Economics, 55(3), 223-240.
Papadopoulou, T. C., and Ozbayrak, M. (2005). Leanness: experiences from the
journey to date. Journal of Manufacturing Technology Management, 16(7),
784-807.
Parasuraman, A., Grewal , D., and Krishnan, R. (2004). Marketing Research.
Boston: Houghton Mifflin Company.
Parker, L., and Price, R. (1994). Empowered managers and empowered workers: The
effects of managerial support and managerial perceived control on worker's
sense of control over decision-making. Human Relations, 47, 911-929.
Parks, C. M. (2002). Instill lean thinking. Industrial Management, 44(5), 14-19.
Patton, M. (2002). Qualitative research and evaluation methods (3rd ed.). Thousand
Oaks, CA: SAGE.
Patton, M. Q. (1990). Qualitative Evaluation and Research Methods. Newbury Park;
London: SAGE.
Pavnaskar, S. J., Gershenson, J. K., and Jambekar, A. B. (2003). Classification
scheme for lean manufacturing tools. International Journal Production
Research, 41(13), 3075-3090.

411
Peacock, R. W. (2004). Understanding Small Business: Practice, Theory and
Research. Adelaide: Scarman Publishing.
Peat, J., Mellis, C., Williams , K., and Xuan , W. (2002). Health Science Research: A
Handbook of Quantitative Methods. London: SAGE.
Pennathur, A., and Mital, A. (2003). Worker mobility and training in
advancedmanufacturing. International Journal ofIndustrial Ergonomics,
32(6), 363-388.
Perera , H. S., Perera, P. S., and Ravecndra, L. M. (2010). Factors affecting effective
lean implementation: a case study of a tyre manufacturing company in Sri
Lanka. In 16th Annual Symposium on Research and Industry (pp. 279-282).
Sri Lanka: Faculty of Engineering, University of Moratuwa.
Perry, C. (1998). Processes of a case study methodology for postgraduate research in
marketing. European Journal of Marketing,, 32(9/10), 785-802.
Peters, T. J., and Waterman, R. H. (1982). In search of excellence. New York:
Harper and Row.
Pettersen, J. (2009). Defining lean production: some conceptual and practical issues.
The TQM Journal, 21(2), 127-142.
Pheng, L. S., and Chuan, C. J. (2001). A study of the readiness of precasters for just-
in-time construction. Work Study, 50(4), 131-140.
Phillips, L. W., Chang, D., and Buzzell, R. D. (1983). Product quality, cost position
and business performance. Journal of Marketing, 47(2), 26-43.
Pino, R. (2008). TQM Practices in Manufacturing and Service Companies in Peru.
Journal of CENTRUM Cathedra, 1(2), 47-56.
Pojasek, R. P. (2003). Lean, Six Sigma, and the Systems Approach: Management
Initiatives for Process Improvement. Environmental Quality Management,
13(2), 85-92.

412
Polit, D. F., Beck, C. T., and Hungler, B. P. (2001). Essentials of Nursing Research:
Methods, Appraisal and Utilization (5th ed.). Philadelphia: Lippincott
Williams and Wilkins.
Poole, T., and Mazur, L. M. (2010). Assessing Readiness for Lean Change in
Emergency Department. In the proceedings of the Industrial Engineering
Research Conference. Cancun, Mexico: A. Johnson and J. Miller eds.
Poppendieck, M. (2002). Principles of Lean Thinking. USA: Poppendieck.LLC.
Powell, D., and Gran, E. (2012). Applying a BITESIZE lean change methodology to
intermodal terminal operations. In the proceedings of the POMS 23rd annual
conference. Chicago: Production and Operations Management Society
(POMS).
Prajogo, D. I. (2005). The comparative analysis of TQM practices and quality
performance between manufacturing and service firms. International Journal
of Service Industry Management, 16(3), 217-228.
Price, M. J., and Chen, E. E. (1993). Total quality management in a small high
technology company. California Management Review, 35(3), 96-117.
Psychogios, G. A., and Priporas, K. (2007). Understanding total quality management
in context: Qualitative research on managers' awareness of TQM aspects in
the Greek service industry. The Qualitative Report, 12(1), 40–66.
Puvanasvaran, P., Megat, H., Hong, T. S., and Razali, M. M. (2009). The roles of
communication process for an effective lean manufacturing implementation.
Journal of Industrial Engineering and Management, 2(1), 128-152.
Quazi, H. A., Hong, C., and Meng, C. (2002). Impact of ISO 9000 certification on
quality management practices: a comparative study. Total Quality
Management, 13(1), 53-67.
Radder, L., and Lynette, L. (2000). The readiness of selected South African
organisations to mass customise. The TQM Magazine, 12(4), 295-304.
Radeka, K. (2009). Extreme Toyota: Radical Contradictions that Drive Success at
the World's Best Manufacturer by Emi Osono, Norihiko Shimizu, and

413
Hirotaka Takeuchi. Journal of Product Innovation Management, 26, 356-
358.
Radnor, Z., Walley, P., Stephens, A., and Bucci, G. (2006). Evaluation of the Lean
Approach to Business Management and its Use in the Public Sector. Full
Report. Edinburgh: Scottish Executive.
Rahman, S. (2001). A comparative study of TQM practice and organizational
performance of SMEs with and without ISO 9000 certification. International
Journal of Quality and Reliability Management, 18(1), 35-49.
Rahman, S. (2010). Impact of lean strategy on operational performance: a study of
Thai manufacturing companies. Journal of Manufacturing Technology
Management, 21(7), 839-852.
Rallis, S. F., and Rossman, G. B. (2003). Mixed methods in evaluation contexts: A
pragmatic framework. In A. Tashakkori , and C. Teddlie, Handbook of mixed
methods in social and behavioral research (pp. 491-512). Thousand Oaks,
CA: SAGE.
Ralston, D. A., Holt, D. H., Terpstra, R. H., and Cheng, Y. K. (1997). The impact of
national culture and economic ideology on managerial work values: A study
of the United States, Russia, Japan, and China. Journal of International
Business Studies, 28, 177–207.
Rampurwala, A., and Marafi, N. (2011). Kuwait’s SMEs: Looking for a Champion.
Kuwait: Kuwait Financial Centre S.A.K. Markaz.
Ranchhod, A., and Zhou, F. (2001). Comparing respondents of e-mail and mail
surveys: understanding the implications of technology. Marketing
Intelligence and Planning, 19(4), 254-262.
Real, R., Pralus, M., Pillet, M., and Guizzi, L. (2007). A study of supporting
programs for small and medium enterprises: a first stage going to Lean. In the
proceedings of the Industrial Engineering and Engineering Management,
IEEE International Conference (pp. 515-519). Singapore: IEEE.

414
Reed, R., Lemak, D., and Montogomery, J. (1996). Beyond process: TQM content
and firm performance. Academy of Management Review, 21(1), 173-202.
Rehman, S., and Askari, H. (2010). How Islamic are Islamic countries?. Global
Economy Journal, 10(2).
Reid, R. S., and Adams, J. S. (2001). Human resource management – a survey of
practices within family and non-family firms. Journal of European Industrial
Training, 25(6), 310-320.
Remenyi, D. (1995). So You Want to Be an Academic Researcher in Business and
Management Studies. Henley-on-Thames: Henley Management College.
Ricondo, I., and Viles, E. (2005). Six Sigma and its link to TQM, BPR, lean and the
learning organisation. International Journal of Six Sigma and Competitive
Advantage, 1(3), 323-354.
Robert Abair Associates. (2002). Lean Checklist Self-Assessment. Shrewsbury:
Robert Abair Associates.
Robinson, R. B., and Pearce, J. A. (1984). Research Thrusts in Small Firm Strategic
Planning. Academy of Management, 9(1), 128-137.
Robson, C. (1993). Real World Research: A Resource for Social Scientists and
Practitioner-Researchers. Oxford: Blackwell.
Robson, C. (2002). Real World Research (2nd ed.). Oxford: Blackwell.
Rose, A., Deros, B., Rahman, M., and Nordin, N. (2011). Lean manufacturing best
practices in SMEs. In the proceedings of the International Conference on
Industrial Engineering and Operations Management (pp. 22-24). Kuala
Lumpur, Malaysia: IEOM Research Solutions Pty Ltd.
Rother, M., and Harris, R. (2001). Creating Continuous Flow : An Action Guide for
Managers, Engineering, and Production Associates. Brookline, MA: Lean
Enterprise Institute.
Runeson , P., and Höst , M. (2009). Guidelines for conducting and reporting case
study research in software engineering. Empir Softw Eng, 14(2), 131-164.

415
Sadeghian, M. R. (2010). A Study of the Significance of Organisational Culture for
the Successful Implementation and Operation of Total Quality Management
(TQM): A Comparative Study between Iran and the UK (Doctoral thesis).
West Yorkshire, UK: University of Huddersfield.
Salaheldin, S. I. (2005). JIT implementation in Egyptian manufacturing firms: some
empirical evidence. International Journal of Operations and Production
Management, 25(4), 354-370.
Salaheldin, S. I. (2009). Critical success factors for TQM implementation and their
impact on performance of SMEs. International Journal of Productivity and
Performance Management, 58(3), 215-237.
Sale, J. E., Lohfeld, L. H., and Brazil, K. (2002). Revisiting thequantitative-
qualitative debate: Implications for mixedmethods research. Quality and
Quantity, 36, 45–53.
Saleeshya, P. G., Austin, D., and Vamsi, N. (2013). A model to assess the lean
capabilities of automotive industries. International Journal of Productivity
and Quality Management, 11(2), 195-211.
Sánchez, A. M., and Pérez, M. P. (2001). Lean indicators and manufacturing
strategies. International Journal of Operations and Production Management,
21(11), 1433-1452.
Sarantakos, S. (1998). Social Research (2nd ed.). Melbourne, Australia: Macmillan .
Saunders, M., Lewis, P., and Thornhill, A. (2009). Research methods for business
students (5th ed.). Harlow: Pearson Education Limited.
Saurin, T. A., Marodin, G. A., and Ribeiro, J. L. (2011). A framework for assessing
the use of lean production practices in manufacturing cells. International
Journal of Production Research, 49(11), 3211-3230.
Schein, E. H. (1992). Organizational Culture and Leadership (Second ed.). San
Francisco: Jossey-Bass .
Schein, E. H. (2004). Organizational Culture and Leadership (3rd ed.). San
Francisco: Jossey-Bass.

416
Scherrer-Rathje, M., Boyle, T. A., and Deflorin, P. (2009). Lean, take two!
Reflections from the second attempt at lean implementation. Business
Horizons, 52(1), 79-88.
Schollhammer, H., and Kuriloff, A. H. (1979). Entrepreneurship and Small Business
Management. Hoboken, N.J: John Wiley and Sons Inc.
Schonberger, R. (2007). Japanese production management. Journal of Operations
Management, 25(2), 403-419.
Schulze, S. (2003). Views on the combination of quantitative and qualitative
research approaches. Progressio, 25(2), 8-20.
Schutte, N., Toppinnen, S., Kalimo, R., and Schaufeli, W. (2000). The factorial
validity of the Maslach Burnout Inventory–General Survey across
occupational groups and nations. Journal of Occupational and
Organizational Psychology, 73, 53-66.
Sekaran , U., and Bougie, R. (2010). Research Methods forBusiness: A Skill Building
Approach. UK: John Wiley and Sons.
Shah, N. (2007). Migration to Kuwait: Trends, Patterns and Policies. Migration and
Refugee Movements in the Middle East and North Africa (pp. 2-19). Cairo:
American University.
Shah, R., and Ward, P. T. (2003). Lean manufacturing: context, practice bundles and
performance. Journal of Operations Management, 21, 129-49.
Shah, R., and Ward, P. T. (2007). Defining and developing measures of lean
production. Journal of operations management, 25(4), 785-805.
Shahram, T. (2008). Lean manufacturing performance in China: assessment of 65
manufacturing plants. Journal of Manufacturing Technology Management,
19(2), 217-234.
Shammas, A. (2012). Industries migration from Kuwait: reasons and solution .
Kuwait : Kuwait Chamber of Commerce and Industry.

417
Sharma, S. K., Gupta, R. D., Kumar, A., and Singh, B. (2011). Supplier Issues for
Lean Implementation. International Journal of Engineering Science, 3900-
3905.
Sharma, U. (2009). Qualitative Research in Business and Management. Qualitative
Research in Accounting and Management, 6(4), 292-296.
Shrader, C. B., Mulford, C. L., and Blackburn, V. L. (1989). Strategic and
Operational Planning, Uncertainty and Performance in Small Firms. Journal
of Small Business Management, 27(4), 45-60.
Sim, K. L., and Rogers, J. W. (2008). Implementing lean production systems:
barriers to change. Management Research News, 32(1), 37-49.
Smalley, A. (2004). Creating Level Pull: A Lean Production-System Improvement
Guide for Production-Control, Operations, and Engineering Professionals
(Lean Tool Kit). Cambridge, MA: Lean Enterprises Institute Inc.
Smith, H. W. (1975). Strategies of Social Research: The Methodological
Imagination. Englewood Cliffs, NJ: Prentice Hall.
Snee, R. D. (2010). Lean Six Sigma – getting better all the time. International
Journal of Lean Six Sigma, 1(1), 9-29.
Sohail, M. S., and Hoong, T. B. (2003). TQM practices and organizational
performances of SMEs in Malaysia: Some empirical observations.
Benchmarking: An International Journal, 10(1), 37-53.
Sohal, A. S., and Egglestone, A. (1994). Lean production: Experience among
Ausralian orgnizations. International Journal of Operations and Production
Management, 14(11), 35-51.
Soriano-Meier, H., and Forrester, P. (2002). A model for evaluating the degree of
leanness of manufacturing firms. Integrated Manufacturing Systems, 13(2),
104-109.
Spann, M. S., Adams, M., Rahman, M., Czarnecki, H., and Schroer, B. (1999).
Transferring Lean Manufacturing to Small Manufacturers:The Role of NIST-
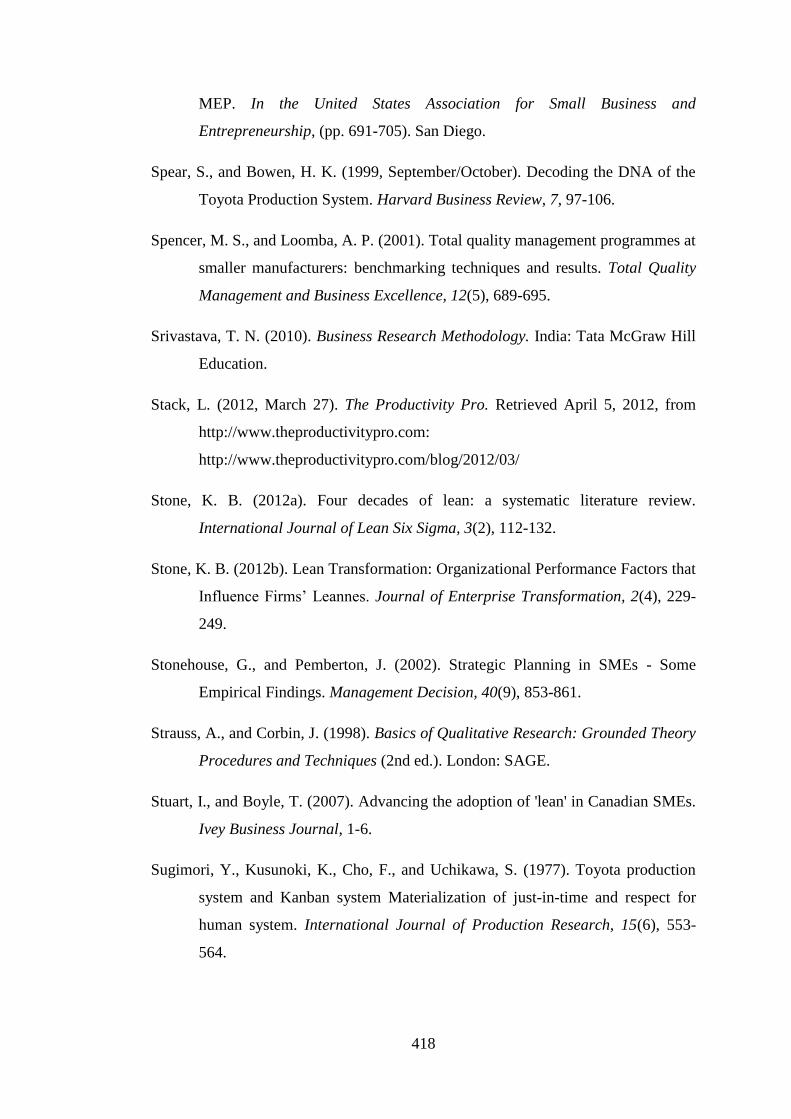
418
MEP. In the United States Association for Small Business and
Entrepreneurship, (pp. 691-705). San Diego.
Spear, S., and Bowen, H. K. (1999, September/October). Decoding the DNA of the
Toyota Production System. Harvard Business Review, 7, 97-106.
Spencer, M. S., and Loomba, A. P. (2001). Total quality management programmes at
smaller manufacturers: benchmarking techniques and results. Total Quality
Management and Business Excellence, 12(5), 689-695.
Srivastava, T. N. (2010). Business Research Methodology. India: Tata McGraw Hill
Education.
Stack, L. (2012, March 27). The Productivity Pro. Retrieved April 5, 2012, from
http://www.theproductivitypro.com:
http://www.theproductivitypro.com/blog/2012/03/
Stone, K. B. (2012a). Four decades of lean: a systematic literature review.
International Journal of Lean Six Sigma, 3(2), 112-132.
Stone, K. B. (2012b). Lean Transformation: Organizational Performance Factors that
Influence Firms’ Leannes. Journal of Enterprise Transformation, 2(4), 229-
249.
Stonehouse, G., and Pemberton, J. (2002). Strategic Planning in SMEs - Some
Empirical Findings. Management Decision, 40(9), 853-861.
Strauss, A., and Corbin, J. (1998). Basics of Qualitative Research: Grounded Theory
Procedures and Techniques (2nd ed.). London: SAGE.
Stuart, I., and Boyle, T. (2007). Advancing the adoption of 'lean' in Canadian SMEs.
Ivey Business Journal, 1-6.
Sugimori, Y., Kusunoki, K., Cho, F., and Uchikawa, S. (1977). Toyota production
system and Kanban system Materialization of just-in-time and respect for
human system. International Journal of Production Research, 15(6), 553-
564.

419
Sun, H. (2000). Total quality management, ISO 9000 certification and performance
improvement. International Journal of Quality and Reliability Management,
17(2), 168-179.
Sun, S. (2011). The strategic role of lean production in SOE’s development.
International Journal of Business and Management, 6(2), 160-168.
Suter, W. N. (2006). Introduction to educational research: A critical think-ing
approach. Thousand Oaks, CA: SAGE.
Swanson, R. A., and Holton, E. F. (2005). Research in organizations: Foundations
and methods of inquiry. San Francisco: Berrett–Koehler.
Swe, V., and Kleiner, B. H. (1998). Managing and changing mistrustful culture.
Industrial and Commercial Training, 30(2), 66 - 70.
Switzerland Global Enterprise. (2012). Kuwait Economic Report. Zürich:
Switzerland Global Enterprise.
Sykes , W., and Collins, M. (1988). Effect of mode of interview: experiments in the
UK. In R. Groves , P. Biemer , and L. Lyberg , In Telephone survey
methodology. New York: John Wiley and Sons.
Taj, S. (2005). Applying lean assessment tools in Chinese hi-tech industries.
Management Decision, 43(4), 628-643.
Takeuchi, H., Osono, E., and Shimiz, N. (2008). The Contradictions That Drive
Toyota’s Success. Harvard Business Review, 96-104.
Taleghani, M. (2010). Success and Failure Issues to Lead Lean Manufacturing
Implementation. World Academy of Science, Engineering and Technology,
615-618.
Talib, F., Rahman, Z., and Qureshi, M. N. (2011). Analysis of Total Quality
Management Practices in Manufacturing and Service Sectors . International
Journal of the Computer, the Internet and Management, 19, 1-8.
Tannock, J., and Ahmed, K. S. (2008). Quality Management in the Arabic-Speaking
Countries. Journal of Transnational Management, 13(2), 174-194.

420
Tashakkori, A., and Teddlie, C. (1998). Mixed Methodology: Combining Qualitative
and Quantitative Approaches. Thousand Oaks, CA: SAGE.
Tashakkori, A., and Teddlie, C. (2003). Handbook of mixed methods in social and
behavioral research. Thousand Oaks, CA: SAGE.
Temtime, Z. T., and Solomon, G. H. (2002). Total quality management and the
planning behavior of SMEs in developing economies. The TQM Magazine,
14(3), 181-191.
Tezel, A., Koskela, L., and Tzortzopoulos, P. (2009). The Functions of Visual
Management. In the proceedings of the International Research Symposium
(pp. 201-219). Salford, UK: University of Salford.
Thompson, M. (2000). The UK Aerospace People Management. London:
Department of Trade and Industry and Society of British Aerospace
Companies.
Toyota. (2005). Environmental and Social Report: Relations with Employees.
Tokyo, Japan: Toyota Motor Corporation.
Treleven, M. (1987). Single sourcing: a management tool for the quality supplier.
Journal of Purchasing and Materials Management, 23(1), 19-24.
Tsang, J., and Antony, J. (2001). Total Quality Management in UK service
organizations: some key findings from a survey. Managing Service Quality,
11(2), 132-141.
Upadhye, N., Deshmukh, S. G., and Garg, S. (2010a). Lean manufacturing system
for medium size manufacturing enterprises an Indian case. International
Journal of Management Science and Engineering Management,, 5(5), 362-
375.
Upadhye, N., Deshmukh, S. G., and Suresh, G. (2010b). Lean manufacturing for
sustainable development. Global Business and Management Research: An
International Journal, 2(1), 125-137.
Vaghefi, M. R., Woods, L. A., and Huellmantel, A. (2000). Toyota story 2: Still
winning the productivity game. Business Strategy Review, 11(1), 59-70.

421
Van Oudenhoven, J. P. (2001). Do organizations reflect national cultures? A 10-
nation study. International Journal of Intercultural Relations, 25, (1), 89-
107.
van Teijlingen, E. R., and Hundley, V. (2001). The Importance of Pilot Studies.
Social Research Update(35), 1-4. Retrieved from
http://sru.soc.surrey.ac.uk/SRU35.html
Vanichchinchai, A. (2012). The relationship between employee involvement,
partnership management and supply performance: Findings from a
developing country. International Journal of Productivity and Performance
Management, 61(2), 157-172.
Venter, E., Boshoff, C., and Maas, G. (2005). The influence of successor-related
factors on the succession process in small and medium-sized family
businesses. Family Business Review, 18, 283–303.
Vermaak, T. D. (2010). Critical success factors for the implementation of lean
thinking in South African manufacturing organisations (Doctoral thesis).
Department of Business Management. Johannesburg: University of
Johannesburg.
Vidich, A. J., and Shapiro, G. (1995). A comparison of participant observation and
survey data. American Sociological Review, 20, 28-33.
Vincent, R., and Reza, K. (2004). Integrating Total Quality Management and
Knowledge Management. Journal of Management Systems, 16(1), 39-54.
Vinodh, S., and Balaji, S. (2011). Fuzzy logic based leanness assessment and its
decision support system. International Journal of Production Research, 49,
40-67.
Vogel, E. (1971). Perspective on Japan. Science (new series), 172(3984), 667-668.
Voss, C., Tsikriktsis, N., and Frohlich, M. (2002). Case research in operations
management. International Journal of Operations and Production
Management, 22(2), 195 -219.

422
Wan, H.-d. (2006). Measuring Leanness of Manufacturing Systems and Identifying
Leanness Target by Considering Agility (Doctoral thesis). Blacksburg, VA:
Industrial and Systems Engineering, Virginia Polytechnic Institute and State
University.
Wan, H.-d., Chen, F. F., and Rivera, L. (2007). Leanness score of value stream maps.
In the proceedings of the Industrial Engineering Research Conference (pp.
1515-1520). Nashville, TN: G. Bayraksan, W. Lin, Y. Son, and R. Wysk,
eds.
Wang, C., Walker, E. A., and Redmond, J. (2007). Explaining the Lack of Strategic
Planning in SMEs: The Importance of Owner Motivation. International
Journal of Organisational Behaviour, 12(1), 1-16.
Ward, J. L. (1988). The Special Role of Strategic Planning for Family Businesses.
Family Business Review, 1(2), 105-117.
Weeks, B., Helms , M. M., and Ettkin , L. P. (1995a). A physical examination of
health care's readiness for a total quality management program: a case study.
Hosp Mater Manage Q, 17, 68–74.
Weeks, B., Helms, M. M., and Ettkin, L. P. (1995b). Is your organization ready for
TQM? An assessment methodology. The TQM Magazine,, 7(5), 43-49.
Weick, K. E. (1979). The Social Psychology of Organizing . New York, NY:
McGraw-Hill.
Welsh , D., and Raven, P. (2004). An exploratory study of SME management in the
Middle. International Journal of Entrepreneurship and Small Business, 1,
121-135.
Welsh, D., and Raven, P. (2006). Family Business in the Middle East: An
Eexploratory Study of Retail Management in Kuwait and Lebanon. Family
Business Review, 19(1), 29-48.
White, R. E., Pearson, J. N., and Wilson, J. R. (1999). JIT Manufacturing: a survey
of implementation in small and large US manufacturers. Management
Science, 45(1), 1-15.

423
Wickramasinghe, D., and Wickramasinghe, V. M. (2012). Effects of perceived
organizational support on participation in decision making, affective
commitment and job satisfaction in lean production in Sri Lanka. Journal of
Manufacturing Technology Management, 23(2), 157-177.
Williams, C. (2007). Research Methods. Journal of Business and Economic
Research, 5(3), 65-71.
Wilson, L. (2009). How To Implement Lean Manufacturing. New York: McGraw-
Hill Professional.
Wisconsin Manufacturing Extension Partnership. (2001). How Lean is Your
Culture? . Madison: Wisconsin Manufacturing Extension Partnership.
Wisconsin Manufacturing Extension Partnership. (2002). Lean Business Assessment.
Madison: Wisconsin Manufacturing Extension Partnership.
Woehrle, S. L., and Abou-Shady, L. (2010). Using dynamic value stream mapping
and lean accounting box scores to support lean implementation. American Journal of
Business Education, 3(8 ), 67-76.
Womack, J. P., and Jones, D. T. (1996). Lean Thinking. New York, NY: Simon and
Schuster.
Womack, J., and Jones, D. (2003). Lean thinking: Banish waste and create wealth in
your corporation (2nd ed.). New York: Free Press.
Womack, J., and Jones, D. (2005). Lean Solutions: How Companies and Customers
Can Create Value and Wealth Together. Brookline, USA: Lean Enterprise
Institute.
Womack, J., Jones, D. T., and Roos, D. (1990). The Machine That Changed the
World . New York, NY: Rawson Associates.
Womack, J., Jones, D., and Roos, D. (2007). The Machine That Changed the World.
London: Simon and Schuster Ltd.

424
Wong, M. (2007). The role of culture in implementing lean production. In
Intemational Federation for Information Processing (IFIP). 246, pp. 413-
422. Boston: Olhager and F. Persson, Eds.
Wong, Y. C., Wong, K. Y., and Ali, A. (2009). A Study on Lean Manufacturing
Implementation in the Malaysian Electrical and Electronics Industry.
European Journal of Scientific Research, 38(4), 521-535.
Woon, K. C. (2000). TQM implementation: comparing Singapore's service and
manufacturing leaders. Managing Service Quality, 10(5), 318-31.
World Bank. (2013). Doing Business 2013: Smarter Regulations for Small and
Medium-Size Enterprises . Washington, DC: The World Bank.
Worley, J. M., and Doolen, T. L. (2006). The role of communication and
management support in a lean manufacturing implementation. Management
Decision, 44(2), 228-245.
Wu, Y. C. (2003). Lean manufacturing: a perspective of lean suppliers. International
Journal of Operations and Production Management, 23(11), 1349-1376.
Yamamoto, Y., and Bellgran, M. (2010). Fundamental mindset that drives
improvements towards lean production. Assembly Automation, 30(2), 124-
130.
Yang, A. P., and Yu Yu, B. (2010). The barriers to SMEs’ implementation of lean
production and countermeasures based on SMS in Wenzhou. International
Journal of Innovation, Management and Technology, 1(2), 220-225.
Yates, L. (2004). What does good education research look like? Berkshire, UK:
Open University Press.
Yauch, C., and Steudel, H. (2003). Complementary Use of Qualitative and
Quantitative Cultural Assessment Methods. Organizational Research
Methods, 6(4), 465-481.
Yin, R. K. (2003). Case Study Research: Design and Methods (3rd ed.). London:
SAGE.

425
Yong, J., and Wilkinson, A. (2001). In search of quality: the quality management
experience in Singapore. International Journal of Quality and Reliability
Management, 18(8), 813-835.
Yoshiaki, T., Hayashi, M., and Hidaka, K. (2000). International Transfer of
Management Style, . Tokyo: Chuuo University Press.
Yoshimori, M. (2005). Does Corporate Governance Matter? Why the Corporate
Performance of Toyota and Canon is Superior to GM and Xerox. Corporate
Governance: An International Review, 13(3), 447-457.
Young, D. (2000). The Six Levers for Managing Organizational Culture. Business
Horizons, 43(5), 19–28.
Youssef, M. A., and Zairi, M. (1995). Benchmarking critical factors for TQM: part II
– empirical results from different regions in the world. Benchmarking for
Quality Management and Technology, 2(2), 3-19.
Yusof, S. R., and Aspinwall, E. (1999). Critical success factors for total quality
management implementation in small and medium enterprises. Total Quality
Management, 10(4-5), 803-809.
Zairi, M. (1996). Economic development and global competitiveness: Why should
Arab managers take note of total quality management?. In the proceedings of
the Fourth Arab Management Conference (pp. 408-423). Bradford, UK:
University of Bradford.
Zakua, N., Muniand, S., Mat Saman, M., Md Ariff, M., Sulaima, S., and Abd Jali, R.
(2012). Critical Success Factors of Total Quality
ManagementImplementation In Higher Education Institution: A Review.
International Journal of Academic Research in Business and Social Sciences,
2(12), 19-32.
Zayko, M. J., Broughman, D. J., and Hancock, W. M. (1997). Lean manufacturing
yields world-class improvements for small manufacturer. IIE Solution, 29(4),
36-40.

426
Zhang, Q., Abbas , J., Zhu, X., and Shah , M. (2012). Critical success factors for
successful lean six sigma implementation in Pakistan. Interdisciplinary
journal of contemporary research in business, 4(1), 117-124.
Zhang, Z., Waszink, A., and Wijngaard, J. (2000). An instrument for measuring
TQM implementation for Chinese manufacturing companies. International
Journal of Quality and Reliability Management, 17(7), 730-755.
Zhao, x., Yeung, a., and Lee, T. (2004). Quality management and organizational
context in selected service industries of China. Journal of Operations
Management, 22(6), 575-587.
Zhou, B. (2012). Lean principles, practices, and impacts: a study on small and
medium-sized enterprises. Annals of Operations Research, 1-18.
Zikmund, W. G., Babin, B. J., Carr , J., and Griffin , M. (2012). Business Research
Methods (9th ed.). Mason, USA: South-Western College.
Zu, X., Robbins, T. L., and Fredendall, L. D. (2010). Mapping the critical links
between organizational culture and TQM/Six Sigma practices. International
Journal of Production Economics, 123(1), 86-106.

427
Appendix-A Questionnaire items
Practices Item
No.
Category Main source
Process
5s PR01 The workshop is divided into different workplaces and each zone has
a specific task.
6,12,14,16,18,22
Cellular
manufacturing
PR02 The processes used within similar operations are placed close to each
other in order to eliminate unnecessary steps.
6,12,14,16,18,22,46
Skilled people PR03 Each working zone is controlled and operated by qualified and well-
trained workers.
12,14,16,18
5s PR04 Each item/piece of equipment is labelled to ensure it is located in the
right zone/location in the workplace.
6,12,14,16,18
Pull PR05 Production at each station is pulled by demand from the next station. 12,16,18
5s and
Standardization
PR06 A certain person is assigned as a part of his daily activities to ensure
that the workplace is clean and all tools/pieces of equipment are put
back in their appropriate places.
12,13,14,16,19
TPM PR07 Equipment maintenance records are posted on the shop floor to be
actively shared with employees.
18,22,47
Cellular
manufacturing
PR08 The process flow of material and components is smooth and
continuous, as the equipment is grouped.
6,12,14,16,18,22,46
Pull PR09 Products are not produced unless orders for them are received from
customers.
12,16,18
TPM PR10 Machine operators and staff are engaged in the scheduled 4,13,16,19,46
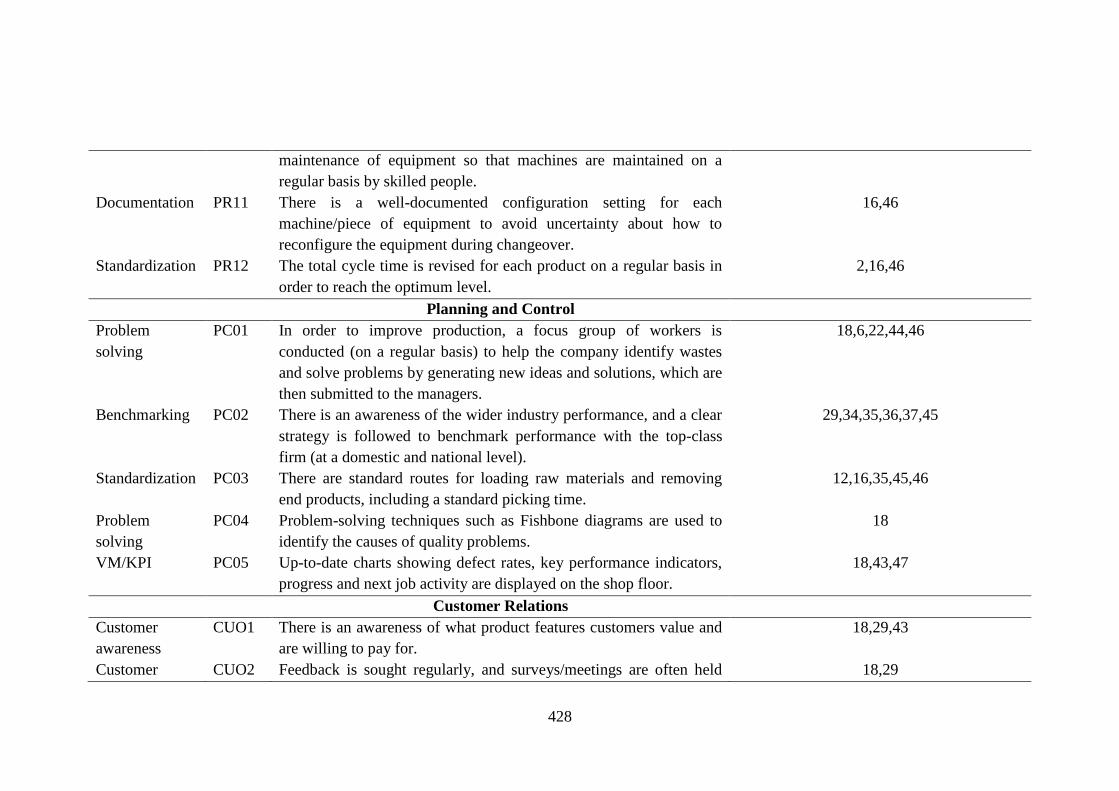
428
maintenance of equipment so that machines are maintained on a
regular basis by skilled people.
Documentation PR11 There is a well-documented configuration setting for each
machine/piece of equipment to avoid uncertainty about how to
reconfigure the equipment during changeover.
16,46
Standardization PR12 The total cycle time is revised for each product on a regular basis in
order to reach the optimum level.
2,16,46
Planning and Control
Problem
solving
PC01 In order to improve production, a focus group of workers is
conducted (on a regular basis) to help the company identify wastes
and solve problems by generating new ideas and solutions, which are
then submitted to the managers.
18,6,22,44,46
Benchmarking PC02 There is an awareness of the wider industry performance, and a clear
strategy is followed to benchmark performance with the top-class
firm (at a domestic and national level).
29,34,35,36,37,45
Standardization PC03 There are standard routes for loading raw materials and removing
end products, including a standard picking time.
12,16,35,45,46
Problem
solving
PC04 Problem-solving techniques such as Fishbone diagrams are used to
identify the causes of quality problems.
18
VM/KPI PC05 Up-to-date charts showing defect rates, key performance indicators,
progress and next job activity are displayed on the shop floor.
18,43,47
Customer Relations
Customer
awareness
CUO1 There is an awareness of what product features customers value and
are willing to pay for.
18,29,43
Customer CUO2 Feedback is sought regularly, and surveys/meetings are often held 18,29

429
feedback with customers to improve product design and quality, and service.
Customer
involvement
CUO3 Customers participate in the initial design process. 18,22,43
Customer
relationship
CUO4 Valued customers are brought in to visit the plant in order to give
them some ideas about quality control that the company can follow.
7,43
Customer
involvement
CUO5 Customers help the company by providing information about their
future demands.
18,43
Customer
involvement
CUO6 There is a system in place for collecting customer complaints so that
problems can be avoided in the future.
18
Supplier Relations
Quality
suppliers
SU01 A clear strategy is in place by which to evaluate supplier
performance in terms of quality, delivery and prices.
18,22,29,48,49
Close suppliers SU02 Local suppliers are used to avoid shipment delays. 3,18,50
Supplier
involvement
SU03 Suppliers are aware of product designs and participate heavily during
design and development.
18,22,49
Quality
suppliers
SU04 Raw materials and purchased parts are not subject to incoming
inspection as they come from qualified suppliers.
20,29,48,49
No. of suppliers SU05 Active steps are taken to reduce the number of suppliers in each
category.
18,51,52,53
Quality
suppliers
SU06 Raw materials are received on time from the date of order. 7,20,48,49,50
Supplier
relation
SU07 Suppliers are cooperative and committed to maintaining a long-term
relationship.
7,17,18,20,23,48,49
Feedback to
suppliers
SU08 Suppliers are provided with feedback regarding quality and delivery
performance.
18
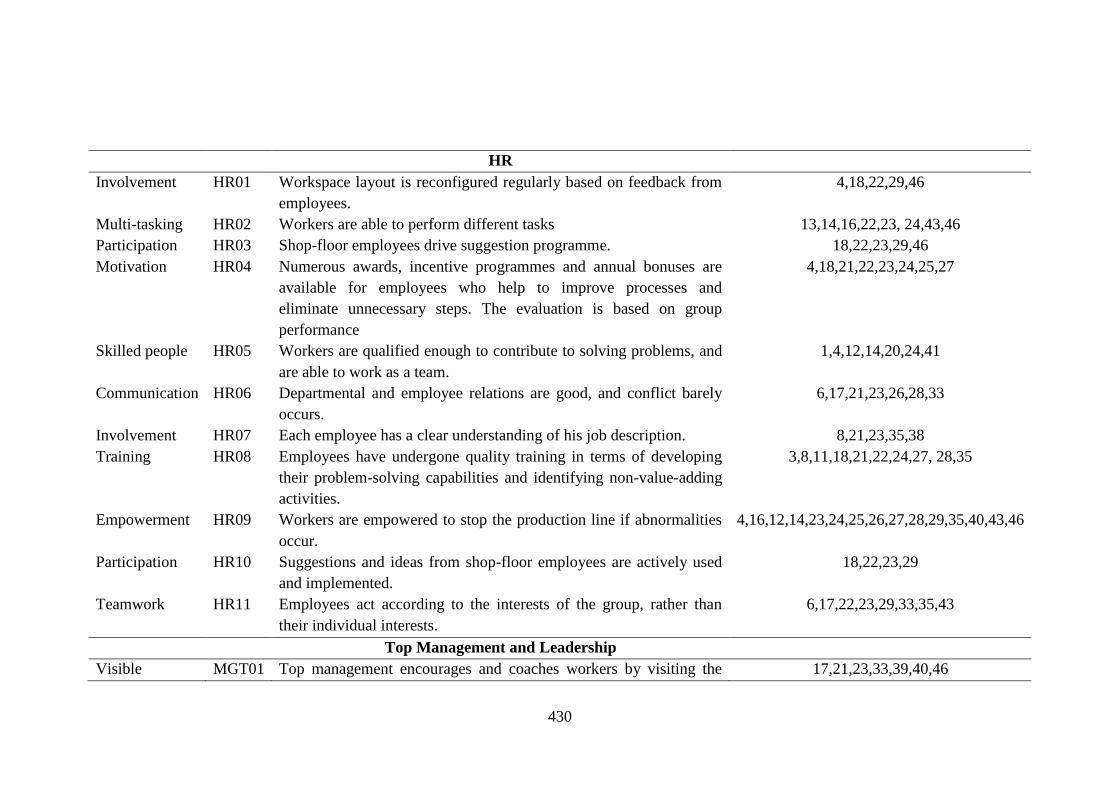
430
HR
Involvement HR01 Workspace layout is reconfigured regularly based on feedback from
employees.
4,18,22,29,46
Multi-tasking HR02 Workers are able to perform different tasks 13,14,16,22,23, 24,43,46
Participation HR03 Shop-floor employees drive suggestion programme. 18,22,23,29,46
Motivation HR04 Numerous awards, incentive programmes and annual bonuses are
available for employees who help to improve processes and
eliminate unnecessary steps. The evaluation is based on group
performance
4,18,21,22,23,24,25,27
Skilled people HR05 Workers are qualified enough to contribute to solving problems, and
are able to work as a team.
1,4,12,14,20,24,41
Communication HR06 Departmental and employee relations are good, and conflict barely
occurs.
6,17,21,23,26,28,33
Involvement HR07 Each employee has a clear understanding of his job description. 8,21,23,35,38
Training HR08 Employees have undergone quality training in terms of developing
their problem-solving capabilities and identifying non-value-adding
activities.
3,8,11,18,21,22,24,27, 28,35
Empowerment HR09 Workers are empowered to stop the production line if abnormalities
occur.
4,16,12,14,23,24,25,26,27,28,29,35,40,43,46
Participation HR10 Suggestions and ideas from shop-floor employees are actively used
and implemented.
18,22,23,29
Teamwork HR11 Employees act according to the interests of the group, rather than
their individual interests.
6,17,22,23,29,33,35,43
Top Management and Leadership
Visible MGT01 Top management encourages and coaches workers by visiting the 17,21,23,33,39,40,46

431
management workplace on a regular basis.
Knowing
people’s
capabilities
MGT02 We locate our worker where they can use their skills, qualifications
and experience.
1,11,46
Job security MGT03 People have job security and workers are regularly promoted to
managerial positions.
9,15,54
Commitment to
improvement
MGT04 Company invests in training programmes and encourages cross-job
training.
3,8,9,17,23,27,28,33,35
Commitment to
improvement
MGT05 Company uses external experts/consultants on a regular basis to
evaluate the overall company performance and to improve
production and quality level.
1,7,5,10,11,23,32
Note: [1] Achanga et al. (2006); [2] Almström and Kinnander (2011); [3] Bhasin (2011); [4] Black (2007); [5] Boughton and Arokiam (2000);
[6] Furlan et al. (2011); [7] Golicic and Medland (2007); [8] Ichimura et al. (2007); [9] Ichimura et al. (2006); [10] Inman and Mehra (1990);
[11] Kundu and Manohar (2012); [12] Liker (2004); [13] Miltenburg (2001); [14] Monden (1998); [15] Radeka (2009); [16] Saurin et al. (2011);
[17] Scherrer-Rathje et al. 2009); [18] Shah and Ward (2007); [19] Spear and Bowen (1999); [20] Vanichchinchai (2012); [21] Ghobadian and
Gallear (1997); [22] Nordin et al. (2010); [23] Nordin et al. (2012); [24] Dahlgaard and Dahlgaard-Park (2006); [25] Balle (2005); [26]
Papadopoulou and Ozbayrak (2005); [27] Puvanasvaran et al. (2009); [28] Sim and Rogers (2008); [29] Salaheldin (2009); [30] Panizzolo
(1998); [31] Antony et al. (2008); [32] Real et al. (2007); [33] Worley and Doolen (2006); [34] Gurumurthy and Kodali (2009); [35] Knuf
(2000); [36] Hines et al. (1999); [37] Spencer and Loomba (2001); [38] New (2007); [39] MacDuffie (1995); [40] Takeuchi et al. (2008); [41]
Yamamoto and Bellgran (2010); [42] Lema and Price (1995); [43] Radnor et al. (2006); [44] Yoshimori (2005); [45] Smalley (2004); [46] Forza
(1996); [47] Moser and Dos Santos (2003); [48] Burman (1995); [49] Sharma et al. (2011); [50] Levy (1997); [51] Barla (2003); [52] Cooper
and Slagmulder (1999); [53] Lubben (1988); [54] Toyota (2005).

432
Appendix-B Survey questionnaire
Part 1: Company Background Information
Company Age (Years)
<3 3-5 5-10 > 10
Type Of Product Produced
Paper, Paper Product and Printing Metal Product Machinery and
Equipment Activity
Chemical, Petroleum Product, Coal,
Rubber and Plastic Activity
Non Metallic Minerals
Food Other (Please Specify)
Legal Structure Of Company
Shareholding Limited Liability
Ownership Structure
Family Owned Non-Family Owned
Company Size
Small (Fewer Than 35 Employees/
Capital 150,000kd Or Less)
Medium (36-70 Employees Or
Capital Between 150,000-500,000kd)
Are You Iso900 Certified Company
Yes No
Number Of Suppliers
<3 3-5
> 5
Are You Aware About Lean System
Yes No
Which Of The Following Quality Practises Your Are Currently Adopting (You
Can Choose More Than One)
Quality Circle Visual Management Bench Marking
5s Other (Please Specify) None
How Can You Describe Your Organisation Type?
Exploitive Bureaucratic Consultative Participative

433
Part 2: Respondent Background Information
Gender
Male Female
Total Years Of Experience
<3 Years 3-5 Years
5-10 > 10 Years
Years Of Employment In This Company
<3 Years 3-5 Years
5-10 > 10 Years
Job Position/ Current Title
CEO/ Managing Director Quality Control Manager
Production Manager Inventory Manager
Supervisor Other (Please Specify)
Education Level
Master’s / PhD Bachelor’s Degree
High School Others (Please Specify)

434
Please use the following scales
1= Never, 2= Very Rarely, 3= Sometimes, 4= Frequently and 5= Always
Item
No. Process 1 2 3 4 5
PR01 The workshop is divided into different workplaces and
each zone has a specific task.
PR02
The processes used within similar operations are placed
close to each other in order to eliminate unnecessary
steps.
PR03 Each working zone is controlled and operated by
qualified and well-trained workers.
PR04 Each item/piece of equipment is labelled to ensure it is
located in the right zone/location in the workplace.
PR05 Production at each station is pulled by demand from
the next station.
PR06
A certain person is assigned as a part of his daily
activities to ensure that the workplace is clean and all
tools/pieces of equipment are put back in their
appropriate places.
PR07 Equipment maintenance records are posted on the shop
floor to be actively shared with employees.
PR08 The process flow of material and components is
smooth and continuous, as the equipment is grouped.
PR09 Products are not produced unless orders for them are
received from customers.
PR10
Machine operators and staff are engaged in the
scheduled maintenance of equipment so that machines
are maintained on a regular basis by skilled people.
PR11
There is a well-documented configuration setting for
each machine/piece of equipment to avoid uncertainty
about how to reconfigure the equipment during
changeover.
PR12 The total cycle time is revised for each product on a
regular basis in order to reach the optimum level.

435
Please use the following scales
1= Never, 2= Very Rarely, 3= Sometimes, 4= Frequently and 5= Always
ITEM
NO. Planning and Control 1 2 3 4 5
PC01
In order to improve production, a focus group of
workers is conducted (on a regular basis) to help the
company identify wastes and solve problems by
generating new ideas and solutions, which are then
submitted to the managers.
PC02
There is an awareness of the wider industry
performance, and a clear strategy is followed to
benchmark performance with the top-class firm (at a
domestic and national level).
PC03
There are standard routes for loading raw materials
and removing end products, including a standard
picking time.
PC04 Problem-solving techniques such as fishbone diagrams
are used to identify the causes of quality problems.
PC05
Up-to-date charts showing defect rates, key
performance indicators, progress and next job activity
are displayed on the shop floor.
Please use the following scales
1= Strongly Disagree, 2= Disagree, 3= Neutral, 4= Agree and 5= Strongly Agree
Item
No. Customer relations 1 2 3 4 5
CU01 There is an awareness of what product features
customers value and are willing to pay for.
CU02
Feedback is sought regularly, and surveys/meetings are
often held with customers to improve product design
and quality, and service.
CU03 Customers participate in the initial design process.
CU04
Valued customers are brought in to visit the plant in
order to give them some ideas about quality control
that the company can follow.
CU05 Customers help the company by providing information
about their future demands.

436
CU06
There is a system in place for collecting customer
complaints so that problems can be avoided in the
future.
Please use the following scales
1= Strongly Disagree, 2= Disagree, 3= Neutral, 4= Agree and 5= Strongly Agree
Item
No. Supplier relations 1 2 3 4 5
SU01
A clear strategy is in place by which to evaluate
supplier performance in terms of quality, delivery and
prices.
SU02 Local suppliers are used to avoid shipment delays.
SU03 Suppliers are aware of product designs and participate
heavily during design and development.
SU04
Raw materials and purchased parts are not subject to
incoming inspection as they come from qualified
suppliers.
SU05 Active steps are taken to reduce the number of
suppliers in each category.
SU06 Raw materials are received on time from the date of
order.
SU07 Suppliers are cooperative and committed to
maintaining a long-term relationship.
SU08 Suppliers are provided with feedback regarding quality
and delivery performance.
Please use the following scales
1= Strongly Disagree, 2= Disagree, 3= Neutral, 4= Agree and 5= Strongly Agree
Items
No. HR 1 2 3 4 5
HR01 Workspace layout is reconfigured regularly based on
feedback from employees.
HR02 Workers are able to perform different tasks
HR03 Shop-floor employees drive suggestion programme.

437
HR04
Numerous awards, incentive programmes and annual
bonuses are available for employees who help to
improve processes and eliminate unnecessary steps.
The evaluation is based on group performance
HR05 Workers are qualified enough to contribute to solving
problems, and are able to work as a team.
HR06 Departmental and employee relations are good, and
conflict barely occurs.
HR07 Each employee has a clear understanding of his job
description.
HR08
Employees have undergone quality training in terms of
developing their problem-solving capabilities and
identifying non-value-adding activities.
HR09 Workers are empowered to stop the production line if
abnormalities occur.
HR10 Suggestions and ideas from shop-floor employees are
actively used and implemented.
HR11 Employees act according to the interests of the group,
rather than their individual interests.
Please use the following scales
1= Strongly Disagree, 2= Disagree, 3= Neutral, 4= Agree and 5= Strongly Agree
Item
No. Top Management and Leadership 1 2 3 4 5
MGT01 Top management encourages and coaches workers
by visiting the workplace on a regular basis.
MGT02 We locate our worker where they can use their skills,
qualifications and experience.
MGT03 People have job security and workers are regularly
promoted to managerial positions.
MGT04 Company invests in training programmes and
encourages cross-job training.
MGT05
Company uses external experts/consultants on a
regular basis to evaluate the overall company
performance and to improve production and quality
level.

438
Appendix-C Ethics statement checklist

439

440
Appendix-D Ethical review certificate

441