investigating the impact of land-pbl coupling on the water and...
TRANSCRIPT

Investigating the Impact of Land-PBL Coupling on the Water and Energy Cycle in NASA Model and Observation Products
PI: Joseph A. Santanello, Jr. Hydrological Sciences Laboratory
NASA-GSFC, Greenbelt, MD
Co-Is: Toshi Matsui3,1, Christa D. Peters-Lidard NASA-GSFC, Greenbelt, MD
Collaborators: Joel Susskind1, Eric Fetzer2, Sujay Kumar4,1 1NASA-GSFC, Greenbelt, MD
2Jet Propulsion Laboratory, Caltech, Pasadena, CA 3University of Maryland, College Park, MD
4Science Applications International Corporation, McLean, VA

Investigating the Impact of Land-PBL Coupling on the Water and Energy Cycle
in NASA Model and Observation Products !• Extend'the'development'and'evaluation'of'local%land(atmosphere%coupling'(‘LoCo’)'diagnostics'for'NEWS'and'community'model'and'observation'products.'
• Determine'if'AIRS%retrievals%can'be'used'to'evaluate,'intercompare,'and'constrain'the'representation'of'land@PBL'coupling'and'its'inDluence'on'the'water'and'energy'cycle.'

Objective I ● Evaluate the accuracy, variability, and limitations of local land-PBL coupling (‘LoCo’) in an array of NASA and community model and observation products using a suite of LoCo diagnostics. LoCo Diagnostics: Mixing Diagrams, EF vs. PBLH, LCL Deficit Products: LIS-WRF, MERRA, NARR, CFSR Location: SGP (ARM-LoCo Testbed) Cases: Daily, composites, monthly, seasonal (JJA), extremes (dry/wet)

Objective I - Updates ● LIS-WRF Testbed -Products: LIS-WRF w/3 LSMs and 3 PBLs -Diagnostics: MDs, LCL, EF/PBLH -Period: 2006-7 dry/wet extremes over SGP Paper Published: Santanello, J. A., C. D. Peters-Lidard, A. Kennedy, S. V. Kumar, 2013: Diagnosing the Nature of Land–Atmosphere Coupling: A Case Study of Dry/Wet Extremes in the U.S. Southern Great Plains. J. Hydrometeor, 14, 3–24. ● LoCo-RA Study -Products: MERRA, NARR, and CFSR -Diagnostics: MDs, LCL, EF/PBLH -Period: 1996-2012 JJA over SGP -Observations: ARMBE and MERGESONDE Paper Submitted: Santanello, J. A., J. Roundy, and P. Dirmeyer: Quantifying the Land-Atmosphere Coupling Behavior in Modern Reanalysis Products over the U.S. Southern Great Plains. J. Climate, (June 2014).

LoCo Diagnostics 1) Mixing Diagrams (Santanello et al. 2009)
Requirements: Daytime evolution of T and q, surface fluxes (mean), PBL height (mean) Diagnosis: Diurnal coupling between land-PBL water and energy balance, entrainment fluxes of heat and moisture
2) Evaporative Fraction vs. PBL Height (Santanello et al. 2009, 2011a)
Requirements: Daytime mean land surface evaporative fraction (EF) and PBL height Diagnosis: Impact of EF on PBL growth (and vice-versa), sensitivity of land-PBL system to different models, inputs, or configurations
3) PBL Budgets of Heat and Moisture (Santanello et al. 2009, 2011a)
Requirements: Same as mixing diagrams Diagnosis: Complete budget of land-PBL fluxes, contribution of land fluxes to atmospheric water and energy cycle
4) Thermodynamic Overlays (Santanello et al. 2011a)
Requirements: Same as mixing diagrams Diagnosis: Diurnal evolution of equivalent potential temperature (theta-e), PBL saturation (q*), relative humidity (RH), and lifting condensation level (LCL) deficit
5) LCL Deficit (Santanello et al. 2011a)
Requirements: Mixing diagrams (1) and thermodynamic overlays (4) Diagnosis: Temporal and spatial analysis (PBL height - LCL height) of potential for clouds/precipitation, sensitivity of moist processes to changes in land-PBL components LoCo Process Chain ΔSM → ΔEFsm → ΔPBL → ΔENT → ΔEFatm ► ΔP/Clouds (1) (a) (b) (c) (d)

Mixing Diagrams 1996-2012
-All RAs tend to be drier than observations -CFSR driest, lowest LHF, largest PBL, largest entrainment; MERRA vice-versa -Diurnal range of T2 and Q2 and overall T2 is represented well in RAs

!MERRA !OBS !NARR !CFSR
Evaporative Fraction vs. PBL Height
-PBL height vs. EF relationship indicates sensitivity of PBL to surface moisture state -CFSR/NARR much deeper PBLs and larger sensitivity to evaporation

!MERRA !OBS !NARR !CFSR
LCL Deficit (PBL height – LCL)
-NARR has tendency to reach the LCL in afternoon; CFSR furthest away -NARR is in ’sweet spot’ of having enough moisture vs. large enough PBL growth -Indicative of dry vs. wet extremes

Diurnal Cycle of Precipitation
-MERRA consistent midday peak in precipitation -Obs tend to show more bimodal distribution (am/pm)
!MERRA !OBS !NARR !CFSR

-CFSR performs worst overall, driven by dry bias -Post-2007 improvement in CFSR driven by incorporation of IASI and improved AIRS observations.
Summary Statistics


Coupling Drought Index (CDI; Roundy et al.)
-LoCo results explain processes responsible for differences and biases in drought indices

Objective I – NEWS Integration ● Extremes WG -Investigating the causes of the flash drought of 2012 over CGP -LoCo insight and analysis produced for manuscript -July minus June relationships and trends over the RA record -Show the potential land preconditioning and PBL feedbacks present in 2012 (vs. 2011). Paper in Prep: Wang, S. et al., 2014: Could the 2012 drought have been anticipated?
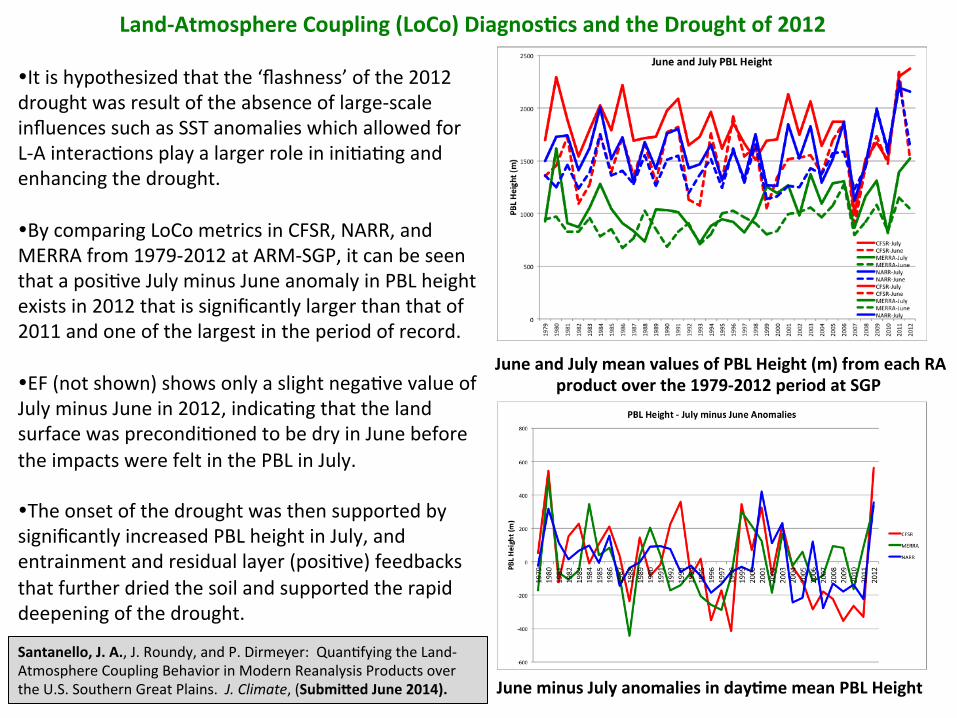
June%minus%July%anomalies%in%day.me%mean%PBL%Height%
%June%and%July%mean%values%of%PBL%Height%(m)%from%each%RA%
product%over%the%1979B2012%period%at%SGP%
!It#is#hypothesized#that#the#‘flashness’#of#the#2012#drought#was#result#of#the#absence#of#large=scale#influences#such#as#SST#anomalies#which#allowed#for#L=A#interacCons#play#a#larger#role#in#iniCaCng#and#enhancing#the#drought.### !By#comparing#LoCo#metrics#in#CFSR,#NARR,#and#MERRA#from#1979=2012#at#ARM=SGP,#it#can#be#seen#that#a#posiCve#July#minus#June#anomaly#in#PBL#height#exists#in#2012#that#is#significantly#larger#than#that#of#2011#and#one#of#the#largest#in#the#period#of#record.## !EF#(not#shown)#shows#only#a#slight#negaCve#value#of#July#minus#June#in#2012,#indicaCng#that#the#land#surface#was#precondiConed#to#be#dry#in#June#before#the#impacts#were#felt#in#the#PBL#in#July.### !The#onset#of#the#drought#was#then#supported#by#significantly#increased#PBL#height#in#July,#and#entrainment#and#residual#layer#(posiCve)#feedbacks#that#further#dried#the#soil#and#supported#the#rapid#deepening#of#the#drought.##
Santanello,%J.%A.,#J.#Roundy,#and#P.#Dirmeyer:##QuanCfying#the#Land=Atmosphere#Coupling#Behavior#in#Modern#Reanalysis#Products#over#the#U.S.#Southern#Great#Plains.##J.!Climate,#(SubmiJed%June%2014).#
LandBAtmosphere%Coupling%(LoCo)%Diagnos.cs%and%the%Drought%of%2012%

July minus June – PBL height and Evaporative Fraction

Objective I - Updates ● LoCo Community Developments -GEWEX-GLASS core theme of L-A Coupling -LoCo WG continues to grow & sponsor initiatives on L-A coupling
"LoCo-SGP Testbed -Community survey conducted on data needs for LoCo -Collaboration with DOE to create a new ARM-Best Estimate (ARMBE-Land product) at SGP for LoCo studies -First time buy-in from DOE ARM/ASR programs

• Based on community feedback and through collaboration between LoCo, ARM, and the NASA NEWS program, a new data product called ARM Best Estimate (ARMBE) - Land has been produced for the SGP Central Facility (Lamont, OK).
• PI: Shaocheng Xie, Lawrence Livermore National Laboratory • Data Product Name: ARMBELAND - Critical soil quantities for describing land properties Product Type: ARM Evaluation Products • Date Range of Product: 01/01/1994 - 12/31/2012 • Data Directory Location: http://iop.archive.arm.gov/arm-iop/0eval-data/xie/armbe-eval/armbeland/
• Currently, the ARMBE-Land contains the following quantities: * Soil temperature measured from CO2FLX, EBBR, and SWATS * Soil moisture content measured from CO2FLX, EBBR and SWATS * Soil heat flux from CO2FLX, EBBR * CO2 flux from CO2FLX * CO2 density from CO2FLX * Friction velocity from CO2FX * Photosynthetic photon flux density (PAR) from CO2FX
• Work has begun on a 2-D gridded (variational analysis) product over the broader ARM SGP network, which will include all the fields relevant for land-atmosphere coupling studies as well as sub-grid scale variability. Delivery of this product is expected by early 2014.
17
#Data#availability:#
• QuanCCes#from#CO2FLX#:#2003=2012#• QuanCCes#from#EBBR:#1994=2012#• QuanCCes#from#SWATS:#1996=2012#
#
LoCo-SGP Testbed

Objective I - Updates ● LoCo Community Developments -GEWEX-GLASS core theme -LoCo WG continues to grow & sponsor initiatives on L-A coupling
"Assessment of PBL Observations at SGP -PBL height, profiles, diurnal evolution are critical to LoCo -Previously limited to sparse radiosonde -Many new value-added and merged products being developed

PBL Observation Inventory 19
• ARMBSGP%Value%Added%Product%(*PBLH)%– SGP#sonde#data#(4x#daily)#over#period#of#record#1996=present#– 4#method#intercomparison#of#PBLH#detecCon#
• Hecer#(gradient),#Liu=Liang#(parcel),#Bulk#Richardson#0.5#and#0.25#(stability/shear)#
• ARMBSGP%PBLH%Product%(*PBLH)%
– AERI#+#Raman#Lidar#to#construct#temperature#profile#in#lower#troposphere#– 2009=2012#hourly#dataset#
• LiBSawyer%Method%(*PBLH)%
– Combines#gradient/wavelet#detecCon#– Employs#sonde,#AERI,#and#MPL#(lidar)#@#SGP#– To#be#released#soon#
• ARMBSGP%Merge%Sonde%VAP%(*profs)%
– Sonde+MWR+Met+ECMWF#data#– 1996=present#@#hourly#resoluCon#and#266#verCcal#levels#– Beta#tesCng#and#helping#with#reprocessing#
• AERIoe%Produce%(*profs)%
– NEW#ARM#highlight,#profiles#based#on#AERI#for#clear#and#cloudy#–#focused#on#PBL#– hip://www.arm.gov/science/highlights/RNTQ2/view#
• CeilometerBderived%(*PBLH)%
– 2011=present#at#SGP;#3#methods,#16s#resoluCon#– hip://www.arm.gov/news/data/post/27253#
• Airborne%HSRL%PBLH%(NASA%Langley)%
– Vs.#WRF=Chem#and#Sondes#– Transects#over#Calnex#
• COSMIC%–%GPS%Radio%Occulta.on%(*prof/PBLH)%– India#Dept.#of#Space#– VerCcal#profiles#of#refracCvity#(N)#– PBLH#from#wavelet#analysis#– Irregular,#global#coverage#depending#on#land/sea#and#laCtude#– SGP#2006=12,#+/=#2#degrees#saw#1136#profiles#available#(~1#every#2#days)#
• ECMWF%(ERABInterim)%Climatology%Product%(*PBLH)%
– Teixeira#and#von#Englen#– Monthly#gridded#PBLH#@#0,#6,#12,#18#UTC#– 5#gradient#methods#–#RH#most#robust#
• AIRS%(*prof)%
– NEWS#proposal#(2012=2014)#– L2#profiles#limited#in#lower#troposphere#– AIRS#radiances#as#a#proxy#for#L=A#condiCons#
• Gadanki,%India%Site%(*prof)%
– Met#staCon,#tower,#soil#moisture/temperature,#and#fluxes#(installed#recently)#– 3=hourly#Radiosonde#(2006=present)#– Monsoon#studies#
SGP#products#highlight#the#diversity#and#difficulCes#in#PBL#profile#and#height#esCmaCon.#
#MERGESONDE#shows#promise#for#filling#in#temporal#dimension#and#allowing#for#automaCon.#
#SCll#site=specific#and#subject#to#sonde/profiler#limitaCons.#
#MoCvaCon#for#satellite=derived#PBL#informaCon#(e.g.#AIRS).#

Objective II ● Compare radiance and profile retrievals from AIRS against those from model and observation products as generated from a satellite data simulator (G-SDSU). Soundings: Vertical profiles of T,q in PBL (AIRS vs. sonde vs. model) Radiances: AIRS retrieved vs. G-SDSU simulated (models and obs) AIRS Science Team Collaboration: AIRS Stand-Alone Radiative Transfer Algorithm (SARTA) and Tb spectra analysis (L. Strow, J. Susskind)

AIRS-d 1130 UTC 2330 UTC
AIRS-d 1130 UTC 2330 UTC
AIRS-n 1130 UTC 2330 UTC
AIRS-n 1130 UTC 2330 UTC
27 July 2003
AIRS Profile Retrievals vs. Radiosonde @ ARM-SGP Central Facility
Day - 14 June 2003 Day - 27 July 2003
Night - 14 June 2003 Night- 27 July 2003

Vertical Temperature Profiles over SGP Dry Year (2007)

-50
-40
-30
-20
-10
0
10
20
30
40
50
650
672
701
727
754
791
824
857
886
925
959
998
1037
1090
1218
1266
1329
1375
1425
1496
1570
2206
2292
2351
2461
2556
2621
Wavenumber*(1/cm)
7-Jul
14-Jun
3-Jun
h w Hs γ Storage 7 July 2695 5 182 .004 210 14 June 290 18 80 .02 -52 3 June 1291 23 15 .006 -104
!
2ch-window 5ch-γ 5ch-Hs 5ch-h 5c-w 5ch-Δθ2m
w .63 .81 .92 .77 .82 .43
Hs .53 .69 .80 .68 .75 .36 h .24 .49 .44 .53 .63 .49
Δθ2m .34 .43 .52 .50 .46 .52 γ .09 .37 .20 .22 .25 .28
WN1 933.040 667.773 667.773 667.773 667.773 651.283
WN2 2530.89 696.603 903.775 896.183 693.028 694.948 WN3 -- 701.617 992.448 922.731 903.775 937.907
WN4 -- 796.038 2278.82 2273.90 2278.82 2285.74 WN5 -- 2272.92 2519.99 2501.67 2519.99 2491.02
Sensitivity of AIRS spectrum to Land-PBL conditions
* Preliminary work has established correlations with as few as 5 AIRS channels and Land-PBL quantities of interest.

200#
220#
240#
260#
280#
300#
320#
340#
650# 1150# 1650# 2150# 2650#
Brightne
ss*Tem
p*(K)*
Frequency*(cm61)*
Radiance*(Tb)*Spectra*from*AIRS*and*Models*
LIS6WRF;*6*Sept*
LIS6WRF;*25*Jan*
LIS6WRF;*27*July*
AIRS*CCR;*27*July*

Simulated#AIRS#L1B#Tb#Spectra#
Retrieved#AIRS#L2#T=q#Profile#and#Ts#
Model#T=q#Profiles#and#Ts##
(WRF,#MERRA,#etc.)#
Obs#T=q#Profiles#and#Ts##
(sonde#data)#
Forward#Model##SARTA#in#G=SDSU#
GSFC#AIRS#Algorithm#
Observed#AIRS#L1B#Tb#spectra##
(1)#
(2)#
Proposed%Goals:#1. Intercompare#L1B#Tb#spectra#2. Intercompare#L2#profiles#
a. Model#(WRF,#RAs)#b. Observed#(radiosonde)#c. AIRS#radiances##
• Focus#on#L=A#quanCCes#and#processes#of#interest,#in#parCcular#PBL#and#surface#turbulent#SH/LH#fluxes.##
• Examine#sensiCvity#of#land=surface#emissivity#and#diurnal#cycle.#


Objective II - Updates ● AIRS PBL Profile Retrievals -AIRS V3, V5, and V6 analysis shows significant limitations in the PBL -Sensitivity of AIRS L2 profiles over land in lower troposphere (e.g. for PBL height detection) is weak and inconsistent ● AIRS Radiance Spectra -Intercompare Tb spectra from AIRS vs. WRF vs. RA products vs. radiosonde -Use G-SDSU to generate Tb from vertical profiles of T, q from models and observations -Supports need for AIRS RTM (SARTA) incorporation into G-SDSU for more direct comparison (resolution and specifications)

LISBWRF%output%over%SGP%–%Dry%Year%(2006)%
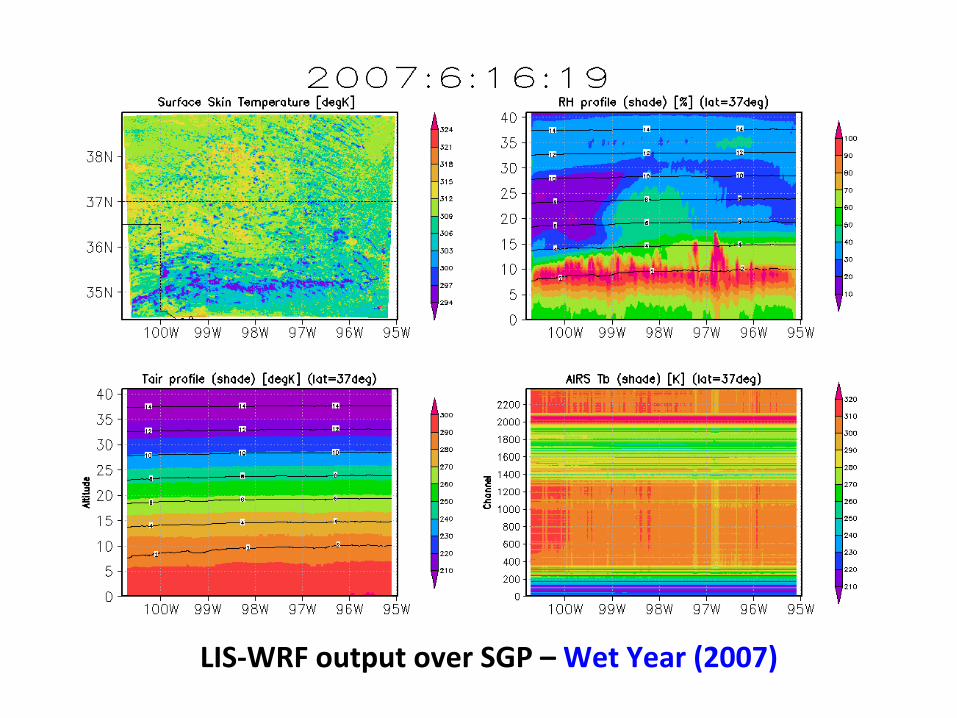
LISBWRF%output%over%SGP%–%Wet%Year%(2007)%

Global%Infrared%Land%Surface%Emissivity:%
=UW=Madison#Baseline#Fit#Emissivity#Database#(MODIS=based)#=Incorporated#into#SARTA/G=SDSU#


Future Work ● Evaluate the ability of hyperspectral sounders (e.g. AIRS or IASI) to be used as an observational benchmark against models. ● Tb and profile intercomparison for dry/wet regimes and locations/regions outside SGP (e.g. AMMA, Cabauw). ● Statistical linkages of Land-PBL variables to specific regions of the AIRS spectrum. ● Identify potential areas of improvement for AIRS profile retrievals (and AIRS Science Team) through the lower troposphere.