investigating the impact on screen temperature of … · temperature of concrete surfaces within...
TRANSCRIPT

Investigating the impact on screen temperature of concrete surfaces within the meteorological enclosure Matt Clark1, Thomas Dent-Jones1 and David Moore1
1Observations Development, Met Office, FitzRoy Road, Exeter, Devon, EX1 3PB, United Kingdom.
1. Introduction
During an inter-comparison of SAMOS and MMS observing systems at Camborne in 2008 – 2009, it was
noted that one-minute mean temperatures, as measured within identical Stevenson screens situated ~30 m
apart, differed by as much as 0.8 °C (Clark et al., 2013). The differences tended to increase with increasing
solar radiation, with MMS temperatures typically warmer. The differences were not investigated in detail,
though it was suggested that variations in the immediate environment of each screen was one possible cause.
In particular, the positive bias in MMS temperature, relative to the SAMOS temperature, may have been a
consequence of the presence of a concrete pathway close to the MMS screen. Similar temperature differences
have been observed in other investigations of screen temperature measurements (e.g. Sun et al., 2005;
Harrison, 2011), and may arise from differing surface temperature, surface albedo (and therefore reflected
down-welling radiation) or sheltering effects in the immediate screen environment.
In the Met Office network of surface stations, the screen is situated within an enclosure, which is
largely grass-covered. Most enclosures also include some concrete surfaces, comprising concrete pathways
and/or concrete plinths on which various sensors are situated. The effect of concrete on temperature
measurements is therefore of potential relevance for screen temperatures as measured in a typical observations
enclosure. In order to derive an estimate of the amount of concrete typically found within enclosures, a virtual
survey of 151 Met Office surface stations was conducted by inspecting photographs of each site, taken by Met
ES staff during site visits. The amount of concrete at each site was estimated from the photos and assigned
one of four categories (note that these categories carry no official status, and are designed only for this trial).
The results can be summarised as follows:
• 10% of enclosures were entirely grass covered (category 0)
• 23% of enclosures had a number of plinths, but no concrete pathway (category 1: < ~5% concrete by
area)

• 61% of enclosures had a concrete pathway and a number of plinths (category 2: ~5% to ~10%
concrete by area)
• 6% of enclosures had larger areas of concrete surfaces, in addition to the plinths and pathways
(category 3: >~10% concrete by area including, in a few instances, entirely concrete- or gravel-
covered enclosures)
The typical enclosure can therefore be described as having ~90 to 95% grass cover, with a concrete pathway
and a number of concrete plinths (i.e. category 2). An example of such an enclosure is shown in Figure 1. Of
note is that the 10% of sites with entirely grass-covered enclosures include the three CET sites of Stonyhurst,
Rothamsted and Pershore College. For Climate Reference sites with photos in the Met ES photo bank (26 out
of 35 sites), the percentages falling into each category were 19%, 27%, 50% and 4% for categories 0, 1, 2 and
3, respectively.
2. Experimental Set-up and Calibration Checks
In order to determine the influence of concrete on air temperature measurements made with platinum
resistance thermometers (PRTs) housed in Stevenson screens, a trial was run over the summers of 2013 and
2014 at Camborne, Cornwall. A square pathway, two concrete slabs wide (each slab of dimensions 0.6 × 0.6 ×
0.055 m) was laid, with a concrete-free square in the middle containing the Stevenson screen R4 (Figures 1
and 2). To the west of the pathway was R3, and to the east was R5. The perimeter of the square path had
dimensions of 2.4 × 2.4 m, with the centre R4 being 0.97 m away from the inner perimeter of the path. The
centres of the R3 and R5 Stevenson screens were also located 0.97 m from the outer edge of path, to the west
and east respectively. A fourth screen, R6, was located 4 m east of R5, and was surrounded by grass. This
screen was set up as a control. Grass surrounded the concrete path, and also covered the 1.2 × 1.2 m square
surrounded by the path. This set-up was designed to emulate a ‘worst-case’ scenario in terms of concrete
amounts near the screen, given the classifications obtained in the virtual survey of Met Office enclosures.
For the summer of 2014 only, eight additional PRTs, housed in aspirated screens of Met Office design
(Figure 3) were installed on poles, located in close proximity to each of the Stevenson screens. A pair of these
sensors was placed 0.6 m to the south of each screen, with one sensor mounted at a height of 1.25 m (the same
height as the PRTs within the Stevenson screens) and the other at 0.5 m. Temperatures measured in the
aspirated shield should, in theory, be less subject to the effects of reflected solar radiation than Stevenson
screens. Therefore, in the event that the concrete causes a warm bias in Stevenson screen temperatures,
comparison of the bias with that of the aspirated screen temperatures should provide insight into whether
thermal effects, or reflected radiation effects, dominate (i.e. if the bias is present in both measurements, it
suggests a thermal effect dominates; bias in the Stevenson screen temperatures only would be suggestive of a

reflected radiation effect). The thermal and reflected radiation mechanisms are discussed further in section
3(ii).
Inside each screen, temperature was measured using a 100Ω PRT, recording temperature every
minute. This minute value is the mean of four measurements, taken every 15 seconds. All PRTs were
calibrated in QA lab prior to deployment in August 2013. In the case of the R3, R4, R5 and R6 temperature
measurements, which are logged by MMS, calibration corrections are applied automatically by the MMS
system. For the PRTs housed in the aspirated screens, calibration corrections were applied at the data analysis
stage. A zero check was performed in the field on 20 August 2013 for all four Stevenson screen-housed PRTs.
A purpose-designed, calibrated test unit was used for this purpose (Figure 4). The unit comprises a flask
containing water or, in the case of a zero check, an ice–water mix. The fluid is continually aerated in order to
ensure a constant temperature is maintained. The screen PRTs are immersed in the water and allowed to fully
respond to the temperature change after immersion. Readings of the screen PRTs are then made over a period
of several minutes. In addition to the zero check on 20 August 2013, a check at 19 °C was conducted, using
the same apparatus, on 26 September 2013 (Table 1). Zero checks were also performed at the beginning of
2014, in order to check that no significant drift in output had occurred since PRT calibration.
As a further check, the screens were placed side-by-side at the Camborne trial site for a period of nine
hours, starting 2000 UTC 20 August 2013, prior to deployment of the concrete pathway, and the mean
temperatures compared (Table 1). Conditions during this side-by-side comparison were largely clear to partly
cloudy, with light south-south-westerly winds.
Table 1: Results of calibration checks and side-by-side comparisons of R3, R4, R5 and R6 PRTs. All
values are in °C.
System Error at
0 °C (°C)
Error at
19 °C (°C)
Correction (at 19 °C)
relative to R3 (°C)
Side-by-side check: mean difference
relative to R3 (°C)
R3 0.023 0.017
R4 0.023 0.007 +0.01 0.004 (range -0.08 to 0.10)
R5 0.018 0.012 +0.005 0.019 (range -0.08 to 0.10)
R6 0.051 0.017 0 0.031 (range -0.03 to 0.11)
The R6 temperature, being located over grass surfaces and well away from the concrete pathway, was
intended to provide a reference temperature throughout the trial. However, early field measurements showed
that R6 temperatures were positively biased, relative to R3, R4 and R5. Furthermore, the mean difference

between R6 and each of the other Stevenson screen temperatures was larger than the mean differences
between any of R3, R4 and R5. The positive bias in R6 is apparent in the zero check results (Table 1), though
it is less apparent in the results of the check at 19 °C (note that these biases are in temperatures which have
already been corrected using calibration offsets obtained during calibration in QA lab, as discussed
previously). For this reason, R6 could not be used as a reference, as originally intended. Temperature biases
have therefore been expressed as the difference between each Stevenson screen temperature (R4 and R5) and
R3. Since R3 is located close to the concrete, and could therefore itself be subject to bias introduced by the
concrete, it cannot be considered a ‘true’ reference. Nevertheless, the comparison of R5 and (particularly) R4
with R3 still provides useful information about the effects of the concrete on the temperature measurements.
3. Results
i) Stevenson Screen Temperatures for 1 April – 30 June 2014
Analysis over 1 April – 30 June 2014 (excluding 30 April – 14 May, when R4 had missing data) reveals the
warm bias in R6 when compared to R3, R4 and R5 (Figure 5; Table 2). Subsequent comparisons will
therefore consider only R3, R4 and R5. In the case of the daily minimum, a slight east-west temperature
gradient (colder to the east) is evident when comparing differences between R3, R4 and R5. A similar feature
was observed in summer 2013 (Clark et al., 2013), and was suggested to have been the result of a larger-scale
temperature gradient across the trial site during nocturnal conditions. The separation of screens and the
observed differences suggest a gradient of ~0.008 °C m-1 in the east–west direction. In the case of daily
maximum temperatures, R4 appears to have the largest bias, being on average 0.033 °C warmer than R3. R5
daily maxima were closer to those of R3 (0.009 °C warmer, on average).
Whilst the mean differences from R3 for the daily maximum, mean and minimum temperatures are
very small (<0.04 °C for R4 and R5), the ranges in the differences were comparatively large. For example, the
differences in individual daily maxima for R5, relative to R3, ranged from -0.259 to 0.244 °C (Table 2).
Comparison with results from summer 2013 (right hand two columns of Table 2) shows that the mean
difference between daily maximum temperatures in 2014 was slightly smaller than in 2013, by ~0.01 °C and
0.03 °C for R4 and R5, respectively. However, differences in daily minima were larger in 2014 (by 0.015 and
0.026 °C for R4 and R5, respectively).

Table 2: Mean differences in daily maximum, daily minimum and daily mean temperatures for R4, R5
and R6, relative to R3.
Stevenson
Screen
Mean
daily
maximum
(oC)
Mean
daily
mean
(oC)
Mean
daily
minimum
(oC)
Mean
Difference
in Daily
Maximum
from R3
(oC)
Mean
Difference
in Daily
Mean
from R3
(oC)
Mean
Difference
in Daily
Minimum
from R3
(oC)
Mean
Difference
in Daily
Maximum
(Clark et
al., 2013)
(oC)
Mean
Difference
in Daily
Minimum
(Clark et
al., 2013)
(oC)
R3 14.998 12.052 9.058
R4 15.031 12.054 9.042 0.033
(range:
-0.111 to
0.171)
0.002
(range:
-0.014 to
0.026)
-0.016
(range:
-0.350 to
0.129)
0.041
(range:
-0.07 to
0.15)
0.001
(range:
-0.05 to
0.07)
R5 15.007 12.043 9.024 0.009
(range:
-0.259 to
0.244)
-0.00921
(range:
-0.032 to
0.012)
-0.034
(range:
-0.185 to
0.098)
0.037
(range:
-0.12 to
0.21)
-0.008
(range:
-0.06 to
0.06)
R6 15.086 12.089 9.056 0.088
(range:
-0.231 to
0.338)
0.037
(range:
0.009 to
0.076)
-0.002
(range:
-0.254 to
0.129)
ii) Influence of global radiation
Bias in temperatures measured near concrete could, theoretically, arise from two different processes. Firstly,
since the albedo of concrete is larger than that of healthy (un-parched) grass, it should reflect more down-
welling solar radiation than the grass. Reflected solar radiation may, in certain conditions, enter the Stevenson
screen via the downward-angled louvres in the screen side panels, causing a temperature bias. In non-zero
solar radiation, such an effect should always lead to a positive bias in temperature measured in Stevenson
screens over concrete, relative to that measured in a screen over grass. In the current trial set-up, the bias
would be expected to be largest in the case of R4, since it has the largest fractional cover of concrete in its
ground ‘view’. One would expect the radiation-induced bias to be largest under conditions of strong solar

radiation (more reflected radiation, given a constant ratio of down-welling to reflected radiation) and light
winds (associated with poor ventilation of the screen, and therefore greater overheating of the PRT where
exposed to reflected radiation; Harrison, 2011).
Secondly, temperature bias may arise from differential heating of the grass and concrete surfaces.
Grass, with its lower albedo, may be expected to reach a higher temperature than concrete for a given amount
of solar radiation. However, the heat capacity of the grass and concrete will also influence the temperatures of
each surface, producing temperature differences of a magnitude (and sign) not easily predicted. Furthermore,
the amount of water on the surfaces (and in the near-surface soil) will impact upon the surface temperature.
Grass would be expected to hold water for longer than concrete, and cooling by evaporation might therefore
lead to lower surface temperatures in the case of damp or wet grass than for concrete, which would typically
dry out more rapidly and more completely. A limitation of the current trial is that there is no way of measuring
concrete and grass temperatures in the presence of solar radiation (sensors mounted on the grass and concrete
are unshielded, therefore overheat significantly during the day). An infra-red camera was used to capture
snapshots of grass and concrete temperature under various conditions during the trial. Although no systematic
recording was conducted, it was observed that the concrete surface tended to be warmer than the grass surface
during the day, typically by 2 to 3 °C. The largest differences occurred when the sun was temporarily shaded
by cloud: under such conditions the grass appeared to cool more rapidly than the concrete, resulting in larger
differences (concrete warmer). These observations suggest that, as a general rule, it is reasonable to expect
that the concrete will be slightly warmer than the grass under most daytime conditions. Positive biases could
therefore arise if air heated by contact with the warmer concrete entered the screen. Bias associated with this
effect may be expected to be wind direction dependant. Under westerly winds, R5 may be expected to warm
more than R3, being downwind of the concrete, with the reverse true for easterly winds. Above some
threshold wind speed, this effect would be negligible, since any warmed air would likely be advected away
horizontally before it could ascend (via convection or mechanical overturning) to Stevenson screen height.
The influence of global radiation (i.e. all down-welling radiation) on temperature biases was
investigated by splitting the data into global radiation bins starting from -100 Wm-2, and subsequently
increasing in 100 Wm-2 increments. Only 80 minutes of data were obtained with a global radiation value
exceeding 1200 Wm-2 (Table 3), and all of these occurred on a single day. Consequently, these data were
excluded from further analysis, as they may not be representative of true biases associated with this radiation
class. Analysis of the differences in Stevenson screen temperatures under different global radiation scenarios
(Table 3, Figure 6) show that there is a small, but measurable, warm bias in R4 temperatures, relative to R3
and R5, under conditions of moderate to strong solar radiation. This bias is evident with global radiation
values as low as 100 – 200 Wm-2, and the magnitude tends to increase with increasing global radiation.
However, even under the highest global radiation intensities, the bias was small (~0.015 to 0.017 °C).
Although measurable in this trial, such bias would be negligible in the context of synoptic meteorology and
for the climate record.

For global radiation <100 Wm-2, R4 and R5 exhibited negative bias, relative to R3. The bias is largest
for R5. Global radiation values <100 Wm-2 occur at night, and occasionally during the daytime under thick
cloud cover. The negative biases may therefore be due to the aforementioned larger-scale gradients which we
suggest may occur across the trial site under nocturnal conditions. These results do not appear to be influenced
significantly by the presence of the concrete, since if concrete were leading to a cold bias in temperatures this
would be expected to be largest for R4.
Table 3: Stevenson screen temperature differences as a function of global radiation intensity, 1 April –
30 June 2014.
Global Radiation
Category (Wm-2)
Minutes
Observed
Mean Temperature
Difference from R3 for
R4 (oC)
Standard
Deviation of the
Mean
Temperature
Difference from
R3 for R4 (oC)
Mean Temperature
Difference from R3 for
R5 (oC)
Standard
Deviation of
the Mean
Temperature
Difference
from R3 for R4
(oC)
Less than 0 38783 0.008 0.003 0.021 0.007
0 – 100 21544 0.004 0.003 0.015 0.002
100 – 200 10119 0.005 0.000 0.005 0.002
200 – 300 8520 0.008 0.002 0.004 0.001
300 – 400 7010 0.011 0.004 0.000 0.000
400 – 500 5396 0.013 0.001 0.000 0.002
500 -600 4437 0.013 0.001 0.001 0.004
600 - 700 3866 0.014 0.003 0.004 0.003
700 – 800 4174 0.018 0.004 0.009 0.006
800 – 900 4391 0.014 0.004 0.008 0.005
900 – 1000 2778 0.015 0.001 0.013 0.001
1000 – 1100 592 0.016 0.006 0.015 0.008
1100 – 1200 80 0.013 0.006 0.000 0.002
1200 – 1300 6 -0.010 0.006 0.033 0.057
Greater than 1300 2 0.086 0.107 0.174 -0.126

The standard deviation of the mean temperature difference shows that there is a distinct lack of variability
(0.008 °C) in temperature bias (analysed only for categories with > 60 minutes of data), as shown in Figure 7.
This suggests that the observed differences between R3 and R4 give a robust idea of the possible order-of-
magnitude impacts of concrete at a ‘worst-case-scenario’ site. However, since R3 itself could be affected by
concrete to some extent, this difference does not allow us to infer the total possible bias due to concrete (R6
would have provided this information, had it not exhibited unexpected bias unrelated to the concrete).
iii) Influence of wind speed
The influence of wind speed on the magnitude of temperature difference was investigated, using the wind
speed as measured on the 10 m operational wind mast Camborne. The wind speed was split into four
categories: <0.5 knots (close to the threshold speed of the anemometer); 0.5 to 10 knots; 10 to 20 knots; and
>20 knots. Originally, the wind speed as measured on the 2 m trials mast (Figure 1) was to be used, but during
the trial period it was observed that the anemometer was not rotating freely. Since there is no record of when
this issue began, the 10 m wind speed had to be used. The 10 m wind mast is located approximately 125 m
east-northeast of the trial site.
In the absence of adequate ventilation, the response time of the screen is increased, resulting in the
PRTs responding more slowly to variations in external air temperature. Furthermore, any heating of the PRT
by reflected radiation would likely be larger, since the air flow within the screen is insufficient to cool the
PRT to a temperature that is closer to the true air temperature. Any thermal effects may also be expected to be
larger in light wind conditions, since there would likely be a greater chance of warm air reaching screen level
by convection, before being advected horizontally away from the screen.
Results for very low wind speeds (less than 0.5 knots) show a greater difference for both R4 and R5,
relative to R3, than during stronger winds (Figure 8; Table 4). The greatest difference occurs for R4 when
winds are less than 0.5 knots, with a warm bias of 0.05 °C. In higher wind speeds, temperature differences are
small. In fact, for wind speeds >0.5 knots, mean differences are <0.01 °C for both R4 and R5. This suggests
that biases only become measurable under very light wind conditions, and that even modest wind speeds
prevent measurable bias in mean temperatures. The standard deviation of the differences was also found to be
larger in very light wind conditions (Table 4).

Table 4: Mean and standard deviation of Stevenson screen temperature differences as a function of
wind speed, 1 April – 30 June 2014.
Wind
Speed
Category
Number
of
Minutes
of Data
R4
Difference
in Mean
Temperature
(oC)
R5
Difference
in Mean
Temperature
(oC)
R4 Standard
Deviation in
Mean
Temperature
(oC)
R5 Standard
Deviation in
Mean
Temperature
(oC)
R4 Range in
Mean
Temperature
Difference
(oC)
R5 Range in
Mean
Temperature
Difference
(oC)
Less
than 0.5
knots
42 0.050 0.018 0.044 0.024 0.216 to
-0.182
0.528 to
-0.301
0.5 to 10
knots
28566 0.014 0.002 0.003 0.001 0.486 to
-0.392
0.614 to
-0.555
10 to 20
knots
19684 0.008 0.001 0.000 0.001 0.419 to
-0.350
0.543 to
-0.375
Greater
than 20
knots
911 -0.005 -0.009 -0.003 -0.005 0.104 to
-0.154
0.133 to
-0.181
Analysis of temperature differences as a function of both wind speed and global radiation class (Figures 9 and
10) shows that positive biases occurred under substantially smaller global radiation intensities for R4 than R5.
The tendency for comparatively large warm biases under light wind conditions is much more evident in R4
than R5. This may point to reflected radiation effect, since R3 and R5 have the same fractional ground cover
of concrete, whilst R4 has a larger cover. The existence of larger warm bias under near-calm and calm
conditions (<0.5 knots) for R4 could equally hint at a thermal effect, since air warmed by the concrete might
be expected to rise more nearly vertically in calm conditions, therefore possibly affecting R4 more (when
analysing a mean bias over all wind directions). However, the persistence of this pattern (larger warm bias in
R4 than R5 over a wide range of radiation classes) in the 0.5 – 10 knot wind speed range (and even, to a small
extent, at 10 – 20 knots) is perhaps more suggestive of a radiative effect, since horizontal advection of air
warmed by the concrete would be expected to prevent this air reaching screen level at most wind speeds in
this wind speed class. For example, air moving horizontally at 2.6 ms-1 (5 knots) would need to have an
updraft of 2.0 ms-1 for air at ground level near the centre of the concrete path to reach R4 screen height, given
the horizontal distance between the path and R4 (though winds near ground level will be much lighter than
those measured on the 10 m mast).
Figures 9 and 10 also show that differences between R3 and each of R4 and R5 tend to be negative at
most radiation intensities when winds are strong (>20 knots). The reason for this effect is not clear.

iv) Influence of wind direction
The results presented so far indicate that R5 often has a small positive temperature bias compared to R3 under
moderate to high radiation intensities (e.g. see Figure 6). Westerly winds were more frequent than easterly
winds over the study period by 2466 minutes (~20% more frequent; Table 5). Therefore it is possible that the
warm bias in R5, relative to R3, could be due to advection of air warmed by the concrete (R5 being downwind
of the concrete more frequently than R3). To further investigate this possibility, data were split into two wind
categories: westerly (210° to 330°) and easterly (30° to 150°). The same analysis was then executed for
situations in which global radiation exceeded 1000 Wm-2. Results are shown in Table 5 and Figure 11.
Table 5: Mean Stevenson screen temperature differences for different wind direction categories 1 April
– 30 June 2014. Results obtained in August 2013, for wind speeds (at 2 m) of 0 – 2 knots, are also shown.
Wind Direction Minutes Observed Mean R4
Temperature
Difference (oC)
Mean R5
Temperature
Difference (oC)
2013 Mean
R4
Temperature
Difference
(oC)
2013 Mean
R5
Temperature
Difference
(oC)
Westerly 14229 0.015 0.002 0.103 0.085
Easterly 11763 0.013 -0.006 0.037 -0.022
Westerly
(GR > 1000Wm-2)
221 0.017 0.012
Easterly
(GR > 1000Wm-2)
116 0.007 -0.021
In westerly winds (all global radiation intensities), there is a slight positive temperature bias in R5, relative to
R3, of 0.002 °C. However, R4 has a greater warm bias than R5 under these conditions. Under high global
radiation intensities, the bias in R5 is more pronounced, and closer to that of R4. Easterly winds show a
reversed pattern with R5 having a negative temperature bias in comparison to R3, which is again larger under
high global radiation intensities. The reversal in the sign of the bias in R5, relative to R3, between easterly and
westerly wind directions is strongly suggestive of a thermal effect, since in each wind direction class the
downwind sensor is warmer, as would be expected if the concrete surfaces were warmer than the grass-
covered surfaces. The reversal of the sign of the difference is also apparent in the 2013 data (Table 5).
However, some caution is required, as suggested by the difference in the temperature bias of R4 under

westerly and easterly wind at high radiation intensities. This sensor is in the middle of the concrete, and
therefore any changes in wind direction should not impact upon the mean bias, if the bias were primarily a
thermal effect (and if it is assumed that the mean wind speed and radiation are similar in the easterly and
westerly wind classes). The mean wind speed in the easterly and westerly wind classes was 11.2 and 9.5
knots, respectively. The mean global radiation (for the >120 Wm-2 classes) was 492 and 396 Wm-2 for the
easterly and westerly wind direction classes, respectively. Therefore, temperature and global radiation
conditions appear not to have been substantially different between the two wind direction classes.
4. Aspirated screen temperature measurements
During summer 2014, eight aspirated-screen-housed PRTs were added to the trial apparatus, as described in
section 2. The aspirated screens were pole mounted, with two screens per pole. Poles were sited 0.6 m to the
south of each Stevenson screen, with one aspirated screen located at 0.5 m, and the other at 1.25 m above
ground level (Figures 2 and 3). Data were collected over the period 29 August – 29 September 2014. The
aspirated screen temperature measurements provide another independent measurement of temperature near the
concrete. Furthermore, the design of the screens is such that the effects of reflected radiation should be
minimised. Consequently, in comparison to the Stevenson screen temperatures, warm bias observed in
temperatures measured in the aspirated screens is more likely to be associated with thermal effects, and less
likely to be associated with differences in reflected radiation between grass and concrete surfaces. Any
thermal effects would be expected to be larger in the screens mounted at 0.50 m, given their closer proximity
to the concrete surface.
Figure 12 shows differences in aspirated screen temperature, relative to C1 (located west of the
concrete pathway), for different global radiation intensities (compare with Figure 6, which is an identical plot
for Stevenson screen temperature differences). The nocturnal gradient in temperatures apparent in the
Stevenson screen temperatures is also evident in the aspirated screen measurements, with lower temperatures
to the east (for example, at 1.25 m, C3 is 0.036 °C colder than C1, and C4 is 0.076 °C colder than C1, for
global radiation < -3 Wm-2). The same pattern is evident in the 0.50 m above ground level temperatures, but
with larger differences; the respective differences for C3 and C4 are 0.085 and 0.146 °C (again, colder to the
east). Even at 1.25 m, nocturnal differences in the aspirated screen temperatures are larger than those in the
Stevenson screen temperatures.
For sensors located at 1.25 m, as global radiation intensity increases, a warm bias becomes apparent in
C2, as was found for R4 (C2 and R4 are both located in the middle of the concrete pathway; c.f. Figure 6).
Under the highest global radiation intensities observed (>800 Wm-2) C2 was, on average, 0.027 °C warmer
than C1. As for the Stevenson screen temperatures, the aspirated screen temperature east of the concrete (C3)
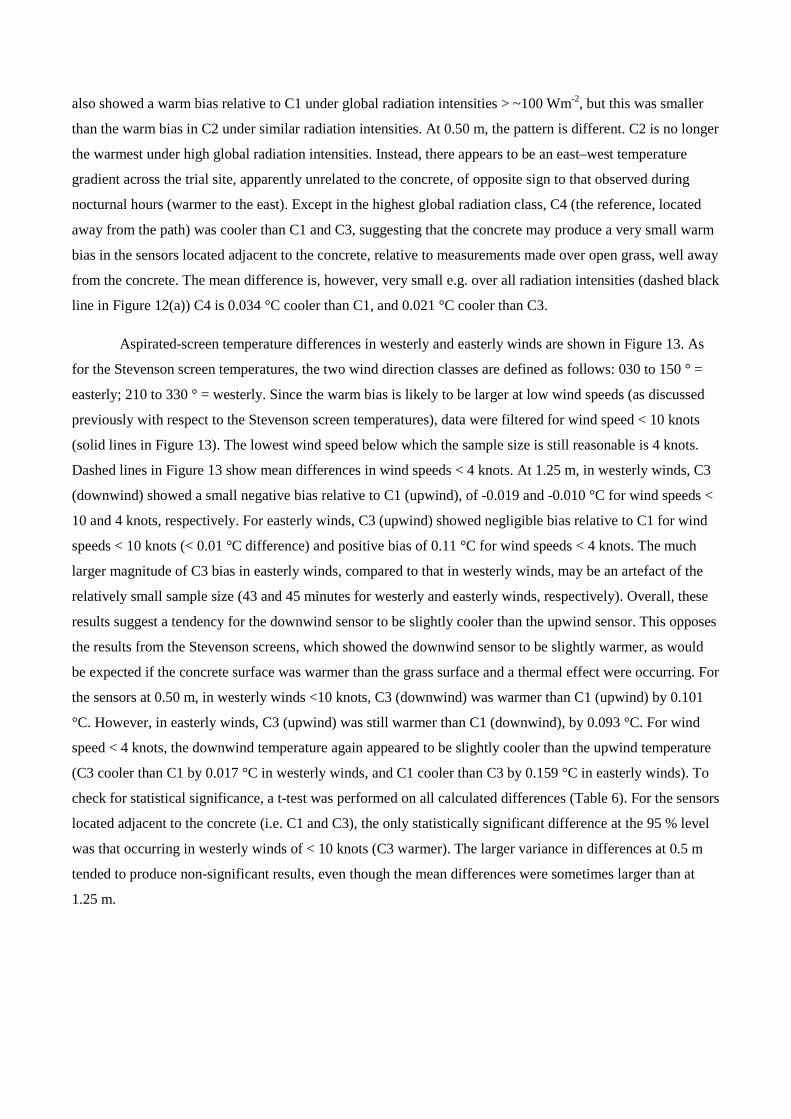
also showed a warm bias relative to C1 under global radiation intensities > ~100 Wm-2, but this was smaller
than the warm bias in C2 under similar radiation intensities. At 0.50 m, the pattern is different. C2 is no longer
the warmest under high global radiation intensities. Instead, there appears to be an east–west temperature
gradient across the trial site, apparently unrelated to the concrete, of opposite sign to that observed during
nocturnal hours (warmer to the east). Except in the highest global radiation class, C4 (the reference, located
away from the path) was cooler than C1 and C3, suggesting that the concrete may produce a very small warm
bias in the sensors located adjacent to the concrete, relative to measurements made over open grass, well away
from the concrete. The mean difference is, however, very small e.g. over all radiation intensities (dashed black
line in Figure 12(a)) C4 is 0.034 °C cooler than C1, and 0.021 °C cooler than C3.
Aspirated-screen temperature differences in westerly and easterly winds are shown in Figure 13. As
for the Stevenson screen temperatures, the two wind direction classes are defined as follows: 030 to 150 ° =
easterly; 210 to 330 ° = westerly. Since the warm bias is likely to be larger at low wind speeds (as discussed
previously with respect to the Stevenson screen temperatures), data were filtered for wind speed < 10 knots
(solid lines in Figure 13). The lowest wind speed below which the sample size is still reasonable is 4 knots.
Dashed lines in Figure 13 show mean differences in wind speeds < 4 knots. At 1.25 m, in westerly winds, C3
(downwind) showed a small negative bias relative to C1 (upwind), of -0.019 and -0.010 °C for wind speeds <
10 and 4 knots, respectively. For easterly winds, C3 (upwind) showed negligible bias relative to C1 for wind
speeds < 10 knots (< 0.01 °C difference) and positive bias of 0.11 °C for wind speeds < 4 knots. The much
larger magnitude of C3 bias in easterly winds, compared to that in westerly winds, may be an artefact of the
relatively small sample size (43 and 45 minutes for westerly and easterly winds, respectively). Overall, these
results suggest a tendency for the downwind sensor to be slightly cooler than the upwind sensor. This opposes
the results from the Stevenson screens, which showed the downwind sensor to be slightly warmer, as would
be expected if the concrete surface was warmer than the grass surface and a thermal effect were occurring. For
the sensors at 0.50 m, in westerly winds <10 knots, C3 (downwind) was warmer than C1 (upwind) by 0.101
°C. However, in easterly winds, C3 (upwind) was still warmer than C1 (downwind), by 0.093 °C. For wind
speed < 4 knots, the downwind temperature again appeared to be slightly cooler than the upwind temperature
(C3 cooler than C1 by 0.017 °C in westerly winds, and C1 cooler than C3 by 0.159 °C in easterly winds). To
check for statistical significance, a t-test was performed on all calculated differences (Table 6). For the sensors
located adjacent to the concrete (i.e. C1 and C3), the only statistically significant difference at the 95 % level
was that occurring in westerly winds of < 10 knots (C3 warmer). The larger variance in differences at 0.5 m
tended to produce non-significant results, even though the mean differences were sometimes larger than at
1.25 m.
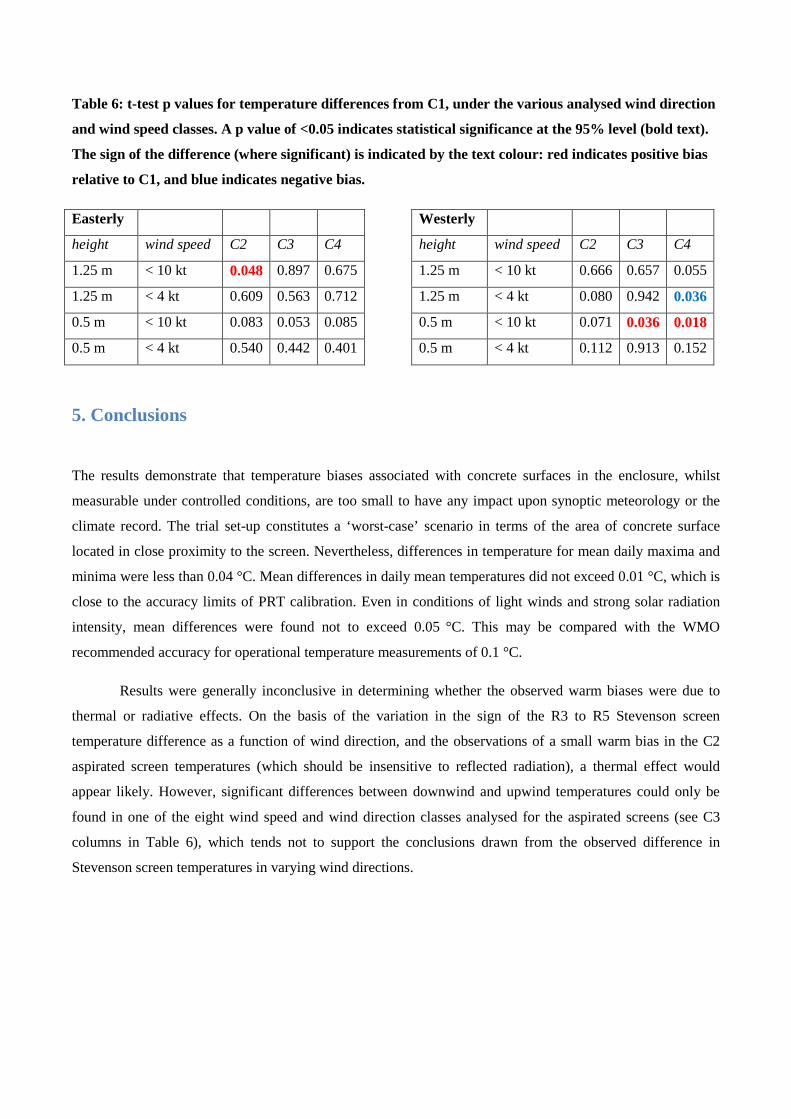
Table 6: t-test p values for temperature differences from C1, under the various analysed wind direction
and wind speed classes. A p value of <0.05 indicates statistical significance at the 95% level (bold text).
The sign of the difference (where significant) is indicated by the text colour: red indicates positive bias
relative to C1, and blue indicates negative bias.
Easterly Westerly
height wind speed C2 C3 C4 height wind speed C2 C3 C4
1.25 m < 10 kt 0.048 0.897 0.675 1.25 m < 10 kt 0.666 0.657 0.055
1.25 m < 4 kt 0.609 0.563 0.712 1.25 m < 4 kt 0.080 0.942 0.036
0.5 m < 10 kt 0.083 0.053 0.085 0.5 m < 10 kt 0.071 0.036 0.018
0.5 m < 4 kt 0.540 0.442 0.401 0.5 m < 4 kt 0.112 0.913 0.152
5. Conclusions
The results demonstrate that temperature biases associated with concrete surfaces in the enclosure, whilst
measurable under controlled conditions, are too small to have any impact upon synoptic meteorology or the
climate record. The trial set-up constitutes a ‘worst-case’ scenario in terms of the area of concrete surface
located in close proximity to the screen. Nevertheless, differences in temperature for mean daily maxima and
minima were less than 0.04 °C. Mean differences in daily mean temperatures did not exceed 0.01 °C, which is
close to the accuracy limits of PRT calibration. Even in conditions of light winds and strong solar radiation
intensity, mean differences were found not to exceed 0.05 °C. This may be compared with the WMO
recommended accuracy for operational temperature measurements of 0.1 °C.
Results were generally inconclusive in determining whether the observed warm biases were due to
thermal or radiative effects. On the basis of the variation in the sign of the R3 to R5 Stevenson screen
temperature difference as a function of wind direction, and the observations of a small warm bias in the C2
aspirated screen temperatures (which should be insensitive to reflected radiation), a thermal effect would
appear likely. However, significant differences between downwind and upwind temperatures could only be
found in one of the eight wind speed and wind direction classes analysed for the aspirated screens (see C3
columns in Table 6), which tends not to support the conclusions drawn from the observed difference in
Stevenson screen temperatures in varying wind directions.

References
Clark, M.R., Lee D.S., Legg T.P. 2013. A Comparison of Screen Temperature as Measured by two Met Office
Observing Systems. International Journal of Climatology. In Press.
Harrison, R.G. 2011. Lag-time effects on a naturally ventilated large thermometer screen. Quarterly Journal
of the Royal Meteorological Society. 137:402-408.
Sun, B., Baker, C.B., Karl, T.R., Gifford, M.D. 2005. A Comparative Study of ASOS and USCRN
Temperature Measurements. Journal of Atmospheric and Oceanic Technology. 22: 679-686.

Figures
Figure 1: Trial set-up at Camborne, 2013
summer 2014 only. Grey squares indicate
Inset panel shows location of the trial site (red box) within the wider Camborne site. Black areas indicate
buildings, and grey areas are asphalt or concrete surfaces.
up at Camborne, 2013 – 2014. Note that the eight pole-mounted sensors were set
summer 2014 only. Grey squares indicate concrete slabs, with the remainder of the surface g
location of the trial site (red box) within the wider Camborne site. Black areas indicate
buildings, and grey areas are asphalt or concrete surfaces.
mounted sensors were set-up for
concrete slabs, with the remainder of the surface grass-covered.
location of the trial site (red box) within the wider Camborne site. Black areas indicate
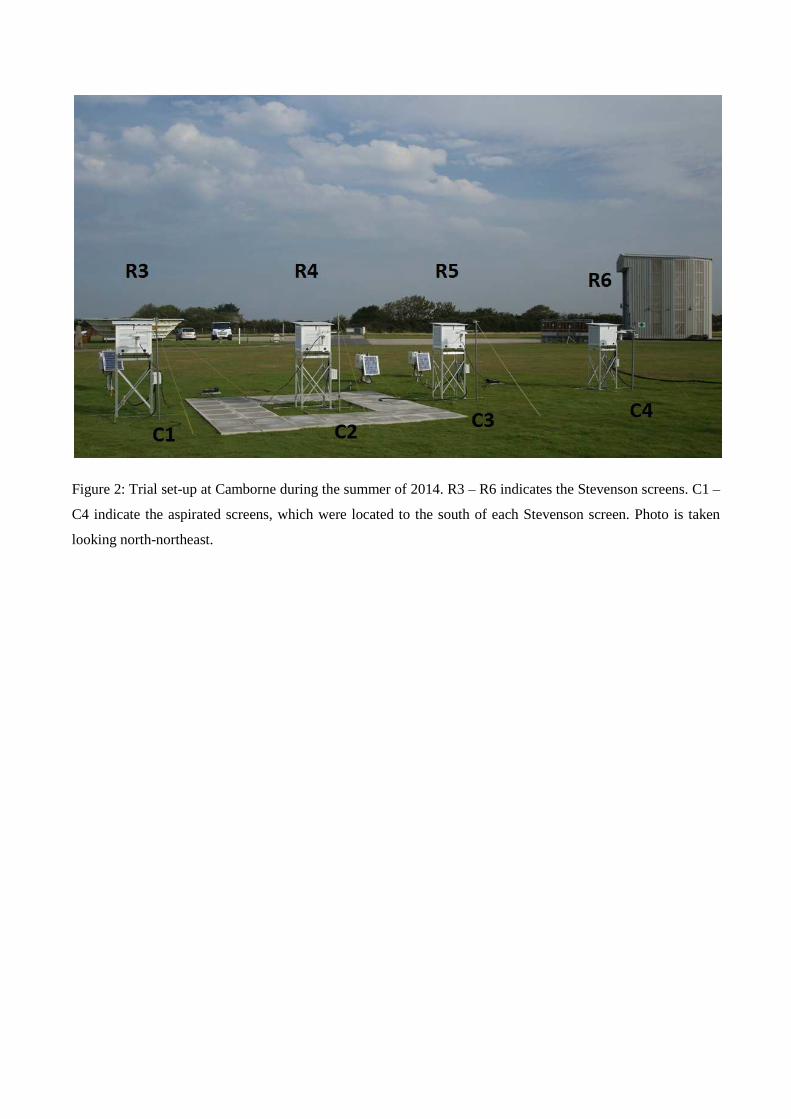
Figure 2: Trial set-up at Camborne during the summer of 2014. R3
C4 indicate the aspirated screens, which were located to the south of each Stevenson screen. Photo is taken
looking north-northeast.
up at Camborne during the summer of 2014. R3 – R6 indicates the Stevenson screens. C1
C4 indicate the aspirated screens, which were located to the south of each Stevenson screen. Photo is taken
R6 indicates the Stevenson screens. C1 –
C4 indicate the aspirated screens, which were located to the south of each Stevenson screen. Photo is taken

Figure 3: A closer view of one of the aspirated screens (highlighted by the red rectangle), situated to the south
of the corresponding Stevenson screen.
e of the aspirated screens (highlighted by the red rectangle), situated to the south
of the corresponding Stevenson screen.
e of the aspirated screens (highlighted by the red rectangle), situated to the south

Figure 4: Performing the zero check on the PRT housed within Stevenson screen R6.
Figure 5: Differences in daily maximum, minimum and mean temperatures, relative to R3, for the period April
to June 2014.
-0.04
-0.02
-1E-16
0.02
0.04
0.06
0.08
0.1
3 4 5 6
Te
mp
era
ture
Dif
fere
nce
/ 0
C
Screen
Max Mean Min

Figure 6: Mean temperature differences for R4 and R5, relative to R3, as a function of global radiation
intensity, April to June 2014.
Figure 7: Standard deviation of the mean temperature difference between R3 and R4 (blue) and R3 and R5
(red), April to June 2014.
-0.025
-0.02
-0.015
-0.01
-0.005
4E-17
0.005
0.01
0.015
0.02
3 4 5
Te
mp
era
ture
Dif
fere
nce
/ o
C
Screen
Less than 0 (38783) 0 - 100 (21544) 100 - 200 (10119) 200 - 300 (8520)
300 - 400 (7010) 400 - 500 (5396) 500 - 600 (4437) 600 - 700 (3866)
700 - 800 (4174) 800 - 900 (4391) 900 - 1000 (2778) 1000 - 1100 (592)
1100 - 1200 (80)
0
0.001
0.002
0.003
0.004
0.005
0.006
0.007
0.008
0.009
-100 0 100 200 300 400 500 600 700 800 900 1000 1100 1200
Sta
nd
ard
De
via
tio
n o
f M
ea
n T
em
pe
ratu
re D
iffe
ren
ce /
oC
Global Radiation / Wm-2
Standard Deviation of the Mean Temperature Difference from R3 for R4
Standard Deviation of the Mean Temperatue Difference from R3 for R5

Figure 8: Mean temperature bias from R3 for R4 and R5 for different wind speed categories for April to June
2014. Sample size is given by numbers in parentheses in the figure legend.
Figure 9: Mean temperature bias for R4 in comparison to R3 as a function of radiation category (x-axis) and
wind speed category (coloured bars in each category), April to June 2014.
-0.01
0
0.01
0.02
0.03
0.04
0.05
3 4 5
Te
mp
era
ture
Dif
fere
nce
/ o
C
Screen
Less than 0.5 knots (42) 0.5 - 10 knots (28566)
10 - 20 knots (19684) Greater than 20 knots (911)
-0.02
-0.015
-0.01
-0.005
3E-17
0.005
0.01
0.015
0.02
0.025
0.03
0.035
Te
mp
era
ture
Dif
fere
nce
/ 0
C
Radiation Category / Wm-2
< 0.5 knots 0.5 - 10 knots 10 - 20 knots > 20 knots

Figure 10: Mean temperature bias in R5 in comparison to R3 as a function of radiation category (x-axis) and
wind speed category (coloured bars in each category), April to June 2014.
Figure 11: Temperature bias in R4 and R5, relative to R3, for westerly and easterly winds under all daytime
conditions (assumed to be where global radiation >120 Wm-2), and for global radiation >1000 Wm-2, April to
June 2014.
-0.025
-0.02
-0.015
-0.01
-0.005
5E-17
0.005
0.01
0.015
0.02
0.025
0.03
0.035
Te
mp
era
ture
Dif
fere
nce
/ 0
C
Radiation Category / Wm-2
< 0.5 knots 0.5 - 10 knots 10 - 20 knots > 20 knots
-0.025
-0.02
-0.015
-0.01
-0.005
0
0.005
0.01
0.015
0.02
3 4 5
Te
mp
era
ture
Dif
fere
nce
/ o
C
Screen
Westerly Easterly Westerly (GR > 1000Wm-2) Easterly (GR > 1000Wm-2)

Figure 12: Aspirated-screen temperature differences, relative to screen 1 (westernmost), under different
intensities of global radiation (see key). (a) Sensors mounted at 1.25 m, and (b) sensors mounted at 0.50 m
above ground level. Note y axis scales differ in (a) and (b).

Figure 13: Mean aspirated screen temperature differences (relative to C1) under easterly and westerly winds,
for wind speeds < 10 knots (solid lines) and < 4 knots (dashed lines). (a) Sensors mounted at 1.25 m above
ground level. (b) Sensors mounted at 0.50 m above ground level.