investigating the value of section scores for the toefl ...origin- · pdf filei abstract this...
TRANSCRIPT

TOEFL iBT® Research Report TOEFL iBT–21
Investigating the Value of Section Scores for the TOEFL iBT® Test
Yasuyo Sawaki
Sandip Sinharay
December 2013

Investigating the Value of Section Scores for the TOEFL iBT ® Test
Yasuyo Sawaki
Waseda University Tokyo, Japan
Sandip Sinharay1
Educational Testing Service, Princeton, New Jersey
RR-13-35

ETS is an Equal Opportunity/Affirmative Action Employer.
As part of its educational and social mission and in fulfilling the organization's non-profit Charter and Bylaws, ETS has and continues to learn from and also to lead research that furthers educational and measurement research to advance quality and equity in education and assessment for all users of the organization's products and services.
Copyright © 2013 by ETS. All rights reserved.
No part of this report may be reproduced or transmitted in any form or by any means, electronic or mechanical, including photocopy, recording, or any information storage and retrieval system, without permission in writing from the publisher. Violators will be prosecuted in accordance with both U.S. and international copyright laws.
ETS, the ETS logos, GRADUATE RECORD EXAMINATIONS, GRE, LISTENING. LEARNING. LEADING., TOEFL, TOEFL IBT, and the TOEFL logo are registered trademarks of Educational Testing Service (ETS).
COLLEGE BOARD is a registered trademark of the College Entrance Examination Board.

i
Abstract
This study investigates the value of reporting the reading, listening, speaking, and writing section
scores for the TOEFL iBT® test, focusing on 4 related aspects of the psychometric quality of the
TOEFL iBT section scores: reliability of the section scores, dimensionality of the test, presence
of distinct score profiles, and the section scores’ generalizability for norm-referenced decisions
as well as the dependability of criterion-referenced decisions for international student admission.
Four operational TOEFL iBT test forms were analyzed for all examinees as well as for 3 native
language (L1) groups (Arabic, Korean, and Spanish).
Haberman’s (2008) subscore analysis suggested that the speaking section score had
added value due to its relative distinctness from the other modalities. Consistent with the
subscore analysis results, a series of exploratory factor analyses (EFAs) indicated the possibility
of the presence of 2 correlated factors—a reading/listening/writing factor and a speaking factor.
In contrast, the CFAs conducted separately for the 3 L1 groups as well as a multiple-group
confirmatory factor analyses (CFAs) identified a correlated 4-factor model with reading,
listening, speaking, and writing factors as the best representation of the structure of the entire test
for all examinees as well as for the 3 L1 groups. Reliability of the observed section scores for
norm-referenced score interpretations and the dependability of classification decisions made
based on different cut scores were generally satisfactory while they were also found to be
relatively low in some circumstances. Based on the mixed results concerning the value-added
information the TOEFL iBT section scores provide, recommendations for future research
directions and some key issues of consideration for high-stakes decision making based on the
section scores were summarized.
Key words: dependability, dimensionality, factor analysis, generalizability theory, reliability,
score profile, subscore analysis

ii
TOEFL® was developed in 1963 by the National Council on the Testing of English as a Foreign Language. The Council was formed through the cooperative effort of more than 30 public and private organizations concerned with testing the English proficiency of nonnative speakers of the language applying for admission to institutions in the United States. In 1965, Educational Testing Service (ETS) and the College Board® assumed joint responsibility for the program. In 1973, a cooperative arrangement for the operation of the program was entered into by ETS, the College Board, and the Graduate Record Examinations® (GRE®) Board. The membership of the College Board is composed of schools, colleges, school systems, and educational associations; GRE Board members are associated with graduate education. The test is now wholly owned and operated by ETS.
ETS administers the TOEFL program under the general direction of a policy board that was established by, and is affiliated with, the sponsoring organizations. Members of the TOEFL Board (previously the Policy Council) represent the College Board, the GRE Board, and such institutions and agencies as graduate schools of business, two-year colleges, and nonprofit educational exchange agencies.
Since its inception in 1963, the TOEFL has evolved from a paper-based test to a computer-based test and, in 2005, to an Internet-based test, TOEFL iBT®. One constant throughout this evolution has been a continuing program of research related to the TOEFL test. From 1977 to 2005, nearly 100 research and technical reports on the early versions of TOEFL were published. In 1997, a monograph series that laid the groundwork for the development of TOEFL iBT was launched. With the release of TOEFL iBT, a TOEFL iBT report series has been introduced.
Currently this research is carried out in consultation with the TOEFL Committee of Examiners. Its members include representatives of the TOEFL Board and distinguished English as a second language specialists from the academic community. The Committee advises the TOEFL program about research needs and, through the research subcommittee, solicits, reviews, and approves proposals for funding and reports for publication. Members of the Committee of Examiners serve four-year terms at the invitation of the Board; the chair of the committee serves on the Board.
Current (2012-2013) members of the TOEFL Committee of Examiners are:
John M. Norris - Chair Georgetown University Maureen Burke The University of Iowa Yuko Goto Butler University of Pennsylvania Barbara Hoekje Drexel University Ari Huhta University of Jyväskylä, Finland Eunice Eunhee Jang University of Toronto, Canada James Purpura Teachers College, Columbia University John Read The University of Auckland, New Zealand Carsten Roever The University of Melbourne, Australia Steve Ross University of Maryland Norbert Schmitt University of Nottingham, UK Ling Shi University of British Columbia, Canada
To obtain more information about the TOEFL programs and services, use one of the following:
E-mail: [email protected] Web site: www.ets.org/toefl

iii
Acknowledgments
This study was funded by the TOEFL® program at ETS. Our special thanks go to Dhanushka
Haputhanthri for preparing data files for this project; Fred Cline for his assistance in preparing
the data sets for the factor analyses; Shelby Haberman for his valuable comments on
methodologies employed in this study and interpretation of the analysis results; and Neil Dorans,
Dan Eignor, Gary Ockey, Todd Rogers, and Steven Ross for their careful reviews of and
constructive suggestions on an earlier version of this report.

iv
Table of Contents
Page
Overview ..........................................................................................................................................1
Value Added by the TOEFL Section Scores ...............................................................................4
Psychometric Dimensionality of the TOEFL iBT Section Scores ..............................................5
Presence/Absence of Distinct Score Profiles Across Modalities .................................................6
Section Score Generalizability for Norm-Referenced Score Interpretations and Dependability
of Decisions Made Based on Predetermined Cut Scores .............................................................6
Method .............................................................................................................................................8
Data ..............................................................................................................................................8
Structure of the Test .....................................................................................................................9
Analyses .....................................................................................................................................11
Results ............................................................................................................................................32
Results From the Classical Test Theory (CTT)-Based Approach of Haberman .......................32
Results From the Factor Analysis ..............................................................................................37
Results From the Cluster Analysis .............................................................................................60
Results From the Generalizability Theory Analysis ..................................................................62
Discussion and Conclusions ..........................................................................................................79
Research Question 1: Do the Section Scores Have Added Value Over the Total Test Score? .80
Research Question 2: Can Distinct Constructs Corresponding to the Four Modalities Be
Identified? ..................................................................................................................................80
Research Question 3: What Different Types of Language Profiles Are Present Across
Modalities Within the TOEFL Population? If Distinct Score Profiles Are Identified, What
Proportion of Students Have Nonflat Score Profiles That Supports the Utility of Score
Profiles Across Modalities? .......................................................................................................81
Research Question 4: Is the Generalizability of Section Scores for Norm-Referenced Score
Interpretations and the Dependability of Decisions Made Based on Predetermined Cut Scores
for TOEFL iBT Section Scores for Criterion-Referenced Score Interpretations Satisfactory
for High-Stakes Contexts? .........................................................................................................81
Generalization Inference ............................................................................................................82
Explanation Inference ................................................................................................................87

v
References ......................................................................................................................................92
Notes .............................................................................................................................................97
List of Appendices .......................................................................................................................100

vi
List of Tables
Page
Table 1 Total and Subgroup Sample Sizes for the TOEFL iBT Test Forms ................................8
Table 2 Means and Standard Deviations for Scaled TOEFL iBT Section and Total Scores ......12
Table 3 Reading and Listening Item Parcels and Speaking and Writing Items Modeled in the
Confirmatory Factor Analysis (CFA) ............................................................................17
Table 4 Results From the Classical Test Theory (CTT)-Based Approach for the April
Test Form .......................................................................................................................33
Table 5 Results From the Classical Test Theory (CTT)-Based Approach for the July Test
Form ...............................................................................................................................34
Table 6 Results From the Classical Test Theory (CTT)-Based Approach for the September
Test Form .......................................................................................................................35
Table 7 Results From the Classical Test Theory (CTT)-Based Approach for the December
Test Form .......................................................................................................................36
Table 8 Ratios of the Eigenvalue of the Last Component Retained to the Average Across the
Eigenvalues for the Remaining Components (for the First 10 Components Only) .......39
Table 9 Confirmatory Factor Analysis (CFA) Testing Results for All Examinees and the
Native Language (L1) Groups (July) .............................................................................42
Table 10 Confirmatory Factor Analysis (CFA) Testing Results for All Examinees and the
Native Language (L1) Groups (September) ...................................................................43
Table 11 Completely Standardized Model Parameter Estimates for the Correlated Four-Factor
Model (July) ...................................................................................................................44
Table 12 Completely Standardized Model Parameter Estimates for the Correlated Four-Factor
Model (September) .........................................................................................................45
Table 13 Estimated Interfactor Correlations for the Correlated Four-Factor Model ....................46
Table 14 Completely Standardized Model Parameter Estimates for the Single-Factor Model
(July) ...............................................................................................................................48
Table 15 Completely Standardized Model Parameter Estimates for the Single-Factor Model
(September) ....................................................................................................................49
Table 16 Completely Standardized Model Parameter Estimates for the Correlated Two-Factor
Model (July) ...................................................................................................................50

vii
Table 17 Completely Standardized Model Parameter Estimates for the Correlated Two-Factor
Model (September) .........................................................................................................51
Table 18 Completely Standardized Model Parameter Estimates for the Higher Order Factor
Model (July) ...................................................................................................................54
Table 19 Completely Standardized Model Parameter Estimates for the Higher Order Factor
Model (September) .........................................................................................................55
Table 20 Loadings of First-Order Factors on the Higher Order Factor ........................................56
Table 21 Tests of Measurement Invariance and Population Heterogeneity of TOEFL iBT
Sections Across Native Language (L1) Groups for the Correlated Four-Factor
Model .............................................................................................................................58
Table 22 Completely Standardized Model Parameter Estimates for the Final Multiple-Group
Models (Correlated Four-Factor Model) ........................................................................59
Table 23 Completely Standardized Model Parameter Estimates for the Final Multiple-Group
Models (Correlated Four-Factor Model) ........................................................................60
Table 24 Reading (Based on D Studies for the Univariate px(I:T) Design With Three Texts
and 13 to 14 Items Associated With Each Text) ............................................................65
Table 25 Listening (Based on D Studies for the Multivariate p● x (I○:T○) Design With
Text Type Fixed, With Two Conversations, Three Lectures, and Five to Six Items
Associated With Each Text) ...........................................................................................69
Table 26 Speaking (Based on D Studies for the Multivariate p● x I○ Design With Task Type
Fixed, With Two Tasks for Each of the Three Task Types) ..........................................73
Table 27 Writing (Based on D Studies for the Univariate p x (R′:T) Design With Two Ratings
and Two Tasks) ..............................................................................................................77
Table 28 One Hundred Times the Conditional Probability That an Examinee Scores Above the
Cut on Form 2 Given That the Examinee Scored Above the Cut on Form 1 ................86

viii
List of Figures
Page
Figure 1. Correlated four-factor model. .........................................................................................20
Figure 2. Single-factor model. .......................................................................................................20
Figure 3. Correlated two-factor model. ..........................................................................................21
Figure 4. Higher order factor model. .............................................................................................21
Figure 5. Scree plot based on the principal component analysis (April). ......................................38
Figure 6. Scree plot based on the principal component analysis (December). ..............................38
Figure 7. The three-cluster solution and the four-cluster solution for the April form for all the
examinees. ......................................................................................................................61
Figure 8. Standardized TOEFL iBT section scores for four random samples of 10 examinees. ...62
Figure 9. Phi-lambda values for different reading cut scores (April). ...........................................65
Figure 10. Phi-lambda values for different reading cut scores (July). ...........................................66
Figure 11. Phi-lambda values for different reading cut scores (September). ................................66
Figure 12. Phi-lambda values for different reading cut scores (December). .................................67
Figure 13. Phi-lambda values for different listening cut scores (April). .......................................70
Figure 14. Phi-lambda values for different listening cut scores (July). .........................................70
Figure 15. Phi-lambda values for different listening cut scores (September). ...............................71
Figure 16. Phi-lambda values for different listening cut scores (December). ...............................71
Figure 17. Phi-lambda values for different speaking cut scores (April). .......................................74
Figure 18. Phi-lambda values for different speaking cut scores (July). .........................................74
Figure 19. Phi-lambda values for different speaking cut scores (September). ..............................75
Figure 20. Phi-lambda values for different speaking cut scores (December). ...............................75
Figure 21. Phi-lambda values for different writing cut scores (April). .........................................78
Figure 22. Phi-lambda values for different writing cut scores (July). ...........................................78
Figure 23. Phi-lambda values for different writing cut scores (September). .................................79
Figure 24. Phi-lambda values for different writing cut scores (December). .................................79

1
Overview
The TOEFL® Internet-based test (TOEFL iBT® test) currently reports four section scores,
corresponding to the reading, listening, speaking, and writing modalities, along with a total
score. Although the TOEFL iBT total score offers a measure of general academic English
language ability, the section scores are intended to provide more fine-grained information about
candidates’ language abilities specific to each modality. The TOEFL iBT section scores are used
alone or in combination with the TOEFL iBT total score for making various types of high-stakes
decisions about candidates, such as international student admission to undergraduate and
graduate degree programs. As of December 2008, 57 undergraduate and 72
graduate/postgraduate programs had reported their TOEFL iBT score requirements for
international student admission to ETS.2 Among the 57 undergraduate programs, 18 reported
score requirements for the TOEFL iBT total score with those for all four sections (12 programs),
for the writing section only (five programs), or for the writing and speaking sections (one
program). Similarly, 24 of the 72 graduate/postgraduate programs reported their TOEFL iBT
total score requirements along with those for all four sections: for the writing section only (two
programs), for the speaking section only (one program), for the speaking and writing sections
(three programs), or for the listening and speaking sections (one program). TOEFL iBT scores
are often used for screening candidates to be international teaching assistants (ITAs) as well. In
this case, the TOEFL iBT Speaking section score is typically employed to determine whether
candidates have a sufficient level of English speaking ability to provide instruction in English.
The TOEFL iBT Speaking section score may be used in conjunction with other measures, such
as those developed by institutions to assess teaching skills, in order to determine whether to
award a teaching assistantship to an international student (Xi, 2007b).
English language demands are expected to vary across different institutions depending on
factors such as the field of study, the characteristics of language demands in a particular
program, and the extent to which English language support is available to admitted students.
Thus, intuitively, it makes sense to employ one or more TOEFL iBT section scores alone or in
combination with the TOEFL iBT total score, so that the measures of academic English language
ability required for decision making about international students correspond closely to the nature
of language-use tasks in a specific target-language use domain (Bachman & Palmer, 1996) of
interest. When one uses TOEFL iBT section scores for high-stakes decision making about

2
candidates, the claim one intends to make is that the TOEFL iBT section scores serve as
appropriate and accurate measures of academic English language ability for specific modalities
of interest. However, adequately supporting this claim requires a systematic investigation of
various types of validity evidence. Because a test section is shorter than the entire test, the extent
to which a given section score maintains the level of reliability that is acceptable for high-stakes
decision making often becomes a point of concern. Moreover, empirical validity evidence
obtained for an entire test does not automatically generalize to a given test section. Likewise,
even when empirical validity evidence suggests that a set of subscores is functioning
appropriately for high-stakes decision making for the entire test-taker population, the same does
not necessarily hold for subgroups that have different linguistic, cultural, and educational
backgrounds. Reporting scores that are not reliable or valid would lead to inaccuracies of
decisions made about candidates, which could in turn result in unwanted consequences.
Given the discussion above, examining the appropriateness of reporting section scores for
a test requires a systematic investigation of the functioning of different section scores for the
total examinee population as well as different subgroups of interest. Standard 5.12 of the
Standards for Educational and Psychological Testing (American Educational Research
Association, American Psychological Association, & National Council on Measurment in
Education, 1999) states, “Scores should not be reported for individuals unless the validity,
comparability, and reliability of such scores have been established” (p. 65). Furthermore,
Standard 1.12 of the same document demands that if a test provides more than one score, the
distinctiveness of the separate scores should be demonstrated.
Addressing these issues related to reporting the section scores is an integrative part of
building a validity argument for the TOEFL iBT. Chapelle, Enright, and Jamieson (2008)
proposed an argument-based approach to building interpretive and validity arguments for the
TOEFL test. Chapelle et al.’s approach built primarily on Kane and his associates’ (Kane, 2004;
Kane, Crooks, & Cohen, 1999) and Bachman’s (2005) frameworks for developing interpretive
and validity arguments for test score interpretation and use based on Toulmin’s (2003) theory of
practical reasoning. On the one hand, developing an interpretive argument or a concept map of
how one might go about building an argument for an intended test score interpretation and use is
part of a test design process (Kane, 2004). On the other hand, building a validity argument refers
to the process of systematically gathering empirical data required to examine the degree to which

3
claims stated in the interpretive argument are justified as test data become available. In their
framework, Chapelle et al. proposed the six inferences below that should be supported to
demonstrate the usefulness of the TOEFL iBT for candidate selection and curriculum decision
making in academic settings:
1. Domain description: the degree to which the test design reflects characteristics of
language use tasks that examinees are likely to encounter in the academic domain.
2. Evaluation: the degree to which scores obtained from the test are appropriate for
assessing aspects of language ability relevant to academic work.
3. Generalization: the degree to which observed test scores offer consistent estimates of
examinees’ academic English language ability.
4. Explanation: the degree to which scores obtained from the test are reflective of
constructs of language ability relevant to academic work.
5. Extrapolation: the degree to which examinees’ test performances are related to their
linguistic performances in academic settings.
6. Utilization: the degree to which the test is useful for score users to make examinee
admission and curriculum decisions.
Chapelle et al.’s (2008) interpretive argument for the TOEFL comprises six reasoning
models corresponding to the preceding six inferences. The process of examining the inferences is
conceptualized as sequential, so that supporting the first inference in the model (domain
description) serves as a bridge for moving onto examining the next inference (evaluation), and
so on.3 Each reasoning model has the same basic structure. Its main component is a claim that
one intends to make about a candidate based on grounds, namely data or observed language
performance of the candidate. The model also specifies warrants (statements that support the
claim) and rebuttals (statements that weaken the claim). Various pieces of evidence that serve as
backing for the warrants and those that support the rebuttal are identified as well. Then, by
carefully weighing the backing against the rebuttals based on empirical evidence and theoretical
analyses obtained as part of test validation, the investigator evaluates the extent to which the
original claim can be supported based on empirical and substantive grounds.

4
The feasibility of the TOEFL interpretive argument was examined in a wide range of
research studies conducted during the test design, development, and piloting stages of the test, as
described in Chapelle et al.’s (2008) volume. Based on a series of relevant studies conducted as
part of the TOEFL iBT development process cited in the same volume, Chapelle (2008)
concluded, “TOEFL scores are valid for making decisions about the test takers’ language
readiness for academic study at English-medium universities” (p. 320). However, further
investigations into various aspects of the validity of the TOEFL iBT score must continue. As
Chapelle points out, the previous studies were “confirmationist” (p. 320) in nature because they
were conducted to provide support for the test design. Thus, it is essential to conduct the second
stage of studies in order to examine the extent to which the conclusions obtained in the initial
studies can be supported with operational data to strengthen the validity argument.
This study is one of the first investigations of the psychometric quality of the TOEFL iBT
section scores based on data from operational administrations of the TOEFL iBT. A series of
section score analyses was conducted for all examinees as well as three native language (L1)
groups having high TOEFL test volumes (Arabic, Korean, and Spanish) for multiple TOEFL iBT
forms. Thus, this study provides empirical evidence concerning the replicability of study findings
across different forms and subgroups when multiple analytic approaches are combined within a
single study. Its primary goal is to address two of the six inferences included in Chapelle et al.’s
(2008) TOEFL interpretive and validity arguments, generalization and explanation.
Value Added by the TOEFL Section Scores
Reporting a section score is often based on the assumption that the section score provides
value-added information about candidates’ language abilities over and above the information a
total test score can offer (or, in other words, a section score is a more accurate measure than the
total test score of the construct the section intends to measure). Haberman (2008) suggested an
approach based on classical test theory (CTT) to determine whether (subscores or) section scores
have added value over the total score. In this approach, reliability and correlations among a set of
section scores of interest play a key role. A section score has added value if it is both reliable and
distinct from the other section scores.4 Thus, Haberman’s CTT-based subscore analysis evaluates
the value of the information obtained from the TOEFL iBT section scores, based on a
combination of information relevant to Standard 1.12 as well as Chapelle et al.’s (2008)
generalization and explanation inferences. Sinharay (2010) applied the method of Haberman to

5
data from 25 operational tests other than TOEFL and concluded that several operationally
reported subscores and section scores did not have added value.
Psychometric Dimensionality of the TOEFL iBT Section Scores
The second issue that is critical in examining the feasibility of reporting the section
scores is the psychometric dimensionality of the test, which is often addressed by examining the
underlying factor structure of the test. This issue pertains to the distinctness of the section scores
stated in the explanation inference. Conceptually, the rationale for devising four sections in the
test is to ensure construct representation by designing each section to assess different aspects of
academic language ability. Psychometrically, because reporting separate section scores is based
on the assumption that they serve as measures of distinct constructs, multidimensionality of the
TOEFL iBT needs to be supported. Psychometric dimensionality of TOEFL iBT has been
investigated in a few previous factor analyses of the test. All of these investigations have
generally supported the presence of more than one psychometrically distinct construct in the
TOEFL iBT, but the actual numbers and makeup of distinct factors identified differed across the
studies. Stricker, Rock, and Lee (2005) investigated the factor structure of a prototype of TOEFL
iBT. In their confirmatory factor analysis (CFA) using item parcels, they identified two
correlated factors, one for a fusion of reading, listening, and writing sections and the other for the
speaking section. Sawaki, Stricker, and Oranje (2008) conducted an item-level factor analysis of
a TOEFL iBT field study test form. In this study a higher order factor model with a general
factor for English as a second language or English as a foreign language (ESL/EFL) ability and
four first-order factors corresponding to the four modalities were identified. Stricker and Rock
(2008) conducted another factor analysis of the same field study test form, this time by modeling
item parcels. They identified the higher order factor structure as well.
A common finding across these studies is the relatively independent nature of the speaking
section, which Stricker et al. (2005) explained in terms of the relative lack of attention to oral
communication skills in ESL instruction. Meanwhile, the results supporting the distinctiveness of
the constructs assessed in the reading, listening, and writing sections are mixed. Many issues
might have contributed to the difference of the findings between the Stricker et al. study versus
Sawaki et al. (2008) and Stricker and Rock (2008) on this issue. One potential reason has to do
with the differences in the test design. In the TOEFL iBT prototype analyzed by Stricker et al.,
the same reading and listening texts that appeared in the reading and listening sections were used

6
as the source texts for the integrated tasks in the writing and speaking sections. In contrast, the
dependencies across the sections were removed in the field test form analyzed by Sawaki et al.
and Stricker and Rock as well as in operational TOEFL iBT test forms.
Presence/Absence of Distinct Score Profiles Across Modalities
An issue closely related to the psychometric dimensionality of the TOEFL iBT sections
discussed above is the extent to which distinct language profiles can be identified across the four
modalities. This issue is a reflection of the psychometric dimensionality of the TOEFL iBT.
Analytic approaches such as cluster analysis can be used to find such score profiles—such
analyses provide secondary, additional evidence addressing the explanation inference. If distinct
score profiles are indeed present among the TOEFL population, then TOEFL iBT section scores
can offer useful language profiles for identifying relative strengths and weaknesses of individual
candidates. A challenge in identifying distinct score profiles for the TOEFL iBT is the nature of
the target construct, however. The current consensus in the field of language assessment is that
different aspects of second language ability are highly correlated, which often leads to
difficulties in extracting distinct scoring patterns across different measures. This case is
particularly noted when attempts are made to extract score profiles within a single modality from
a test that is constructed to be unidimensional for reporting a single score. As pointed out by
Luecht, Gierl, Tan, and Huff (2006), psychometric unidimensionality makes it difficult to
identify distinct, nonflat profiles (i.e., score profiles that suggest strength or weakness at least in
one area). For example, Lee and Sawaki (2009) and Xi (2007a) reported that a majority of
TOEFL test takers had flat profiles across different subscores within each of the reading,
listening, and speaking modalities, suggesting the limited utility of language score profiles
extracted from their TOEFL test performance data within modality. However, given the previous
factor analysis studies above that provide some support for the multidimensionality of the
TOEFL iBT across the four modalities, it might be possible to identify a relatively larger number
of candidates with distinct nonflat profiles across modalities than within modalities.
Section Score Generalizability for Norm-Referenced Score Interpretations and
Dependability of Decisions Made Based on Predetermined Cut Scores
As mentioned above, score user institutions often set cut scores for TOEFL iBT section
scores for making high-stakes decisions about candidates. When such cut scores are strictly

7
followed for making decisions about examinees, the score user’s interest lies mainly in a
criterion-referenced interpretation of test scores. That is, the primary purpose of the test use in
this case is to classify examinees into different categories based on test performance levels (e.g.,
pass vs. fail) rather than simply rank-order them. An important issue in this situation is to
examine the extent to which classification decisions made based on a predetermined cut score are
dependable. It should be noted, however, that the criterion-referenced test score interpretation
above may be combined with norm-referenced score interpretation in practice. For example,
when there is an insufficient number of candidates applying for a program satisfying the TOEFL
score requirements, the institution may decide to secure a set number of candidates by admitting
additional candidates based on rank ordering. The same may apply to cases where there are too
many candidates with TOEFL scores above a preset cut score and therefore only a limited
number of candidates out of the pool can be admitted. Thus, in order to build the TOEFL validity
argument further, it is essential to obtain sufficient empirical evidence relevant to the
generalization inference that supports the consistency of measurement for both the norm-
referenced and criterion-referenced score interpretations. In the context of TOEFL iBT, results of
previous studies on the reliability and generalizability of TOEFL iBT section scores conducted
as part of the test development process (e.g., Lee, 2005; Lee & Kantor, 2005; Wang, Eignor, &
Enright, 2008) offer favorable evidence for the reliability and generalizability of the measures for
norm-referenced score interpretations. However, it is fair to say that relatively little is currently
understood about the dependability of decisions made based on predetermined cut scores set for
the different TOEFL iBT section scores in support of a criterion-referenced score interpretation.
The only study relevant to this issue is Xi’s (2007b) examination of the relationship between
different cut scores on the TOEFL iBT Speaking section for ITA screening and the rate of
candidate misclassification by using a receiver operating characteristics (ROC) curve method.
As can be seen in the discussion above, some empirical evidence that informs the
psychometric quality of the TOEFL iBT section scores useful for building a validity argument is
currently available. However, several of the above mentioned investigations were done prior to
the implementation of the TOEFL iBT for operational use. Moreover, some of the analyses were
conducted neither for multiple test forms nor for different subgroups. These methods were not
run or compared on the same data sets either. Thus, in keeping with Chapelle’s (2008)
suggestion to revisit issues examined in previous studies for building a validity argument for

8
using TOEFL iBT section scores for high-stakes decision making, the present study addressed
the four research questions below:
1. Do the TOEFL iBT section scores provide added value over the total test score?
2. Can four constructs corresponding to the four modalities be identified across the
sections?
3. What different types of language profiles are present across modalities within the
TOEFL population? If distinct score profiles are identified, what proportion of
students have nonflat score profiles that support the utility of score profiles across
modalities?
4. Is the generalizability of section scores for norm-referenced score interpretations
and the dependability of decisions made based on predetermined cut scores for
TOEFL iBT section scores for criterion-referenced score interpretations
satisfactory for high-stakes contexts?
Method
Data
Examinee item-level response data on four operational TOEFL iBT forms administered in
2007 (April, July, September, and December forms) were analyzed. Usable data were available
for 14,495 examinees for April; 13,003 examinees for July; 14,185 examinees for September;
and 8,710 examinees for December. Table 1 summarizes the sample sizes for all examinees and
three major L1 groups (Arabic, Korean, and Spanish) used for the subsequent analyses.
Table 1
Total and Subgroup Sample Sizes for the TOEFL iBT Test Forms
Group April July September December n L1 % n L1 % n L1 % n L1 %
All 14,495 13,003 14,185 8,710 Arabic 1,363 9.4 1,236 9.5 1,207 8.5 705 8.1 Korean 2,577 17.8 2,537 19.5 1,194 8.4 523 6.0 Spanish 1,032 7.1 722 5.6 699 4.9 659 7.6
Note. % = the percentage of the L1 (native language) group (Arabic, Korean, or Spanish) on a
given form.

9
Demographic background of the examinees was examined based on their responses to the
background information questions (BIQs) that they completed at the time of test administration.
According to the BIQs data, six major L1 groups (Arabic, Chinese, French, Japanese, Korean,
and Spanish) accounted for 34% (December) to 59% (July) of all examinees across the four
forms. There were no noticeable differences across the four forms in terms of any key
background variables of interest. Note that the BIQs involved a fairly large number of missing
data points. Thus, key results across the forms are presented below with percentages of missing
data. First, in terms of gender, 46 to 52% of the examinees were males and 39 to 42% were
females with 9 to 13% of the responses missing. With regard to the main reason for taking the
TOEFL test, 12 to 16% of the examinees responded that they were seeking admission to
undergraduate programs and an additional 18 to 26% to graduate programs. Moreover, 1 to 2%
each responded that they were seeking admission to schools other than colleges and universities,
licensure for professional practice in the United States or Canada, demonstration of English
proficiency to companies where they worked or they expected to work, or for reasons other than
the above. The remaining 53 to 63% of the responses regarding the main reason for taking the
TOEFL test was missing. Finally, concerning previous experience of living in English-speaking
countries, 24 to 31% had no experience and an additional 21 to 24% had at least some
experience, with 45 to 56% of the responses missing.
Structure of the Test
Each of the four TOEFL iBT test forms consisted of the reading, listening, speaking, and
writing sections. The reading section included three sets, each of which comprised an academic text
of approximately 700 words and 13 or 14 multiple-choice items associated with the text. The items
were designed to assess English reading abilities defined by three purposes of academic reading:
basic understanding, inferencing, and reading to learn. All items were scored dichotomously, except
three reading to learn items, which were items located at the ends of the sets. Each reading to learn
item was worth more than 1 point. The raw reading section score was the sum of the score points
earned for the individual items. One reading item in the September form was not scored and thus
was excluded from further analyses. After excluding this item, the available total raw score points
ranged from 44 to 45 across the forms.
The listening section consisted of six listening sets: two conversation sets and four
academic lecture sets. Each conversation set was based on a 3- to 5-minute conversation in an

10
academic setting, accompanied by five multiple-choice questions. Each lecture set was based on
a lecture of approximately 5 minutes in length followed by six multiple-choice questions. The
listening items are designed to assess English listening ability with respect to three purposes of
academic listening: basic understanding, pragmatic understanding, and connecting information.
All items in the four test forms were scored dichotomously. The raw listening section score was
a sum of all the points earned on the individual items. One listening item in the December test
form was not scored and thus was excluded from subsequent analyses. After excluding this item,
the available total score points ranged from 33 to 34 across the forms.
The speaking section consisted of six academic speaking tasks of three types. Two of them
were independent speaking tasks that required the examinee to express opinions on familiar topics.
The other four tasks integrated speaking with other modalities. Two of them were
reading/listening/speaking tasks that required the examinee to read an academic text, listen to a
spoken text on the same topic, and then speak about what had been read and heard. The remaining
two were listening/speaking tasks that required the examinee to listen to a short spoken text and
then respond orally to what had been heard. All examinee responses to the six speaking tasks were
scored by ETS-trained raters on a holistic rating scale of 0 to 4. Typically, six different raters
scored responses to the six tasks of the same examinee, but only four raters were involved in some
cases. For a small portion of the responses, two independent ratings were obtained for an interrater
reliability check, although only a single rating was obtained for the remaining responses.5 In brief,
for the responses scored by a single rater, the rater’s score was the final score. For the responses
scored by two raters, Rater 1’s score was the final score when the scores assigned by the two raters
were exactly the same or discrepant by 1 point. However, there were exceptions where
adjudication was conducted. The scores were adjudicated by an additional rater (a) when a single-
rated response was marked with technical difficulty or assigned a score of 0, representing “no
attempt to respond” or “response unrelated to topic” and (b) when the two raters’ scores assigned
to a double-rated response differed by more than 1 point. In both cases, the adjudicated score was
the final score. The raw speaking section score was the sum of the score points earned on the
individual tasks (0 to 24).
The writing section included two tasks. One was an independent writing task, for which the
examinee wrote an essay of approximately 350 words in length based on memory or previous
experiences. The other was an integrated writing task that required production of a written
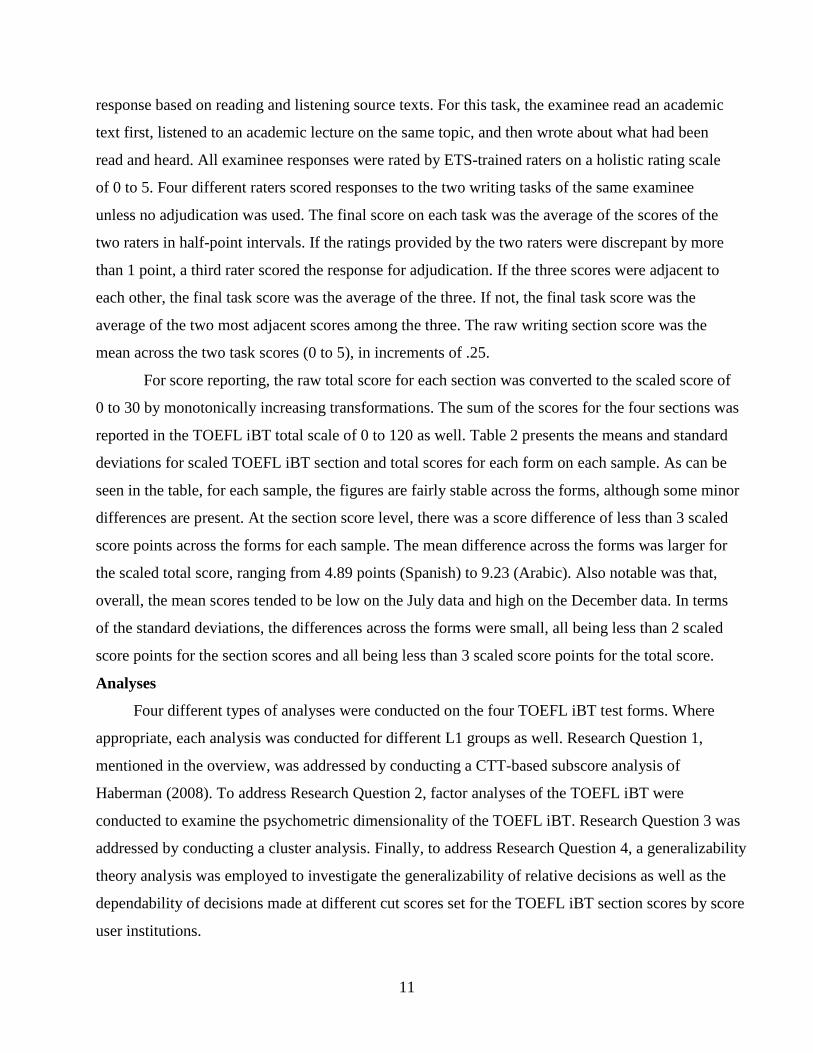
11
response based on reading and listening source texts. For this task, the examinee read an academic
text first, listened to an academic lecture on the same topic, and then wrote about what had been
read and heard. All examinee responses were rated by ETS-trained raters on a holistic rating scale
of 0 to 5. Four different raters scored responses to the two writing tasks of the same examinee
unless no adjudication was used. The final score on each task was the average of the scores of the
two raters in half-point intervals. If the ratings provided by the two raters were discrepant by more
than 1 point, a third rater scored the response for adjudication. If the three scores were adjacent to
each other, the final task score was the average of the three. If not, the final task score was the
average of the two most adjacent scores among the three. The raw writing section score was the
mean across the two task scores (0 to 5), in increments of .25.
For score reporting, the raw total score for each section was converted to the scaled score of
0 to 30 by monotonically increasing transformations. The sum of the scores for the four sections was
reported in the TOEFL iBT total scale of 0 to 120 as well. Table 2 presents the means and standard
deviations for scaled TOEFL iBT section and total scores for each form on each sample. As can be
seen in the table, for each sample, the figures are fairly stable across the forms, although some minor
differences are present. At the section score level, there was a score difference of less than 3 scaled
score points across the forms for each sample. The mean difference across the forms was larger for
the scaled total score, ranging from 4.89 points (Spanish) to 9.23 (Arabic). Also notable was that,
overall, the mean scores tended to be low on the July data and high on the December data. In terms
of the standard deviations, the differences across the forms were small, all being less than 2 scaled
score points for the section scores and all being less than 3 scaled score points for the total score.
Analyses
Four different types of analyses were conducted on the four TOEFL iBT test forms. Where
appropriate, each analysis was conducted for different L1 groups as well. Research Question 1,
mentioned in the overview, was addressed by conducting a CTT-based subscore analysis of
Haberman (2008). To address Research Question 2, factor analyses of the TOEFL iBT were
conducted to examine the psychometric dimensionality of the TOEFL iBT. Research Question 3 was
addressed by conducting a cluster analysis. Finally, to address Research Question 4, a generalizability
theory analysis was employed to investigate the generalizability of relative decisions as well as the
dependability of decisions made at different cut scores set for the TOEFL iBT section scores by score
user institutions.

12
Table 2
Means and Standard Deviations for Scaled TOEFL iBT Section and Total Scores
Group Form N
Reading Listening Speaking Writing Total
Mean SD Mean SD Mean SD Mean SD Mean SD Total April 14,495 18.04 8.07 19.74 8.33 19.01 4.66 19.50 5.41 76.30 23.30
July 13,003 17.66 8.87 19.37 8.30 19.39 4.69 20.74 5.21 77.17 23.69
September 14,185 19.38 9.34 20.63 8.01 19.51 4.75 20.84 5.64 80.36 24.64
December 8,710 19.18 9.30 21.55 8.03 20.35 4.49 21.32 4.85 82.41 23.28
Arabic April 1,363 12.94 7.99 16.69 8.59 18.74 4.62 16.91 5.31 65.29 23.31
July 1,236 10.58 8.41 15.37 8.87 18.56 4.60 17.13 5.36 61.65 23.68
September 1,207 12.87 9.66 17.11 8.56 18.34 5.17 17.59 6.09 65.91 26.06
December 705 13.55 9.75 18.73 8.80 19.63 5.01 18.97 5.41 70.88 25.18
Korean April 2,577 19.43 7.30 20.43 8.14 18.14 4.67 19.48 5.28 77.48 22.39
July 2,537 19.67 7.64 20.36 7.44 18.87 4.56 21.52 4.71 80.42 21.26
September 1,194 18.92 8.94 20.66 7.88 17.84 4.62 19.89 5.36 77.32 23.61
December 523 17.26 8.97 19.56 8.00 18.00 4.18 19.27 4.71 74.08 22.57
Spanish April 1,032 19.23 7.47 21.99 7.27 20.29 3.90 19.97 5.26 81.48 20.81
July 722 18.96 8.02 21.60 7.59 20.29 4.12 20.52 4.81 81.37 21.40
September 699 19.74 9.06 21.21 7.99 20.53 4.00 20.75 5.52 82.22 23.62
December 659 21.30 8.29 22.79 7.47 20.87 4.04 21.31 4.57 86.26 21.20

13
Haberman’s subscore analysis based on the classical test theory (CTT). The CTT-
based approach of Haberman (2008) can be viewed as one that examines if the TOEFL iBT
section scores are reliable and distinct enough to be reported. According to the method, if the
total TOEFL iBT score is a better predictor than an observed section score of the corresponding
true section score, then more errors will result in various decisions about students made based on
the section score than the total score and hence it is difficult to justify reporting of the section
score. As mentioned earlier, the reliability of the section scores and the correlations among them
play a major role in this approach. Let us denote the section score and the total score of an
examinee as s and x, respectively. The approach of Haberman (2008) assumes that a reported
section score is intended to be an estimate of the true section score ts and considers the
following two estimates of the true section score:
• An estimate, ( )ss s s sα= + − , based on the observed section score, where s is the
average section score for the sample of examinees and α is the reliability of the
section score.
• An estimate, ( )xs s c x x= + − , based on the observed total score, where x is the
average total score and c is a constant that depends on the data summaries such as
mean, variance, and reliability and are determined from formulae derived in
Haberman (2008).
The tool used to compare the two estimates is the proportional reduction in mean squared
error (PRMSE), which is a measure similar to reliability. The larger the PRMSE, the more
accurate is the estimate.6 We denote the PRMSE for ss and xs as sPRMSE and xPRMSE ,
respectively. The quantity sPRMSE is identical to the reliability of the section score (Haberman,
2008). Our strategy will be to declare that the section score provides added value over the total
score only if sPRMSE is larger than xPRMSE , that is, if the section score reliability is larger
than xPRMSE (Haberman, 2008). Sinharay, Haberman, and Puhan (2007) discussed why this
strategy is reasonable and how it ensures that a section score satisfies professional standards. A
larger value of xPRMSE for a TOEFL section means than the corresponding TOEFL section

14
score does a better job than the TOEFL total score of predicting the corresponding true section
score.
The appendix shows further details about the method of Haberman (2008). Haberman
(2008) and Sinharay (2010) showed, via theoretical calculations and empirical results, that a
section score has added value if it is both reliable and distinct from the other section scores. In
the computations for this paper, Cronbach’s α was used to estimate the reliabilities of section
scores, and stratified α (see, for example, Feldt & Brennan, 1989), which is more appropriate for
a test that has multiple sections, was used to estimate the reliability of total scores.
Factor structure of the TOEFL iBT. The psychometric dimensionality of the test was
examined by conducting exploratory factor analyses (EFAs) and CFAs, respectively. We decided
to combine the exploratory and confirmatory analytic approaches in this study instead of taking a
strictly confirmatory approach. This is primarily because the present study was the first factor
analysis of operational TOEFL iBT data. The previous factor analyses were conducted on a
TOEFL iBT prototype by Stricker et al. (2005) and on field study data by Sawaki et al. (2008)
and Stricker and Rock (2008). Following the suggestions in the literature to use different data
sets for exploring the factor structure and confirming the findings of the exploratory analyses
(e.g., Jöreskog, 2007, p. 58), EFAs were conducted on two randomly selected forms (the April
and December forms), and CFAs were conducted on the other two forms (the July and
September forms). All analyses were performed for all examinees as well as for the three L1
groups.
The observed variables used for the EFAs and CFAs were scores on item parcels for
the reading and listening sections and scores on individual tasks for the speaking and writing
sections.7 Parceling approaches have been used for decades in factor analyses of various
educational and psychological tests. Modeling item parcels rather than individual items in
factor analyses offers some advantages, such as higher reliability of indicator variables, the
need for a smaller number of parameters to define each factor, and improved model fit
(Dorans & Lawrence, 1999; Little, Cunningham, & Shahar, 2002). However, because
combining individual items into a smaller number of parcels can mask important
interrelationships among individual test items, various authors caution that parceling items is
justified only under certain conditions. Meade and Kroustalis (2006) and Little et al. concur
that modeling parcels in factor analysis is warranted only (a) when the purpose of the study is

15
to examine the structural relationships among latent constructs rather than the relationships
between latent factors and individual items and (b) when psychometric unidimensionality
holds for the item-level data out of which parcels are constructed. The present study satisfies
both conditions above because, first, the goal of this analysis is to examine the
interrelationships among the constructs assessed in the four sections of the TOEFL iBT.
Moreover, the psychometric unidimensionality within each of the TOEFL iBT reading and
listening sections was confirmed in the EFA and a series of multitrait-multimethod analyses
of TOEFL iBT field study data in Sawaki et al.’s (2008) study.
For the reading and listening sections, item parcels were constructed based on item codes
provided by ETS assessment development specialists. Item codes for the three purposes of
academic reading (understanding for basic comprehension, inferencing, and reading to learn) and
three purposes of academic listening (basic understanding, pragmatic understanding, and
connecting information) as defined in the test specifications were employed. Within each of the
reading and listening sections, the parcels were constructed by these content categories. Care was
taken to ensure that the parcels were balanced for difficulty within a content category. This was
achieved by grouping items of varying item difficulty values (p-value) to construct parcels, so
that the resulting average p-values were as similar as possible across the parcels. Another
relevant issue of concern is whether items based on the same passage should be grouped together
to construct parcels, in order to alleviate dependency of items due to passage effects. However,
we did not take this approach because Sawaki et al.’s (2008) EFA and multitrait-multimethod-
based CFA of the TOEFL iBT field study data showed that passage effects were present but not
so prominent as to be considered practically important. Thus, items based on the same passage
were distributed across different parcels within each content category.
Raw scores for items assigned to the same parcel were summed to obtain parcel scores. The
total available score points for a given parcel was between 4 and 7 points. The number of items
and points available for each parcel are presented in Table 3, along with the numbers of speaking
and writing items analyzed. Note that the April form included seven listening parcels, but the July,
September, and December forms included only six listening parcels each. The number of the
reading parcels was the same across the forms. The total number of observed variables subjected to
the factor analyses was 23 for the April form and 22 for the other three forms.

16
As a first step, EFAs were conducted on the Pearson product-moment correlation
matrices of the reading and listening parcels and the speaking and writing task scores for
different samples on the April and December forms separately. The purpose of these analyses
was to identify a rough number of factors that may be present in the data. First, in a principal
component analysis (PCA), eigenvalues for the observed correlation matrix (with 1s on the
diagonal) were obtained. The potential number of underlying factors was examined by
combining Kaiser’s criterion (Kaiser, 1960), where the number of eigenvalues over 1 obtained
from the observed correlation matrix is used as an indication of the potential number of
underlying factors, and the scree test of the eigenvalues. Then, factors were extracted by means
of a principal factor analysis, and the extracted factors were rotated by performing a Promax
rotation. Alternative solutions with different numbers of factors were compared for
interpretability, focusing specifically on the rotated factor loading patterns and interfactor
correlations.
It should be noted that previous simulation studies of different criteria for determining the
number of underlying latent factors (e.g., Zwick & Velicer, 1986) demonstrated that Kaiser’s
criterion often leads to under- or overfactoring, despite its simplicity and widespread use;
however the scree test was found to function relatively well under certain conditions. However,
both criteria have been criticized for the arbitrary nature of the decision rules (Fabriger,
Wegener, MacCallum, & Strahan, 1999). Therefore, two other criteria were used in a
supplemental manner to verify the appropriateness of the number of factors to be extracted. One
was an additional analysis of the scree plot, in which the ratio of the eigenvalue of the nth
component when the number of components retained was n to the average eigenvalue of the
remaining components was compared across scenarios for retaining different numbers of
components. The other was the number of relatively large off-diagonal elements in the residual
correlation matrix based on the principal factor analysis results. The number of elements with the
absolute value of equal to or greater than .05 was compared across different factor solutions.
SPSS Version 17.0 was used for these analyses. Results of these analyses informed the
subsequent CFA as well.

17
Table 3
Reading and Listening Item Parcels and Speaking and Writing Items Modeled in the Confirmatory Factor Analysis (CFA)
Item April July September December
Reading
Basic comprehension 5 parcels of 5–6 items (5–6 points each)
5 parcels of 5–6 items (5 points each)
5 parcels of 5–6 items (5–6 points each)
5 parcels of 5–6 items (5–6 points each)
Inferencing 2 parcels of 5–6 items (5–6 points each)
2 parcels of 5 items (5 points each)
2 parcels of 5–6 items (5–6 points each)
2 parcels of 5–6 items (5–6 points each)
Reading to learn 1 parcel of 3 items (7 points)
1 parcel of 3 items (6 points)
1 parcel of 3 items (6 points)
1 parcel of 3 items (6 points)
Total (reading) 8 parcels 8 parcels 8 parcels 8 parcels
Listening
Basic understanding 3 parcels of 5–6 items (5–6 points each)
3 parcels of 5–6 items (5–6 points each)
3 parcels of 5–6 items (5–6 points each)
3 parcels of 5–6 items (5–6 points each)
Pragmatic understanding
2 parcels of 4–5 items (4–5 points each)
1 parcel of 7 items (7 points)
1 parcel of 6 items (6 points)
1 parcel of 6 items (6 points)
Connecting information 2 parcels of 4–5 items (4–5 points each)
2 parcels of 5–6 items (5–6 points each)
2 parcels of 5–6 items (5–6 points each)
2 parcels of 5 items (5 points each)
Total (listening) 7 parcels 6 parcels 6 parcels 6 parcels
Speaking 6 tasks (each rated on a holistic rating scale of 0–4): 2 independent speaking tasks and 4integrated speaking tasks (i.e., 2 reading/listening/speaking items and 2 listening/speaking items)
Writing 2 tasks (each rated on a holistic rating scale of 0–5): 1 integrated reading/listening/writing task and 1 independent writing task

18
In the CFA, a series of plausible models representing the factor structure of each of the
July and September TOEFL iBT test forms was examined, using the variance-covariance
matrices as input data. The CFAs were conducted in two stages. The purpose of the analyses in
the first stage was to identify a CFA model that provides a good explanation of the underlying
factor structure of the TOEFL iBT for all examinees and each of the three L1 groups. Relative
goodness of fit of four CFA models was examined to choose the best among four proposed
models for each sample. The models were constructed based on those tested by Sawaki et al.
(2008), Stricker and Rock (2008), and Stricker et al. (2005).
Correlated four-factor model (Figure 1). Consistent with the goal of the TOEFL iBT to
assess academic English ability in four modalities, this model defined the presence of four
correlated yet distinct constructs corresponding to the reading, listening, speaking, and writing
modalities. In order to adequately reflect the design of the TOEFL iBT, which involves speaking
and writing tasks that integrate the reading or listening modalities, this model allowed cross-
loadings of the speaking and writing items that involved other modalities. Four latent factors
corresponding to the four modalities (reading, listening, speaking, and writing) were specified,
along with the loadings of the individual measured variables to the corresponding modalities. For
the integrated speaking and writing tasks, factor loadings on all modalities involved in the task
designs were also specified by allowing their cross-loadings on multiple factors (e.g., allowing
the listening/speaking integrated tasks in the speaking section to load on both the listening and
speaking factors). One loading per factor (Basic Comprehension 1 for reading, Basic
Understanding 1 for listening, Independent Task 1 for speaking, and the independent task for
writing; shown as dotted arrows in Figure 1) was fixed for factor scaling; all the other factor
loadings as well as the factor variances, factor covariances, and residuals were estimated freely.
Single-factor model (Figure 2). This model specified presence of only one general
factor across the four modalities, suggesting that the entire test is unidimensional. That is, the
constructs assessed in the four sections are psychometrically not distinguishable from one
another. All the measured variables were specified as loading onto the general factor, English for
Academic Purposes (EAP). One factor loading (Basic Comprehension 1 for reading; shown as a
dotted arrow in Figure 2) was fixed for factor scaling; all the other factor loadings and residuals
as well as the factor variance were estimated freely.

19
Correlated two-factor model (Figure 3). This model specified the presence of two
distinct but correlated factors, one for speaking and the other for a combination of reading,
listening, and writing. This model was identified as the final model in a previous factor analysis
study of LanguEdge, a TOEFL iBT prototype, by Stricker et al. (2005). This model specified the
loadings of all the speaking variables on the speaking factor and the loadings of all the reading,
listening, and writing variables on the reading/listening/writing factor. The reading, listening,
and writing modalities are combined into one factor in this model. Thus, unlike in the correlated
four-factor model and the higher order factor model (see Figure 4), this model did not allow
modeling of the fine distinctions among the involvement of different combinations of modalities
across the integrated speaking and writing tasks. Accordingly, the integrated speaking and
writing tasks were specified as loading only onto the speaking and the reading/listening/writing
factors, respectively. One loading for each factor was fixed for factor scaling (Basic
Comprehension 1 for reading/listening/writing and Independent Task 1 for speaking, shown as
dotted arrows in Figure 3); all the other factor loadings, residuals, factor variances, and the factor
covariance were estimated freely.
Higher order factor model (Figure 4). This model was obtained by imposing a higher
order factor structure to the correlated four-factor model above. The model specified presence of
four distinct factors corresponding to reading, listening, speaking, and writing, as well as a
higher order factor that underlies all four modalities. This model is different from the correlated
four-factor model above in that the higher order factor model clearly explains a reason why the
four first-order factors are correlated: They are all affected by a common factor representing
general academic language ability. The correlated four-factor model allows examination of the
relationships across the four modalities but not their relationships to general language ability. A
higher order factor model was identified as the final model by a recent study of TOEFL iBT field
study data by Sawaki et al. (2008). Stricker and Rock (2008) adopted a higher order factor model
as well, although their final model did not include the cross-loadings. The specification of the
first-order factor structure was the same as that for the correlated four-factor model, except that
the cross-loading of the reading/listening/writing task on the listening factor was dropped from
this model for model identification.8 One loading per first-order factor (Basic Comprehension 1
for reading, Basic Understanding 1 for listening, Independent Task 1 for speaking, and the
independent task for writing; shown as dotted arrows in Figure 4) was fixed for factor scaling.

20
The higher order factor structure was specified by replacing the interfactor correlations in
Model 1 above with a higher order general factor (EAP) and loadings of the four first-order
factors on the EAP factor. The variance of the higher-order factor was fixed for factor scaling;
the loadings of all four first-order factors on the higher-order factor, along with the disturbances9
of the first-order factors, were estimated freely.
Figure 1. Correlated four-factor model.
Figure 2. Single-factor model.

21
Figure 3. Correlated two-factor model.
Figure 4. Higher order factor model.

22
Among the four models tested, the single-factor model, the correlated two-factor model,
and the higher-order factor model are nested within the correlated four-factor model. The
correlated four-factor model was conceptualized as the baseline model in this study based on the
design principle of the TOEFL iBT, which aims to assess four related but distinct aspects of
academic English language ability in different modalities. Examining the plausibility of this
model was essential as the first step of the investigation because estimates of the interfactor
correlations for this model, in particular, provide information that is critical in the evaluation of
the extent to which the four constructs are distinct from one another. Then, based on the results,
this model was compared against the remaining three models to seek a more parsimonious
representation of the factor structure of the entire test. If the constructs are not distinct enough
from one another, the single-factor model or the correlated two-factor model might explain the
factor structure of the test better. Alternatively, if the constructs are distinct enough from one
another, and if their correlations can be explained by a common underlying factor, the higher-
order factor model would be a more reasonable choice. Given the current multicomponential
view of language ability (Bachman, Davidson, Ryan, & Choi, 1995; Sasaki, 1996), we expected
that the correlated four-factor model and the higher-order factor model specifying the presence
of multiple, highly interrelated constructs would show good fit to the data. However, even
among previous factor analyses of language assessments that supported this view, there are some
discrepancies in the actual factor structures identified. Some supported models with correlated
first-order factors (e.g., Bachman & Palmer, 1981; Kunnan, 1995); others identified higher-order
factor structures with a general factor and smaller factors (e.g., Llosa, 2007; Sasaki, 1996; Shin,
2005). Thus, the correlated four-factor model and the higher-order factor model were both
considered viable. Meanwhile, given Stricker et al.’s (2005) results, which identified a correlated
two-factor model for a TOEFL iBT prototype, the correlated two-factor model was hypothesized
as a possible alternative model. Based on the findings of the previous factor analyses of TOEFL
iBT data, we were particularly interested in whether the higher-order factor model adopted by
Sawaki et al. (2008) and Stricker and Rock (2008) could be replicated in this study. From the
perspective of TOEFL iBT validation, the higher-order factor model is preferred over the
correlated four-factor model. This is because the higher-order factor model allows an
examination of the current TOEFL iBT score reporting policy based on the relationship among

23
the TOEFL iBT total score (represented by the higher-order factor) and the section scores
(represented by the first-order factors) explicated in the model.
EQS 6.1 for Windows (Bentler, 2007) was used for all CFA model testing. Maximum
likelihood (ML) was employed for model parameter estimation. The standardized Mardia’s
coefficient varied greatly across the samples and forms. For four of the eight data sets analyzed
(the total sample and the 3 L1 groups per form x 2 forms), the values for the Arabic and Spanish
groups were fairly small, ranging from 0.59 to 4.90. For the total sample and the Korean group,
however, the values were noticeably larger, ranging from 6.94 to 37.48, suggesting deviations
from normality of the multivariate score distributions. In order to compare the goodness-of-fit of
the models according to the same criterion, taking account of the multivariate nonnormality of
the data, the Satorra-Bentler Scaled chi-square statistic (Satorra, 1990) was used for the
evaluation of model fit on all data sets. The fit of each model to the data was examined by means
of multiple criteria: (a) appropriateness of the solution, (b) overall goodness of model fit to the
data, (c) substantive interpretability of results, and (d) model parsimony.
The overall goodness of fit of each model was evaluated based on multiple criteria of
overall model fit. Following Hoyle and Panter (1995) as well as Brown (2006), overall model fit
was evaluated based on the four measures below representing three broad types of model fit
indices: absolute model fit, fit adjusted for model parsimony, and incremental fit. 10
• Model chi-square: The likelihood ratio chi-square statistic for a proposed model
(χ2) is commonly used as a measure of absolute fit (i.e., to test the degree to which
the proposed model fits the covariance matrix being analyzed perfectly). With a
sufficiently large sample size and a normal score distribution, the likelihood ratio
statistic approaches a chi-square distribution. When a factor model correctly
represents the underlying factor structure, the chi-square statistic is relatively small
and statistically nonsignificant. In contrast, when a factor model provides a false
representation of the underlying factor structure, the probability of obtaining a
relatively large, statistically significant chi-square test result approaches to 1 with the
increase of the sample size. Due to the multivariate nonnormality of the data in this
study, the Satorra-Bentler scaled chi-square statistic (χ2S-B ) is presented along with
the likelihood ratio chi-square (χ2) under the multivariate normality assumption.

24
• Standardized root mean square residual (SRMR): An absolute fit index, SRMR
can be interpreted as a measure summarizing the discrepancy between the model-
predicted and observed correlation matrices. This index is obtained by taking the
root mean square of all elements in the residual correlation matrix. SRMR ranges
from 0 to 1, and the lower the value, the better the model fit. Per Hu and Bentler
(1999), the SRMR value of around .08 or below was used as an indication for a
satisfactory model fit.11
• Root mean square error of approximation (RMSEA): Although RMSEA is often
categorized as a measure of absolute model fit, it includes a penalty function for
model parsimony as well. This is a population-based model fit index based on the
noncentral chi-square distribution for the model (Brown, 2006). To obtain this
measure, a rescaled noncentrality parameter for the model chi-square statistic (d) is
obtained, taking the sample size and the model degrees of freedom into account.
Then, RMSEA is calculated by taking the square root of d divided by the model
degrees of freedom (df). A RMSEA of .05 or below is considered as an indication of
close fit and a value of .08 or below as an indication of adequate fit (Browne &
Cudeck, 1993). Values of RMSEA based on scaled statistics that take account of
multivariate nonnormality were obtained.
• Comparative fit index (CFI): An incremental fit index, CFI assesses overall
improvement of a proposed model over a baseline model, which is the independence
model specifying all observed variables included in the model to be completely
uncorrelated with one another. Similar to RMSEA, CFI is based on the noncentrality
parameter. CFI ranges from 0 to 1, and the higher the value, the better the model fit.
A CFI of .95 or above indicates an adequate model fit (Hu & Bentler, 1999). Values
of CFA based on scaled statistics that take account of multivariate nonnormality
were obtained.
Although the likelihood-ratio chi-square statistic is often used for testing goodness-of-fit
of CFA models, it is influenced by sample size. When sample size is large, as in the case of the
present study, the statistic becomes significant even when the discrepancy between a proposed
model and the data is minimal because of the increased statistical power. Meanwhile, descriptive
model fit indices such as RMSEA, CFI, and SRMR above were developed in an attempt to

25
address limitations of the model chi-square statistic including its sensitivity to sample size (Hu &
Bentler, 1999). In fact, the model chi-square statistic for the target CFA model is used in the
calculation of RMSEA and CFI above. The RMSEA adjusts the information for sample size as
well, although CFI does not. Hu and Bentler (1995) stated, however, that the effect of sample
size on CFI is not substantial, according to previous empirical research on the functioning of
these indices. Meanwhile, SRMR is distinct from RMSEA and CFI because it is not based on the
model chi-square statistic. Rather, it directly compares the observed correlation matrix and the
model-produced correlation matrix. Due to the relative robustness of the descriptive model fit
indices above compared to the model chi-square statistic, RMSEA, CFI, and SRMR were
considered as the primary indicators in the evaluation of the goodness-of-fit of the alternative
CFA models in subsequent sections. Note that all these measures are estimates computed from
the available data; hence, they converge to the corresponding population quantity when sample
size goes to infinity and their limiting distributions do not depend on the sample size.
In addition to the goodness-of-fit criteria above, the magnitudes of interfactor correlations
were taken into consideration for evaluation of the CFA models that involved factor correlations
(the correlated four-factor model and the correlated two-factor model). Following Bagozzi and
Heatherton (1994), two latent factors were declared distinct from each other when the absolute
value of the estimated interfactor correlation ± 2 standard error did not include 1.0.12
For comparisons of relative goodness-of-fit of nested models, chi-square difference tests
based on the normal-theory model chi-square statistic or Satorra-Bentler scaled chi-square
statistic with an adjustment proposed by Satorra and Bentler (1999) are often employed.
However, the sample size affects chi-square difference tests as well, making them too
statistically powerful in large samples (Fabriger et al., 1999). Accordingly, relative goodness-of-
fit of alternative models were evaluated based primarily on the descriptive goodness-of-fit
criteria above in this study (i.e., RMSEA, SRMR, and CFI).
As described in the results section below, the correlated four-factor model was identified
as the final CFA model that provided the best explanation of the factor structure for all
examinees as well as all L1 groups on each form at the initial stage of the CFA. Accordingly, a
series of multiple-group CFA models followed as the second phase of the CFA. This analysis
started with fitting the correlated four-factor model (Model 1 below) to the three L1 groups
simultaneously. Then, the relative fit of three other alternative multiple-group models (Models 2

26
to 4 below) against this baseline multiple-group CFA model was tested in order to examine the
invariance of the factor structure across the L1 groups. Equality constraints were imposed
gradually on the baseline multiple-group CFA model to develop the four alternative models, in
the order recommended by Vandenberg and Lance (2000). Below are the four multiple-group
CFA models tested:
1. Model 1: Test for equal number of factors (baseline model with no equality
constraints across the L1 groups). In this run, the correlated four-factor model
(Figure 1) was fit to the three L1 groups simultaneously. The same model parameters
as those estimated for the correlated four-factor model tested in the first phase of the
CFA analysis above were estimated for each group separately. A good fit of this
model would indicate that the number of the underlying factors and the patterns of the
loadings of observed variables (item and parcel scores) to the factors are the same
across the L1 groups.
2. Model 2: Test for equal factor loadings. This model was identical to Model 1
above, except that equality constraints were imposed on the factor loadings across the
L1 groups. Thus, only one set of the factor loadings common across the three groups
were estimated; the indicator error variances, and factor variances, and covariance
were estimated separately for each group. A good fit of this model would suggest
that, in addition to the number of the factors and the patterns of the relationships
between the measures and factors tested in Model 1 above, the strengths and
directions of the relationships between the speaking and reading/listening/writing
factors and the corresponding variables are the same across the three L1 groups.
3. Model 3: Test for equal indicator error variances. This model was obtained by
adding equality constraints to the error variances for all observed variables to Model
2. Thus, only one set of the factor loadings as well as the indicator error variances
were estimated; the factor variances and covariances were estimated separately for
each group. A good fit of this model would suggest that, in addition to the number of
factors and the patterns of the factor-variable relationships, measurement error for the
observed variables is the same across the three L1 groups.

27
4. Model 4: Test for equal factor variances and covariances. This model was
obtained by adding equality constraints to the factor variances and covariances on
Model 3. Thus, only one set of factor loadings, indicator error variances, factor
variances, and factor covariances common across the three groups were estimated. A
good fit of this model would suggest that, in addition to the number of factors, the
patterns of the factor-variable relationships, and residual variances for the observed
variables, the variances and the relationship between the four factors are the same
across the three L1 groups.
Among these three models, the goodness of fit of Models 2 to 4 was compared against
that of the baseline model (Model 1). The same model parameter estimation and goodness-of-fit
criteria as the analyses of all examinees and separate analyses of the individual L1 groups in the
first stage above were followed to compare Models 2 to 4 against Model 1.
Finding different types of score profiles using cluster analysis. We performed a
cluster analysis using the values of the four section scores for each examinee. We standardized
the values of all the variables before running the cluster analysis. We used the Euclidean distance
between the observations as the distance metric. With regard to the clustering method, it is a
standard recommendation to perform a hierarchical clustering method to determine the cluster
means followed by a K-means cluster analysis to optimize the results (e.g., Clatworthy, Buick,
Hankins, Weinman, & Horne, 2005; Milligan, 1980). Hence, we used Ward’s linkage method,
which is a hierarchical clustering method often recommended in the literature, followed by the
K-means method throughout this paper.
Because cluster analysis is not based on a probability model, there is no objective way
to determine the number of clusters. Experts recommend the use of several types of measures to
determine the number of clusters. This is because there is no single measure that is the best under
all situations. We computed the following measures to determine the number of clusters: the
cubic clustering criterion (CCC), the Calinski and Harabasz measure, the Ratkowsky and Lance
measure, the Scott and Symons measure, the TraceW measure, and the Davies and Bouldin
measure. The measures are of different types in that they examine different aspects of the
clusters and were found superior to other existing measures in studies aimed to find the best
measures. (See Milligan & Cooper, 1985, and Dimitriadou, Dolnicar, & Weingessel, 2002, for
detailed descriptions of these measures.) Some of these measures (such as the CCC and the

28
Calinski and Harabasz measure) are maximized for the optimum number of clusters; some others
(such as the Davies and Bouldin measure) are minimized for the optimum number of clusters.
We also used interpretability of the clusters as a criterion in choosing the number of clusters.
Generalizability theory analysis on the generalizability of the TOEFL iBT section
scores and the dependability of decisions made based on predetermined cut scores. We
employed a generalizability theory (G theory) approach (e.g., Brennan, 2001; Cronbach, Gleser,
Nanda, & Rajaratnam, 1972; Shavelson & Webb, 1991) to examine the generalizability of the
TOEFL iBT section scores for norm-referenced score interpretations and the dependability of
decisions made based on predetermined cut scores for criterion-referenced score interpretations.
To investigate the generalizability of the TOEFL iBT section scores, the generalizability
coefficient (G coefficient) obtained in the G-theory framework was examined. The G coefficient
is a reliability-like index for norm-referenced score interpretations, which represents the
proportion of the total score variance explained by true-score variance, taking account of all
facets of measurement being modeled in a particular decision study (D study) design. Like CTT
reliability indices (e.g., Cronbach’s alpha), the G coefficient ranges from 0 to 1, where a value
close to 1 indicates greater generalizability.
To examine the dependability of decisions made at predetermined cut scores, the values
of phi-lambda, Φ (λ), a squared-error loss agreement index for criterion-referenced score
interpretation developed within the G-theory framework by Brennan and Kane (1977a, 1977b),
were obtained for different cut scores for the TOEFL iBT section scores. A Φ (λ) value shows
the extent to which individual candidates’ distances from a cut score obtained over an infinite
number of testings in a similar condition agree with one another (Brennan, 1992; Haertel, 2006).
In addition, this index assumes that a classification error made farther away from a given cut
score is more serious than another classification error made closer to the cut score. The value of
Φ (λ) ranges from 0 to 1 and can be interpreted as the extent to which individual candidates’
distances from a given cut score is estimated accurately over randomly parallel testing, taking
account of all facets of measurement being modeled in a particular D-study design. The Φ (λ)
value varies across different cut scores. The relationship between the cut score and the Φ (λ)
estimates can be depicted as a curve like a parabola (Brennan, 1992, p. 109) where the Φ (λ)
value reaches to its minimum when the cut score equals the mean score. Furthermore, the

29
minimum Φ (λ) value equals Φ , an index of dependability for the scale for domain-referenced
interpretations based on the D-study design (Brennan, 2001).
Within the G-theory framework, G coefficients and Φ (λ) estimates can be obtained for a
variety of measurement designs involving multiple, systematic sources of measurement error.
Although a CTT reliability index takes account of only a single source of measurement error, the
G coefficient and Φ (λ) can take account of not only random measurement error but also
multiple, systematic sources of error variance that are considered present in a given measurement
design. This flexibility was particularly suitable for analyzing the TOEFL iBT, each section of
which has a unique measurement design. (See Brennan & Kane, 1977a, 1977b, for further details
about characteristics of Φ (λ).) Examples of systematic sources of error variance relevant to the
TOEFL iBT include texts with which reading and listening comprehension items are associated,
different text types (conversation vs. lecture) that appear in the listening section, rater effects
associated with human rater scores in the speaking and writing sections, and different task types
present in the speaking and writing sections. Thus, the use of the G coefficient and Φ (λ) allows
one to estimate the generalizability of the section scores and the dependability of decisions made
based on predetermined cut scores, taking account of the complex measurement designs of the
TOEFL iBT sections.
The G-theory analysis was conducted in two steps. The first step was a generalizability
study (G study), where the relative magnitudes of the effects of different sources of score
variability on the observed score variance were obtained for a hypothetical situation where only
one observation is obtained. Then, in a decision study (D study) conducted in the second step,
the G coefficient as well as the Φ (λ) values associated with a series of cut scores for the TOEFL
iBT sections were obtained for a D-study design reflecting the actual measurement design of a
given section (e.g., the actual number of texts, items, and ratings, where appropriate). As
mentioned above, the reading section involved three academic texts, each of which was
accompanied by 13 or 14 items. The G- and D-study design for the reading section employed
was a univariate mixed study design, where persons were crossed with items nested within texts.
With the numbers of the items and texts fixed to those that appeared in the four forms, the
D-study design is denoted p x (I:T). Here, all examinees completed all items based on all texts,
so the items and texts were crossed with persons. Items were nested within texts because a given
item was associated with a particular text. Items and texts were both modeled as random facets

30
because they were both considered as random samples of much larger sets of admissible
academic texts and reading comprehension items. Scored item responses were analyzed.
The listening section involved two types of academic texts (conversation vs. lecture).
These text types were selected for inclusion in the test on purpose, and thus two conversations
and four lectures appear consistently across different TOEFL iBT listening test forms.
Accordingly, the two text types are best conceptualized as levels of a fixed facet. Texts and items
associated with particular texts within each of the text type were considered as randomly parallel
samples drawn from the universes of admissible listening texts and items, so they were modeled
as random facets. Moreover, persons were crossed with text types because all examinees
encountered both text types, but each item and each text was associated with either a
conversation or lecture. The study design used for the analysis of the listening section was a
mixed multivariate study design. With the numbers of items and texts fixed to those in the four
forms, the D-study design is denoted as (p●x(I○:T○)), following Brennan’s (2001) notation.13 In
this study design, persons were crossed with items nested within texts. Persons were crossed with
text types as well; items and texts were nested within text types. Scored item responses were
analyzed.
The speaking section consisted of six speaking tasks. Two of them were independent
speaking tasks and the other four were integrated speaking tasks (two listening/speaking and two
reading/listening/speaking tasks). In the present G-theory analysis, the three task types
(independent, listening/speaking, and reading/listening/speaking) were treated as levels of the
fixed facet because these different task types were employed in order to elicit speech samples
reflecting different task requirements. The tasks within each task type were treated as a random
facet. Another facet that was deemed to affect score variability for the speaking section was rater
effects. However, rater effects were not included as a measurement facet in the present study for
two reasons. First, only a small fraction of examinee responses were scored by two raters; only a
single rating was available for all the other examinee responses. Thus, a majority of the
examinee responses had to be excluded from the analysis if rater effects were to be included as a
facet of measurement. Second, the sampling design for the operational TOEFL iBT
administrations did not allow identification of blocks of a reasonably large sample size suitable
for the purpose of this study (e.g., blocks of examinees scored by multiple raters across different
tasks; blocks of examinees that were consistently rated by the same rater pairs). For modeling

31
rater effects effectively, a special rating study would be required. Accordingly, the G-study
design employed for the speaking section was a multivariate design with persons crossed with
tasks for each of the three task types.14 The D-study design was denoted as p● x I○. The number
of tasks for each task type was set to two, which corresponded to the actual number of tasks in
the speaking section. Only ratings provided by the first rater on the individual tasks were
analyzed.15
For the writing section, each examinee completed both writing tasks—one independent
writing task and one integrated reading/listening/writing task. Thus, persons were crossed with
tasks. The two task types were designed to elicit examinee performance on different aspects of
academic writing ability. Ideally, a G-theory analysis design should take account of both task
types and tasks as facets of measurement in this case. However, it was not possible to do so
because there was only one task per task type. For this reason, we chose to model tasks as a
random facet, without modeling the different task types. For each examinee’s response to each
task, two sets of scores were available from raters independently providing first and second
ratings. Two responses produced by each examinee were rated by different rater pairs. Because
the raters were trained by means of the same criteria and training procedure, ratings assigned by
them can be considered randomly exchangeable. Thus, ratings were treated as a random facet
that was crossed with persons but nested within tasks. As a result, the D-study design for the
section was a univariate study design, denoted p x (R':I).16 The numbers of ratings and tasks
were set to two each, which corresponded to the actual numbers of ratings and tasks in the
writing section. First and second ratings on each task were analyzed.
G and D studies for the different study designs for the different sections were conducted
by using mGENOVA (Brennan, 1999). For each section, the G coefficient and Φ (λ) values for
different cut scores were obtained from the D studies reflecting the actual measurement
condition for each section (i.e., the measurement design involving the same numbers of items,
texts, tasks, or ratings as those involved in each section). The obtained G coefficients were
summarized in tables; the Φ (λ) estimates were plotted against the scaled score for each section
separately. In this analysis, we paid special attention to the cut scores for the TOEFL iBT section
scores reported to ETS by the undergraduate and graduate/postgraduate programs for
international student admissions cited in the introduction. A frequency count of the score
requirements for the TOEFL iBT section scores reported by these institutions showed that the cut

32
scores for international student admissions for these programs, when the undergraduate and
graduate/postgraduate programs are combined, ranged from 16 to 27 for the reading, speaking,
and writing sections and from 14 to 27 for the listening section. (For more details about the
minimum score requirements for the TOEFL iBT sections reported by these institutions, see
Appendices A and B.) Thus, the primary goal of this analysis was to examine whether the Φ (λ)
values obtained for the ranges of minimum score requirements for the different sections reported
by the score users indicated acceptable levels of dependability of decisions made at the particular
cut scores.
Results
Results From the Classical Test Theory (CTT)-Based Approach of Haberman
Tables 4 to 7 show the results from the CTT-based approach (Haberman, 2008) for the
four data sets. Each table shows the means, standard deviations, and correlation coefficients
(simple and disattenuated) for the four raw section scores for all the examinees. In addition, it
shows the values of sPRMSE (which is the same as subscore reliability) and PRMSEx for all the
examinees and then for the Arabic, Korean, and Spanish L1 groups. The total test reliability was
0.90, 0.90, 0.91, and 0.90 for the four test forms, respectively. First, we will discuss the results
for all examinees and then discuss those for the subgroups.
Discussion of results for all examinees. Tables 4 to 7 show that the section scores have
moderate to high reliability. However, for the listening and writing section scores, sPRMSE is
substantially smaller than PRMSEx for all test forms—so these two section scores do not provide
any added value given the total score according to the criteria of Haberman (2008). The writing
section score has the lowest reliability among the four section scores and, naturally, the
difference between PRMSEx and sPRMSE is large for this section. For the reading score, the
reliability is close to PRMSEx for all the forms, suggesting that the reading score barely provides
any added value over the total score.

33
Table 4
Results From the Classical Test Theory (CTT)-Based Approach for the April Test Form
Statistic
Reading Listening Speaking Writing
All examinees
Mean 26.6 22.7 14.9 5.99
Standard deviation 8.31 6.43 3.63 1.91
Correlation matrix 1.00 0.76 0.54 0.74
0.92a 1.00 0.66 0.76
0.63a 0.77a 1.00 0.69
0.94a 0.97a 0.85a 1.00
Subscore reliability or
sPRMSE 0.84 0.84 0.88 0.74
xPRMSE 0.86 0.90 0.62 0.94
L1 Arabic
sPRMSE 0.81 0.81 0.87 0.74
xPRMSE 0.87 0.90 0.64 0.88
L1 Korean
sPRMSE 0.82 0.84 0.89 0.75
xPRMSE 0.84 0.90 0.69 0.92
L1 Spanish
sPRMSE 0.81 0.81 0.83 0.68
xPRMSE 0.85 0.86 0.62 0.96
Note. In the correlation matrix, the simple correlations are shown above the main diagonal and
the disattenuated correlations are below the main diagonal. L1 = native language; PRMSE =
proportional reduction in mean squared error.
aDisattenuated correlation.

34
Table 5
Results From the Classical Test Theory (CTT)-Based Approach for the July Test Form
Statistic
Reading Listening Speaking Writing
All examinees Mean 25.58 21.43 15.20 6.43
Standard deviation 8.37 6.65 3.66 1.84
Correlation matrix 1.00 0.74 0.54 0.72
0.87a 1.00 0.68 0.74
0.62a 0.79a 1.00 0.69
0.89a 0.91a 0.84a 1.00
Subscore reliability or sPRMSE
0.85 0.85 0.88 0.78
xPRMSE 0.84 0.88 0.63 0.87
L1 Arabic
sPRMSE 0.82 0.84 0.86 0.78
xPRMSE 0.84 0.87 0.63 0.82
L1 Korean
sPRMSE 0.81 0.83 0.88 0.75
xPRMSE 0.83 0.87 0.69 0.87
L1 Spanish
sPRMSE 0.81 0.85 0.84 0.70
xPRMSE 0.84 0.88 0.64 0.93
Note. In the correlation matrix, the simple correlations are shown above the main diagonal and
the disattenuated correlations are below the main diagonal. L1 = native language; PRMSE =
proportional reduction in mean squared error.
aDisattenuated correlation.
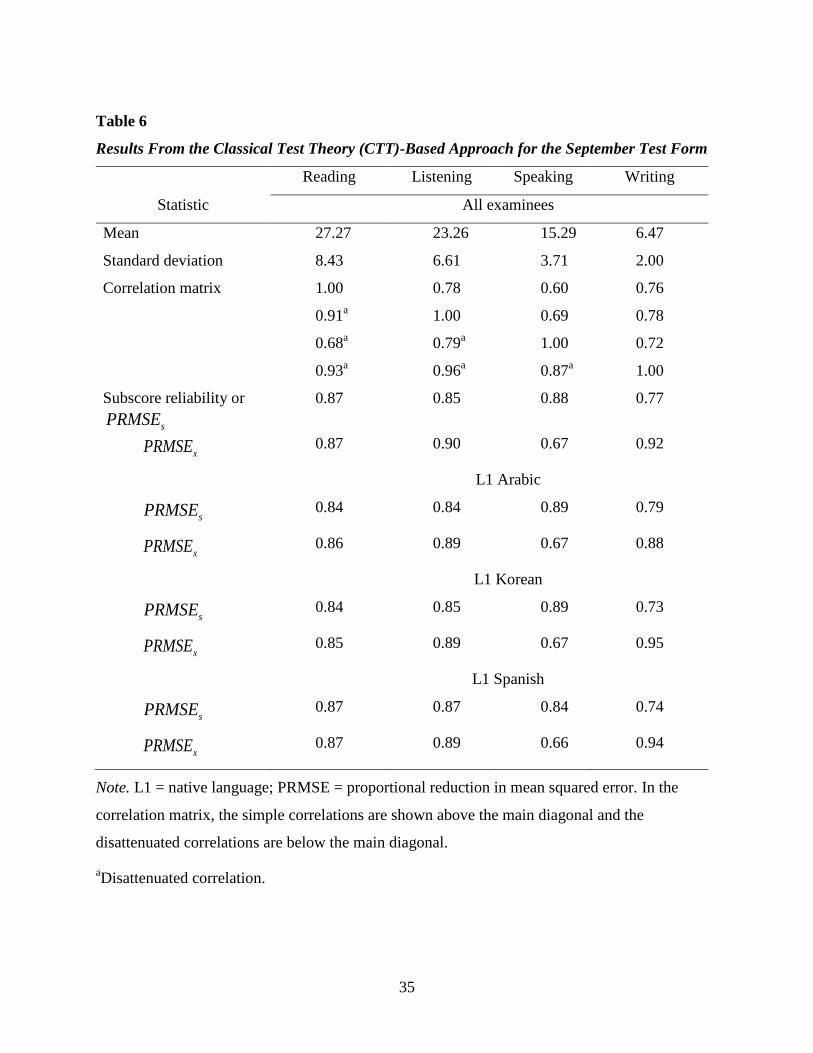
35
Table 6
Results From the Classical Test Theory (CTT)-Based Approach for the September Test Form
Statistic
Reading Listening Speaking Writing
All examinees
Mean 27.27 23.26 15.29 6.47
Standard deviation 8.43 6.61 3.71 2.00
Correlation matrix 1.00 0.78 0.60 0.76
0.91a 1.00 0.69 0.78
0.68a 0.79a 1.00 0.72
0.93a 0.96a 0.87a 1.00
Subscore reliability or
sPRMSE 0.87 0.85 0.88 0.77
xPRMSE 0.87 0.90 0.67 0.92
L1 Arabic
sPRMSE 0.84 0.84 0.89 0.79
xPRMSE 0.86 0.89 0.67 0.88
L1 Korean
sPRMSE 0.84 0.85 0.89 0.73
xPRMSE 0.85 0.89 0.67 0.95
L1 Spanish
sPRMSE 0.87 0.87 0.84 0.74
xPRMSE 0.87 0.89 0.66 0.94
Note. L1 = native language; PRMSE = proportional reduction in mean squared error. In the
correlation matrix, the simple correlations are shown above the main diagonal and the
disattenuated correlations are below the main diagonal.
aDisattenuated correlation.

36
Table 7
Results From the Classical Test Theory (CTT)-Based Approach for the December Test Form
Statistic Reading Listening Speaking Writing
All examinees
Mean 26.32 23.00 15.95 6.63
Standard deviation 9.16 5.91 3.51 1.72
Correlation matrix 1.00 0.77 0.57 0.71
0.90a 1.00 0.66 0.73
0.65a 0.77a 1.00 0.69
0.88a 0.92a 0.86a 1.00
Subscore reliability
or sPRMSE
0.87 0.83 0.87 0.75
xPRMSE 0.87 0.88 0.63 0.86
L1 Arabic
sPRMSE 0.84 0.83 0.88 0.78
xPRMSE 0.86 0.88 0.61 0.84
L1 Korean
sPRMSE 0.83 0.80 0.86 0.73
xPRMSE 0.86 0.88 0.63 0.89
L1 Spanish
sPRMSE 0.84 0.84 0.83 0.69
xPRMSE 0.87 0.88 0.62 0.91
Note. L1 = native language; PRMSE = proportional reduction in mean squared error. In the
correlation matrix, the simple correlations are shown above the main diagonal and the
disattenuated correlations are below the main diagonal. aDisattenuated correlation.

37
The reliability for the speaking score is much larger than xPRMSE for all the test
forms, showing that the speaking score is quite distinct from the other TOEFL section scores
and has substantial added value. This difference is partially evident from the comparatively
low correlation (both simple and disattenuated) in Tables 4 to 7 between the speaking score
and the other section scores.
Discussion of results for the three native language (L1) groups. The results for the
Arabic, Spanish, and Korean L1 groups are quite similar to those for all examinees. The values of
reliability of the section scores are close to those for all examinees for all these subgroups, except
that the reliability values of the speaking and writing scores are somewhat lower for the Spanish
L1 group. However, the same phenomenon observed for all examinees hold for each of these
three subgroups: the reading, listening, and writing section scores do not in general have added
value but the speaking scores do. The reading section score does not have added value for any
subgroup (whereas it had slight added value for the total group for the July form—see Table 5).
Results From the Factor Analysis
Results for exploratory factor analysis (EFA). At the outset, scree plots based on a
PCA were obtained from observed correlation matrices for the total sample and the three L1
groups on the April and December forms. The numbers of components were 23 for the April
form and 22 for the December form, corresponding to the numbers of the observed variables on
the respective forms. As can be seen in Figures 5 and 6, the plots for the total and L1 group
samples overlapped almost perfectly on each form, indicating that the observed patterns were
highly consistent across the samples. The overall shapes of the plots were highly similar across
the forms as well. In all except one run, only the first two components were associated with
eigenvalues greater than 1; the size of the third eigenvalue ranged from .86 to .91. Moreover,
41.5 to 46.7% of the total score variance was explained by the first component and an additional
6.8 to 9.0% by the second one. The third component explained smaller portions, ranging from
3.8 to 4.6% of the total variance. For seven out of the eight runs, the proportion of variance
accounted for by the fourth component was 3.2 to 3.5%; for one run the proportion was smaller
at 2.8%. The proportions of variance accounted for by the fifth component and beyond were
mostly less than 3.0%. The scree plot shows a drastic decline in the size of the eigenvalue at the
second component. Although the size of the eigenvalue decreased slightly more at the third

38
component, the decline was not so substantial as the one at the second component. After that, the
lines leveled off.
Figure 5. Scree plot based on the principal component analysis (April).
Figure 6. Scree plot based on the principal component analysis (December).

39
Next, the ratios of the eigenvalue of the last component retained to the average across the
eigenvalues for the remaining components (e.g., the average eigenvalue across the third through
the last components when two components are retained) were compared across different
scenarios for extracting different numbers of components. The results for the first 10 components
are presented in Table 8. The values in the columns were calculated as follows: The sizes of the
eigenvalues of the first to fourth components for the total sample on the April form were 10.36,
1.89, .88, and .73, respectively. In a two-component solution, the second component is the last
one to be retained. For this run, the average eigenvalue across the third to the last (23rd)
components was .51, so the ratio was calculated as 1.89/.51 = 3.70. The values shown in Table 8
indicate that the ratios for the one-component solution are extremely large. The ratios for the
two-component solution are substantially smaller than those for the one-factor solution across the
samples and forms; their sizes, all being above 3.0, are still relatively large compared to the
average eigenvalues across the remaining components. The ratios for the three- and four-
component solutions were even smaller, ranging from 1.41 to 1.99. The ratios for the solutions
with the larger numbers of retained components gradually level off to approach 1.00. Thus, in
other words, the first and second components were clearly distinct in size from the rest. The third
and fourth components were not noticeably large compared to the remaining eigenvalues,
suggesting that they would both add relatively little to the explanation of the variance shared
across the variables. The same pattern was observed consistently across all samples and on both
forms.
Table 8
Ratios of the Eigenvalue of the Last Component Retained to the Average Across the
Eigenvalues for the Remaining Components (for the First 10 Components Only)
Number of components
retained
April December
All Arabic Korean Spanish All Arabic Korean Spanish 1 18.03 16.12 18.12 15.59 18.37 17.20 15.13 16.38 2 3.70 3.18 3.42 3.06 3.60 3.70 3.09 3.21 3 1.77 1.66 1.77 1.99 1.79 1.86 1.69 1.74 4 1.52 1.53 1.51 1.49 1.30 1.53 1.42 1.41 5 1.32 1.40 1.42 1.33 1.27 1.40 1.45 1.43 6 1.26 1.37 1.32 1.28 1.26 1.42 1.38 1.34 7 1.21 1.29 1.31 1.28 1.25 1.44 1.35 1.33

40
Number of components
retained
April December
All Arabic Korean Spanish All Arabic Korean Spanish 8 1.18 1.26 1.31 1.24 1.25 1.29 1.37 1.32 9 1.17 1.25 1.26 1.25 1.18 1.29 1.37 1.30
10 1.16 1.24 1.24 1.22 1.18 1.28 1.33 1.29
Next, correlated two-, three-, and four-factor solutions were extracted by principal factor
analysis, and factor loadings after the Promax rotation for the different solutions were compared
for each of the eight runs. Across the runs, the correlated two-factor model roughly represented a
speaking factor and a factor combining the reading, listening, and writing variables. However,
the factor loading patterns were not straightforward. In two of the eight runs, relatively low but
salient (> .30) cross-loadings of one to four listening variables on the speaking factor were
observed, making it difficult to interpret the factor loading patterns clearly. Meanwhile, in both
the three- and four-factor solutions, the speaking, reading, and listening variables consistently
loaded on different factors. However, the factors with which the writing variable loaded changed
across the runs. In the four-factor solutions, the writing variable did not cluster together to
identify a writing factor. The instability of the factor loading patterns of the writing variables
suggests that the evidence for the presence of a distinct writing factor was rather weak.
The pattern observed in the residual correlation matrix based on the principal factor
analysis results was highly similar across the samples and the forms. That is, for the one-factor
solution, 32 to 38% of the off-diagonal elements in the residual matrix had absolute values equal
to or greater than .05, suggesting fairly noticeable discrepancies between the observed and
reproduced correlation matrices. In contrast, the percentage sharply decreased to 0 to 5% for the
correlated two-factor solution, suggesting a reasonable fit of the model to the data. The
proportion of the off-diagonal elements with the absolute value equal to or exceeding .05 was
virtually nil, at 0 to 1%, for both the three- and four-factor solutions.
In sum, Kaiser’s criterion, the scree plot, and the ratios of the eigenvalue of the last
component retained to the average across the eigenvalues for the remaining components based
on PCA, as well as the pattern observed in the residual correlation matrix obtained from the
EFA, indicate that at least two factors are required to explain the underlying factor structure of
the test, supporting multidimensionality of the entire test. In contrast, however, the factor loading
pattern for the two-factor solution from the EFA was not necessarily easy to interpret.

41
Underfactoring is considered to introduce a more serious problem than overfactoring (Fabriger et
al., 1999). Thus, the results above suggest the need to closely examine correlated two-factor
solutions as well as solutions with larger numbers of factors in the subsequent CFA.
Confirmatory factor analysis (CFA) results of all examinees and individual groups.
Tables 9 and 10 summarize statistics for evaluating overall model fit for all examinees and the
three L1 groups on the July and September forms (i.e., eight different data sets). Note that the
normal-theory chi-square statistics and Satorra-Bentler scaled chi-square statistics were very
large for all models tested due to the large sample sizes on which the analyses were based. The
values were much smaller for the L1 groups than for the total samples. This result is partly due to
the reduced statistical power for the L1 samples, which were smaller than those of the total
samples. Thus, the relatively small chi-square values for the results for the L1 groups should not
be interpreted as an indication of the relatively better fit of the proposed CFA models for the
subgroups.
As can be seen in Tables 9 and 10, the fit of the correlated four-factor model, which was
the least restrictive among the four, was excellent across all examinees and the three L1 groups
for both forms. (> .95), SRMR (< .08), and RMSEA (< .05) all satisfied the criteria for good
overall model fit above. The completely standardized parameter estimates for the correlated four-
factor model are presented in Tables 11 to 13. The obtained factor loadings for this model
(Tables 11 and 12) were all within the acceptable range and were interpretable. The loadings of
the reading and listening item parcels on the corresponding factors as well as those of the
speaking and writing tasks to the primary factors (i.e., the loadings of the speaking tasks on the
speaking factor and those of the writing tasks on the writing factor) were all salient. They were
all substantial (> .50) as well; the only exception was the loading of the integrated writing task
on the writing factor, which was smaller than .50 in all except one run (the Korean group on the
July form). The loading of the integrated writing task on the listening factor was weak to
moderate (.25 to .49) in all runs, and they were even greater than the loadings of this task on the
writing factor for the Spanish sample on the July form and all four runs on the September form.
In contrast, all the other additional paths to the reading or listening factors specified for the
integrated speaking and writing tasks were either nonsignificant or significant but minimal.

42
Table 9
Confirmatory Factor Analysis (CFA) Testing Results for All Examinees and the Native Language (L1) Groups (July)
Group Test Normal theory χ2 S-B χ2 Df CFI SRMR RMSEA 90% CI
All Correlated four factors 1700.68 1662.34 195 .99 .02 .024 .023–.025
Single factor 19468.51 18537.42 209 .87 .06 .082 .081–.083
Correlated two factors 8332.28 8073.70 208 .94 .04 .054 .053–.055
Higher order factor 3004.39 2930.37 198 .98 .03 .033 .032–.034
Arabic Correlated four factors 301.39 297.950 195 .99 .02 .021 .016–.025
Single factor 1660.32 1597.52 209 .88 .06 .073 .070–.077
Correlated two factors 799.02 783.59 208 .95 .04 .047 .044–.051
Higher order factor 402.64 397.64 198 .98 .03 .029 .024–.033
Korean Correlated four factors 571.73 558.26 195 .98 .02 .027 .024–.030
Single factor 2854.74 2743.05 209 .89 .05 .069 .067–.071
Correlated two factors 1498.89 1456.25 208 .95 .04 .049 .046–.051
Higher order factor 783.62 764.67 198 .98 .03 .034 .031–.036
Spanish Correlated four factors 222.63 219.47 195 1.00 .02 .013 .000–.021
Single factor 982.15 960.06 209 .89 .06 .071 .066–.075
Correlated two factors 582.61 571.46 208 .95 .04 .049 .044–.054
Higher order factor a 304.94 300.09 199 .99 .03 .027 .020–.032
Note. CFI = comparative fit index; CI = confidence interval; RMSEA = root mean square error of approximation;
SRMR = standardized root mean square residual. a The disturbance for the writing factor was constrained to be zero.

43
Table 10
Confirmatory Factor Analysis (CFA) Testing Results for All Examinees and the Native Language (L1) Groups (September)
Group Test Normal theory χ2 S-B χ2 Df CFI SRMR RMSEA 90% CI All Correlated four factors 1498.06 1435.46 195 .99 .01 .021 .020–.022 Single factor 18215.14 16938.39 209 .89 .05 .075 .074–.076 Correlated two factors 6701.23 6353.67 208 .96 .03 .046 .045–.047 Higher order factor 2722.69 2602.23 198 .98 .02 .029 .028–.030 Arabic Correlated four factors 336.93 334.23 195 .99 .02 .024 .020–.029 Single factor 1854.33 1751.79 209 .88 .06 .078 .075–.082 Correlated two factors 850.95 828.35 208 .95 .04 .050 .046–.053 Higher order factor 494.84 488.96 198 .98 .03 .035 .031–.039 Korean Correlated four factors 283.40 277.34 195 .99 .02 .019 .013–.024 Single factor 1671.07 1562.48 209 .88 .06 .074 .070–.077 Correlated two factors 767.42 742.37 208 .95 .04 .046 .043–.050 Higher order factor a 407.45 396.97 199 .98 .03 .029 .025–.033 Spanish Correlated four factors 234.01 227.28 195 1.00 .02 .015 .000–.023 Single factor 888.25 841.45 209 .91 .05 .066 .061–.070 Correlated two factors 534.97 510.73 208 .96 .04 .046 .041–.051 Higher order factor 283.62 275.83 198 .99 .03 .024 .017–.030
Note. CFI = comparative fit index; CI = confidence interval; RMSEA = root mean square error of approximation;
SRMR = standardized root mean square residual. a The disturbance for the writing factor was constrained to be zero.

44
Table 11
Completely Standardized Model Parameter Estimates for the Correlated Four-Factor Model (July)
Task All Arabic Korean Spanish
R L S W Error R L S W Error R L S W Error R L S W Error R BC1 .67a .74 .63a .77 .60a .80 .62a .79 R BC2 .66 .75 .62 .78 .58 .82 .65 .76 R BC3 .74 .68 .65 .76 .67 .74 .74 .67 R BC4 .72 .70 .67 .74 .63 .77 .72 .69 R BC5 .71 .70 .68 .73 .63 .78 .72 .70 R INF1 .65 .76 .54 .84 .61 .79 .63 .78 R INF2 .71 .71 .66 .75 .65 .76 .70 .71 R RtoL .58 .81 .51 .86 .56 .83 .53 .85 L BU1 .71a .71 .70a .71 .66a .76 .72a .70 L BU2 .73 .69 .72 .69 .67 .75 .72 .69 L BU3 .67 .75 .62 .79 .58 .82 .69 .73 L PU .71 .70 .72 .70 .71 .71 .76 .65 L CI1 .77 .64 .76 .65 .75 .66 .75 .66 L CI2 .73 .68 .74 .68 .69 .73 .72 .70 S IND1 .68a .73 .65a .76 .66a .75 .64a .77 S IND2 .69 .72 .67 .75 .69 .72 .66 .76 S RLS1 .06 .06 .68 .64 .03b .15 .69 .68 .04b .02b .73 .63 .07b .03b .65 .69 S RLS2 .01b .04b .71 .67 -.03b .08b .69 .69 -.01b .01b .76 .65 .02b .03b .65 .73 S LS1 .07 .73 .63 .10 .64 .63 .04b .75 .63 -.01b .71 .71 S LS2 .04 .74 .63 .06 .66 .66 .07b .73 .62 -.08b .80 .68 W INT .16 .29 .42 .58 .15 .25 .49 .56 .02b .31 .52 .59 -.07b .49 .40 .63 W IND .86a .52 .83a .56 .80a .60 .77a .64 Note. BC = basic comprehension; BU = basic understanding; CI = connecting information; IND = independent; INF = inferencing;
INT = integrated writing task (reading/listening/writing); L = listening; LS = listening/speaking task; PU = pragmatic understanding;
R = reading; RtoL = reading to learn; RLS = reading/listening/speaking task; S = speaking; W = writing. aFixed for factor scaling. bNonsignificant (|t| < 1.96; p > .05).
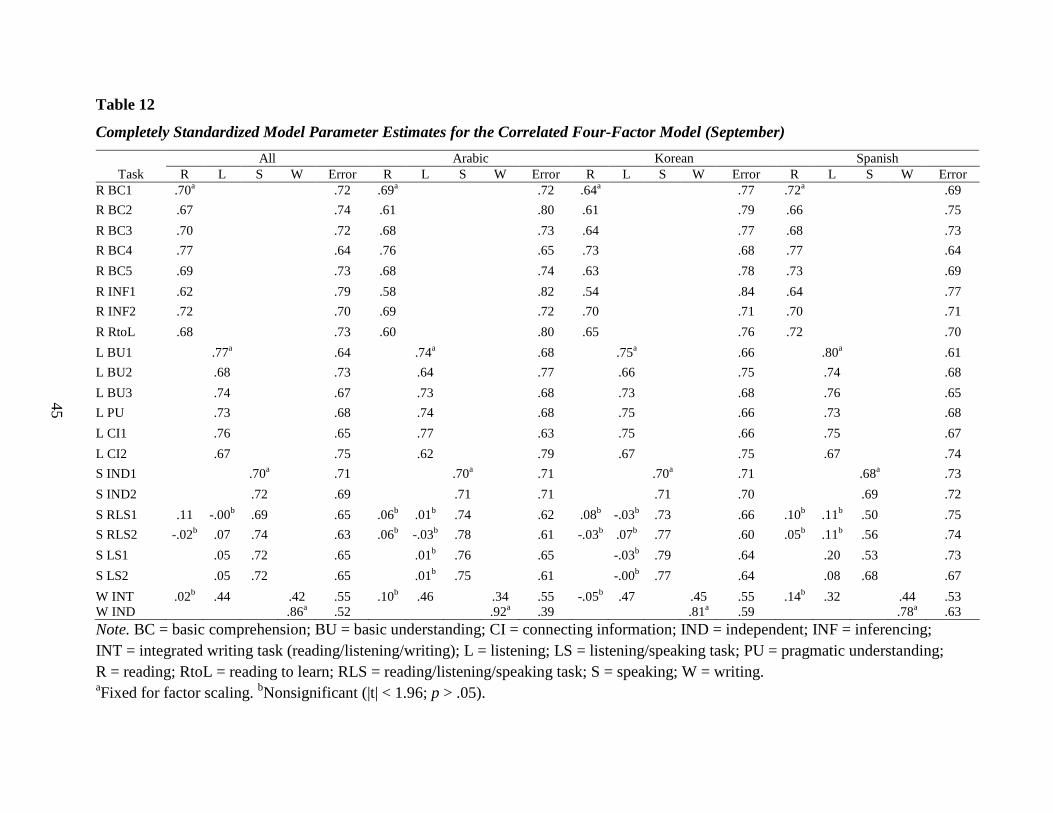
45
Table 12
Completely Standardized Model Parameter Estimates for the Correlated Four-Factor Model (September)
Task All Arabic Korean Spanish
R L S W Error R L S W Error R L S W Error R L S W Error R BC1 .70a .72 .69a .72 .64a .77 .72a .69 R BC2 .67 .74 .61 .80 .61 .79 .66 .75 R BC3 .70 .72 .68 .73 .64 .77 .68 .73 R BC4 .77 .64 .76 .65 .73 .68 .77 .64 R BC5 .69 .73 .68 .74 .63 .78 .73 .69 R INF1 .62 .79 .58 .82 .54 .84 .64 .77 R INF2 .72 .70 .69 .72 .70 .71 .70 .71 R RtoL .68 .73 .60 .80 .65 .76 .72 .70 L BU1 .77a .64 .74a .68 .75a .66 .80a .61 L BU2 .68 .73 .64 .77 .66 .75 .74 .68 L BU3 .74 .67 .73 .68 .73 .68 .76 .65 L PU .73 .68 .74 .68 .75 .66 .73 .68 L CI1 .76 .65 .77 .63 .75 .66 .75 .67 L CI2 .67 .75 .62 .79 .67 .75 .67 .74 S IND1 .70a .71 .70a .71 .70a .71 .68a .73 S IND2 .72 .69 .71 .71 .71 .70 .69 .72 S RLS1 .11 -.00b .69 .65 .06b .01b .74 .62 .08b -.03b .73 .66 .10b .11b .50 .75 S RLS2 -.02b .07 .74 .63 .06b -.03b .78 .61 -.03b .07b .77 .60 .05b .11b .56 .74 S LS1 .05 .72 .65 .01b .76 .65 -.03b .79 .64 .20 .53 .73 S LS2 .05 .72 .65 .01b .75 .61 -.00b .77 .64 .08 .68 .67 W INT .02b .44 .42 .55 .10b .46 .34 .55 -.05b .47 .45 .55 .14b .32 .44 .53 W IND .86a .52 .92a .39 .81a .59 .78a .63 Note. BC = basic comprehension; BU = basic understanding; CI = connecting information; IND = independent; INF = inferencing; INT = integrated writing task (reading/listening/writing); L = listening; LS = listening/speaking task; PU = pragmatic understanding; R = reading; RtoL = reading to learn; RLS = reading/listening/speaking task; S = speaking; W = writing. aFixed for factor scaling. bNonsignificant (|t| < 1.96; p > .05).

46
Table 13
Estimated Interfactor Correlations for the Correlated Four-Factor Model
Group Form
July September
R L S W R L S W
All Reading 1.00 1.00
Listening 0.85 1.00 0.89 1.00
Speaking 0.59 0.76 1.00 0.65 0.76 1.00
Writing 0.78 0.80 0.79 1.00 0.84 0.83 0.81 1.00
R L S W R L S W
Arabic Reading 1.00 1.00
Listening 0.86 1.00 0.88 1.00
Speaking 0.59 0.69 1.00 0.65 0.76 1.00
Writing 0.75 0.75 0.78 1.00 0.75 0.75 0.80 1.00
R L S W R L S W
Korean Reading 1.00 1.00
Listening 0.86 1.00 0.88 1.00
Speaking 0.66 0.80 1.00 0.65 0.77 1.00
Writing 0.80 0.84 0.89 1.00 0.82 0.85 0.89a 1.00
R L S W R L S W
Spanish Reading 1.00 1.00
Listening 0.85 1.00 0.88 1.00
Speaking 0.61 0.78 1.00 0.62 0.73 1.00
Writing 0.84 0.81 0.87a 1.00 0.81 0.82 0.80 1.00
Note. L = listening; R = reading; S = speaking; W = writing. a The obtained interfactor correlation was not statistically different from 1.0.
The interfactor correlations for the correlated four-factor model are presented in Table
13. As can be seen in the table, all the interfactor correlations ranged from the .50s to the .80s.
The correlations between the reading and listening factors were generally high in all runs,

47
ranging from .85 to .89. In contrast, the correlations of the speaking factor with the reading and
listening factors were relatively low, consistently being at or below .80. Moreover, the
correlations of the writing factor to the other three factors were in the .70s or the .80s in all cases.
Among all interfactor correlations obtained, the correlations between the speaking and writing
factors were noticeably high for the Spanish sample on the July form and the Korean sample on
the September form. These two correlations were not more than two standard errors away from
1.00, suggesting that these two factors were statistically not distinct from each other in these
runs. All the other obtained interfactor correlations were significantly different from 1.00.
To sum up, the patterns observed for the correlated four-factor model were consistent
across the samples and forms. The individual variables were substantially related to the primary
factors; the integrated speaking and writing tasks were minimally related with the reading and
listening factors. The only exception was the integrated writing task, which loaded not only on
the writing factor but also on the listening factor. Moreover, the four factors were highly
correlated but still distinct from one another in most cases, where the speaking factor was found
to be relatively more distinct from the others. Given the good fit of this model and the
interpretability of the results, the appropriateness of the correlated four-factor model as the
baseline model was confirmed. Subsequent CFA of the individual groups focused on evaluating
the extent to which any of the other three more parsimonious models could serve as an
alternative representation of the underlying factor structure of the test.
The first alternative model considered was the single factor model. The substantial
loadings of all observed variables on the general EAP factor (Tables 14 to 15) were interpretable,
but as can be seen in Tables 9 and 10, the overall fit of this model was much worse than that of
the baseline model in all eight runs. Across the samples and the test forms, the SRMR values
were within the acceptable range (< .08). However, none of the CFI values obtained for this
model reached the criterion value of .95 for a good model fit. The RMSEAs were larger than .05
with the upper tail of the 90% confidence interval of RMSEA approaching .08 (i.e., the criterion
for adequate fit) for all eight runs. Accordingly, this model was dropped from further
consideration.
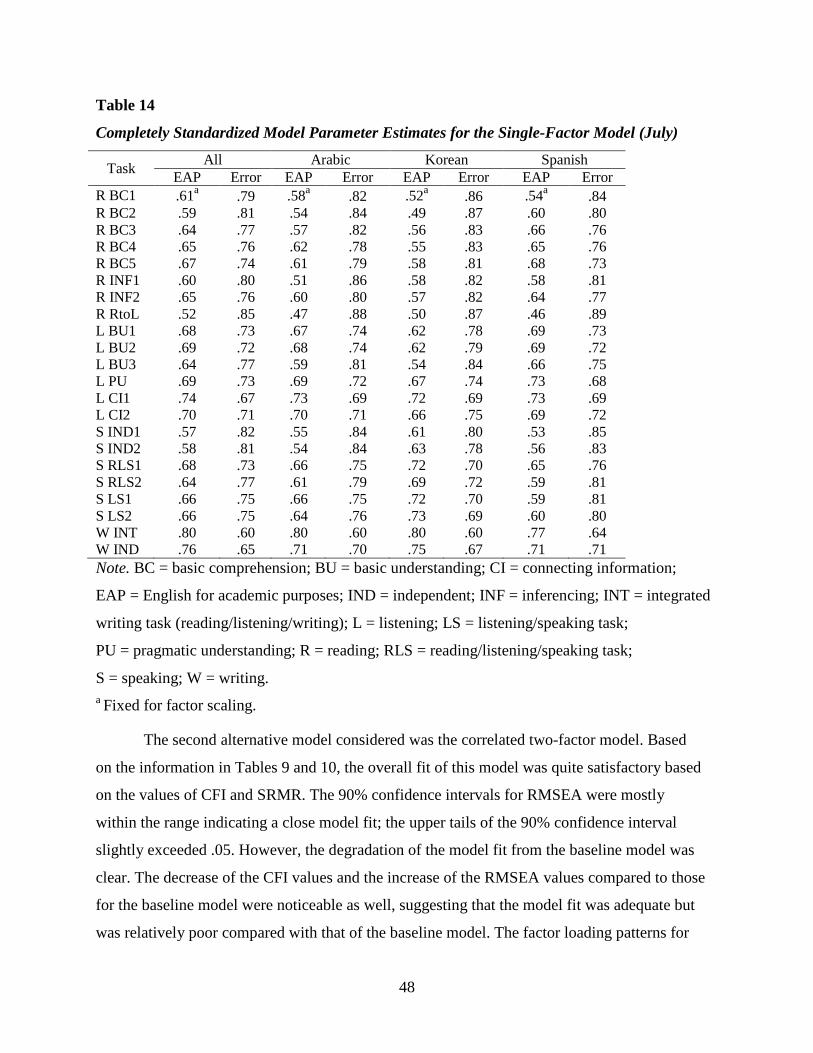
48
Table 14
Completely Standardized Model Parameter Estimates for the Single-Factor Model (July)
Task All Arabic Korean Spanish EAP Error EAP Error EAP Error EAP Error
R BC1 .61a .79 .58a .82 .52a .86 .54a .84 R BC2 .59 .81 .54 .84 .49 .87 .60 .80 R BC3 .64 .77 .57 .82 .56 .83 .66 .76 R BC4 .65 .76 .62 .78 .55 .83 .65 .76 R BC5 .67 .74 .61 .79 .58 .81 .68 .73 R INF1 .60 .80 .51 .86 .58 .82 .58 .81 R INF2 .65 .76 .60 .80 .57 .82 .64 .77 R RtoL .52 .85 .47 .88 .50 .87 .46 .89 L BU1 .68 .73 .67 .74 .62 .78 .69 .73 L BU2 .69 .72 .68 .74 .62 .79 .69 .72 L BU3 .64 .77 .59 .81 .54 .84 .66 .75 L PU .69 .73 .69 .72 .67 .74 .73 .68 L CI1 .74 .67 .73 .69 .72 .69 .73 .69 L CI2 .70 .71 .70 .71 .66 .75 .69 .72 S IND1 .57 .82 .55 .84 .61 .80 .53 .85 S IND2 .58 .81 .54 .84 .63 .78 .56 .83 S RLS1 .68 .73 .66 .75 .72 .70 .65 .76 S RLS2 .64 .77 .61 .79 .69 .72 .59 .81 S LS1 .66 .75 .66 .75 .72 .70 .59 .81 S LS2 .66 .75 .64 .76 .73 .69 .60 .80 W INT .80 .60 .80 .60 .80 .60 .77 .64 W IND .76 .65 .71 .70 .75 .67 .71 .71 Note. BC = basic comprehension; BU = basic understanding; CI = connecting information;
EAP = English for academic purposes; IND = independent; INF = inferencing; INT = integrated
writing task (reading/listening/writing); L = listening; LS = listening/speaking task;
PU = pragmatic understanding; R = reading; RLS = reading/listening/speaking task;
S = speaking; W = writing. a Fixed for factor scaling.
The second alternative model considered was the correlated two-factor model. Based
on the information in Tables 9 and 10, the overall fit of this model was quite satisfactory based
on the values of CFI and SRMR. The 90% confidence intervals for RMSEA were mostly
within the range indicating a close model fit; the upper tails of the 90% confidence interval
slightly exceeded .05. However, the degradation of the model fit from the baseline model was
clear. The decrease of the CFI values and the increase of the RMSEA values compared to those
for the baseline model were noticeable as well, suggesting that the model fit was adequate but
was relatively poor compared with that of the baseline model. The factor loading patterns for

49
this model (Tables 16 to 17) were all consistent with expectations in that the loadings of all
observed variables on the corresponding factors were substantial. No model parameter
estimation problems were encountered either. The estimates of the correlation between the
reading/listening/writing factor and the speaking factor were stable, ranging from .76 to .82
across the eight runs.
Table 15
Completely Standardized Model Parameter Estimates for the Single-Factor Model
(September)
Task All Arabic Korean Spanish
EAP Error EAP Error EAP Error EAP Error R BC1 .67a .75 .63a .77 .58a .82 .69a .73 R BC2 .62 .79 .52 .85 .54 .84 .62 .79 R BC3 .65 .76 .63 .77 .56 .83 .64 .77 R BC4 .72 .69 .69 .72 .65 .76 .76 .66 R BC5 .64 .77 .61 .79 .58 .82 .68 .73 R INF1 .58 .82 .54 .84 .50 .87 .59 .81 R INF2 .66 .75 .64 .77 .63 .78 .64 .77 R RtoL .63 .77 .54 .84 .62 .78 .66 .75 L BU1 .75 .67 .70 .71 .73 .69 .77 .64 L BU2 .66 .75 .61 .79 .63 .78 .72 .69 L BU3 .72 .70 .70 .72 .71 .71 .73 .68 L PU .71 .71 .71 .70 .72 .70 .71 .71 L CI1 .73 .68 .74 .68 .72 .70 .71 .70 L CI2 .64 .77 .59 .81 .64 .77 .65 .76 S IND1 .60 .80 .62 .79 .63 .78 .54 .84 S IND2 .60 .80 .61 .79 .62 .78 .54 .84 S RLS1 .68 .73 .70 .71 .68 .73 .60 .80 S RLS2 .67 .75 .70 .72 .71 .70 .60 .80 S LS1 .65 .76 .67 .75 .66 .75 .61 .79 S LS2 .66 .75 .70 .71 .68 .73 .62 .79 W INT .82 .57 .83 .56 .83 .56 .83 .56 W IND .78 .63 .78 .63 .76 .65 .74 .67
Note. BC = basic comprehension; BU = basic understanding; CI = connecting information;
EAP = English for academic purposes; IND = independent; INF = inferencing; INT = integrated
writing task (reading/listening/writing); L = listening; LS = listening/speaking task;
PU = pragmatic understanding; R = reading; RLS = reading/listening/speaking task;
S = speaking; W = writing. a Fixed for factor scaling.

50
Table 16
Completely Standardized Model Parameter Estimates for the Correlated Two-Factor Model (July)
Task All Arabic Korean Spanish
R/L/W S Error R/L/W S Error R/L/W S Error R/L/W S Error R BC1 .64a .77 .60a .80 .55a .84 .57a .82 R BC2 .62 .79 .57 .82 .52 .86 .62 .78 R BC3 .68 .74 .60 .80 .60 .80 .68 .73 R BC4 .67 .74 .64 .77 .58 .81 .67 .74 R BC5 .69 .72 .64 .77 .61 .80 .70 .72 R INF1 .63 .78 .52 .85 .60 .80 .60 .80 R INF2 .68 .74 .62 .78 .60 .80 .66 .75 R RtoL .55 .84 .49 .87 .52 .85 .48 .88 L BU1 .70 .72 .69 .73 .65 .76 .70 .72 L BU2 .70 .71 .69 .72 .65 .76 .70 .72 L BU3 .64 .77 .60 .80 .57 .83 .67 .74 L PU .68 .73 .69 .73 .68 .74 .73 .68 L CI1 .74 .68 .73 .68 .73 .69 .72 .69 L CI2 .69 .72 .71 .70 .66 .75 .69 .73 S IND1 .68a .74 .64a .77 .66a .75 .63a .78 S IND2 .69 .72 .66 .76 .69 .73 .65 .76 S RLS1 .78 .63 .73 .68 .78 .62 .73 .69 S RLS2 .75 .67 .72 .69 .76 .65 .69 .72 S LS1 .78 .63 .77 .64 .78 .62 .70 .71 S LS2 .78 .63 .75 .66 .79 .62 .73 .69 W INT .80 .60 .80 .60 .79 .61 .76 .65 W IND .74 .67 .69 .72 .73 .69 .69 .73 IC .76 .76 .82 .78
Note. BC = basic comprehension; BU = basic understanding; CI = connecting information; EAP = English for academic purposes; IC = interfactor correlation; IND = independent; INF = inferencing; INT = integrated writing task (reading/listening/writing); L = listening; LS = listening/speaking task; PU = pragmatic understanding; R = reading; RLS = reading/listening/speaking task; S = speaking; W = writing. a Fixed for factor scaling.

51
Table 17
Completely Standardized Model Parameter Estimates for the Correlated Two-Factor Model (September)
Task All Arabic Korean Spanish R/L/W S Error R/L/W S Error R/L/W S Error R/L/W S Error
R BC1 .68a .74 .6a .76 .60a .80 .69a .72 R BC2 .64 .77 .56 .83 .57 .82 .63 .78 R BC3 .67 .75 .65 .76 .59 .81 .65 .76 R BC4 .74 .67 .72 .70 .68 .74 .76 .65 R BC5 .66 .75 .64 .77 .60 .80 .69 .72 R INF1 .59 .81 .56 .83 .52 .86 .61 .80 R INF2 .68 .73 .67 .75 .66 .76 .66 .75 R RtoL .65 .76 .56 .83 .64 .77 .68 .74 L BU1 .75 .66 .72 .70 .74 .68 .77 .63 L BU2 .67 .74 .62 .79 .64 .77 .73 .69 L BU3 .72 .70 .71 .71 .71 .70 .73 .69 L PU .71 .70 .72 .70 .74 .68 .71 .71 L CI1 .74 .68 .75 .66 .73 .68 .72 .70 L CI2 .65 .76 .60 .80 .65 .76 .65 .76 S IND1 .70a .72 .70a .71 .71a .71 .66a .75 S IND2 .71 .70 .71 .71 .71 .70 .67 .74 S RLS1 .77 .64 .79 .61 .76 .65 .67 .75 S RLS2 .78 .63 .79 .62 .80 .60 .69 .72 S LS1 .76 .65 .76 .65 .76 .65 .70 .72 S LS2 .76 .65 .79 .61 .77 .64 .74 .68 W INT .82 .57 .83 .56 .82 .57 .83 .56 W IND .76 .65 .76 .66 .74 .68 .73 .68 IC .78 .79 .79 .80
Note. BC = basic comprehension; BU = basic understanding; CI = connecting information; EAP = English for academic purposes;
IC = interfactor correlation; IND = independent; INF = inferencing; INT = integrated writing task (reading/listening/writing);
L = listening; LS = listening/speaking task; PU = pragmatic understanding; R = reading; RLS = reading/listening/speaking task;
S = speaking; W = writing.
a Fixed for factor scaling.

52
The last alternative model considered was the higher-order factor model (see Table 20).
The overall fit of this model was satisfactory with the CFI values of over .95 and the 90%
confidence intervals of RMSEA values, which were consistently below .05. The factor loading
patterns observed for this model were fairly consistent across the runs. That is, the item parcels
as well as the speaking and writing tasks loaded saliently on the target modalities, whereas the
loadings of the integrated speaking and writing tasks on the other modalities (the reading and
listening factors) were minimal. The obtained parameter estimates for the higher-order factor
model were fully interpretable in three runs (the Arabic sample on both forms and the Spanish
sample on the September form). However, some model parameter estimates obtained from the
other five runs had the following caveats. First, the disturbance for the writing factor was out of
bounds and thus had to be constrained to be zero for two runs (the Spanish sample on the July
form and the Korean sample on the September form). On these samples the correlations between
the speaking and writing sections were not statistically distinct from 1.0 in the baseline model.
Thus, the instability of the disturbance observed in these two samples may reflect overfactoring.
That is, because the speaking and writing factors were not statistically distinct from each other in
these runs, the higher-order factor structure that assumes the presence of distinct four first-order
factors could not be imposed. Second, in one run (the Korean group on the July form), the
disturbance for the writing factor was not statistically significantly different from zero. This is
not plausible because it is unlikely that a predictor can fully explain the variance of the criterion
variable with no measurement error. Finally, in three runs (all examinees for both forms and the
Korean group on the September form), some loadings of the integrated speaking and writing
tasks on the reading factor were small but negative and statistically significantly different from
zero. These negative relationships between these tasks and the respective factors were
unexpected, and they are difficult to interpret in a meaningful manner.
Another point worth noting is a difference in the factor-loading pattern of the integrated
writing task between this model and the baseline model. For all eight runs the correlated four-
factor model yielded sizable loadings of this task on both the listening and writing factors,
suggesting that the task taps both listening and writing abilities. In the higher-order factor model,
the paths from the integrated writing task to all the modalities involved (the reading, listening,
and writing variables) could not be modeled fully. In the version of the higher-order factor model
presented in Tables 18 and 19, which estimated the paths from the reading and writing factors to

53
this task but not the path from the listening factor, the task loaded substantially on the writing
task but only minimally on the reading factor.
Taken together, the correlated four-factor model provided an excellent fit with
interpretable model parameter estimates, serving as a reasonable baseline model for all samples
and on both forms. When three more alternative models (the single factor model, the correlated
two-factor model, and the higher-order factor model) were compared against the baseline model
to see if a more parsimonious explanation of the factor structure of the test could be obtained, the
higher-order factor model was the only model that was comparable to the baseline model in
terms of model fit. The fit of the single factor model was poor, and thus it was dropped from
further consideration. The fit of the correlated two-factor model was adequate, and the model
parameter estimates were stable and interpretable. However, the degradation in the model fit
compared to that of the baseline model was noticeable. This left only the baseline model and the
higher-order factor model as possible candidates for the final model.
As noted earlier, both the correlated four-factor model and the higher-order factor model
are plausible from a theoretical point of view; the higher-order factor model was preferable
because it allows examination of the relationships among the TOEFL iBT total score and the
section scores. Despite this preference of the higher-order factor model, however, the results of
the present CFA analysis did not provide enough support to adopt the model as the best
representation of the factor structure of the test. In particular, this model yielded some problems
in the estimated model parameters for five out of the eight runs of the higher-order factor model,
making the interpretation of the results difficult for these runs. In contrast, the fit of the
correlated four-factor model was excellent, and the results were fully interpretable consistently
across all eight runs. As a result, the correlated four-factor model was accepted as the final
model.

54
Table 18
Completely Standardized Model Parameter Estimates for the Higher Order Factor Model (July)
Task All Arabic Korean Spanish
R L S W Error R L S W Error R L S W Error R L S W Error R BC1 .67a .74 .64a .77 .61a .80 .62a .79 R BC2 .66 .75 .62 .78 .58 .81 .65 .76 R BC3 .73 .68 .65 .76 .67 .75 .74 .68 R BC4 .72 .70 .67 .74 .63 .77 .73 .69 R BC5 .71 .70 .68 .74 .63 .78 .72 .69 R INF1 .65 .76 .54 .84 .62 .79 .62 .78 R INF2 .71 .70 .66 .75 .64 .77 .71 .71 R RtoL .58 .81 .51 .86 .56 .83 .53 .84 L BU1 .71a .71 .70a .72 .65a .76 .71a .70 L BU2 .73 .69 .72 .69 .66 .75 .72 .70 L BU3 .66 .75 .61 .79 .57 .82 .68 .73 L PU .72 .70 .72 .69 .71 .71 .76 .65 L CI1 .77 .64 .77 .64 .75 .66 .75 .66 L CI2 .73 .68 .74 .67 .69 .72 .72 .70 S IND1 .68a .73 .65a .76 .66a .75 .63 .77 S IND2 .70 .72 .66 .75 .69 .73 .65 .76 S RLS1 -.03 .16 .66 .64 -.02b .20 .59 .69 -.04b .07b .75 .63 -.07b .21b .60 .70 S RLS2 -.08 .14 .70 .67 -.09b .12 .69 .69 -.10b .06b .78 .65 -.09b .12b .65 .73 S LS1 .08 .71 .63 .10 .70 .64 .02b .76 .63 -.01b .71 .71 S LS2 .05 .74 .63 .05b .72 .65 .06b .74 .62 -.11b .83 .67 W INT .13 .72 .55 .04b .83 .50 -.02b .85 .56 -.10b .89 .60 W IND .80a .61 .76a .65 .76a .65 .72 .70
Note. BC = basic comprehension; BU = basic understanding; CI = connecting information; EAP = English for academic purposes;
IND = independent; INF = inferencing; INT = integrated writing task (reading/listening/writing); L = listening;
LS = listening/speaking task; PU = pragmatic understanding; R = reading; RLS = reading/listening/speaking task; S = speaking;
W = writing. a Fixed for factor scaling. bNonsignificant (|t| < 1.96; p > .05).

55
Table 19
Completely Standardized Model Parameter Estimates for the Higher Order Factor Model (September)
Task All Arabic Korean Spanish
R L S W Error R L S W Error R L S W Error R L S W Error R BC1 .70a .71 .70a .72 .64a .77 .72a .69 R BC2 .67 .74 .60 .80 .61 .80 .66 .75 R BC3 .70 .72 .68 .73 .65 .76 .68 .73 R BC4 .77 .64 .76 .65 .73 .68 .77 .64 R BC5 .69 .73 .68 .74 .63 .78 .73 .69 R INF1 .62 .79 .58 .82 .54 .84 .64 .77 R INF2 .71 .70 .69 .72 .70 .71 .70 .71 R RtoL .68 .73 .59 .81 .66 .76 .72 .70 L BU1 .77a .64. .73a .68 .75a .66 .79a .61 L BU2 .68 .73 .64 .77 .66 .75 .73 .68 L BU3 .74 .67 .73 .68 .74 .68 .76 .65 L PU .73 .68 .74 .67 .75 .66 .73 .68 L CI1 .76 .65 .77 .64 .75 .66 .75 .67 L CI2 .67 .75 .62 .78 .67 .75 .67 .74 S IND1 .70a .71 .70a .71 .70a .71 .68 .73 S IND2 .72 .69 .71 .71 .71 .71 .69 .73 S RLS1 .01b .11 .67 .65 - .02b .09b .74 .61 -.00b .03b .74 .66 .03b .18 .49 .75 S RLS2 -.11 .16 .73 .63 -.05b .08b .76 .62 -.11b .12b .79 .60 -.01b .15b .58 .73 S LS1 .06 .71 .65 .02b .75 .65 -.04b .80 .64 .20 .53 .73 S LS2 .06 .72 .65 .05b .75 .61 -.03b .79 .64 .07b .69 .67 W INT -.08 .93 .51 .01b .87 .49 -.15 .99 .51 .04b .84 .49 W IND .79a .61 .80a .60 .76a .65 .78a .63
Note. BC = basic comprehension; BU = basic understanding; CI = confidence interval; EAP = English for academic purposes; IND =
independent; INF = inferencing; INT = integrated writing task (reading/listening/writing); L = listening; LS = listening/speaking task;
PU = pragmatic understanding; R = reading; RLS = reading/listening/speaking task; S = speaking; W = writing. a Fixed for factor scaling. bNonsignificant (|t| < 1.96; p > .05).

56
Table 20
Loadings of First-Order Factors on the Higher Order Factor
Group July September General Error General Error
All Reading .87 .50 .91 .41 Listening .95 .32 .95 .30 Speaking .78 .62 .79 .61 Writing .96 .29 .99 .16 Arabic Reading .89 .46 .90 .45 Listening .93 .37 .95 .32 Speaking .76 .65 .81 .59 Writing .94 .46 .97 .25
Korean Reading .86 .51 .88 .47 Listening .94 .35 .95 .32 Speaking .86 .51 .83 .55 Writing .99 .13a 1.00 .00b
Spanish Reading .87 .49 .90 .43 Listening .94 .33 .95 .31 Speaking .82 .57 .77 .64 Writing 1.00 .00b .97 .26
aParameter estimate was nonsignificant (|t| < 1.96; p > .05). bDisturbance was constrained to be
zero due to condition codes.
Results of multiple-group confirmatory factor analysis (CFA). Given that the
correlated four-factor model was selected as the final model in the separate analyses of the
different samples, the model was fit to the three L1 groups simultaneously to conduct the
multiple-group CFA for each form. The results are summarized in Table 21. The baseline
model (i.e., the initial model without any equality constraints [the test for equal number of
factors]) fit the data well for all the groups on all the forms. The goodness-of-fit indicators
presented in Table 21 show that, on both forms, the first multiple-group model for the test of
equal number of factors demonstrated a satisfactory fit to the data with the CFI values above
.95, the SRMR values of around or below .08, and the RMSEA values and their 90%
confidence intervals of smaller than .05.
Next, the relative fit of this initial model was tested against more restrictive models to
examine the extent to which the factor structure was invariant across the three L1 groups.
Equality constraints across the samples to test the equality of factor loadings, indicator error
variances, and factor variances and covariances were introduced in steps. The results in Table 21

57
indicate that all three models with different degrees of equality constraints fit the data well,
satisfying the good overall model fit criteria in terms of CFI, SRMR, and RMSEA on both
forms. For both the July and September forms, the most restrictive model (the equal factor
variances and covariances model) yielded the CFI of .98, SRMR values of .06 to .07, and the
RMSEA values and their 90% confidence intervals of .033 or below. Because these values all
satisfy the criteria for good overall fit of this model to data, the equal factor variances and
covariances model was adopted as the final model on both forms.
Completely standardized model parameter estimates for the equal factor variances and
covariances model are presented in Tables 22 and 23. These tables present only one set of factor
loadings, indicator error variances, and factor variances and covariances for each form because
the standardized model parameter estimates were identical across the L1 groups due to the
equality constraints across the samples imposed on all these model parameters. Note that the
model parameter estimates cannot be directly compared across the two forms because they come
from separate multiple-group CFA runs and thus the parameter estimates are not on a common
scale across the forms. The factor loading patterns on the two forms presented in Table 22
generally replicate the results observed in the baseline model fit to the individual L1 groups
separately (Tables 11 and 12). That is, all factor loadings were statistically significantly different
from zero (|t| > 1.96; p < .05), suggesting that all measures were significantly associated with the
corresponding factors. The standardized factor loadings of the variables on the primary factors
were all above .5, which shows that the relationships between the variables and the target
modalities were substantial. Reflecting the pattern observed in the analyses of individual groups,
the integrated writing task was an exception with moderate loadings on the writing factor as well
as on the listening factor on both forms. The interfactor correlations presented in Table 23
basically replicated the pattern observed in the correlated four-factor models in the analysis of
individual groups as well. The correlation between the reading and listening factors was high on
both forms, and the relationship of the writing factor on the other factors were generally high. In
contrast, the speaking factor was relatively more distinct from the reading and listening factors.
All these interfactor correlations were more than two standard errors away from 1.0, indicating
that the four factors were highly correlated but statistically distinct from one another.

58
Table 21
Tests of Measurement Invariance and Population Heterogeneity of TOEFL iBT Sections Across Native Language (L1) Groups for
the Correlated Four-Factor Model
Test Normal
theory χ 2 S-B χ 2 Df CFI SRMR RMSEA 90% CI July
Equal form 1095.74 1077.77 585 .99 .02 .024 .021–.026
Equal factor loadings 1240.54 1224.99 637 .99 .04 .025 .023–.027
Equal indicator error variances 1516.69 1490.69 681 .98 .04 .028 .026–.030
Equal factor variances and covariances
1698.02 1648.19 701 .98 .06 .030 .028–.032
September
Equal form 854.34 837.71 585 .99 .02 .020 .017–.023
Equal factor loadings 1016.69 1001.31 637 .99 .04 .024 .021–.026
Equal indicator error variances 1211.23 1215.64 681 .98 .04 .028 .025–.030
Equal factor variances and covariances
1364.95 1365.70 701 .98 .07 .030 .028–.033
Note. CFI = comparative fit index; CI = confidence interval; RMSEA = root mean square error of approximation;
SRMR = standardized root mean square residual.

59
Table 22
Completely Standardized Model Parameter Estimates for the Final Multiple-Group Models
(Correlated Four-Factor Model)
Tasks July September
R L S W Error R L S W Error
R BC1 .62a .79 .68a .73
R BC2 .60 .80 .62 .78
R BC3 .68 .74 .67 .75
R BC4 .66 .75 .75 .66
R BC5 .66 .75 .67 .74
R INF1 .59 .80 .58 .82
R INF2 .66 .75 .70 .72
R RtoL .54 .84 .65 .76
L BU1 .68a .74 .76 a .65
L BU2 .69 .72 .67 .74
L BU3 .61 .80 .74 .67
L PU .72 .70 .74 .67
L CI1 .75 .66 .76 .65
L CI2 .71 .71 .65 .76
S IND1 .65a .76 .70a .72
S IND2 .68 .74 .71 .71
S RLS1 .04b .07b .67 .66 .08b .01b .70 .66
S RLS2 -.01b .03b .72 .67 .02b .02b .74 .63
S LS1 .05 .73 .64 .04b .72 .66
S LS2 .04b .74 .64 .04b .75 .63
W INT .03b .32 .49a .59 .06b .44 .39a .55
W IND .80 .60 .86 .51
Note. BC = basic comprehension; BU = basic understanding; CI = confidence interval; IND =
independent; INF = inferencing; INT = integrated writing task (reading/listening/writing);
L = listening; LS = listening/speaking task; PU = pragmatic understanding; R = reading;
RLS = reading/listening/speaking task; RtoL = reading to learn; S = speaking; W = writing. aFixed for factor scaling. bNonsignificant (|t| < 1.96; p > .05).

60
Table 23
Completely Standardized Model Parameter Estimates for the Final Multiple-Group Models
(Correlated Four-Factor Model)
Sample Form
July September
R L S W R L S W
Total Reading 1.00 Reading 1.00
Listening .86 1.00 Listening .88 1.00
Speaking .63 .76 1.00 Speaking .64 .76 1.00
Writing .79 .81 .85 1.00 Writing .78 .80 .83 1.00
Note. L = listening; R = reading; S = speaking; W = writing.
Results From the Cluster Analysis
Results for all examinees. The previously mentioned measures used in the cluster
analysis did not lead to a clear answer for any of the data sets about the number of clusters. For
example, for the April form, although the Calinski and Harabasz measure favored a four-cluster
classification, three measures (the Ratkowsky and Lance measure, the Scott and Symons
measure, and the TraceW measure) favored a three-cluster classification, the CCC favored a two-
cluster classification, and the Davies and Bouldoin measure did not provide any clear solution
(its value kept going down as the number of cluster increased). In addition, the clusters did not
have interesting profiles (i.e., nonflat profiles suggesting relative strengths and weaknesses
across the sections). Figure 7 shows the three-cluster and four-cluster classifications, obtained by
Ward’s linkage followed by a K-means algorithm, for the April form. Each panel shows the
means on the four sections for each cluster. The figure shows that for both classifications, all the
lines joining the cluster means on the four sections are close to being a horizontal line; in other
words, each cluster denotes examinees who score high, medium, low, and so forth on all the
sections (i.e., flat score profiles).
To investigate the issue further, Figure 8 shows the standardized section scores for four
random samples of 10 examinees for the April form. The figure does not show any definite
pattern in the scores of the examinees (in other words, some examinees scored higher on writing
than on the other three sections and some other examinees scored higher on speaking than on the

61
other three sections and so on), which explains why the cluster analysis did not elicit much
valuable information from the data.
Results for the three subgroups of examinees. The results from cluster analysis for
each of the subgroups were similar to those for all examinees. That is, cluster analysis did not
reveal the presence of any clear clustering of examinees or any specific patterns of scores.
Figure 7. The three-cluster solution and the four-cluster solution for the April form for all
the examinees.

62
Figure 8. Standardized TOEFL iBT section scores for four random samples of 10
examinees.
Results From the Generalizability Theory Analysis
The G coefficient and the range of Φ (λ) values for typical cut scores for international
student admission as reported by the TOEFL score user institutions above are summarized for
the different sections in Tables 24 to 27. Because the Φ (λ) values change according to the
distance of the cut score from the mean, the means and standard deviations for the section scores

63
are shown in these tables as well. Moreover, the values of Φ (λ) are plotted for each section and
test form separately in Figures 9 to 24. The results are discussed for each section separately
below.
Reading. In the D study for the univariate p x (I:T) study design, the total score variance
is decomposed into five variance component estimates: (a) score variance due to true ability
differences across examinees (persons variance component, or p), (b) score variance due to mean
difficulty differences across texts (text variance component, or T), (c) score variance due to mean
difficulty differences across items nested within texts (items-nested-within-text variance
component, or I:T), (d) score variance due to rank-ordering differences of persons across texts
(person-by-text interaction variance component, or pT), and (e) score variance due to a
combination of rank-ordering differences of persons across items nested within text and
undifferentiated error (residual variance component, or pI:T,e). Although the D-study variance
component estimates are not discussed in detail here, the estimates for the reading section can be
found in Appendix D.
The first column of Table 24 shows the G coefficients for the reading section obtained
from the D studies for the p x (I:T) study design with the numbers of texts and items fixed to
those of the actual test forms. The G coefficients ranged from .80 to .87 across the samples and
forms, suggesting that the generalizability of the section score for norm-referenced decisions was
generally high. In this D-study design, all measurement facets that involve persons (pT and
pI:T,e) contribute to the error variance in the calculation of the G coefficient. For the runs with
relatively low G coefficients (the three L1 groups on the April and July forms), the variance
components for these two facets together accounted for slightly larger proportions (about 16 to
18%) of the total score variance than in the other runs. This suggests that, relatively speaking,
(a) the examinee rank-ordering differed more across texts and (b) the examinee rank-ordering
differed more across items nested within texts or that systematic, nonsystematic error not
modeled in this D-study design was larger than in the other runs or both.
In terms of the dependability of the decisions made at predetermined cut scores for
criterion-referenced decisions, the second column of Table 24 shows the Φ (λ) values obtained
for the cut scores of 16 to 27 reported by score user institutions. As can be seen in the third
column in the table, the mean score for the reading section differed across the samples. The mean
for the Arabic group was the lowest and that for either the Spanish or Korean group was the

64
highest across the forms. A few observations can be made about the Φ (λ) estimates for the cut-
score range of 16 to 27. (See also Figures 9 to 12.) First, for the Korean and Spanish groups on
the April form, the Φ (λ) values were generally lower, ranging from .65 to .83 for the Korean
group and from .71 to .86 for the Spanish group. For the other runs, the Φ (λ) values for the cut
score range were generally acceptable, ranging from the high .70s to the low .90s. Second,
comparing the samples analyzed separately, the Φ (λ) estimates for the cut score range were
generally high for the Arabic group across the forms; the lower-end estimates for the other
samples were below .80 on some forms.
The variation observed in the Φ (λ) estimates above can be explained in terms of two
points. The first is the location of the sample mean relative to the cut score. The mean of the
Arabic group for the four forms ranged from 10.6 to 13.6, which was below the cut score range
of 16 to 27. Because Φ (λ) takes its minimum value at the sample mean (i.e., the bottom of the
parabola), the Φ (λ) estimates for the Arabic group for the cut score range tended to be high, as
shown in Figures 9 to 12. In contrast, the mean scores for the other samples (17.7 to 21.3) were
within the cut score range, which led to the relatively lower Φ (λ) estimates for those samples.
Second, in this D-study design, all except the variance component for persons (T, I:T, pT, and
pI:T,e) contribute to the error variance in the calculation of the Φ (λ) value. Thus, the larger the
proportion of the total observed score variance accounted for by these variance components
contributing to error, the lower the G coefficient and the Φ (λ) value. The D-study variance
component estimates obtained for the different samples and forms showed that one or more of
these four variance components were sizable for the runs with relatively low Φ (λ) estimates. For
example, the Φ (λ) estimates for the Korean and Spanish groups were relatively low on the April
form. For these groups the contribution of the text variance component (T) accounted for 5.5 to
11.3% of the total score variance; the percentage was 0.0 to 3.6% for the other samples. This
suggests that the texts that appeared in the reading section of the April form differed in difficulty
for the Korean and Spanish groups. In addition, the I:T variance components for these groups
were small but nonzero, suggesting that there were some differences in the difficulty of the items
nested within texts for this sample. Thus, a combination of the inclusion of the group means in
the cut score range of 16 to 27, coupled with the sizable variance components for the 7 and I:7
facets described above, explain why the Φ (λ) estimate was noticeably low for these groups on
the April form.
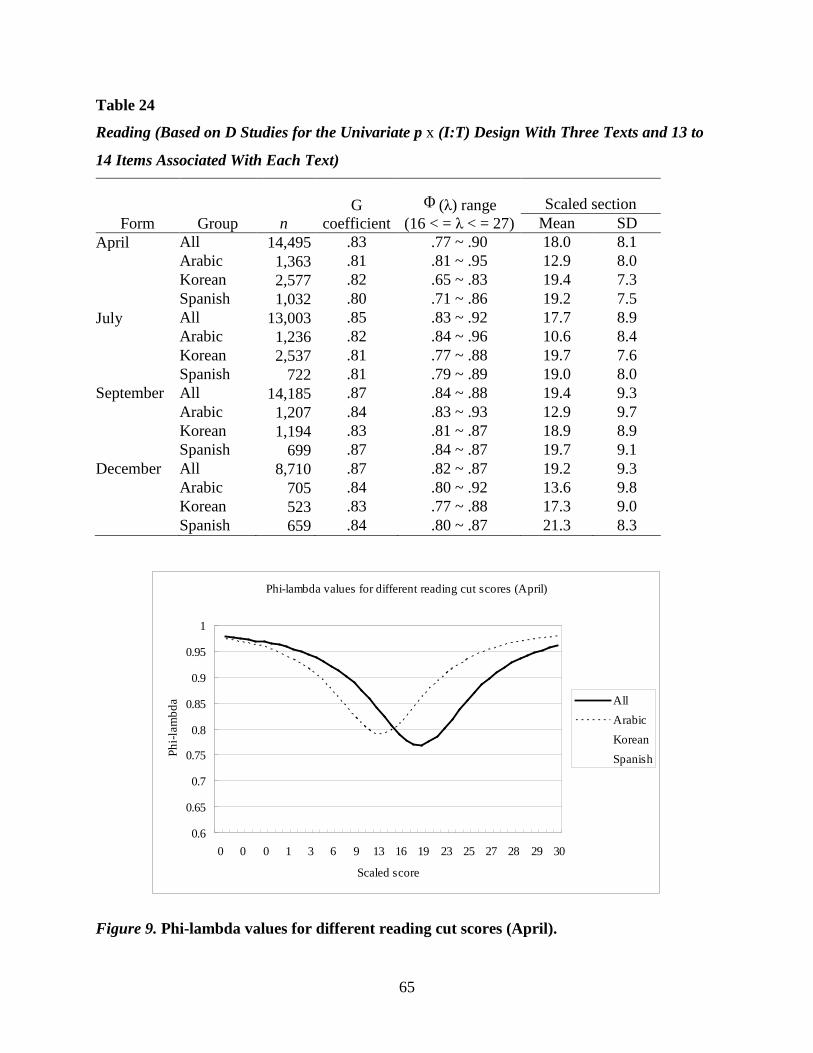
65
Table 24
Reading (Based on D Studies for the Univariate p x (I:T) Design With Three Texts and 13 to
14 Items Associated With Each Text)
Form Group n G
coefficient Φ (λ) range
(16 < = λ < = 27) Scaled section
Mean SD April All 14,495 .83 .77 ~ .90 18.0 8.1 Arabic 1,363 .81 .81 ~ .95 12.9 8.0 Korean 2,577 .82 .65 ~ .83 19.4 7.3 Spanish 1,032 .80 .71 ~ .86 19.2 7.5 July All 13,003 .85 .83 ~ .92 17.7 8.9
Arabic 1,236 .82 .84 ~ .96 10.6 8.4 Korean 2,537 .81 .77 ~ .88 19.7 7.6 Spanish 722 .81 .79 ~ .89 19.0 8.0
September All 14,185 .87 .84 ~ .88 19.4 9.3 Arabic 1,207 .84 .83 ~ .93 12.9 9.7 Korean 1,194 .83 .81 ~ .87 18.9 8.9 Spanish 699 .87 .84 ~ .87 19.7 9.1
December All 8,710 .87 .82 ~ .87 19.2 9.3 Arabic 705 .84 .80 ~ .92 13.6 9.8 Korean 523 .83 .77 ~ .88 17.3 9.0 Spanish 659 .84 .80 ~ .87 21.3 8.3
Figure 9. Phi-lambda values for different reading cut scores (April).
Phi-lambda values for different reading cut scores (April)
0.6
0.65
0.7
0.75
0.8
0.85
0.9
0.95
1
0 0 0 1 3 6 9 13 16 19 23 25 27 28 29 30
Scaled score
Phi-l
ambd
a AllArabicKoreanSpanish

66
Figure 10. Phi-lambda values for different reading cut scores (July).
Figure 11. Phi-lambda values for different reading cut scores (September).
Phi-lambda values for different reading cut scores (July)
0.6
0.65
0.7
0.75
0.8
0.85
0.9
0.95
1
0 0 0 1 2 5 8 13 17 21 24 26 28 29 30 30
Scaled score
Phi-l
ambd
a AllArabicKoreanSpanish
Phi-lambda values for different reading cut scores (September)
0.6
0.65
0.7
0.75
0.8
0.85
0.9
0.95
1
0 0 0 0 1 3 7 12 17 22 25 28 29 29 30
Scaled score
Phi-l
ambd
a AllArabicKoreanSpanish

67
Figure 12. Phi-lambda values for different reading cut scores (December).
Listening. The multivariate D study for the p● x (I○:T○) design yields, for each level of
the fixed facet, five variance component estimates: (a) score variance due to true ability
differences across examinees (persons variance component, or p); (b) score variance due to mean
difficulty differences across texts (texts variance component, or T); (c) score variance due to
mean difficulty differences across items nested within texts (items-nested-within-texts variance
component, or I:T); (d) score variance due to rank-ordering differences of persons across texts
(person-by-text interaction variance component, or pT), and (e) score variance due to a
combination of rank-ordering differences of persons across items nested within texts and
undifferentiated error (residual variance component or pI:T,e). The covariance component for
persons (covariance component attributable to true ability differences across examinees) is
estimated as well. A notable pattern observed here is that most variance component estimates for
the measurement facets were much larger for the conversation sets than for the lecture sets. This
is partly because there were only two conversation sets, although there were four lecture sets.
(For the variance and covariance components obtained for these multivariate D study runs, see
Appendix E.)
The G coefficients for norm-referenced decisions shown in the first column of Table 25
ranged from .81 to .87, suggesting overall high generalizability for the listening section score. In
Phi-lambda values for different reading cut scores (December)
0.6
0.65
0.7
0.75
0.8
0.85
0.9
0.95
1
0 0 0 1 2 5 9 15 19 23 26 28 29 29 30 30
Scaled score
Phi-l
ambd
a AllArabicKoreanSpanish

68
the calculation of the G coefficient for the composite across the two levels of the fixed facet
(conversations and lectures) for this D-study design, the variance components for the
measurement facets involving persons (pT and pI:T,e) and weights assigned to the two levels of
the fixed facet contribute to the error variance.17 Across the runs, the pT variance component
estimates (i.e., score variance due to rank-ordering differences of persons across texts) were
fairly small on both conversation sets and lecture sets, accounting for only up to 6.6% of the total
score variances. In the runs associated with relatively low G coefficients, however, the pI:T,e
variance component estimates tended to be relatively large on both the conversation and lecture
sets. This was the case in the Korean sample on the December form, where the pI:T,e variance
component estimate explained as much as 29.8% of the variance for the conversation sets and
23.9% of the variance for the lecture sets. This means that, for this run, the rank-ordering
differences of candidates across items nested within texts, systematic and unsystematic sources
of error not modeled in this D-study design, or both, were relatively large compared with those in
the other runs.
The cut scores for the TOEFL iBT Listening section reported by the score user
institutions above ranged from 14 to 27. Across the four forms, the mean section scores were the
lowest for the Arabic group and the highest for the Spanish group. Unlike the reading section, all
these mean section scores were within the cut score range. The range of Φ (λ) values obtained
from the multivariate D study for the p● x (I○:T○) design with the numbers of items and texts
equaling those included in the TOEFL Listening section are presented in the second column of
Table 25 and plotted in Figures 13 to 16. Generally speaking, the estimated Φ (λ) values reached
the high .80s or above for some cut scores in the range. However, the lower-end estimates of the
Φ (λ) values for the Arabic and Spanish groups for the April form, that for the Korean group for
the July form, and those for all examinees and all the L1 groups for the December forms were
noticeably low, below .80.
In the calculation of the Φ (λ) estimate for this multivariate D-study design, the variance
components for all effects except that for persons (the T, I:T, pT, and pI:T,e facets) and weights
assigned to the two levels of the fixed facet contribute to the error variance.18 The obtained
variance component estimates for each level of the fixed facet suggested that there was a
considerable variation in the percentage of the total score variance explained by the text (T)
variance component for the conversation sets across the forms. The estimates were particularly

69
large for all the samples analyzed for the April and December forms, ranging from 21.6 to 41.4%
for the April form and 23.6 to 31.1% for the December form. In contrast, the text variance
components for the July and September forms were much smaller, accounting for 0 to 7.1% of
the total score variance for the July form and 0 to 3.5% for the September form. This means that,
particularly for the April and December forms, the performance of all examinees and the three
L1 groups differed substantially across the two conversation sets that appeared in the test forms.
Interestingly, the text variance component estimates for the conversation sets were the largest for
the Arabic group consistently across all forms.
The relatively low minimum value of Φ (λ) obtained for the Korean sample for the July
form was attributable to the relatively large pI:T,e variance component estimates on both the
conversation and lecture sets. This suggested that, for the Korean group on the July form, the
rank-ordering of examinees varied relatively more across items nested within texts, systematic
and nonsystematic error not modeled in this D-study design was large, or both.
Table 25
Listening (Based on D Studies for the Multivariate p● x (I○:T○) Design With Text Type Fixed,
With Two Conversations, Three Lectures, and Five to Six Items Associated With Each Text)
Form Group n G
coefficient
Composite Φ (λ) range
(14 < = λ < = 27)
Scaled section
Mean SD April All 14,495 .85 .80 ~ .93 19.7 8.3
Arabic 1,363 .83 .76 ~ .88 16.7 8.6 Korean 2,577 .86 .82 ~ .94 20.4 8.1 Spanish 1,032 .84 .77 ~ .94 22.0 7.3
July All 13,003 .86 .82 ~ .92 19.4 8.3 Arabic 1,236 .84 .80 ~ .92 15.4 8.9 Korean 2,537 .83 .78 ~ .92 20.4 7.4 Spanish 722 .86 .82 ~ .94 21.6 7.6
September All 14,185 .86 .83 ~ .94 20.6 8.0 Arabic 1,207 .84 .82 ~ .91 17.1 8.6 Korean 1,194 .86 .84 ~ .95 20.7 7.9 Spanish 699 .87 .85 ~ .95 21.2 8.0
December All 8,710 .84 .77 ~ .93 21.6 8.0 Arabic 705 .83 .75 ~ .89 18.7 8.8 Korean 523 .81 .73 ~ .90 19.6 8.0 Spanish 659 .84 .78 ~ .95 22.8 7.5

70
Figure 13. Phi-lambda values for different listening cut scores (April).
Figure 14. Phi-lambda values for different listening cut scores (July).
0.60
0.65
0.70
0.75
0.80
0.85
0.90
0.95
1.00
0 0 0 2 4 8 14 19 23 26 28 30
Phi-l
ambd
a
Scaled score
Phi-lambda values for different listening cut scores (April)
All
Arabic
Korean
Spanish
0.60
0.65
0.70
0.75
0.80
0.85
0.90
0.95
1.00
0 0 1 2 6 11 16 20 24 27 29 29
Phi-l
ambd
a
Scaled score
Phi-lambda values for different listening cut scores (July)
All
Arabic
Korean
Spanish

71
Figure 15. Phi-lambda values for different listening cut scores (September).
Figure 16. Phi-lambda values for different listening cut scores (December).
Speaking. The multivariate p● x I○ design yields three variance component estimates
separately for each level of the fixed facet (independent speaking, reading/listening/speaking,
0.60
0.65
0.70
0.75
0.80
0.85
0.90
0.95
1.00
0 0 1 3 6 10 14 19 23 26 28 30
Phi-l
ambd
a
Scaled score
Phi-lambda values for different listening cut scores (September)
All
Arabic
Korean
Spanish
0.60
0.65
0.70
0.75
0.80
0.85
0.90
0.95
1.00
0 0 0 2 4 9 15 21 25 28 29 30
Phi-l
ambd
a
Scaled score
Phi-lambda values for different listening cut scores (December)
All
Arabic
Korean
Spanish

72
and listening/speaking): (a) score variance due to true ability differences among examinees
(persons variance component, or p), (b) score variance mean difficulty differences across tasks
(task variance component, or I), and (c) score variance due to a combination of rank-ordering
differences of persons across tasks and undifferentiated error (residual variance component, or
pI,e). The covariance component for the linking facet (persons) is estimated as well. The
variance and covariance component estimates obtained from the D study are presented in
Appendix F.
The G coefficients for the composite score obtained for this multivariate D-study design
shown in the first column of Table 26 ranged from .83 to .89, suggesting satisfactory
generalizability of norm-referenced decisions across samples and forms. However, the value was
the lowest for the Spanish group across all forms. In the calculation of the G coefficient for this
D-study design, the pI,e variance components and weights assigned to each level in the fixed
facet contribute to the relative error variance.19 For the Spanish group the residual variance
component (pI,e) accounted for a relatively large percentage of the total score variance across the
forms (29.9 ~ 41.1%). The percentages were much larger than those for the other groups, which
were mostly in the mid 20s to the low 30s. This difference suggests that within each task type for
the Spanish group (a) rank-ordering of examinees differed relatively more across the tasks, (b)
the variance due to systematic error not explicitly modeled in the multivariate p● x I○ design or
random error was relatively large, or (c) both.
The cut score range for the TOEFL iBT Speaking section reported by the score user
institutions ranged from 16 to 27. The means and standard deviations for the mean section scores
presented in Table 26 show that the mean scores for the Arabic and Korean groups were close
and the mean scores for the Spanish group were consistently higher than those for the other two
subgroups across the forms. Again, the cut score range reported from the score users involved
these group mean scores. The second column of Table 26 shows the composite Φ (λ) estimates
for the cut score range for the multivariate p● x I○ D-study design with the number of tasks
equaling those in the TOEFL iBT Speaking section.20 As can be seen in Figures 17 through 20,
the obtained Φ (λ) estimates were generally high across the cut score range, where even the
lower-end of the Φ (λ) estimates were .86 or above for all examinees and the Arabic and Korean
groups across the forms. For the Spanish group, however, the lower-end estimates around the
section mean scores were slightly lower, ranging from .83 to .85 across the forms. In the

73
calculation of the Φ (λ) values for this D-study design, the I and pI,e variance components, along
with the weights assigned to the levels of the fixed facet, contribute to the error. On the one
hand, the percentage of variance explained by the I facet was trivial across all levels of the fixed
facet, for all samples, and on all forms, ranging from 0 to 1.4%. This suggests that, within each
of the three task types (independent speaking, reading/listening/speaking, and
listening/speaking), the tasks were roughly equal in difficulty. Thus, the slightly lower lower-end
estimates of the Φ (λ) values for the Spanish group are primarily attributable to the relatively
large pI,e variance component estimates described above.
Table 26
Speaking (Based on D Studies for the Multivariate p● x I○ Design With Task Type Fixed, With
Two Tasks for Each of the Three Task Types)
Form Group n G
coefficient
Composite Φ (λ) range
(16 < = λ < = 27)
Scaled section
Mean SD April All 14,495 .88 .88 ~ .97 19.0 4.7
Arabic 1,363 .88 .88 ~ .97 18.7 4.6 Korean 2,577 .89 .89 ~ .98 18.1 4.7 Spanish 1,032 .83 .83 ~ .96 20.3 3.9
July All 13,003 .88 .88 ~ .96 19.4 4.7 Arabic 1,236 .87 .87 ~ .96 18.6 4.6 Korean 2,537 .88 .88 ~ .96 18.9 4.6 Spanish 722 .85 .85 ~ .94 20.3 4.1
September All 14,185 .89 .89 ~ .97 19.5 4.8 Arabic 1,207 .89 .89 ~ .97 18.3 5.2
Korean 1,194 .89 .88 ~ .98 17.8 4.6 Spanish 699 .85 .84 ~.96 20.5 4.0
December All 8,710 .87 .87 ~ .96 20.4 4.5 Arabic 705 .88 .88 ~ .96 19.6 5.0 Korean 523 .86 .86 ~ .97 18.0 4.2 Spanish 659 .83 .83 ~ .95 20.9 4.0

74
Figure 17. Phi-lambda values for different speaking cut scores (April).
Figure 18. Phi-lambda values for different speaking cut scores (July).
0.60
0.65
0.70
0.75
0.80
0.85
0.90
0.95
1.00 Ph
i-lam
bda
Scaled score
Phi-lambda values for different speaking cut scores (April)
All
Arabic
Korean
Spanish
0.60
0.65
0.70
0.75
0.80
0.85
0.90
0.95
1.00
0 3 5 8 10 13 15 18 20 23 26 28 30
Phi-l
ambd
a
Scaled score
Phi-lambda values for different speaking cut scores (July)
All
Arabic
Korean
Spanish

75
Figure 19. Phi-lambda values for different speaking cut scores (September).
Figure 20. Phi-lambda values for different speaking cut scores (December).
Writing. The variance and covariance component estimates obtained from the D studies
for the univariate p x (R′:I) design with two ratings and two tasks are shown in Appendix G. For
this study design, the total observed score variance is decomposed into five parts: (a) score
0.60
0.65
0.70
0.75
0.80
0.85
0.90
0.95
1.00
0 3 5 8 10 13 15 18 20 23 26 28 30
Phi-l
ambd
a
Scaled score
Phi-lambda values for different speaking cut scores (September)
All
Arabic
Korean
Spanish
0.60
0.65
0.70
0.75
0.80
0.85
0.90
0.95
1.00
0 3 5 8 10 13 15 18 20 23 26 28 30
Phi-l
ambd
a
Scaled score
Phi-lambda values for different speaking cut scores (December)
All
Arabic
Korean
Spanish

76
variance due to true ability differences across examinees (person variance component, or p); (b)
score variance due to difficulty differences across tasks (task variance component, or I); (c) score
variance due to severity differences across ratings nested within tasks (ratings-nested-within-
tasks variance component or R′:I); (d) person rank-ordering differences across tasks person-by-
task variance component or pI); and (e) a combination of person rank-ordering differences across
ratings nested within tasks and undifferentiated error (residual variance component, or pR′:I, e
The obtained G coefficients presented in Table 27 were relatively low compared to those
for the other sections, ranging from .68 to .78. Among the five variance component estimates for
this D-study design, those for the measurement facets involving persons (pI and pR′:I,e)
contribute to the relative error for calculation of the G coefficient. A consistent pattern observed
across all runs is that the pI variance component estimate was sizable, and this was particularly
the case for the Spanish samples, accounting for 18.3 to 21.6% of the total score variance. This
suggests that examinees were rank-ordered differently across the two tasks in the writing section,
and this tendency was relatively strong for the Spanish group. In contrast, the proportions of
score variances accounted for by the pR′:I,e variance components were relatively small across all
runs, ranging from 5.6 to 10.6%.
Also shown in Table 27 are the mean section scores, which were the lowest for the
Arabic group. The cut score range for the TOEFL iBT Writing score reported by the score user
institutions above ranged from 16 to 27, so these group means were all within the cut score
range. As shown in Table 20 and Figures 21 to 24, the obtained composite Φ (λ) values were
mostly between in the mid .60s to the mid to high .80s across the samples and the forms. In the
calculation of the Φ (λ) values for this D-study design, all four variance components for the
facets of measurement (the I, R′:I, pI, and pR′:I,e facets) contribute to the absolute error variance.
The generally low Φ (λ) estimates for the writing section were attributable primarily to the
sizable person-by-task (pI) variance components across samples and forms described in relation
to the G coefficients above. These results suggest that, across all samples and forms, examinees
were rank-ordered quite differently across the two tasks and that this tendency was the most
visible for the Spanish group. In addition, the percentage of the total score variance explained by
the task (I) variance component varied substantially across the forms. On the April form and for
the Arabic sample on the July form, this variance component was quite large, accounting for 7.0
to 11.8% of the total score variance. In contrast, for the other runs, this variance component was

77
relatively small, accounting for the 0.1 to 4.9% of the total score variance. These results indicate
that the difficulty of the two tasks differed relatively more for all groups on the April form and
for the Arabic group on the July form. Taken together, it appears that the relatively low Φ (λ)
estimates for all samples on the April form and the Arabic group on the July form are attributable
to the combination of the (a) difference in how candidates were rank-ordered across the tasks and
(b) difference in difficulty across the tasks. These results are discussed further in the next
section.
Table 27
Writing (Based on D Studies for the Univariate p x (R′:T) Design With Two Ratings and Two
Tasks)
Form Group n G coefficient
Φ (λ) range (16 < = λ < = 27)
Scaled section Mean SD
April All 14,495 .73 .65 ~ .87 19.5 5.4
Arabic 1,363 .74 .61 ~ .91 16.9 5.3
Korean 2,577 .74 .66 ~ .88 19.5 5.3
Spanish 1,032 .68 .59 ~ .84 20.0 5.3
July
All 13,003 .77 .74 ~ .89 20.7 5.2
Arabic 1,236 .77 .68 ~ .93 17.1 5.4
Korean 2,537 .75 .76 ~ .89 21.5 4.7
Spanish 722 .70 .65 ~ .87 20.5 4.8
September All 14,185 .76 .74 ~ .87 20.8 5.6
Arabic 1,207 .78 .74 ~ .92 17.6 6.1
Korean 1,194 .73 .70 ~ .89 19.9 5.4
Spanish 699 .74 .70 ~ .86 20.8 5.5
December All 8,710 .74 .73 ~ .88 21.3 4.9
Arabic 705 .77 .76 ~ .92 18.9 5.4
Korean 523 .73 .69 ~ .91 19.3 4.7
Spanish 659 .68 .65 ~ .85 21.3 4.6
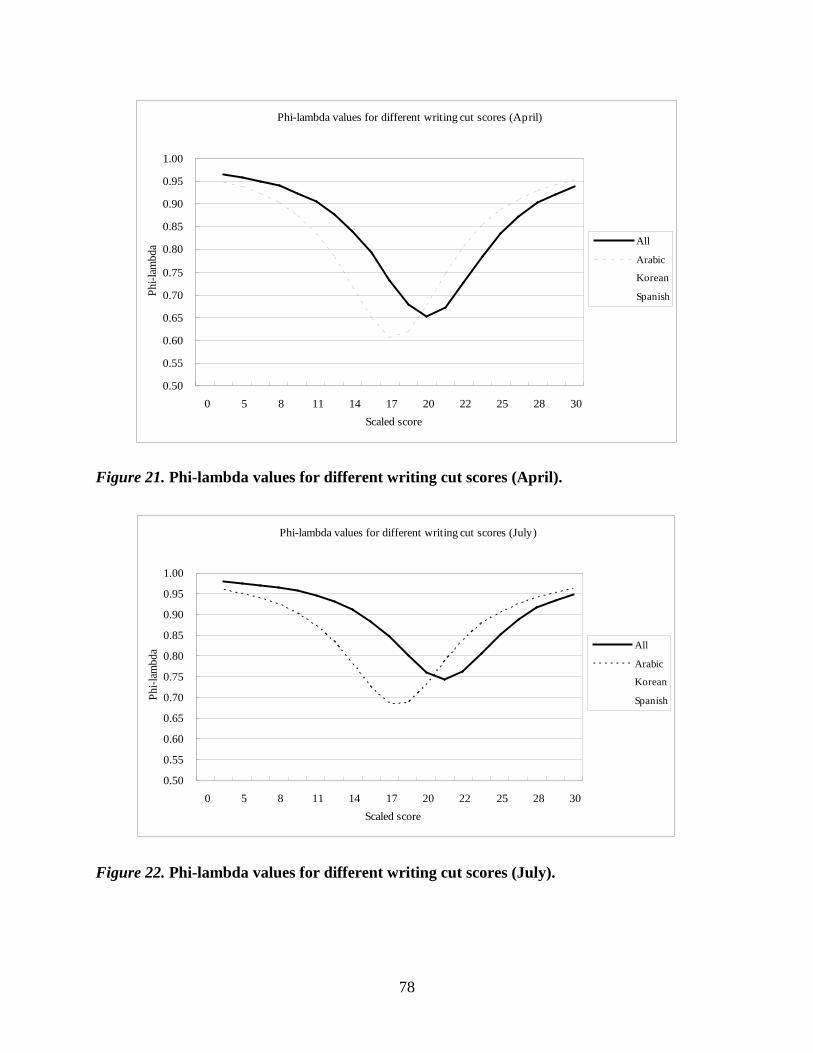
78
Figure 21. Phi-lambda values for different writing cut scores (April).
Figure 22. Phi-lambda values for different writing cut scores (July).
Phi-lambda values for different writing cut scores (April)
0.50
0.55
0.60
0.65
0.70
0.75
0.80
0.85
0.90
0.95
1.00
0 5 8 11 14 17 20 22 25 28 30Scaled score
Phi-l
ambd
a All
Arabic
Korean
Spanish
Phi-lambda values for different writing cut scores (July)
0.50
0.55
0.60
0.65
0.70
0.75
0.80
0.85
0.90
0.95
1.00
0 5 8 11 14 17 20 22 25 28 30Scaled score
Phi-l
ambd
a All
Arabic
Korean
Spanish

79
Figure 23. Phi-lambda values for different writing cut scores (September).
Figure 24. Phi-lambda values for different writing cut scores (December).
Discussion and Conclusions
The present study examined the value of reporting the four TOEFL iBT section scores
(reading, listening, speaking, and writing) for all examinees and three L1 groups (Arabic,
Korean, and Spanish) on four forms from multiple perspectives. Key findings are briefly
Phi-lambda values for different writing cut scores (September)
0.50
0.55
0.60
0.65
0.70
0.75
0.80
0.85
0.90
0.95
1.00
0 5 8 11 14 17 20 22 25 28 30Scaled score
Phi-l
ambd
a All
Arabic
Korean
Spanish
Phi-lambda values for different writing cut scores (December)
0.500.55
0.600.65
0.700.750.80
0.850.90
0.951.00
0 5 8 11 14 17 20 22 25 28 30Scaled score
Phi-l
ambd
a All
Arabic
Korean
Spanish

80
summarized below for each of the four research questions. Then, some pertinent issues of
concern are discussed to synthesize the results according to the interpretive and validity
arguments for TOEFL iBT proposed by Chapelle (2008) and Chapelle et al. (2008).
Research Question 1: Do the Section Scores Have Added Value Over the Total Test Score?
Results of Haberman’s (2008) subscore analysis based on CTT were similar for all
examinees as well as for the three L1 groups. Although reliability for all the sections was found
to be quite satisfactory, the sections varied in terms of the extent to which they had added value
over and above what the TOEFL iBT total score can offer. The speaking section was found to
have added value, justifying the reporting of the speaking section score. In contrast, reliability
estimates for the reading, listening, and writing sections were not high enough, according to the
criterion of Haberman, to declare that these section scores had added value. The difference of the
results between the speaking section and the other three sections is explained by the relative
distinctness of the speaking section score. The distinctness of the speaking section from the rest
found in this analysis was generally consistent with the results of the present factor analysis as
well as those of recent TOEFL iBT factor analyses by Sawaki et al. (2008), Stricker and Rock
(2008), and Stricker et al. (2005).
Research Question 2: Can Distinct Constructs Corresponding to the Four Modalities Be
Identified?
Investigation of the factor structure of the entire TOEFL iBT started with an EFA,
followed by a series of single-group and multiple-group CFA. The EFA suggested that a
correlated two-factor model might sufficiently account for the underlying structure of the test,
although the results were not entirely conclusive. In the subsequent CFA, a correlated four-factor
model was identified as the final CFA model for the total sample as well as for the three L1
groups. This model specified four correlated factors corresponding to the reading, listening,
speaking, and writing modalities. These factors were highly correlated with one another,
although the speaking factor was relatively more distinct from the others. The observed variables
substantially loaded on the target modalities; the integrated speaking and writing tasks were
minimally related to the additional factors (reading and listening) involved in the task designs.
The only exception was the integrated writing task, which loaded moderately on both the writing
and listening factors; its loading on the reading factor was minimal. Furthermore, the multiple-

81
group CFA on four forms showed that the number of factors, the relationships between the
observed variables (parcel and task scores) and the corresponding factors, and error variances of
the observed variables were invariant across the three L1 groups. Taken together, the EFA results
are consistent with those of the CTT-based subscore analysis above, which suggested the
presence of two distinct factors; however, the CFA results were different, indicating that the
factor structure of the test would be best explained by a correlated four-factor structure. The
results of the present CFA results are not entirely consistent with previous factor analyses of the
TOEFL iBT prototype and field test forms either. Some issues related to this point will be
discussed in more detail below.
Research Question 3: What Different Types of Language Profiles Are Present Across
Modalities Within the TOEFL Population? If Distinct Score Profiles Are Identified, What
Proportion of Students Have Nonflat Score Profiles That Supports the Utility of Score
Profiles Across Modalities?
The cluster analyses conducted on standardized section scores did not reveal the presence
of any meaningful clusters of examinees. Although the analysis results suggested that identifying
three or four clusters may be possible, the mean score profiles for the different clusters obtained
from those solutions were flat. That is, each group scored roughly the same in terms of
standardized scores across all four sections. Thus, these score profiles would not be useful for
identifying relative strengths and weaknesses of individual examinees across different areas.
Research Question 4: Is the Generalizability of Section Scores for Norm-Referenced Score
Interpretations and the Dependability of Decisions Made Based on Predetermined Cut
Scores for TOEFL iBT Section Scores for Criterion-Referenced Score Interpretations
Satisfactory for High-Stakes Contexts?
For this analysis, we focused on the generalizability coefficient (G coefficient) for norm-
referenced score interpretations and Φ (λ), an index of dependability of decisions based on
predetermined cut scores for criterion-referenced score interpretations developed within the G-
theory framework. We examined the G coefficients for the section scores and the values of Φ (λ)
associated with a range of cut scores for the TOEFL iBT sections reported previously by score
user institutions to ETS for international student admission to undergraduate and
graduate/postgraduate programs (14 to 27 for listening and 16 to 27 for reading, speaking, and

82
writing). Results showed that the generalizabilty of the section scores for norm-referenced score
interpretations were acceptable in general. The dependability of pass-fail classification decisions
made based on the cut score ranges reported by the institutions was mostly satisfactory for the
reading, listening, and speaking sections. However, it was relatively low for the writing section
as well as for some samples and on some forms for the other three sections, depending on the
location of the group mean relative to the cut score and the relative contribution of different
sources of score variability to the section score variance. Furthermore, some of the G-theory
analysis runs that produced relatively low G coefficients and Φ (λ) estimates seem to offer some
useful information for examining fairness of the test content across subgroups and the
comparability of task content across forms. For example, in one form, a greater difference in
terms of difficulty was suggested across the three texts that appeared in the reading section for
the Korean and Spanish groups than in the other samples and forms. In the writing section,
examinees in the Spanish group had a tendency to be rank-ordered differently across the two
tasks relatively more than those in the other groups. These results indicate that the groups may
differ in terms of topic and task familiarity. Moreover, the difficulty differences across the
conversation texts that appeared in the listening section in two forms were found to be greater
than in the other forms, and that these differences were the largest for the Arabic group across
forms. This suggests that a set of texts that are assembled to create a form may not always be
comparable across forms and subgroups in terms of difficulty.
This study generated various pieces of empirical evidence relevant to the generalization
and explanation inferences as defined in the interpretive/validity argument framework for the
TOEFL iBT by Chapelle (2008) and Chapelle et al. (2008). The results are summarized below
according to these two inferences.
Generalization Inference
A key issue of concern in Chapelle et al.’s (2008) generalization inference is the
psychometric quality of the measurement of examinee’s language ability obtained from the
TOEFL iBT. Relevant results were obtained from the CTT-based subscore analysis based on
Haberman’s (2008) method and the G-theory analysis of the generalizability of norm-referenced
decisions and the dependability of the criterion-referenced decisions made based on
predetermined cut scores. The CTT-based subscore analysis showed that the speaking section
score had added value given the high reliability and its distinctness from the other sections, but
83
that reporting the other section scores may not be justified due to a combination of relatively low
reliability estimates and relatively high intercorrelations among them. In the G-theory analysis,
the generalizability of the section scores for relative decisions and the dependability of absolute
decisions made at predetermined cut scores were examined, taking account of multiple
systematic sources of score variance reflective of the measurement designs of the TOEFL iBT
sections. The G coefficients obtained from the G-theory analysis suggested that the
generalizability of the TOEFL iBT section scores for norm-referenced decisions was acceptable
in general, although that of the writing section was relatively low. Moreover, the dependability
of decisions made based on the cut scores for international student admission previously reported
to ETS by score user institutions (14 to 27 for listening, and 16 to 27 for reading, speaking, and
writing) was generally acceptable, although it was found to be relatively low in some
circumstances. To sum up, backing for this inference was obtained for the generalizability of the
reading, listening, and speaking section scores; the dependability of classification decisions made
at predetermined cut scores for these three sections and the added value for the speaking section.
In contrast, the backing for the generalizability and dependability of the writing score and the
added value of the reading, listening, and writing sections was relatively weaker.
It should be noted that the relatively low generalizability and dependability for the
writing section found in this study must be interpreted with caution. This is because neither the
CTT-based reliability estimates nor the G-theory analysis of the writing section modeled the two
task types: independent writing and integrated writing (reading/listening/writing). Not being able
to model task types in the analyses has an important implication to the interpretation of the
present results. The relatively low reliability estimates obtained in the CTT-based subscore
analysis and the fairly large task variance component estimates observed in the G-theory analysis
suggested that the examinees were rank-ordered quite differently across the two writing tasks.
Given that the two tasks are designed to assess different aspects of academic writing ability, this
result was expected. Reflecting this design principle, therefore, task type should be defined
ideally as a fixed facet in the G-theory framework, so that the performance differences across the
tasks is conceptualized as coming from construct differences rather than from inconsistency in
the measurement (i.e., measurement error). However, it was not possible to do so because there
is only one task representing each task type in the writing section, resulting in the current study
design where the two writing tasks were treated as randomly parallel measures. Given this

84
incongruence between the measurement design versus how error is conceptualized in the specific
D-study design employed, as well as the fact that there were only two tasks in the section, the
relatively low G coefficients and the Φ (λ) estimates for the cut score ranges for the writing
section were understandable.
Second, the G-theory analysis results for the speaking section must be interpreted with
caution. In examining the reliability of performance assessments where examinee responses are
scored by raters, rater effects are considered an important facet of measurement that is deemed to
explain at least some portion of the measurement error. However, the D-study design employed
for this section (the multivariate p● x I○ design) did not take account of rater effects because only
a single rating was available for a majority of the examinees in the data analyzed in this study.
Previous G-theory analyses of TOEFL iBT speaking data that modeled rater effects showed that
score variability due to these effects were nonzero, although they were not so pronounced as
task-related effects. For example, in Lee’s (2005) analysis of TOEFL iBT speaking prototype
data, double ratings were available for the data he analyzed. Thus, Lee analyzed the data using a
Univariate Person x Task x Rating design and a Multivariate Person● x Task○ x Rating● design,
treating the raters as randomly exchangeable to one another. Lee’s univariate G study showed
that variance components involving ratings were very small (the rating main effect and the
person-by-rating interaction together explained less than 2% of the total score variance); those
related to tasks explained a considerable portion of the total score variance (e.g., the person-by-
task interaction explained 17% of the variance). A similar pattern was observed in Lee’s
multivariate G study, although there were some differences in the size of measurement error
explained by rating-related variance components across the task types. Meanwhile, Xi (2007a)
conducted a G-theory analysis of TOEFL iBT speaking task ratings using analytic ratings of
examinee responses on three different dimensions (delivery, language use, and topic
development). In her Univariate Persons x Raters x Tasks G study, Xi modeled score variability
due to differences across individual raters because her rating design allowed for identification of
blocks of responses scored by different rater pairs. Her results showed that rater severity
differences and examinee rank-ordering differences across raters together explained much
smaller portions of the total score variances across the three analytic scales (a total of 3.7 to 5.6%
of the total score variance with adjudicated scores and 6.0 to 9.0% without adjudication) than
person-by-task interaction. The D-study design for the speaking section employed in the present

85
study included the task facet, an important facet contributing to measurement error. However,
when a facet of measurement that contributes to measurement error such as a rating- or rater-
related effect is not modeled in a D study, the proportion of variance attributable to the facet
contributes to the person variance component, making G coefficients and Φ (λ) estimates look
higher than they actually are (Brennan, 2001). Given that the proportion of score variance
accounted for by rating- and rater-related effects were nonzero in Lee’s and Xi’s studies cited
above, it is expected that the G coefficients and Φ (λ) estimates obtained in this study are higher
than they should actually be than when rating effects are modeled.
Third, the meaning of the Φ (λ) values reported in this study should be interpreted
properly. Some strengths of Φ (λ), a squared-error loss agreement index reported in this study,
include (a) its sensitivity to the distance of individual scores from the cut score (Brown &
Hudson, 2002) and (b) its flexibility for modeling unique measurement designs for the different
TOEFL iBT sections because the index was developed within the G-theory framework. Note,
however, that this index, which indicates the degree of accuracy in the estimate of individual
candidates’ distances from a given cut score across randomly parallel testing, provides quite
different information from indices of classification consistency across multiple testing occasions.
For example, Haberman (2005) recently suggested examining the conditional probability of
obtaining a high score (i.e., a score above a cut point) consistently across two parallel forms of a
test involving cut scores. We computed these values for the April form as an illustrative
example. The Cronbach’s alpha estimates obtained in Haberman’s subscore analyses reported in
Tables 4 to 7 were used for the calculation. For all examinees and for the three L1 groups, Table
28 shows four different cut scores within the cut score ranges for the TOEFL iBT section scores
and the corresponding conditional probabilities that a person who scores above a given cut score
in the first testing occasion obtains a score above the cut point when testing on a parallel form for
a second time. As can be seen in the table, the conditional probability is the highest at the lower
bound of the cut score. It decreases consistently as the cut score increases. For example, for the
Korean sample, the conditional probability for a candidate to score above a cut score consistently
across different forms on the reading section is 89 when the cut score is 16, whereas the estimate
decreases to as low as 65 when the cut score is set at 27. Recall that the section mean score for
the Korean group was 19.4, which means that Φ (λ) takes its lowest value around the score of 19.
Therefore, an institution can use this information to set a cut score for the reading section by
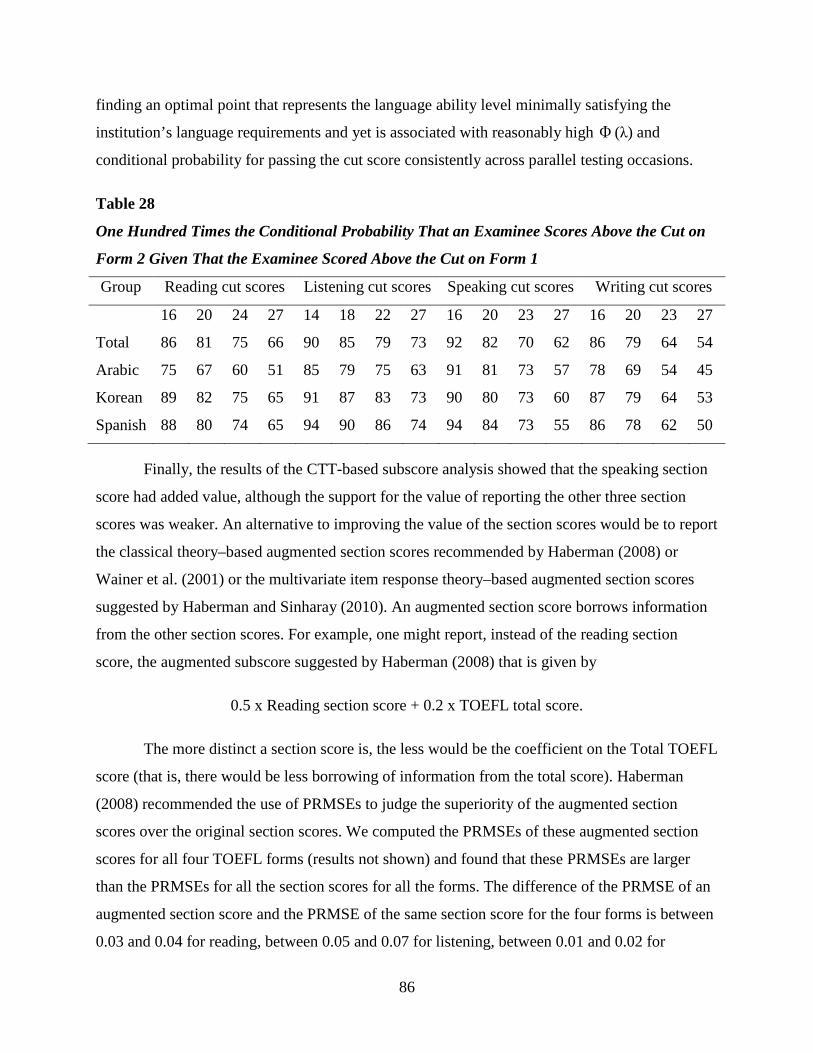
86
finding an optimal point that represents the language ability level minimally satisfying the
institution’s language requirements and yet is associated with reasonably high Φ (λ) and
conditional probability for passing the cut score consistently across parallel testing occasions.
Table 28
One Hundred Times the Conditional Probability That an Examinee Scores Above the Cut on
Form 2 Given That the Examinee Scored Above the Cut on Form 1
Group Reading cut scores Listening cut scores Speaking cut scores Writing cut scores
16 20 24 27 14 18 22 27 16 20 23 27 16 20 23 27
Total 86 81 75 66 90 85 79 73 92 82 70 62 86 79 64 54
Arabic 75 67 60 51 85 79 75 63 91 81 73 57 78 69 54 45
Korean 89 82 75 65 91 87 83 73 90 80 73 60 87 79 64 53
Spanish 88 80 74 65 94 90 86 74 94 84 73 55 86 78 62 50
Finally, the results of the CTT-based subscore analysis showed that the speaking section
score had added value, although the support for the value of reporting the other three section
scores was weaker. An alternative to improving the value of the section scores would be to report
the classical theory–based augmented section scores recommended by Haberman (2008) or
Wainer et al. (2001) or the multivariate item response theory–based augmented section scores
suggested by Haberman and Sinharay (2010). An augmented section score borrows information
from the other section scores. For example, one might report, instead of the reading section
score, the augmented subscore suggested by Haberman (2008) that is given by
0.5 x Reading section score + 0.2 x TOEFL total score.
The more distinct a section score is, the less would be the coefficient on the Total TOEFL
score (that is, there would be less borrowing of information from the total score). Haberman
(2008) recommended the use of PRMSEs to judge the superiority of the augmented section
scores over the original section scores. We computed the PRMSEs of these augmented section
scores for all four TOEFL forms (results not shown) and found that these PRMSEs are larger
than the PRMSEs for all the section scores for all the forms. The difference of the PRMSE of an
augmented section score and the PRMSE of the same section score for the four forms is between
0.03 and 0.04 for reading, between 0.05 and 0.07 for listening, between 0.01 and 0.02 for

87
speaking, and between 0.12 and 0.21 for writing (because the PRMSEs are like reliability, one
can treat the larger PRMSEs of the augmented section scores as indicating higher reliability).
The small differences for the speaking section are another indication that the speaking section is
distinct from the other section scores, and the large differences for the writing section are another
indication that the writing section is not very distinct from the other section scores. Although
augmentation would enhance the reliability of the TOEFL iBT section scores, taking this
approach can introduce another issue of concern. That is, compared to the scaled scores currently
reported, augmented section scores would be more difficult to interpret for examinees and score
users. If the use of such an alternative is indeed considered, this communication issue should be
examined closely. More research is currently underway on reporting of augmented TOEFL
section scores.
Explanation Inference
The explanation inference (Chapelle, 2008; Chapelle et al., 2008) concerns the
relationship between the scores obtained on the TOEFL iBT and theoretical constructs of
academic language ability. In particular, this study focused on examining the degree to which the
constructs assessed in the four sections were distinct from one another and whether distinct score
profiles that are useful for identification of examinee strengths and weaknesses could be
identified. The relationships among the TOEFL iBT sections obtained in the CTT-based
subscore analysis and the factor analysis, as well as the cluster analysis results, offered empirical
evidence relevant to the explanation inference.
The results suggest that the constructs assessed across the sections were multidimensional
(i.e., the test tapped more than one latent construct). However, the results were mixed as to how
many constructs were present and how they were related to one another. On the one hand, the
results of both the CTT-based subscore analysis and the EFA suggested that the speaking section
score was distinct from the reading, listening, and writing scores but that the latter three section
scores were not distinct from one another. On the other hand, results of the CFA were partly
consistent with those of the CTT-based subscore analysis and EFA in that the speaking section
was found to be relatively distinct from the others. Yet, when four CFA models representing
alternative explanations for the factor structure of the test were compared, the correlated four-
factor model, which suggested that the four sections were correlated but sufficiently distinct from
one another, was identified as the best-fitting model. This factor structure was found to be

88
invariant across the three L1 groups as well. However, partly as a reflection of the high
intercorrelations among the sections, the cluster analysis did not yield score profiles useful for
identifying individual examinees’ relative strengths and weaknesses across the sections. That is,
examinees that scored high on one section tended to score high on another, leading to
identification of flat score profiles.
The incongruence of the results between the CTT-based subscore analysis and the EFA
as opposed to the CFA may be explained in terms of some differences in the features of the
analytic approaches employed. Note that the CTT-based subscore analysis was distinct from both
the EFA and CFA, in that the CTT-based analysis was conducted at the level of observed scores
and the EFA and CFA modeled the relationships among the sections at the level of latent
constructs. However, this difference does not seem to explain the divergent findings of the CFA
from those of the CTT-based subscore analysis and the EFA in this study. A more reasonable
explanation is that the CFA took a confirmatory approach, which focused on testing relative
goodness-of-fit of models reflecting the test design principles and factor structures that are
plausible from theoretical perspectives. In contrast, the other two analytic approaches were data-
driven. Furthermore, unlike in the other two approaches, the CFA specified, as closely as
possible, not only the relationships of the integrated speaking and writing tasks to their target
modalities (speaking and writing) but also their relationships to additional modalities involved in
the task design (reading and listening). Therefore, it seems that both a correlated two-factor
structure and a correlated four-factor structure can serve as reasonable representations of the
underlying factor structure of the TOEFL iBT, depending on the analytic approach employed.
The correlated four-factor model selected as the final CFA model in this study is
consistent with the current view in the field of language testing that language ability comprises
multiple, highly related constructs. However, the present CFA results differ from those of a
recent factor analysis of a TOEFL iBT field test form by Sawaki et al. (2008) and Stricker and
Rock (2008), both of which identified higher-order factor models consisting of a general higher-
order factor and four first-order factors corresponding to the four modalities. In the present study,
the higher-order factor model fit the data well, and the results were fully interpretable for three of
the eight runs. However, this model was not adopted as the final model due to difficulties in
interpreting model parameter estimates in the other five runs. Because the factor analyses of the
TOEFL iBT field study form were conducted by Sawaki et al. and Stricker and Rock, little

89
substantive changes have been made to the test design. The parcel-level factor analysis employed
in this study was similar to the approach taken by Stricker and Rock as well. Thus, neither test
design differences nor methodological differences explain the discrepancy in the conclusions of
the factor analyses of the field study test form and the present study. A possible explanation may
be the somewhat increased homogeneity of the data for the samples analyzed in this study,
presumably reflecting differential levels of motivation and familiarity with the TOEFL iBT
format between the field study participants and the operational test takers involved in this study.
It is expected that the higher the intercorrelations across the sections become, the more difficult it
becomes to identify a higher-order factor structure because a higher-order structure assumes the
presence of four correlated but distinct constructs across the sections.
In the future it is worth replicating the investigation of the factor structure of the test in
more detail, focusing specifically on the factor structure of the writing section. One notable
difference between the correlated four-factor model identified in this study and the higher-order
factor model adopted by Sawaki et al. (2008) is the factor loading pattern of the writing section.
In the correlated four-factor model identified in this study, all three paths from the writing factor
to the reading, listening, and writing modalities could be estimated successfully. In the resulting
model, the integrated writing task loaded moderately on both the writing and listening factors;
the loading of this task on the reading factor was minimal. In contrast, however, the higher-order
factor model tested in this study and by Sawaki et al. did not allow simultaneous modeling of all
three paths due to model identification problems. Thus, a version of the higher-order factor
model that specified only two paths (the paths from the reading and writing factors to the
integrated writing task) was presented. In addition to this version of the higher-order factor
model (shown in Tables 18 and 19), another version that specified only the paths from the
writing and listening factors to the task were tested as well. 21 Across these versions of the
higher-order factor model, the same factor-loading pattern was observed for the writing tasks.
That is, both the integrated and independent writing tasks loaded primarily on the writing factor;
the loading of the integrated writing task on the reading or listening factor was minimal. Thus, it
seems to be the case that, when the higher-order factor model is specified, part of variance for
the integrated writing task attributable to the additional modalities could be explained by the
loading of the task on the general factor. In contrast, when such a general factor is absent as in

90
the correlated four-factor model, the involvement of multiple modalities in the integrated writing
task was reflected in its moderate loadings on the listening factor.
Accordingly, future studies should examine which of the two representations of the factor
structure of the writing section above is more viable because this affects the interpretation of the
writing section score. On the one hand, the substantial loading of the integrated writing task on
the writing factor and its minimal loading on other modalities involved in the higher-order factor
model is consistent with the view that the integrated writing task can still be interpreted primarily
as a measure of writing ability, supporting the practice of including the integrated writing task
for the calculation of the writing section score. On the other hand, the moderate loading of the
integrated writing task on both the writing and listening factors in the correlated four-factor
model suggests that examinee performance on the integrated writing task is interpreted as
reflecting both writing and listening abilities. This is expected given the critical importance of
aural comprehension of the lecture for integrating the content from the reading and listening
materials on this task. At the same time, however, this makes it difficult to support the current
practice of reporting the writing section score obtained by combining scores across both writing
tasks because the section score would be a reflection of not only writing ability but also listening
ability to some extent.
In conclusion, the present study yielded mixed results about the extent to which the
TOEFL iBT section scores offer value-added information to score users when the particular
psychometric qualities of the TOEFL iBT section scores examined in this study are concerned.
That is, although the speaking section score may provide relatively more distinct information
from the other sections, there is a fairly high degree of overlap across the reading, listening, and
writing sections because of their high intercorrelations. In other words, because a high
correlation between a pair of factors in the final model adopted in this study means the similarity
in examinee rank-ordering results across two sections, the rank-ordering results that the
institutions obtain from the different TOEFL iBT sections will be quite similar. Second, the
reliability/generalizability of the section scores for norm-referenced decisions is satisfactory
overall. However, the dependability of criterion-referenced decisions based on cut scores varies,
depending on the location of cut scores, their relative distance from the group means, and
relative contribution of different sources of measurement error to the total score variance.

91
Nevertheless, the results of the psychometric analyses in this study do not necessarily
diminish the value of reporting four TOEFL iBT section scores. From a theoretical point of view,
each section of the test is designed to elicit examinee performance on specific language-use tasks
in a given modality that reflects frequent and important language use tasks in academia.
Therefore, the section scores may provide richer information than the total score for score user
institutions to confirm that examinees can actually perform at a satisfactory level on a sample of
representative language use tasks across the TOEFL iBT sections. This in turn may help score-
user institutions make better judgments as to how examinees might perform when they arrive on
campus. Thus, in this sense, the section scores still serve as useful supplements to the TOEFL
iBT total score when evaluating whether a candidate has a language profile that meets the
language demands of a specific academic program.
The results of the present study are helpful for us to better understand how the TOEFL
iBT section scores are functioning. However, results of this study, which focused on some
selected psychometric qualities of the section scores themselves, should be combined with other
types of investigations for a well-rounded examination of the value of reporting the section
scores. An important possibility to consider is to combine the present results with other studies
that examine the value of the information the TOEFL iBT section scores offer from the
perspectives of the extrapolation inference and the utilization inference in Chapelle et al.’s
(2008) framework. In terms of the extrapolation inference, for example, a predictive validity
study with a focus on TOEFL iBT subscores could examine the extent to which the section
scores serve as useful predictors of examinee performance in the academic domain. As for the
utilization inference, one might conduct a test score user survey in order to examine in detail
how score users currently use the TOEFL iBT section scores for various types of decision
making, and how useful they find the section scores are for their purposes. Such studies would be
essential for enhancing the validity argument for the score interpretation and use of the TOEFL
iBT section scores.

92
References
American Educational Research Association, American Psychological Association, & National
Council on Measurement in Education. (1999). Standards for Educational and
Psychological Testing. Washington DC: American Educational Research Association.
Bachman, L. F. (2005). Building and supporting a case for test use. Language Assessment
Quarterly, 2(1), 1–34.
Bachman, L. F., Davidson, F., Ryan, K., & Choi, I.-C, (1995). An investigation into the
comparability of two tests of English as a foreign language: The Cambridge-TOEFL
comparability study. Cambridge, UK: Cambridge University Press.
Bachman, L. F., & Palmer, A. (1981). The construct validation of the FSI oral interview.
Language Learning, 31, 67–86.
Bachman, L. F., & Palmer, A. (1996). Language testing in practice. Oxford, UK: Oxford
University Press.
Bagozzi, R. P., & Heatherton, T. D. (1994). A general approach to representing multifaceted
personality constructs: Application to state self-esteem. Structural Equation Modeling,
1(1), 35–67.
Bentler, P. M. (2007). EQS (Version 6.1, Build 94) [Computer software]. Encino, CA:
Multivariate Software.
Brennan, R. L. (1992). Elements of generalizability theory. Iowa City, IA: American College
Testing.
Brennan, R. L. (1999). mGENOVA (Version 2.0) [Computer software]. Iowa City: University of
Iowa, Iowa Testing Programs.
Brennan, R. L. (2001). Generalizability theory. New York, NY: Springer-Verlag.
Brennan, R. L., & Kane, M. T. (1977a). An index of dependability for mastery tests. Journal of
Educational Measurement, 14, 277–289.
Brennan, R. L., & Kane, M. T. (1977b). Signal/noise ratios for domain-referenced tests.
Psychometrika, 42, 609–625.
Brown, J. D., & Hudson, T. (2002). Criterion-related language testing. Cambridge, UK:
Cambridge University Press.
Brown, T. A. (2006). Confirmatory factor analysis for applied research. New York, NY:
Guilford.

93
Browne, M. W., & Cudeck, R. (1993). Alternative ways of assessing model fit. In K. A. Bollen
& J. S. Long (Eds.), Testing structural equation models (pp. 136–162). Newbury Park,
CA: Sage Publications.
Chapelle, C. A. (2008). The TOEFL validity argument. In C. A., Chapelle, M. K., Enright, & J.
M. Jamieson (Eds.), Building a validity argument for the Test of English as a Foreign
Language™ (pp. 319–352). New York, NY: Routledge.
Chapelle, C. A., Enright, M. K., & Jamieson, J. M. (2008). Test score interpretation and use. In
C. A. Chapelle, M. K. Enright, & J. M. Jamieson (Eds.), Building a validity argument for
the Test of English as a Foreign Language (pp. 1–26). New York, NY: Routledge.
Clatworthy, J., Buick, D., Hankins, M., Weinman, J., & Horne, R. (2005). The use and reporting
of cluster analysis in health psychology: A review. British Journal of Health Psychology,
10(3), 329–358.
Cronbach, L. J., Gleser, G. C., Nanda, H., & Rajaratnam, N. (1972). The dependability of
behavioral measurements: Theory of generalizability for scores and profiles. New York,
NY: Wiley.
Dimitriadou, E., Dolnicar, S., & Weingassel, A. (2002). An examination of indexes for
determining the number of clusters in binary data sets. Psychometrika, 67(1), 137–160.
Dorans, N. J., & Lawrence, I. M. (1999). The role of the unit of analysis in dimensionality
assessment (Research Report No. RR-99-14). Princeton, NJ: Educational Testing Service.
Fabriger, L. R., Wegener, D. T., MacCallum, R. C., & Strahan, E. J. (1999). Evaluating the use
of exploratory factor analysis in psychological research. Psychological Methods, 4(3),
272–299.
Feldt, L. S., & Brennan, R. L. (1989). Reliability. In R. L. Linn (Ed.), Educational measurement
(3rd ed., pp. 105–146). Phoenix, AZ: American Council on Education/Macmillan
Publishing.
Haberman, S. J. (2005). Interpretations of reliability (Research Report No. RR-05-29).
Princeton, NJ: Educational Testing Service.
Haberman, S. J. (2008). When can subscores have value? Journal of Educational and Behavioral
Statistics, 33, 204–229.
Haberman, S. J., & Sinharay, S. (2010). Subscores based on multidimensional item response
theory. Psychometrika, 75, 209–227.

94
Haertel, E. H. (2006). Reliability. In R. L. Brennan (Ed.), Educational measurement (4th ed.,
pp. 65–111). Westport, CT: American Council on Education and Praeger Publishers.
Hoyle, R. H., & Panter, A. T. (1995). Writing about structural equation models. In R. H. Hoyle
(Ed.), Structural equation modeling: Concepts, issues, and applications (pp. 158–176).
Thousand Oaks, CA: Sage Publications.
Hu, L., & Bentler, P. M. (1995). Evaluating model fit. In R. H. Hoyle (Ed.), Structural equation
modeling: Concepts, issues, and applications (pp. 76–99). Thousand Oaks, CA: Sage.
Hu, L., & Bentler, P. M. (1999). Cutoff criteria for fit indexes in covariance structure analysis:
Conventional criteria versus new alternatives. Structural Equation Modeling, 6, 1–55.
Jöreskog, K. G. (2007). Factor analysis and its extensions. In R. Cudeck & R. C. MacCallum
(Eds.), Factor analysis at 100: Historical developments and future directions (pp. 47–77).
Mahwah, NJ: Erlbaum.
Kaiser, H. F. (1960). The application of electronic computers to factor analysis. Educational and
Psychological Measurement, 20, 141–151.
Kane, M. (2004). Certification testing as an illustration of argument-based validation.
Measurement, 2, 135–170.
Kane, M., Crooks, T., & Cohen, A. (1999). Validating measures of performance. Educational
Measurement: Issues and Practice, 18(2), 5–17.
Kunnan, A. (1995). Test taker characteristics and test performance: A structural equation
modeling approach. Cambridge, UK: Cambridge University Press.
Lee, Y.-W. (2005). Dependability of scores for a new ESL speaking test: Evaluating prototype
tasks (TOEFL Monograph No. 28). Princeton, NJ: Educational Testing Service.
Lee, Y.-W., & Kantor, R. (2005). Dependability of new ESL writing test scores: Evaluating
prototype tasks and alternative rating schemes (TOEFL Monograph Series No. 31).
Princeton, NJ: Educational Testing Service.
Lee, Y.-W., & Sawaki, Y. (2009). Application of three diagnosis models to ESL reading and
listening assessments. Language Assessment Quarterly, 6(3), 239–263.
Little, T. D., Cunningham, W. A., & Shahar, G. (2002). To parcel or not to parcel: Exploring the
question, weighing the merits. Structural Equation Modeling, 9(2), 151–173.
Llosa, L. (2007). Validating a standards-based classroom assessment of English proficiency: A
multitrait-multimethod approach. Language Testing, 24, 489–515.

95
Luecht, R. M., Gierl, M. J., Tan, X., & Huff, K. (2006, April). Scalability and the development of
useful diagnostic scales. Paper presented at the annual meeting of the National Council
on Measurement in Education, San Francisco, CA.
Meade, A. W., & Kroustalis, C. M. (2006). Problems with item parceling for confirmatory factor
analytic tests of measurement invariance. Organizational Research Methods, 9, 369–403.
Milligan, G. W. (1980). An examination of the effect of six types of error perturbation on fifteen
clustering algorithms. Psychometrika, 45, 325–342.
Milligan, G. W., & Cooper, M. C. (1985). An examination of procedures for determining the
number of clusters in a data set. Psychometrika, 50, 159–179.
Sasaki, M. (1996). Second language proficiency, foreign language aptitude, and intelligence:
Quantitative and qualitative analyses. New York, NY: Lang.
Satorra, A. (1990). Robustness issues in structural equation modeling: A review of recent
developments. Quality & Quantity 24, 367–386.
Satorra, A., & Bentler, P. (1999). A scaled difference chi-square test statistic for moment
structure analysis (UCLA Statistics Series No. 260). Los Angeles: University of
California.
Sawaki, Y., Stricker, L., & Oranje, A. (2008). Factor structure of the TOEFL® Internet-based
test (iBT): Exploration in a field trial sample (TOEFL iBT Research Report No.
TOEFLiBT-04). Princeton, NJ: Educational Testing Service.
Shavelson, R. J., & Webb, N. M. (1991). Generalizability theory: A primer. Newbury Park, CA:
Sage Publications.
Shin, S.-K. (2005). Did they take the same test? Examinee language proficiency and the structure
of language tests. Language Testing, 22, 31–57.
Sinharay, S. (2010). When can subscores be expected to have added value? Results from
Operational and Simulated Data. Journal of Educational Measurement, 47, 150–174.
Sinharay, S., Haberman, S. J., & Puhan, G. (2007). Subscores based on classical test theory: To
report or not to report. Educational Measurement: Issues and Practice, 26, 21–28.
Stricker, L. J., & Rock, D. A. (2008). Factor structure of the TOEFL® Internet-based test across
subgroups (TOEFL iBT Research Report No. TOEFL-iBT-07). Princeton, NJ:
Educational Testing Service.

96
Stricker, L. J., Rock, D. A., & Lee, Y.-W. (2005). Factor structure of the LanguEdge test across
language groups (TOEFL Monograph Series MS-32). Princeton, NJ: Educational Testing
Service.
Toulmin, S. E. (2003). The use of argument (updated ed.). Cambridge, UK: Cambridge
University Press.
Vandenberg, R. J., & Lance, C. E. (2000). A review and synthesis of the measurement invariance
literature: Suggestions, practices, and recommendations for organizational research.
Organizational Research Methods, 3, 4–70.
Wainer, H., Vevea, J. L., Camacho, F., Reeve, B. B., Rosa, K., Nelson, L., Swygert, K. A., &
Thissen, D. (2001). Augmented scores—“borrowing strength” to compute scores based
on small numbers of items. In D. Thissen & H. Wainer (Eds.), Test scoring (pp. 343–
387). Hillsdale, NJ: Lawrence Erlbaum.
Wang, L., Eignor, E., & Enright, M. K. (2008). A final analysis. In C. A. Chapelle, M. K.
Enright, & J. M. Jamieson (Eds.), Building a validity argument for the Test of English as
a Foreign Language (pp. 259–318). New York, NY: Routledge.
Xi, X. (2007a). Evaluating analytic scores for the TOEFL® Academic Speaking Test (TAST) for
operational use. Language Testing, 24(2), 251–286.
Xi, X. (2007b). Validating TOEFL iBT Speaking and setting score requirements for ITA
screening. Language Assessment Quarterly, 4(4), 318–351.
Zwick, W. R., & Velicer, W. F. (1986). Comparison of five rules for determining the number of
components to retain. Psychological Bulletin, 99, 432–442.

97
.
Notes 1 Sandip Sinharay can be contacted at [email protected]. 2 ETS website, http://www.ets.org, retrieved on December 14, 2008. 3 As pointed out by Chapelle et al. (2008), however, the process of test design, development, and
validation is oftentimes iterative. Given that, building a validity argument through examining
each of the six inferences would have to proceed in an iterative manner in practice. 4 Note that we use this definition of added value, which is different from the definition of added
value used in, for example, educational evaluation studies, throughout this paper. 5 Although rater-related effects are considered important sources of score variation in
performance-based assessment, this rating design based on a single rating was supported by
Lee’s (2005) study of TOEFL iBT speaking prototype data, which suggested relatively large
impact of task-related effects on the dependability of ratings than rater-related effects. Lee’s
study showed that obtaining a single rating on six different tasks would result in satisfactory
score reliability. 6 A larger PRMSE is equivalent to a smaller mean squared error in predicting the true section
score and hence is a desirable property. 7 The variance-covariance matrices used for the EFA and CFA presented in this report are
available from the first author upon request. 8 This strategy is the same as the one employed by Sawaki et al. (2008). Because the writing
section comprises only two writing tasks, estimating all the paths involved in the design of the
integrated writing task (the loadings of this task on to the reading, listening, and writing
factors) results in an unidentified model. Thus, only two loadings for the integrated writing
task (loadings of this task onto the reading and writing factors) were estimated. (See the
discussion and conclusion section on more details about a related issue.) 9 A disturbance refers to residual variance. In the higher-order factor model described here, the
disturbances refer to the proportions of the variances of the first-order factors not explained
by the higher-order factor. 10 A primary goal of factor analysis is to identify a common factor model that reproduces the
observed covariance matrix well (Brown, 2006). Thus, these model fit measures provide
information regarding the extent to which a proposed factor model provides a good

98
approximation of the covariance matrix being analyzed, rather than how well the model can
predict responses of individuals. Developing a measure based on the difference between
observed and model-estimated responses might be an item for further research. 11 As mentioned in Note 10 above, the goal of factor analysis is to reproduce the observed
covariance matrix by identifying a well-fitting model. Thus, residuals are not computed for
each observation as in several statistical applications such as linear regression. Instead,
residuals for covariance matrices are calculated instead (EQS technical support, personal
communication, February 25, 2010). SRMR is a standardized version of the root mean square
residual (RMR), which is based on the mean discrepancy between the elements of the
observed and model-estimated covariance matrix. 12 In previous factor analyses of the TOEFL iBT prototype and field study data (Sawaki et al.,
2008; Stricker & Rock, 2008; Stricker et al., 2005), the distinctness of a pair of factors from
each other was evaluated based on the absolute value of the estimated interfactor correlation.
When the absolute value of an estimated interfactor correlation was smaller than the rule-of-
thumb value of .90, the two factors were declared as distinct from each other. This approach
was not employed in this study because the choice of the value of .90 is rather arbitrary. (See
Brown, 2006, for example, for other values employed in applied research.) Moreover, there
was no principled way to systematically evaluate borderline values (e.g., an interfactor
correlation of .89, which was observed between the reading and listening sections in Sawaki
et al.’s study). For these reasons, Bagozzi and Heatherton’s (1994) statistical test approach
above was deemed preferable. 13 In Brennan’s (2001) notation, filled (●) and open (○) circles denote the relationship of a given
facet with levels of the fixed facet. For example, in the p● x (I○:T○) design for the D study
employed for the listening section in this study, persons is a linked facet. The same persons
completed all items in both the conversation and lecture sets. Therefore, the random effects p
x (I:T) designs for the two levels of the fixed facet (conversation vs. lecture) are linked by
sharing the common persons. In contrast, the item and text facets in this multivariate study
design are independent facets in the sense that they are not shared across the different levels
of the fixed facet.

99
14 In order to distinguish the task facet for the speaking section from the text facet modeled for
the reading and listening sections, the symbol i (for items) was used to denote tasks. 15The present G- and D-study designs employed for the speaking section did not take account of
rater effects, which is deemed to affect the analysis results at least to some extent. See the
discussion and conclusion section on further details on this issue. 16 Similar to the tasks in the speaking section, the symbol i (for items) was used to denote the
tasks in the writing section. 17 The numbers of items based on the conversation sets and those based on the lecture sets were
used as the nominal weights. 18 Same as Note 15 above. 19 In the calculation of the composite Φ (λ) values, the three levels of the fixed facet (task types)
were weighted equally as the number of the tasks employed were the same across them. 20 Same as Note 15. 21 Although the second version above reflects the pattern of factor loadings observed in the
correlated four-factor model better, the first version was presented here because the model
parameters from the second version were more difficult to interpret due to the presence of
some out-of-the-range model parameter estimates.
100
List of Appendices
Page
A. TOEFL iBT Score Requirements Reported by Undergraduate Programs (as of
December 2008) .....................................................................................................................101
B. TOEFL iBT Score Requirements Reported by Graduate/Postgraduate Programs (as of
December 2008) .....................................................................................................................102
C. Further Details of the Method of Haberman (2008) ..............................................................103
D. D-Study Variance Component Estimates for the Reading Section .......................................106
E. D-Study Variance/Covariance Component Estimates for the Listening Section ..................107
F. D-Study Variance/Covariance Component Estimates for the Speaking Section ...................109
G. D-Study Variance Component Estimates for the Writing Section ........................................113

101
Appendix A
TOEFL iBT Score Requirements Reported by Undergraduate Programs
(as of December 2008)
Score N Mean SD Min Max
Total score 57 74.9 11.1 52 100
Reading 12 19.8 2.2 16 25
Listening 12 18.8 2.0 15 21
Speaking 13 20.3 2.4 16 24
Writing 18 20.5 3.0 16 27

102
Appendix B
TOEFL iBT Score Requirements Reported by Graduate/Postgraduate Programs
(as of December 2008)
Score N Mean SD Min Max Total 70a 83.1 10.3 60 112
Reading 24 20.1 2.1 17 27
Listening 25 19.2 2.8 14 27
Speaking 30 20.9 2.6 17 27
Writing 29 21.2 2.7 17 27
a Two institutions that specified their score requirements as the total of the reading, listening, and
writing sections were excluded from this analysis.

103
Appendix C
Further Details of the Method of Haberman (2008)
Here, we describe the methodology of Haberman (2008) that was used in this paper to
determine whether and how to report examinee level subscores. The examinee level analysis
involves the observed subscore s , the true subscore ts , the observed total score x , and the true
total score tx . It is assumed that ts , tx , ts s− , and tx x− all have positive variances. As usual
in CTT, s and ts have common mean ( )E s , x and tx have common mean ( )E x , and the true
scores ts and tx are uncorrelated with the errors ts s− and tx x− . It is assumed that the true
subscore ts and true total score tx are not collinear, so that ( )t ts xρ| , | is less than 1. This
assumption also implies that ( ) 1s xρ| , |< . Haberman (2008) considered several approaches for
prediction of the true score ts .
In the first approach, ts is predicted by the constant ( )E s , so that the corresponding
mean squared error is 2 2[ ( )] ( )t tE s E s sσ− = .
In the second, the linear regression
2( ) ( )[ ( )]s ts E s s s s E sρ= + , −
of ts on the observed subscore s predicts ts , and the corresponding mean squared error is
2 2 2( ) ( )[1 ( )]t s t tE s s s s sσ ρ− = − , , where 2 ( )ts sρ , is the reliability of the subscore.
In the third approach, the linear regression
( ) ( )[ ( ) ( )][ ( )]x t ts E s s x s x x E xρ σ σ= + , / −
of ts on the observed total score x predicts ts , and the corresponding mean squared error is
2 2 2( ) ( )[1 ( )]t x t tE s s s s xσ ρ− = − , .
Haberman (2008) compared the three approaches with respect to their PRMSE. Relative
to using ( )E s , the PRMSE corresponding to the use of ss as the estimate of ts is 2 ( )ts sρ , ,
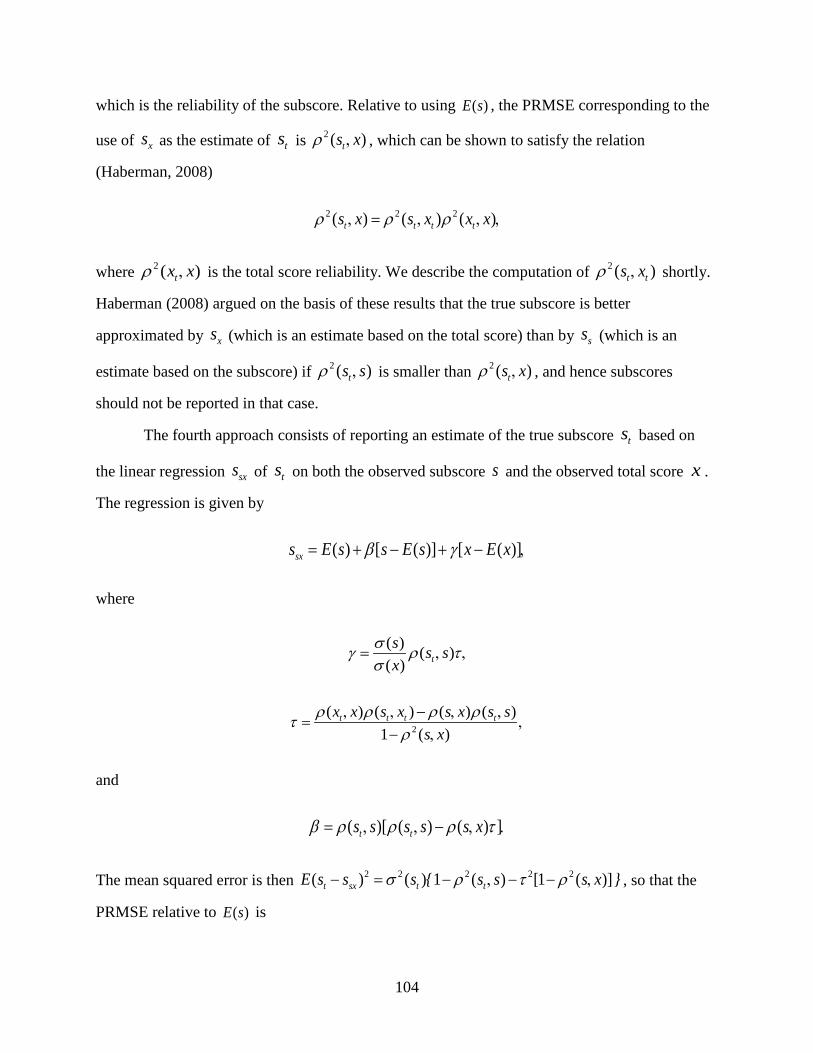
104
which is the reliability of the subscore. Relative to using ( )E s , the PRMSE corresponding to the
use of xs as the estimate of ts is 2 ( )ts xρ , , which can be shown to satisfy the relation
(Haberman, 2008)
2 2 2( ) ( ) ( )t t t ts x s x x xρ ρ ρ, = , , ,
where 2 ( )tx xρ , is the total score reliability. We describe the computation of 2 ( )t ts xρ , shortly.
Haberman (2008) argued on the basis of these results that the true subscore is better
approximated by xs (which is an estimate based on the total score) than by ss (which is an
estimate based on the subscore) if 2 ( )ts sρ , is smaller than 2 ( )ts xρ , , and hence subscores
should not be reported in that case.
The fourth approach consists of reporting an estimate of the true subscore ts based on
the linear regression sxs of ts on both the observed subscore s and the observed total score x .
The regression is given by
( ) [ ( )] [ ( )]sxs E s s E s x E xβ γ= + − + − ,
where
( ) ( )( ) ts s sx
σγ ρ τσ
= , ,
2
( ) ( ) ( ) ( )1 ( )
t t t tx x s x s x s ss x
ρ ρ ρ ρτρ
, , − , ,= ,
− ,
and
( )[ ( ) ( ) ]t ts s s s s xβ ρ ρ ρ τ= , , − , .
The mean squared error is then 2 2 2 2 2( ) ( ) 1 ( ) [1 ( )]t sx t tE s s s { s s s x }σ ρ τ ρ− = − , − − , , so that the
PRMSE relative to ( )E s is
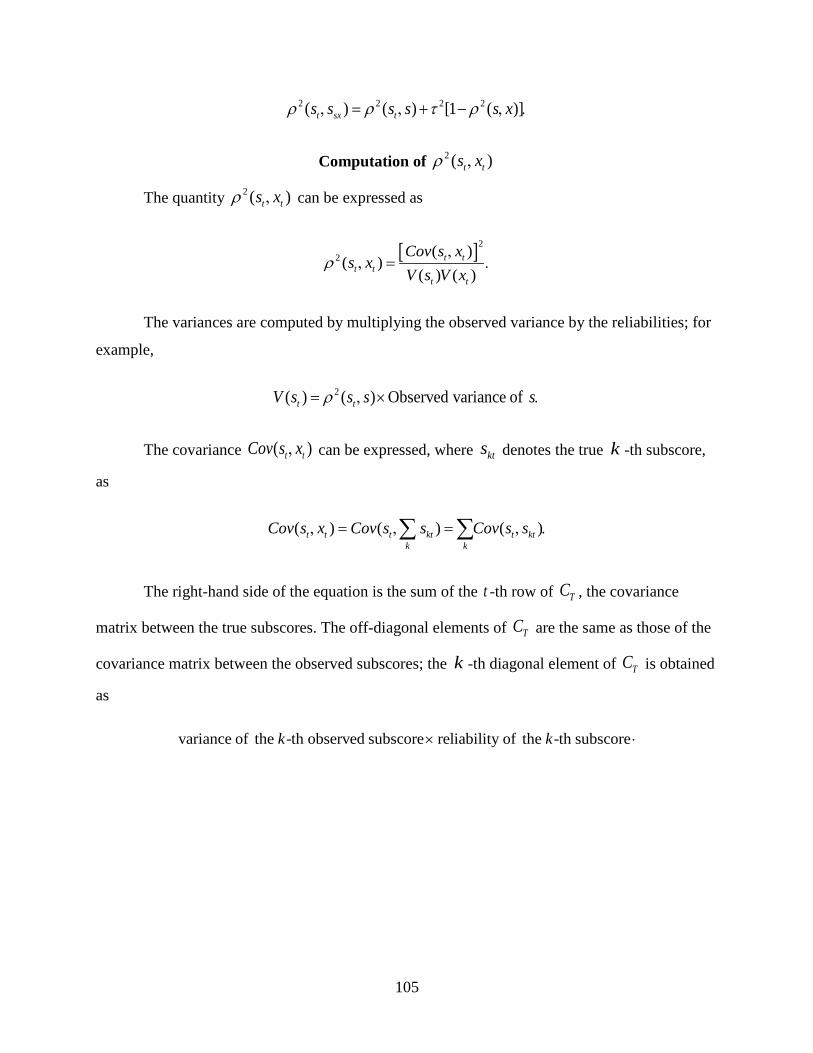
105
2 2 2 2( ) ( ) [1 ( )]t sx ts s s s s xρ ρ τ ρ, = , + − , .
Computation of 2 ( )t ts xρ ,
The quantity 2 ( )t ts xρ , can be expressed as
[ ]22 ( )( )
( ) ( )t t
t tt t
Cov s xs x
V s V xρ
,, = .
The variances are computed by multiplying the observed variance by the reliabilities; for
example,
2( ) ( ) Observed variance oft tV s s s sρ= , × .
The covariance ( )t tCov s x, can be expressed, where kts denotes the true k -th subscore,
as
( ) ( ) ( )t t t kt t ktk k
Cov s x Cov s s Cov s s, = , = , .∑ ∑
The right-hand side of the equation is the sum of the t -th row of TC , the covariance
matrix between the true subscores. The off-diagonal elements of TC are the same as those of the
covariance matrix between the observed subscores; the k -th diagonal element of TC is obtained
as
variance of the -th observed subscore reliability of the -th subscorek k× ⋅
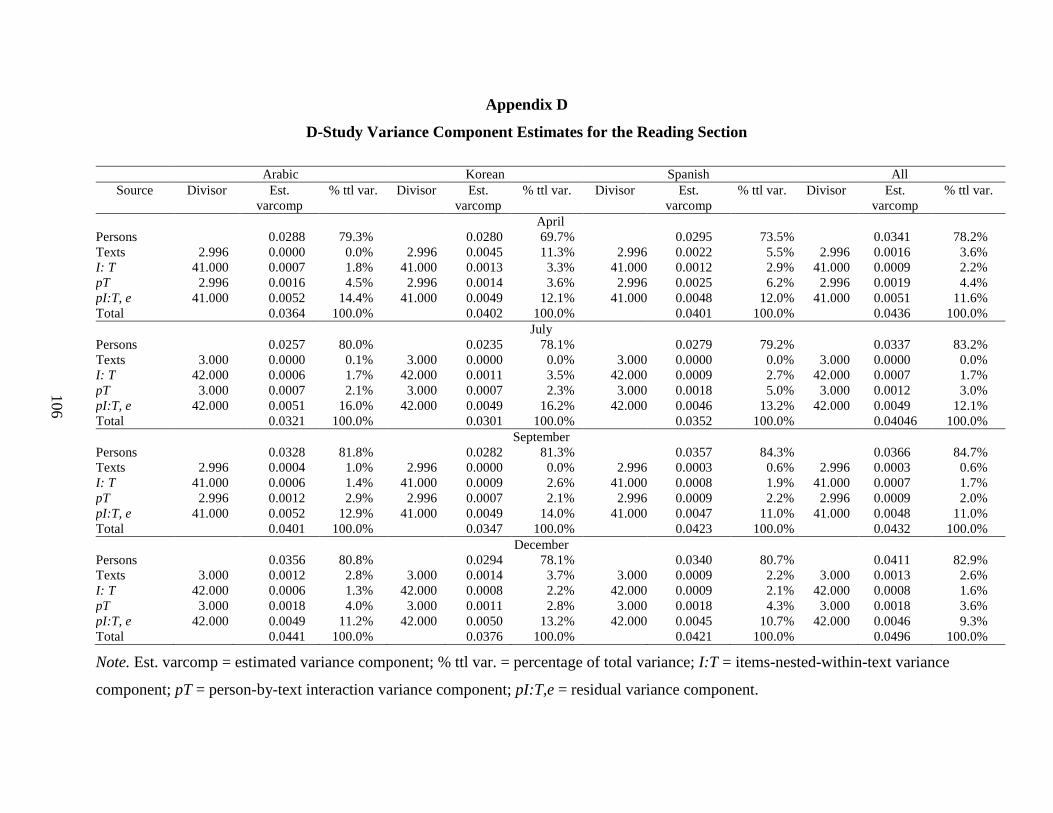
106
Appendix D
D-Study Variance Component Estimates for the Reading Section
Arabic Korean Spanish All Source Divisor Est.
varcomp % ttl var. Divisor Est.
varcomp % ttl var. Divisor Est.
varcomp % ttl var. Divisor Est.
varcomp % ttl var.
April Persons 0.0288 79.3% 0.0280 69.7% 0.0295 73.5% 0.0341 78.2% Texts 2.996 0.0000 0.0% 2.996 0.0045 11.3% 2.996 0.0022 5.5% 2.996 0.0016 3.6% I: T 41.000 0.0007 1.8% 41.000 0.0013 3.3% 41.000 0.0012 2.9% 41.000 0.0009 2.2% pT 2.996 0.0016 4.5% 2.996 0.0014 3.6% 2.996 0.0025 6.2% 2.996 0.0019 4.4% pI:T, e 41.000 0.0052 14.4% 41.000 0.0049 12.1% 41.000 0.0048 12.0% 41.000 0.0051 11.6% Total 0.0364 100.0% 0.0402 100.0% 0.0401 100.0% 0.0436 100.0%
July Persons 0.0257 80.0% 0.0235 78.1% 0.0279 79.2% 0.0337 83.2% Texts 3.000 0.0000 0.1% 3.000 0.0000 0.0% 3.000 0.0000 0.0% 3.000 0.0000 0.0% I: T 42.000 0.0006 1.7% 42.000 0.0011 3.5% 42.000 0.0009 2.7% 42.000 0.0007 1.7% pT 3.000 0.0007 2.1% 3.000 0.0007 2.3% 3.000 0.0018 5.0% 3.000 0.0012 3.0% pI:T, e 42.000 0.0051 16.0% 42.000 0.0049 16.2% 42.000 0.0046 13.2% 42.000 0.0049 12.1% Total 0.0321 100.0% 0.0301 100.0% 0.0352 100.0% 0.04046 100.0%
September Persons 0.0328 81.8% 0.0282 81.3% 0.0357 84.3% 0.0366 84.7% Texts 2.996 0.0004 1.0% 2.996 0.0000 0.0% 2.996 0.0003 0.6% 2.996 0.0003 0.6% I: T 41.000 0.0006 1.4% 41.000 0.0009 2.6% 41.000 0.0008 1.9% 41.000 0.0007 1.7% pT 2.996 0.0012 2.9% 2.996 0.0007 2.1% 2.996 0.0009 2.2% 2.996 0.0009 2.0% pI:T, e 41.000 0.0052 12.9% 41.000 0.0049 14.0% 41.000 0.0047 11.0% 41.000 0.0048 11.0% Total 0.0401 100.0% 0.0347 100.0% 0.0423 100.0% 0.0432 100.0%
December Persons 0.0356 80.8% 0.0294 78.1% 0.0340 80.7% 0.0411 82.9% Texts 3.000 0.0012 2.8% 3.000 0.0014 3.7% 3.000 0.0009 2.2% 3.000 0.0013 2.6% I: T 42.000 0.0006 1.3% 42.000 0.0008 2.2% 42.000 0.0009 2.1% 42.000 0.0008 1.6% pT 3.000 0.0018 4.0% 3.000 0.0011 2.8% 3.000 0.0018 4.3% 3.000 0.0018 3.6% pI:T, e 42.000 0.0049 11.2% 42.000 0.0050 13.2% 42.000 0.0045 10.7% 42.000 0.0046 9.3% Total 0.0441 100.0% 0.0376 100.0% 0.0421 100.0% 0.0496 100.0%
Note. Est. varcomp = estimated variance component; % ttl var. = percentage of total variance; I:T = items-nested-within-text variance
component; pT = person-by-text interaction variance component; pI:T,e = residual variance component.

107
Appendix E
D-Study Variance/Covariance Component Estimates for the Listening Section
Arabic Korean Spanish All Source Divisor Est. var/cov comp % total var. Est. var/cov comp % total var. Est. var/cov comp % total var. Est. var/cov comp % total var. Conv Lect Conv Lect Conv Lect Conv Lect Conv Lect Conv Lect Conv Lect Conv Lect
April Persons 0.0130 0.8931 a 22.7 0.0165 0.9455 a 37.4 0.0135 0.9326 a 31.7 0.0174 0.9220 a 33.9 0.0198 0.0378 80.9 0.0237 0.0381 82.6 0.0192 0.0312 78.0 0.0238 0.0381 81.9 Texts 2.000 0.0238 41.4 0.0096 21.6 0.0114 26.6 0.0153 29.8 4.000 0.0003 0.5 0.0000 0.0 0.0008 1.9 0.0002 0.4 I: T 10.000 0.0013 2.3 0.0022 4.9 0.0018 4.2 0.0018 3.6 24.000 0.0006 1.3 0.0006 1.2 0.0006 1.4 0.0004 0.9 pT 2.000 0.0021 3.6 0.0006 1.4 0.0015 3.5 0.0010 1.9 4.000 0.0001 0.1 0.0004 0.9 0.0009 2.2 0.0005 1.2 pI:T, e 10.000 0.0172 30.0 0.0153 34.6 0.0145 33.9 0.0159 30.9 24.000 0.0080 17.1 0.0071 15.3 0.0066 16.5 0.0073 15.7 Total 0.0574 100.0 0.0442 100.0 0.0427 100.0 0.0515 100.0 0.0467 100.0 0.0461 100.0 0.0400 100.0 0.0465 100.0
July Persons 0.0382 0.9337a 60.4 0.0233 0.9926 a 56.7 0.0303 0.8953 a 66.4 0.0316 0.9479 a 62.6 0.0325 0.0317 73.5 0.0246 0.0263 71.2 0.0282 0.0326 75.2 0.0312 0.0343 76.0 Texts 2.000 0.0045 7.1 0.0004 0.9 0.0000 0.0 0.0010 2.0 4.000 0.0020 4.6 0.0017 4.6 0.0022 5.0 0.0020 4.4 I:T 10.000 0.0017 2.7 0.0019 4.7 0.0017 3.8 0.0016 3.2 24.000 0.0007 1.7 0.0010 2.6 0.0007 1.6 0.0007 1.5 PT 2.000 0.0015 2.4 0.0014 3.4 0.0000 0.0 0.0007 1.4 4.000 0.0007 1.6 0.0003 0.8 0.0009 2.0 0.0005 1.2 pI:T, e 10.000 0.0174 27.4 0.0141 34.2 0.0137 30.1 0.0155 30.7 24.000 0.0080 18.6 0.0077 20.7 0.0070 16.1 0.0076 16.9 Total 0.0632 100.0 0.0411 100.0 0.0456 100.0 0.0505 100.0 0.0431 100.0 0.0370 100.0 0.0434 100.0 0.0452 100.0
September Persons 0.0270 0.9991a 54. 2 0.0247 0.9710a 59.3 0.0283 0.9902a 62.1 0.0261 0.9959a 56.5 0.0315 0.0367 78.1 0.0280 0.0337 79.8 0.0318 0.0365 80.6 0.0303 0.0353 79.5 Texts 2.000 0.0017 3.5 0.0000 0.0 0.0000 0.0 0.0013 2.8 4.000 0.0003 0.7 0.0001 0.2 0.0004 0.9 0.0005 1.2 I: T 10.000 0.0028 5.7 0.0019 4.5 0.0021 4.6 0.0020 4.4 24.000 0.0007 1.4 0.0008 1.8 0.0007 1.5 0.0007 1.5 pT 2.000 0.0028 5.5 0.0023 5.4 0.0021 4.5 0.0031 6.6 4.000 0.0015 3.2 0.0004 0.9 0.0008 1.9 0.0008 1.9 pI:T, e 10.000 0.0156 31.2 0.0129 30.8 0.0131 28.7 0.0138 29.7

108
Arabic Korean Spanish All Source Divisor Est. var/cov comp % total var. Est. var/cov comp % total var. Est. var/cov comp % total var. Est. var/cov comp % total var. Conv Lect Conv Lect Conv Lect Conv Lect Conv Lect Conv Lect Conv Lect Conv Lect 24.000 0.0078 16.6 0.0074 17.4 0.0068 15.0 0.0071 15.9 Total 0.0499 100.0 0.0417 100.0 0.0456 100.0 0.0463 100.0 0.0470 100.0 0.0423 100.0 0.0452 100.0 0.0444 100.0
December Persons 0.0232 1.0298a 39.6 0.0219 0.9934a 40.2 0.0228 1.0120a 42.0 0.0227 1.0335a 41.5 0.0266 0.0288 72.4 0.0223 0.0230 69.5 0.0243 0.0254 76.0 0.0261 0.0281 74.3 Texts 2.000 0.0182 31.1 0.0129 23.6 0.0146 26.9 0.0139 25.4 3.977 0.0013 3.3 0.0011 3.3 0.0001 0.2 0.0011 3.0 I: T 10.000 0.0010 1.7 0.0012 2.2 0.0010 1.9 0.0009 1.7 23.000 0.0013 3.2 0.0012 3.5 0.0010 2.9 0.0010 2.5 pT 2.000 0.0008 1.3 0.0023 4.1 0.0027 5.0 0.0028 5.1 3.977 0.0007 1.9 0.0000 0.0 0.0001 0.4 0.0006 1.5 pI:T, e 10.000 0.0154 26.2 0.0163 29.8 0.0131 24.2 0.0144 26.3 23.000 0.0077 19.3 0.0079 23.9 0.0069 20.6 0.0071 18.7 Total 0.0586 100.0 0.0545 100.0 0.0543 100.0 0.0547 100.0 0.0398 100.0 0.0331 100.0 0.0334 100.0 0.0378 100.0
Note. Diagonals = variance component estimates; lower diagonals = covariance component estimates; upper diagonals =
universe-score correlations. Conv = conversation; est. var/cov comp = estimated variance/covariance component; lect = lecture; %
total var. = percentage of total variance; I:T = items-nested-within-text variance component; pT = person-by-text interaction variance
component; pI:T,e = residual variance component. a Upper off-diagonals = universe score correlations.

109
Appendix F D-Study Variance/Covariance Component Estimates for the Speaking Section
Table F1
D-Study Variance/Covariance Component Estimates for the Speaking Section (April)
Source Divisor
Arabic Korean Est. var/cov comp % total var. Est. var/cov comp % total var.
Speaking RLS LS Speak RLS LS Speaking RLS LS Speak RLS LS Persons 0.27923 0.92126 a 0.89463 a 69.0% 0.29357 0.96548 a 0.99147 a 70.5% 0.30089 0.38202 0.99449 a 72.1% 0.3295 0.39674 0.97049 a 76.6% 0.26958 0.35051 0.32518 72.5% 0.30162 0.34322 0.31524 73.8% Items 2.000 0.0011 0.3% 0.0005 0.1% 2.000 0.003 0.6% 0.00004 0.0% 2.000 0.001 0.2% 0.00054 0.1% pI,e 2.000 0.12436 30.7% 0.12222 29.4% 2.000 0.14447 27.3% 0.12112 23.4% 2.000 0.12262 27.3% 0.11142 26.1% Total 0.40469 100.0% 0.41629 100.0% 0.52949 100.0% 0.5179 100.0% 0.4488 100.0% 0.4272 100.0%
Spanish All Persons 0.18869 0.98177 a 0.96485 a 58.5% 0.28018 0.96956 a 0.97877 a 68.0% 0.20724 0.23614 0.98304 a 62.8% 0.31915 0.38671 0.98728 a 74.4% 0.19849 0.22624 0.22429 64.0% 0.2947 0.34923 0.32356 72.6% Items 2.000 0.0013 0.4% 0.00027 0.1% 2.000 0.0046 1.2% 0.00071 0.1% 2.000 0.00482 1.4% 0.00099 0.2% pI,e 2.000 0.13242 41.1% 0.13143 31.9% 2.000 0.13542 36.0% 0.13232 25.5% 2.000 0.12139 34.6% 0.12136 27.2% Total 0.32241 100.0% 0.41188 100.0% 0.37616 100.0% 0.51974 100.0% 0.3505 100.0% 0.44591 100.0%
Note. Diagonals = variance component estimates; lower diagonals = covariance component estimates. Est. var/cov comp = estimated variance-covariance component; % total var. = percentage of total variance; R = reading; L = listening; S = speaking; pI,e = residual variance component. aUpper diagonals = universe score correlations.
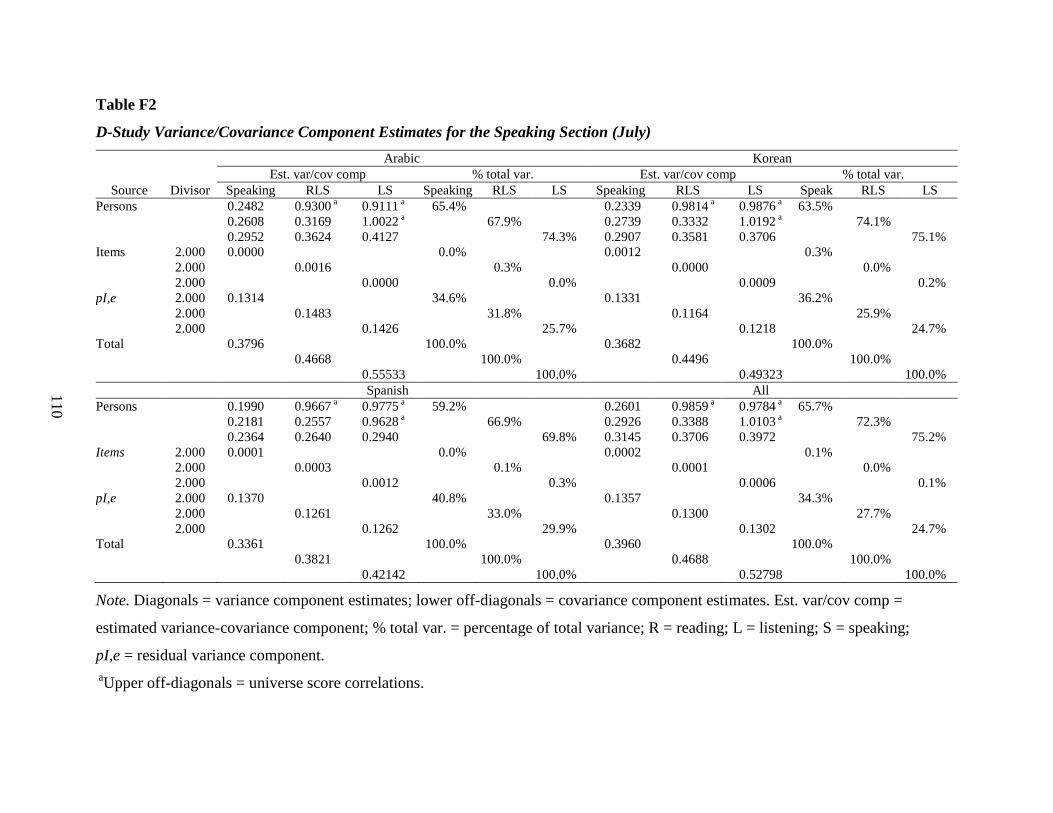
110
Table F2
D-Study Variance/Covariance Component Estimates for the Speaking Section (July)
Source Divisor
Arabic Korean Est. var/cov comp % total var. Est. var/cov comp % total var.
Speaking RLS LS Speaking RLS LS Speaking RLS LS Speak RLS LS Persons 0.2482 0.9300 a 0.9111 a 65.4% 0.2339 0.9814 a 0.9876 a 63.5% 0.2608 0.3169 1.0022 a 67.9% 0.2739 0.3332 1.0192 a 74.1% 0.2952 0.3624 0.4127 74.3% 0.2907 0.3581 0.3706 75.1% Items 2.000 0.0000 0.0% 0.0012 0.3% 2.000 0.0016 0.3% 0.0000 0.0% 2.000 0.0000 0.0% 0.0009 0.2% pI,e 2.000 0.1314 34.6% 0.1331 36.2% 2.000 0.1483 31.8% 0.1164 25.9% 2.000 0.1426 25.7% 0.1218 24.7% Total 0.3796 100.0% 0.3682 100.0% 0.4668
100.0% 0.4496
100.0%
0.55533 100.0% 0.49323 100.0%
Spanish All Persons 0.1990 0.9667 a 0.9775 a 59.2% 0.2601 0.9859 a 0.9784 a 65.7% 0.2181 0.2557 0.9628 a 66.9% 0.2926 0.3388 1.0103 a 72.3% 0.2364 0.2640 0.2940 69.8% 0.3145 0.3706 0.3972 75.2% Items 2.000 0.0001 0.0% 0.0002 0.1% 2.000 0.0003 0.1% 0.0001 0.0% 2.000 0.0012 0.3% 0.0006 0.1% pI,e 2.000 0.1370 40.8% 0.1357 34.3% 2.000 0.1261 33.0% 0.1300 27.7% 2.000 0.1262 29.9% 0.1302 24.7% Total 0.3361 100.0% 0.3960 100.0% 0.3821
100.0% 0.4688
100.0%
0.42142 100.0% 0.52798 100.0%
Note. Diagonals = variance component estimates; lower off-diagonals = covariance component estimates. Est. var/cov comp =
estimated variance-covariance component; % total var. = percentage of total variance; R = reading; L = listening; S = speaking;
pI,e = residual variance component. aUpper off-diagonals = universe score correlations.

111
Table F3
D-Study Variance/Covariance Component Estimates for the Speaking Section (September)
Source Divisor
Arabic Korean Est. var/cov comp % total var. Est. var/cov comp % total var.
Speaking RLS LS Speaking RLS LS Speaking RLS LS Speaking RLS LS Persons
0.3291 0.9872a 0.9796 a 67.0% 0.2646 0.9957a 1.0086a 67.1% 0.3769 0.4430 1.0058a 75.5% 0.3012 0.3459 1.0266a 74.7% 0.3767 0.4488 0.4494 74.3% 0.3053 0.3553 0.3464 72.6%
Items
2.000 0.0056 1.1% 0.0015 0.4% 2.000 0.0068 1.2% 0.0000 0.0% 2.000 0.0068 1.1% 0.0026 0.5%
pI,e
2.000 0.1564 31.9% 0.1281 32.5% 2.000 0.1370 23.3% 0.1173 25.3% 2.000 0.1483 24.5% 0.1283 26.9%
Total
0.4910 100.0% 0.3942 100.0% 0.5867
100.0% 0.4631
100.0%
0.60453 100.0% 0.47725 100.0%
Spanish All Persons 0.2173 0.9370a 1.0249a 63.4% 0.2971 0.9735a 0.9599a 68.7% 0.2091 0.2293 0.9686a 64.2% 0.3202 0.3641 0.9931a 73.8% 0.2417 0.2346 0.2559 66.0% 0.3206 0.3673 0.3756 73.6% Items 2.000 0.0008 0.2% 0.0021 0.5% 2.000 0.0024 0.7% 0.0017 0.3% 2.000 0.0023 0.6% 0.0034 0.7% pI,e 2.000 0.1248 36.4% 0.1331 30.8% 2.000 0.1253 35.1% 0.1274 25.8% 2.000 0.1293 33.4% 0.1314 25.7% Total 0.3428 100.0% 0.4323 100.0% 0.3570
100.0% 0.4932
100.0%
0.38752 100.0% 0.51041 100.0%
Note. Diagonals = variance component estimates; lower off-diagonals = covariance component estimates. Est. var/cov comp = estimated variance-covariance component; % total var. = percentage of total variance; R = reading; L = listening; S = speaking; pI,e = residual variance component. aUpper off-diagonals = universe score correlations.
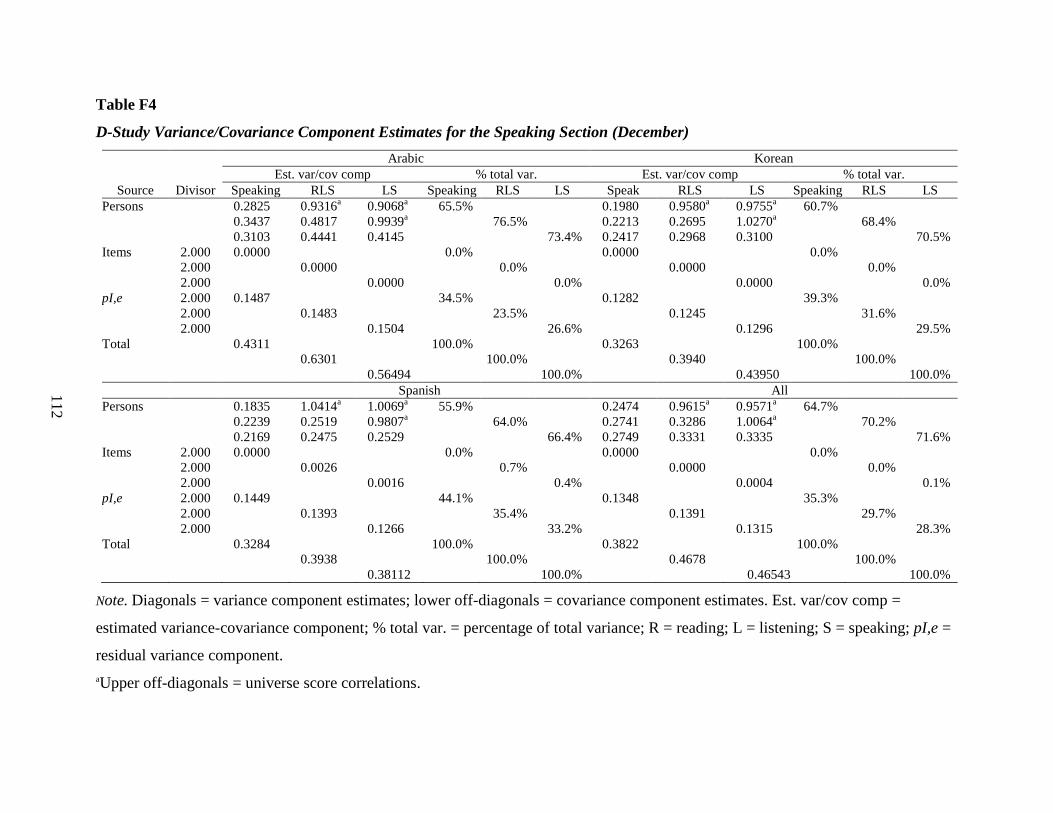
112
Table F4
D-Study Variance/Covariance Component Estimates for the Speaking Section (December)
Source Divisor
Arabic Korean Est. var/cov comp % total var. Est. var/cov comp % total var.
Speaking RLS LS Speaking RLS LS Speak RLS LS Speaking RLS LS Persons 0.2825 0.9316a 0.9068a 65.5% 0.1980 0.9580a 0.9755a 60.7% 0.3437 0.4817 0.9939a 76.5% 0.2213 0.2695 1.0270a 68.4% 0.3103 0.4441 0.4145 73.4% 0.2417 0.2968 0.3100 70.5% Items 2.000 0.0000 0.0% 0.0000 0.0% 2.000 0.0000 0.0% 0.0000 0.0% 2.000 0.0000 0.0% 0.0000 0.0% pI,e 2.000 0.1487 34.5% 0.1282 39.3% 2.000 0.1483 23.5% 0.1245 31.6% 2.000 0.1504 26.6% 0.1296 29.5% Total 0.4311 100.0% 0.3263 100.0% 0.6301 100.0% 0.3940 100.0% 0.56494 100.0% 0.43950 100.0%
Spanish All Persons 0.1835 1.0414a 1.0069a 55.9% 0.2474 0.9615a 0.9571a 64.7% 0.2239 0.2519 0.9807a 64.0% 0.2741 0.3286 1.0064a 70.2% 0.2169 0.2475 0.2529 66.4% 0.2749 0.3331 0.3335 71.6% Items 2.000 0.0000 0.0% 0.0000 0.0% 2.000 0.0026 0.7% 0.0000 0.0% 2.000 0.0016 0.4% 0.0004 0.1% pI,e 2.000 0.1449 44.1% 0.1348 35.3% 2.000 0.1393 35.4% 0.1391 29.7% 2.000 0.1266 33.2% 0.1315 28.3% Total 0.3284 100.0% 0.3822 100.0% 0.3938 100.0% 0.4678 100.0% 0.38112 100.0% 0.46543 100.0%
Note. Diagonals = variance component estimates; lower off-diagonals = covariance component estimates. Est. var/cov comp =
estimated variance-covariance component; % total var. = percentage of total variance; R = reading; L = listening; S = speaking; pI,e =
residual variance component. aUpper off-diagonals = universe score correlations.

113
Appendix G
D-Study Variance Component Estimates for the Writing Section
Arabic Korean Spanish All Source Divisor Varcomp % ttl var. Divisor Varcomp % ttl var. Divisor Varcomp % ttl var. Divisor Varcomp % ttl var.
April Persons 0.5931 65.0% 0.5916 68.5% 0.5606 61.8% 0.6321 67.7% Items 2.000 0.1076 11.8% 2.000 0.0601 7.0% 2.000 0.0759 8.4% 2.000 0.0694 7.4% R':I 4.000 0.0000 0.0% 4.000 0.0000 0.0% 4.000 0.0000 0.0% 4.000 0.0000 0.0% pI 2.000 0.1441 15.8% 2.000 0.1436 16.6% 2.000 0.1963 21.6% 2.000 0.1618 17.3% pR':I, e 4.000 0.0678 7.4% 4.000 0.0687 8.0% 4.000 0.0740 8.2% 4.000 0.0706 7.6% Total 0.9126 100.0% 0.8640 100.0% 0.9067 100.0% 0.9338 100.0%
July Persons 0.6180 70.6% 0.4928 75.1% 0.4972 66.4% 0.6058 74.9% Items 2.000 0.0711 8.1% 2.000 0.0005 0.1% 2.000 0.0364 4.9% 2.000 0.0195 2.4% R':I 4.000 0.0000 0.0% 4.000 0.0000 0.0% 4.000 0.0000 0.0% 4.000 0.0000 0.0% pI 2.000 0.1249 14.3% 2.000 0.0938 14.3% 2.000 0.1470 19.6% 2.000 0.1156 14.3% pR':I, e 4.000 0.0618 7.1% 4.000 0.0694 10.6% 4.000 0.0682 9.1% 4.000 0.0679 8.4% Total 0.8759 100.0% 0.6564 100.0% 0.7488 100.0% 0.8088 100.0%
September Persons 0.7752 75.0% 0.5707 70.6% 0.6950 71.4% 0.6911 74.4% Items 2.000 0.0369 3.6% 2.000 0.0172 2.1% 2.000 0.0368 3.8% 2.000 0.0171 1.8% R':I 4.000 0.0000 0.0% 4.000 0.0000 0.0% 4.000 0.0000 0.0% 4.000 0.0000 0.0% pI 2.000 0.1637 15.8% 2.000 0.1571 19.4% 2.000 0.1778 18.3% 2.000 0.1565 16.9% pR':I, e 4.000 0.0576 5.6% 4.000 0.0635 7.8% 4.000 0.0638 6.6% 4.000 0.0638 6.9% Total 1.0334 100.0% 0.8085 100.0% 0.9735 100.0% 0.9286 100.0%
December Persons 0.6569 76.3% 0.4623 70.3% 0.4391 66.2% 0.5220 73.2% Items 2.000 0.0131 1.5% 2.000 0.0209 3.2% 2.000 0.0206 3.1% 2.000 0.0095 1.3% R':I 4.000 0.0000 0.0% 4.000 0.0000 0.0% 4.000 0.0001 0.0% 4.000 0.0000 0.0% pI 2.000 0.1332 15.5% 2.000 0.1164 17.7% 2.000 0.1416 21.3% 2.000 0.1180 16.6% pR':I, e 4.000 0.0582 6.8% 4.000 0.0576 8.8% 4.000 0.0623 9.4% 4.000 0.0635 8.9% Total 0.8613 100.0% 0.6573 100.0% 0.6637 100.0% 0.7131 100.0%
Note. Varcomp = variance component; % ttl var. = percentage of total variance; R':I = ratings-nested-within-tasks variance
component; pI = person-by-task variance component; pR':I, e = residual variance component.

Test of English as a Foreign LanguagePO Box 6155
Princeton, NJ 08541-6155USA
To obtain more information about TOEFL programs and services, use one of the following:
Phone: 1-877-863-3546(US, US Territories*, and Canada)
1-609-771-7100(all other locations)
E-mail: toefl @ets.orgWeb site: www.ets.org/toefl
*America Samoa, Guam, Puerto Rico, and US Virgin Islands