investigation answer sheets - northern highlands
TRANSCRIPT
Investigation Answer Sheets
Physics A First Course Investigation Answer Sheets
Physics A First CourseTeacher Resource CD-ROM
Copyright 2005 CPO ScienceISBN 1-58892-144-1
1 2 3 4 5 6 7 8 9 - QWE - 09 08 07 06 05
All rights reserved. No part of this work may be reproduced or transmitted in any form or by anmeans, electronic or mechanical, including photocopying and recording, or by any informationstore or retrieval system, without permission in writing. For permission and other rights underthis copyright, please contact:
CPO Science26 Howley Street,
Peabody, MA 01960 (800) 932-5227
http://www. cposcience.com Printed and Bound in the United States of America
CreditsCPO Science Curriculum Develompment TeamAuthor: Thomas Hsu, Ph.DVice Presidents: Thomas Narro and Lynda PennellWriters: Scott Eddleman, Mary Beth Hughes, Lainie Ives, Erik Benton, Mary Ann Erikson, and Patsy DeCosterGraphic Artists: Bruce Holloway and Polly Crisman
Curriculum ContributorsDavid Bliss, and Stacy Kissel
Technical ConsultantsTracy Morrow, and Julie Dalton

1
1A
Name: ______________________________________________ Date: __________
Time, Distance, and Speed
A Using the timer as a stopwatchThere are no questions to answer in part 1.
B Mixed units for timeArrange the following times from smallest to largest:
C Using the photogatesThere are no questions to answer in part 3.
D How the photogate works a. Exactly what do you do to start and stop the clock? Be very specific in your answer. Someone who has
never seen the photogate before should be able to read your answer and know what to do.
b. If you block the light beam several times in a row, does the time add or does the timer start at zero every time you break the beam? Your answer should provide observations that back up what you say. For example, “the timer does _____ because_____.” Fill in the blanks with what you think based on what you observed.
1A
2
Name: ______________________________________________ Date: __________
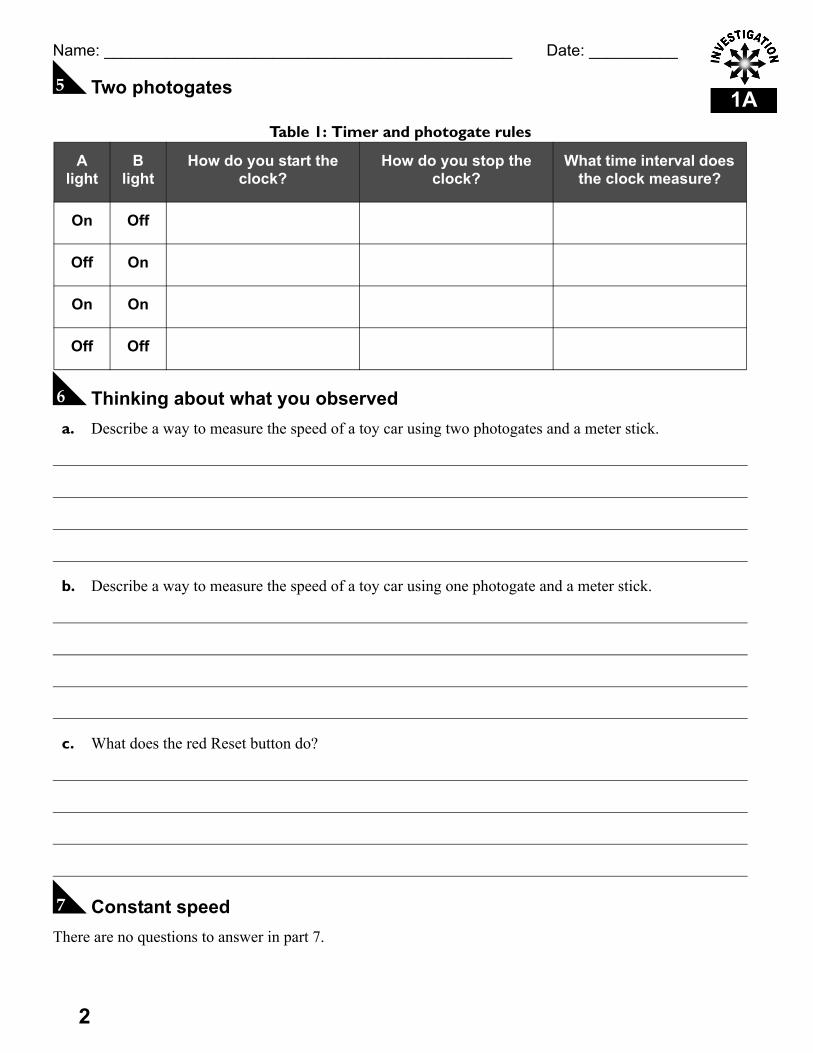
E Two photogates
F Thinking about what you observed a. Describe a way to measure the speed of a toy car using two photogates and a meter stick.
b. Describe a way to measure the speed of a toy car using one photogate and a meter stick.
c. What does the red Reset button do?
G Constant speedThere are no questions to answer in part 7.
Table 1: Timer and photogate rules
A light
B light
How do you start the clock?
How do you stop the clock?
What time interval does the clock measure?
On Off
Off On
On On
Off Off

3
1A
Name: ______________________________________________ Date: __________
H Thinking about what you observed a. Describe how the photogate measurements prove that the car has constant speed, or nearly
constant speed.
b. Calculate the speed of the car in meters per second (m/sec).
I Position versus time
Table 2: Position versus time data
Position(cm)
Time through photogate A
(sec.)
Time through photogate A
(sec.)
Time from photogate A to B(sec.)

1A
4
Name: ______________________________________________ Date: __________
J Thinking about what you observed a. Draw a graph showing the position of the car on the vertical (y) axis and the time since the car
was released on the horizontal (x) axis. The time you want is the time from photogate A to B.
b. What shape does the position versus time graph have? Describe the line or curve that you produce.
c. Calculate the average speed of the car from the graph or your data.
d. How long would it take the car to travel a distance of 2 meters if it kept the same speed?
1
1B
Name: ______________________________________________ Date: __________
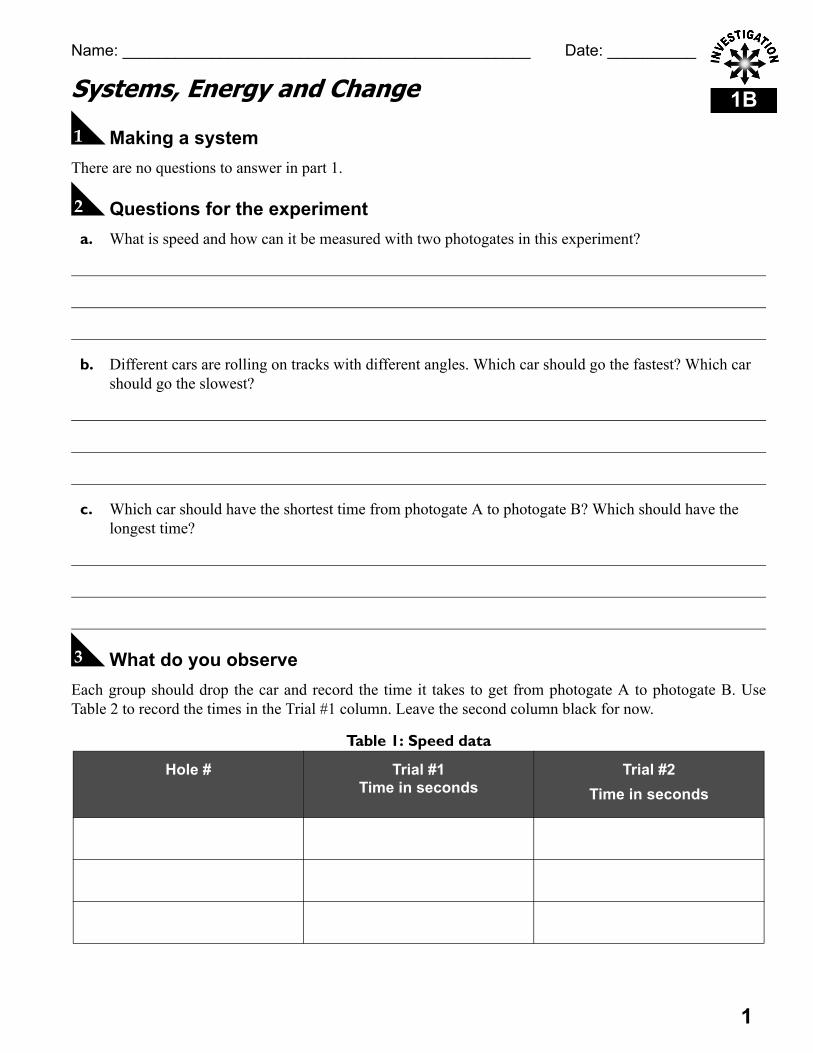
Systems, Energy and Change
A Making a system There are no questions to answer in part 1.
B Questions for the experiment a. What is speed and how can it be measured with two photogates in this experiment?
b. Different cars are rolling on tracks with different angles. Which car should go the fastest? Which car should go the slowest?
c. Which car should have the shortest time from photogate A to photogate B? Which should have the longest time?
C What do you observeEach group should drop the car and record the time it takes to get from photogate A to photogate B. UseTable 2 to record the times in the Trial #1 column. Leave the second column black for now.
Table 1: Speed data
Hole # Trial #1Time in seconds
Trial #2Time in seconds
1B
2
Name: ______________________________________________ Date: __________
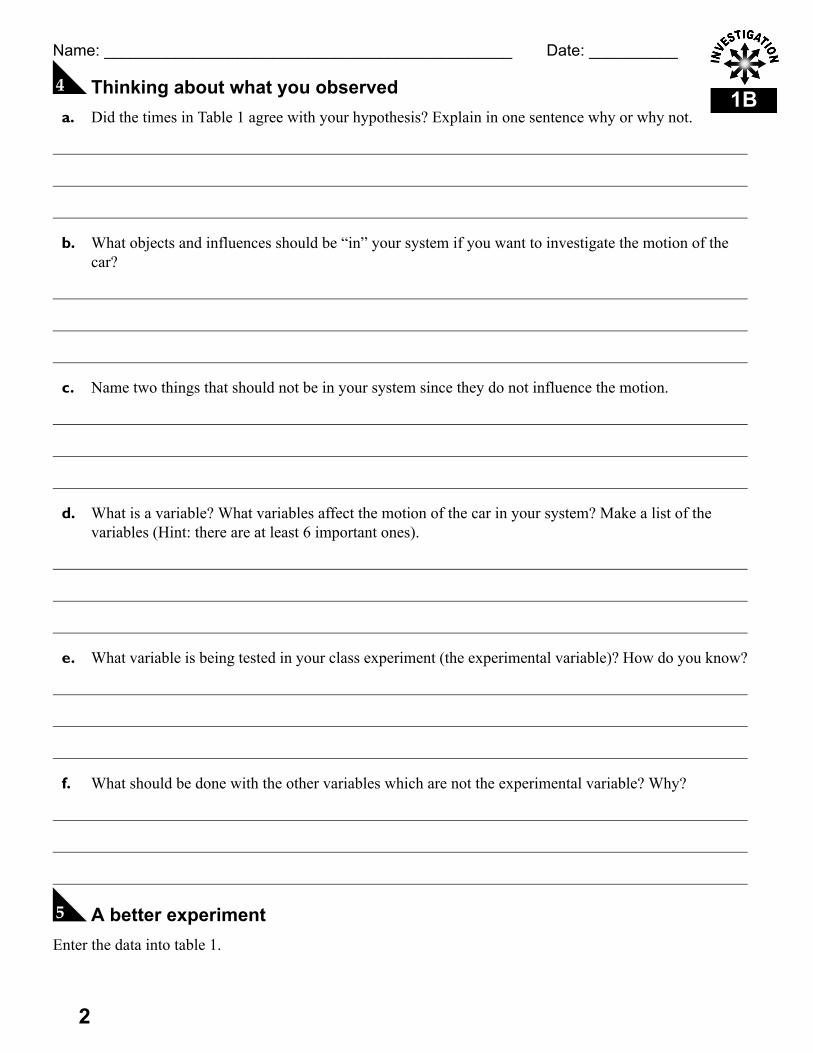
D Thinking about what you observed a. Did the times in Table 1 agree with your hypothesis? Explain in one sentence why or why not.
b. What objects and influences should be “in” your system if you want to investigate the motion of the car?
c. Name two things that should not be in your system since they do not influence the motion.
d. What is a variable? What variables affect the motion of the car in your system? Make a list of the variables (Hint: there are at least 6 important ones).
e. What variable is being tested in your class experiment (the experimental variable)? How do you know?
f. What should be done with the other variables which are not the experimental variable? Why?
E A better experimentEnter the data into table 1.
3
1B
Name: ______________________________________________ Date: __________
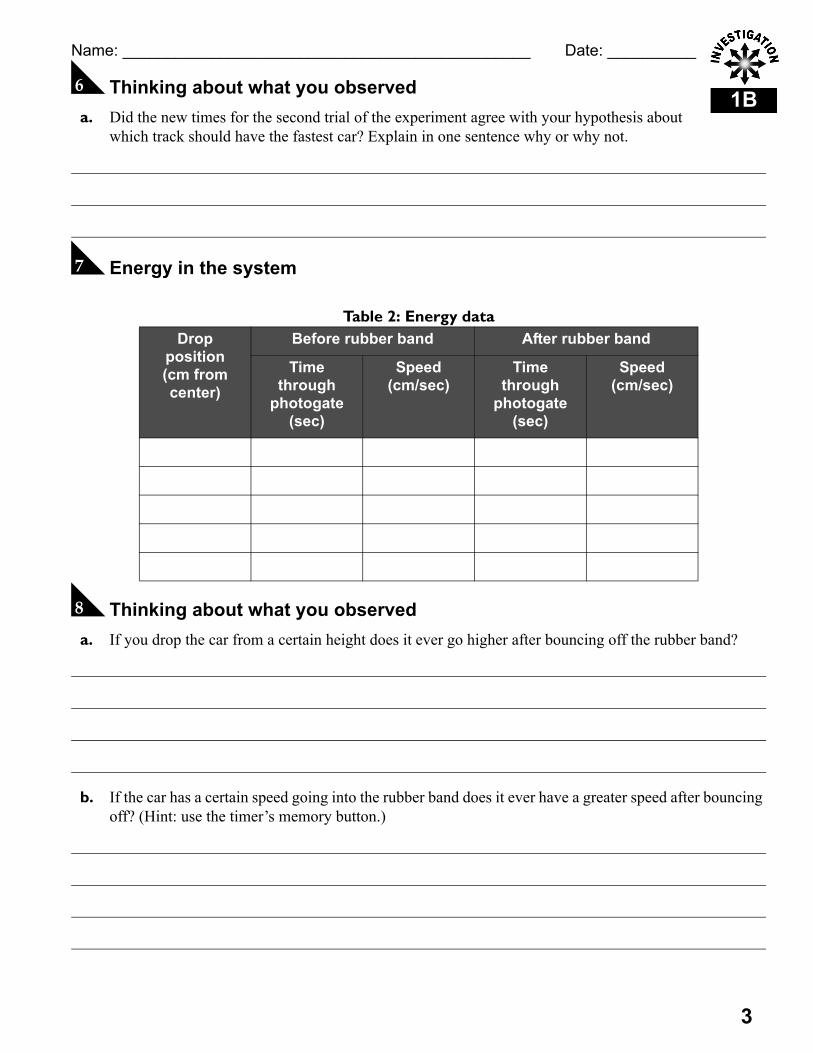
F Thinking about what you observed a. Did the new times for the second trial of the experiment agree with your hypothesis about
which track should have the fastest car? Explain in one sentence why or why not.
G Energy in the system
H Thinking about what you observed a. If you drop the car from a certain height does it ever go higher after bouncing off the rubber band?
b. If the car has a certain speed going into the rubber band does it ever have a greater speed after bouncing off? (Hint: use the timer’s memory button.)
Table 2: Energy dataDrop
position(cm from center)
Before rubber band After rubber band
Time through
photogate(sec)
Speed(cm/sec)
Time through
photogate(sec)
Speed (cm/sec)
1B
4
Name: ______________________________________________ Date: __________
c. When you drop the car from a certain height it reaches a certain speed at the photogate. If you launch the car with the same speed back up the hill, does the car ever get higher than the height at which you first dropped it? (try this experiment)
d. In one paragraph, explain how the answers to a, b, and c are explained using the idea of energy.

1
2A
Name: ______________________________________________ Date: __________
The Law of Inertia
A Launching cars of different mass
B Thinking about what you observed a. Use Table 1 to graph the speed of the car (y) against the mass (x).
b. Why did the speed change when the same launching force from the rubber band was applied to cars of different mass? How do your observations support your answer?
Table 1: Constant force dataMass of car (kg) Time through photogate
(sec)Speed (m/sec)
2A
2
Name: ______________________________________________ Date: __________
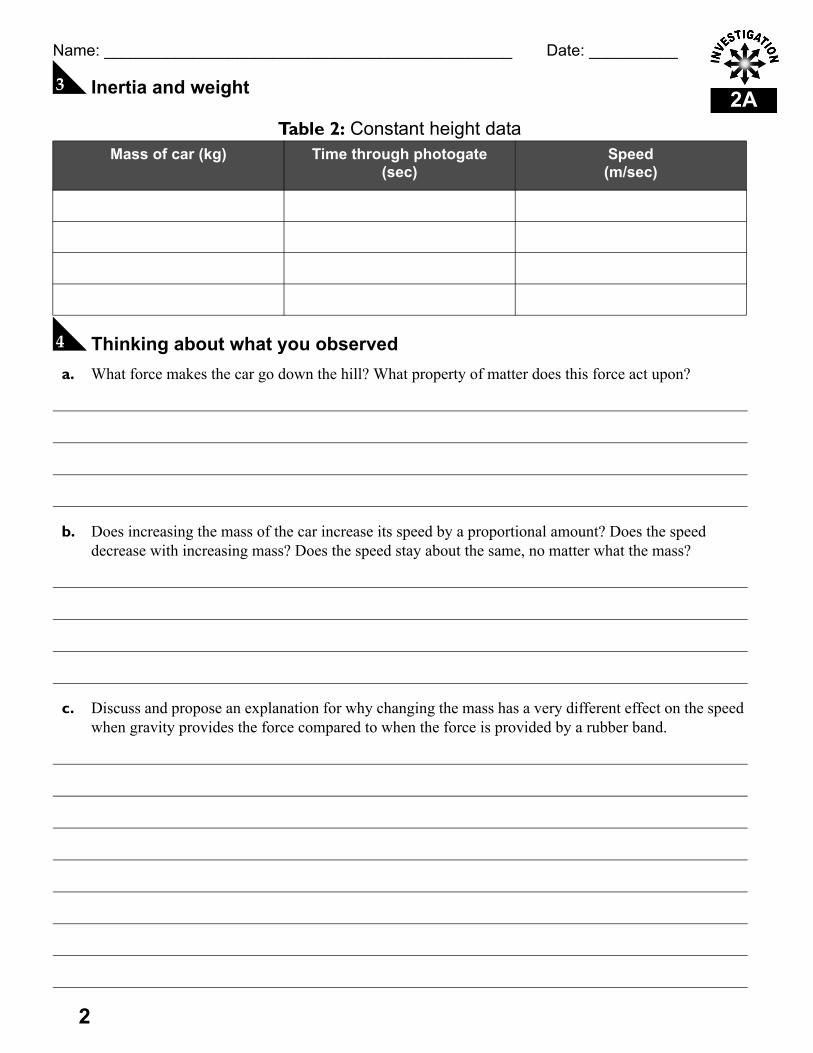
C Inertia and weight
D Thinking about what you observed a. What force makes the car go down the hill? What property of matter does this force act upon?
b. Does increasing the mass of the car increase its speed by a proportional amount? Does the speed decrease with increasing mass? Does the speed stay about the same, no matter what the mass?
c. Discuss and propose an explanation for why changing the mass has a very different effect on the speed when gravity provides the force compared to when the force is provided by a rubber band.
Table 2: Constant height dataMass of car (kg) Time through photogate
(sec)Speed (m/sec)
3
2A
Name: ______________________________________________ Date: __________
d. Research and define the terms “inertia”, “weight” and “mass”. Write 2-3 sentences that describe how these three concepts are similar and how they are different.

1
2B
Name: ______________________________________________ Date: __________
Newton’s Second Law
A Looking at the motion along the track
B Thinking about what you observed a. Where is there a net force acting on the car? How do you know?
b. Where is there zero net force on the car? How do you know?
c. Can you have constant speed with zero net force? What experimental data support your answer?
Table 1: Speed data
Time photogate A
(sec)
Time photogate B
(sec)
Time from A to B sec)
Speed at A(m/sec)
Speed at B(m/sec)
Level section
Down hill section
2B
2
Name: ______________________________________________ Date: __________
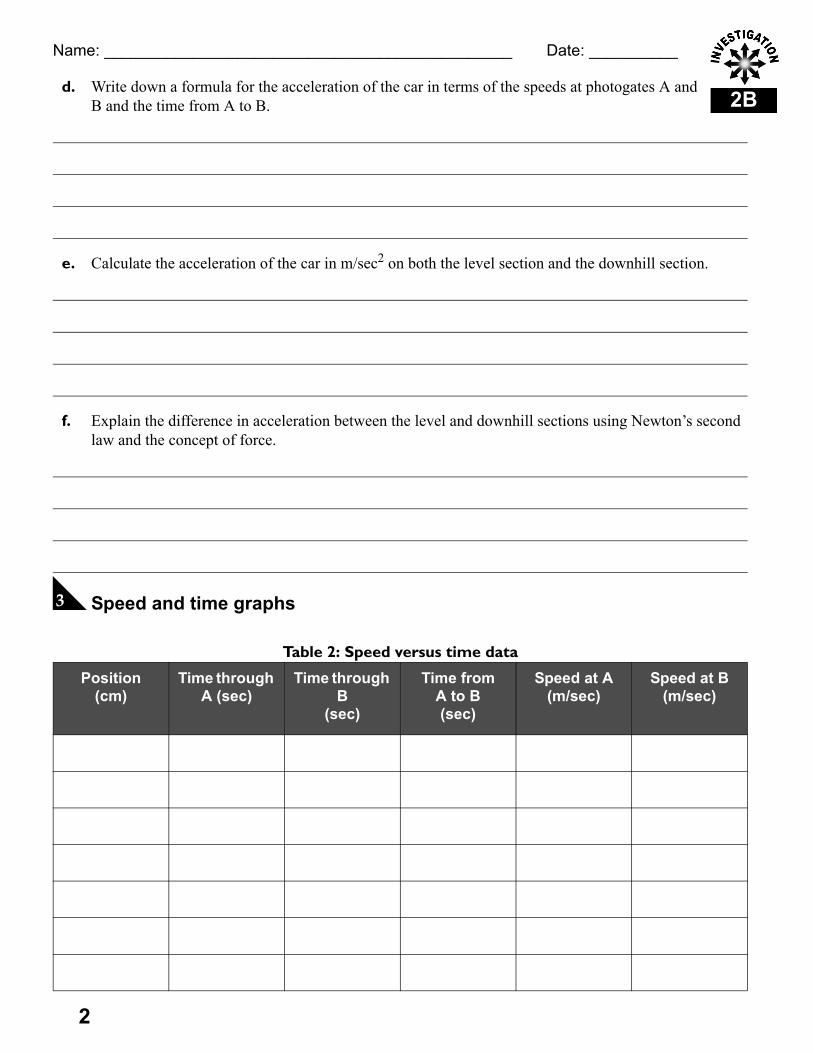
d. Write down a formula for the acceleration of the car in terms of the speeds at photogates A and B and the time from A to B.
e. Calculate the acceleration of the car in m/sec2 on both the level section and the downhill section.
f. Explain the difference in acceleration between the level and downhill sections using Newton’s second law and the concept of force.
C Speed and time graphs
Table 2: Speed versus time data
Position(cm)
Time through A (sec)
Time through B
(sec)
Time from A to B (sec)
Speed at A(m/sec)
Speed at B(m/sec)
3
2B
Name: ______________________________________________ Date: __________
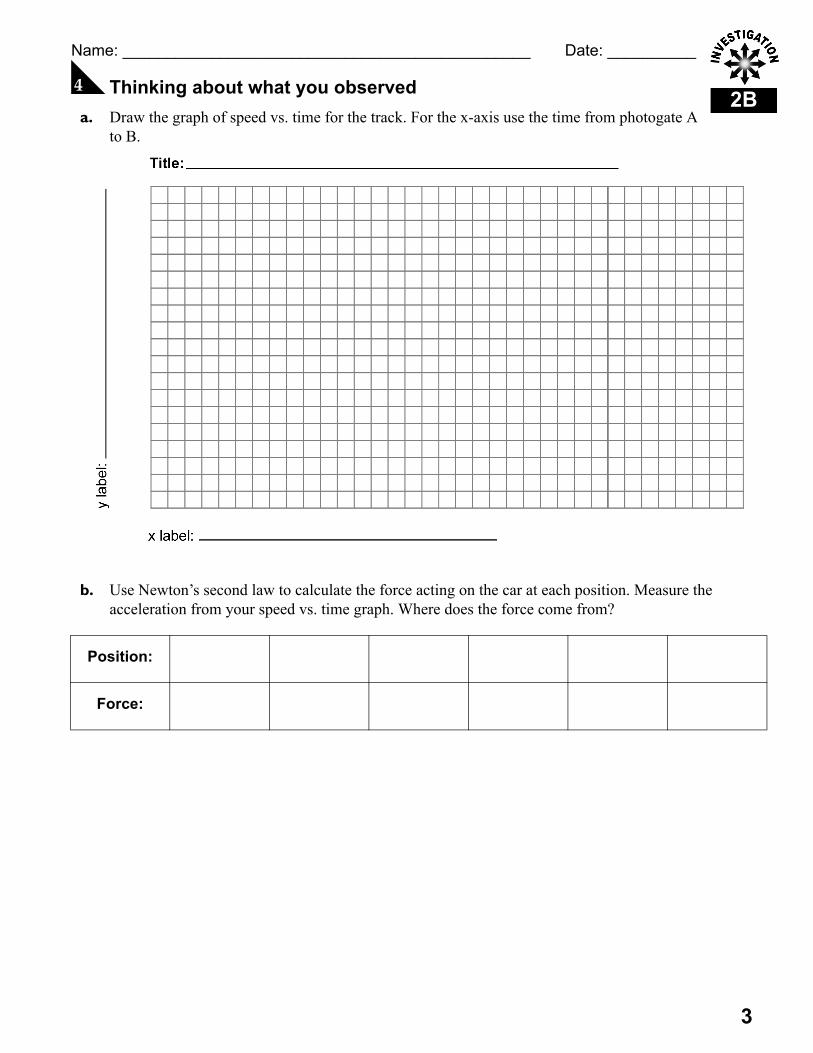
D Thinking about what you observed a. Draw the graph of speed vs. time for the track. For the x-axis use the time from photogate A
to B.
b. Use Newton’s second law to calculate the force acting on the car at each position. Measure the acceleration from your speed vs. time graph. Where does the force come from?
Position:
Force:

2B
4
Name: ______________________________________________ Date: __________
c. Draw the graph of force vs. time and compare this graph to the speed vs. time graph.
What relationship is there between the two graphs?
d. Explain how speed and acceleration are different using your speed vs. time graph as an example.
1
3A
Name: ______________________________________________ Date: __________
Momentum and the Third Law
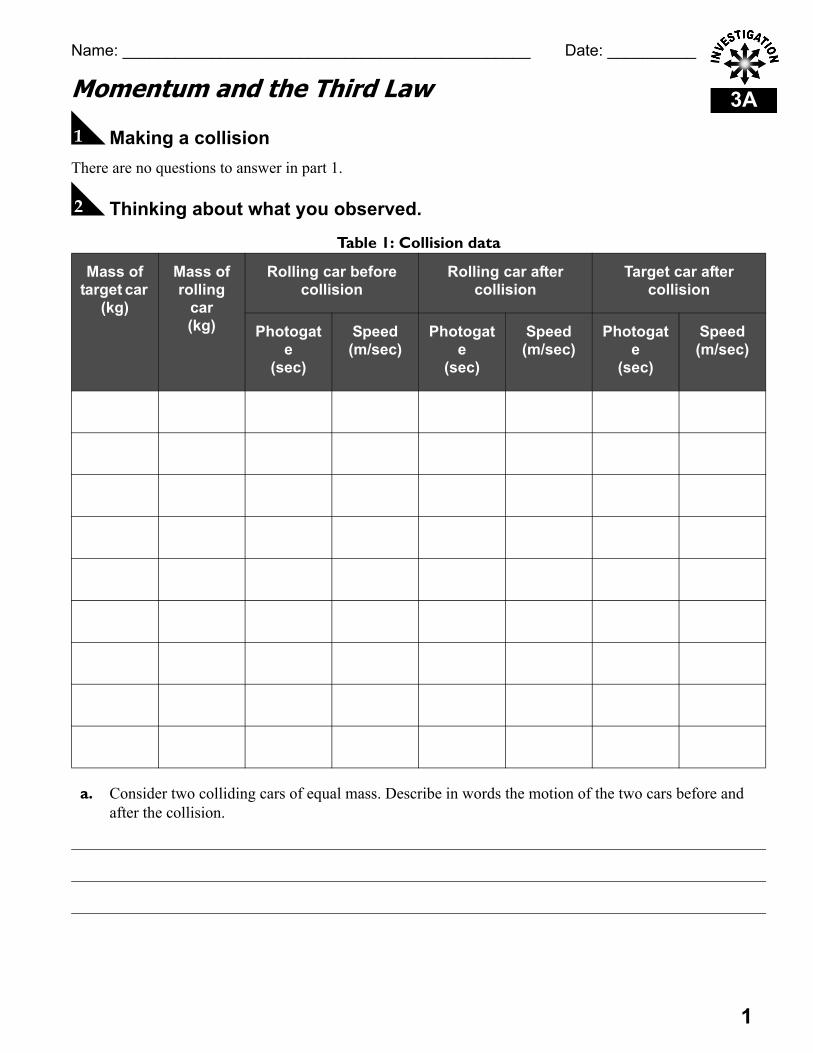
A Making a collision There are no questions to answer in part 1.
B Thinking about what you observed.
a. Consider two colliding cars of equal mass. Describe in words the motion of the two cars before and after the collision.
Table 1: Collision data
Mass of target car
(kg)
Mass of rolling
car (kg)
Rolling car before collision
Rolling car after collision
Target car after collision
Photogate
(sec)
Speed (m/sec)
Photogate
(sec)
Speed (m/sec)
Photogate
(sec)
Speed (m/sec)
3A
2
Name: ______________________________________________ Date: __________
b. The target car must exert a force on the rolling car to stop it. How strong is this force relative to the force the rolling car exerts on the target car to get it moving? What experimental evidence supports your answer?
c. Look up Newton’s third law and state how it applies to the collision of the two cars.
C MomentumThere are no questions to answer in part 3.
D Thinking about what you observed a. Describe the motion of the two cars when the target car has more mass than the rolling car.
b. Describe the motion of the two cars when the target car has less mass than the rolling car.
c. Research and write down a formula for the momentum of a moving object. State what each of the variables are and what units they have.

3
3A
Name: ______________________________________________ Date: __________
d. Calculate the total momentum of the two cars before and after each collision. Be sure to remember that momentum can be positive or negative depending on the direction of motion.
e. Research and write down the law of conservation of momentum. Describe how your data either support or do not support this law.
Trial Momentum before collision Momentum after collision
1
2
3
4
5
6
7
8
9

1
3B
Name: ______________________________________________ Date: __________
Conservation of Energy
A Energy exchange from potential to kinetic.
Table 1: Downhill data
Drop Height (m) Mass of car (kg) Photogate time (sec) Speed (m/sec)

3B
2
Name: ______________________________________________ Date: __________
B Thinking about what you observed a. Graph the speed of the car vs. the height. Use different symbols for different masses.
b. What does the graph tell you about the relationship between speed and height?
C Analyzing the data a. Use the formula for potential energy to fill in the first column of Table 2.
b. Use energy conservation to derive a formula for the speed of the car in terms of the energy it has at the start. (Hint: your formula should include only two variables, energy and height.)
c. Use the formula you just derived to fill in the column for the predicted speed of the car.
3
3B
Name: ______________________________________________ Date: __________
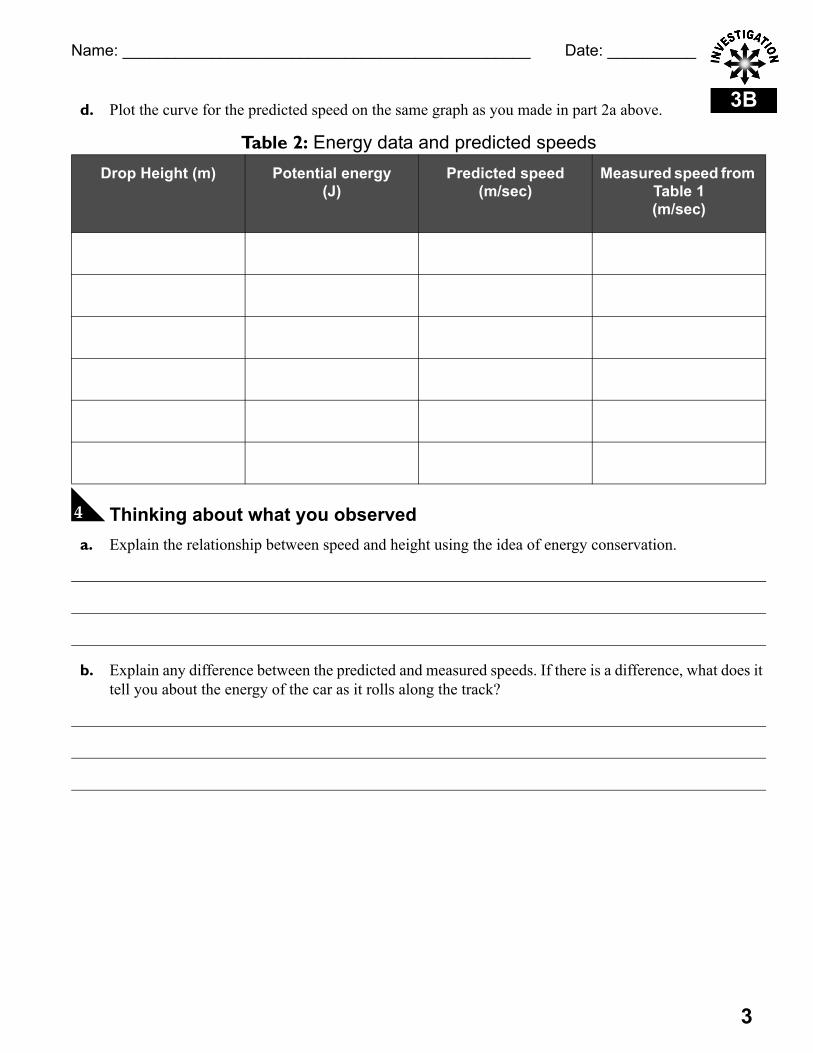
d. Plot the curve for the predicted speed on the same graph as you made in part 2a above.
D Thinking about what you observed a. Explain the relationship between speed and height using the idea of energy conservation.
b. Explain any difference between the predicted and measured speeds. If there is a difference, what does it tell you about the energy of the car as it rolls along the track?
Table 2: Energy data and predicted speedsDrop Height (m) Potential energy
(J)Predicted speed
(m/sec)Measured speed from
Table 1(m/sec)

3B
4
Name: ______________________________________________ Date: __________
c. Did changing the mass have a significant effect on the relationship between height and speed? How does your data support your answer?
d. Let the car roll downhill, bounce off the rubber band and go back up hill again. Does it reach the same height as it was dropped from? Explain why or why not using the idea of energy conservation.
e. Challenge experiment. Use a rubber band to launch the car uphill so it goes through the photogate with the same speed as it had going down. You won’t be able to get it precisely the same, but come as close as you can. If the speeds are the same, the car’s kinetic energy is also the same. Does the car reach the same height on the hill that it was dropped from to get the same speed in part 1? Explain any difference using the idea of energy lost to friction.
1
4A
Name: ______________________________________________ Date: __________
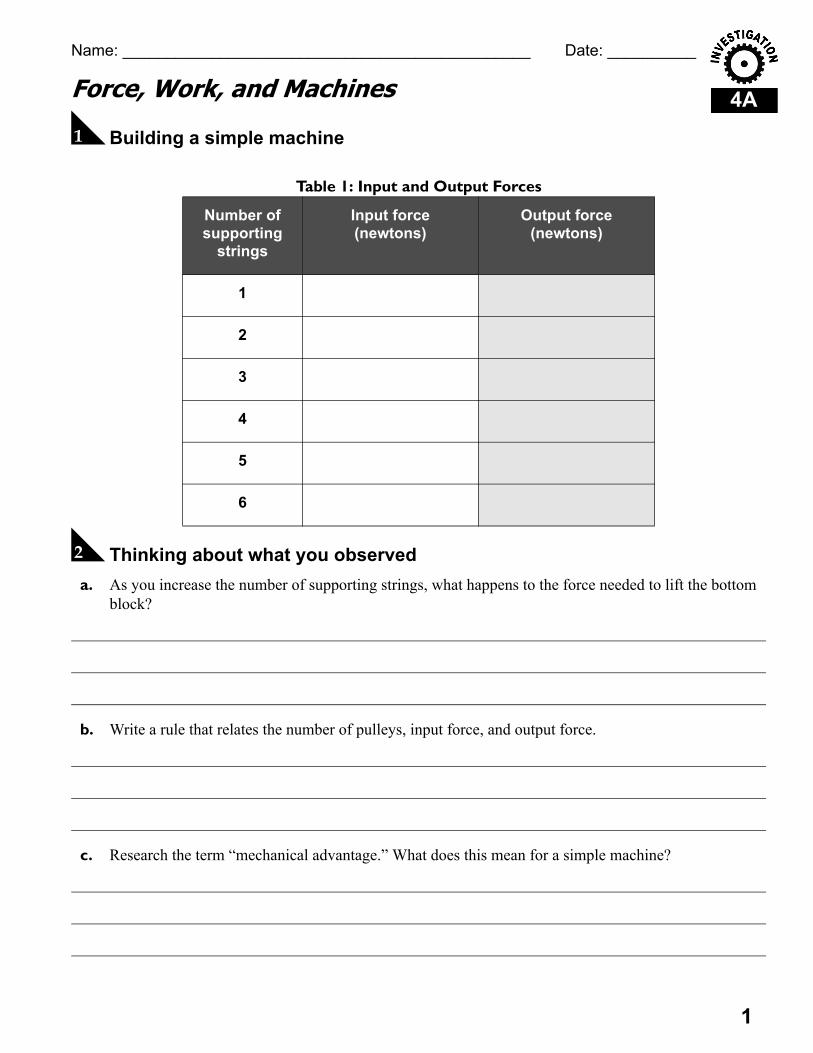
Force, Work, and Machines
A Building a simple machine
B Thinking about what you observed a. As you increase the number of supporting strings, what happens to the force needed to lift the bottom
block?
b. Write a rule that relates the number of pulleys, input force, and output force.
c. Research the term “mechanical advantage.” What does this mean for a simple machine?
Table 1: Input and Output Forces
Number of supporting
strings
Input force(newtons)
Output force(newtons)
1
2
3
4
5
6

4A
2
Name: ______________________________________________ Date: __________
d. Use your data from Table 1 to calculate the mechanical advantage for each arrangement of supporting strings.
C The input and output distance
Number of supporting strings
Mechanical Advantage
1
2
3
4
5
6
Table 2: Force and Distance Data
Mechanical advantage
Output force(newtons)
Output distance(meters)
Input force(newtons)
Input distance(meters)
1
2
3
4
5
6

3
4A
Name: ______________________________________________ Date: __________
D Thinking about what you observed a. As the mechanical advantage increases, what happens to the length of the string you have to
pull to raise the block?
b. The word work is used in many different ways. For example, you work on science problems, your toaster doesn’t work, or taking out the trash is too much work. In science, however, work has one specific meaning. Write one sentence that defines work in its scientific meaning.
c. You may have heard the saying, “nothing is free.” Explain why this is true of the ropes and pulleys. (HINT: What do you trade for using less input force to lift the block?)
d. Use your data to calculate the work done on the block (the output work). Record the data into table 3.
e. Next, use your data to calculate the work you did as you pulled on the string to lift the block. This is the input work. Record the data into table 3.
Table 3: Output and Input Work
Mechanical advantage Output work(joules)
Input work(joules)
1
2
3
4
5
6

4A
4
Name: ______________________________________________ Date: __________
f. For each mechanical advantage, how do output and input work compare?
g. Is output work ever greater than input work? Can you explain this?
h. Explain any differences between input and output work in your data.
1
4B
Name: ______________________________________________ Date: __________
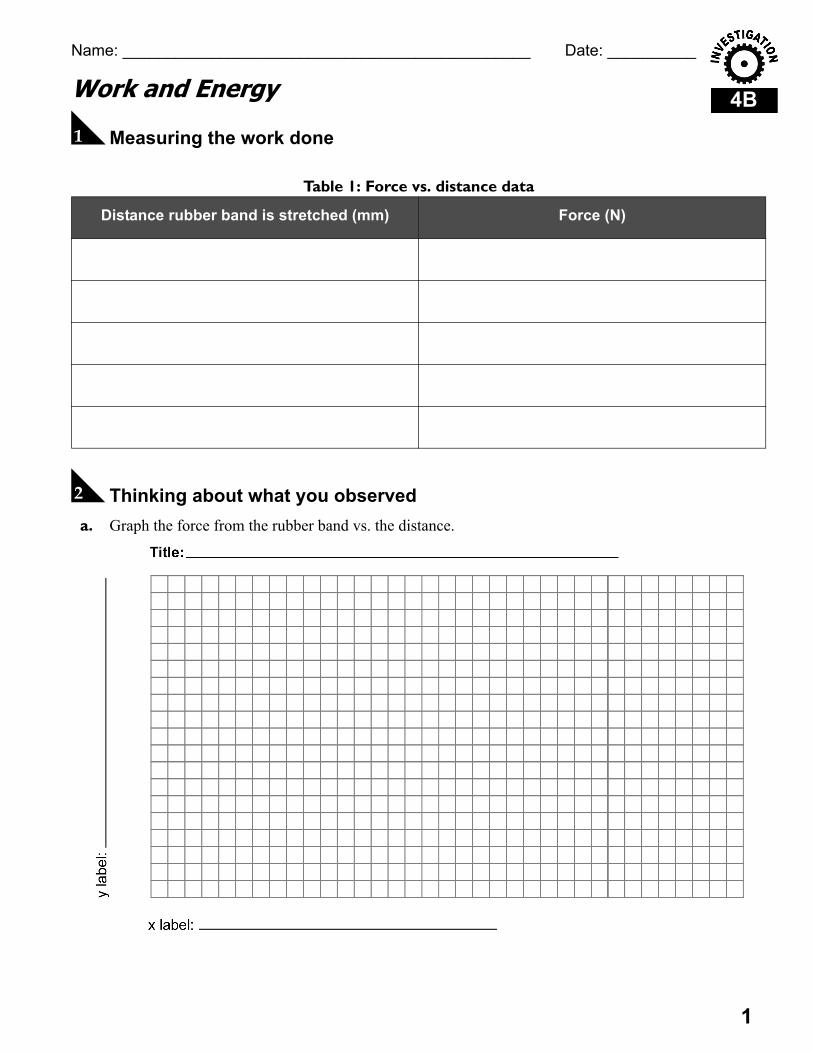
Work and Energy
A Measuring the work done
B Thinking about what you observed a. Graph the force from the rubber band vs. the distance.
Table 1: Force vs. distance data
Distance rubber band is stretched (mm) Force (N)
4B
2
Name: ______________________________________________ Date: __________
b. Write down a one sentence definition of work in physics.
c. You would like to know how much work the rubber band does on the car during a launch. Since the force changes with distance, you need to use the graph to do some averaging. Divide your graph up into bars each representing one centimeter of distance. Make the height of each bar the average force over the distance interval covered by the bar. The area of each bar is the work done over that interval of distance.
3
4B
Name: ______________________________________________ Date: __________
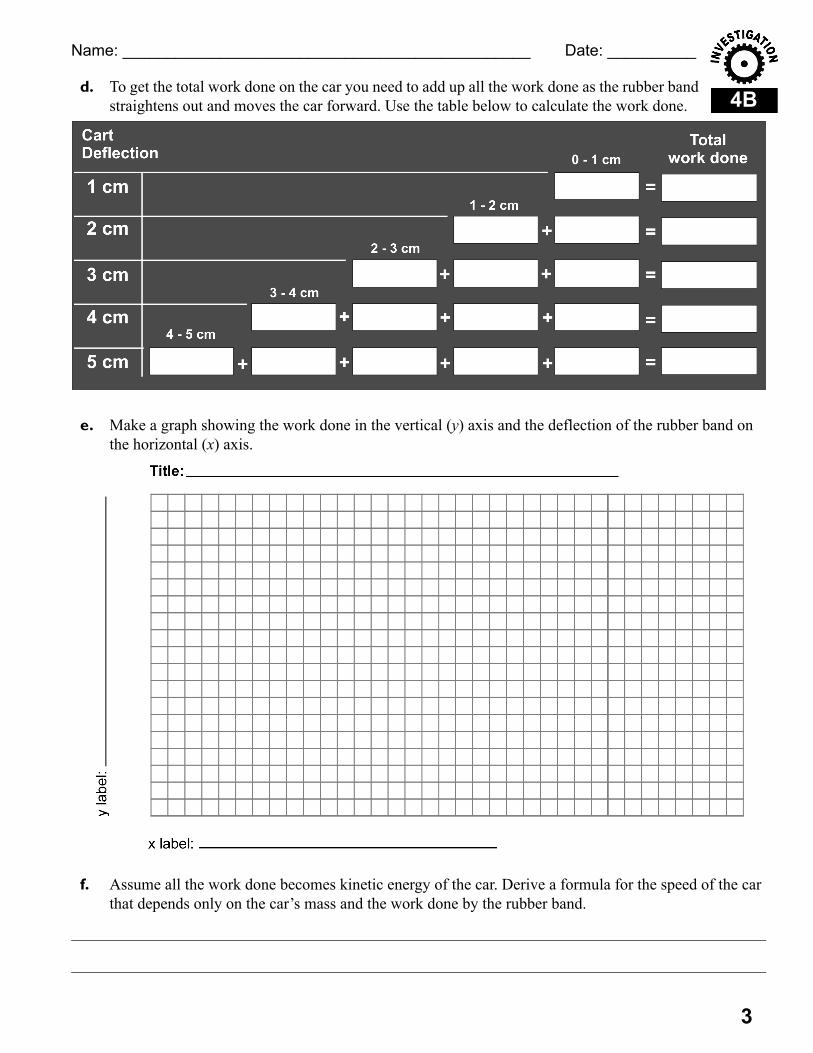
d. To get the total work done on the car you need to add up all the work done as the rubber band straightens out and moves the car forward. Use the table below to calculate the work done.
e. Make a graph showing the work done in the vertical (y) axis and the deflection of the rubber band on the horizontal (x) axis.
f. Assume all the work done becomes kinetic energy of the car. Derive a formula for the speed of the car that depends only on the car’s mass and the work done by the rubber band.
4B
4
Name: ______________________________________________ Date: __________
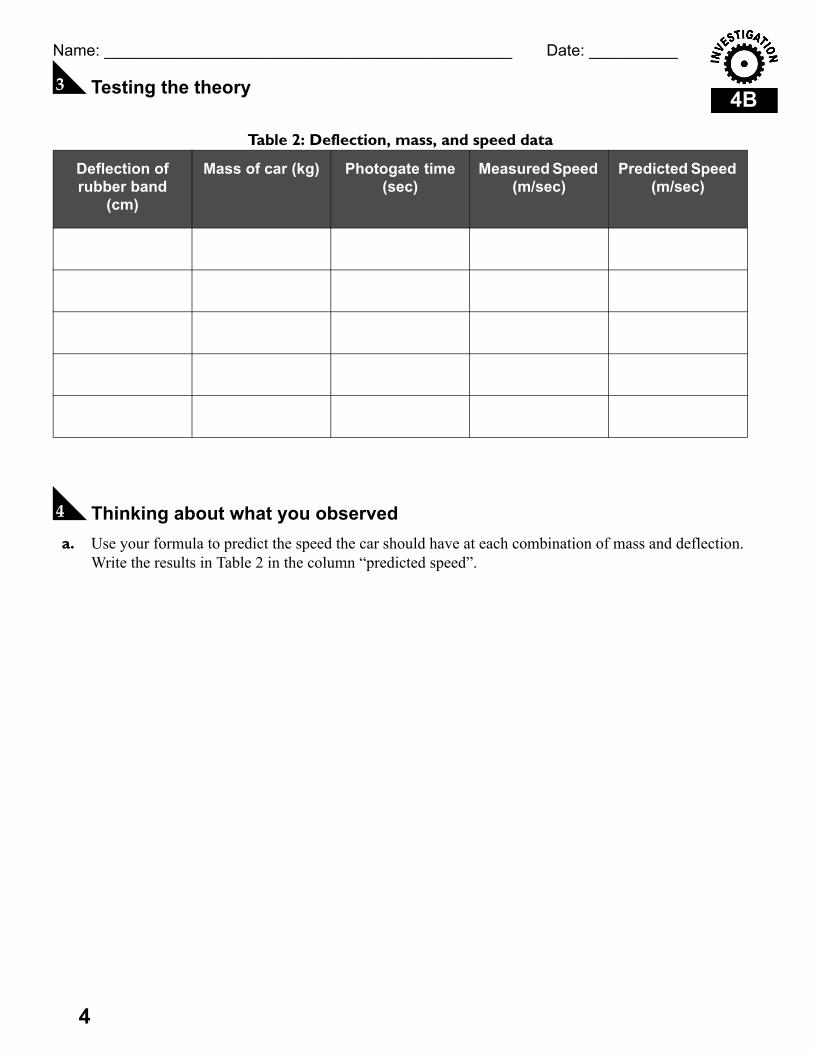
C Testing the theory
D Thinking about what you observed a. Use your formula to predict the speed the car should have at each combination of mass and deflection.
Write the results in Table 2 in the column “predicted speed”.
Table 2: Deflection, mass, and speed data
Deflection of rubber band
(cm)
Mass of car (kg) Photogate time (sec)
Measured Speed (m/sec)
Predicted Speed (m/sec)

5
4B
Name: ______________________________________________ Date: __________
b. Graph the predicted speed of the car vs. the deflection of the rubber band. Draw a smooth curve through the plotted points. On the same graph, show the measured speeds.
c. Graph the measured speed of the car vs. the deflection of the rubber band on the same graph as part (c).
d. Does your data support the theory that the energy of the car is equal to the work done by the rubber band? Your answer should provide evidence from your results and discuss possible sources of errors.
e. Use your theory to predict the speed if a car with 2 and 3 steel balls is launched at a deflection of 3 cm. Do the experiment and see if your prediction is accurate.
1
5A
Name: ______________________________________________ Date: __________
Equilibrium and Forces
A Making equilibrium
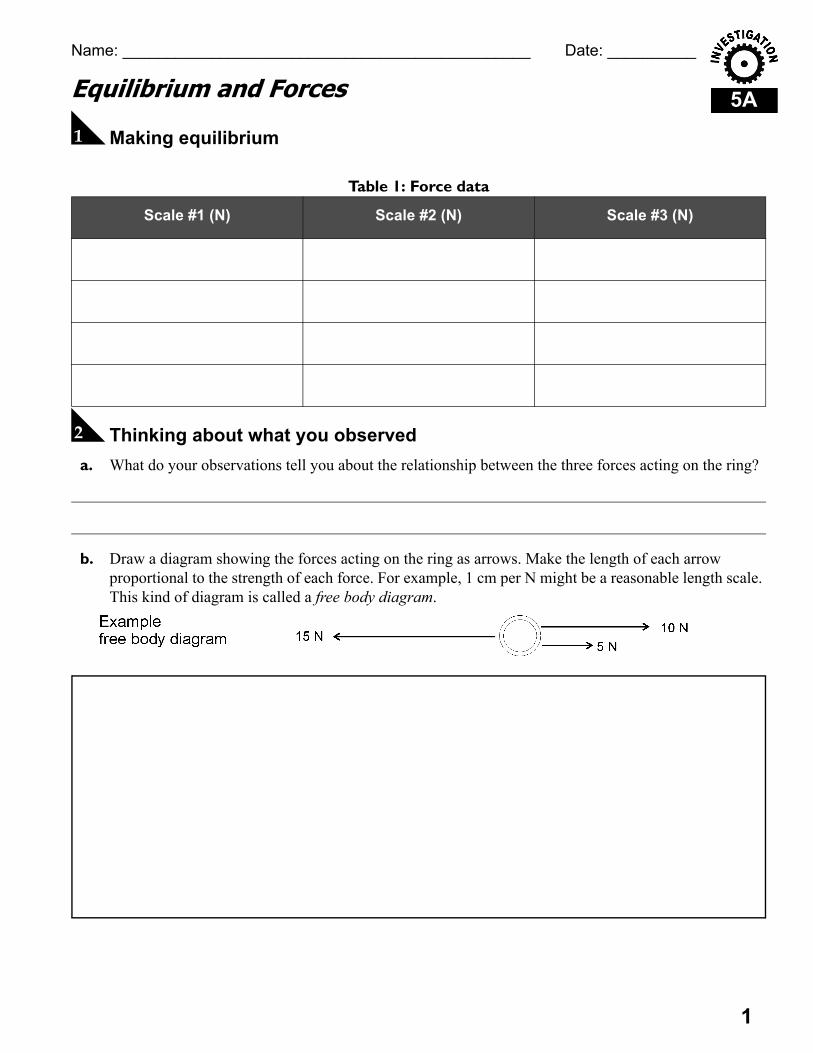
B Thinking about what you observed a. What do your observations tell you about the relationship between the three forces acting on the ring?
b. Draw a diagram showing the forces acting on the ring as arrows. Make the length of each arrow proportional to the strength of each force. For example, 1 cm per N might be a reasonable length scale. This kind of diagram is called a free body diagram.
Table 1: Force data
Scale #1 (N) Scale #2 (N) Scale #3 (N)

5A
2
Name: ______________________________________________ Date: __________
c. If the total force acting on an object is zero, what does Newton’s second law say about the motion? Does the object have to be at rest?
C The force of gravity
D Thinking about what you observed a. Draw a free body diagram showing the two forces acting on the group of washers.
Table 2: Mass and weight data
Number of washers Mass (kg) Weight (N)
3
5A
Name: ______________________________________________ Date: __________
b. The spring scale gives you one force, how do you know the other one?
c. Make a graph showing the weight in Newtons on the y-axis versus the mass in kilograms on the x-axis.
d. The strength of gravity is measured in N/kg. On the moon, the strength of gravity is 1.62 N/kg. That means a 1-kg object weighs 1.62 N on the Moon. Determine the strength of Earth’s surface gravity from your graph.
1
5B
Name: ______________________________________________ Date: __________
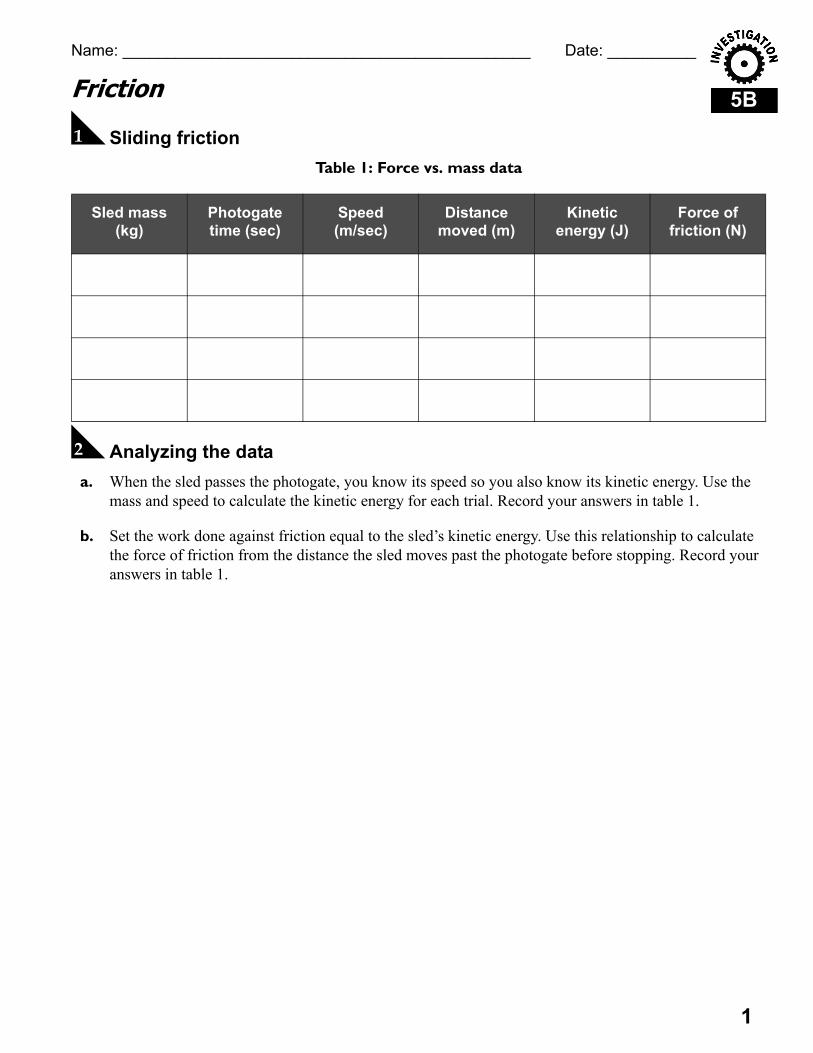
Friction
A Sliding friction Table 1: Force vs. mass data
B Analyzing the data a. When the sled passes the photogate, you know its speed so you also know its kinetic energy. Use the
mass and speed to calculate the kinetic energy for each trial. Record your answers in table 1.
b. Set the work done against friction equal to the sled’s kinetic energy. Use this relationship to calculate the force of friction from the distance the sled moves past the photogate before stopping. Record your answers in table 1.
Sled mass (kg)
Photogate time (sec)
Speed(m/sec)
Distance moved (m)
Kinetic energy (J)
Force of friction (N)
5B
2
Name: ______________________________________________ Date: __________
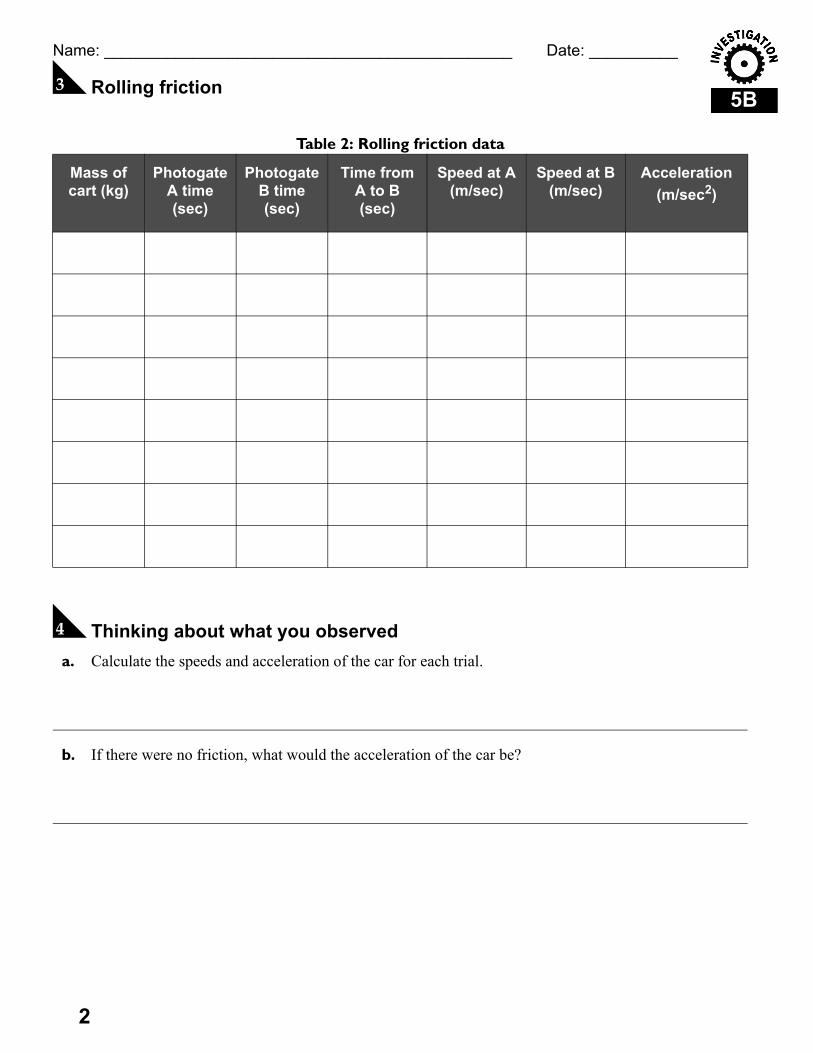
C Rolling friction
D Thinking about what you observed a. Calculate the speeds and acceleration of the car for each trial.
b. If there were no friction, what would the acceleration of the car be?
Table 2: Rolling friction data
Mass of cart (kg)
Photogate A time (sec)
Photogate B time (sec)
Time from A to B (sec)
Speed at A(m/sec)
Speed at B(m/sec)
Acceleration(m/sec2)
3
5B
Name: ______________________________________________ Date: __________
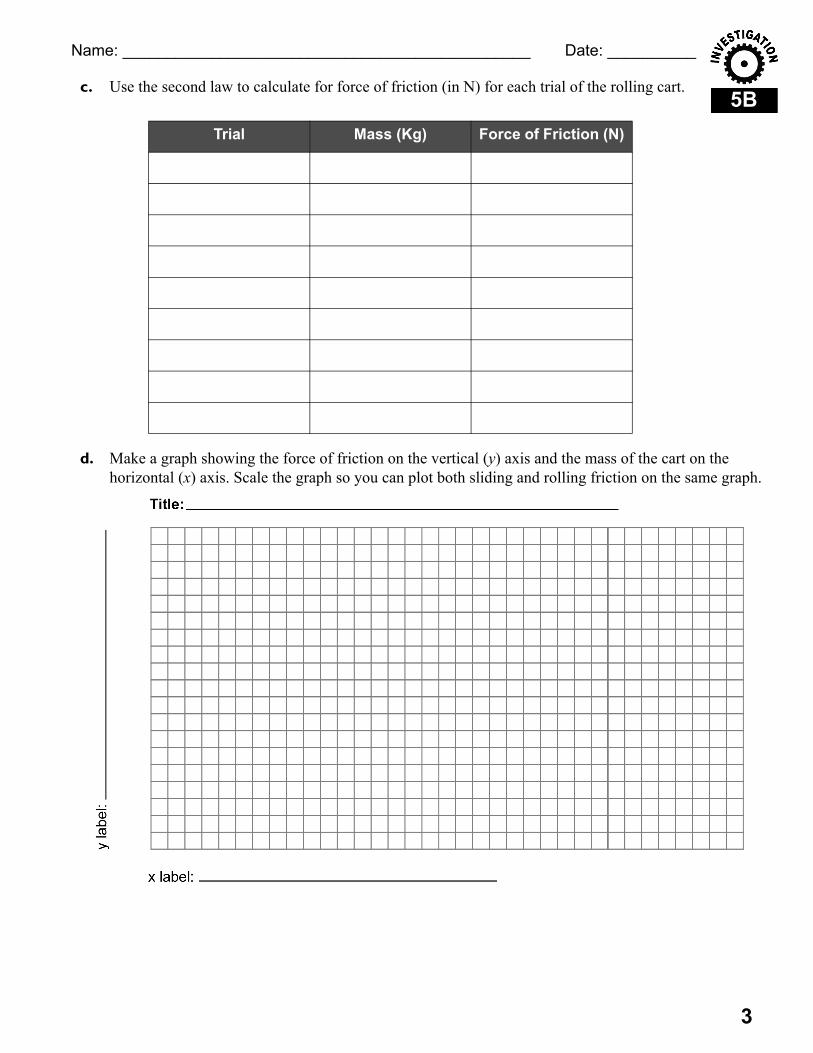
c. Use the second law to calculate for force of friction (in N) for each trial of the rolling cart.
d. Make a graph showing the force of friction on the vertical (y) axis and the mass of the cart on the horizontal (x) axis. Scale the graph so you can plot both sliding and rolling friction on the same graph.
Trial Mass (Kg) Force of Friction (N)
5B
4
Name: ______________________________________________ Date: __________
e. Describe the relative strength of the friction forces for sliding and rolling.
f. How does the force of friction vary with mass? Is the variation the same for rolling and sliding friction?
g. How does the force of rolling friction vary with speed? Make a graph showing the force of friction at different average speeds for carts with the same mass.
1
6A
Name: ______________________________________________ Date: __________
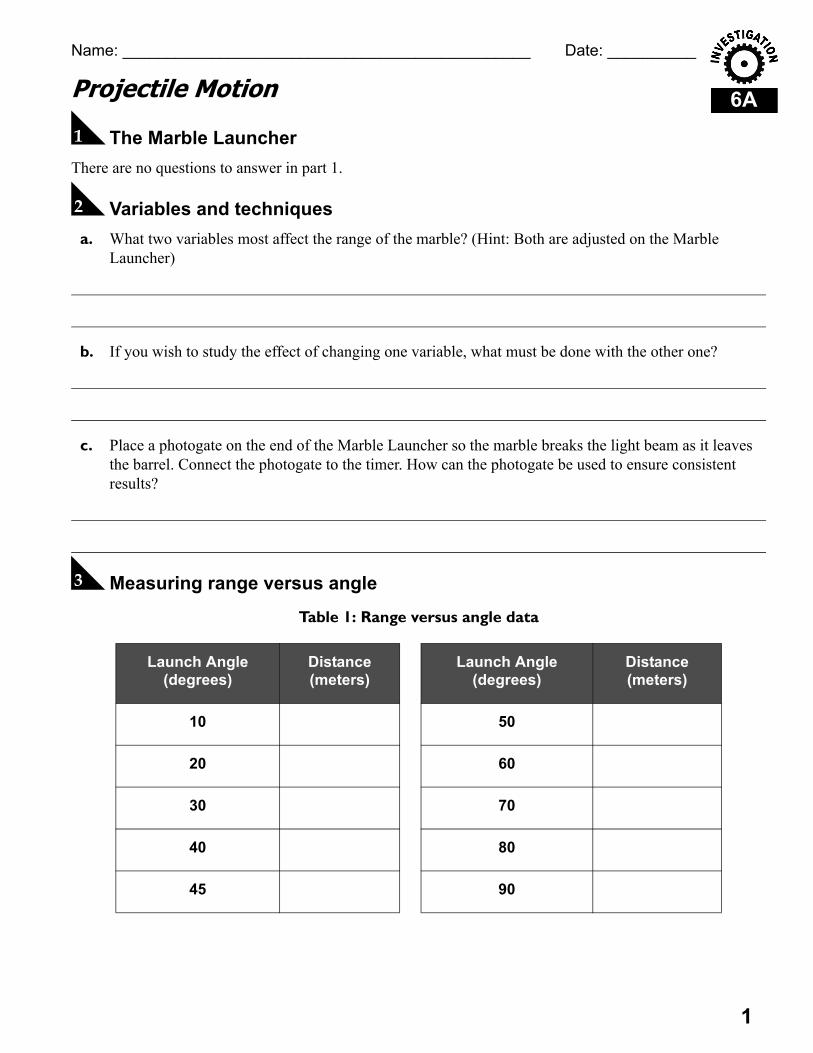
Projectile Motion
A The Marble LauncherThere are no questions to answer in part 1.
B Variables and techniques a. What two variables most affect the range of the marble? (Hint: Both are adjusted on the Marble
Launcher)
b. If you wish to study the effect of changing one variable, what must be done with the other one?
c. Place a photogate on the end of the Marble Launcher so the marble breaks the light beam as it leaves the barrel. Connect the photogate to the timer. How can the photogate be used to ensure consistent results?
C Measuring range versus angle
Table 1: Range versus angle data
Launch Angle(degrees)
Distance(meters)
Launch Angle(degrees)
Distance(meters)
10 50
20 60
30 70
40 80
45 90

6A
2
Name: ______________________________________________ Date: __________
D Thinking about what you observed a. Make a graph with launch angle on the x-axis and range on the y-axis.
b. Use your graph to find the angle that launches the marble with the greatest range.
a. The Marble Launcher starts the marble more than 10 cm above the floor. Suppose the marble were launched from floor level. Do you think it would go a shorter, longer, or about the same distance? Explain why.
b. You are challenged to launch a marble to travel a distance of 3.00 meters. At what angle will you set the launcher?
c. Referring to your answer for question (c), state another angle that would give you the same result.
1
6B
Name: ______________________________________________ Date: __________
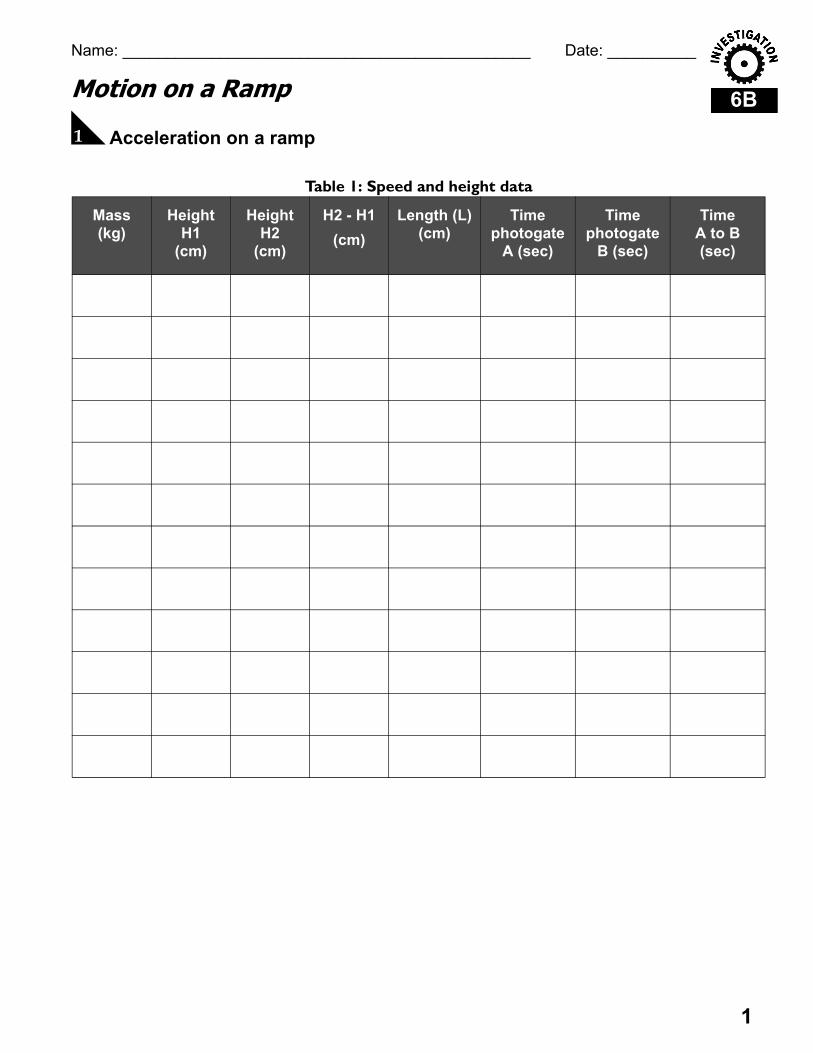
Motion on a Ramp
A Acceleration on a ramp
Table 1: Speed and height data
Mass(kg)
Height H1
(cm)
Height H2
(cm)
H2 - H1(cm)
Length (L)(cm)
Time photogate
A (sec)
Time photogate
B (sec)
Time A to B (sec)
6B
2
Name: ______________________________________________ Date: __________
B Thinking about what you observed a. The steepness of the hill is described by the ratio of height over length. What is this ratio for a
ramp that is vertical (straight up)? What is the ratio for a ramp that is horizontal?
a. Calculate the ratio of (H2 - H1) ÷ L for the angles you tested. Record the results in Table 2, column 4 under “Steepness ratio”.
b. Calculate the speeds and acceleration of the rolling car for each trial (Table 2, columns 1, 2, 3).
c. Make a graph showing the acceleration of the car on the vertical (y) axis and the steepness ratio on the horizontal (x) axis.
d. Research the acceleration of an object dropped straight down in free fall. How does this acceleration compare to the acceleration you determined on the ramp? How does the steepness ratio figure into the relationship between acceleration straight down and acceleration along the ramp?
3
6B
Name: ______________________________________________ Date: __________
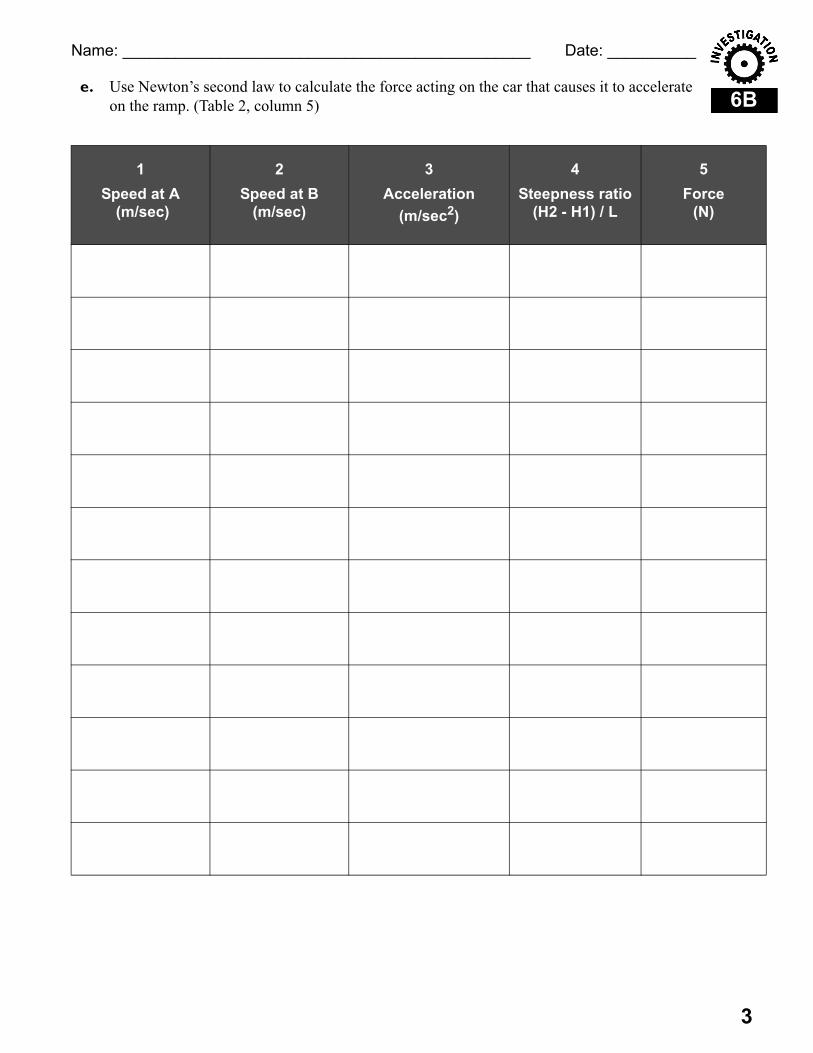
e. Use Newton’s second law to calculate the force acting on the car that causes it to accelerate on the ramp. (Table 2, column 5)
1Speed at A
(m/sec)
2Speed at B
(m/sec)
3Acceleration
(m/sec2)
4Steepness ratio
(H2 - H1) / L
5Force
(N)
6B
4
Name: ______________________________________________ Date: __________
f. How does the force in column 5 compare to the weight of the car? How does the steepness ratio figure into the relationship between weight and force along the ramp?
g. Research a mathematical name for the steepness ratio.

1
7A
Name: ______________________________________________ Date: __________
Temperature and Heat
A Thinking about temperature and energy a. Which cup has more energy, the hot one or the cold one? Why do you think so?
b. What do you think the temperature of the mixture will be? Why?
c. If the system includes both the cold and hot water, compare the energy of the system before mixing to the energy after mixing. You may ignore any energy going to air or friction.
B Doing the experiment
C Thinking about what you observed a. Given the actual hot and cold temperatures, what do you think the mixture temperature should be?
b. Did the result of the experiment agree with your prediction? Discuss the meaning of “agree” in terms of the accuracy and precision of your experiment.
Table 1: Temperature data for mixing equal masses of water
Cold water temperature before mixing (°C)
Hot water temperature before mixing (°C)
Mixture temperature(°C)
7A
2
Name: ______________________________________________ Date: __________
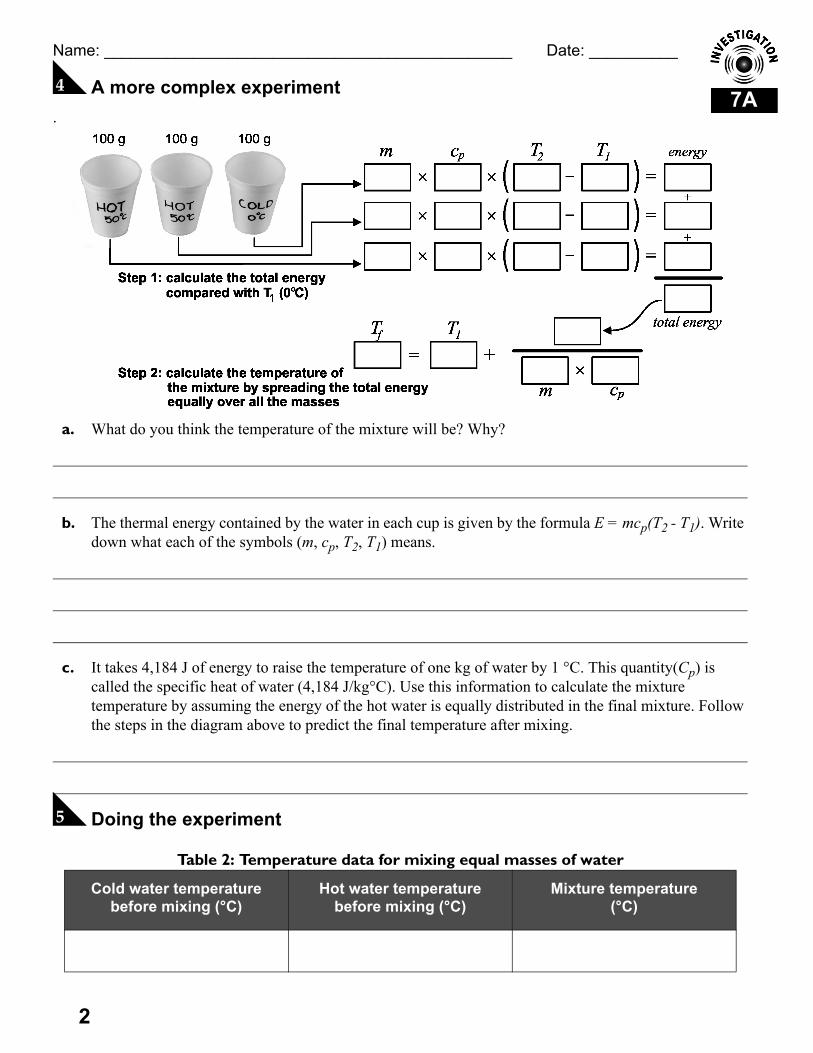
D A more complex experiment.
a. What do you think the temperature of the mixture will be? Why?
b. The thermal energy contained by the water in each cup is given by the formula E = mcp(T2 - T1). Write down what each of the symbols (m, cp, T2, T1) means.
c. It takes 4,184 J of energy to raise the temperature of one kg of water by 1 °C. This quantity(Cp) is called the specific heat of water (4,184 J/kg°C). Use this information to calculate the mixture temperature by assuming the energy of the hot water is equally distributed in the final mixture. Follow the steps in the diagram above to predict the final temperature after mixing.
E Doing the experiment
Table 2: Temperature data for mixing equal masses of water
Cold water temperature before mixing (°C)
Hot water temperature before mixing (°C)
Mixture temperature(°C)
3
7A
Name: ______________________________________________ Date: __________
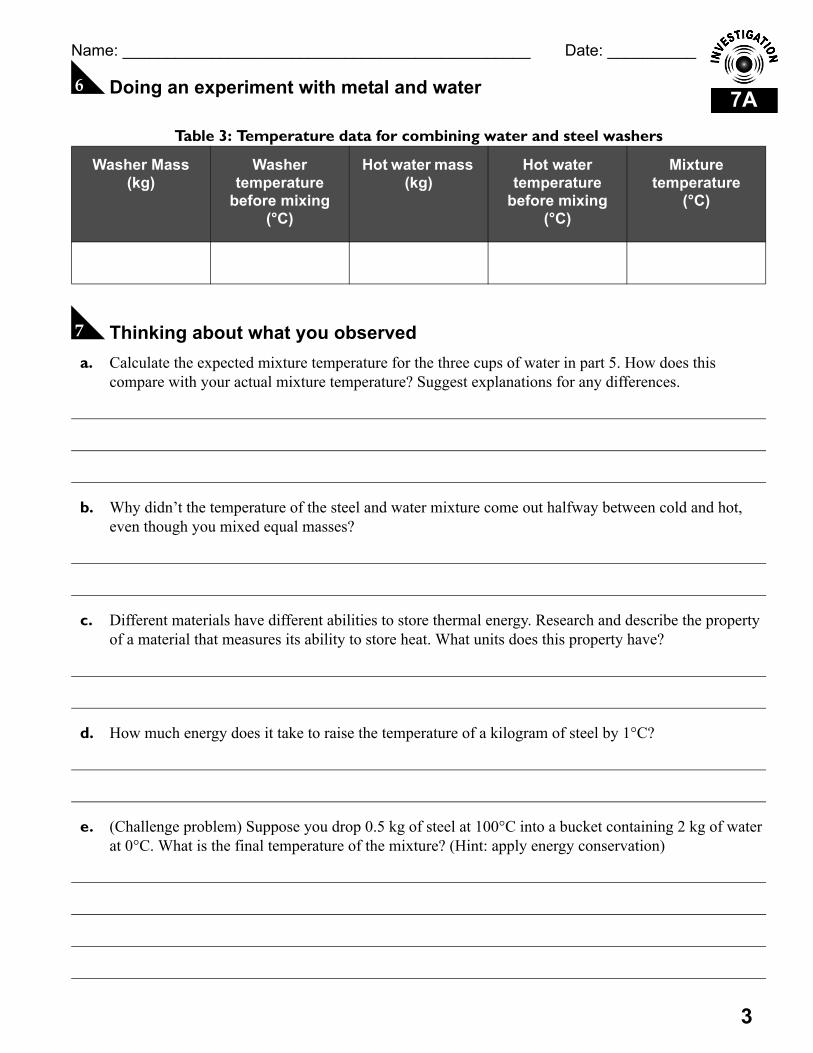
F Doing an experiment with metal and water
G Thinking about what you observed a. Calculate the expected mixture temperature for the three cups of water in part 5. How does this
compare with your actual mixture temperature? Suggest explanations for any differences.
b. Why didn’t the temperature of the steel and water mixture come out halfway between cold and hot, even though you mixed equal masses?
c. Different materials have different abilities to store thermal energy. Research and describe the property of a material that measures its ability to store heat. What units does this property have?
d. How much energy does it take to raise the temperature of a kilogram of steel by 1°C?
e. (Challenge problem) Suppose you drop 0.5 kg of steel at 100°C into a bucket containing 2 kg of water at 0°C. What is the final temperature of the mixture? (Hint: apply energy conservation)
Table 3: Temperature data for combining water and steel washers
Washer Mass (kg)
Washer temperature
before mixing (°C)
Hot water mass (kg)
Hot water temperature
before mixing (°C)
Mixture temperature
(°C)
1
7B
Name: ______________________________________________ Date: __________
Energy and Phase Changes
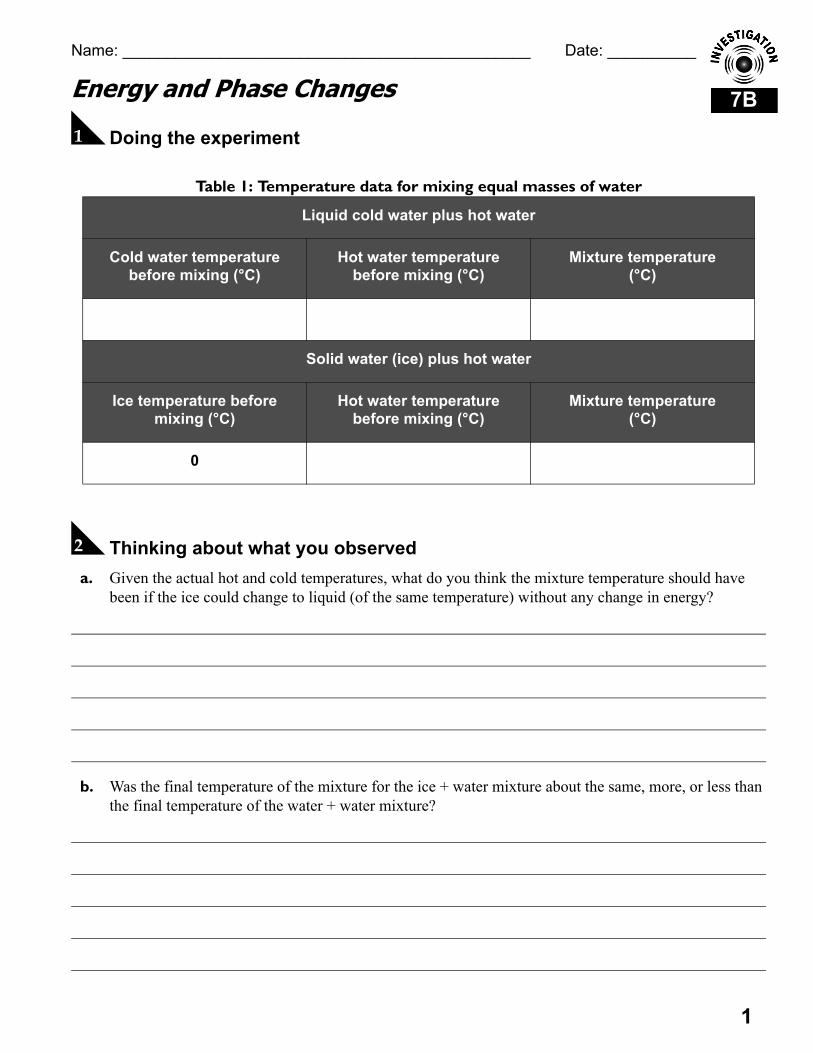
A Doing the experiment
B Thinking about what you observed a. Given the actual hot and cold temperatures, what do you think the mixture temperature should have
been if the ice could change to liquid (of the same temperature) without any change in energy?
b. Was the final temperature of the mixture for the ice + water mixture about the same, more, or less than the final temperature of the water + water mixture?
Table 1: Temperature data for mixing equal masses of water
Liquid cold water plus hot water
Cold water temperature before mixing (°C)
Hot water temperature before mixing (°C)
Mixture temperature(°C)
Solid water (ice) plus hot water
Ice temperature before mixing (°C)
Hot water temperature before mixing (°C)
Mixture temperature(°C)
0
7B
2
Name: ______________________________________________ Date: __________
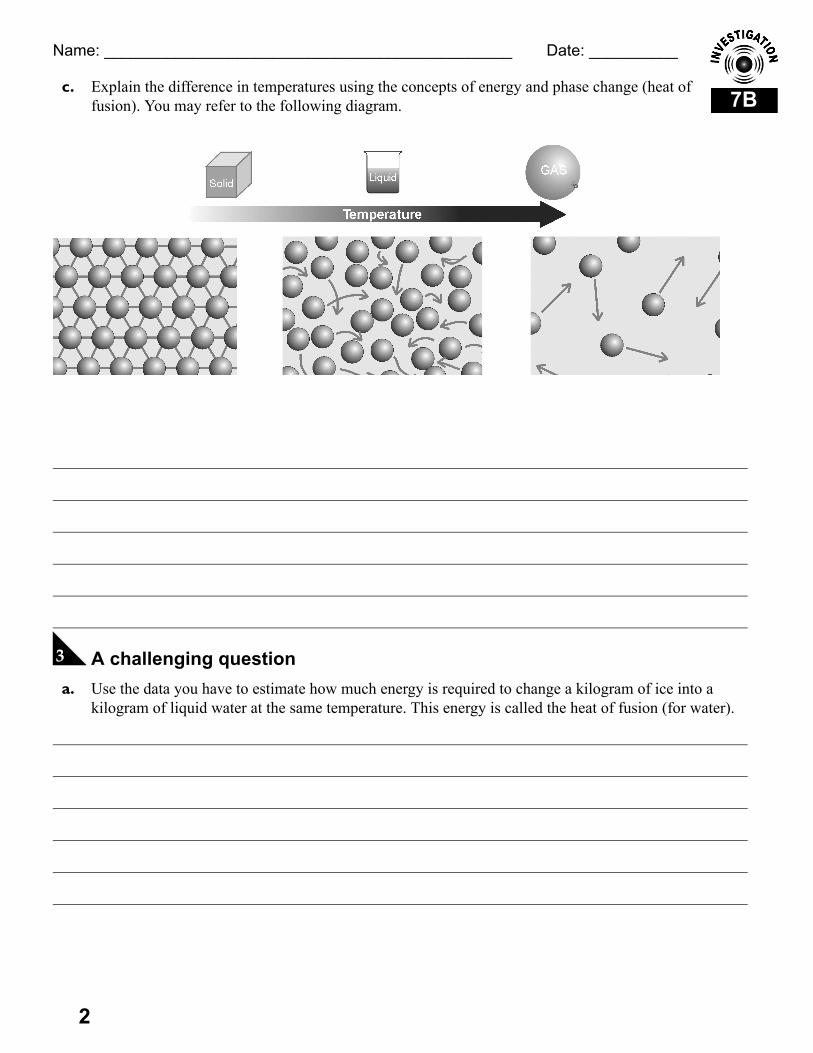
c. Explain the difference in temperatures using the concepts of energy and phase change (heat of fusion). You may refer to the following diagram.
C A challenging question a. Use the data you have to estimate how much energy is required to change a kilogram of ice into a
kilogram of liquid water at the same temperature. This energy is called the heat of fusion (for water).
1
8A
Name: ______________________________________________ Date: __________
Density and the Phases of Matter
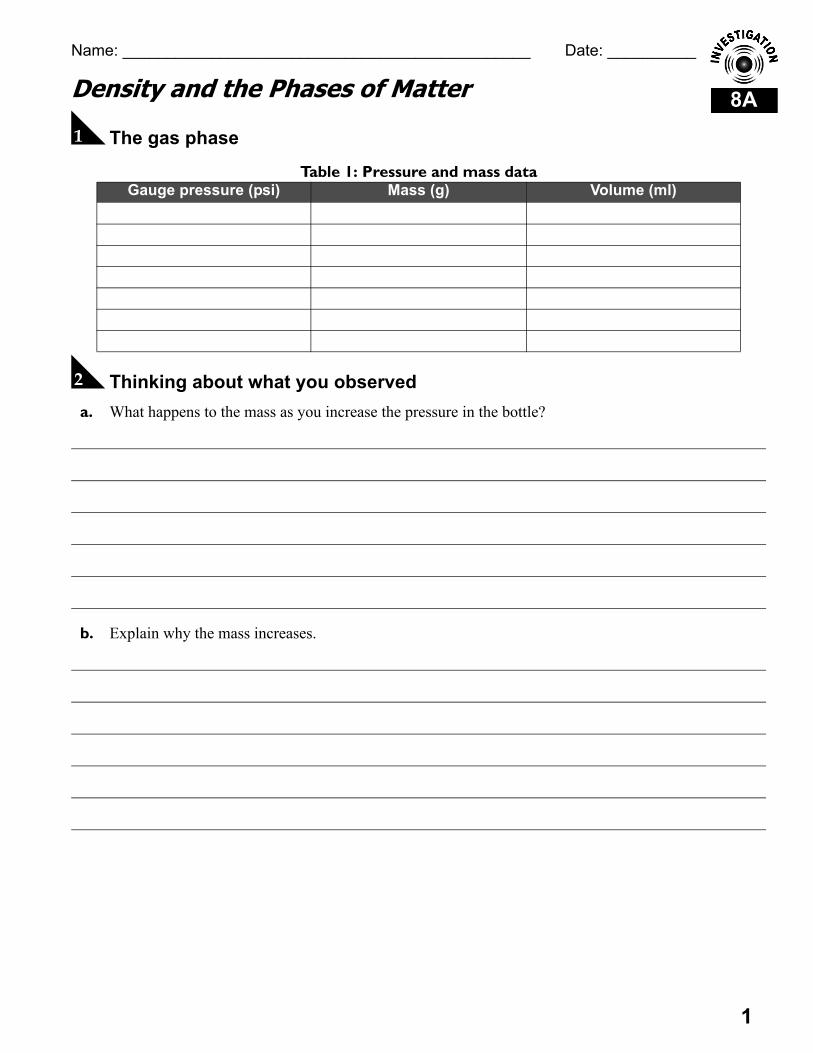
A The gas phase
Table 1: Pressure and mass data
B Thinking about what you observed a. What happens to the mass as you increase the pressure in the bottle?
b. Explain why the mass increases.
Gauge pressure (psi) Mass (g) Volume (ml)
8A
2
Name: ______________________________________________ Date: __________
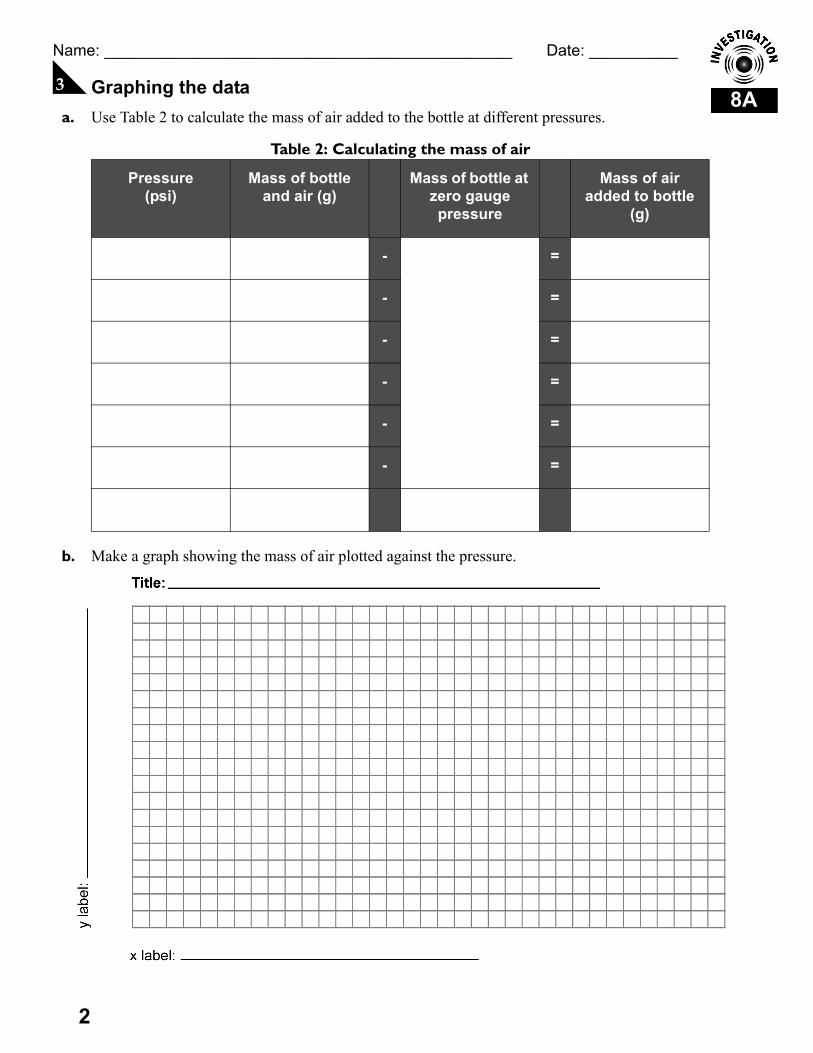
C Graphing the data a. Use Table 2 to calculate the mass of air added to the bottle at different pressures.
b. Make a graph showing the mass of air plotted against the pressure.
Table 2: Calculating the mass of air
Pressure(psi)
Mass of bottle and air (g)
Mass of bottle at zero gauge pressure
Mass of air added to bottle
(g)
- =
- =
- =
- =
- =
- =
3
8A
Name: ______________________________________________ Date: __________
c. When the pressure is zero on the gauge, is there any air in the bottle? Use the graph (or your data) to estimate the mass of air in the bottle at atmospheric pressure (zero on the gauge).
D Liquid and solid phasesThere are no questions to answer in part 4.
E Thinking about what you observed a. Compare the total amount of matter in the gas, liquid, and solid samples. Does one have more matter?
Does one have less matter? Or, do all have about the same amount of matter?
b. Most of the mass in ordinary matter is in protons and neutrons. How does the total number of protons and neutrons compare in each of the three samples (solid, liquid, gas)?
c. How does the number of atoms compare in each of the three samples (solid, liquid, gas)? How can the number of atoms be different from the total number of protons and neutrons?
d. Compare the relative density of each of the three samples (solid, liquid, gas).
1
8B
Name: ______________________________________________ Date: __________
Motion of Fluids
A Demonstrating Bernoulli’s equationThere are no questions to answer in part 1.
B Thinking about what you observed a. Does the paper curl up into the moving air or down away from the moving air?
b. Force has units of mass multiplied by acceleration. Energy has units of force multiplied by distance. What are the units of pressure?
c. Show that the units of pressure are identical to the units of energy density. Energy density is energy divided by volume, or joules per cubic meter.
d. When you blow air what happens to its kinetic energy? Does the kinetic energy increase, decreases, or stay the same?
e. If the kinetic energy increases, the energy must come from somewhere. Where does it come from and how does this change the pressure?
f. Use the concept of pressure to explain why the paper lifts up when you blow air over it.
C Demonstrating energy conservationThere are no questions to answer in part 3.
8B
2
Name: ______________________________________________ Date: __________
D Thinking about what you observed a. What happens to the speed of the water jet coming out of the hole as the carton empties out?
Does the speed stay the same, get faster, or get slower as the water level goes down? How can you tell?
b. How does the pressure change with depth in a fluid?
c. Where does the kinetic energy of the moving water jet come from?
d. Use the law of energy conservation to explain the observed speed of the water jet as the carton empties out.
e. What would happen to the speed of the water jet if you blow into the carton and increase the pressure? Why do you think so? Try the experiment (if you can) and see if your prediction is correct.
E Bernoulli’s equation a. Research Bernoulli’s equation and give a 2-3 sentence explanation of how a wing creates lift forces
large enough to fly a plane. You may refer to the diagram on the right in your answer.
1
9A
Name: ______________________________________________ Date: __________
The Atom
A Modeling an atomThere are no questions to answer in part 1.
B Thinking about the atom a. What is the number below the element symbol called and what does this number tell you about the
atom?
b. What is the number(s) above the element symbol called and what does this number tell you about the atom?
c. Why do some elements have more than one number above the symbol? What are the variations in this number called?
C The Atomic ChallengeThere are no questions to answer in part 3.
D Using the periodic tableAtoms which are not on the periodic table shown (see next page) may exist in nature but they are radioactiveand unstable. For example, carbon-14 (C14) is unstable and is not listed although C12 and C13 are stable.
a. How many electrons does an atom of neon (Ne) have?
b. How many stable isotopes does oxygen (O) have?
9A
2
Name: ______________________________________________ Date: __________
c. Find one element on the periodic table that has no stable isotopes.
d. What element has atoms with 26 protons in the nucleus?
e. On most periodic tables a single atomic mass is listed instead of the mass numbers for all the stable isotopes. How is this mass related to the different isotopes?
1
9B
Name: ______________________________________________ Date: __________
Energy and the Quantum Theory
A The neon atomThere are no questions to answer in part 1.
B How atoms exchange energy a. Explain the meaning of the term “ground state” when applied to an atom?
b. Can the second energy level of neon hold any more electrons? How does this affect neon’s chemical properties and position on the periodic table?
c. Take the red “pump 1” card from your hand and put it on the atom board. Move one electron from level 2 to level 3. Explain what this sequence of actions represents in a real atom.
d. Take the yellow “pump 2” card from your hand and put it on the atom board. Move any one electron up 2 levels. Explain what this sequence of actions represents in a real atom.
e. Take the red “laser 1” card from your hand and put it on the atom board. Move any one electron down one level. Explain what this sequence of actions represents in a real atom.
C The photons and lasers gameThere are no questions to answer in part 3.
9B
2
Name: ______________________________________________ Date: __________
D Thinking about what you learned a. What does the term “excited state” mean with respect to energy and atoms.
b. What physical principle prevents two electrons from moving into the same state?
c. In order of increasing energy, arrange the following colors of light: blue, red, green, yellow.
d. Could an atom emit one photon of blue light after absorbing only one photon of red light? Explain why or why not.
e. Suppose a real atom had energy levels just like the game. Could this atom make blue-green light with an energy in between blue and green? Explain what colors this atom could make.
Take the spectrometer and look at the light from a fluorescent lamp. It looks white but you will see lines of certain colors. The lines are proof that electrons in atoms really do have energy levels.

1
10A
Name: ______________________________________________ Date: __________
Energy and Efficiency
A Kinetic energy exchange
B Thinking about what you observed a. Describe the energy flows that occur between the car heading toward the rubber band and the car
leaving the rubber band.
b. If the transformation of energy were perfect (100% efficiency) what would you expect the speed of the car to be before and after the collision with the rubber band?
Table 1: Kinetic energy data
Mass of the car (kg)
Time before collision
(sec)
Speed before collision(m/sec)
Time after collision
(sec)
Speed after collision(m/sec)
10A
2
Name: ______________________________________________ Date: __________
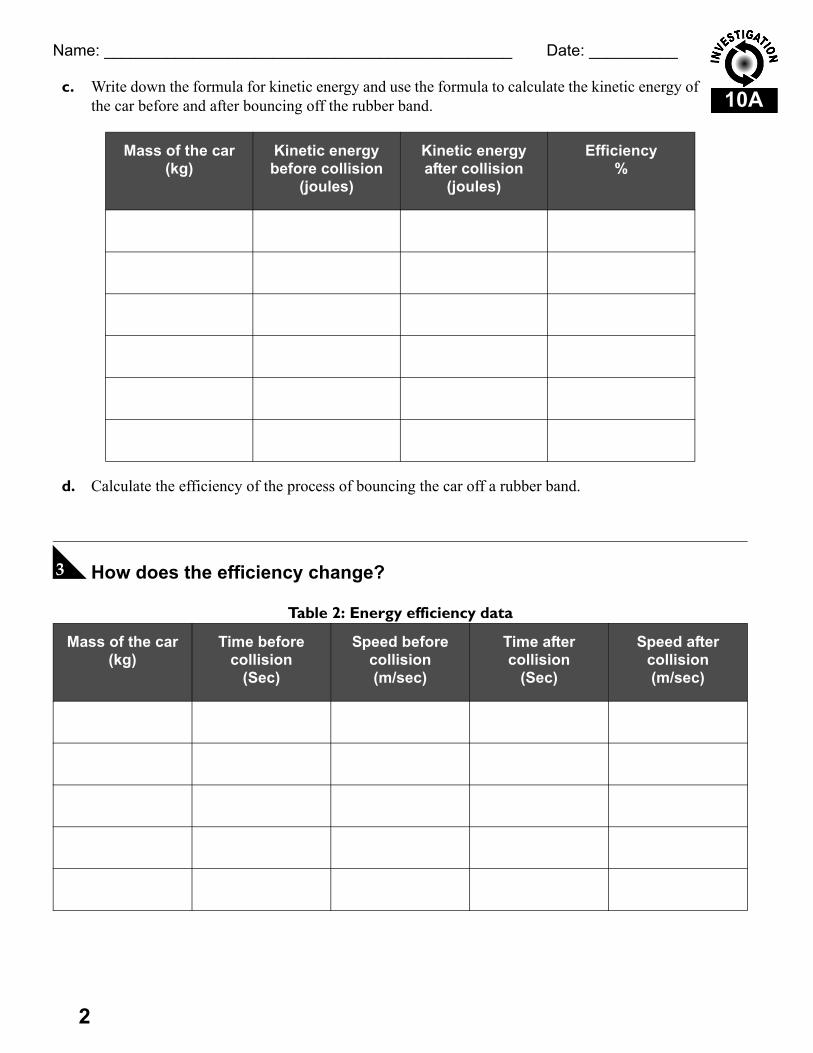
c. Write down the formula for kinetic energy and use the formula to calculate the kinetic energy of the car before and after bouncing off the rubber band.
d. Calculate the efficiency of the process of bouncing the car off a rubber band.
C How does the efficiency change?.
Mass of the car (kg)
Kinetic energy before collision
(joules)
Kinetic energy after collision
(joules)
Efficiency%
Table 2: Energy efficiency data
Mass of the car (kg)
Time before collision
(Sec)
Speed before collision(m/sec)
Time after collision
(Sec)
Speed after collision(m/sec)

3
10A
Name: ______________________________________________ Date: __________
D Thinking about what you observed a. Calculate the efficiency of the rubber band for the different masses and speeds you tested.
b. Plot a graph showing the efficiency on the vertical (y) axis and the speed on the horizontal (x) axis. How does the efficiency change with the speed of the car?
10A
4
Name: ______________________________________________ Date: __________
c. Try changing the tension in the rubber band. Does this effect the efficiency?
E How long does it take for the energy to be gone?There are no questions to answer in part 5.
1
10B
Name: ______________________________________________ Date: __________
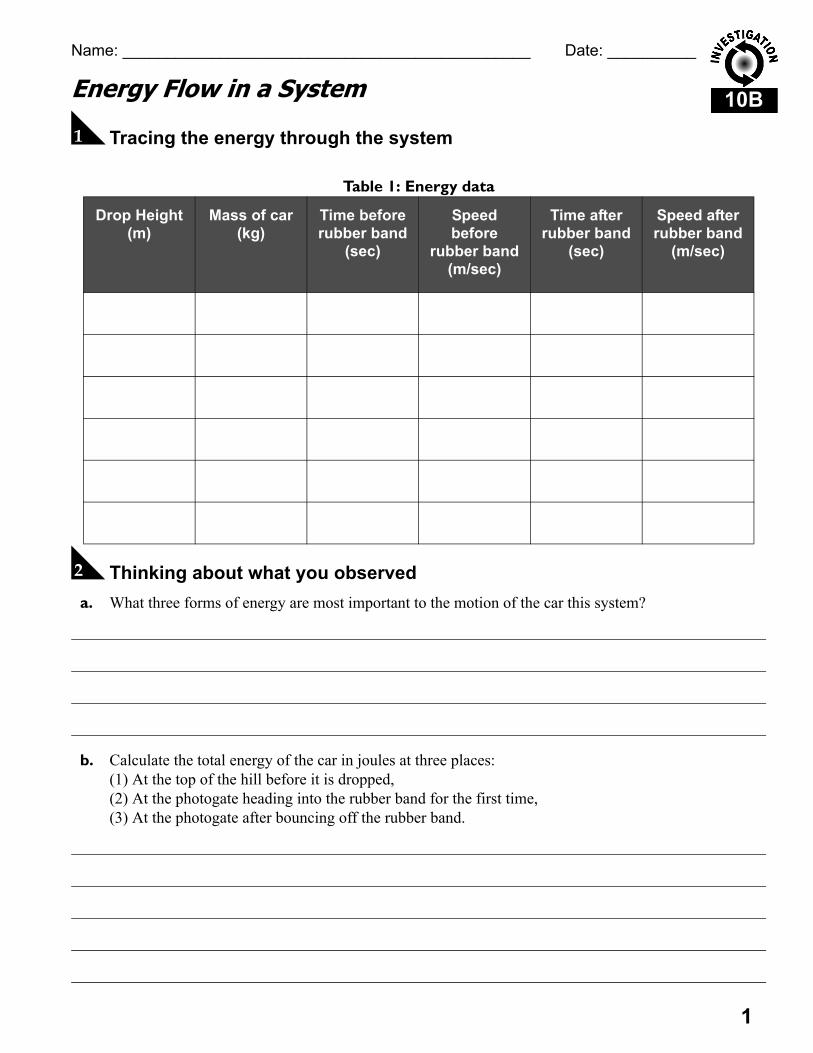
Energy Flow in a System
A Tracing the energy through the system
B Thinking about what you observed a. What three forms of energy are most important to the motion of the car this system?
b. Calculate the total energy of the car in joules at three places:(1) At the top of the hill before it is dropped,(2) At the photogate heading into the rubber band for the first time,(3) At the photogate after bouncing off the rubber band.
Table 1: Energy data
Drop Height(m)
Mass of car (kg)
Time before rubber band
(sec)
Speed before
rubber band(m/sec)
Time after rubber band
(sec)
Speed after rubber band
(m/sec)

10B
2
Name: ______________________________________________ Date: __________
c. Describe the three most important energy transformations that occur during the motion (other than friction).
d. Draw an energy flow diagram showing how the energy is appears in each of the three main transformations. Label any energy that is lost as “friction.”
e. What percentage of its initial energy does the car have after passing through the photogate for the second time? Assume the car has “lost” any energy spent overcoming friction.
f. Where does the energy “lost” to friction go? Is the energy really destroyed?

3
10B
Name: ______________________________________________ Date: __________
C Improving the overall performance a. Suggest a modification you can make to the system that would leave the car with a higher
percentage of energy after the second pass through the photogate.
b. Explain why you believe your modification will result in higher energy efficiency.
c. Write down a few sentences giving a procedure to test your modification.
D Testing your idea a. Design an experiment that will test your idea for improving overall energy efficiency. Write down a
procedure for doing the experiment. Write down what data you expect to take and how the data will allow you to evaluate your idea.
b. Set up and do the experiment you designed.
10B
4
Name: ______________________________________________ Date: __________
c. Analyze the results from your experiment. Compare the percentage of energy the car has after the second pass through the photogate to what it was in the earlier experiments. Your answer must use data from your experiment.
d. Give at least one reason why the efficiency is higher, lower, or about the same compared to what it was.
1
11A
Name: ______________________________________________ Date: __________
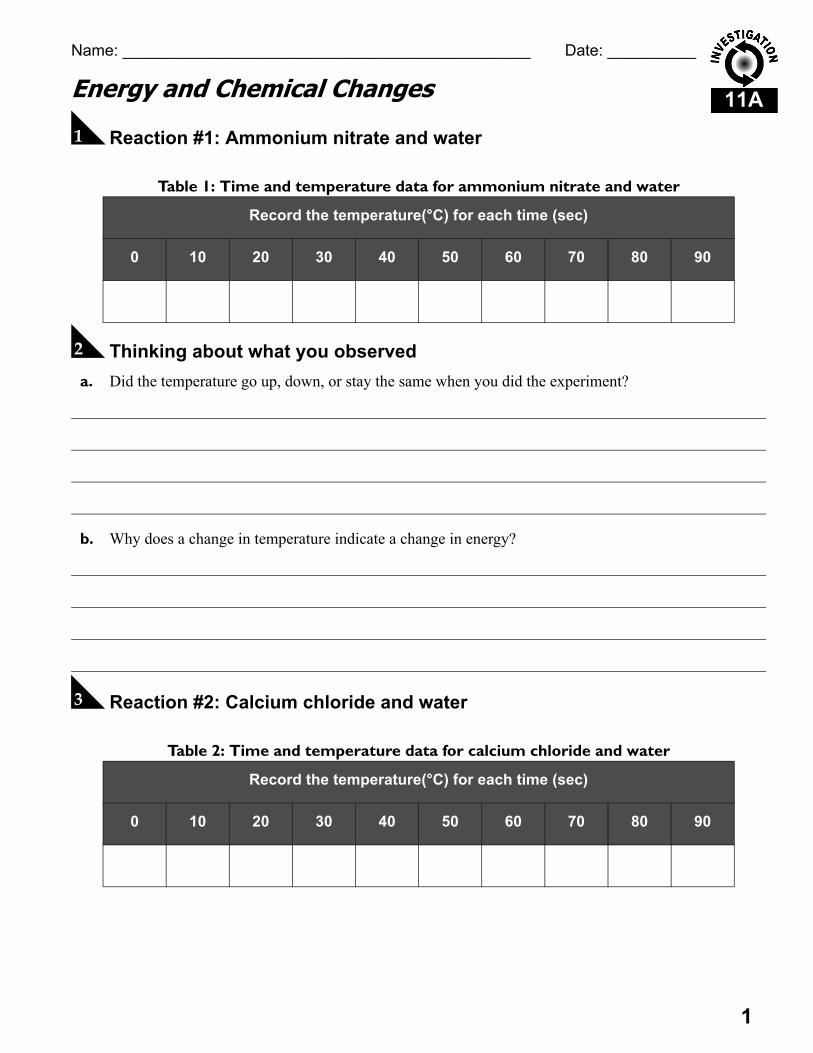
Energy and Chemical Changes
A Reaction #1: Ammonium nitrate and water
B Thinking about what you observed a. Did the temperature go up, down, or stay the same when you did the experiment?
b. Why does a change in temperature indicate a change in energy?
C Reaction #2: Calcium chloride and water
Table 1: Time and temperature data for ammonium nitrate and water
Record the temperature(°C) for each time (sec)
0 10 20 30 40 50 60 70 80 90
Table 2: Time and temperature data for calcium chloride and water
Record the temperature(°C) for each time (sec)
0 10 20 30 40 50 60 70 80 90
11A
2
Name: ______________________________________________ Date: __________
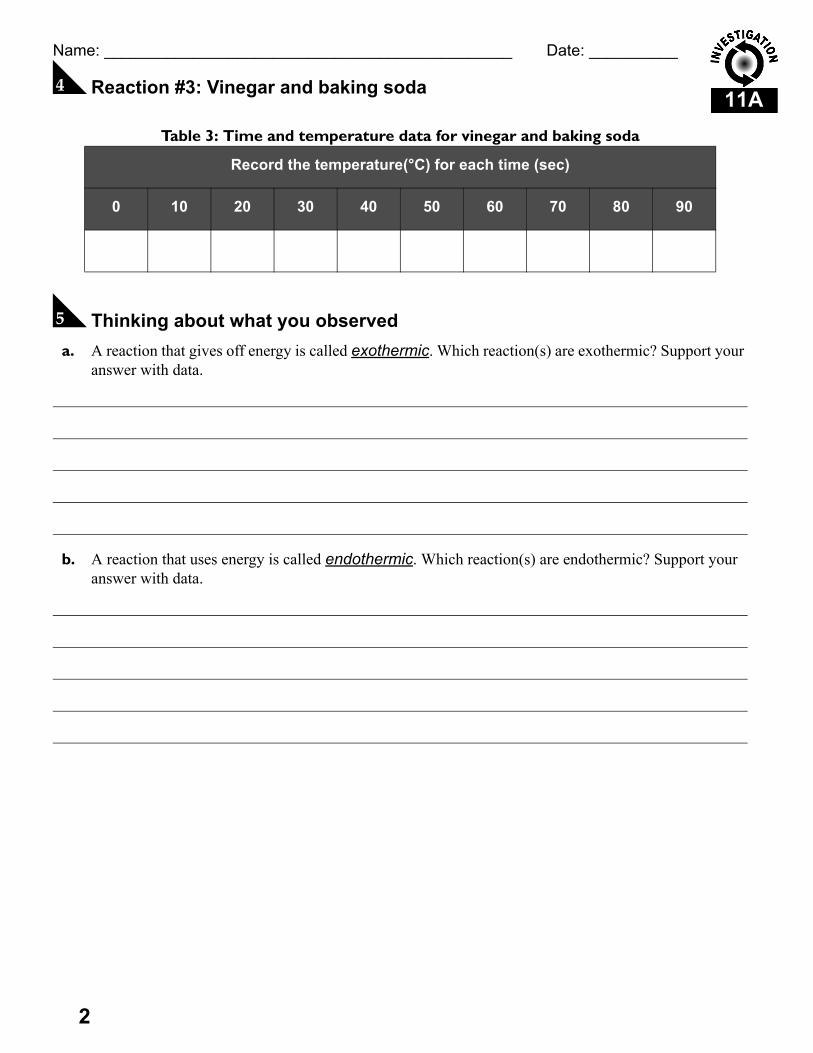
D Reaction #3: Vinegar and baking soda
E Thinking about what you observed a. A reaction that gives off energy is called exothermic. Which reaction(s) are exothermic? Support your
answer with data.
b. A reaction that uses energy is called endothermic. Which reaction(s) are endothermic? Support your answer with data.
Table 3: Time and temperature data for vinegar and baking soda
Record the temperature(°C) for each time (sec)
0 10 20 30 40 50 60 70 80 90
3
11A
Name: ______________________________________________ Date: __________
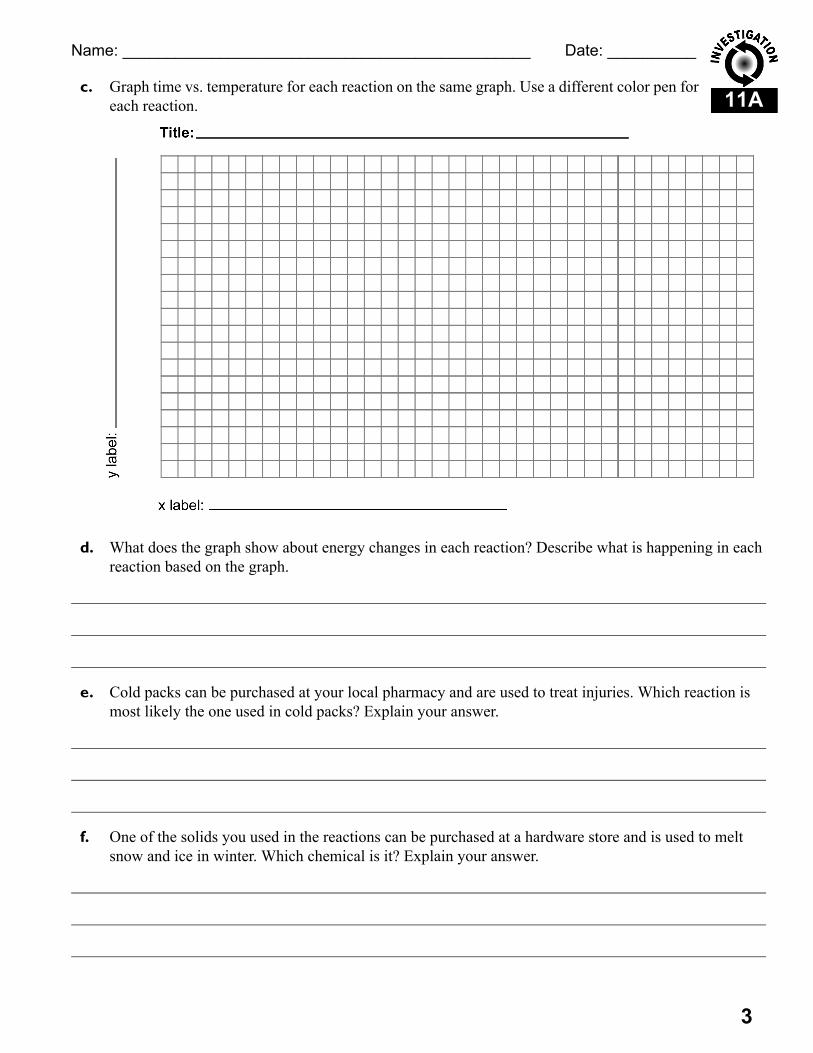
c. Graph time vs. temperature for each reaction on the same graph. Use a different color pen for each reaction.
d. What does the graph show about energy changes in each reaction? Describe what is happening in each reaction based on the graph.
e. Cold packs can be purchased at your local pharmacy and are used to treat injuries. Which reaction is most likely the one used in cold packs? Explain your answer.
f. One of the solids you used in the reactions can be purchased at a hardware store and is used to melt snow and ice in winter. Which chemical is it? Explain your answer.
1
11B
Name: ______________________________________________ Date: __________
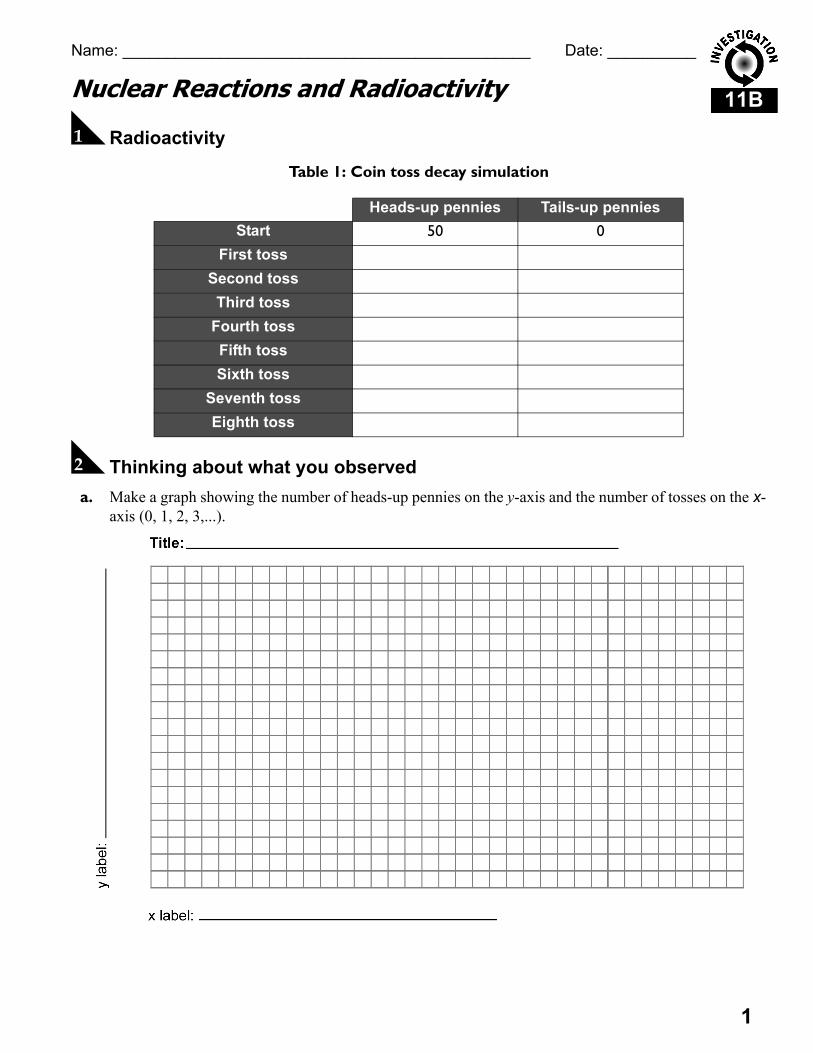
Nuclear Reactions and Radioactivity
A Radioactivity
Table 1: Coin toss decay simulation
B Thinking about what you observed a. Make a graph showing the number of heads-up pennies on the y-axis and the number of tosses on the x-
axis (0, 1, 2, 3,...).
Heads Heads-up pennies Tails-up penniesStart 50 0
First tossSecond tossThird toss
Fourth tossFifth tossSixth toss
Seventh tossEighth toss

11B
2
Name: ______________________________________________ Date: __________
b. On average, what percentage of pennies are lost on each toss? “Lost” means they came up tails and were removed.
c. How does the concept of half-life relate to the experiment with pennies? What does one half-life correspond to?
C Build a radioactive atomThere are no questions to answer in part 3.
D Thinking about what you did a. Research what happens to C14 when it decays. What element does it become? What particles are given
off?
b. What is the average time it takes for 50% of the C14 atoms in a sample to decay?
c. Suppose you have 50 atoms of C14 and you watch them for a very long time. How do the results of your penny-flipping experiment describe the number of C14 atoms?
3
11B
Name: ______________________________________________ Date: __________
d. We actually find C14 in the environment. Research where it comes from.
e. Describe two other types of radioactivity and give an example of each.
f. (Challenge) You cannot predict when any one atom will decay, just as you cannot predict whether a penny will come up heads or tails. Why can you predict that 50% of the C14 atoms will decay every half-life?
1
12A
Name: ______________________________________________ Date: __________
Frames of Reference
A Demonstrating two frames of referenceThere are no questions to answer in part 1.
B Thinking about what you observed a. Imagine the person pushing the table was in a box, able only to see the car and track and nothing
outside the box. What motion of the car do they see relative to themselves?
b. What motion of the car do the outside observers see relative to themselves?
c. There are two important frames of reference in this demonstration. What are they?
d. One frame of reference is in motion relative to the other. What is this motion?
12A
2
Name: ______________________________________________ Date: __________
e. Suppose the table was rolling at exactly 1 m/sec relative to the room and the car was rolling in the same direction at 1 m/sec relative to the track. What is the speed of the car relative to the room? How do you arrive at this answer?
C A thought experiment a. When you are on the moving train, do you observe the lightning hit the front of the train first, the back
first, or does light from both lightning strikes reach you at the exact same time?
b. (Discussion question) Explain the reasoning behind your answer of question (a) above.
1
12B
Name: ______________________________________________ Date: __________
Relativity
A An imaginary experiment with light - Special relativityThere are no questions to answer in part 1.
B Thinking about what you imaginedThe following are all questions for class discussion. They are challenging!
a. Describe the two reference frames that are important. Who is in each one?
b. What is the relative motion between the two reference frames?
c. Does the person on the ground see the light travel a distance that is longer, shorter, or the same compared to the distance seen by the person watching the light on the space ship?
d. Prior to Einstein, speed was always calculated as the distance traveled divided by the time taken. Thinking this way, does the person on the ground see the light in the clock move faster, slower, or at the same speed compared to what the person in the space ship sees.
12B
2
Name: ______________________________________________ Date: __________
e. The theory of relativity requires that the speed of light be the same for all observers, regardless of relative motion. If the speed is the same, but the distance is different, what other variable must also be different in the two reference frames?
f. Do clocks on board the space ship run slower, faster, or at the same rate compared to clocks on the ground?
C General relativity a. Suppose “straight line” is defined as “the path of motion an object follows when the net force acting on
it is zero”. Does this definition describe the same thing as your previous mathematical definition of a “straight line”?
b. Suppose you stretch a rubber sheet and place a heavy glass ball in the center. The glass ball depresses the sheet a few centimeters. A plastic ball is rolled in a straight line from the edge of the sheet as shown in the diagram. Sketch the path of the plastic ball as it passes by the glass ball.
c. Suppose the rubber sheet was completely transparent, and you could not see the glass ball either. Propose an explanation that would explain the observed path of the plastic ball using the idea of force.
D Einstein’s two theoriesThere are no questions to answer in part 4.
1
13A
Name: ______________________________________________ Date: __________
Electricity
A Building a circuitThere are no questions to answer in part 1.
B Thinking about what you observed a. How can you tell electric current is flowing in the circuit? Can you see the current flow?
b. Current flows from positive to negative. Trace the flow of current around the circuit with your finger.
c. How does the switch cause the current to stop flowing?
d. Why does the bulb go out when you open the switch?
e. Draw an energy flow diagram of the circuit. Label the forms of energy that appear.
13A
2
Name: ______________________________________________ Date: __________
C Conductors and insulatorsThere are no questions to answer in part 3.
D Thinking about what you observed a. Make a table listing the materials as either conductors or insulators.
b. What characteristics are shared by the conductors you found?
c. What characteristics are shared by the insulators you found?
E Measuring the voltage of a batteryThere are no questions to answer in part 5.
Conductors Insulators

3
13A
Name: ______________________________________________ Date: __________
F Measuring current a. How much current is flowing in the circuit when the bulb is making light?
G Circuit diagrams a. Using these symbols, draw a picture of the circuit you built with one battery, switch, and light bulb.
H A circuit with a dimmer switch.
Table 1: Pot settings and voltage across bulb
Pot dial position Voltage across bulb (V) Observed light output of bulb

13A
4
Name: ______________________________________________ Date: __________
I Thinking about what you observed a. As you changed the settings of the pot, what happened to the voltage across the bulb?
b. Did you observe a relationship between the voltage across the bulb and the light output?
c. Propose a relationship between power and voltage that would explain the light output of the bulb.
1
13B
Name: ______________________________________________ Date: __________
Resistance and Ohm’s Law
A Measuring resistance
B The meaning of resistance a. What relationship did you notice between the resistance and whether a material was a conductor or
insulator?
b. Describe the ability of an object to conduct electrical current in terms of its resistance.
c. Write down Ohm’s law and describe what each of the three symbols stands for (including units).
Table 1: Resistance Measurements
Object description Conductor or Insulator Resistance (Ω)
13B
2
Name: ______________________________________________ Date: __________
d. Two simple circuits are built with two different electrical devices. Each contains the same size battery. One device has a resistance of 100 ohms (100 Ω) and the other has a resistance of 1,000 ohms (1,000 Ω or 1 kΩ). Which circuit has more current? Use the concept of resistance to explain why.
C Mystery resistors
a. Use your knowledge of Ohm’s law to determine which resistor is which. The resistance you calculate from Ohm’s law will not come out exactly to 5, 10, or 20 because the meter itself has a small resistance.
D Resistance and potentiometers (pots)
Table 2: Resistor Currents
Resistor color Battery voltage (V) Current (amps)
Table 3: Pot settings and resistance
Pot dial position Resistance (Ω)
3
13B
Name: ______________________________________________ Date: __________
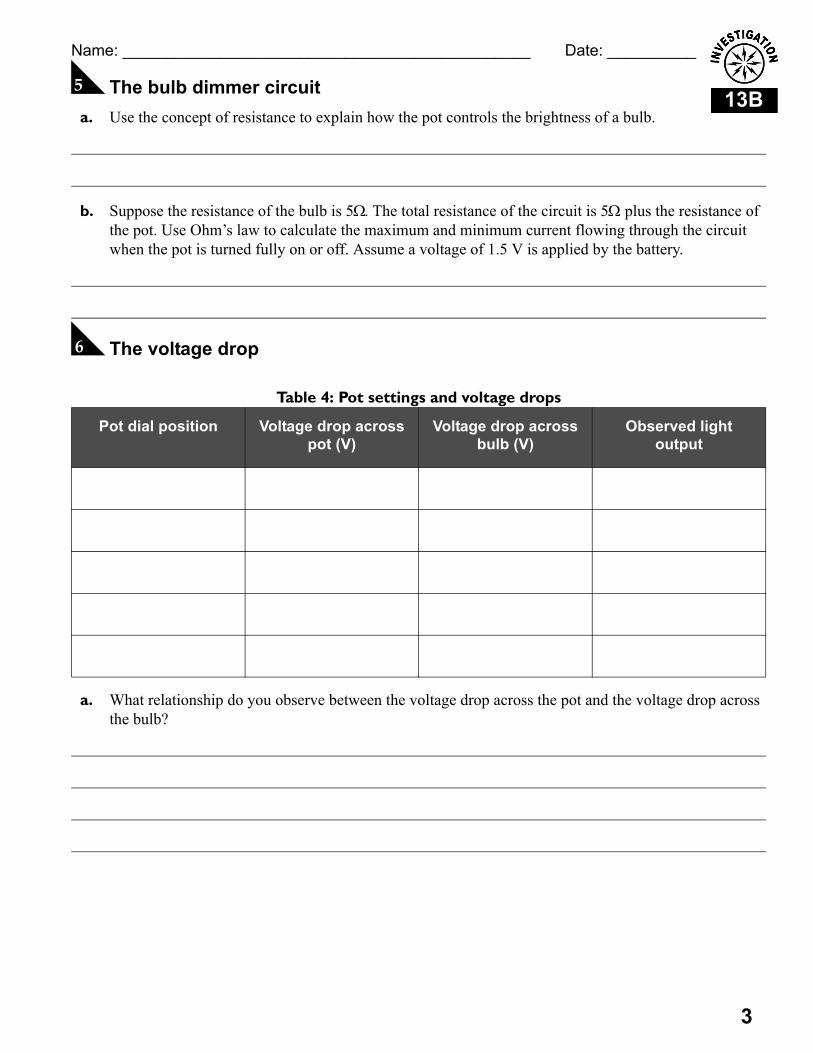
E The bulb dimmer circuit a. Use the concept of resistance to explain how the pot controls the brightness of a bulb.
b. Suppose the resistance of the bulb is 5Ω. The total resistance of the circuit is 5Ω plus the resistance of the pot. Use Ohm’s law to calculate the maximum and minimum current flowing through the circuit when the pot is turned fully on or off. Assume a voltage of 1.5 V is applied by the battery.
F The voltage drop
a. What relationship do you observe between the voltage drop across the pot and the voltage drop across the bulb?
Table 4: Pot settings and voltage drops
Pot dial position Voltage drop across pot (V)
Voltage drop across bulb (V)
Observed light output

13B
4
Name: ______________________________________________ Date: __________
b. What does the voltage drop tell you about the electrical energy carried by the current?
c. What relationship do you observe between the measured voltage drops and the battery voltage?

1
14A
Name: ______________________________________________ Date: __________
Electric Circuits
A Series circuits.
B Thinking about what you measured a. What relationships do you see among the voltage measurements in Table 1?
b. What do the voltage measurements tell you about the flow of energy in the circuit?
C The current in series circuit
D Thinking about what you observed a. What happens to the current in the circuit as the number of bulbs is reduced? Explain why this occurs
using Ohm’s law and the concept of resistance.
b. What happens to the other two bulbs when one bulb is removed from the three-bulb circuit? Try it and explain why the circuit behaves as it does.
Table 1: Voltage measurements (volts)
Between A and B Between B and C Between C and D Between A and D
Table 2: Current Measurements (amps)
Three bulbs Two bulbs One bulb
14A
2
Name: ______________________________________________ Date: __________
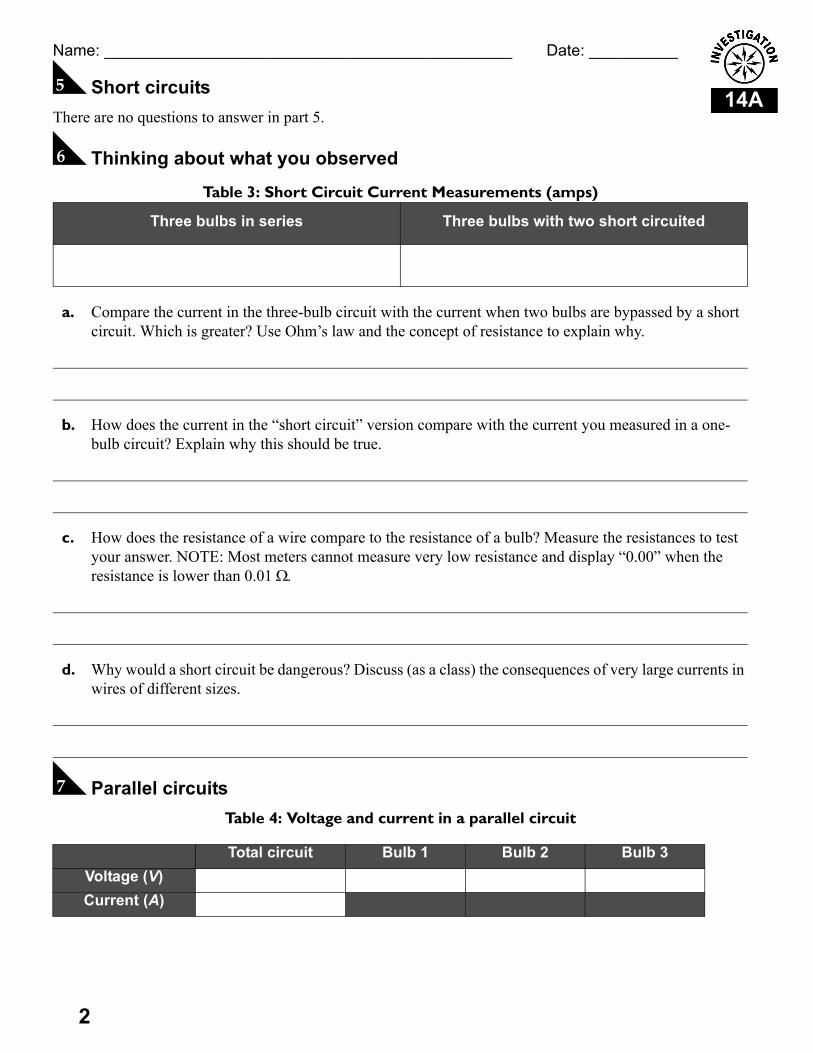
E Short circuitsThere are no questions to answer in part 5.
F Thinking about what you observed
a. Compare the current in the three-bulb circuit with the current when two bulbs are bypassed by a short circuit. Which is greater? Use Ohm’s law and the concept of resistance to explain why.
b. How does the current in the “short circuit” version compare with the current you measured in a one-bulb circuit? Explain why this should be true.
c. How does the resistance of a wire compare to the resistance of a bulb? Measure the resistances to test your answer. NOTE: Most meters cannot measure very low resistance and display “0.00” when the resistance is lower than 0.01 Ω.
d. Why would a short circuit be dangerous? Discuss (as a class) the consequences of very large currents in wires of different sizes.
G Parallel circuitsTable 4: Voltage and current in a parallel circuit
Table 3: Short Circuit Current Measurements (amps)
Three bulbs in series Three bulbs with two short circuited
Total circuit Bulb 1 Bulb 2 Bulb 3Voltage (V) Current (A)
3
14A
Name: ______________________________________________ Date: __________
H Thinking about what you observed a. Compare the brightness of the bulbs in the parallel circuit with the brightness in the series
circuit.
b. Compare the total current in the single-bulb circuit, the three-bulb series circuit, and the three-bulb parallel circuit. Propose a relationship between the currents that agrees with the brightness of the bulbs.
c. Remove one bulb from the circuit by unscrewing it from its socket. Observe what happens to the remaining bulbs.
d. Did the other two bulbs continue to light when the third bulb was removed from the parallel circuit? Explain why. How does this differ from what happened with the series circuit?
e. Do you think the electrical outlets in your home are connected in a series or parallel circuit? Give two reasons why one type of circuit has an advantage over the other for connecting outlets.

1
14B
Name: ______________________________________________ Date: __________
Electrical Energy and Power
A Energy and power in an electrical system
Table 1: Power used by a bulb
B Thinking about what you observed a. How did the power used by the bulb compare at the two different voltages?
b. Was the bulb brighter, dimmer, or about the same at 3 V compared to 1.5 V? Explain any difference you observed using the concept of power.
C Energy and power from a batteryThere are no questions to answer in part 3.
D Thinking about what you observed a. How was energy flowing when the capacitor was “charging up”? What was the source of the energy
and where did it go?
b. How was energy flowing when the bulb was connected and the battery was removed? What was the source of the energy and where did it go?
Voltage (V) Current (A) Power (W)
14B
2
Name: ______________________________________________ Date: __________
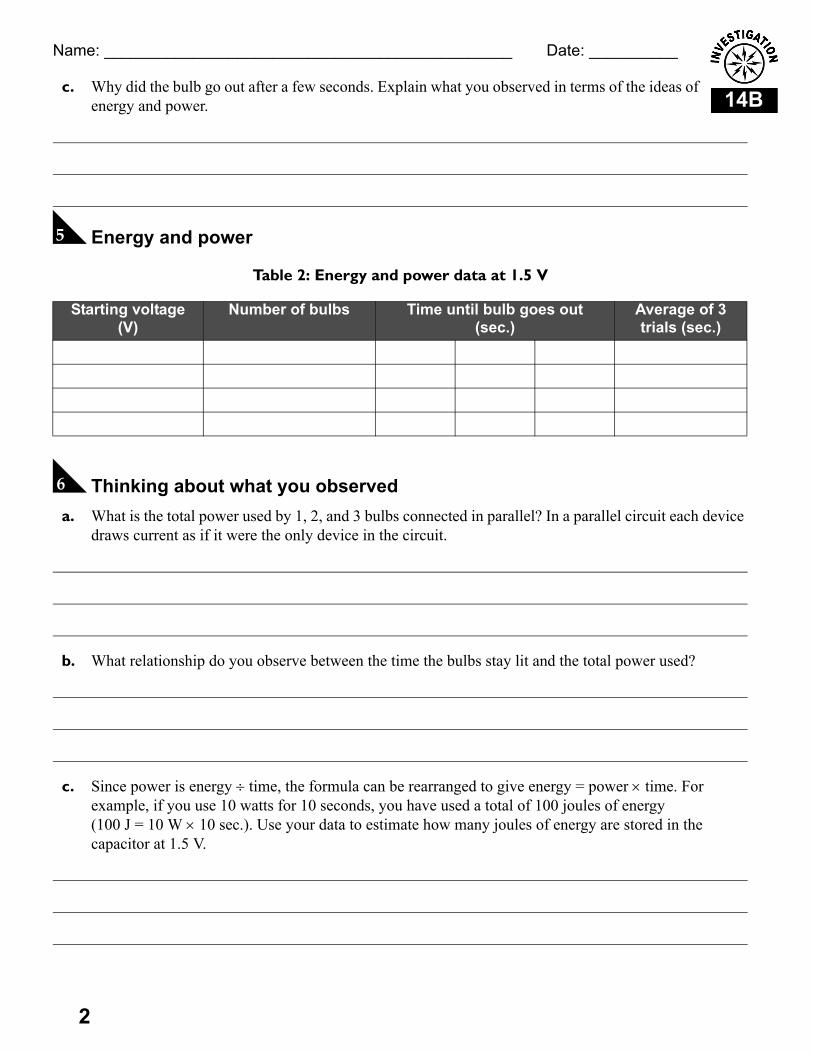
c. Why did the bulb go out after a few seconds. Explain what you observed in terms of the ideas of energy and power.
E Energy and power
Table 2: Energy and power data at 1.5 V
F Thinking about what you observed a. What is the total power used by 1, 2, and 3 bulbs connected in parallel? In a parallel circuit each device
draws current as if it were the only device in the circuit.
b. What relationship do you observe between the time the bulbs stay lit and the total power used?
c. Since power is energy ÷ time, the formula can be rearranged to give energy = power × time. For example, if you use 10 watts for 10 seconds, you have used a total of 100 joules of energy (100 J = 10 W × 10 sec.). Use your data to estimate how many joules of energy are stored in the capacitor at 1.5 V.
Starting voltage (V)
Number of bulbs Time until bulb goes out (sec.)
Average of 3 trials (sec.)
1
15A
Name: ______________________________________________ Date: __________
Electric Charge
A Observing electric chargeThere are no questions to answer in part 1.
B Thinking about what you observed a. Describe what happens to the aluminum foil leaf as you move the balloon closer.
b. Explain the reaction of the leaf to the rubbed balloon using the concepts of positive and negative charge.
c. Explain why touching the balloon to a metal object changed its effect on the leaf.
C Making an electroscopeThere are no questions to answer in part 3.
D Thinking about what you observed a. Describe what happens to the aluminum foil leaves as you move the rubbed balloon closer.
15A
2
Name: ______________________________________________ Date: __________
b. Give a reason why the leaves stay apart after the balloon is removed.
c. Explain what happens when you touch the wire with your hand or a metal object.
d. “Charge” the electroscope by touching it with a balloon that has been rubbed against your hair. Then touch the rubbed side of the balloon to something metal and bring it close to the electroscope again. Describe what happens.
e. Why does the plastic rod cause the leaves to move only after it has been rubbed with the fleece?
f. What causes the leaves of the electroscope to move apart?
1
15B
Name: ______________________________________________ Date: __________
The Flow of Electric Charge
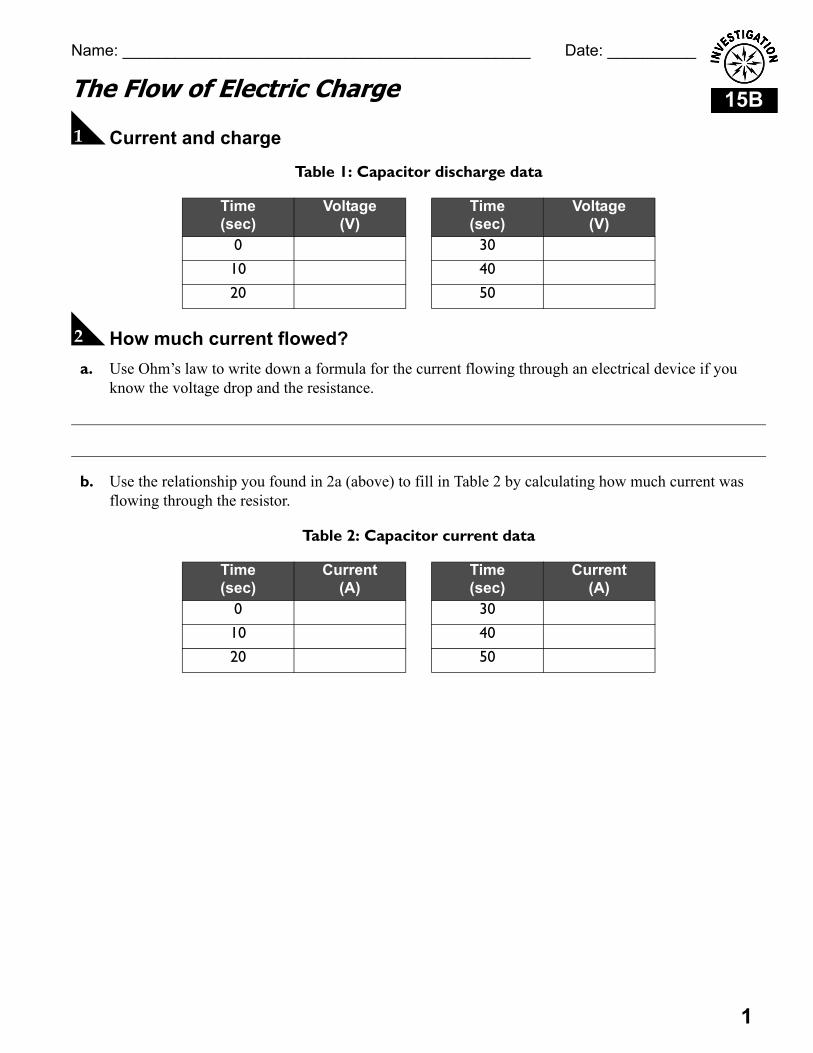
A Current and charge
Table 1: Capacitor discharge data
B How much current flowed? a. Use Ohm’s law to write down a formula for the current flowing through an electrical device if you
know the voltage drop and the resistance.
b. Use the relationship you found in 2a (above) to fill in Table 2 by calculating how much current was flowing through the resistor.
Table 2: Capacitor current data
Time (sec)
Voltage(V)
Time (sec)
Voltage(V)
0 30 10 40 20 50
Time (sec)
Current(A)
Time (sec)
Current(A)
0 30 10 40 20 50
15B
2
Name: ______________________________________________ Date: __________
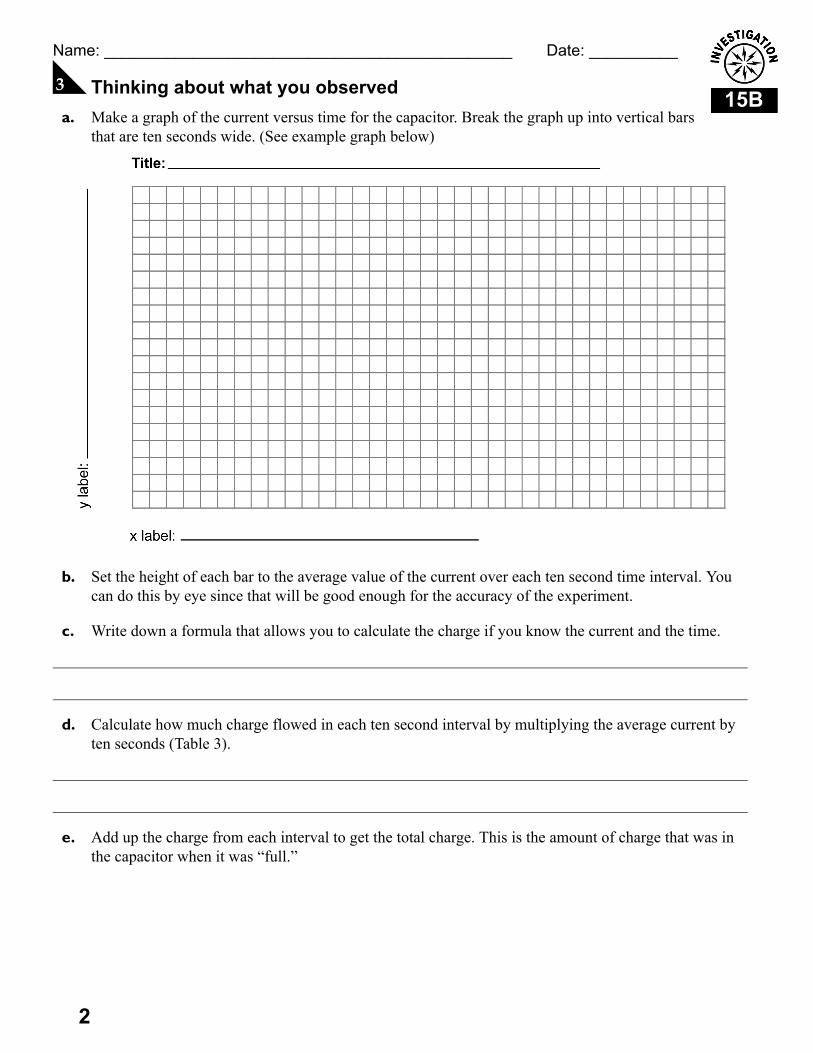
C Thinking about what you observed a. Make a graph of the current versus time for the capacitor. Break the graph up into vertical bars
that are ten seconds wide. (See example graph below)
b. Set the height of each bar to the average value of the current over each ten second time interval. You can do this by eye since that will be good enough for the accuracy of the experiment.
c. Write down a formula that allows you to calculate the charge if you know the current and the time.
d. Calculate how much charge flowed in each ten second interval by multiplying the average current by ten seconds (Table 3).
e. Add up the charge from each interval to get the total charge. This is the amount of charge that was in the capacitor when it was “full.”
3
15B
Name: ______________________________________________ Date: __________
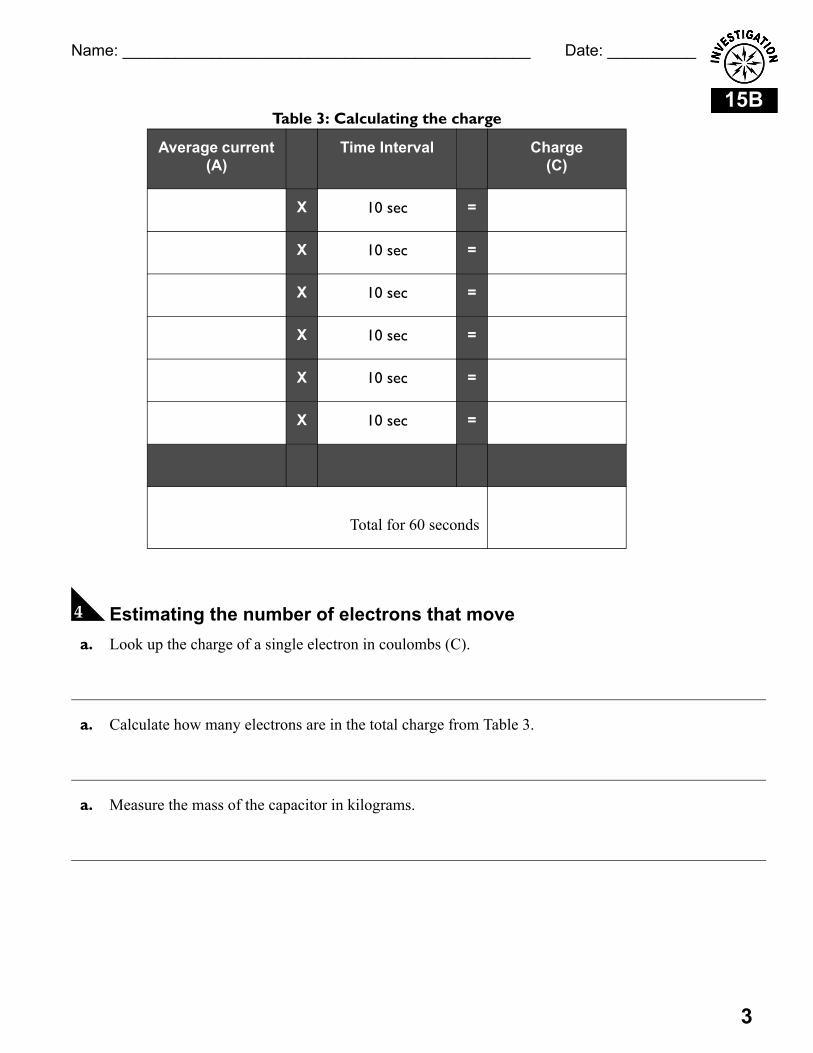
D Estimating the number of electrons that move a. Look up the charge of a single electron in coulombs (C).
a. Calculate how many electrons are in the total charge from Table 3.
a. Measure the mass of the capacitor in kilograms.
Table 3: Calculating the charge
Average current (A)
Time Interval Charge(C)
X 10 sec =
X 10 sec =
X 10 sec =
X 10 sec =
X 10 sec =
X 10 sec =
Total for 60 seconds
15B
4
Name: ______________________________________________ Date: __________
a. Estimate how many electrons are in the capacitor. You can do this calculation in the following steps.(1) Write down the mass of a proton (1 amu) in kg.(2) Calculate how many protons there are by assuming 1/2 the mass of the capacitor is protons.(3) The number of electrons is the same as the number of protons.
b. Calculate the number of electrons that move by dividing the result of step b by the number you found in step d.
E Thinking about what you observed a. Was the number of electrons that moved larger, smaller, or about the same as the number of electrons in
the capacitor? Was the difference very large or very small?
b. Why were we able to estimate the number of protons as 1/2 the total mass even though we did not know what elements the capacitor was made of?
c. Is the estimate of the number of electrons larger or smaller than the true number? Do you think the difference is larger or smaller than 25%? Give a reason for your answer.
1
16A
Name: ______________________________________________ Date: __________
Magnetism
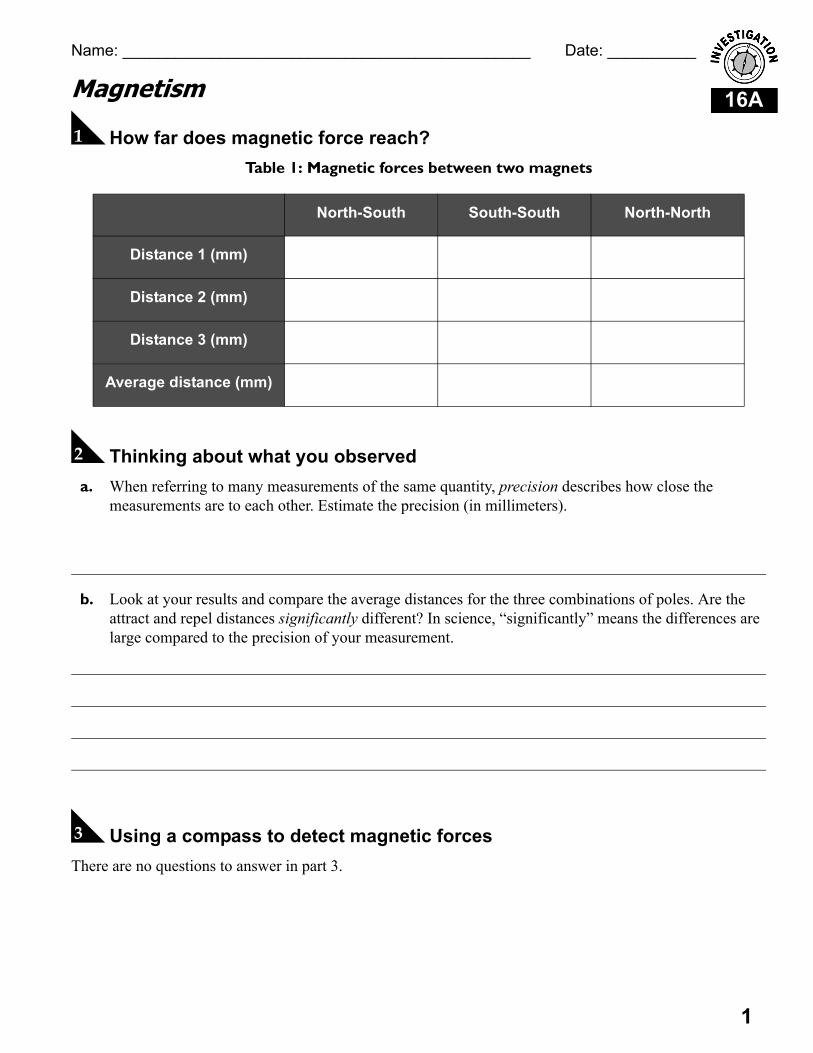
A How far does magnetic force reach?Table 1: Magnetic forces between two magnets
B Thinking about what you observed a. When referring to many measurements of the same quantity, precision describes how close the
measurements are to each other. Estimate the precision (in millimeters).
b. Look at your results and compare the average distances for the three combinations of poles. Are the attract and repel distances significantly different? In science, “significantly” means the differences are large compared to the precision of your measurement.
C Using a compass to detect magnetic forcesThere are no questions to answer in part 3.
North-South South-South North-North
Distance 1 (mm)
Distance 2 (mm)
Distance 3 (mm)
Average distance (mm)
16A
2
Name: ______________________________________________ Date: __________
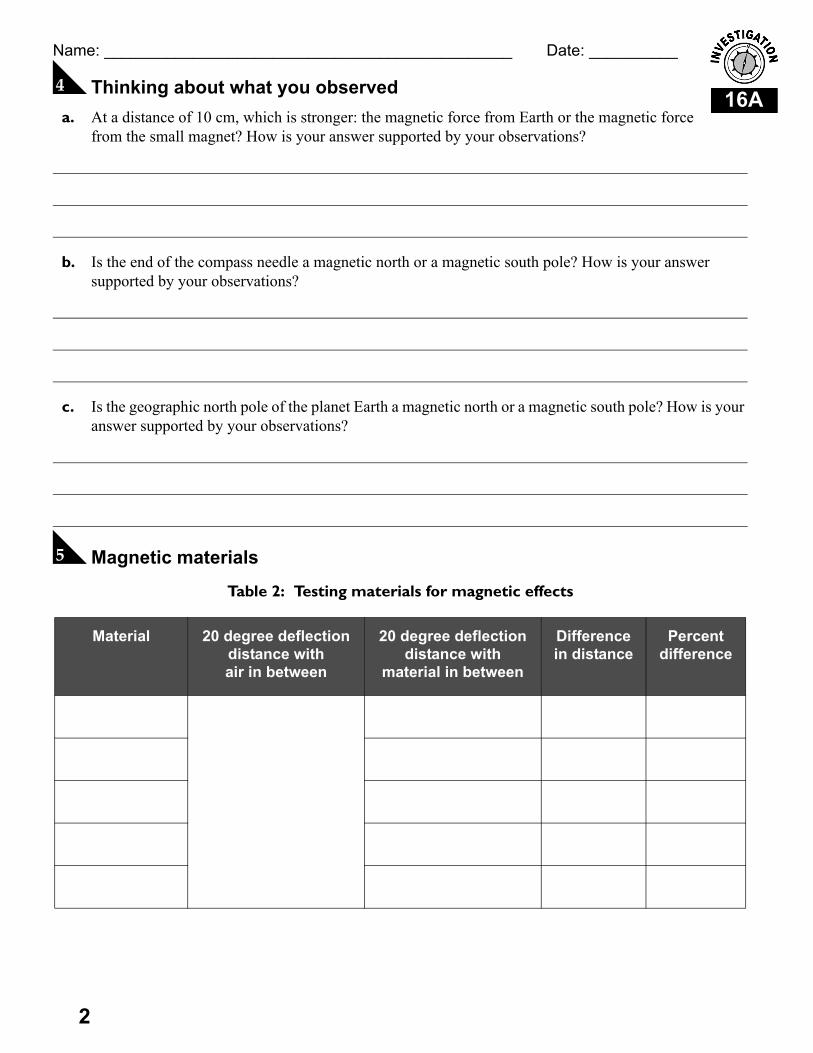
D Thinking about what you observed a. At a distance of 10 cm, which is stronger: the magnetic force from Earth or the magnetic force
from the small magnet? How is your answer supported by your observations?
b. Is the end of the compass needle a magnetic north or a magnetic south pole? How is your answer supported by your observations?
c. Is the geographic north pole of the planet Earth a magnetic north or a magnetic south pole? How is your answer supported by your observations?
E Magnetic materials
Table 2: Testing materials for magnetic effects
Material 20 degree deflection distance with air in between
20 degree deflection distance with
material in between
Difference in distance
Percent difference

3
16A
Name: ______________________________________________ Date: __________
F Thinking about what you observed a. Which materials made almost no change in the magnetic force? Can you list any common
characteristics of these materials?
b. Which materials made a significant change in the magnetic force? Can you list any common characteristics of these materials?

1
16B
Name: ______________________________________________ Date: __________
Electromagnets
A Making an electromagnetThere are no questions to answer in part 1.
B Thinking about what you observed a. Does the compass needle move? What does this tell you about the force created by the electromagnet?
b. What happens when the current in the coil is reversed? Use your observations to support your answer.
c. Try wrapping 30 more turns on the coil. Does the magnetic force get stronger, weaker, or stay about the same? How do your observations support your answer?
C Comparing the electromagnet to a permanent magnetThere are no questions to answer in part 3.
D Magnetic properties of materialsThere are no questions to answer in part 4.
E Thinking about what you observed a. Based on your observations, propose a relationship between the current in the coil and the magnetic
force produced. You may use the meter to measure the current to verify your hypothesis.
b. Which materials made almost no change in the magnetic force from the electromagnet? Can you list any common characteristics of these materials?
16B
2
Name: ______________________________________________ Date: __________
c. Which materials made a significant change in the magnetic force? Can you list any common characteristics of these materials?
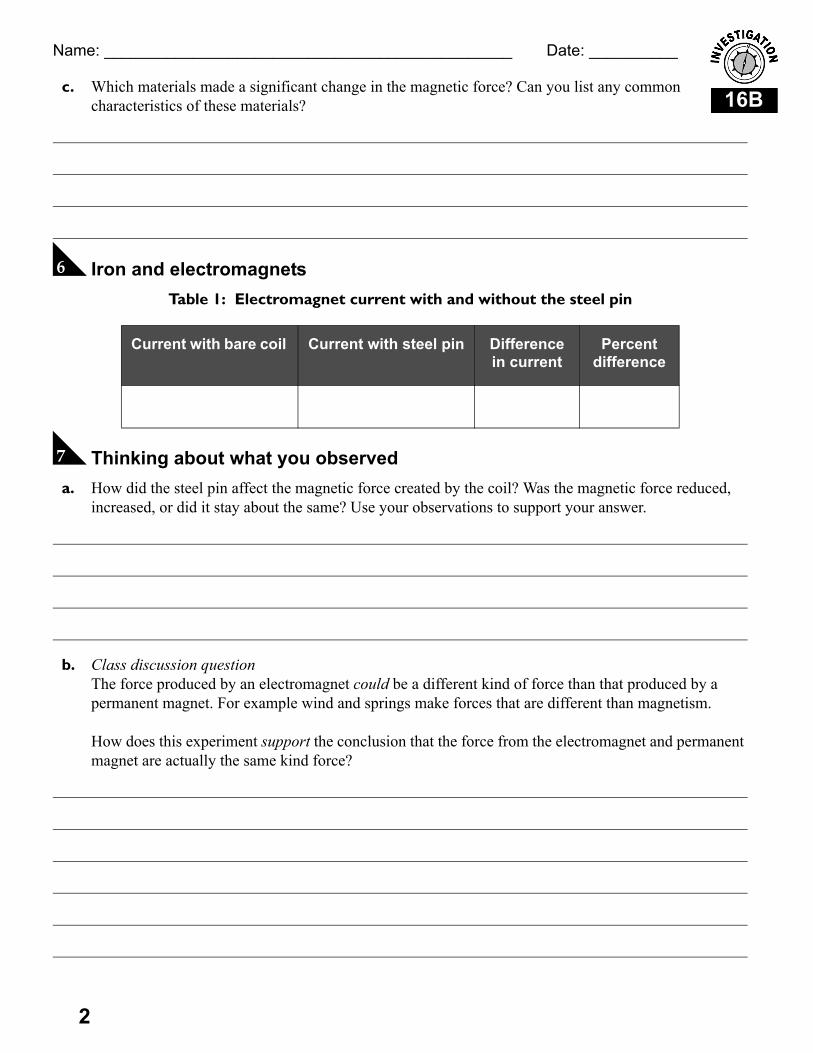
F Iron and electromagnetsTable 1: Electromagnet current with and without the steel pin
G Thinking about what you observed a. How did the steel pin affect the magnetic force created by the coil? Was the magnetic force reduced,
increased, or did it stay about the same? Use your observations to support your answer.
b. Class discussion questionThe force produced by an electromagnet could be a different kind of force than that produced by a permanent magnet. For example wind and springs make forces that are different than magnetism.
How does this experiment support the conclusion that the force from the electromagnet and permanent magnet are actually the same kind force?
Current with bare coil Current with steel pin Difference in current
Percent difference
1
17A
Name: ______________________________________________ Date: __________
Electromagnetic Forces
A Make the baseThere are no questions to answer in part 1.
B Make the coilThere are no questions to answer in part 2.
C Making the motor workThere are no questions to answer in part 3.
D Thinking about what you observed a. Explain the force acting on the coil when there is current flowing. What creates the force?
b. Why was it important to sand only one side of the wire on one end of the coil.
c. See if you can hold a photogate so the spinning coil breaks the light beam. Perform an experiment to measure the speed of your motor.
d. Try adding a second magnet. Does this make the motor go faster, slower, or about the same? What observations did you make that support your answer?
1
17B
Name: ______________________________________________ Date: __________
Electromagnetic Induction
A Making a generatorThere are no questions to answer in part 1.
B Thinking about what you observed a. Explain the difference between AC and DC electricity.
b. Is electricity produced by the magnets at rest or only by motion of the magnets?
c. Does the generator make AC or DC electricity? Support your answer with your observations.
17B
2
Name: ______________________________________________ Date: __________
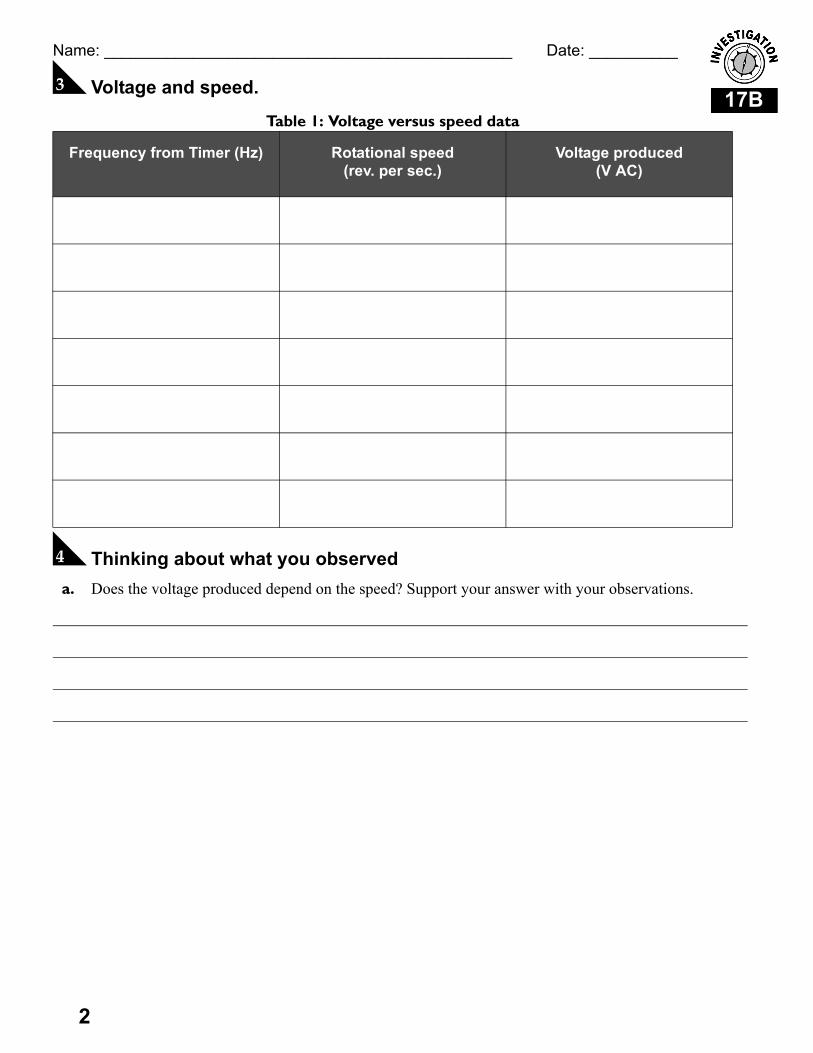
C Voltage and speed.
D Thinking about what you observed a. Does the voltage produced depend on the speed? Support your answer with your observations.
Table 1: Voltage versus speed data
Frequency from Timer (Hz) Rotational speed(rev. per sec.)
Voltage produced(V AC)

3
17B
Name: ______________________________________________ Date: __________
b. Make a graph of voltage versus speed. Is the graph a straight line or a curve?
E Changing the designThere are no questions to answer in part 5.
F Thinking about what you observed a. Which changes you made in part 5 have the largest effect on the voltage produced?
b. Explain why changing one thing made a large difference while changing the other did not. The answer is not obvious so this should be a class discussion question.

17B
4
Name: ______________________________________________ Date: __________
G Building different generators
H Thinking about what you observed a. If the number of magnets is increased from 6 to 12, what change do you expect in the voltage? Assume
the magnets alternate north-south.
b. Suppose you have 6 magnets (alternate north-south) and double the speed. What change do you expect in the voltage?
Table 2: Voltage for different magnet configurations
Magnet configuration (describe) Rotational frequency (Hz)
Voltage produced
(V AC)
5
17B
Name: ______________________________________________ Date: __________
c. Suppose you change from 6 to 12 magnets and also double the speed. What change do you expect in the voltage?
d. Propose a relationship that accounts for the voltage produced at different speeds and magnet configurations. This should be a class discussion question.
e. What change in voltage do you expect when changing from 12 magnets with alternating north-south to 12 magnets all facing the same way? Why?
1
18A
Name: ______________________________________________ Date: __________
The Magnetic Field
A Making a map of a magnetic fieldThere are no questions to answer in part 1.
B Thinking about what you observed a. The arrow of the compass shows you the direction of the force felt
by the ____________ pole of another magnet. (Fill in the blank with the word “north” or “south”)
b. The lines of magnetic field point away from _________ and toward _________ magnetic poles. (Fill in the blanks with the word “north” or “south”)
c. Why do all the arrows far from the magnet point in the same direction?
d. Research and give a one sentence definition of a “field” as the term is used in physics. This may be a class discussion question.
e. Describe two basic kinds of fields and give the difference between them. The magnetic force around a magnet is an example of one and the temperature around a candle flame is an example of the other.
18A
2
Name: ______________________________________________ Date: __________
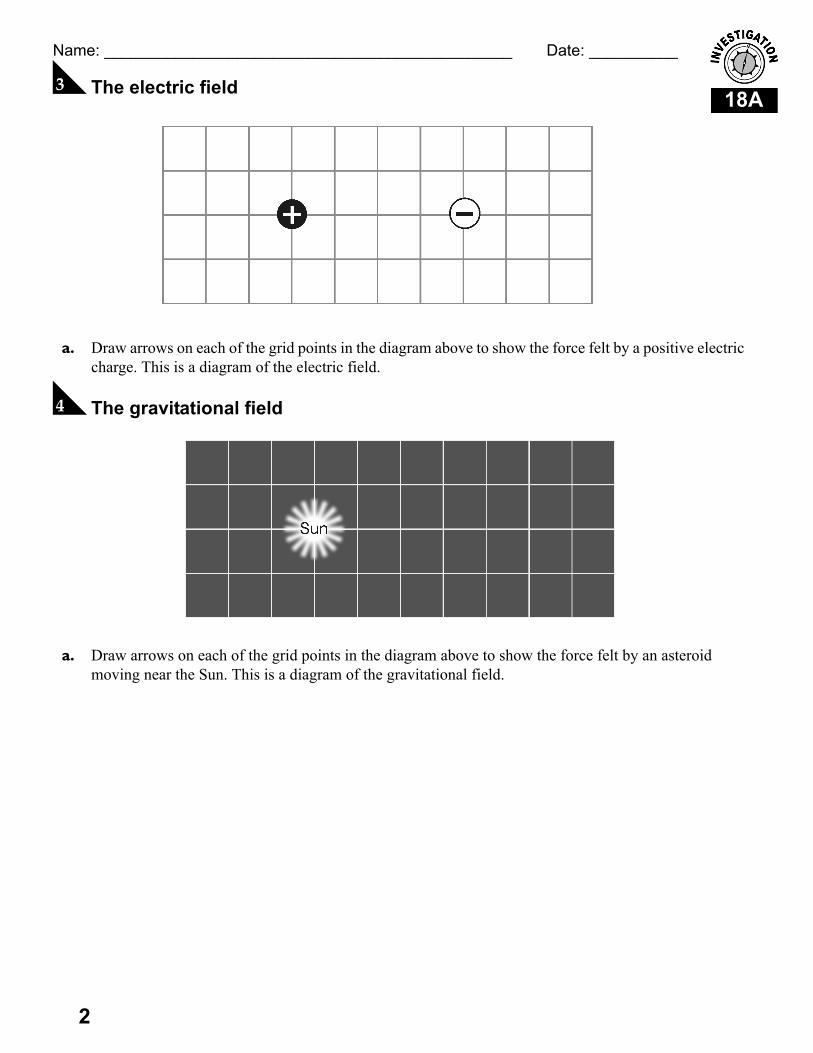
C The electric field
a. Draw arrows on each of the grid points in the diagram above to show the force felt by a positive electric charge. This is a diagram of the electric field.
D The gravitational field
a. Draw arrows on each of the grid points in the diagram above to show the force felt by an asteroid moving near the Sun. This is a diagram of the gravitational field.
1
18B
Name: ______________________________________________ Date: __________
Using Fields
A Making the puzzleThere are no questions to answer in part 1.
B Thinking about what you are going to doThere are no questions to answer in part 2.
C Solving the puzzle
D Thinking about what you observed a. How can you use the map you made to determine the location and orientation of the hidden magnet?
18B
2
Name: ______________________________________________ Date: __________
b. Sketch the magnetic axis of the magnet on your map.
c. Flip the cardboard grid over and check your results. Did you get the location and orientation correct?

1
19A
Name: ______________________________________________ Date: __________
Harmonic Motion
A Make a pendulum a. Write one sentence about the motion using the word “cycle.”
b. The amplitude is the maximum amount the pendulum swings away from its resting position. The resting position is straight down. One way to measure amplitude is the angle the pendulum moves away from center. Write one sentence describing the motion of your pendulum using the word “amplitude.”
c. Draw a sequence of sketches that describe one complete cycle using arrows to indicate the direction the pendulum is going at that point in the cycle.
B Oscillators and period a. Use the stopwatch to measure the period of your pendulum. Time ten cycles Do three trials and use
Table 1 to record your data.
b. Divide the average time for ten cycles by 10 to get the period.
c. Write a one sentence description of how you measured the period.

19A
2
Name: ______________________________________________ Date: __________
C Measuring period with a photogateThere are no questions to answer in part 3.
D Thinking about what you observed a. Write down the time measurement you get from the Timer.
b. Is the time you get from the Timer the period of the pendulum? Explain why the time is or is not the period of the pendulum (hint: compare to your results from part 2).
c. Explain how the time measured by the Timer is related to the period of the pendulum.
E What variables affect the period of a pendulum? a. Think of three experiments you can do to see what variables affect the period of the pendulum. Write
down one sentence describing each experiment.
Table 1: Pendulum period data: Time for 10 cycles (sec)
Trial 1 Trial 2 Trial 3 Average
Period of pendulum (average divided by10)

3
19A
Name: ______________________________________________ Date: __________
b. Do the three experiments and record the measurements you make to assess the effect of changing each variable.
19A
4
Name: ______________________________________________ Date: __________
c. Write a sentence about the effect of each variable. Write a second sentence explaining how the data you took support the statement you made about each variable.
F Sketch a graph of the motion using amplitude and period
a. How many complete cycles does your graph show?
b. Describe how to determine the amplitude of motion from a harmonic motion graph.
5
19A
Name: ______________________________________________ Date: __________
c. Describe how to determine the period from a harmonic motion graph.
d. What is the amplitude and period of the motion shown on the graph in the diagram?

1
19B
Name: ______________________________________________ Date: __________
Natural Frequency
A Make an oscillatorThere are no questions to answer in part 1.
B Measure the natural frequency
C Thinking about what you observed a. Does the washer-and-rubber-band oscillator have a natural frequency? How do you know?
b. Explain in one or two sentences how you measured the natural frequency. (Hint: describe the washer’s motion relative to the photogate.)
c. What would happen to the natural frequency if you made the rubber bands stronger? Would the natural frequency get higher, lower, or stay about the same? Explain your reasoning in a few sentences.
d. What would happen to the natural frequency if you made the washer heavier by adding more mass? Would the natural frequency get higher, lower, or stay about the same? Explain your reasoning in a few sentences.
Table 1: Natural frequency data (Hz) for 1 washer with 2 rubber bands
Trial 1Period (sec)
Trial 2Period (sec)
Trial 3Period (sec)
AveragePeriod (sec)
Natural Frequency (Hz)
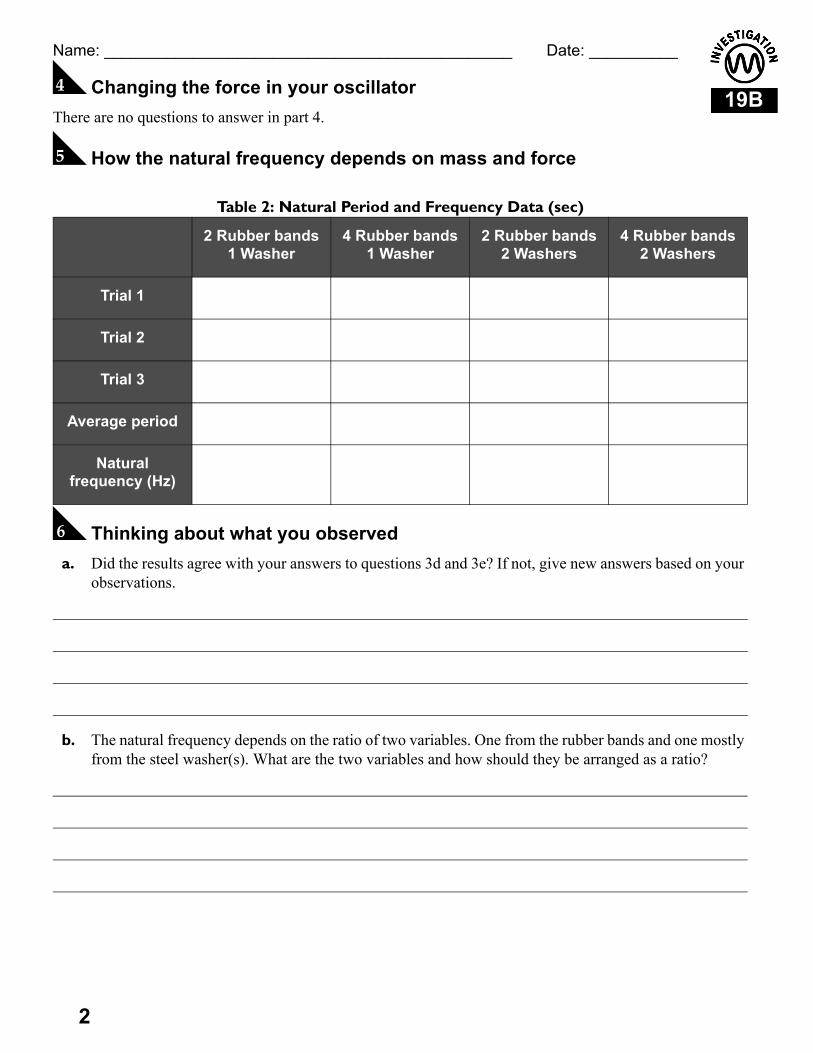
19B
2
Name: ______________________________________________ Date: __________
D Changing the force in your oscillatorThere are no questions to answer in part 4.
E How the natural frequency depends on mass and force
F Thinking about what you observed a. Did the results agree with your answers to questions 3d and 3e? If not, give new answers based on your
observations.
b. The natural frequency depends on the ratio of two variables. One from the rubber bands and one mostly from the steel washer(s). What are the two variables and how should they be arranged as a ratio?
Table 2: Natural Period and Frequency Data (sec)
2 Rubber bands1 Washer
4 Rubber bands1 Washer
2 Rubber bands2 Washers
4 Rubber bands2 Washers
Trial 1
Trial 2
Trial 3
Average period
Natural frequency (Hz)

1
20A
Name: ______________________________________________ Date: __________
Waves
A Making a wave pulseThere are no questions to answer in part 1.
B Thinking about what you observed a. How is the motion of a wave pulse different from the motion of a moving object such as a car.
(HINT: What is it that moves in the case of a wave?)
b. What happens to the wave pulse when it hits the far end of the string? Watch carefully. Does the pulse stay on the same side of the string or flip to the other side? Use the word “reflect” in your answer.
C Transverse waves
D Thinking about what you observed a. Imagine you removed one rubber band in the middle, making two unconnected chains. Do you think
the wave could cross the break. Discuss the reasoning behind your answer in a few sentences.
Table 1: Wave Frequency and Period Data
Wave Pattern
Trial 1Time for 10 cycles (sec)
Trial 2Time for 10 cycles (sec)
Trial 3Time for 10 cycles (sec)
AverageTime for 10 cycles (sec)
Period (sec)
Frequency(Hz)

20A
2
Name: ______________________________________________ Date: __________
b. Why does the wave move along the chain from one washer to the next?
c. Use the data you collected to complete Table 1 and calculate the natural frequency and period of the different wave patterns you observed.
d. Did you find a relationship between the frequencies at which you had to shake the chain to get the three different wave patterns? What relationship did you find?
E Waves in waterThere are no questions to answer in part 5.
F Thinking about what you observed a. The wave front of a water wave is an imaginary line drawn to show the shape of the crest of one wave.
Draw a sketch that shows the wave front of your plane wave. Also on your sketch, draw an arrow that shows the direction the wave moves.
3
20A
Name: ______________________________________________ Date: __________
b. Is the wave front parallel or perpendicular to the direction the wave moves?
c. Draw another sketch that shows the circular wave fronts and include at least four arrows that show the direction in which each part of the wave moves.
d. At every point along the wave, are the wave fronts more parallel or perpendicular to the direction in which the circular wave moves?
20A
4
Name: ______________________________________________ Date: __________
e. Sketch the shape of the wave fronts before and after wave passes through the 1 cm opening.
f. Does the wave change shape when it passes through the opening? If you see any change, your answer should say what kind of shape the wave changes into.

1
20B
Name: ______________________________________________ Date: __________
Resonance and Standing Waves
A Setting up a standing wave experimentThere are no questions to answer in part 1.
B Thinking about what you observed a. The string is 1 meter long. The wavelength, λ, is the length of one complete wave. Without using a
meter stick, how can you determine the wavelength of each standing wave?
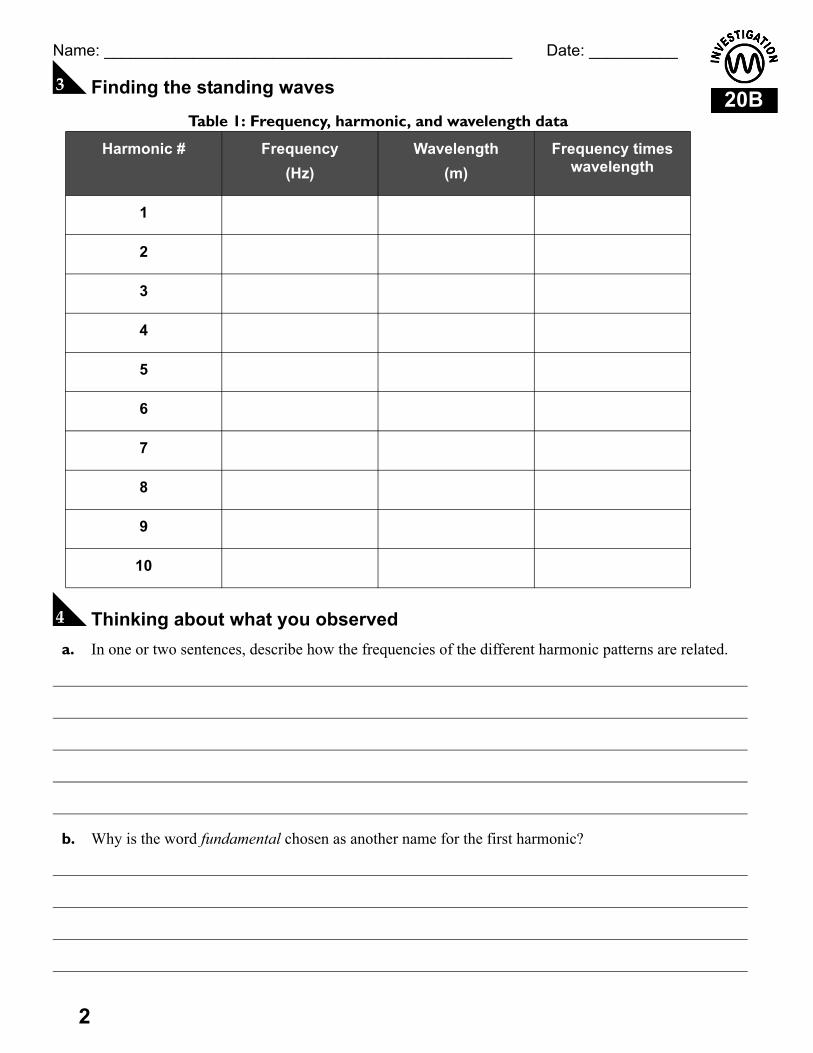
20B
2
Name: ______________________________________________ Date: __________
C Finding the standing waves
D Thinking about what you observed a. In one or two sentences, describe how the frequencies of the different harmonic patterns are related.
b. Why is the word fundamental chosen as another name for the first harmonic?
Table 1: Frequency, harmonic, and wavelength data
Harmonic # Frequency(Hz)
Wavelength(m)
Frequency times wavelength
1
2
3
4
5
6
7
8
9
10
3
20B
Name: ______________________________________________ Date: __________
c. Give an equation relating frequency (f) and wavelength (λ) that best describes your observations.
d. If the frequency increases by a factor of two, what happens to the wavelength?
e. Propose a meaning for the number you get by multiplying frequency and wavelength.
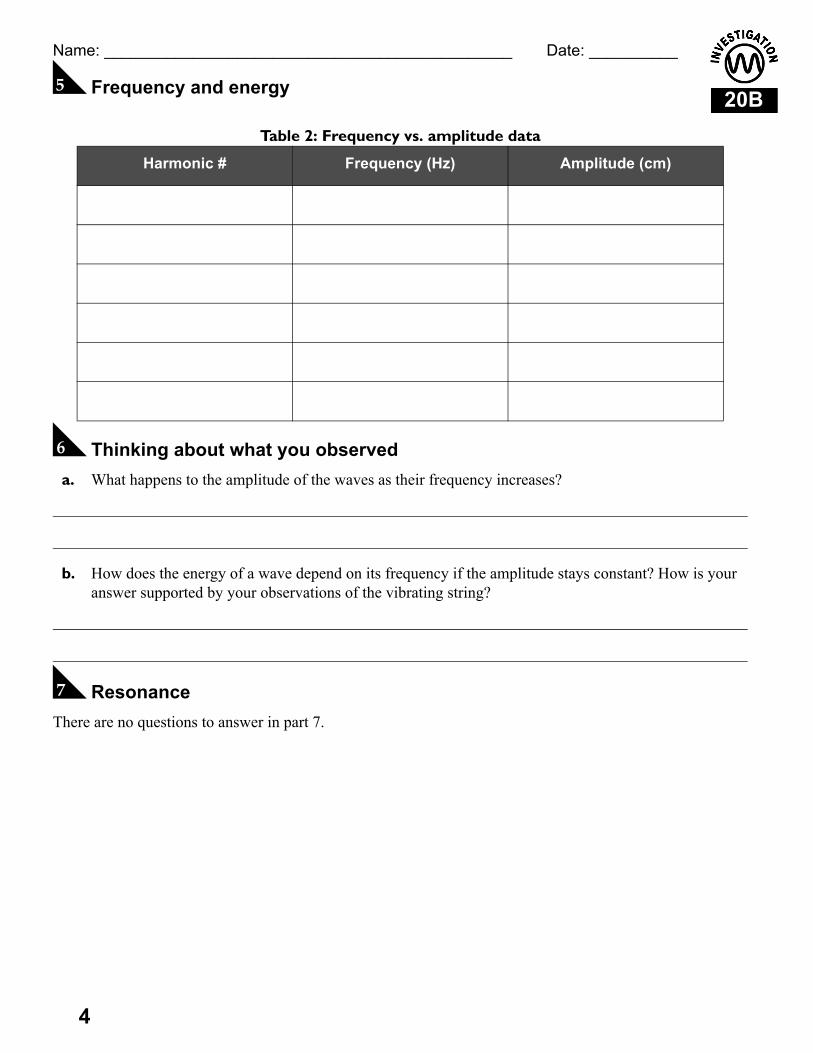
20B
4
Name: ______________________________________________ Date: __________
E Frequency and energy
F Thinking about what you observed a. What happens to the amplitude of the waves as their frequency increases?
b. How does the energy of a wave depend on its frequency if the amplitude stays constant? How is your answer supported by your observations of the vibrating string?
G ResonanceThere are no questions to answer in part 7.
Table 2: Frequency vs. amplitude data
Harmonic # Frequency (Hz) Amplitude (cm)

1
21A
Name: ______________________________________________ Date: __________
The Properties of Sound
A What do different frequencies sound like?
B How high can you hear?There are no questions to answer in part 2.
C Thinking about what you observed a. Make a histogram showing your class response to frequencies between 10,000 and 20,000 Hz. You
should have 5 bars, one per 2,000 Hz.
Table 1: How we hear frequencies of sound
Description Frequency (Hz)
Low
Medium
High
Very high

21A
2
Name: ______________________________________________ Date: __________
b. Do you think the method of counting raised hands is likely to give an accurate result? Give at least one reason you believe the method is either good or bad.
D The interference of two sound wavesThere are no questions to answer in part 4.
E Thinking about what you observed a. Read about beats. Using the diagram above, write a few sentences explaining why beats occur and how
they are created by the wave properties of sound.
b. If the two frequencies are exactly the same do you hear beats?
c. Would you expect to hear beats from an 800 Hz and a 805 Hz sound played together? Would you expect to hear beats from an 800 Hz and a 845 Hz sound played together? Explain why or why not.
3
21A
Name: ______________________________________________ Date: __________
d. What determines the frequency of the beats?
F Finding a mystery frequencyThere are no questions to answer in part 6.
1
21B
Name: ______________________________________________ Date: __________
Wave Properties of Sound
A Controlling frequency and wavelengthThere are no questions to answer in part 1.
B Thinking about what you observed a. How is sound created by the kazoo?
b. Why does the frequency change with the length of the straw? Think back to your experiments with the vibrating string.
c. Identify at least three musical instruments that use vibrating air columns or objects of different lengths to make sounds of different frequencies.
C Complex soundsThere are no questions to answer in part 3.
D Thinking about what you heard a. Describe the sound of the four frequencies 264 Hz, 330 Hz, 396 Hz, and 528 Hz when you hear them
together.
21B
2
Name: ______________________________________________ Date: __________
b. Describe the sound of the four frequencies 264 Hz, 317 Hz, 396 Hz, and 528 Hz when you hear them together.
c. Contrast the two sounds. Does one sound more happy or sad compared with the other? Does one sound spookier than the other? Which combination reminds you more of spring, which of fall?
E Musical scalesThere are no questions to answer in part 5.
F Thinking about what you heard a. What notes have frequencies of 264, 330, and 396 Hz? What is this combination of 3 notes called?
b. What notes have frequencies of 264, 317, and 396 Hz? What is this combination of 3 notes called?
c. What is the relationship between the frequencies of notes with the same name?

3
21B
Name: ______________________________________________ Date: __________
G Making an instrumentFor the last part of the Investigation you will make a musical instrument that plays the scale.
H Thinking about what you made a. How were the properties of waves used to design your musical instrument?
b. Do some research and find out how the length ratio is related to the frequency ratio for panpipes.
Table 1: Musical chimes
Column 1Note number
Column 2Frequency ratio
Column 3Length of first
chime
Column 4Length ratio
Length of chime for this note
(= Col. 3 x Col. 4)
1 1 1.00
2 9/8 0.94
3 5/4 0.89
4 4/3 0.87
5 3/2 0.82
6 5/3 0.77
7 15/8 0.73
8 2 0.71
1
22A
Name: ______________________________________________ Date: __________
Light and Color
A Sources of light a. Compare the light from a light bulb with the light from the same bulb when seen in a mirror. In both
cases, describe the path of the light from the source to your eyes.
b. Look at your clothes. Does the light reaching your eye from your clothes originate in your clothes? Or does the light originate somewhere else?
c. Turn off all the lights, and shade the windows so it is completely dark. Can you see your clothes in the dark? What does this experiment tell you about whether your clothes give off their own light or reflect light from somewhere else?
d. Turn on a television or computer screen in a dark room. Can you see the TV or computer screen in the dark? What does this experiment tell you about whether the TV or computer screen give off their own light or reflect light from somewhere else?
B Making colorsThere are no questions to answer in part 2.
C Thinking about what you observedRecord your answers to questions a-d in table 1.
a. What color do you see when you mix red and green light?
b. What color do you see when you mix red and blue light?

22A
2
Name: ______________________________________________ Date: __________
c. What color do you see when you mix blue and green light?
d. What color is produced when all three colors of light are equally mixed?
Table 1: Mixing primary colors of light
e. Research and explain the following terms from the diagram below: cone cells, rod cells, retina.
f. Research and explain how the eye sees white light in terms of the photoreceptors in the eye.
D The subtractive color model (CMYK)There are no questions to answer in part 4.
LED color combination Color you see
Red + Green
Green + Blue
Blue + Red
Red + Green + Blue

3
22A
Name: ______________________________________________ Date: __________
E Thinking about what you observed a. Explain how the mixture of magenta and cyan makes its color when seen in white light.
b. Explain how the mixture of cyan and yellow makes its color when seen in white light.
c. Explain how the mixture of yellow and magenta makes its color when seen in white light.
d. Why don’t the mixed colors produce full red, green, or blue?
e. What color would appear if you looked at a mixture of magenta and cyan under a lamp that only made blue light?
f. Research how printers make colors. Do they use red, green, and blue (RGB) or cyan, magenta, yellow, and black (CMYK)? Explain why printed pictures need to use one or the other.
g. Research how computer monitors and televisions make colors. Do they use red, green, and blue (RGB) or cyan, magenta, yellow, and black (CMYK)? Explain why TV’s and computer screens need to use one or the other.

1
22B
Name: ______________________________________________ Date: __________
Reflection and Refraction
A Observing the law of reflectionThere are no questions to answer in part 1.
B Thinking about what you observed a. Draw a ray diagram showing the surface of the mirror and the light rays before and after the mirror.
b. Which is the incident ray? Label it on your ray diagram.
c. Which is the reflected ray? Label it on your ray diagram.
C The law of reflection a. For each ray diagram, draw a line perpendicular to the mirror surface at the point where the rays hit.
This line is called the normal line.
b. Use a protractor to measure the angle between the normal and the incident and reflected rays.
c. Write down your own statement of the law of reflection, describing the relationship between the angles you measured.
Table 1: Angles of incidence and reflection
D Light rays going through a prismThere are no questions to answer in part 4.
Diagram #1 Diagram #2 Diagram #3 Diagram #4
Angle of incidence
Angle of reflection
22B
2
Name: ______________________________________________ Date: __________
E Sketching what you observed a. Draw at least one ray diagram showing a laser beam that is refracted passing through the prism.
The refracted ray is the ray that comes out of the prism.
b. Draw a ray diagram showing a laser beam that is reflected passing through the prism.
c. Draw a ray diagram showing a laser beam that is both refracted and reflected passing through the prism.

3
22B
Name: ______________________________________________ Date: __________
F Seeing reflection and refraction at the same time There are no questions to answer in part 6.
G Thinking about what you observed a. Draw a diagram showing the path of the light when you see the letter A.
b. Draw a diagram showing the path of the light when you see the letter B.
c. Is the image in the prism always reflected or refracted or can there be both reflection and refraction at the same time?

22B
4
Name: ______________________________________________ Date: __________
H The angle of refractionThere are no questions to answer in part 8.
I Thinking about what you observed a. Draw the normal line to the surface at the points where the light ray enters and leaves the cup. A round
cup is convenient because the normal line points toward the center of the circle.
b. When the light is going from air into water does the ray bend toward or away from the normal?
c. When the light is going from water back into air does the ray bend toward or away from the normal?

1
23A
Name: ______________________________________________ Date: __________
Optics
A Making an image with a lens
a. Was the image created by a single lens smaller or larger than the object?
b. Was the image right side up or was it inverted?
B Projecting an image with a lensThere are no questions to answer in part 2.
C Thinking about what you observed a. Describe the characteristics of the image formed by the lens. Characteristics include whether the image
right-side-up, inverted, larger, or smaller.
b. Discuss with your class why blocking part of the lens makes the image dimmer, even though you still see the entire image.
Table 1: Focal lengths of lenses
Focal length (mm)
White Lens
Black lens
23A
2
Name: ______________________________________________ Date: __________
D Finding the magnification of a lensTable 2: Magnification data for a single lens
E Thinking about what you observed a. Is the image in a magnifying glass inverted or upright?
b. At what distances will the lens act like a magnifying glass? What happens when the object is more than a focal length away?
c. Describe something that looks completely different under a magnifying glass than when seen with the un-aided eye.
Distance to paper(cm)
# of squares on the graph paper
(unmagnified squares)
# of squaresin the lens
(magnified squares)
Magnification

1
23B
Name: ______________________________________________ Date: __________
Optics and Images
A The image in a mirrorThere are no questions to answer in part 1.
B Thinking about what you observed a. Relative to the mirror surface, where did the image of the arrow appear in the mirror? How deep into
the mirror was the image?
b. Remove the mirror and use the ruler to extend the two reflected rays beyond where the mirror was. They should meet in a point on the other side of the line, like in the example on the right. What is the significance of the point where the reflected rays meet?
C Refracting light through a lensThere are no questions to answer in part 3.
D Thinking about what you observed a. Describe the path of the laser beam as it travels along the axis and through the lens.
23B
2
Name: ______________________________________________ Date: __________
b. What is the focal point of a lens? Mark the focal point on the ray diagram you just drew.
c. What is the focal length of a lens? Measure the focal length of the flat glass lens from the ray diagram.
d. Look back at your results from part 1 of Investigation 23A. Where does the image of a distant object form relative to the lens?

1
24A
Name: ______________________________________________ Date: __________
The Frequency and Wavelength of Light
A Breaking light apart
B Thinking about what you observed a. Describe the similarities and differences you observed in the spectra from the red, blue, and green
LEDs.
b. Describe what you saw looking at the white LED. Compare the spectrum from the white LED with the spectra from red, green, and blue.
c. Describe the spectrum you saw looking through the diffraction grating glasses at the spot made by the red laser on the screen. How is the spectrum of the red laser different from the spectrum of the red LED?
d. Based on your observations, explain how the colored filters transform the white light of the LEDs inside the lamps into red, green, and blue.
Table 1: Examining light sources
Red LED Green LED Blue LED
White LED Red laser spot
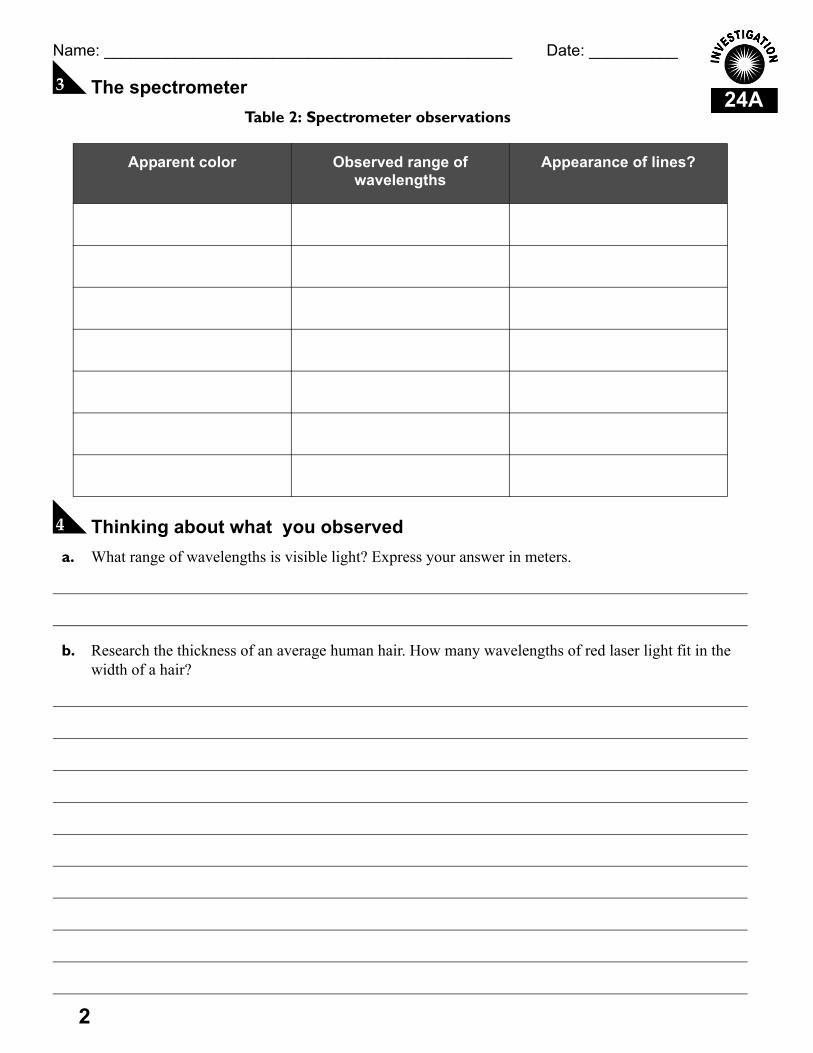
24A
2
Name: ______________________________________________ Date: __________
C The spectrometerTable 2: Spectrometer observations
D Thinking about what you observed a. What range of wavelengths is visible light? Express your answer in meters.
b. Research the thickness of an average human hair. How many wavelengths of red laser light fit in the width of a hair?
Apparent color Observed range of wavelengths
Appearance of lines?
3
24A
Name: ______________________________________________ Date: __________
c. Give a brief explanation of the colored lines in the spectrum of the fluorescent bulb.

1
24B
Name: ______________________________________________ Date: __________
Waves and Photons
A Polarization There are no questions to answer in part 1.
B Thinking about what you observed a. Describe how the term polarization applies to the two different kinds of waves you made.
b. How many polarizations are there for a water wave like the one you made in Investigation 20A?
c. Suppose you shake the spring at an angle halfway between vertical and horizontal. This makes the wave also oscillate at the same angle. Is this angle a totally different kind of polarization or can it be represented as a combination of the other two waves you made before? You should discuss this question with your class because the answer is not simple.
C The polarization of lightThere are no questions to answer in part 3.
D Thinking about what you observed a. What is the difference between polarized and unpolarized light?
b. Why did the image appear the same when viewed through one polarizer, even when the polarizer was rotated to any angle?
24B
2
Name: ______________________________________________ Date: __________
c. Explain why rotating a second polarizer on top of the first polarizer changes the amount of light you see coming through. You may use the diagram for reference.
d. Explain how polarization allows two waves to be different even if they have the same frequency, amplitude, phase, and wavelength.
E Reflecting on what you didThere are no questions to answer in part 5.
F Why polarizers make good sunglassesThere are no questions to answer in part 6.
G Thinking about what you observed a. Is there an orientation of the polarizer that allows you to see through the glare? If so, what is it?
b. What does this experiment tell you about the light that is reflected from the surface of the water compared to other light you see?
3
24B
Name: ______________________________________________ Date: __________
H Glow-in-the-dark plasticThere are no questions to answer in part 8.
I The effect of different colorsThere are no questions to answer in part 9.
J Thinking about what you observedIn answering these questions, think in terms of light and energy.
a. Why didn’t the plastic that was covered by your hand glow? Explain in 1-2 sentences.
b. What is the energy of green light compared to red and blue?
c. Propose an explanation for why the red and blue lights had different effects on the glow-in-the-dark plastic.
d. Holding the LED lamp closer to the surface makes the light on the surface brighter. Brighter light means more energy. The red light did not make a glow even when it was close, while the blue light made a glow even 10 cm away. How does the photon theory of light explain this observation? This is a class discussion question and the answer took many years to deduce.