investigation for natural extract inhibitors of...
TRANSCRIPT

INVESTIGATION FOR NATURAL EXTRACT INHIBITORS OF BOVINE LENS ALDOSE REDUCTASE RESPONSIBLE FOR THE FORMATION OF DIABETIS
DEPENDENT CATARACT
A THESIS SUBMITTED TO THE GRADUATE SCHOOL OF NATURAL AND APPLIED SCIENCES
OF MIDDLE EAST TECHNICAL UNIVERSITY
BY
MELİH ONAY
IN PARTIAL FULLFILLMENT OF THE REQUIREMENTS FOR
THE DEGREE OF MASTER OF SCIENCE IN
BIOCHEMISTRY
AUGUST 2008

Approval of the thesis:
INVESTIGATION FOR NATURAL EXTRACT INHIBITORS OF BOVINE
LENS ALDOSE REDUCTASE RESPONSIBLE FOR THE FORMATION OF DIABETIS DEPENDENT CATARACT
submitted by MELİH ONAY in partial fulfillment of the requirements for the degree of Master of Science in Biochemistry Department, Middle East Technical University by, Prof. Dr. Canan Özgen _____________________ Dean, Graduate School of Natural and Applied Sciences Assoc. Prof. Dr. Nursen Çoruh _____________________ Head of Department, Biochemistry Assoc. Prof. Dr. Nursen Çoruh Supervisor, Chemistry Department, METU _____________________ Prof. Dr. Mesude İşcan Co-Supervisor, Biology Department, METU _____________________ Examining Committee Members: Prof. Dr. Faruk Bozoğlu _____________________ Food Engineering Dept., METU Assoc. Prof. Dr. Nursen Çoruh _____________________ Chemistry Dept., METU Prof. Dr. Ayhan S. Demir _____________________ Chemistry Dept., METU Prof. Dr. Ahmet M. Önal _____________________ Chemistry Dept., METU Assist.Prof.Dr. Tülin Yanık _____________________ Biology Dept., METU Date: 01.08.2008
iii
I hereby declare that all information in this document has been obtained and presented in accordance with academic rules and ethical conduct. I also declare that, as required by these rules and conduct, I have fully cited and referenced all material and results that are not original to the this work.
Name, Last name : Melih Onay
Signature :

iv
ABSTRACT
INVESTIGATION FOR NATURAL EXTRACT INHIBITORS OF ALDOSE REDUCTASE RESPONSIBLE FOR THE FORMATION OF DIABETIS
DEPENDENT CATARACT
Onay, Melih
M.Sc., Department of Biochemistry
Supervisor : Assoc. Prof. Dr. Nursen Çoruh
Co-Supervisor : Prof. Dr. Mesude İşcan
August 2008, 100 pages
In the polyol pathway, Aldose reductase (AR) is an important enzyme in
reduction of aldehydes and aldosugars to their suitable alcohols. AR, using NADPH
as a coenzyme, has a molecular weight of 37 000 dalton. AR in its activated form,
known to increase the sorbitol accumulation in lens, is responsible for the cataract
formation in diabetis diseases. Therefore, the inhibition of aldose reductase is
important to prevent the incedence of cataract formation in diabetus mellitus. In the
treatment of diabetis dependent cataract, chemically synthetized drugs were
sometimes less than beneficial due to the severe side effects they cause.

v
Recently a huge amount of study has been intensified on developing new
drugs from natural compounds and even by utilizing plant extracts for their easily
metabolizing polyphenolic compounds. In this study, BLAR, source of enzyme, was
obtained as crude via differential centrifugation and ammonium sulfate precipitation.
The enzyme assay conditions were optimized for the protein, substrate, coenzyme,
and salt concentrations, also for the effects of pH and temperature. Ocimum
basilicum, Lavandula stoechas, Melissa officinalis, Glycyrrhiza glabra L. and
Tilia tomentosa were selected as commonly used alternative medicine plants. Plant
extracts were prepared in ethanol and ethyl acetate and their inhibitory effects were
tested on crude bovin lens aldose reductase enzyme. Fifty percent inhibitory
concentrations (IC50) were found between values of 25.53 µg/mL and 54.15 µg/mL
for ethanol extracts and between 41.55 µg/mL and 82.96 µg/mL for the ethyl acetate
extracts of selected plants. In addition, the plant extracts were also characterized for
their antioxidant activities by of 2,2-diphenyl-1-picrylhydrazyl (DPPH) radical
scavenging method and test of total phenolic content (TPC) .
Keywords: Aldose Reductase Inhibition, Medicinal Plants, Antioxidant Activity,
Bovine Lens.

vi
ÖZ
DİYABETE BAĞLI KATARAK OLUŞUMUNDAN SORUMLU ALDOZ REDUKTAZIN DOĞAL ÖZÜT İNHİBİTÖRLERİNİN ARAŞTIRILMASI
Onay, Melih
Yüksek Lisans, Biyokimya Bölümü
Tez Danışmanı : Doç.Dr. Nursen Çoruh
Ortak Tez Danışmanı: Prof. Dr. Mesude İşcan
Ağustos 2008, 100 sayfa
Aldoz redüktaz (AR) aldehit ve aldoşekerlerin, uygun alkollere
indirgenmesinde önemli bir enzimdir. NADPH’i koenzim olarak kullanan AR 37 000
dalton moleküler ağırlığa sahiptir. Göz merceğinde sorbitol birikimini arttırdığı
bilinen AR’nın aktive edilmiş şekli diyabette katarakt oluşumundan sorumludur. Bu
yüzden, aldoz redüktazın inhibisyonu diyabette katarakt oluşumunun ilerlemesini
engellemede önemlidir. Diyabete bağlı kataraktın tedavisinde, kimyasal olarak
sentezlenen ilaçlar onların neden oldukları yan etkilerden dolayı bazı zamanlar daha
az yararlı olmaktadırlar.

vii
Son zamanlarda yapılan çalışmaların büyük bir kısmı doğal bileşiklerden yeni
ilaçların gelişimi ve kolaylıkla metabolize olabilen fenolik bileşikler ile bitki
özütlerinin kullanımı üzerine yoğunlaştırılmıştır. Bu çalışmada, enzim kaynağı aldoz
redüktaz basamaklı santrifüj ve amonyum sülfat çöktürmesi aracılığı ile ham olarak
elde edildi. Enzim deney koşulları protein, substrat, koenzim, tuz konsantrasyonu,
pH etkileri ve sıcaklık şartları için en uygun hale getirildi. Ocimum basilicum,
Lavandula stoechas, Melissa officinalis, Glycyrrhiza glabra L. ve Tilia tomentosa
yaygın olarak kullanılan halk tıbbi bitkileri olarak seçildi. Bitki özütleri etanol ve
etilasetat içerisinde hazırlandı ve onların inhibitör etkileri ham sığır aldoz redüktaz
enzimi üzerinde test edildi. Seçilen bitkilerin etanol özütleri için yüzde elli
inhibisyon konsantrasyonu 25.53 µg/mL ile 54.15 µg/mL arasında, etil asetat
özütleri için 41.55 µg/mL ile 82.96 µg/mL arasında bulundu. Buna ek olarak, birde
bitki özütleri, 2,2 difenil-1- pikrilhidrazil (DPPH) radikali yakalama yeteneği
methodu ve toplam fenol içeriği testi ile antioksidan özelliği için karakterize edildi.
Anahtar sözcükler: Aldoz Redüktaz İnhibisyonu, Tıbbi Bitkiler, Antioksidan
Aktivite, Sığır Lensi.

viii
To the sunshine of my life Aytun…

ix
ACKNOWLEDGEMENTS
I would like to thank to my supervisor Assoc. Prof. Dr. Nursen Çoruh for her
patience and encouragement and supervision throughout this study.
I am deeply grateful to my co-supervisor Prof. Dr. Mesude İşcan for all things
that I need to complete the work.
I am deeply grateful to Assist. Prof. Dr. Belgin İşgör for her help, guidance
and encouragement in this study.
I would like to thank to Prof. Dr. Ayhan S. Demir’s laboratory for their
helps.
I wish to express my special thanks to Prof. Dr. Faruk Bozoğlu, Prof. Dr.
Ayhan S. Demir, Prof. Dr. Ahmet Önal, Assist. Prof. Dr. Tülin Yanık for their
valuable suggestions and corrections.
I would also like to thank everyone in our group in METU for their friendship
and help, my lab friends Ömer Faruk Gerdan and Nizamettin Özdoğan for their
sincere friendship.
I would like to send my appreciation to my gratitude to dear Aytun Onay for
her endless patience, support and love.
I am grateful to my family for their encouragement and trust.
I want to express my sincere gratitute to TÜBİTAK for financial supports to
my thesis through TÜBİTAK-BAYG -2210 Yurtiçi Yüksek Lisans Burs Programı.
x
TABLES OF CONTENTS ABSTRACT................................................................................................................ iv
ÖZ ............................................................................................................................... vi
ACKNOWLEDGEMENTS ........................................................................................ ix
TABLES OF CONTENTS........................................................................................... x
LIST OF TABLES ....................................................................................................xiii
LIST OF FIGURES .................................................................................................. xiv
LIST OF ABBERIVATIONS.................................................................................xviii
CHAPTER
1. INTRODUCTION ................................................................................................ 1
1.1 Properties of plant materials............................................................................... 2
1.1.1 Properties of Ocimum basilicum L. ............................................................. 2
1.1.2 Properties of Lavandula stoechas ................................................................ 3
1.1.3 Properties of Melissa officinalis .................................................................. 4
1.1.4 Properties of Glycyrrhiza glabra ................................................................. 5
1.1.5 Properties of Tilia tomentosa ....................................................................... 6
1.2. Properties of aldose reductase ........................................................................... 7
1.3 Inhibition of aldose reductase activity.............................................................. 14
1.3.1 Aldose reductase inhibitors from plant materials ...................................... 17
1.4 Antioxidants ..................................................................................................... 18
1.4.1 Fenolic compounds .................................................................................... 20
1.4.2 Free Radicals ............................................................................................. 24
1.5 Scope of the study ............................................................................................ 24
2. MATERIAL AND METHOD ............................................................................ 26
2.1 Materials ........................................................................................................... 26
2.1.1 Chemicals .................................................................................................. 26
2.1.2 Apparatus ................................................................................................... 27
2.2 Methods ............................................................................................................ 27
xi
2.2.1 Preparation of aldose reductase crude extract from bovine lens ............... 27
2.2.2 Preparation of crude fractions from the plant extracts............................... 28
2.2.3 Analytical procedures ................................................................................ 29
2.2.4 Antioxidant activities of plant extracts ...................................................... 35
2.2.5 Statistical calculation ................................................................................. 37
3. RESULTS AND DISCUSSION ......................................................................... 38
3.1 Weights of bovine lenses.................................................................................. 38
3.2 Bovine lens aldose reductase activity............................................................... 38
3.3 Storage stability of aldose reductase activity ................................................... 38
3.4 Characterization of bovine lens aldose reductase activity................................ 41
3.4.1 The time course of bovine lens aldose reductase activity.......................... 41
3.4.2 Effect of protein amount on enzyme activity............................................. 42
3.4.3 Effect of pH on enzyme activity ................................................................ 43
3.4.4 Effect of Li2SO4 amount on enzyme activity............................................. 44
3.4.5 The effect of glyceraldehyde concentration on enzyme activity ............... 45
3.4.6 The effect of cofactor NADPH concentration on enzyme activity............ 48
3.4.7 The effect of temperature on aldose reductase enzyme activity................ 50
3.4.8 The inhibitory effect of dimethylsulfoxide (DMSO) on aldose reductase enzyme activity ................................................................................................... 51
3.5 Yields of ethanol and ethyl acetate extracts ..................................................... 52
3.5.1 Yields of ethanol extracts .......................................................................... 52
3.5.2 Yields of ethyl acetate extracts .................................................................. 53
3.6 Inhibitory effect of plant extracts on aldose reductase enzyme activity .......... 54
3.6.1 Inhibitory effect of ethanol extracts on aldose reductase enzyme activity 55
3.6.2 Inhibitory effect of ethyl acetate extracts on aldose reductase enzyme activity ................................................................................................................ 60
3.6.3 Summary of inhibitory effects ( IC 50 µg/mL) of ethyl acetate extracts on aldose reductase activity ..................................................................................... 66
3.6.4. Comparision of 50 % inhibitory concentrations ( IC 50 µg/mL) of ethanol and ethyl Acetate extracts on aldose reductase activity...................................... 67

xii
3.7 Determination of antioxidant capacities and total phenol content (TPC) of
plant extracts………………………………………………………………………...69
3.7.1 Determination of antioxidant capacities of plant ethanol extracts............. 70
3.7.2 Determination of antioxidant capacities of plant ethyl acetate extracts .... 76
3.7.3. Comparision of 50 % effective concentration for DPPH radical scavenging activity of ethyl acetate extracts....................................................... 81
3.8 Determination of total phenol content (TPC) of plant extracts ........................ 82
3.8.1 Determination of total phenol content (TPC) of ethanol extracts.............. 82
3.8.2 Determination of total phenol content (TPC) of ethyl acetate extracts .... 84
4. CONCLUSIONS................................................................................................. 86
REFERENCES........................................................................................................... 90

xiii
LIST OF TABLES TABLES
Table 1.1: Tissue localization of aldose reductase and related diabetic complications.
(Raskin, P., 1987)....................................................................................................... 13
Table 2.1 : The components of assay mixture for aldose reductase.......................... 31
Table 3.1 : Comparision of percent yields of ethanol extracts. The values were
shown as (%) percent yield of ethanol extracts (w/w) ............................................... 52
Table 3.2 : Comparision of percent yields of ethyl acetate extracts. The values were
shown as (%) percent yield of ethyl acetate extracts (w/w)....................................... 53
Table 3.3: Comparision of 50 % inhibitory concentrations ( IC 50 µg/ml) of ethanol
on aldose reductase activity. ...................................................................................... 67
Table 3.4: Comparision of 50 % inhibitory concentrations ( IC 50 µg/ml) of ethyl
acetate extracts on aldose reductase activity.............................................................. 68
Table 3.5 : Comparision of 50 % effective concentration for DPPH radical
scavenging activity of ethanol extracts. ..................................................................... 75
Table 3.6: Comparision of 50 % effective concentration for DPPH radical
scavenging activity of ethyl acetate extracts.............................................................. 81
Table 3.7: Comparision of. total phenol content (TPC) of ethanol extracts. ........... 83
Table 3.8: Comparision of. total phenol content (TPC) of ethyl acetate extracts. ... 85

xiv
LIST OF FIGURES FIGURES Figure 1.1: Secondary structure of aldose reductase. (Wilson, 1992) ........................ 8
Figure 1.2 : NADPH- enzyme binary complex. (Wilson, 1992)................................. 9
Figure 1.3 :The formation of fructose via aldose reductase and sorbitol
dehydrogenase............................................................................................................ 10
Figure 1.4 : Polyol pathway in accordance with Embden–Meyerhof pathway. (Ohta,
1993 ; Clarke, 1984)................................................................................................... 11
Figure 1.5: Chemical structures of some of known synthetic aldose reductase
inhibitors. ................................................................................................................... 15
Figure 1.6 : The schematic representation of ligand binding site of aldose reductase
(Miyamoto, 2002). ..................................................................................................... 17
Figure 1.7 : Structure of flavonoid.............................................................................19
Figure 1.8 : Structures of flavone, flavonol, isoflavone and flavonone…………….23
Figure 2.1 : BSA standard calibration curve for protein determination.................... 30
Figure 2.2: Free Radical Scavenging Activity of DPPH (2,2-Diphenyl-1
picrylhydrazyl) by a flavonoid (Dragan, 2003).......................................................... 36
Figure 3.1: Storage stability of bovine lens aldose reductase. The data determined
are mean of duplicate measurements obtained from at least three seperate
experiments. ............................................................................................................... 39
Figure 3.2: The time course of bovine lens aldose reductase enzyme activity.. ....... 41
Figure 3.3: Effect of enzyme amount on bovine lens aldose reductase activity. The
values were expressed as Mean ± SD. The data determined are mean of duplicate
measurements obtained from at least three seperate experiments. ............................ 42
Figure 3.4: Effect of pH on bovine lens aldose reductase enzyme activity. The
values were expressed as Mean ± SD. The data determined are mean of duplicate
measurements obtained from at least three seperate experiments. ............................ 43
Figure 3.5: Effect of Li2SO4 concentration on bovine lens aldose reductase. .......... 44

xv
Figure 3.6: Effect of glyceraldehyde concentration on enzyme activity. ................. 46
Figure 3.7: Lineweaver-Burk plot of bovine lens aldose reductase activity against
glyceraldehyde. .......................................................................................................... 47
Figure 3.8: Effect of cofactor NADPH concentration on enzyme activity. The values
were expressed as Mean ± SD. The data determined are mean of duplicate
measurements obtained from at least three seperate experiments. ............................ 48
Figure 3.9: Lineweaver-Burk plot of aldose reductase enzyme activity against
cofactor (NADPH). .................................................................................................... 49
Figure 3.10: Effect of temperature on enzyme activity............................................. 50
Figure 3.11: Effect of Dimethylsulfoxide (DMSO) on Aldose Reductase Enzyme
Activity. The values were expressed as Mean ± SD. The data determined are mean of
duplicate measurements obtained from at least three seperate experiments.............. 51
Figure 3.12: Inhibitory effect of Ocimum Basilicum ethanol extracts on aldose
reductase enzyme activity. The values were given as Mean ± SD. The data
determined are mean of duplicate measurements acquired from at least three seperate
experiments. ............................................................................................................... 55
Figure 3.13: Inhibitory effect of Lavandula stoechas ethanol extracts on aldose
reductase enzyme activity. The values were shown as Mean ± SD. The data
determined are mean of duplicate measurements obtained from at least three seperate
experiments. ............................................................................................................... 56
Figure 3.14: Inhibitory effect of Melissa officinalis ethanol extracts on aldose
reductase enzyme activity. The values were demonstrated as Mean ± SD. The data
found are mean of duplicate measurements obtained from at least three seperate
experiments. ............................................................................................................... 57
Figure 3.15: Inhibitory effect of Glycyrrhiza glabra L ethanol extracts on qldose
reductase enzyme activity. The values were shown as Mean ± SD. The data obtained
are mean of duplicate measurements acquired from at least three seperate
experiments. ............................................................................................................... 58

xvi
Figure 3.16: Inhibitory effect of Tilia tomentosa ethanol extracts on aldose reductase
enzyme activity. The values were taken as Mean ± SD. The data given are mean of
duplicate measurements obtained from at least three seperate experiments.............. 59
Figure 3.17 : Inhibitory Effects of Ethanol Extracts on Aldose Reductase Enzyme
Activity. The values were taken as Mean ± SD. The data given are mean of duplicate
measurements obtained from at least three seperate experiments. ............................ 60
Figure 3.18: Inhibitory effect of Ocimum basilicum ethyl acetate extracts on aldose
reductase enzyme activity. The values were shown as Mean ± SD. The data given are
mean of duplicate measurements obtained from at least three seperate experiments.61
Figure 3.19: Inhibitory effect of Lavandula stoechas ethyl acetate extracts on aldose
reductase enzyme activity. The values were shown as Mean ± SD. The data
determined are mean of duplicate measurements obtained from at least three seperate
experiments. ............................................................................................................... 62
Figure 3.20: Inhibitory effect of Melissa officinalis ethyl acetate extracts on aldose
reductase enzyme activity. The values were taken as Mean ± SD. The data found are
mean of duplicate measurements obtained from at least three seperate experiments.
50 % inhibitory concentration ( IC 50 µg/ml) of Melissa officinalis ethyl acetate
extracts was found as 50.32 ± 2.46 µg/ml................................................................. 63
Figure 3.21: Inhibitory effect of Glycyrrhiza glabra L ethyl acetate extracts on
aldose reductase enzyme activity. The values were shown as Mean ± SD. The data
obtained are mean of duplicate measurements acquired from at least three seperate
experiments. 50 % inhibitory concentration ( IC 50 µg/ml) of Glycyrrhiza glabra L
ethyl acetate extracts was found as 41.55 ± 1.4 µg/ml. ............................................. 64
Figure 3.22: Inhibitory effect of Tilia tomentosa ethyl acetate extracts on aldose
reductase enzyme activity. The values were shown as Mean ± SD. The data given are
mean of duplicate measurements obtained from at least three seperate experiments.65
Figure 3.23 : Inhibitory effects of ethyl acetate extracts on aldose reductase enzyme
activity. The values were shown as Mean ± SD. The data given are mean of duplicate
measurements obtained from at least three seperate experiments. ............................ 66

xvii
Figure 3.24: Percent DPPH scavenging activity of Ocimum basilicum ethanol
extracts. The values were given as Mean ± SD. The data determined are mean of
duplicate measurements acquired from at least three seperate experiments.............. 70
Figure 3.25: Percent DPPH scavenging activity of Lavandula stoechas ethanol
extracts. The values were shown as Mean ± SD. The data determined are mean of
duplicate measurements obtained from at least three seperate experiments.............. 71
Figure 3.26: Percent DPPH scavenging activity of Melissa officinalis ethyl acetate
extracts. The values were expressed as Mean ± SD. The data determined are mean of
duplicate measurements obtained from at least three seperate experiments.............. 72
Figure 3.27: Percent DPPH scavenging activity of Glycyrrhiza glabra L. ethyl
acetate extracts. The values were given as Mean ± SD. The data determined are mean
of duplicate measurements obtained from at least three seperate experiments. ........ 73
Figure 3.28:Percent DPPH scavenging activity of Tilia tomentosa ethanol
extracts………………………………………………………………………………74
Figure 3.29: Percent DPPH scavenging activity of Ocimum basilicum ethyl acetate
extracts…………………………………………………………...………………….76
Figure 3.30: Percent DPPH scavenging activity of Lavandula stoechas ethyl acetate
extracts………………………………………………………………………………77
Figure 3.31: Percent DPPH scavenging activity of Melissa officinalis ethyl acetate
extracts…………………………………………………………………………...….78
Figure 3.32: Percent DPPH scavenging activity of Glycyrrhiza glabra L. ethyl
acetate extracts………………………………………………………………...…….79
Figure 3.33: Percent DPPH scavenging activity of Tilia tomentosa ethyl acetate
extracts………………………………………………………………………………80
Figure 3.34: Total phenol content (TPC) of plant ethanol extracts. ......................... 82
Figure 3.35: Total phenol content (TPC) of plant ethyl acetate extracts. ................ 84

xviii
LIST OF ABBERIVATIONS ARI Aldose reductase inhibitor
BLAR Bovine lens aldose reductase
BSA Bovine serum albumin
DPPH 2,2-diphenyl-1-picrylhydrazyl
EC50 Fifty percent effective concentration
GAE Gallic acid equivalent
IC 50 Fifty percent inhibitory concentration
NADP+ Nicotinamide adenine dinucleotide phosphate (oxidized)
NADPH Nicotinamide adenine dinucleotide phosphate (reduced)
DMSO Dimethylsulfoxide
PBS Phosphate Buffer Saline
RSA Radical scavenging activity
SD Standard deviation:
TMG Tetramethylene glutaric acid
TPC Total phenol content
OB Ocimum basilicum L. (Sweet Basil)
LS Lavandula stoechas (Lavender)
MO Melissa officinalis (Sweet Balm)
GG Glycyrrhiza glabra (Liquorice)
TT Tilia tomentosa (Linden)

1
CHAPTER 1
INTRODUCTION
Aldose reductase is the first enzyme of the polyol pathway and it changes
glucose to sorbitol that is formed by reduction of glucose in the presence of NADPH
(Crabbe, 1991). Aldose reductase in eyes, kidney, muscle and brain can cause
accumulation of sorbitol in the presence of diabetes mellitus (Kador, 1988;
Nishimura-Yabe 1998; Brownlee 2001). Consequently, aldose reductase is
importantly associated with the pathogenesis of symptoms of diabetes. Accumulation
of sorbitol under normal physiological conditions is not much important. However,
in diabetes mellitus with increased glucose levels, sorbitol would be accumulated in
cells due to its slow metabolization by sorbitol dehydrogenase and it has severe
effects in the formation of cataract. Sorbitol does not easily diffuse through the cell
membranes, so it accumulates in the cells, causing the osmotic pressure to construct
eventually to the cells burst, resulting in the tissue damage. The presence of aldose
reductase in the eye lenses was reported by Heyningen (Van Heyningen, 1959).
Some physical properties of the partially purified bovine lens aldose reductase have
been reported such as substrate specisity, cofactor requirement, optimum pH and
sulfhydryl requirement (Hayman, 1965) and it is purified (Sheaff, 1976). Sheaff
displayed that aldose reductase has a broad substrate specificity for substances
having aldehyde groups and shown an optimum pH of 5.5, and it has been purified at
15.000 fold with a molecular weight of 37.000 dalton. The studies including
inhibition of aldose reductase that prevents the onset of cataract successfully began
in the early 1960s. Tetramethylene glutaric acid (TMG) was changed the cataract
progression by modifying the activity of aldose reductase (Kinoshita, 1968 ).

2
Flavonoids are often found in plants and they have diversity as a group of
phytochemicals. The inhibitory properties of various flavonoids were tested and all
had significant activity for inhibition of aldose reductase. In the same study it was
shown that quercetin, quercitrin and myricitrin were much more effective as
inhibitors than TMG (Kinoshita, 1968; Varma, 1977).
1.1 Properties of plant materials
1.1.1 Properties of Ocimum basilicum L. Scientific classification of Ocimum basilicum L. is defined as below.
Kingdom : Plantae
Subkingdom : Tracheobionta
Division : Magnoliophyta
Class : Magnoliopsida
Subclass : Asteridae
Order : Lamiales
Family : Lamiaceae
Genus : Ocimum
Species: Ocimum basilicum L.
Ocimum is a genus of about 35 species of aromatic annual and perrenial herbs
and shrubs in the family Lamiaceae, native to the tropical and warm temperate
regions of the Old World. Ocimum basilicum, O. americanum, and O. micranthum
are members of the family Lamiaceae. Most Ocimum spp. can be grown and found
throughout the world. However, they are not native to all areas. For example, O.
micranthum originated in Central America. It grows to a height of approximately 50
cm. The leaves are oval and slightly toothed, and the flowers are white or purple. In
contrast, O. basilicum looks very similar, but grows taller , generally, it has 50-80 cm
of height. O. Basilicum has common names in different countries. For example, it is
named as fesleğen in Turkey, sweet basil in USA, hung que in Vietnam, balanoi in
the Philippines.

3
The dried leaves of O. basilicum contain 0.20-1 % essential oil. The major
compounds in the oil are linalool and methylchaviol. However, the exact amounts
can vary considerably. For example, cineole has been found in O. Basilicum. There is
little available literature on the toxicity of Ocimum spp. O. basilicum, the species that
appears to be used the most medicinally and the one for which the most analysis has
been done, contains several potentially dangerous compounds. Some of these
compounds are rutin, caffeic acid, tryptophan, and quercetin. O. basilicum has been
used as an expectorant in animals. Recently, there has been much research put into
the health benefits related to the essential oils found in basil. Scientific studies have
established that compounds in basil oil have potent antioxidant, anti-cancer, anti-
viral, and anti-microbial properties (Bozin, 2006 ; Chiang, 2005 ; Almeida, 2007 ;
Manosroi, 2006 ). In addition, basil has been shown to decrease the occurence of
platelet aggregation and experimental thrombus in mice ( Tohti, 2006 ).
O. Basilicum is grown near Aegean and the Mediterranean region and used
for diuretic treatments, depression, expectorant and headache in Turkey.
1.1.2 Properties of Lavandula stoechas Scientific classification of Lavandula stoechas is clarified as below.
Kingdom : Plantae
Subkingdom : Tracheobionta
Division : Magnoliophyta
Class : Magnoliopsida
Subclass : Asteridae
Order : Lamiales
Family : Lamiaceae
Genus : Lavandula
Species: Lavandula stoechas

4
Lavandula stoechas occurs naturally in the Mediterranean region. It has a
perennial shrub and grows to 30-100 cm tall. The leaves are 1-4 cm long, greyish
tomentose. The flowers are pinkish-purple (lavender-coloured), produced on spikes
2-3 cm long at the top of slender leafless stems 10-30 cm long; each flower is
subtended by a bract 4-8 mm long. Lavandula stoechas has common names in
different countries. For example, it is named as karabaş otu in Turkey, lavender in
England, lavendel in Germany and lavande in France. Lavandula stoechas can be
grown throughout western and southern Anatolia and it is used for cholera,
antiseptic, lesion treatments and expectorant ( Gülçin, 2004 ).
1.1.3 Properties of Melissa officinalis Scientific classification of Melissa officinalis is defined as below.
Kingdom : Plantae
Subkingdom : Tracheobionta
Division : Magnoliophyta
Class : Magnoliopsida
Subclass : Asteridae
Order : Lamiales
Family : Lamiaceae
Genus : Melissa
Species: Melissa officinalis
Melissa officinalis is a perennial herb in family Lamiaceae, native to southern
Europe and the Mediterranean region. It grows to 70-150 cm tall. The leaves have a
gentle lemon scent. At the end of the summer, little white flowers full of nectar
appear and attract bees. Hence, the genus name Melissa is meaned to honey bee in
Greek. Melissa officinalis has common names in different countries. For example, it
is named as oğul otu and limon otu in Turkey, lemon balm melissa and sweet balm in
England, melisse Germany and mélisse in France. Its flavour comes from the
terpenes citronellal, citronellol, citral, and geraniol.
5
Lemon balm is often used as a flavouring in ice cream and herbal teas. It is
also frequently paired with fruit dishes or candies. Melissa officinalis can be grown
throughout Thrace region in Turkey. It is very useful for heart diseases, nervous
agitation, and for promoting sleep, and ameliorates functional gastrointestinal
complaints (Kümel, 1991 ). In folk medicine, balm is recommended as a plant juice,
cream or tea infusion for nervous complaints, lower abdominal disorders, gastric
complaints, hysteria and melancholia, chronic bronchial catarrh, migraine, nervous
debility, toothache, earache, headache and high blood pressure and, externally for
rheumatism, nevre pains and stiff necks (Cohen, 1964).
1.1.4 Properties of Glycyrrhiza glabra Scientific classification of Glycyrrhiza glabra is clarified as below.
Kingdom : Plantae
Subkingdom : Tracheobionta
Division : Magnoliophyta
Class : Magnoliopsida
Subclass : Rosidae
Order : Fabales
Family : Fabaceae
Genus : Glycyrrhiza
Species: Glycyrrhiza glabra
Glycyrrhiza is a genus of about 18 accepted species in the family Fabaceae,
with a subcosmopolitan distribution in Asia, Australia, Europe, and the Americas.
The genus is best known for liquorice (British English; licorice in American
English), which is the product of G. glabra, a species native to the Mediterranean
region. It grows to 40-200 cm tall. Glycyrrhiza glabra has common names in
different countries. For example, it is named as meyan kökü in Turkey, sweet root
and licorice in England, süssholz Germany and racine dovce in France.

6
It contains sterols and flavones such as liquiritin and liquiritigenin. It can be
grown throughout Southern, Middle and East Anatolia region in Turkey. Glycyrrhiza
glabra is one of the oldest and widely used herbs from the ancient medical history of
Ayurveda, both as a medicine and a flavoring herb to disguise the unpleasant flavor
of other medications (Biondi, 2005). The first report of medicinal use comes from
Greeks, who recommended it for the treatment of gastric and peptic ulcers. In Asia
and Europe, the extract is used in the treatment of psoriasis. Glycyrrhiza glabra is
used to relieve inflammations, eye diseases, throat infections, peptic ulcers, arthritic
conditions, and liver diseases in Indian Ayurveda system. Other uses of the plant
include the treatment of sex-hormone imbalances and menopausal symptoms in
women. Anti-Helicobacterpylori and antibacterial activities of flavonoids from the
licorice extract were reported previously (Fukai, 2002).
1.1.5 Properties of Tilia tomentosa Scientific classification of Tilia tomentosa is defined as below.
Kingdom : Plantae
Subkingdom : Tracheobionta
Division : Magnoliophyta
Class : Magnoliopsida
Subclass : Dilleniidae
Order : Malvales
Family : Tiliaceae
Genus : Tilia
Species: Tilia tomentosa

7
Tilia is a genus of about 30 species of trees, native throughout most of the
temperate Northern Hemisphere, in Asia, Europe and eastern North America; it is not
native to western North America. Under the Cronquist classification system, this
genus was placed in the family Tiliaceae, but genetic research by the APG has
resulted in the incorporation of this family into the Malvaceae. The trees are
generally called lime in Britain and linden in North America. Tilia species are large
deciduous trees, reaching typically 20-40 m tall, with oblique-cordate leaves 6-20 cm
across, and are found through the north temperate regions. Three species of Tilia is
known as Tilia platyphyllos, Tilia rubra and Tilia tomentosa (Tilia argentea) in
Turkey. Tilia flowers have a noticable importance in phytotherapy. It is stated to
possess expectorant, diuretic, antispasmodic, stomachic and sedative activities. It has
been used for the treatment of flu, migraine, cough, nervous tension, ingestion,
various types of spasms, liver and gall bladder disorders. Medicinal properties
claimed for the drug have been attributed to its flavonoid, volatile oil and mucilage
components ( Baytop, 1984 ; Newall, 1996 ).
1.2. Properties of aldose reductase Aldose reductase is a cytoplasmic enzyme and it consists of a group of
enzymes with the (beta/alpha)8 barrel class. Aldose reductase is a globular protein
composed of a single polypeptide chain of 315 residues, with molecular weight of
37 000 dalton and it does not contain any metal group. Aldose reductase is an
NADPH-dependent oxidoreductase with a large substrate specificity that it catalyzes
the reactions of aldosugars and aldehydes to alcohols.
Single chain of aldose reductase folds in an α and β barrel with an inner core
of 8 parallel β strands encircled by 8 α-helices as exhibited in figure 1.1. The red core
suits to the β strands and the grey surroundings correspond to the helices.

Figure 1.1: Secondary structure of aldose reductase (Wilson, 1992).
The structure is composed of two short antiparallel β-strands. In addition, it
has an extra piece of α-helix between strand 7 and helix 7 and between strand 8 and
helix 8. (Wilson, 1992; Wilson 1993).
Bovine lens aldose reductase go after an ordered addition of substrates with
NADPH binding first and an ordered release of products with NADP being released
last. (Liu, 1992) The active site of aldose reductase is placed at COOH terminal of
the β barrel. The active site of the aldose reductase has highly hydrophobic residues
and some aminoacids presented in cavity are nonpolar. (Rondeau, 1992; Wilson,
1992 ). In the enzyme –NADPH binary complex, the C-4 of the nicotinamide of
NADPH, the reactive end of the molecule is in close proximity to 3 polar residues
Cys-298, Tyr-48, and His-110, and one of these residues may be the acid-base
catalyst for the oxidation/reduction reactions. Also NADPH is binded to the enzyme
by 19 hydrogen bonds in an extended conformation across the barrel which has the
nicotinamide ring in the center of cavity (Wilson, 1992) .
8

NADPH-Enzyme binary complex is shown in figure 1.2. Two forms of
aldose reductase have been recognized. One of which is activated form and the other
form is unactivated. The activated and unactivated forms of bovine aldose reductase
have different physical and kinetic properties ( Grimshaw 1990; Del Corso 1989 ).
Figure 1.2 : NADPH- enzyme binary complex (Wilson, 1992).
The unactivated form can be activated in presence of glucose, glucose-6-
phosphate and NADPH. The activated form of aldose reductase shows lower Km for
glucose and glyseraldehyde because Vmax increases. In addition, activated form of
aldose reductase has less sensitivity than unactivated forms for aldose reductase
inhibitors. Aldose reductase with high Km demonstrates low activity for
glyceraldehyde (Das, 1985; Ohta, 1993 ).
One of the most functions of aldose reductase is to work as a promoter of the
polyol pathway. In this pathway, glucose is converted to fructose via the sorbitol
formation and aldose reductase is associated with the conversion of sugar to sugar
alcohols. In addition, aldose reductase catalyzes the reduction of hexoses.
9

The formation of fructose via aldose reductase and sorbitol dehydrogenase is
shown in figure 1.3.
Figure 1.3 :The formation of fructose via aldose reductase and sorbitol
dehydrogenase.
Fructose and sorbitol are present in the human lens. Concentration of fructose
and sorbitol increase at diabetes and they may join in the pathogenesis of diabetic
complications. The polyol pathway is responsible for fructose arrangement from
glucose and the glucose concentration increases in tissues that are not insulin
sensitive at diabetes. Glucose passing the cell is rapidly phosphorylated by the
enzyme hexokinase and metabolized via the glycolytic pathway to lactate and
pyruvate to supply major energy sources for the cells. Large amount of glucose is
also metabolized via pentose phosphate pathway in the lens. Nevertheless, the
concentrations of glucose and galactose increase in several folds in diabetes and
galactosemia. The excess glucose can not be metabolized by the glycolysis pathway.
Hence, the aldose reductase is activated and leads to the conversion of glucose to
sorbitol. Hexokinases have higher affinity for glucose than aldose reductases, so
glucose can enter the polyol pathway only when its levels increases (Clarke, 1984 ).
10

Figure 1.4 : Polyol pathway in accordance with Embden–Meyerhof pathway (Ohta, 1993 ; Clarke, 1984).
Sorbitol does not easily diffuse through the cell membranes, so it
accumulates in the cells, causing the osmotic pressure to construct eventually to the
cells burst. Activation of enzyme brings about a NADPH depletion altering the redox
state of the cell and the depletion of antioxidants as a result an increased damage due
to oxidative stress from superoxide and peroxides can be observed (Wood, 1985).
The physiological properties of the polyol pathway are presented by Hers in 1956.
In polyol pathway, produced sugar alcohol is oxidized to ketose by a second enzyme
of the path named NAD+-dependent sorbitol dehydrogenase (SDH). While the
glucose concentration increases, aldose reductase activity raises in several folds.
Nevertheless, the sorbitol dehydrogenase activity does not increase proportionally as
a consequence of sorbitol accumulates in the cell (figure 1.4) (Ohta, 1993).
11
12
High concentrations of sorbitol in the lens can increase the osmotic pressure
and cause cellular swelling with disruption and cell death. Finally, this process
results in lenticular opacity which termed as sugar cataract. Animal experiments
exhibits the dependence of the appearance of the diabetic complications associated
with diabetes on the aldose reductase–initiated accumulation of sugar alcohols
(Crabbe, 1991). In human cornea, aldose reductase has been found in corneal
epithelium and endothelium ( Kador, 1984 ).
The role of aldose reductase in cataract formation through invivo animal
studies has shown by Kinoshita and Hayman (Kinoshita and Hayman, 1965). The
rate of cataract formation is directly dependent upon the levels of aldose reductase
present in the lens ( Varma, 1977).
The pharmaceutical industry has approached the problems of diabetic
complications by searching for possible common links between the various organs
that are damaged. The development of potential medicines has been focused on the
three areas (Raskin, P., 1987).
Aldose reductase inhibitors (ARI s)
Advanced glycation end-product inhibitors (AGEIs)
Other approaches including tissue bioengineering

13
Table 1.1: Tissue localization of aldose reductase and related diabetic complications.
(Raskin, P., 1987).
TISSUE LOCALIZATION
DIABETIC COMPLICATIONS
EYE Lens (Epithelium) Retina (pericytes) Cornea (epithelium)
Cataract Retinopathy Keratopathy
KIDNEY Loop of Henle Collecting tubules, interstitial Cells in inner medula Glomerulus,epithelial cells of the podocyte Mesengial cells Epithelial cells of the distal convuluted tubules
Nephropathy
PERIPHERAL NERVES Schwann cell, axons within myelin sheath
Neuropathy

14
1.3 Inhibition of aldose reductase activity
The studies including inhibition of aldose reductase began in the early 1960s
when first known inhibitor of aldose reductase was determined as a long-chain fatty
acid. In late 1960s, tetramethylene glutaric acid (TMG) was found that it changed the
progression of cataract by modifying the activity of aldose reductase (Kinoshita,
1968). In addition, TMG minimizes the increase in lens hydration and the appearance
of vacuoles but its inability to penetrate the membranes made the compound
ineffective in vivo.
Types of flavonoids were tested for their inhibitory properties in 1970 and all
the flavonoids studied had significant activity for inhibition of aldose reductase.
Among the flavonoids, quercetin, quercitrin and myricitrin were found to be much
more effective as aldose reductase inhibitors than TMG (Kinoshita 1968; Varma
1977). Although it has been known that flavonoids are non-toxic compounds, they
could not made to the clinical trials. Since the mid.-70’s, several studies on the
inhibition of aldose reductase by flavonoids have been reported by the reseach
groups of Varma and Okuda (Varma, 1975; Varma, 1976; Okuda, 1982). 94
flavonoids were examined in order to clarify the further structural requirements of
flavonoids for aldose reductase inhibitory activity and the results suggested that the
flavones and flavonols having the 7-hydoxyl moiety on the A ring showed the strong
activity, the 2-3 double bonds enhanced the activity and the 5-hydoxyl moiety did
not affect the activity (Matsuda, 2002). In the 1990s synthetic aldose reductase
inhibitors were studied in two general classes. One contains a carboxylic acid moiety
and other contains cyclic imide represented by a spirohydantoin or related ring
system (Wrobe, 1991; Yamagish, 1992; Costantino, 1999). Both types of inhibitor
have similar intrinsic activity for aldose reductase but their in vivo potencies are
different. Imides are more potent in invivo because of their better pharmokinetic
properties.
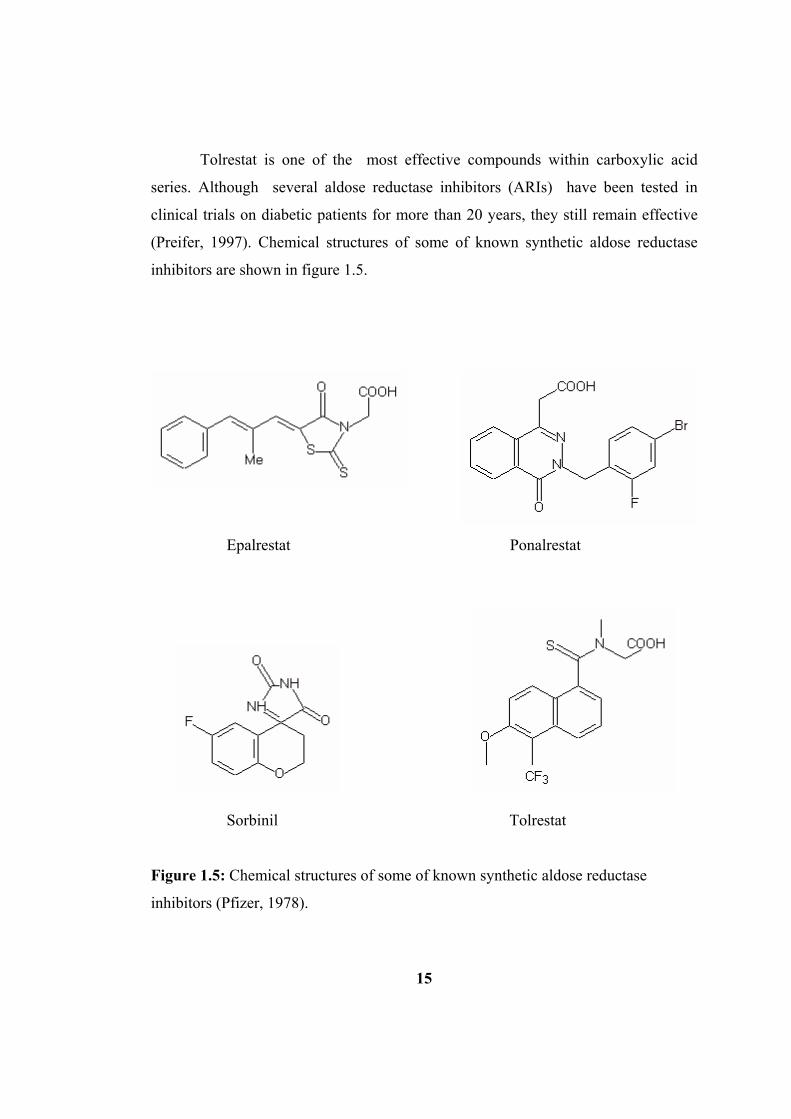
Tolrestat is one of the most effective compounds within carboxylic acid
series. Although several aldose reductase inhibitors (ARIs) have been tested in
clinical trials on diabetic patients for more than 20 years, they still remain effective
(Preifer, 1997). Chemical structures of some of known synthetic aldose reductase
inhibitors are shown in figure 1.5.
15
Epalrestat Ponalrestat
Sorbinil Tolrestat
Figure 1.5: Chemical structures of some of known synthetic aldose reductase
inhibitors (Pfizer, 1978).
16
The majority of inhibitors that have been used for human clinical trials
were the members of carboxylic acid derivatives such as epalrestat, statil,
tolrestat, and ponalrestat containing carbonyl or thiocarbonyl groups. These
reactive groups which tend to accept a pair of electron from the enzyme are
known to lead to the inhibition.
It has also been shown that the inhibition of aldose reductase is dependent
on the degree of purification of the enzyme as well as on the substrate used for
the activity assays (Del Corso, 1989).
Many of compounds have inhibited the aldose reductase reaction, as
measured by the change in absorbance at 340 nm (oxidation of NADPH) , when
oxidizing monosaccharides are used as substrates. The aromatic hydrocarbonyl
groups helps the attachment of the inhibitor (Crabbe, 1991; Kador, 1985).

1.3.1 Aldose reductase inhibitors from plant materials
Flavonoids are polyphenolic compounds that they are seperated into four
groups. These are flavone, flavonol, isoflavone and flavonone. The studies
shows that structural requirements of an aldose reductase inhibitor are more
general. However, the shared feature of all such inhibitors has a hydrophobic
region attached to an acid group. Ligand binding site of aldose reductase was
shown in figure 1.6.
Figure 1.6 : The schematic representation of ligand binding site of aldose reductase
(Miyamoto, 2002).
17
18
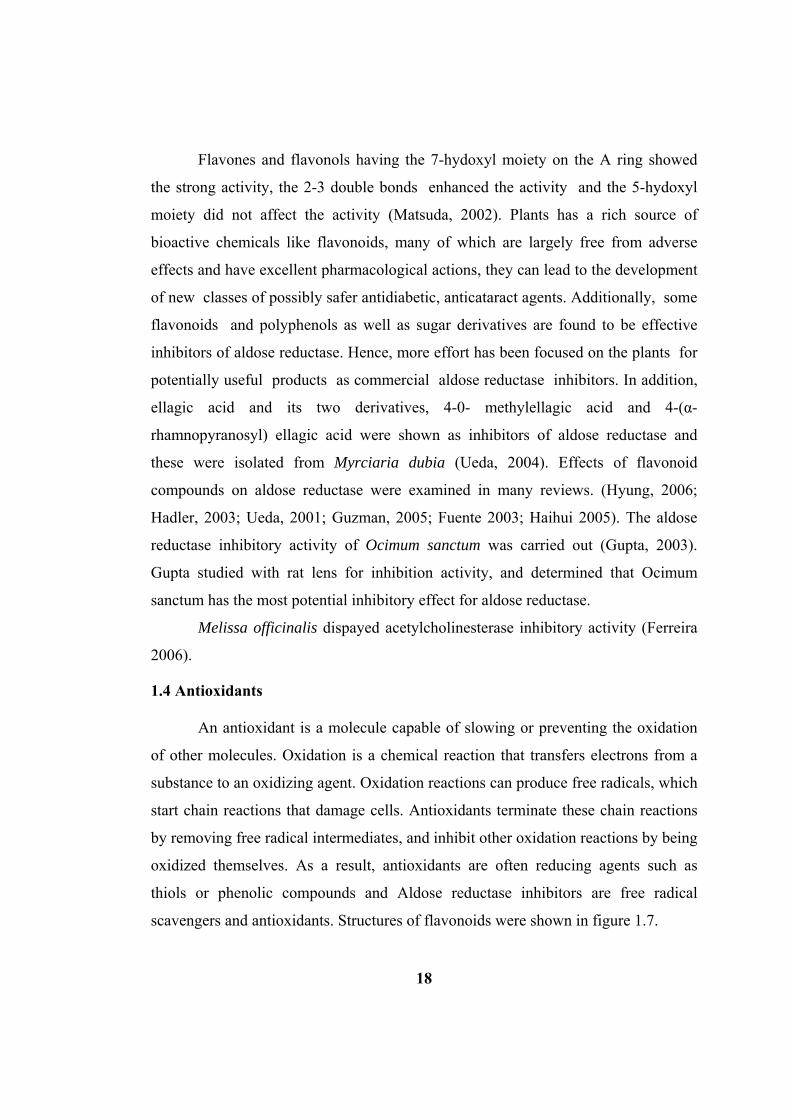
Flavones and flavonols having the 7-hydoxyl moiety on the A ring showed
the strong activity, the 2-3 double bonds enhanced the activity and the 5-hydoxyl
moiety did not affect the activity (Matsuda, 2002). Plants has a rich source of
bioactive chemicals like flavonoids, many of which are largely free from adverse
effects and have excellent pharmacological actions, they can lead to the development
of new classes of possibly safer antidiabetic, anticataract agents. Additionally, some
flavonoids and polyphenols as well as sugar derivatives are found to be effective
inhibitors of aldose reductase. Hence, more effort has been focused on the plants for
potentially useful products as commercial aldose reductase inhibitors. In addition,
ellagic acid and its two derivatives, 4-0- methylellagic acid and 4-(α-
rhamnopyranosyl) ellagic acid were shown as inhibitors of aldose reductase and
these were isolated from Myrciaria dubia (Ueda, 2004). Effects of flavonoid
compounds on aldose reductase were examined in many reviews. (Hyung, 2006;
Hadler, 2003; Ueda, 2001; Guzman, 2005; Fuente 2003; Haihui 2005). The aldose
reductase inhibitory activity of Ocimum sanctum was carried out (Gupta, 2003).
Gupta studied with rat lens for inhibition activity, and determined that Ocimum
sanctum has the most potential inhibitory effect for aldose reductase.
Melissa officinalis dispayed acetylcholinesterase inhibitory activity (Ferreira
2006).
1.4 Antioxidants
An antioxidant is a molecule capable of slowing or preventing the oxidation
of other molecules. Oxidation is a chemical reaction that transfers electrons from a
substance to an oxidizing agent. Oxidation reactions can produce free radicals, which
start chain reactions that damage cells. Antioxidants terminate these chain reactions
by removing free radical intermediates, and inhibit other oxidation reactions by being
oxidized themselves. As a result, antioxidants are often reducing agents such as
thiols or phenolic compounds and Aldose reductase inhibitors are free radical
scavengers and antioxidants. Structures of flavonoids were shown in figure 1.7.

Figure 1.7 : Structure of flavonoid
Aroma compounds in basil leaves (Ocimum basilicum L.) were determined by
gas chromatography (GC) (Lee, 2005). Lee found that 3,7-dimethyl-1,6-octadien-3-
ol, 1-methoxy-4-(2-propenyl) benzene, methyl cinnamate, 4-allyl-2-methoxyphenol,
and 1,8-cineole are the most aroma componenets of Ocimum basilicum and showed
that these compounds have highly antioxidant activities. There are many reviews of
Ocimum sp. and numerous laboratory investigation have studied that these are on
radiation protection (Devi, 2000), chemopreventive activity (Prakash and Gupta,
2000), anti-inflammatory activity (Klem, 2000), a nervous system stimulant effect
(Maity, 2000), bactericidal activity (Koga et al. 1999), modulatory effect on
glutathione and antioxidant enzymes (Devi and Ganasoundari, 1999), antiulcer
activity (Singh, 1999), antidiarrheal effects (Offiah and Chikwendu, 1999), and
blood-sugar lowering (Chattopadhyay, 1999). Antioxidant capacity of free volatile
aglycones from Ocimum basilicum L. was studied and free volatile aglycones
(eugenol, chavicol, linalool and a-terpineol) were used for antioxidant activity
measurements via DPPH test and found that eugenol has the most antioxidant
activity (Politeo 2007).
19
20
Essential oils of O. basilicum display varying array of compounds, relying on
variations in chemotypes, leaf and flower colors, aroma and origin of the plants (Da-
Silva, 2003; Sajjadi, 2006).
1.4.1 Phenolic compounds Phenolic compounds are often found in plants and they have diversity as a
group of phytochemicals. Phenolic compounds cause different functions in plants.
For example, they function as protective agents against UV light, attraction for
pollinators, flavor, color and plant pigmentation. In addition, phenolic compouns
have health-protecting capacities, and oxidative stability. These are advantageous for
producers and consumers (Shahidi, 2004). Structures of flavonoids such as flavones,
flavanones, isoflavonoids and flavonols were exhibited in figure 1.8.
Although lemon balm antioxidant studies have been carried out, studies
reporting upon the antioxidant activity of polar extracts of lemon balm are limited
(Hohman, Zupko, Redei, & Csanyi, 1999; Ivanova, Gerova, Chervenkov, &
Yankova, 2005; Triantaphyllou, Blekas, & Boskou, 2001; Venkutonis, Gruzdiene,
Trizite, & Trizite, 2005). The leaf material of lemon balm (Melissa officinalis L.) was
extracted in aqueous ethanol and studied for antioxidant activity and total phenol
content by Dastmalchi. Melissa officinalis L. extract included hydroxycinnamic acid
derivatives and flavonoids with caffeic acid, m-coumaric acid, eriodictyol-7-O-
glucoside, naringin, hesperidin, rosmarinic acid, naringenin, hesperetin. It was found
that Melissa officinalis L. contains highly antioxidant activity (Dastmalchi, 2008).
Bouayed examined Iranian medicinal plants (leaves of Lavandula officinalis
and of Melissa officinalis) and it was shown that they exhibited important
antioxidant activities and present a good source of natural antioxidants. 6.18 ± 0.18
(catechinequivalent (CE) mg CE/g dw) and 10.0 ± 0.32 (catechinequivalent (CE) mg
CE /g dw) respectively. (Bouayed, 2007). Total phenol content of Bulgarian Melissa
officinalis was found as 1370.09 ± 41.38 (µM) quercetin equivalents (QE) (µM)
(Ivanova, 2005).

21
The antioxidant activity of water and ethanol extracts of lavender showed
strong total antioxidant activity. At the concentrations of 20, 40, and 60 µg/ml, water
extract of lavender showed 86.9 %, 92.3%, and 94.8 % inhibition on lipid
peroxidation of linoleic acid emulsion, respectively. At the same concentrations,
ethanol extract of lavender exhibited 92.5 %, 93.8 %, and 96.5 % inhibition,
respectively.Total phenol content of water extract of lavender was found as 153.92
µg GAE and total phenol content of ethanol extract of lavender was 226.74 µg GAE
(Gulcin, 2004). Total phenol content of water extract of leaves of Lavandula
officinalis was exhibited as 16.2 ± 0.59 (mg GAE/g dw ) (gallic acid equivalent
(GAE) per 1 g dry weight) (Bouayed, 2007). Lavandula vera (Lamiaceae) phenolic
constitution was investigated by reversed phase high performance liquid
chromatography. Metanolic extract of Lavandula vera were composed of phenolic
compounds such as gallic acid, p-hydroxybenzoic acid, (+) catechin, vanillic acid,
caffeic acid, ferulic acid and naringenin (Proestos, 2006). Lavandula angustifolia
were used to identify their radical scavenging activity using DPPH and the content of
total phenolic compounds. Ethyl acetate,acetone and methanol extract of Lavandula
angustifolia were found for DPPH % inhibition as 2.5 %, 7.4 %, 35.4 %,
respectively. Total phenol content of methanol extract of Lavandula angustifolia was
shown as 5.4 mg/g plantextract(in GAE). (Miliauskas, 2004).
Phytochmical components of Glycyrrhiza glabra water extracts were
examined and they have composed of glycyrrhizin, asparagin, sugar, starch, acid
resin, flavones, coumarins (Naik, 2003).
Ethanolic extracts from the roots of wild licorice (Glycyrrhiza lepidota) were
examined for their free-radical scavenging capacity and their antioxidant activity.
Total phenolic content of Glycyrrhiza lepidota was found as 63 mg/g catechin
equivalents/g of extract (Amarowicz, 2004).

22
Analysis of flavonoid composition of Tilia. tomentosa (argentea) were
studied and quercetin-3,7-dirhamnoside, isoquercitrin-rutin, quercitrin, astragalin,
tiliroside from T. argentea flowers were found as flavonoid. Quercetin-3,7-
dirhamnoside,isoquercitrin-rutin,kaempferol-3,7-dirhamnoside,astragalin,quercitrin,
tiliroside from T.argentea bracts were shown as flavonoid. Quercetin-3,7-
dirhamnoside, isoquercitrin-rutin, kaempferol-3,7-dirhamnoside, quercitrin,
astragalin from T. argentea leaves were exhibited as flavonoid ( Toker, 2001).
Flavonoid composition of T. platyphyllos were analyzed quercetin-3,7-
dirhamnoside, isoquercitrin-rutin, quercitrin, astragalin from T. platyphyllos flowers
were found as flavonoid. Hyperoside, quercetin-3,7-dirhamnoside, isoquercitrin-
rutin, kaempferol-3,7 dirhamnoside, quercitrin, astragalin from T. platyphyllos bracts
were exhibited as flavonoid. Hyperoside, quercetin-3,7-dirhamnoside, isoquercitrin-
rutin, quercitrin, kaempferol-3,7 dirhamnoside, astragalin from T. platyphyllos leaves
were shown as flavonoid. ( Toker, 2001).
Analysis of flavonoid composition of T. rubra were investigated and
quercetin-3,7-dirhamnoside, isoquercitrin-rutin, quercitrin, astragalin from T. rubra
flowers were found and quercetin-3,7-dirhamnoside, isoquercitrin-rutin, astragalin,
kaempferol-3,7 dirhamnoside, quercitrin from T. rubra bracts were shown also
quercetin-3,7-dirhamnoside, isoquercitrin-rutin, astragalin, kaempferol-3,7
dirhamnoside, quercitrin from T. rubra leaves were exhibited as flavonoid. ( Toker,
2001).

Flavone Flavonol
Isoflavone Flavonone
Figure 1.8: Structures of flavone, flavonol, isoflavone and flavonone.
23

24
1.4.2 Free Radicals
Free radicals act with one or more unpaired electrons in their construction
(Halliwell, 1995). Some examples of free radicals are oxides of nitrogen,
hydrogen peroxyl, hydroxyl and superoxide. Free radicals can naturally or
artificially occur in biological systems. Artificial free radical arrangements
forming from enviromental factors can induce chain reactions in vivo systems.
For example, lipid peroxidation causes strong damages to lipid membranes and
inner compositions of cells. Free radicals cause cross-linkage of
macromolecules such as nucleic acids. Free radicals are highly responsible for
aging and tumor production (Penzes, 1984).
1.5 Scope of the study Diabetes has been studied to be one of the major risk factors of cataract (Lee,
2002). Aldose reductase in diabetes has been examined elaborately because
inhibitors of aldose reductase are known to prevent cataractogenesis. This study was
designed to investigate the bovine lens aldose reductase enzyme activity and to
evaluate the inhibitory effects of plant extracts in the enzyme assay. Bovine lens was
selected as the source of AR since the cattle are slaughtered mosty on daily bases in
our country,so we can find them for our experiments. For this reason, bovin lens
aldose reductase was isolated by centrifugation and ammonium sulfate precipitation.
Assay is used for determination of aldose reductase activity by monitoring the
reduction of NADPH to NADP+ at 340 nm spectrophotometrically. The optimum
conditions such as substrate concentration, protein amount, pH, coenzyme
concentration and the effect of temprature were examined. Inhibitory effects of
Ocimum basilicum, Lavandula stoechas, Melissa officinalis, Glycyrrhiza glabra L.
and Tilia tomentosa ethanol and ethylacetate extracts were determined on the crude
bovine lens aldose reductase. They were expressed as % 50 inhibition concentration.
Furtermore, antioxidative activities of ethanol and ethyl acetate extracts were studied

25
and 50 % effective concentrations of plant extracts were calculated. Also, the total
phenol contents of the plant extracts were determined .

26
CHAPTER 2
MATERIAL AND METHOD
2.1 Materials
2.1.1 Chemicals
Bovine serum albumin (BSA), β-nicotinamide adenine dinucleotide
phosphate, reduced form ( NADPH ), DL-glyceraldehyde, lithium sulfate (Li2S04 ),
folin-phenol reagent, dimethylsulfoxide (DMSO), membrane dialysis tubing, 2,2-
diphenyl-1-picrylhydrazyl (DPPH), quercetin and gallic acid as standards were all
purchased from Sigma Chemical Company, Saint Louis ,Missouri,USA.
Ammonium sulfate [(NH4)2SO4 ], sodium chloride (NaCl), Na –K tartarate,
Cupper sulfate (CuS04 ), Sodium bicarbonate ( Na2C03 ), EDTA, Sodium Hydroxide
(NaOH), NaHC03, ethyl acetate and ethanol of analytical grade, reagents and solvents
were purchased from Merck (Darmstadt, Germany) and water distilled twice was
purified by using a Milli – Q system (Millipore, Bedford, MA, USA). 125mm pore
size white band filter.
Ocimum basilicum (Sweet Basil), Lavandula stoechas (Lavender), Melissa
officinalis (Sweet Balm), Glycyrrhiza glabra L. (Liquorice) and Tilia tomentosa
(Linden).

27
2.1.2 Apparatus
All of the spectroscopic data as enzyme kinetic, determination of total
phenolic contents and free radical scavenging activity measurements were obtained
with Cary 50 Bio UV-VIS spectrophotometer (Varian).
Several instruments used for the experiments are rotary evaporator (Heidolph
Laborota 4000), homogenizer (Heidolph Diax 900), lyophilizator (Heto-
Holten Model Maxi-Dry Lyo), waring blender model 32BL80 (New Hartford, CT,
USA); bandelin Sonorex (ultrasonic bath), Optic Ivymen System (incubator)
Laborota 4000), centrifuge (Sigma 3K30 with 12159 rotor).
2.2 METHODS
2.2.1 Preparation of aldose reductase crude extract from bovine lens
The bovine eyes were obtained from abattoir ( Kazan Belediye Mezbahası,
Ankara ) immeddiately after slaughtering, then they were put into crushed ice. As
soon as the eyes were reached to laboratory, lenses were excised from the eyes and
washed with cold ultra pure water. The lenses were weighted and homogenized in
nearly three volumes of cold ultra pure water by the Heidolph Diax 900, and
centrifuged (Sigma 3K30) by using 12159 rotor at 4 ºC, 10,000 x g for 30 minutes to
remove insoluble material.
The supernatant was saturated with ammonium sulfate to 40 % and saturated
sample was centrifuged at 10,000 x g for 25 minutes. Pelet was discarded and
supernatant was brought to 50 % ammonium sulfate saturation to remove additional
proteins. Then the saturated sample with 50 % ammonium sulfate was centrifuged at
10,000 x g for 25 minutes and pellet was discarded again. Supernatant was taken and
saturated with 75 % ammonium sulfate at 10,000 x g for 25 minutes. Saturated
sample was centrifuged at 10,000 x g for 25 minutes. In the final step, supernatant
was discarded and pellet was taken. The pellet was dissolved in 50 mM NaCI
28
solution. The volume of the suspension was recorded and the sample was dialyzed
overnight against 50 mM NaCI (double replacement of dialysis solution).
After dialysis, the volume of the sample was recorded and treated to liquid
nitrogen then samples were stored in 1 mL aliquots in eppendorf tubes in deep
freezer at -80 ºC for the determination of the total protein, enzyme activity and
inhibition studies.
2.2.2 Preparation of crude fractions from the plant extracts
Ocimum basilicum, Lavandula stoechas, Melissa officinalis, Glycyrrhiza
glabra L, and Tilia tomentosa were taken and dried at room temprature then finely
grounded to increase air-surface area by Waring Blender (model 32BL80). Plant
samples (20 g) were three times extracted in 1:10 ratio of ethanol and ethyl acetate
for 24 hours at rocking incubator (Optic Ivymen System) at 30 °C temperature.
Mixtures were filtered through a double layered cheese cloth. Then, samples were
filtered with a rough filter paper. Next, solvents of plants were evaporated by rotary
evaporator (Heidolph Laborota 4000) at 35 °C until mixtures remained to 50 mL of
solvents. Afterwards, mixtures including 50 ml of solvent settled to lyophilizator
(Heto-Holten Model Maxi-Dry Lyo) to dry plant extracts completely. Dried extracts
were weight out and the percent yield of extraction was calculated then stored at 4
°C.

29
2.2.3 Analytical procedures
2.2.3.1 Protein determination
Protein concentration of sample was examined by means of the method of
Lowry (Lowry, 1951) by using the crystalline BSA as a standard. To obtain a
calibration curve, five different concentrations of standard BSA’s were used. 0.02-
0.2 mg BSA/mL were taken into test tubes with a final volume of 0.5ml.
The aliquots of 0.1, 0.25, 0.5 mL of diluted samples were put into test tubes
and were completed to final volume of 0.5 mL with ultra pure water. All tubes were
mixed with 2.5 ml alkaline-copper reagent prepared with adding 2 % copper sulfate,
2 % sodium potassium-tartarate and 0.1 M NaOH containing 2% sodium carbonate
in a ratio of 1:1:100 respectively. Then all of the test tubes including alkaline-copper
reagent were vortexed and waited for 10 minutes at room temprature. Finally, 0.25
ml of 1 M folin-phenol reagent prepared freshly was added to test tubes. Each tubes
directly was mixed (8 second) as soon as 0.25 mL of 1 M folin-phenol reagent was
added to test tubes. After the test tubes were left for 30 minutes at room temprature,
the change of color was observed in each test tube and the optical density of each
tube was measured at 660 nm with spectrophotometer (Cary 50 Bio UV-VIS)
(Varian).
The standard calibration curve of 0-0.2 mg BSA/mL was plotted and shown in
figure 2.1. Then, the protein concentration of the sample was determined with
standard calibration curve.

00.050.1
0.150.2
0.250.3
0.350.4
0.450.5
0 0.05 0.1 0.15 0.2 0.25
BSA concentration(mg/ml)
Abso
rban
ce a
t (66
0nm
)
Figure 2.1 : BSA standard calibration curve for protein determination.
2.2.3.2. Determination of aldose reductase enzyme activity
The aldose reductase enzyme activity was spectrophotometrically measured
by means of the method of Kinoshita (Kinoshita et al 1965). This method is based on
the reduction of DL- gyceraldehyde as a substrate to glycerol by enzyme which is
aldose reductase during the oxidation of Nicotinamide adenine dinucleotide
phosphate (NADPH) to NADP+. The oxidation of NADPH was
spectrophotometrically followed at 340 nm using spectrophotometer. In our study,
partially purified bovine lens extracts were taken as the enzyme source. (As
described in methods section).
All of components were put into the reaction mixture with the given order
was shown in Table 2.1. Determination of aldose reductase enzyme activity was
applied for five minutes to each reaction cuvette. Absorbance immediately was
measured at 340 nm before substrate, glyceraldehyde, was added. Then, after
30

31
substrate was added in cuvette, three minutes incubation time was maintained and the
decrease in absorbance was measured once again at 340 nm. Under the same
conditions, a blank solution was prepared without the substrate and the background
corrections were made.
The assay mixture contained final concentrations of 6x10⁻⁵ M DL-
Glyceraldehyde as substrate solution, 1x10⁻⁴ M NADPH prepared freshly, 1.43
mg/ml protein containing crude enzyme solution, 270 mM Li2S04 , and 30 mM
potassium phosphate buffer pH 6.7 in a final volume of 1.0 mL, is shown in table
2.1.
Table 2.1 : The components of assay mixture for aldose reductase
Components Volume Added
(µL)
Final
Concentration
Glyceraldehyde 40 6x10⁻⁵ M
NADPH 50 1 x 10⁻⁴ M
Enzyme Solution * 1.43 mg/mL
Li2S04 135 270mM
pH 6.7 Phosphate
Buffer
600 30 mM
dH20 To complete final
volume to 1 mL
*
Total volume 1 mL *

32
The specific activity was written as nmole NADPH oxidized per minute per
mg protein per mL. One unit of enzyme was defined as amount of enzyme catalyzing
the oxidation of 1 nmole NADPH per minute.
Background measurement, the slope of the reaction and the extinction
coefficient of NADPH (6220 mM-1) were taken for the calculation of aldose
reductase activity.
Sample Δ OD (340) - Blank ΔOD (340)
Specific Activity (nmole . min-1. (mg/mL) -1 = --------------------------------------------
ε340(NADPH).[protein]

33
2.2.3.3 Inhibition of bovine lens aldose reductase
Various concentrations of extraction samples obtained in ethylacetate and
ethanol solvents by extraction method were used for testing inhibitions on bovine
lens aldose reductase and the volume of the test cuvette was completed to 1 mL with
ultra pure water.
All of the ethylacetate and ethanol extracts were dissolved in 5 %
dimethylsulfoxide (DMSO). The concentrations of these extracts were prepared by
serial dilution of the stock solutions in 5 % DMSO. Various concentration of DMSO
was added in the assay mixture to keep amount of DMSO constant. Each extract
with DMSO content was added in test tube for measurement of bovine lens aldose
reductase enzyme activity. This activity was considered as control activity. The
content of final DMSO below 1 % had a little effect on the measurement of aldose
reductase activity, which could be ignored on the measurement of the enzyme
activity.
The standard assay mixture was used in our study. All of the components of
the assay mixture and various concentrations of extract samples were put in assay
cuvette and completed to 1mL with ultra pure water. Absorbances of these processes
were measured at 340 nm and the results were taken as absorbances of samples at
340nm. All components of the assay mixture without dl-glyceraldehyde and various
concentrations of extract sample were mixed in assay cuvette and completed to 1 mL
with ultra pure water. Absorbances of these components were measured at 340 nm
and the results were used as absorbances of blanks. All components of the assay
mixture and various concentrations of DMSO were used in assay cuvette and
completed to 1mL with ultra pure water. Absorbances of these components were
measured at 340 nm and the results were taken as absorbances of controls.

The percentage inhibitions of aldose reductase activities of extract samples
were calculated from the below formula:
(Δ OD340 control - Δ OD340 sample ) * 100
Percentage Inhibition (%) =
Δ OD340 control
The inhibitor effects of the extract samples were expressed as the 50 % inhibitory
concentration ( IC50 µg/mL).
34

2.2.4 Antioxidant activities of plant extracts
2.2.4.1 DPPH method (Free Radical Scavenging Activity)
2,2-diphenyl-1-picrylhydrazyl (DPPH) method was used by Blois (1958) for
determining the free radical scavenging activities of samples and chemicals. DPPH is
the purple-colored stable free radical reduced into the yellow colored diphenylpicryl
hydrazine by giving a hydrogen from the compounds found in extracts. Reaction
existing is shown in figure 2.2.
0.05 mg of DPPH was dissolved in 1 mL of ethanol.Then, 1.4 mL of DPPH
ethanol solution was put into eppendorf. Absorbance of DPPH ethanol solution was
recorded at 517 nm and obtained about 1.3 unit of absorbance.
Ethylacetate and ethanol extracts were dissolved in ethanol. Various
concentrations of extracts were prepared and 0.1 mL of extract solutions was added
to 1.4 mL of DPPH ethanol solution. Absorbances of samples were measured in 5
min-incubation time at 517 nm. In the same condition, blank incuding ethanol
instead of extract solution was prepared and results were recorded at 517 nm.
Free radical scavenging activity effects of ethylacetate and ethanol extracts
were calculated as formula below.
(Δ OD517 control - Δ OD517 sample ) x 100
DPPH radical scavenging (%) =
Δ OD517 control
Δ OD517 control : is the absorbance of the control with ethanol
Δ OD517 sample : is the absorbance of the ethylacetate and ethanol extracts dissolved in
ethanol.
35
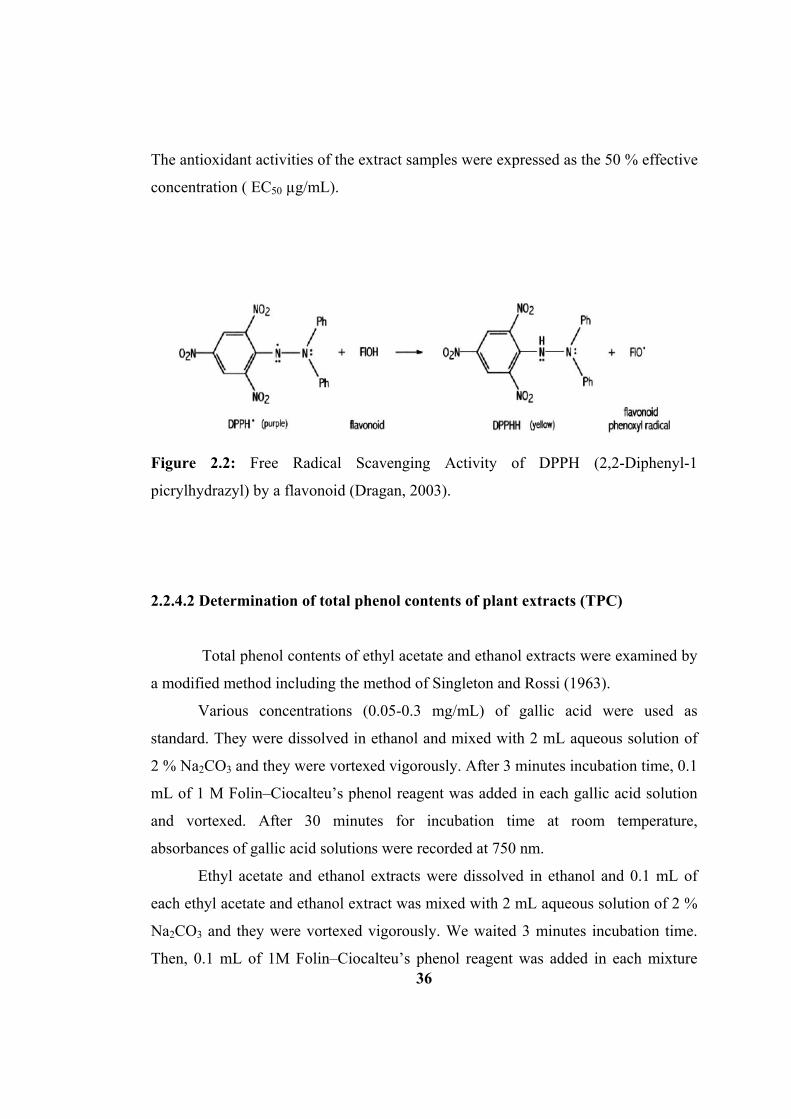
The antioxidant activities of the extract samples were expressed as the 50 % effective
concentration ( EC50 µg/mL).
Figure 2.2: Free Radical Scavenging Activity of DPPH (2,2-Diphenyl-1
picrylhydrazyl) by a flavonoid (Dragan, 2003).
2.2.4.2 Determination of total phenol contents of plant extracts (TPC)
Total phenol contents of ethyl acetate and ethanol extracts were examined by
a modified method including the method of Singleton and Rossi (1963).
Various concentrations (0.05-0.3 mg/mL) of gallic acid were used as
standard. They were dissolved in ethanol and mixed with 2 mL aqueous solution of
2 % Na2CO3 and they were vortexed vigorously. After 3 minutes incubation time, 0.1
mL of 1 M Folin–Ciocalteu’s phenol reagent was added in each gallic acid solution
and vortexed. After 30 minutes for incubation time at room temperature,
absorbances of gallic acid solutions were recorded at 750 nm.
36
Ethyl acetate and ethanol extracts were dissolved in ethanol and 0.1 mL of
each ethyl acetate and ethanol extract was mixed with 2 mL aqueous solution of 2 %
Na2CO3 and they were vortexed vigorously. We waited 3 minutes incubation time.
Then, 0.1 mL of 1M Folin–Ciocalteu’s phenol reagent was added in each mixture

37
and vortexed mixture. We waited 30 minutes for incubation time at room
temperature. Absorbances of samples were recorded at 750 nm. The results obtained
from absorbances were recorded as miligrams of total phenolics including in
miligrams of extract as the gallic acid equivalents (GAE).
2.2.5 Statistical calculation
All of results are expressed as mean ± standard deviation (SD) and levels of
significance were determined by regression analysis of variance using Minitab and
plotted.

38
CHAPTER 3
RESULTS AND DISCUSSION
3.1 Weights of bovine lenses
Bovine lenses obtained from abattoir were excised from the eyes and washed
with cold ultra pure water. Then, they were weighed and weight of average bovine
lens was found as 2.06 g ± 0.04 (Mean ± SD, n=10).
3.2 Bovine lens aldose reductase activity
The bovine lens aldose reductase activity was examined according to the
method of Kinoshita (Hayman; Kinoshita 1965) as described under ”Methods”.
Crude extracts of the bovine lens homogenate were used as enzyme sources.
Aldose reductase activity was determined in the crude extracts prepared from
64 bovine lenses. Among the pooled lens extracts, the lowest activity was measured
as 1.043 nmole NADPH oxidized /min/ mg protein and the highest activity was
measured as 1.256 nmole NADPH oxidized /min/ mg protein.
The average aldose reductase activity calculated as 1.135 ± 0.058 ( Mean ±
SD, n=10 ) nmole NADPH oxidized /min/ mg protein.
3.3 Storage stability of aldose reductase activity
In order to determine effect of storage duration on the activity of lens aldose
reductase, % AR activity was plotted versus duration time in weeks. Crude extracts
from bovine lenses were divided into 1.5 mL of alliquots in eppendorf tubes which
were treated in liquid nitrogen and stored at (-80 o C). Figure 3.1 shows the weeks of

stability of the enzyme. At the given weeks of storage, one of the alliquots was
thawed and the aldose reductse activity was determined as explained under
”Methods”.
Thawing the sample once did not affect the aldose reductase activity
significantly, but second thawing of the crude extract resulted in approximately 14
% loss of activity. Therefore, the measurements of the enzyme activity were
performed using the samples thawed only once.
0
20
40
60
80
100
120
0 1 2 3 4 5 6 7 8
% B
LAR
Act
ivity
Time (weeks)
Effect of Storage
Figure 3.1: Storage stability of the bovine lens aldose reductase activity. Samples
were stored in eppendorf tubes in small alliquots at -80 ºC. The data determined are
mean of duplicate measurements obtained from at least three seperate experiments.
39

40
The bovine lens aldose reductase activitity was measured in the reaction
medium containing 1.43 mg/mL protein containing crude enzyme solution, 6x10⁻⁵
M DL-glyceraldehyde as substrate solution, 1x10⁻⁴ M NADPH prepared freshly,
270 mM Li2S04, and 30 mM potassium phosphate buffer at of pH 6.7 in a final
volume of 1.0 mL.
The bovine lens aldose reductase activity was stable only for 4 weeks;
afterwards, it recessed to nearly 91.1 % at the 5th week, 86.1 % at the 6th week,
82.8 % at the 7th week, and 81.2 % at the 8 th week when activities compared to the
initial enzyme activity.

3.4 Characterization of bovine lens aldose reductase activity
3.4.1 The time course of bovine lens aldose reductase activity
The reaction that is catalayzed by aldose reductase exists by means of
NADPH oxidation and DL-gleyceraldehyde reduction, whose, the time course of
activity was shown figure 3.2.
0.25
0.27
0.29
0.31
0.33
0.35
0.37
0.39
0 200 400 600 800
Abso
rban
ce a
t (34
0nm
)
Reaction Time (sec)
Figure 3.2: The time course of bovine lens aldose reductase enzyme activity.
Reactions were examined at 25 ºC as described in the methods.
41

3.4.2 Effect of protein amount on the enzyme activity
The effect of the enzyme amount on BLAR activity was measured by
changing the final protein concentration in the 1 mL reaction mixture. The protein
amount in reaction cuvette was varied from 0.31 mg to 3.48 mg. It was found that the
reaction rate was proportional with the enzyme amount up to 2.25 mg protein in 1
mL reaction mixture. In order to obtain enough quantity of product for
spectrophotometric determination , 1.43 mg of protein routinely used throughout in
this study. Effect of protein amount on the BLAR activity was shown in figure 3.3.
The BLAR activities were measured in the reaction medium containing different
concentrations of protein including crude enzyme solution, 6x10⁻⁵ M DL-
glyceraldehyde as substrate solution, 1x10⁻⁴ M NADPH freshly prepared, 270 mM
Li2S04, and 30 mM PBS at a pH of 6.7 in the final volume of 1.0 mL.
0 .0 0 .5 1 .0 1 .5 2 .0 2 .5 3 .0 3 .5 4 .00 .0
0 .5
1 .0
1 .5
2 .0
2 .5
3 .0
Enz
yme
Act
ivity
(nm
ol/m
in/m
l)
P ro tein C o n cen tratio n (m g /m l)
Figure 3.3: Effect of the enzyme amount on bovine lens aldose reductase
activity. The values were expressed as Mean ± SD. Data determined are mean of
duplicate measurements obtained from at least three seperate experiments.
42
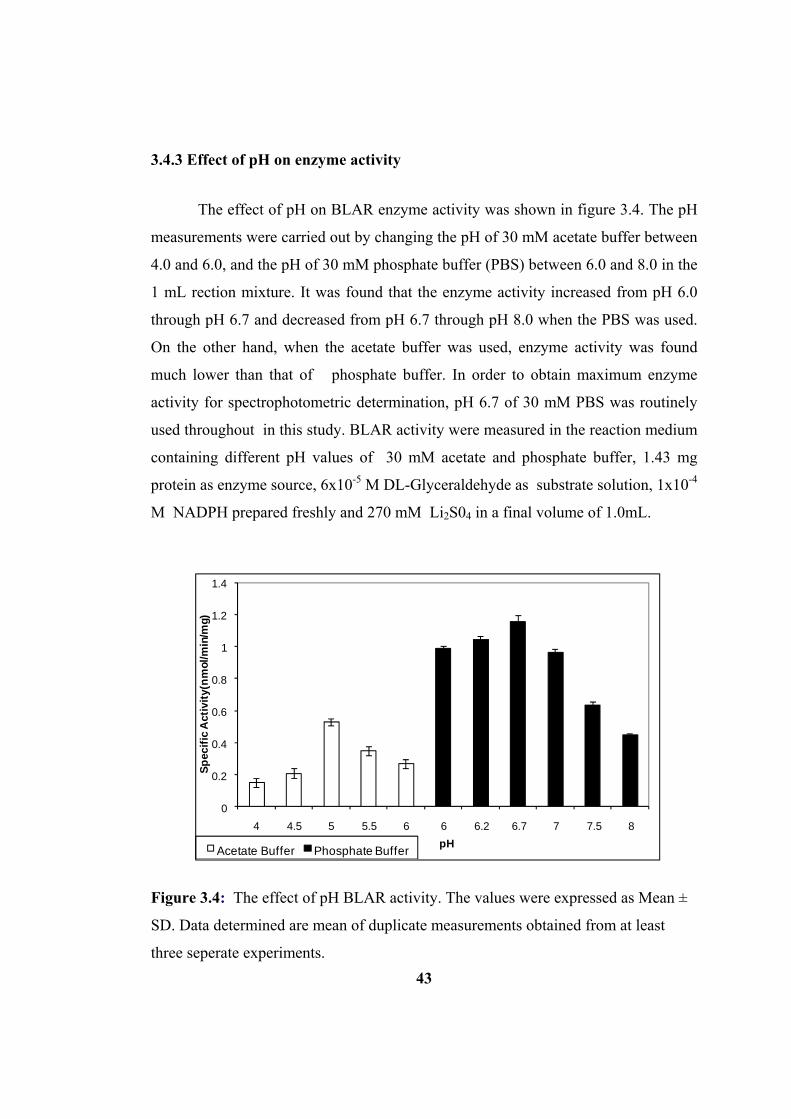
3.4.3 Effect of pH on enzyme activity
The effect of pH on BLAR enzyme activity was shown in figure 3.4. The pH
measurements were carried out by changing the pH of 30 mM acetate buffer between
4.0 and 6.0, and the pH of 30 mM phosphate buffer (PBS) between 6.0 and 8.0 in the
1 mL rection mixture. It was found that the enzyme activity increased from pH 6.0
through pH 6.7 and decreased from pH 6.7 through pH 8.0 when the PBS was used.
On the other hand, when the acetate buffer was used, enzyme activity was found
much lower than that of phosphate buffer. In order to obtain maximum enzyme
activity for spectrophotometric determination, pH 6.7 of 30 mM PBS was routinely
used throughout in this study. BLAR activity were measured in the reaction medium
containing different pH values of 30 mM acetate and phosphate buffer, 1.43 mg
protein as enzyme source, 6x10⁻⁵ M DL-Glyceraldehyde as substrate solution, 1x10⁻⁴
M NADPH prepared freshly and 270 mM Li2S04 in a final volume of 1.0mL.
0
0.2
0.4
0.6
0.8
1
1.2
1.4
4 4.5 5 5.5 6 6 6.2 6.7 7 7.5 8
Spec
ific
Act
ivity
(nm
ol/m
in/m
g)
pHAcetate Buffer Phosphate Buffer
Figure 3.4: The effect of pH BLAR activity. The values were expressed as Mean ±
SD. Data determined are mean of duplicate measurements obtained from at least
three seperate experiments. 43

3.4.4 Effect of Li2SO4 amount on enzyme activity
Li2SO4 was used as an activator. Also, Li2SO4 is necessary for correct aldose
reductase activity results. Aldehyde reductase II found in the crude protein mixture
reduces aldehydes and oxidizes NADPH like aldose reductase (Das, 1985). The
effect of Li2SO4 concentration on BLAR was shown figure 3.5. In absence of
Li2SO4, BLAR activity was found 0.33±0.02 nmole/min/mg. In precence of Li2SO4,
BLAR activity incerased while Li2SO4 concentration was increasing.
0
0.2
0.4
0.6
0.8
1
1.2
1.4
0 50 100 150 200 250 270 300
Enz
yme A
ctiv
ity(n
mol
/min
/mg)
Salt Concentration(mM)
Figure 3.5: The effect of Li2SO4 concentration on BLAR. The values were
expressed as Mean ± SD. Data determined are mean of duplicate measurements
obtained from at least three seperate experiments.
44

45
Li2SO4 concentration was increased from 50 mM to 300 mM to find spesific
enzyme activities and specific enzyme activities were varied from 0.74±0.03 to
1.23±0.01. When Li2SO4 concentration was increased from 50mM to 270 mM,
specific enzyme activity raised proportionally and it was found as 1.20±0.02 at 270
mM. Then, the specific enzyme activity did not change much when Li2SO4
concentration was increased. Therefore, we used Li2SO4 concentration at 270 mM
for further studies.
BLAR activity was carried out in the reaction medium containing different
concentrations of Li2SO4, 1.43 mg protein as enzyme source, 6x10⁻⁵ M DL-
Glyceraldehyde as substrate solution, 1x10⁻⁴ M NADPH prepared freshly and pH
6.7 of 30 mM PBS in a final volume of 1.0 mL.
3.4.5 The effect of glyceraldehyde concentration on enzyme activity
The effects of substrate glyceraldehyde concentration on BLAR were
measured by changing glyceraldehyde concentration. Glyceraldehyde concentration
was changed from 3 µM to 105 µM to find spesific enzyme activities and specific
enzyme activities were varied from 0.21±0.03 to 1.22±0.06. BLAR activity reached
to saturation at nearly 60 µM glyceraldehyde. As glyceraldehyde concentration was
further increased, enzyme activity did not show a significant difference. Therefore,
60µM was used as the optimum concentration of substrate for further study. The
effect of substrate concentration was shown in figure 3.6.

0 20 40 60 80 100 1200.0
0.2
0.4
0.6
0.8
1.0
1.2
1.4Sp
esifi
c A
ctiv
ity (n
mol
/min
/mg)
G lyceraldehyde C oncentration (µM )
Figure 3.6: The effect of glyceraldehyde concentration on the enzyme activity.
The values were expressed as Mean ± SD. Data determined are mean of duplicate
measurements obtained from at least three seperate experiments.
46

y = 11.94x + 0.728R² = 0.993
0
1
2
3
4
5
6
-0.1 0 0.1 0.2 0.3 0.4 0.5
1/V
Spec
ific
Act
ivity
1/
(nm
ol/m
in/m
g)
1/Glyceraldehyde(1/µM)
Figure 3.7: Lineweaver-Burk plot of BLAR activity against glyceraldehyde.
Meanwhile, Vmax and Km values of BLAR were calculated for glyceraldehyde
by plotting Lineweaver-Burk plot. While Vmax for glyceraldehyde was found as
1.372 nmol/min/mg, Km was calculated as 16.39 µM, which was illustrated by
Lineweaver-Burk plot in figure 3.7.
BLAR activity was measured in the reaction medium containing different
concentrations of DL-Glyceraldehyde as substrate, 1.43 mg protein as enzyme
source, 1x10⁻⁴ M NADPH prepared freshly, pH 6.7 of 30mM PBS and 270 mM
Li2S04 in a final volume of 1.0 mL.
47
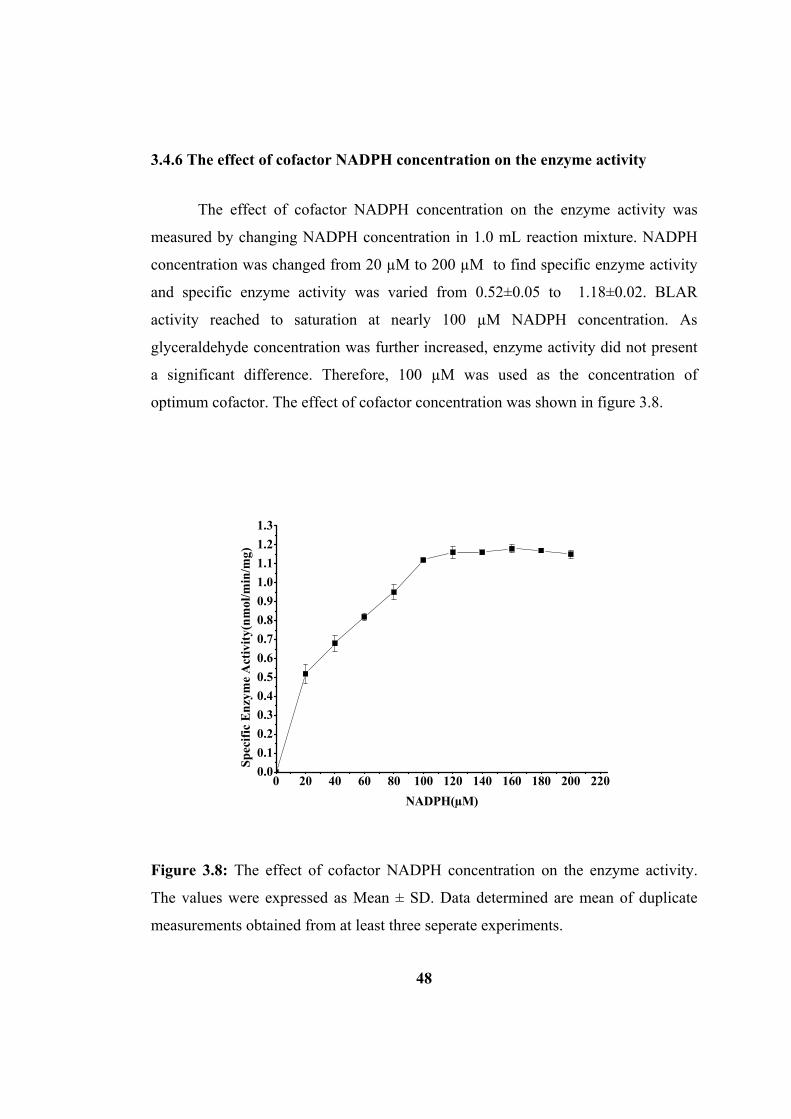
3.4.6 The effect of cofactor NADPH concentration on the enzyme activity
The effect of cofactor NADPH concentration on the enzyme activity was
measured by changing NADPH concentration in 1.0 mL reaction mixture. NADPH
concentration was changed from 20 µM to 200 µM to find specific enzyme activity
and specific enzyme activity was varied from 0.52±0.05 to 1.18±0.02. BLAR
activity reached to saturation at nearly 100 µM NADPH concentration. As
glyceraldehyde concentration was further increased, enzyme activity did not present
a significant difference. Therefore, 100 µM was used as the concentration of
optimum cofactor. The effect of cofactor concentration was shown in figure 3.8.
0 20 40 60 80 100 120 140 160 180 200 2200.00.10.20.30.40.50.60.70.80.91.01.11.21.3
Spec
ific
Enz
yme
Act
ivity
(nm
ol/m
in/m
g)
NADPH(µM)
Figure 3.8: The effect of cofactor NADPH concentration on the enzyme activity.
The values were expressed as Mean ± SD. Data determined are mean of duplicate
measurements obtained from at least three seperate experiments.
48

Then, Vmax and Km values of bovine lens aldose reductase were examined for
cofactor NADPH by plotting Lineweaver-Burk plot. While Vmax for cofactor
NADPH was calculated as 1.4 nmol/min/mg, Km was found as 35.81 µM, which was
illustrated by Lineweaver-Burk plot in figure 3.9.
Figure 3.9: Lineweaver-Burk plot of BLAR activity against cofactor (NADPH).
y = 25.49x + 0.712R² = 0.967
0
0.3
0.6
0.9
1.2
1.5
1.8
2.1
2.4
-0.035 -0.015 0.005 0.025 0.045 0.065
1/Sp
ecifi
c En
zym
e Ac
tivity
1/(n
mol
/min
/mg)
1/NADPH(1/µM)
BLAR activity was measured in the reaction medium containing different
concentrations of NADPH as cofactor, 1.43 mg protein as enzyme source, 6x10⁻⁵ M
DL-Glyceraldehyde as substrate solution, pH 6.7 of 30mM Phosphate Buffer and
270 mM Li2S04 in a final volume of 1.0 mL.
49

3.4.7 The effect of temperature on the enzyme activity
The effect of temperature on aldose reductase enzyme activity was examined
by incubating the reaction mixture at 11 different temperatures as such 10 oC, 15 oC,
20 oC, 25 oC, 30 oC, 35 oC, 40 oC, 45 oC, 50 oC, 55 oC and 60 oC. Mixtures
without adding the enzyme were incubated at given tempratures for 3 minutes. Then,
the enzyme was added and the enzyme activity was measured for 5 minutes. The
maximum enzyme activity was found at 60 oC. However, all of the enzyme activity
measurements were examined at room temperature to facilitate the study. The effect
of temperature on enzyme activity was shown in figure 3.10.
0 5 10 15 20 25 30 35 40 45 50 55 60 650.0
0.3
0.6
0.9
1.2
1.5
1.8
2.1
2.4
2.7
3.0
Spes
ific
Enz
yme
Act
ivity
(nm
ol/m
in/m
g)
Temperature (ºC)
Figure 3.10: Effect of temperature on BLAR activity. The values were expressed as
Mean ± SD. Data determined are mean of duplicate measurements obtained from at
least three seperate experiments.
50

3.4.8 The inhibitory effect of dimethylsulfoxide (DMSO) on aldose reductase enzyme activity
The inhibitory effect of dimethylsulfoxide (DMSO) on BLAR activity was
measured by changing DMSO concentration in 1.0 mL reaction mixture. DMSO
concentration was changed from 0.1% to 10% to find the percent of inhibition and
the percent of inhibition were varied from 0.99±0.05 to 77.23±0.24. BLAR activity
was not affected importantly until 1% DMSO concentration. As DMSO
concentration was further increased, enzyme activity changed notably. Hence, 1%
DMSO concentration could be handled on the measurement of BLAR. The inhibitory
effect of dimethylsulfoxide (DMSO) on BLAR activity was shown in figure 3.11.
0
10
20
30
40
50
60
70
80
90
100
0.1 0.3 0.5 0.7 1 2 3 4 5 10
% In
hibi
tion
Final % DMSO Concentration in 1 ml
Figure 3.11: Effect of dimethylsulfoxide (DMSO) on BLAR activity. The values
were expressed as Mean ± SD. Data determined are mean of duplicate measurements
obtained from at least three seperate experiments.
51

52
3.5 Yields of ethanol and ethyl acetate extracts of plant materials
Ocimum basilicum, Lavandula stoechas, Melissa officinalis, Glycyrrhiza
glabra L, and Tilia tomentosa were dried at room temprature then finely grounded
to enlarge air-surface area by Waring Blender (model 32BL80 ). Plant samples (20 g)
were three times extracted in 1:10 ratio of ethanol and ethyl acetate for 24 hours at
rocking incubator (Optic Ivymen System) at 30 °C. Mixtures were filtered through a
double layered cheese cloth. Then, samples were filtered with a rough filter paper.
Next, solvents of plants were evaporated by rotary evaporator (Heidolph Laborota
4000) at 35 °C until mixtures remained to 50 ml of solvents. Afterwards, mixtures
including 50 ml of solvent settled to lyophilizator (Heto-Holten Model Maxi-Dry
Lyo) to dry plant extracts completely. Dried extracts were weight out and the percent
yield of extraction was calculated and yields of ethanol and ethyl acetate extracts
were shown in table 3.1 and table 3.2, respectively.
3.5.1 Yields of ethanol extracts
Dried ethanol extracts were weight out and the percent yield of extraction was
calculated and yields of ethanol extracts were expressed in table 3.1.
Table 3.1 : Comparision of percent yields of ethanol extracts. The values were
shown as (%) percent yield of ethanol extracts (w/w)
Ethanol Extracts Percent Yield (w/w) (%)
Ocimum basilicum 7.76
Lavandula stoechas 11.78
Melissa officinalis 7.92
Glycyrrhiza glabra L 11.08
Tilia tomentosa 7.67
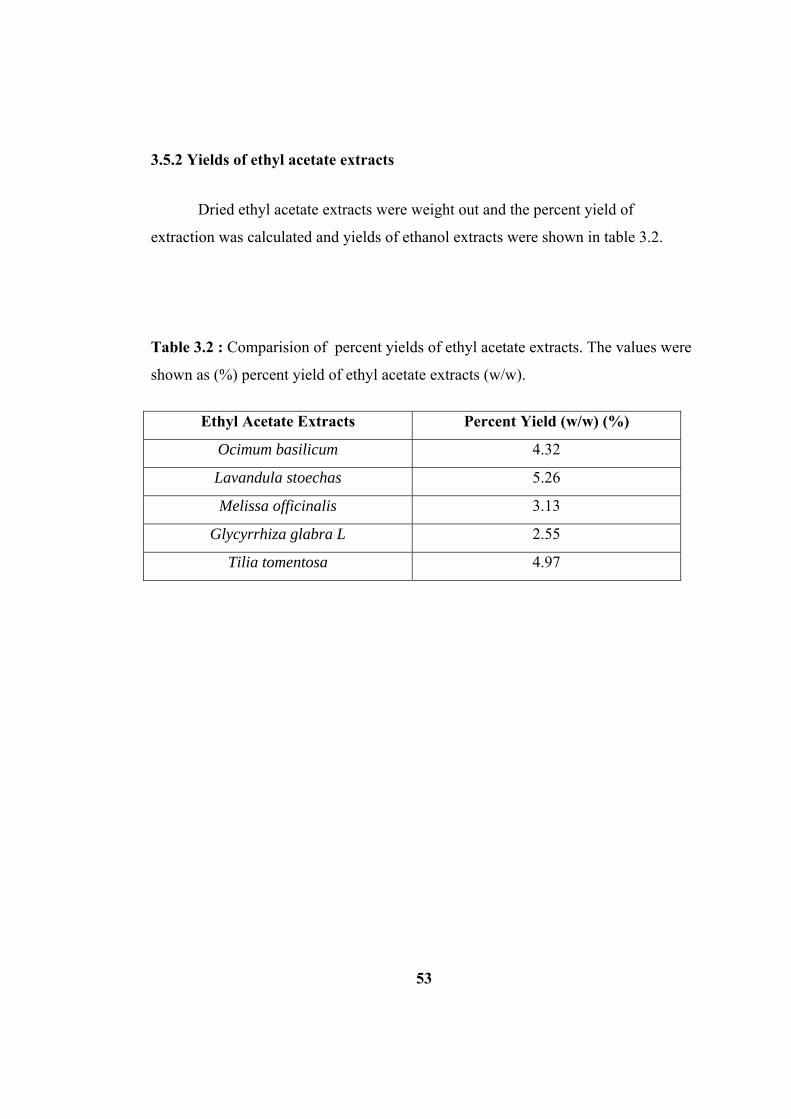
53
3.5.2 Yields of ethyl acetate extracts
Dried ethyl acetate extracts were weight out and the percent yield of
extraction was calculated and yields of ethanol extracts were shown in table 3.2.
Table 3.2 : Comparision of percent yields of ethyl acetate extracts. The values were
shown as (%) percent yield of ethyl acetate extracts (w/w).
Ethyl Acetate Extracts Percent Yield (w/w) (%)
Ocimum basilicum 4.32
Lavandula stoechas 5.26
Melissa officinalis 3.13
Glycyrrhiza glabra L 2.55
Tilia tomentosa 4.97

54
3.6 Inhibitory effect of plant extracts on aldose reductase activity
Various concentrations of extraction samples obtained in ethylacetate and
ethanol solvents by extraction method were used for testing inhibitions on bovine
lens aldose reductase.The inhibition assay studies examined to use crude enzyme
solution. Each extract was dissolved in DMSO because extracts acquired were not
dissolved in water.
The concentrations of these extracts were prepared by serial dilution of the
stock solutions in 5% DMSO. Various concentration of DMSO was added in assay
mixture to keep amount of DMSO constant. DMSO content in each extract was
added in test tube for measurement of BLAR activity. This activity was considered
as control activity.

3.6.1 Inhibitory effect of ethanol extracts on aldose reductase enzyme activity
3.6.1.1 Inhibitory effect of Ocimum Basilicum ethanol extracts on aldose
reductase enzyme activity
BLAR inhibition study was carried out by using different concentrations of
Ocimum Basilicum ethanol extracts in 1 mL of assay solution. Assay constituents
were composed of different concentrations of Ocimum Basilicum ethanol extracts in
DMSO, 1.43 mg protein as enzyme source, 6x10⁻⁵ M DL-Glyceraldehyde as
substrate solution, 1x10⁻⁴ M NADPH prepared freshly, pH 6.7 of 30 mM PBS and
270 mM Li2S04 in a final volume of 1.0 mL.
The inhibitory effect results of Ocimum Basilicum ethanol extracts on BLAR
activity was given in figure 3.12.
0.00 0.02 0.04 0.06 0.08 0.10 0.12 0.140
10
20
30
40
50
60
70
80
90
100
Ald
ose
Red
ucta
se In
hibi
tion
(%)
Plant Extract (mg/ml)
Figure 3.12: Inhibitory effect of Ocimum Basilicum ethanol extracts on BLAR
activity. 50 % inhibitory concentration (IC50 µg/mL) of Ocimum Basilicum ethanol
extracts was calculated as 45.89 ± 2.31 µg/mL.
55

3.6.1.2 Inhibitory effect of Lavandula stoechas ethanol extracts on aldose
reductase enzyme activity
BLAR inhibition study was examined by using different concentrations of
Lavandula stoechas ethanol extracts in 1 mL of assay solution. Assay constituents
consist of different concentrations of Lavandula stoechas ethanol extracts in DMSO,
1.43 mg protein as enzyme source, 6x10⁻⁵ M DL-Glyceraldehyde as substrate
solution, 1x10⁻⁴ M NADPH prepared freshly, pH 6.7 of 30 mM PBS and 270 mM
Li2S04 in a final volume of 1.0 mL. The inhibitory effect results of Lavandula
stoechas ethanol extracts on BLAR activity was given in figure 3.13.
0.00 0.02 0.04 0.06 0.08 0.100
10
20
30
40
50
60
70
80
90
100
Ald
ose
Red
ucta
se In
hibi
tion
(%)
Plant Extract (mg/ml)
Figure 3.13: Inhibitory effect of Lavandula stoechas ethanol extracts on BLAR
activity. The values were shown as Mean ± SD. Data determined are mean of
duplicate measurements obtained from at least three seperate experiments. 50 %
inhibitory concentration ( IC 50 µg/mL) of Lavandula stoechas ethanol extracts was
calculated as 39.28 ± 11 µg/mL.
56

3.6.1.3 Inhibitory effect of Melissa officinalis ethanol extracts on aldose
reductase enzyme activity
BLAR inhibition study was made by using different concentrations of
Melissa officinalis ethanol extracts in 1 mL of assay medium. Assay components
consist of different concentrations of Melissa officinalis ethanol extracts in DMSO,
1.43 mg protein as enzyme source, 6x10⁻⁵ M DL-Glyceraldehyde as substrate
solution, 1x10⁻⁴ M NADPH prepared freshly, pH 6.7 of 30 mM PBS and 270 mM
Li2S04 in a final volume of 1.0 mL. The inhibitory effect results of Melissa
officinalis ethanol extracts on BLAR activity was displayed in figure 3.14.
0.00 0.02 0.04 0.06 0.08 0.10 0.12 0.14 0.160
10
20
30
40
50
60
70
80
90
100
Ald
ose
Red
ucta
se In
hibi
tion
(%)
Plant Extract (mg/ml)
57
Figure 3.14: Inhibitory effect of Melissa officinalis ethanol extracts on BLAR
activity. The values were demonstrated as Mean ± SD. Data found are mean of
duplicate measurements obtained from at least three seperate experiments. 50 %
inhibitory concentration ( IC 50 µg/mL) of Melissa officinalis ethanol extracts was
found as 54.15 ± 3.26 µg/mL.

3.6.1.4 Inhibitory effect of Glycyrrhiza glabra L ethanol extracts on aldose
reductase enzyme activity
BLAR inhibition study was carried out by using different concentrations of
Glycyrrhiza glabra L ethanol extracts in 1 mL of assay medium. Assay constituents
were composed of different concentrations of Glycyrrhiza glabra L ethanol extracts
in DMSO, 1.43 mg protein as enzyme source, 6x10⁻⁵ M DL-Glyceraldehyde as
substrate solution, 1x10⁻⁴ M NADPH prepared freshly, pH 6.7 of 30 mM phosphate
buffer and 270 mM Li2S04 in a final volume of 1.0 mL. The inhibitory effect
results of Glycyrrhiza glabra L ethanol extracts on BLAR activity was shown in
figure 3.15.
0.00 0.02 0.04 0.06 0.08 0.10 0.120
10
20
30
40
50
60
70
80
90
100
Ald
ose
Red
ucta
se In
hibi
tion
(%)
Plant Extract (mg/ml)
Figure 3.15: Inhibitory effect of Glycyrrhiza glabra L ethanol extracts on BLAR
activity. The values were shown as Mean ± SD. Data obtained are mean of duplicate
measurements acquired from at least three seperate experiments. 50 % inhibitory
concentration ( IC 50 µg/mL) of Glycyrrhiza glabra L ethanol extracts was
calculated as 25.53 ± 0.36 µg/mL.
58

3.6.1.5 Inhibitory effect of Tilia tomentosa ethanol extracts on aldose reductase
enzyme activity
BLAR inhibition study was examined by using different concentrations of
Tilia tomentosa ethanol extracts in 1 mL of assay solution. Assay components were
combined with different concentrations of Tilia tomentosa ethanol extracts in
DMSO, 1.43 mg protein as enzyme source, 6x10⁻⁵ M DL-Glyceraldehyde as
substrate solution, 1x10⁻⁴ M NADPH prepared freshly, pH 6.7 of 30 mM PBS and
270 mM Li2S04 in a final volume of 1.0 mL. The inhibitory effect results of Tilia
tomentosa ethanol extracts on BLAR activity was given in figure 3.16.
0.00 0.02 0.04 0.06 0.08 0.100
10
20
30
40
50
60
70
80
90
100
Ald
ose
Red
ucta
se In
hibi
tion
(%)
Plant Extract (mg/ml)
59
Figure 3.16: Inhibitory effect of Tilia tomentosa ethanol extracts on BLAR activity.
The values were taken as Mean ± SD. Data given are mean of duplicate
measurements obtained from at least three seperate experiments. 50 % inhibitory
concentration (IC50 µg/mL) of Tilia tomentosa ethanol extracts was found as 31.76 ±
0.2 µg/mL.

3.6.1.6 Summary of inhibitory effects (IC50 µg/ml) of ethanol extracts on aldose
reductase activity
Inhibitory effects of ethanol extracts on BLAR were expressed as 50 %
inhibitory concentration ( IC 50 µg/mL) and shown in figure 3.17.
0
10
20
30
40
50
60
70
80
90
100
Ocimum basilicum
Lavandula stoechas
Melissa officinalis
Glycyrrhiza glabra L
Tilia tomentosa
quercetin
IC 5
0 (µ
g/m
l)
Ethanol Extracts
Figure 3.17 : Inhibitory Effects of Ethanol Extracts on BLAR activity. The values
were taken as Mean ± SD. Data given are mean of duplicate measurements obtained
from at least three seperate experiments.
3.6.2 Inhibitory effect of ethyl acetate extracts on aldose reductase enzyme activity
3.6.2.1 Inhibitory effect of Ocimum Basilicum ethyl acetate extracts on aldose
reductase enzyme activity
60
BLAR inhibition study was made by using different concentrations of
Ocimum Basilicum ethyl acetate extracts in 1 mL of assay solution.

Assay constituents consist of different concentrations of Ocimum Basilicum
ethyl acetate extracts in DMSO, 1.43 mg protein as enzyme source, 6x10⁻⁵ M DL-
Glyceraldehyde as substrate solution, 1x10⁻⁴ M NADPH prepared freshly, pH 6.7 of
30 mM PBS and 270 mM Li2S04 in a final volume of 1.0 mL.
The inhibitory effect results of Ocimum Basilicum ethyl acetate extracts on
BLAR activity was shown in figure 3.18 and the inhibitor effects of the Ocimum
Basilicum ethyl acetate extracts were expressed as the 50 inhibitory concentration
( IC50 µg/mL).
0.00 0.02 0.04 0.06 0.08 0.10 0.12 0.14 0.160
10
20
30
40
50
60
70
80
90
100
Ald
ose
Red
ucta
se In
hibi
tion
(%)
Plant extract (mg/ml)
Figure 3.18: Inhibitory effect of Ocimum basilicum ethyl acetate extracts on BLAR
activity. The values were shown as Mean ± SD. Data given are mean of duplicate
measurements obtained from at least three seperate experiments. 50 % inhibitory
concentration (IC50 µg/mL) of Ocimum Basilicum ethyl acetate extracts was
calculated as 82.96 ± 1.88 µg/mL.
61

3.6.2.2 Inhibitory effect of Lavandula stoechas ethyl acetate extracts on aldose
reductase enzyme activity
BLAR inhibition study was carried out by using different concentrations of
Lavandula stoechas ethyl acetate extracts in 1 mL of assay solution. Assay
constituents were composed of different concentrations of Lavandula stoechas ethyl
acetate extracts in DMSO, 1.43 mg protein as enzyme source, 6x10⁻⁵ M DL-
Glyceraldehyde as substrate solution, 1x10⁻⁴ M NADPH prepared freshly, pH 6.7 of
30 mM PBS and 270 mM Li2S04 in a final volume of 1.0 mL. The inhibitory effect
results of Lavandula stoechas ethyl acetate extracts on BLAR activity was shown in
figure 3.19.
0.00 0.02 0.04 0.06 0.08 0.10 0.120
10
20
30
40
50
60
70
80
90
100
Ald
ose
Red
ucta
se In
hibi
tion
(%)
Plant Extract (mg/ml)
Figure 3.19: Inhibitory effect of Lavandula stoechas ethyl acetate extracts BLAR
activity. The values were shown as Mean ± SD. 50 % inhibitory concentration ( IC 50
µg/mL) of Lavandula stoechas ethyl acetate extracts was found as 50.04 ± 1.5
µg/mL.
62
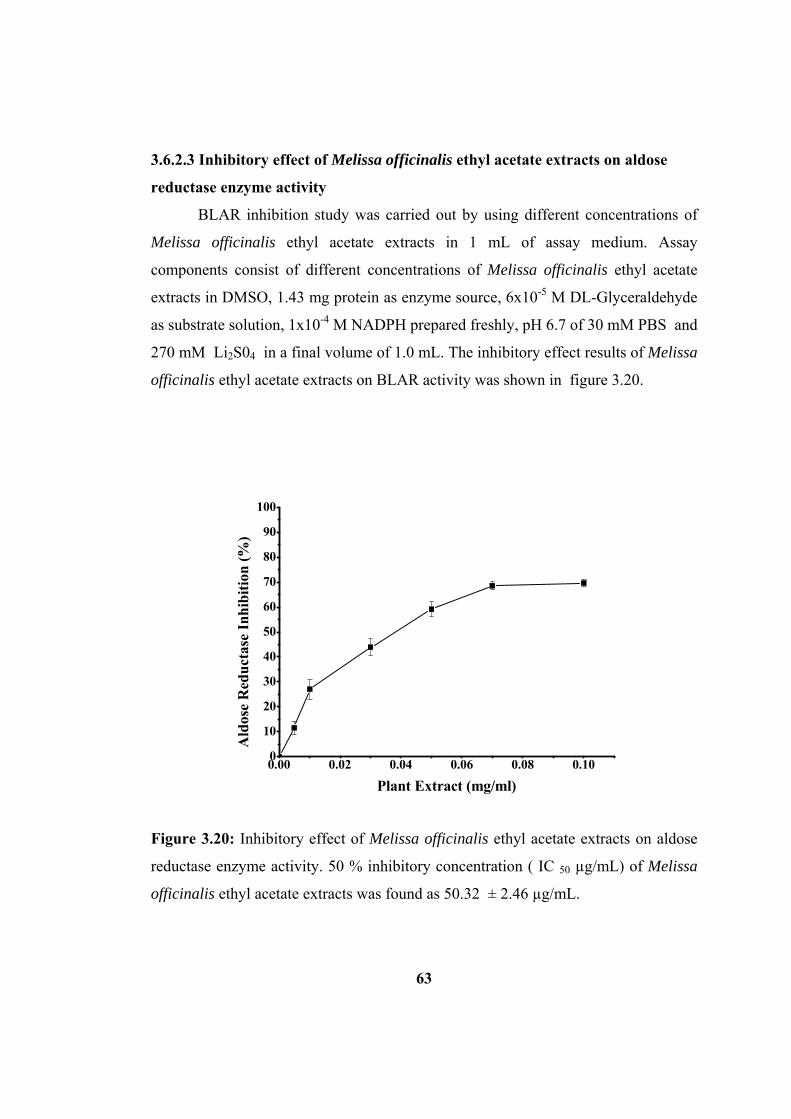
3.6.2.3 Inhibitory effect of Melissa officinalis ethyl acetate extracts on aldose
reductase enzyme activity
BLAR inhibition study was carried out by using different concentrations of
Melissa officinalis ethyl acetate extracts in 1 mL of assay medium. Assay
components consist of different concentrations of Melissa officinalis ethyl acetate
extracts in DMSO, 1.43 mg protein as enzyme source, 6x10⁻⁵ M DL-Glyceraldehyde
as substrate solution, 1x10⁻⁴ M NADPH prepared freshly, pH 6.7 of 30 mM PBS and
270 mM Li2S04 in a final volume of 1.0 mL. The inhibitory effect results of Melissa
officinalis ethyl acetate extracts on BLAR activity was shown in figure 3.20.
0.00 0.02 0.04 0.06 0.08 0.100
10
20
30
40
50
60
70
80
90
100
Ald
ose
Red
ucta
se In
hibi
tion
(%)
Plant Extract (mg/ml)
Figure 3.20: Inhibitory effect of Melissa officinalis ethyl acetate extracts on aldose
reductase enzyme activity. 50 % inhibitory concentration ( IC 50 µg/mL) of Melissa
officinalis ethyl acetate extracts was found as 50.32 ± 2.46 µg/mL.
63

3.6.2.4 Inhibitory effect of Glycyrrhiza glabra L ethyl acetate extracts on aldose
reductase enzyme activity
BLAR inhibition study was studied by using different concentrations of
Glycyrrhiza glabra L ethyl acetate extracts in 1 mL of assay medium. Assay
components were composed of different concentrations of Glycyrrhiza glabra L
ethyl acetate extracts in DMSO, 1.43 mg protein as enzyme source, 6x10⁻⁵ M DL-
Glyceraldehyde as substrate solution, 1x10⁻⁴ M NADPH prepared freshly, pH 6.7 of
30 mM PBS and 270 mM Li2S04 in a final volume of 1.0 mL. The inhibitory effect
results of Glycyrrhiza glabra L ethyl acetate extracts on BLAR activity was given
in figure 3.21.
0.00 0.02 0.04 0.06 0.08 0.100
10
20
30
40
50
60
70
80
90
100
Ald
ose
Red
ucta
se In
hibi
tion
(%)
Plant Extract (mg/ml)
Figure 3.21: Inhibitory effect of Glycyrrhiza glabra L ethyl acetate extracts on
BLAR activity. The values were shown as Mean ± SD. experiments. 50 % inhibitory
concentration ( IC 50 µg/mL) of Glycyrrhiza glabra L ethyl acetate extracts was
found as 41.55 ± 1.4 µg/mL.
64

3.6.2.5 Inhibitory effect of Tilia tomentosa ethyl acetate extracts on aldose
reductase enzyme activity
BLAR inhibition study was examined by using different concentrations of
Tilia tomentosa ethyl acetate extracts in 1 mL of assay solution. Assay components
were added with different concentrations of Tilia tomentosa ethanol extracts in
DMSO, 1.43 mg protein as enzyme source, 6x10⁻⁵ M DL-Glyceraldehyde as
substrate solution, 1x10⁻⁴ M NADPH prepared freshly, pH 6.7 of 30 mM PBS and
270 mM Li2S04 in a final volume of 1.0 mL. The inhibitory effect results of Tilia
tomentosa ethyl acetate extracts on BLAR activity was shown in figure 3.21.
0.00 0.02 0.04 0.06 0.08 0.10 0.120
10
20
30
40
50
60
70
80
90
100
Ald
ose
Red
ucta
se In
hibi
tion
(%)
Plant Extract (mg/ml)
Figure 3.22: Inhibitory effect of Tilia tomentosa ethyl acetate extracts on BLAR
activity. The values were shown as Mean ± SD. 50 % inhibitory concentration ( IC 50
µg/mL) of Tilia tomentosa ethyl acetate extracts was calculated as 75.96 ± 3.51
µg/mL.
65

3.6.3 Summary of inhibitory effects ( IC 50 µg/mL) of ethyl acetate extracts on
aldose reductase activity
Inhibitory effects of ethyl acetate extracts on BLAR were expressed as 50 %
inhibitory concentration ( IC 50 µg/mL) and shown in figure 3.23.
0102030405060708090
100
Ocimum basilicum
Lavandula stoechas
Melissa officinalis
Glycyrrhiza glabra L
Tilia tomentosa
quercetin
IC 5
0 (µ
g/m
l)
Ethyl Acetate Extracts
Figure 3.23 : Inhibitory effects of ethyl acetate extracts on BLAR activity. The
values were shown as Mean ± SD. Data given are mean of duplicate measurements
obtained from at least three seperate experiments.
66

67
3.6.4. Comparision of 50 % inhibitory concentrations ( IC 50 µg/mL) of ethanol
and ethyl Acetate extracts on aldose reductase activity
50 % inhibitory concentrations of ethanol extracts on BLAR activity were
compared and shown in table 3.3.
The highest aldose reductase inhibitory effect among ethanol extracts was
found as 25.53 ± 0.36 µg/mL in Glycyrrhiza glabra L . On the other hand, the lowest
aldose reductase inhibitory effect among ethanol extracts was detected as 54.15 ±
3.26 µg/mL in Melissa officinalis.
Table 3.3: Comparision of 50 % inhibitory concentrations ( IC 50 µg/mL) of ethanol
on BLAR activity. The values were shown as Mean ± SD. Data given are mean of
duplicate measurements obtained from at least three seperate experiments.
Ethanol Extracts ( IC 50 µg/mL) ± SD
Ocimum basilicum 45.89 ± 2.31
Lavandula stoechas 39.28 ± 11
Melissa officinalis 54.15 ± 3.26
Glycyrrhiza glabra L 25.53 ± 0.36
Tilia tomentosa 31.76 ± 0.2
Quercetin (Standard) 9.93 ± 0.87

68
50 % inhibitory concentrations of ethyl acetate extracts on BLAR activity
were compared and shown in Table 3.4.
The highest aldose reductase inhibitory effect among ethyl acetate extracts
was observed as 41.55 ± 1.4 µg/mL in Glycyrrhiza glabra L . On the other hand, the
lowest BLAR inhibitory effect among ethyl acetate extracts was found as 82.96 ±
1.85 µg/mL in Ocimum basilicum.
Table 3.4: Comparision of 50 % inhibitory concentrations ( IC 50 µg/mL) of ethyl
acetate extracts on BLAR activity. The values were expressed as Mean ± SD. Data
shown are mean of duplicate measurements obtained from at least three seperate
experiments.
Ethyl Acetate Extracts ( IC 50 µg/mL) ± SD
Ocimum basilicum 82.96 ± 1.85
Lavandula stoechas 50.04 ± 1.5
Melissa officinalis 50.32 ± 2.46
Glycyrrhiza glabra L 41.55 ± 1.4
Tilia tomentosa 75.96 ± 3.51
Quercetin (Standard) 9.93 ± 0.87
69
3.7 Determination of antioxidant capacities and total phenol content (TPC) of
plant extracts
Antioxidant activities of Ocimum basilicum, Lavandula stoechas, Melissa
officinalis, Glycyrrhiza glabra L, and Tilia tomentosa was examined by measuring
DPPH scavenging activity and total phenolic contents.
Measurement of DPPH percent scavenging activities were made at different
concentrations at plant extracts and the measurements for DPPH percent radical
scavenging activities (% RSA ) versus extract concentrations in mg/ml which were
shown in figure 3.24- figure 3.33 and determined as EC50 values.
DPPH radical scavenging activities of Ocimum basilicum, Lavandula
stoechas, Melissa officinalis, Glycyrrhiza glabra L, and Tilia tomentosa prepared
ethahol and ethyl acetate were carried out at 517 nm for 5 minutes.
The effect of antioxidant for 5 minutes were examined against fifty percent
effective concentration (EC50) of DPPH radical scavenginig activity.

3.7.1 Determination of antioxidant capacities of plant ethanol extracts 3.7.1.1 Determination of percent DPPH scavenging activity of Ocimum basilicum
ethanol extracts
Determination of antioxidant capacity of Ocimum basilicum ethanol extracts
was carried out by using different concentrations of Ocimum basilicum ethanol
extracts in 1.5 mL of the assay solution.
The antioxidant effect results of Ocimum basilicum ethanol extracts was
given in figure 3.24 and the antioxidant effects of the Ocimum basilicum ethanol
extracts were expressed as the 50 % effective concentration ( EC50 ).
0.0 0.1 0.2 0.3 0.40
10
20
30
40
50
60
70
80
90
100
DPP
H S
cave
ngin
g A
ctiv
ity (%
)
Plant Extract (mg/ml)
Figure 3.24: Percent DPPH scavenging activity of Ocimum basilicum ethanol
extracts. The values were given as Mean ± SD. Data determined are mean of
duplicate measurements acquired from at least three seperate experiments. 50 %
effective concentration ( EC 50 µg/mL) of Ocimum basilicum ethanol extracts was
calculated as 136.88 ± 0.72 µg/mL.
70

3.7.1.2 Determination of percent DPPH scavenging activity of Lavandula
stoechas ethanol extracts
Determination of antioxidant capacity of Lavandula stoechas ethanol
extracts was examined by using different concentrations of Lavandula stoechas
ethanol extracts in 1.5 mL of the assay solution.
Percent DPPH scavenging activity of Lavandula stoechas ethanol extracts
was shown in figure 3.25 and the antioxidant effects of the Lavandula stoechas
ethanol extracts were expressed as the 50 % effective concentration ( EC50 ).
0.00 0.25 0.50 0.75 1.00 1.25 1.50 1.75 2.00 2.250
10
20
30
40
50
60
70
80
90
100
DPP
H S
cave
ngin
g A
ctiv
ity (%
)
Plant Extract (mg/ml)
Figure 3.25: Percent DPPH scavenging activity of Lavandula stoechas ethanol
extracts. The values were shown as Mean ± SD. Data determined are mean of
duplicate measurements obtained from at least three seperate experiments. 50 %
effective concentration ( EC 50 µg/mL) of Lavandula stoechas ethanol extracts was
found as 2667.61 ± 13.95 µg/mL.
71
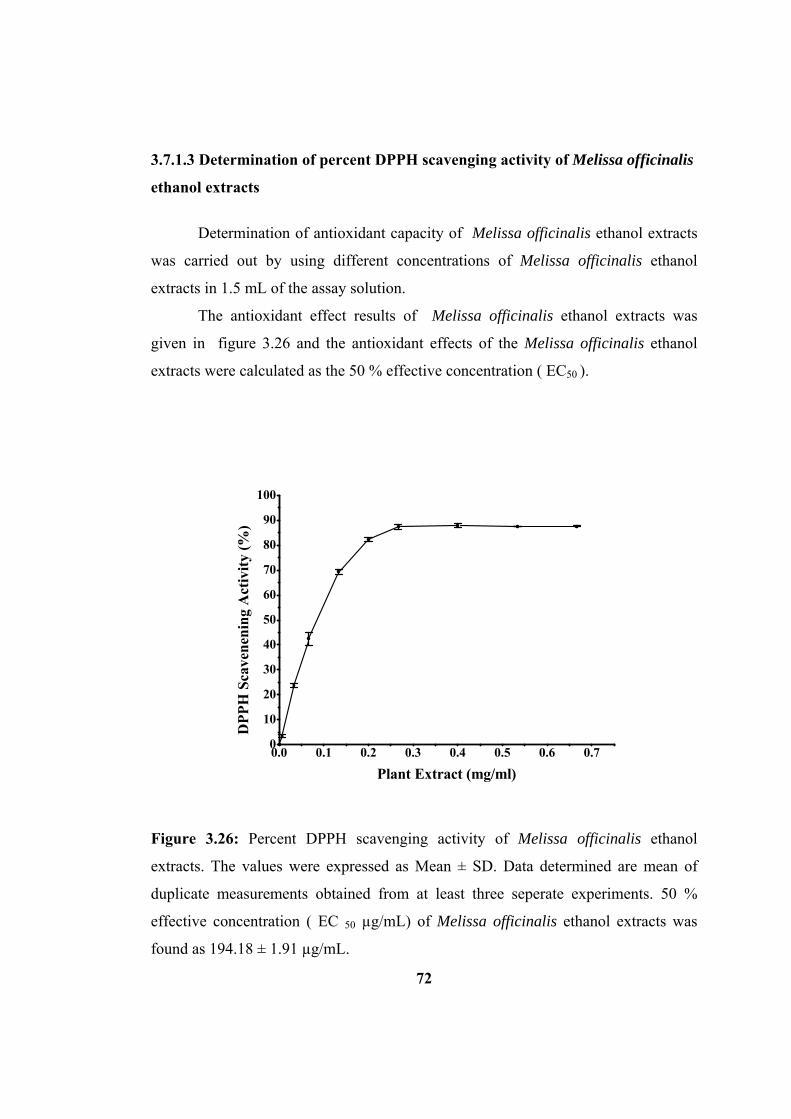
3.7.1.3 Determination of percent DPPH scavenging activity of Melissa officinalis
ethanol extracts
Determination of antioxidant capacity of Melissa officinalis ethanol extracts
was carried out by using different concentrations of Melissa officinalis ethanol
extracts in 1.5 mL of the assay solution.
The antioxidant effect results of Melissa officinalis ethanol extracts was
given in figure 3.26 and the antioxidant effects of the Melissa officinalis ethanol
extracts were calculated as the 50 % effective concentration ( EC50 ).
0.0 0.1 0.2 0.3 0.4 0.5 0.6 0.70
10
20
30
40
50
60
70
80
90
100
DPP
H S
cave
neni
ng A
ctiv
ity (%
)
Plant Extract (mg/ml)
Figure 3.26: Percent DPPH scavenging activity of Melissa officinalis ethanol
extracts. The values were expressed as Mean ± SD. Data determined are mean of
duplicate measurements obtained from at least three seperate experiments. 50 %
effective concentration ( EC 50 µg/mL) of Melissa officinalis ethanol extracts was
found as 194.18 ± 1.91 µg/mL.
72
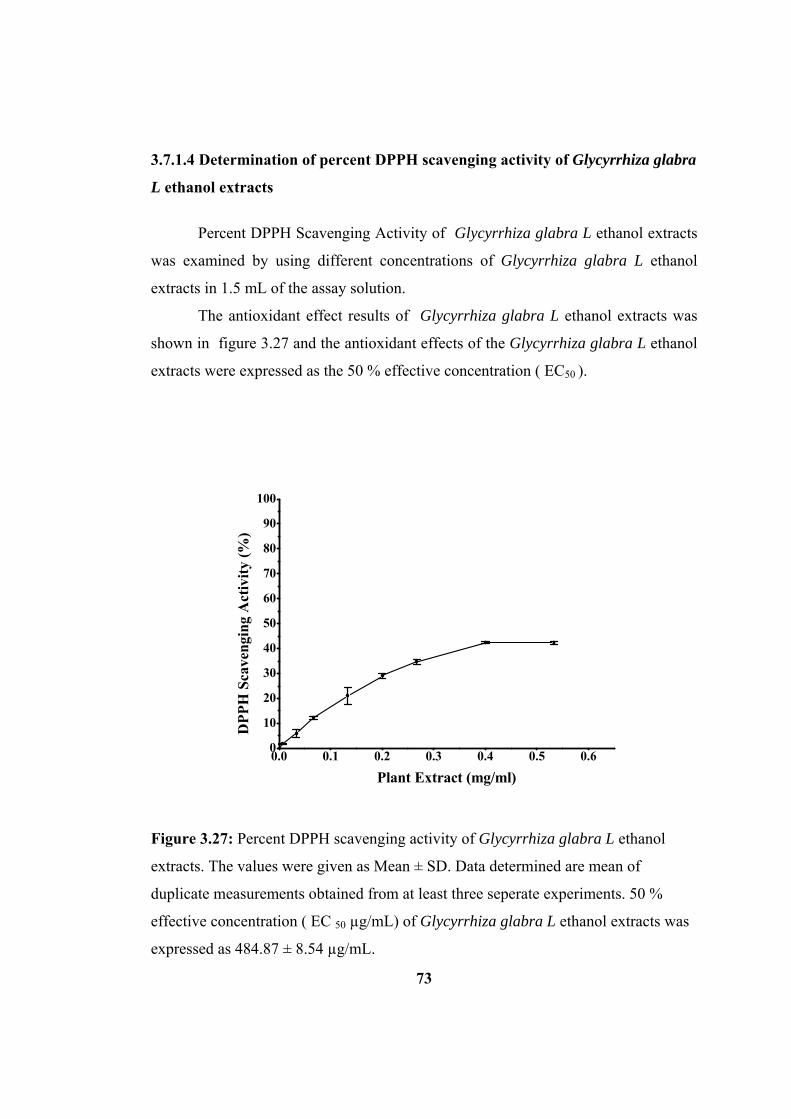
3.7.1.4 Determination of percent DPPH scavenging activity of Glycyrrhiza glabra
L ethanol extracts
Percent DPPH Scavenging Activity of Glycyrrhiza glabra L ethanol extracts
was examined by using different concentrations of Glycyrrhiza glabra L ethanol
extracts in 1.5 mL of the assay solution.
The antioxidant effect results of Glycyrrhiza glabra L ethanol extracts was
shown in figure 3.27 and the antioxidant effects of the Glycyrrhiza glabra L ethanol
extracts were expressed as the 50 % effective concentration ( EC50 ).
0.0 0.1 0.2 0.3 0.4 0.5 0.60
10
20
30
40
50
60
70
80
90
100
DPP
H S
cave
ngin
g A
ctiv
ity (%
)
Plant Extract (mg/ml)
Figure 3.27: Percent DPPH scavenging activity of Glycyrrhiza glabra L ethanol
extracts. The values were given as Mean ± SD. Data determined are mean of
duplicate measurements obtained from at least three seperate experiments. 50 %
effective concentration ( EC 50 µg/mL) of Glycyrrhiza glabra L ethanol extracts was
expressed as 484.87 ± 8.54 µg/mL.
73

3.7.1.5 Determination of percent DPPH scavenging activity of Tilia tomentosa
ethanol extracts
Percent DPPH Scavenging Activity of Tilia tomentosa ethanol extracts was
carried out by using different concentrations of Tilia tomentosa ethanol extracts in
1.5 mL of the assay solution.
The antioxidant effect results of Tilia tomentosa ethanol extracts was given
in figure 3.28 and the antioxidant effects of the Tilia tomentosa ethanol extracts
were expressed as the 50 % effective concentration ( EC50 ).
0.00 0.05 0.10 0.15 0.20 0.25 0.300
10
20
30
40
50
60
70
80
90
100
DPP
H S
cave
ngin
g A
ctiv
ity (%
)
Plant Extract (mg/ml)
74
Figure 3.28: Percent DPPH scavenging activity of Tilia tomentosa ethanol extracts.
The values were shown as Mean ± SD. Data determined are mean of duplicate
measurements obtained from at least three seperate experiments. 50 % effective
concentration ( EC 50 µg/mL) of Tilia tomentosa ethanol extracts was found as 70.46
± 1.1 µg/mL.

75
3.7.1.6 Comparision of 50 % effective concentrations for DPPH radical
scavenging activity of ethanol extracts
50 % effective concentrations for DPPH radical scavenging activity of
ethanol extracts were compared and demonstrated in table 3.5.
The highest DPPH radical scavenging capacity among ethanol extracts was
found as 70.46 ± 1.1µg/mL in. Tilia tomentosa . On the other hand, the lowest DPPH
radical scavenging capacity among ethanol extracts was detected as 2667.61 ±
13.95µg/mL in Lavandula stoechas.
Table 3.5 : Comparision of 50 % effective concentration for DPPH radical
scavenging activity of ethanol extracts. The values were shown as Mean ± SD. Data
determined are mean of duplicate measurements obtained from at least three seperate
experiments.
Ethanol Extracts ( EC 50 µg/mL) ± SD
Ocimum basilicum 136.88 ± 0.72
Lavandula stoechas 2667.61 ± 13.95
Melissa officinalis 194.18 ± 1.91
Glycyrrhiza glabra L 484.87 ± 8.54
Tilia tomentosa 70.46 ± 1.1
Quercetin 8.72 ± 0.11

3.7.2 Determination of antioxidant capacities of plant ethyl acetate extracts 3.7.2.1 Determination of percent DPPH scavenging activity of Ocimum basilicum
ethyl acetate extracts
Determination of antioxidant capacity of Ocimum basilicum ethyl acetate
extracts was examined by using different concentrations of Ocimum basilicum ethyl
acetate extracts in 1.5 mL of the assay solution.
The antioxidant effect results of Ocimum basilicum ethylacetate extracts was
given in figure 3.29 and the antioxidant effects of the Ocimum basilicum ethyl
acetate extracts were expressed as the 50 % effective concentration ( EC50 ).
0.0 0.2 0.4 0.6 0.8 1.0 1.2 1.40
10
20
30
40
50
60
70
80
90
100
DPP
H S
cave
ngin
g A
ctiv
ity (%
)
Plant Extract (mg/ml)
Figure 3.29: Percent DPPH scavenging activity of Ocimum basilicum ethyl acetate
extracts. The values were given as Mean ± SD. Data determined are mean of
duplicate measurements acquired from at least three seperate experiments. 50 %
effective concentration ( EC 50 µg/mL) of Ocimum basilicum ethyl acetate extracts
was calculated as 1869.01 ± 19.14 µg/mL.
76

3.7.2.2 Determination of percent DPPH scavenging activity of Lavandula
stoechas ethyl acetate extracts
Determination of antioxidant capacity of Lavandula stoechas ethyl acetate
extracts was carried out by using different concentrations of Lavandula stoechas
ethyl acetate extracts in 1.5 mL of the assay solution.
Percent DPPH scavenging activity of Lavandula stoechas ethyl acetate
extracts was shown in figure 3.30 and the antioxidant effects of the Lavandula
stoechas ethyl acetate extracts were calculated as the 50 % effective concentration (
EC50 ).
0.0 0.2 0.4 0.6 0.8 1.0 1.2 1.4 1.6 1.80
10
20
30
40
50
60
70
80
90
100
DPP
H S
cave
ngin
g A
ctiv
ity (%
)
Plant Extract (mg/ml)
77
Figure 3.30: Percent DPPH scavenging activity of Lavandula stoechas ethyl acetate
extracts. The values were given as Mean ± SD. Data determined are mean of
duplicate measurements obtained from at least three seperate experiments. 50 %
effective concentration ( EC 50 µg/mL) of Lavandula stoechas ethyl acetate extracts
was expressed as 413.55 ± 3.46 µg/mL.

3.7.2.3 Determination of percent DPPH scavenging activity of Melissa officinalis
ethyl acetate extracts
Determination of antioxidant capacity of Melissa officinalis ethyl acetate
extracts was carried out by using different concentrations of Melissa officinalis ethyl
acetate extracts in 1.5 mL of the assay solution.
The antioxidant effect results of Melissa officinalis ethyl acetate extracts was
shown in figure 3.31 and the antioxidant effects of the Melissa officinalis ethyl
acetate extracts were calculated as the 50 % effective concentration ( EC50 ).
0.0 0.2 0.4 0.6 0.8 1.00
10
20
30
40
50
60
70
80
90
100
DPP
H S
cave
ngin
g A
ctiv
ity (%
)
Plant Extract (mg/ml)
78
Figure 3.31: Percent DPPH scavenging activity of Melissa officinalis ethyl acetate
extracts. The values were expressed as Mean ± SD. Data determined are mean of
duplicate measurements obtained from at least three seperate experiments. 50 %
effective concentration ( EC 50 µg/mL) of Melissa officinalis ethyl acetate extracts
was found as 807.32 ± 14.72 µg/mL.

3.7.2.4 Determination of percent DPPH scavenging activity of Glycyrrhiza glabra
L. ethyl acetate extracts
Percent DPPH Scavenging Activity of Glycyrrhiza glabra L ethyl acetate
extracts was examined by using different concentrations of Glycyrrhiza glabra L
ethyl acetate extracts in 1.5 mL of the assay solution.
The antioxidant effect results of Glycyrrhiza glabra L. ethyl acetate extracts
was shown in figure 3.32 and the antioxidant effects of the Glycyrrhiza glabra L
ethyl acetate extracts were expressed as the 50 % effective concentration ( EC50 ).
0.00 0.05 0.10 0.15 0.20 0.25 0.300
10
20
30
40
50
60
70
80
90
100
DPP
H S
cave
ngin
g A
ctiv
ity (%
)
Plant Extract (mg/ml)
79
Figure 3.32: Percent DPPH scavenging activity of Glycyrrhiza glabra L. ethyl
acetate extracts. The values were given as Mean ± SD. Data determined are mean of
duplicate measurements obtained from at least three seperate experiments. 50 %
effective concentration ( EC 50 µg/mL) of Glycyrrhiza glabra L. ethyl acetate
extracts was expressed as 80.63 ± 0.91 µg/mL.

3.7.2.5 Determination of percent DPPH scavenging activity of Tilia tomentosa
ethyl acetate extracts
Percent DPPH Scavenging Activity of Tilia tomentosa ethyl acetate extracts
was carried out by using different concentrations of Tilia tomentosa ethyl acetate
extracts in 1.5 mL of the assay solution.
The antioxidant effect results of Tilia tomentosa ethyl acetate extracts was
given in figure 3.33 and the antioxidant effects of the Tilia tomentosa ethyl acetate
extracts were expressed as the 50 % effective concentration ( EC50 ).
0.0 0.2 0.4 0.6 0.8 1.0 1.2 1.4 1.6 1.80
10
20
30
40
50
60
70
80
90
100
DPP
H S
cave
ngin
g A
ctiv
ity (%
)
Plant Extract (mg/ml)
80
Figure 3.33: Percent DPPH scavenging activity of Tilia tomentosa ethyl acetate
extracts. The values were shown as Mean ± SD. Data determined are mean of
duplicate measurements obtained from at least three seperate experiments. 50 %
effective concentration ( EC 50 µg/mL) of Tilia tomentosa ethyl acetate extracts was
found as 1986.79 ± 88.81 µg/mL.
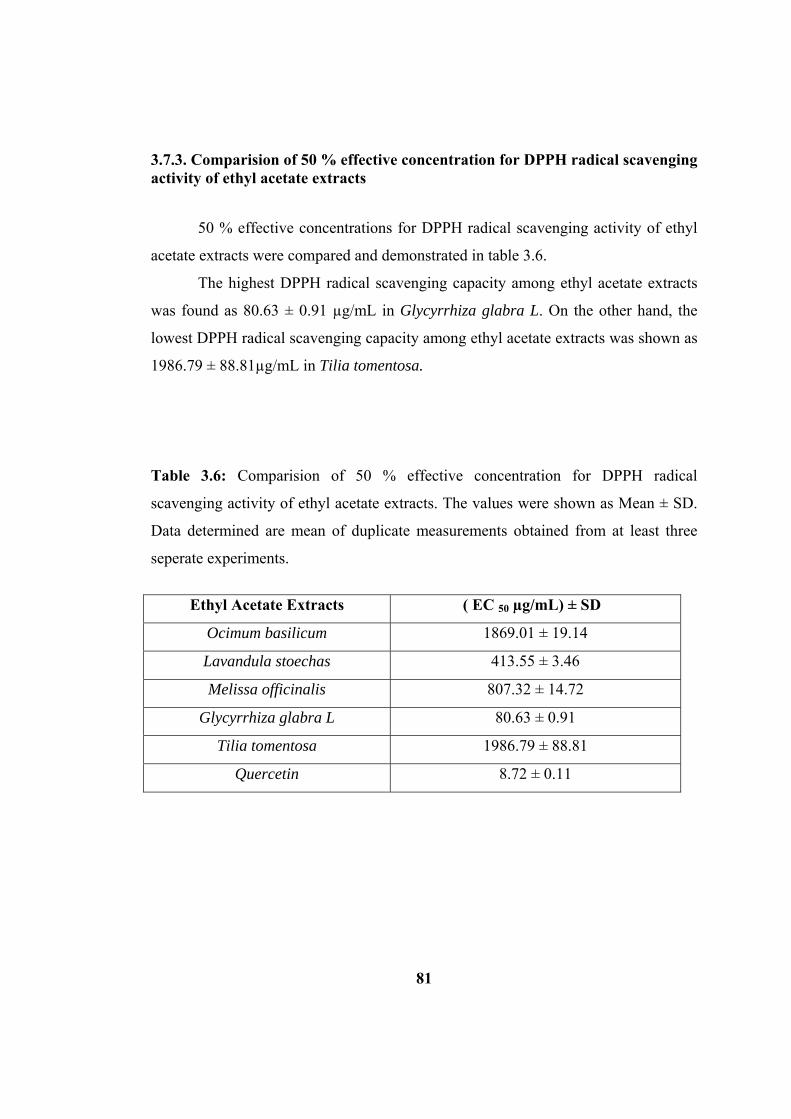
81
3.7.3. Comparision of 50 % effective concentration for DPPH radical scavenging activity of ethyl acetate extracts
50 % effective concentrations for DPPH radical scavenging activity of ethyl
acetate extracts were compared and demonstrated in table 3.6.
The highest DPPH radical scavenging capacity among ethyl acetate extracts
was found as 80.63 ± 0.91 µg/mL in Glycyrrhiza glabra L. On the other hand, the
lowest DPPH radical scavenging capacity among ethyl acetate extracts was shown as
1986.79 ± 88.81µg/mL in Tilia tomentosa.
Table 3.6: Comparision of 50 % effective concentration for DPPH radical
scavenging activity of ethyl acetate extracts. The values were shown as Mean ± SD.
Data determined are mean of duplicate measurements obtained from at least three
seperate experiments.
Ethyl Acetate Extracts ( EC 50 µg/mL) ± SD
Ocimum basilicum 1869.01 ± 19.14
Lavandula stoechas 413.55 ± 3.46
Melissa officinalis 807.32 ± 14.72
Glycyrrhiza glabra L 80.63 ± 0.91
Tilia tomentosa 1986.79 ± 88.81
Quercetin 8.72 ± 0.11

3.8 Determination of total phenol content (TPC) of plant extracts
Total phenolic contents of Ocimum basilicum, Lavandula stoechas, Melissa
officinalis, Glycyrrhiza glabra L, and Tilia tomentosa was examined by measuring as
microgram equivalents of gallic acid per mg of crude extracts.
3.8.1 Determination of total phenol content (TPC) of ethanol extracts
Total phenolic contents of Ocimum basilicum, Lavandula stoechas, Melissa
officinalis, Glycyrrhiza glabra L, and Tilia tomentosa ethanol extracts were shown in
figure 3.34.
0
10
20
30
40
50
60
Ocimum basilicum Lavandula stoechas
Melissa officinalis Glycyrrhize glabra L
Tilia tometosaTP G
AEs
µg/m
g of
Ext
ract
Ethanol Extracts
Figure 3.34: Total phenol content (TPC) of plant ethanol extracts.
The results obtained from absorbances were recorded as miligrams of total
phenolics including in miligrams of extract as the gallic acid equivalents (GAE).
82

83
3.8.1.1. Comparision of total phenol content (TPC) of ethanol extracts
Results of ethanol extracts were compared as miligrams of total phenolics
including in miligrams of extract as the gallic acid equivalents (GAE) and shown in
table 3.7.
The highest total phenolic content among ethanol extracts was found as 51.83
± 0.229 GAEs µg/mg of extract in Tilia tomentosa. On the other hand, the lowest
total phenolic content among ethanol extracts was detected as 8.04 ± 0.455 GAEs
µg/mg of extract Lavandula stoechas.
Table 3.7: Comparision of. total phenol content (TPC) of ethanol extracts. The
values were shown as Mean ± SD. Data determined are mean of duplicate
measurements obtained from at least three seperate experiments.
Ethanol Extracts TP GAEs µg/mg of extract ± SD
Ocimum basilicum 19.07 ± 0.758
Lavandula stoechas 8.04 ± 0.455
Melissa officinalis 25.43 ± 1.694
Glycyrrhiza glabra L 15.29 ± 2.379
Tilia tomentosa 51.83 ± 0.229

3.8.2 Determination of total phenol content (TPC) of ethyl acetate extracts
Total phenolic contents of Ocimum basilicum, Lavandula stoechas, Melissa
officinalis, Glycyrrhiza glabra L, and Tilia tomentosa ethyl acetate extracts were
shown in figure 3.35.
0
10
20
30
40
50
Ocimum basilicum Lavandula stoechas Melissa officinalis Glycyrrhize glabraL
Tilia tometosa
Ethyl Acetate Extracts
TP G
AEs
µg/
mg
of e
xtra
ct
Figure 3.35: Total phenol content (TPC) of plant ethyl acetate extracts.
The results obtained from absorbances were calculated as miligrams of total
phenolics including in miligrams of extract as the gallic acid equivalents (GAE).
84

85
3.8.2.1. Comparision of total phenol content (TPC) of ethyl acetate extracts
Results of ethyl acetate extracts were compared as miligrams of total
phenolics including in miligrams of extract as the gallic acid equivalents (GAE) and
exhibited in table 3.8.
The highest total phenolic content among ethyl acetate extracts was detected
as 44.54 ± 0.754 GAEs µg/mg of extract in Glycyrrhiza glabra L. On the other hand,
the lowest total phenolic content among ethyl acetate was shown as 5.68 ± 0.632
GAEs µg/mg of extract in Tilia tomentosa.
Table 3.8: Comparision of. total phenol content (TPC) of ethyl acetate extracts The
values were shown as Mean ± SD. Data determined are mean of duplicate
measurements obtained from at least three seperate experiments.
Ethyl Acetate Extracts TP GAEs µg/mg of extract ± SD
Ocimum basilicum 17.33 ± 0.940
Lavandula stoechas 13.76 ± 0.930
Melissa officinalis 8.26 ± 0.840
Glycyrrhiza glabra L 44.54 ± 0.754
Tilia tomentosa 5.68 ± 0.632

86
CHAPTER 4
CONCLUSIONS
Average weight of bovine lens was found as 2.06 g ± 0.04. The average
BLAR activity was calculated as 1.135 ± 0.058 nmole NADPH oxidized /min/ mg
protein. The lowest activity was measured as 1.043 nmole NADPH oxidized /min/
mg protein and the highest activity was measured as 1.256 nmole NADPH oxidized
/min/ mg protein. After optimization experiments optimum bovine lens aldose
reductase (BLAR) activity was measured in the reaction medium containing 1.43
mg/mL protein containing crude enzyme solution, 6x10⁻⁵ M DL-glyceraldehyde as
substrate solution, 1x10⁻⁴ M NADPH prepared freshly, 270 mM Li2S04, and 30
mM PBS at of pH 6.7 in a final volume of 1.0 mL. BLAR activity was stable up to
4 weeks. After 4 weeks, BLAR activity significantly decreased.
While Vmax for glyceraldehyde was found as 1.372 nmol/min/mg, Km was
calculated as 16.39 µM. On the other hand, while Vmax for cofactor NADPH was
calculated as 1.400 nmol/min/mg, Km was found as 35.81 µM. Bovine lens aldose
reductase activity was not affected by the addition of DMSO up to 1%
concentration. As DMSO concentration was further increased, enzyme activity
changed notably.
Ocimum basilicu, Melissa officinalis, Lavandula stoechas, Glycyrrhiza
glabra and Tilia tomentosa were selected for the plant extract preparation to be
investigated in inhibition of BLAR activity. Crude extracts were prepared using
ethanol and ethyl acetate solvent system. The highest yield of ethanol extracts was
found as 11.78 % in Lavandula stoechas. The lowest yield of ethanol extracts was
shown as 7.67 % in Tilia tomentosa. Yield of Glycyrrhiza glabra was found higher
than that of Melissa officinalis. Also, yield of Ocimum basilicum was displayed
lower than that of Melissa officinalis.

87
The highest yield of ethyl acetate extracts was shown as 5.26 % in Lavandula
stoechas. The lowest yield of ethyl acetate extracts was found as 2.55 % in
Glycyrrhiza glabra. Also, Tilia tomentosa was displayed higher yield than that of
Ocimum basilicum. In addition, Melissa officinalis was found to have lower yield
than that of Ocimum basilicum.
Ethanol and ethyl acetate crude extracts of each selected plant were prepared
10 mg/mL in the 10% DMSO as initial stock solution. Inhibition studies were
examined for the extract concentrations of 0.001-0.2 mg/mL. Among the plants
prepared in ethanol extracts the highest BLAR inhibitory effect was found by
Glycyrrhiza glabra which has the lowest 50 % inhibitory concentration of 25.53 ±
0.36 µg/mL. On the contrary, the lowest BLAR inhibitory effect was exhibited by
Melissa officinalis with the highest 50 % inhibitory concentration of 54.15 ± 3.26
µg/mL. BLAR inhibitory effects of Tilia tomentosa, Lavandula stoechas and
Ocimum basilicum were obtained as 50 % inhibitory concentration values of 31.76 ±
0.2, 39.28 ± 11, and 45.89 ± 2.31 µg/mL, respectively.
BLAR inhibitory effects for ethyl acetate extracts of same selected plants
were shown a different order of the effectiveness. The highest BLAR inhibitory
effect was exhibited by Glycyrrhiza glabra with the lowest 50 % inhibitory
concentration value of 41.55 ± 1.4 µg/mL. On the other hand, the lowest BLAR
inhibitory effect was displayed by Ocimum basilicum with 50 % inhibitory
concentration of 82.96 ± 1.85 µg/mL. BLAR inhibitory effects of Lavandula
stoechas, Melissa officinalis, and Tilia tomentosa, were obtained as 50 % inhibitory
concentration values of 50.04 ± 1.5, 50.32 ± 2.46, and 75.96 ± 3.51 µg/mL,
respectively. In addition, the 50 % inhibitory concentration of quercetin (standard) on
BLAR activity was found as 9.93 ± 0.87 µg/mL.
Ethanol and ethyl acetate crude extracts of each selected plant were prepared
10 mg/mL in the pure ethanol as initial stock solution. DPPH radical scavenging
activity were studied for the extract concentrations in the range of 0.001- 2.5 mg/mL.

88
Among the plants prepared in ethanol extracts the highest DPPH radical
scavenging activity was exhibited by Tilia tomentosa which has the lowest 50 %
inhibitory concentration of 70.46 ± 1.1µg/mL. On the other hand, Lavandula
stoechas displayed the lowest radical scavenging activity with 50 % effective
concentration value of 2667.61 ± 13.95 µg/mL. DPPH radical scavenging activities
were obtained for the rest of the plants with increasing order of the activity was given
by 50 % effective concentration values of 136.88 ± 0.72, 194.18 ± 1.91, and 484.87 ±
8.54 1µg/mL for Ocimum basilicum, Melissa officinalis and Glycyrrhiza glabra
ethanol extracts, respectively.
DPPH radical scavenging activity for the plants extracted in ethyl acetate
has shown different trend than that of ethanol extracts. On this occasion, the highest
radical scavenging activity was displayed by Glycyrrhiza glabra with a 50 %
effective concentration of 80.63 ± 0.91 µg/mL, however, the lowest activity revealed
by Tilia tomentosa and Ocimum basilicum with 50 % effective concentration values
of 1986.79 ± 88.81 and 1869.01 ± 19.14 µg/mL , respectively. Melissa officinalis
and Lavandula stoechas had respective 50 % effective concentration values of
807.32 ± 14.72 and 413.55 ± 3.46 µg/mL. In comparison, 50 % effective
concentration of quercetin used as a standard for DPPH radical scavenging activity
was found as 8.72 ± 0.11 µg/mL.
Total phenol content of each plant extract was investigated to find a
relationship between phenolic content of plant and its activity in terms of BLAR
inhibitory activity and radical scavenging activity. The highest total phenol content
(TPC) of ethanol extracts was found as 51.83 ± 0.229 µg GAE/mg of extract in Tilia
tomentosa. The lowest total phenol content (TPC) of ethanol extracts was shown as
8.04 ± 0.455 µg GAE/mg of extract in Lavandula stoechas. Melissa officinalis,
Ocimum basilicum, and Glycyrrhiza glabra exhibited respective total phenol
contents of 25.43 ± 1.694, 19.07 ± 0.758, and 15.29 ± 2.379 µg GAE/mg of extract
89
The highest total phenol content (TPC) of ethyl acetate extracts was found
as 44.54 ± 0.754 µg GAE/mg of extract in Glycyrrhiza glabra L. The lowest total
phenol content (TPC) of ethyl acetate extracts was shown as 5.68 ± 0.632 µg
GAE/mg of extract in Tilia tomentosa. Ocimum basilicum, Lavandula stoechas, and
Melissa officinalis exhibited respective total phenol contents of 17.33 ± 0.940,
13.76 ± 0.930, and 8.26 ± 0.840 µg GAE/mg of extract.
In conclusion, the highest total phenol content was obtained from Tilia
tomentosa among all the ethonolic plant extracts which was comparable with its
DPPH radical scavenging activity and BLAR inhibitory activity. The lowest total
phenolic content was belong to Lavandula stoechas which exhibited the lowest
radical scavenging activity, however, BLAR inhibitory activity was not the lowest
among other ethanolic extracts.
The highest total phenol content among the ethyl acetate plant extracts was
presented by Glycyrrhiza glabra as corresponding to the highest effect on radical
scavenging activity and BLAR inhibitory activity. Tilia tomentosa ethyl acetate
extract displayed the lowest phenolic content in the list and expectedly it also
displayed the lowest radical scavenging and BLAR inhibitory activity.
Glycyrrhiza glabra ethanol and ethyl acetate extracts have displayed the
highest BLAR inhibitory activity and Glycyrrhiza glabra may be carried into further
investigation for prevention of diabetic complications through pharmacolagic studies
of aldose reduction inhibition in vivo studies.

90
REFERENCES
Almeida, I., Alviano, D.S., Vieira, D.P., Alves, P.B., Blank, A.F., Lopes, A.H.,
Alviano, C.S., Rosa, M., (2007) Parasitol Res, Vol 101, 443-452.
Amarowicz R., Pegg R.B., Rahimi., Moghaddam P., Barl B., Weil J.A. (2004) Food
Chemistry Vol 84, 551–562.
Arauz, S. (1992) Joournal of Diabetic Complications, Vol 6, 131-137
Apotheker Zeitung, (2002) Vol 131, 1609.
Baytop, T. Phytotherapy in Turkey, (1984) Past and Present,Istanbul University
Press, Istanbul.
Bergman, M., Perelman, A., Dubinsky, Z., Grossman, S., (2003) Phytochemistry,
Vol 62, 753-762.
Biondi, D.M., Rocco, C., Ruberto, G., ( 2005 ). Journal of Natural Products Vol 68,
1099–1102.
Blois, M.S., (1958) . Nature, Vol 181, 1199-1200.
Bouayed Jaouad, Khosro Piri , Hassan Rammal , Amadou Dicko , Fre´de´ric Desor ,
Chafique Younos , Rachid Soulimani (2007) Food Chemistry Vol 104, 364–368.
Boulton, H. (1990) Diabetologia, Vol 33, 431-437.
Bozin, B., Mimica-Dukic, N., Simin, N., Anackov, G. J. (2006) Agric Food Chem,
Vol 54, 1822-1828.

91
Brandwein, B. J., (1965) Journal of Food Science Vol 30, 360.
Brownlee, M. (2001) Nature, 414, 813–820.
Chattopadhyay RR (1999) Acomparative evaluation of some blood sugar lowering
agents of plant origin. J Ethnopharmacol Vol 67, 367–372.
Chiang, L.C., Nig, L.T., Cheng, P.W., Chiang, W., Lin, C.C. (2005) Clin. Exp.
Pharmacol. Physiol, Vol 32, 811-816.
Clarke, B. F., Young, R. J., Martyn, C. N., Ewing, D. J., (1984) Diabetological
Medicine, Vol 1, 88-90.
Constantino, L., Rastelli, G., Vianello, P., Cignarella, G., Barlocco D. (1999)
Medicinal Research Reviews, Vol 19, 3-23.
Crabbe, J. M. C. (1991) Int. Opthalmol., 15,25-36.
Crabbe, M. J. C., Hoe, S.T. (1991) Enzyme, Vol 45, 188-193.
Cohen, R. A., Kucera, L. S., & Herrmann, E. (1964). Proceedings of the Society for
Experimental Biology and Medicine, Vol 117, 431–434.
Cromlish, J. A., Flynn, T. G. (1983) Journal of Biological Chemistry, Vol 258, 3583-
3586.
Das, B., Srivastava, S.K. (1985) Diabetes, Vol 34, 1145-1151.

92
Dastmalchi, K., Dorman, H. J. D., Kos-ar, M., & Hiltunen, R. (2007). Chemical
composition and in vitro antioxidant evaluation of a water soluble Moldavian balm
(Dracocephalum moldavica L) extract. Food Science and Technology, Vol 40, 239–
248.
Davis, K., (1988) Eds Boca Raton, Vol 2, 5-67.
Del Corso, A., Barsacchi, D., Camici, M., Garland, D., Mura, U. (1989) Arch.
Biochem. Biophys., Vol 270, 604-610.
Dias, C. P. A., Barberan, F. A. T., Ferreaira, M. F., Ferreres, F., (1998)
Phytochemistry, Vol 48, 1165-1168.
Dragan, A., Dusanka, D. A., Drago, B., Nead, T. (2003), Croatica Chemica Acta, Vol
76, 55-61.
Fossen, T., Pederson, A. T., (1998) Phytochemistry, Vol 47, 281-285.
Fridman, E. A. (1999) Diabetes Care, Vol 22, 65-71.
Fukai, T., Ali, M., Kaitou, K.Kanda, T., Terada, S., Nomura, T., 2002a. Life
Sciences Vol 71,1449–1463.
Greene, H. (1992) Journal of Diabetic Complications Vol 6, 35-38.
Grimshaw, C. E. (1990) Arch. Biochem. Biophys., Vol 278, 273-276.
Gupta, S. K., Halder, N., Joshi, S. (2003) Journal of Ethnopharmacology., Vol
86, 113–116

93
Guzman, A., Guerrero, O. (2005) Rev Cubana Plant Med. Vol 10, 3-4.
Gülçin, İ., Şat, İ.G., Beydemir, Ş., Elmastaş, M., Küfrevioğlu, Ö.İ., (2004) Food
Chemistry, Vol 87, 393-400.
Hadler, N., Joshi, S., Gupta, S. K., (2003), Journal of Ethnopharmacology, Vol 86,
113-116
Haihui, X., Wang, Matsuda, H., Yoshikawa, M., (2005) Chem. Pharm. Bull. Vol 53,
1416-1422
Halliwell, B., Murcia, A., Chiricio, S., Aruoma, O.L., (1995) Critical Reviews in
Food Science and Nutrition, Vol 35, 7-20.
Hayman, S., Kinoshita, J. H. (1965) J. Biol. Chem., 240,877-882.
Hohman, J., Zupko, I., Redei, D., Csanyi, M., et al. (1999). Protective effects of the
aerial parts of Salvia officinalis, Melissa officinalis and Levandula angustifolia and
their constituents against enzyme dependent and enzyme independent lipid
peroxidation. Planta Medica Vol 65, 576–578.
Hyung-In Moon, Jae-Chul Jung, Lee, Joongku., Medicinal Chemistry, (2006) Vol 14,
7592-7594.
Ivanova, D., Gerova, D., Chervenkov, T., & Yankova, T. (2005). Polyphenols and
antioxidant capacity of Bulgarian medicinal plant. Journal of Ethnopharmacology,
Vol 96, 145–150.
94
Kador, P. F., Kinoshita, J. H., Kuwabara, T., Yajima, Y., Akagi, Y. (1984), Biabetes,
Vol 33, 562-566.
Kador, P. F., Robison, G. W. Jr., Kinoshita, J. H. (1985) Annuals of Rewievs of
Pharmacology, Vol 25, 691-714.
Kador, P. F. (1988) Med. Res. Rev. 8, 325–352.
Kador, P. F. (1990) Experimental Eye Research, Vol 50, 615-620.
Kawamura, and Hamanaka, N., (1997) J. Syn. Org. Chem., Vol 37, 651-657.
Kin, N.M., Kim, J., Chung, H.Y., Choi, J.S., (2000). Arch. Pharma. Res., Vol 23,
237-239.
Kinoshita, J. H., Drovnik, D., Kraml, M., Gabbay, K. H. (1968) Biochem. Biophys.
Acta, Vol 158, 472-475.
Kinoshita, J. H., Fukushi, S, Kador, P. F, Merola, L. O. (1979) Metabolism,Vol 28,
462-469.
Klem MA, Nair MG, Straassburg GM, Dewitt DL (2000) Antioxidant and
cyclooxygenase inhibitory phenolic compounds from Ocimum sanctum Linn.
Phytomedicine Vol 7, 7–13.
Koga T, Hirota, Takumi K (1999) Bactericidal activities of essential oils of basil and
sage against a range of bacteria and the effect of these essential oils on Vibrio
parahaemolyticus. Microbiol Res Vol 154, 267–273.

95
Koya, D., King, G. L. (1998) Diabetes, Vol 47, 859-866.
Kümel, G., Stoll, L., & Brendel, M. (1991). Therapie mit rezeptfreien Topika.
Deutsche.
Lee, H. S., (2002) J. Pharm. Pharmaceut Sci., Vol 5, 226-230.
Lee Seung-Joo, Katumi Umano, Takayuki Shibamoto, Kwang-Geun Lee, (2005)
Food Chemistry Vol 91, 131–137.
Lightman, S. (1993) Eye, Vol 7, 238-241.
Liu, S. Q., Bhatnagar, A., Srivastava, S. K. (1992) Biochem. Biophys. Acta. Vol
1120, 329-336.
Lowry, O. H., and Rosebrough, N. J., Farr, A. I., (1951) J. Biol. Chem., Vol 193,
265-275.
Maity TK, Mandal SC, Saha BP, Pal M (2000) Effect of Ocimum sanctum roots
extract on swimming performance in mice. Phytother Res Vol 14, 120–121.
Manosroi J, Dhumtanom P, Manosroi A. (2006) Cancer Lett, Vol 235 114-120.
Manzanaro, S., Fuente, J. S., (2003) NPR, Vol 20, 243-251.
Matsuda, H., Cai, H., Kubo, M., Tosa, H., Iinuma, M., (1995), Biol. Pharm. Bull.,
Vol 18,463-466.
Matsuda, H., Morikawa, T., Toguchida, I., Yoshkawa, M. (2002), Chemical
Pharmaceutica I Bulletin, Vol 50, 788-795.

96
Matsuoka, Y.,Matsumoto, K. (1992) Journal of Medicinal Chemistry, Vol 35, 2085-
2094.
Miliauskas G., Venskutonisa P.R., Van Beek T.A. (2004) Food Chemistry Vol, 85 231–237.
Miyamoto, S. (2002) Chem- Bio Informatics Journal, Vol 2, 74-85.
Moras, D. (1992) Nature, Vol 355, 469-472.
Nadkarni, K. M. (1982). Indian materia medica .Bombay: Popular Prakashan. 3rd
ed, 730.
Naeser, P., Brolin, S. E. (1991) Acta Opht., Vol 69, 591-595.
Naik G., Priyadarsini, K. I., Satav J. G., Banavalikar M. M., Sohoni D.P., Biyani
M.K., Mohan H. (2003) Phytochemistry Vol 63, 97–104.
Newall, C.A., Anderson L.A., Phillipson J.D., Herbal Medicines A Guide for Health-
care Professionals, The Pharmaceutical Press, London, 1996.
Nishimura-Yabe C. (1998) Pharmacol. Rev., 50, 21–33.
Offiah VN, Chikwendu UA (1999) antidiarrhoeal effects of Ocimum gratissimum
leaf extract in experimental animals. J Ethnopharmacol Vol 68, 327–330.
Ohta, M., Tanimoto, T., Tanakata, A., Hayakawa, T. (1993) Int. J. Biochem., Vol 25,
1165-1174.
Okuda, J., Miwa, I., Inagaki, K., Horie, T., Nakayama, M. (1982) Biochemical
Pharmocology, Vol 31, 3807-3822.
97
Park, Y., and Lee, C. (1994) Polyphenols, Vol 94, 265.
Penzes, I., Boross, M., Gergely, I., (1984) Acedemic Press New York 18-38.
Politeo O., M. Jukic, M. Milos (2007) Food Chemistry Vol 101, 379–385.
Preifer, M. A., Schumer, M. P., Gelber, D.A (1997) Diabetes, Vol 46 82-89.
Proestos C., Sereli D., Komaitis M. (2006) Food Chemistry Vol 95, 44–52.
Robinson, W. G. (1994) Diabetes, Vol 43, 337-338.
Rondeau, J. M., Tete-Favier, F., Podjarney, A., Reyman, J. M., Barth, P., Biellman,
J. F., Wood, Academic Press, (1985).
Prakash J, Gupta SK (2000) Chemopreventive activity of Ocimum sanctum seed oil.
J Ethnopharmacol. Vol 72, 29–34.
Sajjadi, S. E. (2006). Analysis of the essential oils of two cultivated basil (Ocimum
basilicum L.) from Iran. Daru, Vol 14(3), 128-130.
Schieber, A., Keller, P., Carle, R. (2001) Journal of Chromotography, Vol 910, 265-
273.
Shahidi, F., Naczk, M., 2004. Phenolics in Food and Nutraceuticals: Sources,
Applications and Health Effects, CRC Press, Boca Raton, FL.
Sheaff, C. M., Daughty, C. (1976) J. Biol. Chem., 251,2696-2702.

98
Simon, J. E., Morales, M. R., Phippen, W. B., Vieira, R. F., & Hao, Z.(1999).
Perspectives on new corps and new uses. In J. Janick (Ed.), Asource of aroma
compounds and a popular culinary and ornamental herb. Alexandria, VA: ASHS
Press. 499–505.
Singh S (1999) Evaluation of gastric anti-ulcer activity of fixed oil of Ocimum
basilicum Linn. and its possible mechanism of action. Indian J Exp Biol 37: 253–
257.
Singleton,V.L., Rossi, J.A., (1965).American Journal of Enology and Viticulture, 16,
144-158.
Srivastava, S. K., Ansari, N. H., Brown, J. H., Petrash, J. M. (1982) Biochim.
Biophys. Acta., 717, 210-214
Thorpe, S. R., Baynes, J. W. (1999) Diabetes, Vol 48, 1-9.
Triantaphyllou, K., Blekas, G., & Boskou, D. (2001). Antioxidant properties of water
extracts obtained from herbs of the species Lamiaceae. International Journal of Food
Science and Nutrition, Vol 52, 313–317.
Tohti, I., Tursun, M., Umar, A., Turdi, S., Imin, H., Moore, N.. (2006) Thromb Res,
Vol 118, 733-739.
Toker Gulnur , Mustafa Aslan , Erdem Yesilada, Merve Memisoglu, Shigeru Ito
(2001) Journal of Pharmaceutical and Biomedical Analysis Vol, 26 111–121.
Ueda, H., Kuroiwa, E., Tachibana, Y. (2004) Phytomedicine, Vol 11, 652-656.
99
Ueda, H., Tachibana, Y., Moriyasu, M. Kawanishi, K., Alves, M. (2001)
Phytomedicine, Vol 8(5), 377-381.
Uma Devi P, Ganasoundri A, Vindra B, Srinivasan KK, Unnikrishnan MK (2000)
Radiation protection by the ocimum flavonoids orientin and vicenin: mechanisms of
action. Radiat Res Vol 154, 455–460.
Van Heyningen, R. (1959) Nature., 184,194-195.
Varma, S. D., Kinoshita, J. H. (1976) Biochemical Pharmocology, Vol 25, 2505-
2513.
Varma, S. D., Mikuni, I., Kinoshita, J. H. (1977 a) Science, Vol 195, 205-206
Varma, S. D., Mikuni, I., Kinoshita, J. H. (1977 b) Science, Vol 188, 1215-1216.
Venkutonis, P. R., Gruzdiene, D., Trizite, D., & Trizite, G. (2005). Assessment of
antioxidant activity of plant extracts by different methods. Acta Horticulturae, Vol
677, 99–107.
Yamagishi, M., Yamada, Y., Ozaki, K., Asao, M., Shimizu, R., Suziki,
M.Matsumato, M., Matsuoka, Y.,Matsumoto, K. (1992) Journal of Medicinal
Chemistry, Vol 35, 2085-2094.
Wilson, K.D., Bohren,K. M.,Gabay, K., Quiocho, F. A (1992), Science,Vol 257, 81-
84.

100
Wilson, K.D., Tarle, I., Petrash, J. M. (1993) Biochemistry, Vol 90, 9847-9851.
Wilson, K.D., (1992) Science, Vol257, 81-84.
Zargari, A.I. (1990). Medicinal plants.Tehran: Tehran University Press Vol. 1,77–81.