investigation into the feasibility of adding turbulators
TRANSCRIPT

University of Central Florida University of Central Florida
STARS STARS
Electronic Theses and Dissertations, 2004-2019
2018
Investigation into the Feasibility of Adding Turbulators to Rocket Investigation into the Feasibility of Adding Turbulators to Rocket
Combustion Chamber Cooling Channels Using a Conjugate Heat Combustion Chamber Cooling Channels Using a Conjugate Heat
Transfer Analysis Transfer Analysis
Tyler Buchanan University of Central Florida
Part of the Mechanical Engineering Commons
Find similar works at: https://stars.library.ucf.edu/etd
University of Central Florida Libraries http://library.ucf.edu
This Masters Thesis (Open Access) is brought to you for free and open access by STARS. It has been accepted for
inclusion in Electronic Theses and Dissertations, 2004-2019 by an authorized administrator of STARS. For more
information, please contact [email protected].
STARS Citation STARS Citation Buchanan, Tyler, "Investigation into the Feasibility of Adding Turbulators to Rocket Combustion Chamber Cooling Channels Using a Conjugate Heat Transfer Analysis" (2018). Electronic Theses and Dissertations, 2004-2019. 6007. https://stars.library.ucf.edu/etd/6007

INVESTIGATION INTO THE FEASIBILITY OF ADDING TURBULATORS TO ROCKET
COMBUSTION CHAMBER COOLING CHANNELS USING A CONJUGATE HEAT
TRANSFER ANALYSIS
by
TYLER SCOTT BUCHANAN
B.S.M.E., University of Central Florida, Orlando, 2016
A thesis submitted in partial fulfillment of the requirements
for the degree of Master of Science in Mechanical Engineering
in the Department of Mechanical and Aerospace Engineering
in the College of Engineering and Computer Science
at the University of Central Florida
Orlando, Florida
Summer Term
2018
Major Professor: Jayanta Kapat

ii
© 2018 Tyler Scott Buchanan

iii
ABSTRACT
A conjugate heat transfer analysis will be carried out to simulate an 89 kN thrust chamber
hydrogen cooling channel, to determine the feasibility of adding turbulators to the combustion
chamber cooling channels at various parameters such as angle, pitch, and height of the turbulator.
An existing regeneratively cooled chamber environment is simulated and used as a baseline case
to be compared against. The new design includes using ribbed turbulators or delta wedges in the
cooling channels to increase the heat transfer on the channel hot wall (wall adjacent to the hot gas
wall) and on the two channel sidewalls. With a higher heat transfer coefficient, the sidewalls
behave like fins for heat transfer and participate more in the overall heat transfer process in the
channel. Efficient rib and wedge geometries are chosen based on previous investigations. A
conjugate heat transfer analysis is performed using a straight duct with the rib and wedge
geometries included, with boundary conditions similar to those found in the combustion chamber,
to provide thermal hydraulic performance data at numerous turbulator configurations. The baseline
channel’s maximum hot wall temperature is the target maximum hot wall temperature that is
desired to be reduced. The goal is to reduce the hot gas side wall temperature at a minimal cost in
pressure drop.

iv
ACKNOWLEDGMENTS
I would like extend my gratitude to Dr.Kapat for allowing me the knowledge and
experience I’ve gained by being in the UCF CATER lab. I would also like to thank everyone at
lab who took the time to help me with this research; your efforts did not go unnoticed.

v
TABLE OF CONTENTS
LIST OF FIGURES ...................................................................................................................... vii
LIST OF TABLES .......................................................................................................................... x
NOMENCLATURE ...................................................................................................................... xi
ABBREVIATIONS ...................................................................................................................... xii
CHAPTER 1: INTRODUCTION ................................................................................................... 1
1.1 History of Rocketry ............................................................................................................... 1
1.2 Rocket Engine Cycles ........................................................................................................... 4
1.3 Rocket Cooling Methods ....................................................................................................... 8
1.4 Regenerative Cooling .......................................................................................................... 10
1.5 Motivation ........................................................................................................................... 15
1.6 Additive Manufacturing ...................................................................................................... 21
CHAPTER 2: LITERATURE REVIEW ...................................................................................... 23
2.1 LRE Cooling Channel Studies ............................................................................................ 23
2.2 Turbulators .......................................................................................................................... 25
CHAPTER 3: PROBLEM DEFINITION ..................................................................................... 28
CHAPTER 4: ANALYSIS OF BASELINE GEOMETRY .......................................................... 32
4.1 Geometry and Computational Domain ............................................................................... 32
4.2 Meshing and Assumptions .................................................................................................. 36
4.3 Baseline Results .................................................................................................................. 44
CHAPTER 5: ANALYSIS OF RIBBED TURBULATOR CASE............................................... 45
5.1 Ribbed Case Geometry and Domain ................................................................................... 45

vi
5.2 Meshing and Boundary Conditions ..................................................................................... 48
5.3 Ribbed Case Results ............................................................................................................ 50
CHAPTER 6: ANALYSIS OF WEDGE TURBULATORS ........................................................ 54
6.1 Initial Wedge Geometry and Domain ................................................................................. 54
6.2 Meshing and Boundary Conditions ..................................................................................... 56
6.3 Initial Wedge Results .......................................................................................................... 58
6.4 Multi-Configuration Wedge Geometry ............................................................................... 63
6.5 Multi-Configuration Wedge Results ................................................................................... 65
CONCLUSIONS........................................................................................................................... 77
FUTURE WORK .......................................................................................................................... 79
APPENDIX: MESH IMAGES ..................................................................................................... 80
REFERENCES ............................................................................................................................. 84

vii
LIST OF FIGURES
Figure 1: Robert Goddard with his first liquid fueled rocket [1] .................................................... 2
Figure 2: Expander Cycle LRE [3] ................................................................................................. 5
Figure 3: Gas Generator LRE [3].................................................................................................... 6
Figure 4: Staged Combustion LRE [3] ........................................................................................... 6
Figure 5: Diagram of Regeneratively Cooled Nozzle [5] ............................................................. 10
Figure 6: Heat Transfer Paths of Regenerative Cooling Channels ............................................... 14
Figure 7: Regen Cooling Visualization of Typical Thermal Gradient and Desired Mixing ........ 15
Figure 8: Coolant Wall Thickness vs Chamber Pressure and Their relationship with Heat
Transfer Limits of the Channel [7] ............................................................................................... 16
Figure 9: Gas Turbine and LRE Industry Progress [8] ................................................................. 17
Figure 10: Additively Manufactured Copper Thrust Chamber [11] ............................................. 22
Figure 11: 60-degree V-shaped broken rib configuration [16] ..................................................... 26
Figure 12: Backward Facing Delta Wedge Secondary Flows [19]............................................... 27
Figure 13: Cooling Channels as Applied and as Modeled ............................................................ 30
Figure 14: Contoured and Straight Channel Lengths ................................................................... 31
Figure 15: Entire Baseline Geometry ........................................................................................... 33
Figure 16: Cross Section of Baseline Channel ............................................................................. 33
Figure 17: Baseline Channel Geometry Domain as Simulated .................................................... 34
Figure 18: Baseline Channel Geometry Side View ...................................................................... 34
Figure 19: Baseline Channel Geometry Front View..................................................................... 35
Figure 20: Baseline Case Boundary Conditions ........................................................................... 36
Figure 21: Baseline Channel y+ Values for Mesh 1, Zoned in to Highest Values ....................... 38
Figure 22: Baseline Case Pressure Drop Convergence................................................................. 39
Figure 23: T-S Diagram for Hydrogen [23] .................................................................................. 41
Figure 24: Baseline Case Hot Gas Wall Temperature Profile ...................................................... 43
Figure 25: Baseline Case Hot Gas Wall Heat Flux....................................................................... 44
Figure 26: Ribbed Case Channel Geometry ................................................................................. 46
Figure 27: Ribbed Case Top Down View (top wall removed) ..................................................... 46

viii
Figure 28: Ribbed Case Side View from Midplane ...................................................................... 47
Figure 29: Ribbed Case Detailed Geometry ................................................................................. 48
Figure 30: Max Hot Gas Wall Temperature Convergence ........................................................... 49
Figure 31: Max y+ values for ribbed case mesh ........................................................................... 49
Figure 32: Rib Case Mesh Midplane Side View .......................................................................... 50
Figure 33: Hot Gas Wall and Hot Channel Wall Temperature Profiles of Rib Case and Baseline
Case ............................................................................................................................................... 51
Figure 34: Line Integral Convolution Generated Streamlines Along Channel Midplane with A)
Velocity Magnitude and B) Temperature Results Shown for Ribbed Case. Side View............... 52
Figure 35: Midplane Channel Bottom Wall HTC from Rib Case and Baseline Case .................. 53
Figure 36: Initial Wedge Case Detailed Geometry ....................................................................... 55
Figure 37: Initial Wedge Case Channel Geometry ....................................................................... 55
Figure 38: Initial Wedge Case Top Down View (top wall removed) ........................................... 55
Figure 39: Initial Wedge Case Side View from Midplane ........................................................... 56
Figure 40: Max Hot Gas Wall Temperature Convergence ........................................................... 57
Figure 41: Max y+ Values for Initial Wedge Case Mesh ............................................................. 57
Figure 42: Initial Wedge Case Mesh Midplane Side View .......................................................... 58
Figure 43: Hot Gas Wall and Hot Channel Wall Temperature Profiles of Initial Wedge Case and
Baseline Case ................................................................................................................................ 59
Figure 44: Initial Wedge Case Line Integral Convolution with Velocity Magnitude Shown Along
the First Wedge in the Axial Direction ......................................................................................... 60
Figure 45: Line Integral Convolution Generated Streamlines Along Channel Midplane with A)
Velocity Magnitude and B) Temperature Results Shown for Initial Wedge Case. Side View .... 61
Figure 46: Line Integral Convolution Generated Streamlines 0.07 mm above bottom channel
wall with A) Velocity Magnitude and B) Temperature Results Shown for Initial Wedge Case.
Top-Down View ........................................................................................................................... 62
Figure 47: Midplane Channel Bottom Wall HTC from Initial Wedge Case and Baseline Case .. 63
Figure 48: Max Hot Gas Wall Temperature vs Wedge Angle for Multi-Config Wedges ............ 66
Figure 49: Channel Pressure Drop vs Wedge Angle for Multi-Config Wedges .......................... 66
Figure 50: LIC with Vorticity Magnitude Shown for 80 and 20 Degree Wedges. Directly Aft of
the Wedge. .................................................................................................................................... 67

ix
Figure 51: Max Hot Gas Wall Temperature vs Wedge Height for Multi-Config Wedges ........... 68
Figure 52: Channel Pressure Drop vs Wedge Height for Multi-Config Wedges ......................... 68
Figure 53: LIC with Vorticity Magnitude Shown for 80 and 20 Degree Wedges. Directly Aft of
the Wedge. .................................................................................................................................... 69
Figure 54: Max Hot Gas Wall Temperature vs Wedge Pitch for Multi-Config Wedges ............. 70
Figure 55: Channel Pressure Drop vs Wedge Pitch for Multi-Config Wedges ............................ 70
Figure 56: Heat Flux Through Bottom Channel Wall and Wedges for Pitches of 1.61 and 1.04
mm with Constant Angle of 60 Degrees and e/D.h of 0.1 ............................................................ 71
Figure 57: h/h.0 vs f/f.0 for All Wedge Cases .............................................................................. 74
Figure 58: Feasibility Front Results Obtained by Analysis of Many Wedge Configurations ...... 75
Figure 59 Feasibility Front Results with All Wedge Cases Labeled ............................................ 75
Figure A.1: Baseline Mesh 1, Midplane Near Inlet ...................................................................... 81
Figure A.2: Baseline Mesh 2 ........................................................................................................ 81
Figure A.3: Baseline Mesh 3 ........................................................................................................ 82
Figure A.4: Baseline Cross-Sectional Velocity Profile ................................................................ 82
Figure A.5: Rib Case Mesh Midplane Side View near ribs .......................................................... 83
Figure A.6: Initial Wedge Case Mesh Midplane Side View near Wedges ................................... 83

x
LIST OF TABLES
Table 1: Nomenclature for Heat Transfer Equations .................................................................... 11
Table 2: Method of Transposition from Contour to Straight Channel.......................................... 31
Table 3: List of Mesh Sizes in Grid Convergence Investigation .................................................. 39
Table 4: Grid Convergence Investigation Results for Baseline Case ........................................... 40
Table 5: Entire Baseline Channel Dimensions ............................................................................. 42
Table 6: Baseline Case Boundary Conditions .............................................................................. 43
Table 7: Comparison of Results of Rib, Initial Wedge, and the Baseline Case ........................... 63
Table 8: Wedge Parameter Values for Multi-Configuration Study .............................................. 65
Table 9: Tabulated Results from All Wedge Cases ...................................................................... 73

xi
NOMENCLATURE
ℎℎ𝑔 = Hot Gas Heat Transfer Coefficient
𝑇𝑎𝑤 = Adiabatic Wall Temperature
𝑇ℎ𝑔𝑤 = Hot Gas Wall Temperature
𝑘 = Channel Wall Thermal Conductivity
𝑇𝑐𝑤 = Channel Wall Temperature
𝑇𝑐𝑤 = Channel Wall Temperature
𝑇𝑐,∞ = Channel Freestream Temperature
𝑇ℎ𝑔, ∞ = Hot Gas Freestream Temperature
𝑇0, ℎ𝑔 = Hot Gas Stagnation Temperature
𝑘 = Channel Wall Thermal Conductivity
𝑇𝑐𝑤 = Channel Wall Temperature
𝑇𝑐𝑤 = Channel Wall Temperature
𝑇𝑐,∞ = Channel Freestream Temperature
𝑇ℎ𝑔, ∞ = Hot Gas Freestream Temperature
𝑇0, ℎ𝑔 = Hot Gas Stagnation Temperature
𝑃 = Perimeter
𝐴𝑐 = Cross-sectional Area
𝑞ℎ𝑔′′ = Hot Gas Heat Flux
𝑞𝑐𝑜𝑛𝑑′′ = Heat Flux Through Channel
𝑞𝑐′′ = Coolant Wall Heat Flux
𝑞𝑠𝑤′′ = Sidewall Heat Flux

xii
ABBREVIATIONS
AR = Aspect Ratio
CC = Combustion Chamber
DMLS = Direct Metal Laser Sintering
HTC = Heat Transfer Coefficient
H = Height of Channel
D.h = Hydraulic Diameter
LRE = Liquid Rocket Engine
P = Pitch
e = Rib Height
SLM = Selective Laser Melting

1
CHAPTER 1: INTRODUCTION
1.1 History of Rocketry
Rocketry has enabled humans to reach the moon, and regularly access orbital positions
around the Earth. It has enabled manmade research vehicles to reach beyond the moon to
orbit, and land on, other planets and bodies in our solar system. It has even enabled manmade
vehicles to leave our solar system. Continually improving the technology of rocketry will
allow all the aforementioned accomplishments to become commonplace and allow for future
missions to reach every corner of our solar system, and further.
Robert Goddard built and flew the first liquid fueled rocket in 1926 [1]. He was first to
apply the de Laval nozzle (convergent-divergent (CD) nozzle) to a flow for the purpose of
thrust. Without the CD nozzle, rocket engines simply would not work, as they wouldn’t be
nearly as powerful as they are with a CD nozzle, and the supersonic flow in the engine would
not be possible. With thrust being equal to the mass flow rate times the velocity of the fluid,
the CD nozzle allowed the fuel and oxidizer products to be accelerated to an exhaust velocity
which would never be possible without it. Robert was not able to design and build robust
pump systems for his early rockets, but that technology would be developed over the rest of
the twentieth century. His first rockets used tank feed pressure systems to pressurize fuel and
oxidizers. His contributions laid the foundation for rocketry to begin its growth into what we
know it as today.

2
Figure 1: Robert Goddard with his first liquid fueled rocket [1]
In 1923 Goddard integrated regenerative cooling into an engine. He then dismissed the
idea as being too complex. This is ironic since nearly every liquid rocket manufactured today
utilizes regenerative cooling for some to all of their active cooling. Regenerative cooling is
such a vital part of modern rocketry that many engine’s nozzles are made completely out of
cooling channels.
From the V2 rockets used during WWII to the rockets made by the Americans and the
Soviets during the space race, most have been expendable one way or another. With
governments being the primary customer, cost was secondary to performance. This resulted
in expendable engines and vehicles becoming the low hanging fruit when it came to putting
humans and cargo into space. Technical difficulties also contributed to rockets becoming
expendable during this era. It would have required much more time to research methods to
fully reuse the rocket engines of the day. Some of these additional difficulties include taking

3
a body that could be traveling 5000+ km/hr and reversing its course. Reentry itself is a
process which subjects a vehicle to extreme environments. As far as the engines go, full
reusability requires a more robust design so the life of the components allow for reusability
under the extreme conditions that an engine experiences.
The United States’ Space Shuttle was a large-scale attempt to reuse rocket engines and
the entire vehicle. The Shuttle vehicle was made largely reusable thanks to the thermally
insulating tiles applied all over its body. These protected the Shuttle and its crew from the
high temperatures associated with reentry. The Space Shuttle Main Engines (SSME) were
made to be very robust. Still, they needed to be thoroughly inspected between flights and
often needed parts to be replaced and/or refurbished [2]. A contributing factor to increasing
the reusability of the engines was the type of fuel they used. The SSME’s used liquid
hydrogen and liquid oxygen for its propellants. The hydrogen was made to run through
cooling channels in the nozzle and combustion chamber to cool it. The nozzle was made of
the cooling channels. They served a double purpose, to act as a CD nozzle and to maintain
the nozzle wall temperature in an allowable range. An additional benefit of this method of
cooling is that after the fuel absorbs energy from the hot gas environment through the nozzle
wall, it then burns it to power the turbopumps. This reusing of the energy absorbed through
cooling is why this method of cooling is called regenerative cooling. This will be addressed
in greater detail later. Novel cooling methods like this are required to keep materials within
their structural safety limits.
In more recent years, there has been a push to drive down the cost of putting mass into
space. New competition in space flight providers has led to this renewed goal. An increasing

4
number of companies are attempting to put mass into orbit, and some are trying to go further.
Many companies are trying various approaches to reduce the cost to place payloads in orbit.
Reusability is believed to be one of the greatest ways to reduce the costs of operating a
space transportation service. Cost saving is probably the greatest pro of reusability. Instead of
buying X number of new engines that cost Y millions of dollars for each launch, use those
engines for 2, 3, or more launches. This is easier said than done however. When an engine is
expendable, the design reflects that by planning for an operating life on the order of minutes.
The cost of each engine is attempted to be kept to a minimum, but it seems that no amount of
cost savings for an engine can justify making it expendable, if reusable engines become a
viable option. For reusability, new designs are required that reflect an operating life on the
order of hundreds of minutes or more. Some of the most effective ways to increase
component life is to reduce mechanical stress and thermal loads. Reducing either of these
factors in rocket engines necessitates investigating new methods of operation and
manufacturing. There are techniques that may have been known in the past to improve life or
performance, but may not have been justified on an expendable engine. For instance, in the
past when it was desired to keep a nozzle wall below a certain temperature, the groups
involved may have opted to use methods that are typically acceptable for one flight engines,
such as ablative cooling, instead of more complex systems like regenerative or film cooling,
which could be used on more than one flight.
1.2 Rocket Engine Cycles
For liquid rocket engines, there are three primary types of engine cycles, expander, gas
generator, and staged combustion figures 2, 3, & 4, respectively. These cycles are defined by
what path the propellants take through the engine and by the method used to drive the turbine.

5
There are advantages to each engine, for instance, the three engine types vary in cost,
complexity, efficiency, power, and others. All cycles provide a method to run a compressor so
the desired chamber pressure can be maintained. Specific impulse (Isp) is how an engines
efficiency is measured. It tells how much thrust is achieved per unit of propellant mass used.
Figure 2: Expander Cycle LRE [3]

6
Figure 3: Gas Generator LRE [3]
Figure 4: Staged Combustion LRE [3]

7
An expander cycle uses heat picked up from cooling the combustion chamber and nozzle
to drive the turbine. Typically, as the fuel runs through regenerative cooling channels its
temperature has greatly increased. After exiting these channels, the fuel is then directed to the
turbine where it produces the power required to run the compressor. An advantage to this cycle is
that it can provide high Isp as the cooling channels are part of a closed system and the coolant is
also used as the propellant. Expander cycle engines are limited in the amount of thrust they can
provide, at about 300 kN [4]. This is because the nozzle gets larger, the nozzle wall heat
exchanger grows by the radius squared and the volume grows by the radius cubed. So, the heat
pickup is limited.
A gas generator cycle is where a small amount of propellant is burned upstream of the
main combustion chamber. The reactants are then used to drive a turbine, which in turn drives
the compressor. A unique feature of this cycle that the other two do not share is that, after the
propellant reactants make it across the turbine, it is exhausted out of the engine. This method
allows for the engine to be simpler than, and cheaper to manufacture than, expander and staged
combustion engines. A drawback to a gas generator cycle is that since the propellant is exhausted
overboard and not burned in the main combustion chamber, it typically has a lower Isp than the
other two cycles.
A staged combustion cycle is like a gas generator cycle, but instead of dumping the
turbine exhaust overboard, it is sent to the main combustion chamber. This way, instead of
sending mass and potentially unburned fuel overboard from the turbine exhaust, more energy can
be extracted from that mass by burning it further in the main combustion chamber and by
increasing the mass flow rate (slightly) through the C-D nozzle. Most configurations of staged
combustion cycle engines have either one or two preburners. These are where the initial

8
combustion occurs to drive the turbine or turbines. This cycle is the most complex of the three to
develop but offers higher Isp than a gas generator cycle and higher thrust potential than an
expander cycle.
1.3 Rocket Cooling Methods
Liquid rocket engines must use novel ways to maintain components within structural
limits. The combustion hot gas temperature is higher than the failure point and/or melting
point of the combustion chamber and nozzle. Typically, ablation cooling, thermal barrier
coatings, film cooling, and regenerative cooling are used to keep the engine cool enough to
operate properly.
Ablation cooling is when solid material on the walls sublimes and carries heat
away with it. An ablative material is applied to the interior wall of the combustion chamber
and/or the nozzle. This kind of treatment is usually intended for a single use. This method
does not usually effect Isp or performance of the engine. Due to its wearing away during
each use, ablation is not as promising as other cooling methods for reusability.
A thermal barrier coating (TBC) is a very thin layer of material that adheres to the
interior wall of the nozzle and/or chamber. This material has low thermal conductivity. Heat
travels slowly through a TBC layer, which means that the TBC surface in contact with the
nozzle/chamber wall maintains a lower temperature than the side exposed to the hot gas
environment. This helps to separate the wall from the hot gas environment. This method does
not usually effect Isp or performance. This method of cooling is usually not enough by itself,
so other methods of cooling must also be used. If other robust methods of cooling are “good
enough” (like regenerative cooling) then TBC isn’t applied because then it becomes an extra
cost.

9
Film cooling is when the interior wall of the chamber and/or nozzle is covered by a liquid
or gaseous film. This film is “placed” on the wall by specially designed ports within the walls
that release the fluid into the flow path in such a way so that it remains on the wall for as
long as possible. This layer on the wall serves to separate the wall from the hot gas
environment and provides more matter for the heat from the hot gas environment to travel
through before it gets to the nozzle/chamber wall. This method can be very effective at
maintaining thermal environments, but uses fuel as the film, which means less fuel enters the
chamber through the injectors to participate in combustion.
Radiation Cooling is typically used on upper stages of a vehicle. Upper stage engines
tend to be smaller than booster engines since most of the weight of the original vehicle is no
longer part of the accelerating mass. A nozzle which utilizes radiation as its method of
cooling usually weights less also, since it doesn’t need to be made to carry high pressure
coolant through its walls or adhere ablative material to it. In the low-pressure environment of
the upper atmosphere or in orbit larger nozzles are desired to improve thrust and Isp. Larger
area ratio nozzles make radiatively cooled nozzles even more advantageous than actively
cooled ones. The material is usually made of a metal or carbon composite that is capable of
handling high temperatures, beyond the melting point of more frequently used metals. When
heated up by the hot gas environment, the heat travels through the nozzle and radiates away
from the outer surface. Only the nozzle or nozzle extensions are made to be radiatively
cooled in large LRE’s as the material it’s made of is not strong enough to be used for the
combustion chamber. The following section will cover regenerative cooling.

10
1.4 Regenerative Cooling
Regenerative cooling may be the most robust method of cooling of the four mentioned
here. Usually fuel, sometimes oxidizer, is flowed through channels that makeup the
nozzle/chamber walls including hydrogen, rocket propellent-1 (highly refined kerosene),
liquid oxygen, or methane. The coolant comes from the pump system of the engine and can
enter from the forward or aft (near nozzle exit plane) part of the engine, as seen in figure 5.
Figure 5: Diagram of Regeneratively Cooled Nozzle [5]
The flowrate is fast enough and/or the temperature is low enough that, the wall
temperature can be maintained within thermal limits using this method. This method
improves Isp over not using it, as all the heat that is drawn out of the chamber/nozzle and
picked up by the coolant is then redirected to be used for the main combustion process. This
means that heat is not lost through cooling but is recaptured. Except for minor losses, all the
energy leaving the energy is through the nozzle, which improves the efficiency. Now that
reusability is becoming more desirable in the rocket industry, there is an incentive to improve

11
the thermal performance of regenerative cooling channels. This investigation aims to study
the feasibility of using wedge turbulators in a LRE chamber cooling channel environment to
determine if improved thermal performance is possible.
The heat entering the nozzle wall and traveling into the coolant channel can take two
paths, directly through the wall into the hot channel wall (channel bottom wall), or through
the channel sidewall and into the coolant flow. All variables in the following section can be
found in table 1.
Table 1: Nomenclature for Heat Transfer Equations
Starting with the hot gas environment, the driving temperature for heat transfer is the
adiabatic wall temperature. The adiabatic wall temperature can be related to the hot gas
environment by a recovery factor, equation (1). From this the adiabatic wall temperature can

12
be used to determine the heat flux into the chamber/nozzle wall, equation (2). The heat
transfer path through the chamber/nozzle wall itself depends on conduction paths, equation
(3). The path directly into the channel bottom wall also relies on typical convection, equation
(4).
(1)
(2)
(3)
(4)
The heat transfer path through the sidewalls can be analyzed like traditional heat transfer
fins. Equation (5) shows the typical fin heat transfer path for an infinitely long fin. The fin
efficiency can be evaluated from equation (6). The dependent values m, 𝐿𝑐, and, 𝜃𝑏 can be seen
in equations (7), (8), and (9), respectively. As the heat transfer coefficient on the sidewall
increases, the fin efficiency goes down. This implies that with an enhanced HTC on the sidewall,
other parameters can be adjusted to bring the fin efficiency back up, such as thickness of the
sidewalls.

13
(5)
(6)
(7)
(8)
(9)
Figure 6 shows a diagram of a regenerative cooling channel to illustrate the potential
paths for heat transfer to take.

14
Figure 6: Heat Transfer Paths of Regenerative Cooling Channels
The goal is to increase the HTC on the channel bottom wall and the sidewalls by adding
turbulators to the channel. This will increase mixing and disrupt the boundary layers that
normally exist on the flat channel bottom wall. Figure 7 gives a visualization of the typical
thermal gradient in a cooling channel and exaggerated vortices to increase mixing. The
vortex vector field equation (10) is the mathematical representation of vortices. For increased
mixing it is desired to increase the magnitude of �⃗⃗� .
(10)

15
Figure 7: Regen Cooling Visualization of Typical Thermal Gradient and Desired Mixing
1.5 Motivation
Lowering the hot gas wall temperature is an effective method to increase the life and reliability
of LRE’s. Quentmeyer et al [6] investigated the relationship between maximum hot gas wall
temperature and cycle fatigue life. Equation (11) explains that relationship 𝑁𝑓 is number of
cycles to failure and 𝑇𝑔𝑤 is the hot gas wall temperature. Lowering the maximum hot gas wall
temperature effectively increases the low cycle fatigue. If full reusability of LRE is to become a
reality, low cycle fatigue will be of great importance.
(11)
16
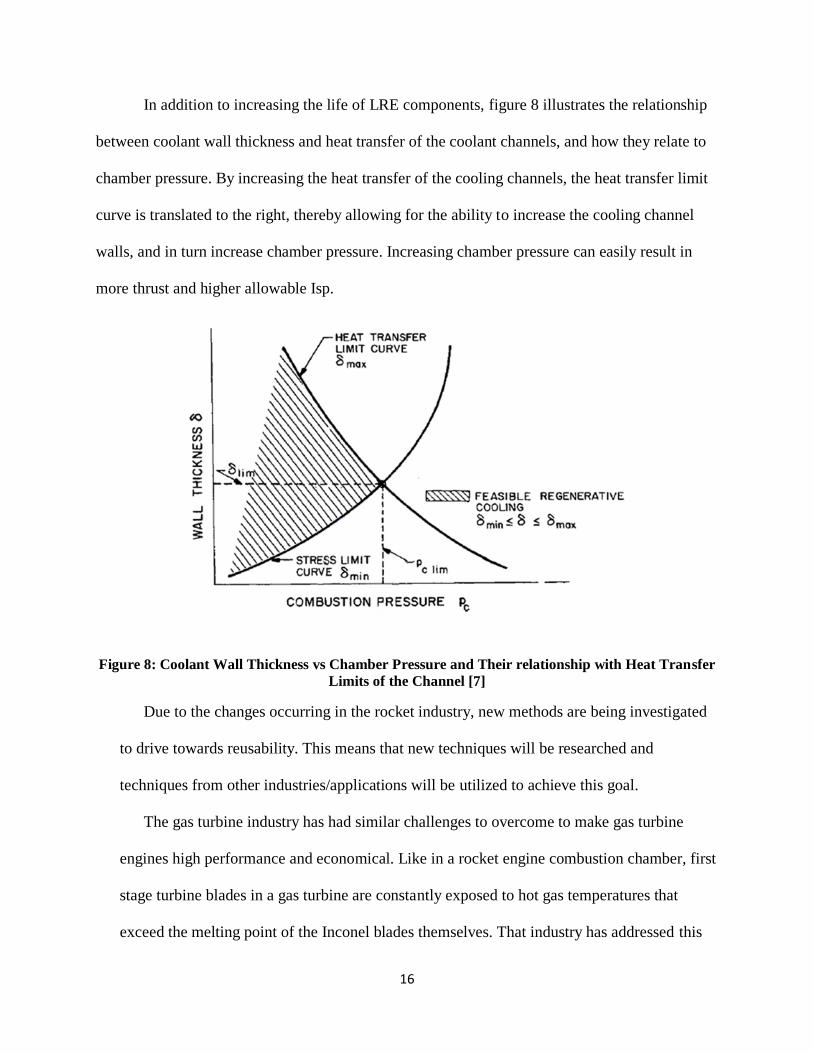
In addition to increasing the life of LRE components, figure 8 illustrates the relationship
between coolant wall thickness and heat transfer of the coolant channels, and how they relate to
chamber pressure. By increasing the heat transfer of the cooling channels, the heat transfer limit
curve is translated to the right, thereby allowing for the ability to increase the cooling channel
walls, and in turn increase chamber pressure. Increasing chamber pressure can easily result in
more thrust and higher allowable Isp.
Figure 8: Coolant Wall Thickness vs Chamber Pressure and Their relationship with Heat Transfer
Limits of the Channel [7]
Due to the changes occurring in the rocket industry, new methods are being investigated
to drive towards reusability. This means that new techniques will be researched and
techniques from other industries/applications will be utilized to achieve this goal.
The gas turbine industry has had similar challenges to overcome to make gas turbine
engines high performance and economical. Like in a rocket engine combustion chamber, first
stage turbine blades in a gas turbine are constantly exposed to hot gas temperatures that
exceed the melting point of the Inconel blades themselves. That industry has addressed this

17
by coming up with novel ways to keep gas temperatures high and maintaining the structural
integrity of the components exposed to it. Figure 9 shows the LRE industry progress
compared to the gas turbine industry. Green circles indicate methods utilized by the LRE
industry, and red circles indicate techniques utilized by the gas turbine industry but not the
LRE industry.
Figure 9: Gas Turbine and LRE Industry Progress [8]
Some of these novel heat transfer methods include internal duct cooling in the turbine
blades, film cooling on the surface of the turbine blades, pin fin cooling in the trailing edge
of the blades, and impingement cooling on the internal surfaces of the blades. The first of
these methods, internal duct cooling, is of interest to us because it one of the most adaptable
methods for systems other than turbine blades. Internal duct cooling in turbine blades consist
of cooling channels running through the internals of the blades. The purpose of adding

18
cooling channels here is to take excess heat out of/ away from the blade structure and prevent
overheating.
To make internal duct cooling more effective at removing heat, the gas turbine industry
investigated ways to improve the heat transfer rate of those channels. This goal was achieved
by adding turbulators to the channels to increase turbulence. Turbulators are variously shaped
(ribs, wedges, dimples, etc.) obstructions in the cooling channel/duct. These turbulators then
increase the amount of turbulence, and thus mixing, in the channel and increase the heat
transfer coefficient on the internal walls of the channel. The cost of this increased thermal
performance is an increase in pressure drop. Many factors account for the effectiveness and
efficiency of the turbulators thermal performance. The shape, size, amount, and angle of the
turbulators all affect the thermal performance. They change the amount, type, and
effectiveness of mixing. In addition, the thermal effects of the same geometry turbulator are
very different in different environments. For instance, a particular geometry may increase
heat transfer with an acceptable pressure drop increase at a low Reynolds number, but that
same geometry at a higher Reynolds number may yield prohibitively high pressure drop. All
these effects are balanced for optimized performance on the system level. So this method of
cooling a gas turbine blade may increase the pressure demands of the compressor portion of
the engine, but it enables higher temperatures at the first stage turbine blades, which leads to
greater thermal efficiency of the whole system. In gas turbines, despite the increased pressure
drop of the cooling channels, there is a net benefit in the overall system.
Liquid rocket engines also use cooling channels in extreme environments. The hot gas
temperature in a combustion chamber and nozzle is higher than the melting point of the
material that the chamber and nozzle are made of. As mentioned previously, rocket engine

19
cooling channels have almost all been smooth walled. This has been sufficient in the past, but
with increased competition, organizations are now looking at more novel methods for
improving their engines. Adding turbulators to cooling channels can potentially be one of
those novel methods for increasing engine performance. This investigation aims to study the
feasibility of using turbulators in rocket engine cooling channels. The main focus is to
determine how much the maximum hot wall temperature can be reduced with the addition of
turbulators. This aids in the life of the components, and helps the goal of reusability. Other
potential benefits include system level performance improvements. Increasing the amount of
heat picked up in the cooling channels allow for new performance regimes, especially in
expander cycle engines. There may be many other changes that can improve performance as
a result of the increased heat transfer rate in the channel. For instance, if the cooling channel
(with turbulators) is picking up more heat than required to maintain hot wall temperatures,
perhaps the coolant flow rate can be reduced to yield a more advantageous pressure drop
through the channels. This will of course change heat transfer characteristics of the cooling
channels and other factors, which means this would have to be an iterative process. Like the
gas turbines, there may exist a system balance which has improved performance despite the
pressure drop increase that comes with adding turbulators.
Internal cooling through a channel is a very wide field of study. Internal cooling is akin to
a regular heat exchanger, where the goal is to decrease (or increase) the amount of energy in
a fluid or solid while increasing (or respectively decreasing) the amount of energy in the
working fluid. In a rocket engine cooling channel, the goal is to decrease the temperature
(energy content) of the chamber and nozzles wall while increasing the amount of energy in
the coolant fluid.

20
High mass flow rates in narrow channels means liquid rocket engine cooling channels
have Reynolds numbers on the order of millions. The flow is turbulent as the Reynolds
number is well above the typical threshold of 5000 for the transition to turbulent internal
flow [9]. The standard heat transfer correlation for turbulent internal flow is the Dittus-Bolter
correlation for the Nusselt number. The Dittus-Bolter correlation, equation (12), is not
accurate at very high Reynolds numbers [9]. Nu is the Nusselt number, Re is the Reynolds
number, and Pr is the Prandtl number. To account for its inaccuracies, other factors are
applied to the standard correlation. These include things that are neglected by the Dittus-
Bolter correlation, like the ratio of wall density, viscosity, temperature, and pressure, to the
core density, viscosity, temperature, and pressure, respectively.
(12)
The aerospace industry has challenges that many other industries don’t typically need to
consider. For instance, for anything that goes into the air, weight is one of the most important
factors of the design. Safety is also of paramount concern. Since many aerospace applications
involve people, safety usually becomes the most important factor. Failsafe’s in the aerospace
industry are made to help preserve life in the event of an emergency. Even with a failsafe in
place, it is always possible that a failure might lead to an uncontrolled fall back to Earth.
These factors make the aerospace industry very conservative when it comes to implementing
new technologies and/or methods of operation. To my knowledge, a liquid rocket engine
with turbulators used in its cooling channels has not been flown before. This presents
increased difficulty, as new technology in the air is viewed with the most scrutiny, rightfully
so in the name of safety.

21
1.6 Additive Manufacturing
Up until recently, traditional manufacturing methods have been used to build rocket engines.
The amount of human labor required to manufacture rocket engines is astronomical. Also, many
engine components require custom made tools to manufacture. The increasing technology behind
additive manufacturing and its increasing use in industry are slated to change what
manufacturing will look like in the future.
Additive manufacturing has the potential to reduce the costs of rocket engine manufacturing
drastically. The cost savings of additive manufacturing comes from greatly reducing the need for
human labor and potentially eliminating the need for specialized machines.
Also, as additive manufacturing becomes increasingly relied upon and investigated, new
design parameters will be possible. Many geometries exist currently that are extremely expensive
or nearly impossible to build, such as, a channel with geometric features on its walls, or an
angled pipe or sheet with constant (not strained) structural properties throughout.
Additive manufacturing is the enabling technology this investigation. It allows complex
features to be applied to internal cooling channels on a scale which would otherwise be
prohibitively expensive, or nearly impossible to make. Even though very small features are now
possible, there are still drawbacks to additive manufacturing. One of the limitations with additive
manufacturing will always be its resolution. As long as it keeps improving, new applications for
it will be realized. At the time of this writing, commercially available resolution for a selective
laser melting (SLM) manufacturing process is 20 μm. [10]. It is reasonable to assume that the
technology will improve further and that the resolution will continue to improve. Today’s current
resolution limits are still an improvement over many current manufacturing techniques, for a

22
given tolerance and price. Figure 10 shows an additively manufactured copper thrust chamber
built by NASA, using SLM.
Figure 10: Additively Manufactured Copper Thrust Chamber [11]
A challenge of using additive manufacturing is the part’s surface roughness after the
printing is complete. The surface roughness various depending on the material used and the
quality and speed of the printer used. Typically, an additively manufactured part has a higher
surface roughness than a traditionally manufactured part. There are processes that can make
the surface smoother, but the effectiveness of this varies with material, part geometry, and
which method of 3-D printing was used.

23
CHAPTER 2: LITERATURE REVIEW
2.1 LRE Cooling Channel Studies
There is ongoing research into improving rocket technology. There are several focal points,
such as structures, thermal fluids, materials, and more. Within those groups the research focus is
further divided into things like, improving current engines/technology, investigating new
technologies, improving life, decreasing costs, and more. Much of the relevant research for the
current study has to do with improving current engines while looking through a thermal fluid
lens. The improvements can potentially improve performance, and/or life of components.
Wadel et al [12] investigated the effects of using very high aspect ratio cooling channels in a
combustion/thrust chamber. The study focused on optimizing the cooling channel aspect ratio in
the axial direction. The aspect channels ranged from 2.5 to 40. The goal of the study was to
reduce the maximum temperature of the hot gas wall.
A measure of used by Wadel to determine the effectiveness of the various designs was the rib
effectiveness parameter, equation (13) [12].
𝜀𝑟 = (2𝑘
ℎ𝑡)1/2
(13)
In equation (13), t is the rib thickness, h is the heat transfer coefficient, and k is the thermal
conductivity of the rib material. Note that “rib” in this context refers to the cooling channel
sidewalls, it does not imply the use of a turbulator. This is a useful metric for Wadel as in some
of the channel designs of that study, the channels bifurcated near the throat. This had the effect

24
of doubling the number of cooling channels near the throat and increasing their aspect ratio. This
drove down the t parameter in the rib effectiveness equation, thus increasing the effectiveness
value. In the current study, the aspect ratio is constant and the “rib” (channel sidewall) thickness
does not change.
The starting point for her study was a baseline channel with a constant aspect ratio of 2.5.
Seven other channel designs were simulated. The maximum hot gas wall temperature and
associated pressure drop for the baseline case are 764 K and 3.7 MPa, respectively. In the
various designs, the aspect ratio changed in the axial direction and some of the designs include
bifurcating the channels near the throat.
Wadel’s [12] investigation showed that increasing the aspect ratio of cooling channels is an
effective way to reduce the maximum hot gas wall temperature. The reduction in hot gas wall
temperature for the various cases ranged from 125 K to 164 K. The associated pressure drops for
the cases ranged from 3.7 MPa to 5 MPa. Wadel [12] also found that additional balances are
possible in thanks to the very high aspect ratio cooling channels. A balance between pressure
drop and max hot gas wall temperature could be reached. For instance, if the fin effect of the
channel sidewalls is greater, then the mass flow could be reduced to the point where the max hot
gas wall temperature is the same as the baseline case but the pressure drop through the channel
has decreased due to the lower mass flow rate. There also is the possibility of reducing the mas
hot gas wall temperature and reducing the channel pressure drop by balancing all the parameters,
such as aspect ratio, bifurcation, mass flow rate, and number of channels.
Another investigation into the aspect ratio of LRE cooling channels was done by Boysan et al
[13]. In that study aspect ratios from 0.8 to 8 were investigated. He modeled the cooling channels
after the baseline case from Wadel et al [12], then changed the parameters for further study. His

25
results also concluded that the high aspect ratio cooling channels proved to be more effective at
heat transfer than lower aspect ratio ones. However, he did find that high aspect ratio cooling
channels only improve heat transfer up to a point, then become less effective, as the area for heat
transfer reduces with high aspect ratios. Increasing the number of cooling channels without
changing aspect ratios was found to improve heat transfer up to a point then become less
effective as more channels are added, due to lower coolant velocity. More channels have a
favorable impact on pressure drop also, due to the coolant velocity reduction.
At the time of this writing only one study is known to include turbulators in LRE cooling
channels. A study by Hossain [14] was conducted where 90-degree square ribs were placed
perpendicular to the stream wise flow of a LRE cooling channel. They made their baseline
channel to match Wadel’s [12] baseline channel. They placed ribbed turbulators only near the
throat, as this is the area of the channel with the highest heat load. Their study found that that the
average reduction in the maximum hot gas wall temperature was approximately 36 K with a
coolant pressure drop increase of 0.33 percent.
2.2 Turbulators
When turbulators were first introduced, 90-degree square wedges [15] were the first
geometries studied. They were found to be able to increase the heat transfer coefficient (HTC) on
a wall, or walls, of a channel. The cost of the HTC increasing is that the pressure drop through
the channel also increases. The relationship between the HTC increase and the pressure drop
increase is not fixed, and is different shaped turbulators. Since the first turbulator studies, many
geometries have been studied and more efficient turbulators found.

26
Han et al [15] was among the first to investigate turbulators. The first studies looked into 90
(perpendicular to stream wise flow) degree square ribbed turbulators. His experiments consisted
of a channel with isothermal walls and air flowing through. From this he backed out an HTC and
a corresponding Nusselt (Nu) number correlation. The 90-degree square ribbed turbulators
proved to be able to increase the HTC in a channel, but also greatly increased the channel
pressure drop. A later study by Han et al [16] investigated potential ways to improve the
efficiency of ribbed turbulators. In this study, he experimented with several different
configurations of ribbed turbulators. The designs included using ribs at different angles to the
flow (i.e. not 90 degrees), separated (or “broken) ribs, and V shaped ribs with the midplane of
the channel acting as a line of symmetry. From these studies, he found that a design using 60-
degree V-shaped broken rib configuration performed the best, seen in figure 11. It proved to
increase the HTC more efficiently by increasing the number of secondary flows near the channel
wall, which improves mixing. It is this rib design that is utilized in the present study for the rib
case.
Figure 11: 60-degree V-shaped broken rib configuration [16]
It was found that other shaped turbulators can be more effective than ribbed shaped ones.
Wedge shaped turbulators were investigated by Han et al [18], and found to be more effective
than ribbed turbulators. Similar to the multiple rib configurations studied, Han [18] studied
multiple wedge configurations, like continues and broken wedges, and backward facing delta

27
wedges in different alignments. He found the backward facing delta shaped wedge to be the most
efficient at heat transfer enhancement in channels.
Valentino et al [18] studied numerous configurations of backward facing delta wedges in
a channel flow. The variations include different size wedges and half wedge shapes. All
configurations utilized 60-degree wedges, and one wedge per channel section, as opposed to side
by side wedges. More uniform HTC increases came from the whole wedges, which also had a
greater overall effect on HTC increases. The initial wedge case of the current study is based on
parameters in Valentino’s [18] study. The advantages of the backward facing delta wedge come
from its ability to efficiently create secondary flow vortices, as seen in figure 12.
Figure 12: Backward Facing Delta Wedge Secondary Flows [19]

28
CHAPTER 3: PROBLEM DEFINITION
As competition increases in the rocket industry, more organizations hope to set
themselves apart from other manufacturers. To do this, many organizations are looking for ways
to make their engines reusable, get more power out of them, and/or increase the overall
efficiency of the engine. Since a LRE is a thermal fluid centric system much of the ability to
make such improvements can be found in the fluid and/or thermal systems of the engine.
In the present study, an attempt is made to contribute to the above-mentioned
improvements by investigating the feasibility of using turbulators in rocket nozzle/combustion
chamber cooling channels. The hope is that the results show this to be a valid method to improve
the thermal hydraulic performance of such cooling channels and that the topic to be worth further
investigation. From this investigation will come a detailed look into the rib case and initial
wedge case described later, and a comparison of many different wedge configurations to be
compared by their ability to reduce the maximum hot gas wall temperature and their pressure
drop penalty.
The current study’s baseline model, and by extension, all that follow, is based on the
baseline channel design found in Wadel et al [12]. The channel design for that study was based
on an 89 kN thrust chamber. The thrust chamber had 100 cooling channels with a total of 2.3kg
of hydrogen flowing through them. The combustion environment was simulated. A test thrust
chamber was later built and tested using an optimal design as determined from the study.
The first large assumption of the present study is that of constant heat flux into the
system. The hot gas wall temperature from the Wadel’s [12] baseline case was used as the

29
boundary condition for the hot gas wall in the current study. From this simulation a hot gas side
wall heat flux was determined. This hot gas wall heat flux was then applied to all following cases
as the hot gas wall boundary condition. This allows the hot gas wall temperature to change and
the various cases to be compared against each other.
The second large assumption of the present study is that of geometric simplification. The
Wadel [12] baseline channel that the present study’s baseline channel is based on is contoured to
match the converging-diverging behavior of the thrust chamber. In the current study, this
chamber is represented by a straight channel, as seen in figure 13. This is done to simplify the
geometric domain and reduce the computational resources required for the model simulations. It
is assumed that the heat transfer difference of the contoured channel compared to the straight
channel is negligibly small. The effect of the contour on heat transfer is reduced even more when
turbulators are introduced, as they will be the primary drivers in any increasing heat transfer rate.
The coolant flows into the inlet which is near the exit plane of the thrust chamber and travels the
opposite direction of the hot gas flow.

30
Figure 13: Cooling Channels as Applied and as Modeled
The method used to transpose the coordinates of the contoured channel to the straight
channel are based on triangulating the axial distance from the throat and the radius (table 2
shown with point near the inlet). These two parameters are used to determine how far a point is
from the throat, which is then carried over to the straight channel. The throat is point zero,
downstream of the throat (near cooling channel inlet) are positive values, and upstream of the
throat (near cooling channel exit) are negative values. The effect is the straight channel is slightly
longer than the contoured channel as seen in figure 14. The baseline hot gas wall temperature is
then imposed on the straight channel, relative to the throat, the same as the contoured channel.

31
Table 2: Method of Transposition from Contour to Straight Channel
Figure 14: Contoured and Straight Channel Lengths

32
CHAPTER 4: ANALYSIS OF BASELINE GEOMETRY
A CFD analysis is performed on the baseline case to refine the domain mesh and extract a
boundary heat flux. This heat flux is applied as a boundary condition in the following
simulations. From each simulation pressure drop and wall temperature will be obtained. Other
information such as HTC and mixing can also be obtained from the simulations in order to
compare the thermal-hydraulic performance across various runs. The geometry, mesh, boundary
conditions, and assumptions about each case is discussed. Results are discussed for each case
then compared to one another. All cases were setup, meshed, and run using STAR-CCM+
version 11.06.011 commercial code.
4.1 Geometry and Computational Domain
The geometry for the baseline case is made to emulate the baseline case from Wadel’s [12]
baseline case. The geometry from that study is a convergent-divergent channel, while the current
study geometry is represented by a straight channel, as discussed in the previous section. The
converging-diverging channel is 31.8 cm in axial length and the straight channel is 33.7 cm in
axial length. Figure 15 shows the whole channel baseline geometry. Figure 16 is a cross section
of the baseline channel.

33
Figure 15: Entire Baseline Geometry
Figure 16: Cross Section of Baseline Channel

34
The channel has symmetry along the midplane from top to bottom. To reduce the
computational demand, half of the channel is modeled, as seen in figure 17. Channel side and
front views can also be seen in figures 18 and 19 respectively. All later geometries are also
symmetric along the midplane, so the baseline results can directly be compared to all
following cases. The baseline channel is also symmetric along the horizontal midplane
halfway up the channel, but the boundary conditions on the top and bottom walls are not the
same so it cannot be simplified in that manner. Also, later geometries will not be symmetric
on the mid horizontal plane. A point is made to setup and run the baseline case in such a way
that later cases require little change to their geometry and mesh.
Figure 17: Baseline Channel Geometry Domain as Simulated
Figure 18: Baseline Channel Geometry Side View
35
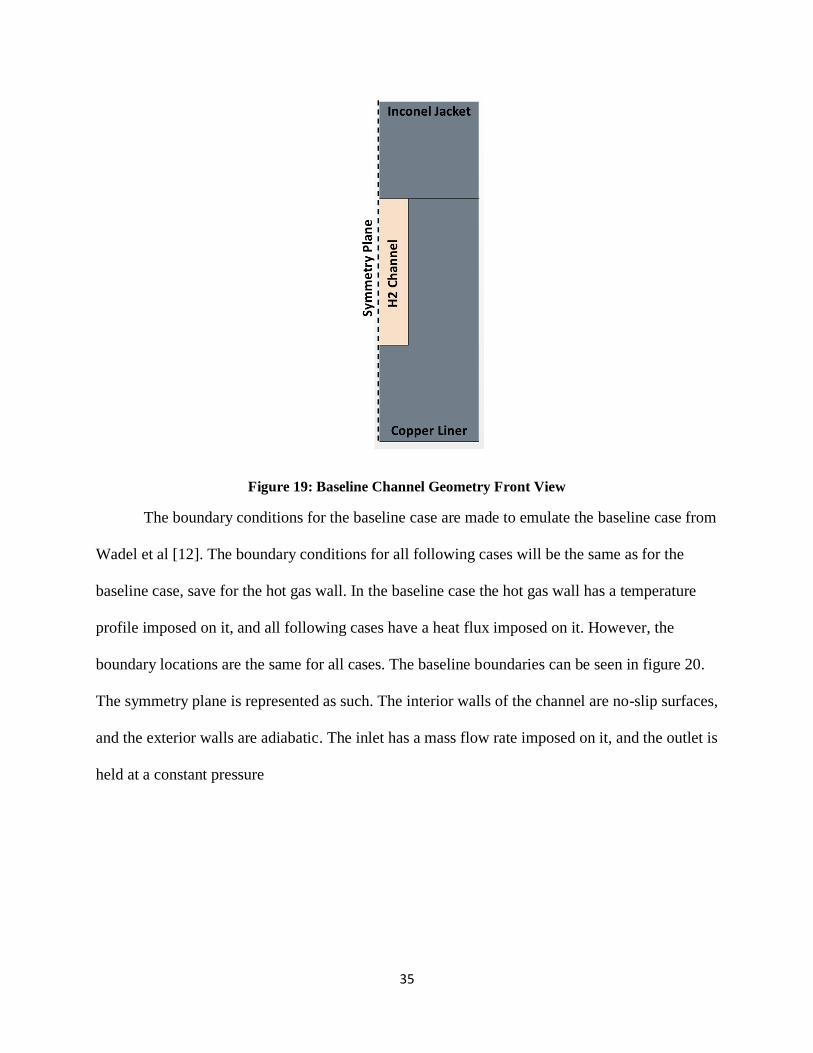
Figure 19: Baseline Channel Geometry Front View
The boundary conditions for the baseline case are made to emulate the baseline case from
Wadel et al [12]. The boundary conditions for all following cases will be the same as for the
baseline case, save for the hot gas wall. In the baseline case the hot gas wall has a temperature
profile imposed on it, and all following cases have a heat flux imposed on it. However, the
boundary locations are the same for all cases. The baseline boundaries can be seen in figure 20.
The symmetry plane is represented as such. The interior walls of the channel are no-slip surfaces,
and the exterior walls are adiabatic. The inlet has a mass flow rate imposed on it, and the outlet is
held at a constant pressure

36
Figure 20: Baseline Case Boundary Conditions
4.2 Meshing and Assumptions
A quality mesh is important for accurate simulations and results. All cases were meshed
and using STAR-CCM+ meshing tool. Due to the simple rectangular shape of the baseline
channel, a structured, trimmed, mesh was considered at first. This would work well with the
baseline geometry, but later cases with more complex geometry would not work will with a
structured mesh. To ensure the same mesh can be used for each case, a polyhedral mesh was
used instead of a trimmed mesh. Also, polyhedral cells resolve recirculation better than
tetrahedral cells, and require fewer cells [20]. Prism layers were also used on walls which
have a no-slip boundary condition. This is to resolve the hydrodynamic boundary layer. The
Advancing Layer Prism Mesher was used to build the prism layers. This method builds the
prisms from the wall outward and has less prism cell collapsing in corners.
Developing the appropriate mesh takes several iterations. There are key metrics that
affect the quality of the mesh. These include the skewness angle, the y+ value, and the base

37
cell size. The base cell size determines the size of the cells in the mesh volume, unless a
different local parameter is input, such as a prim layer near a wall, or a zone of refinement.
Info into more mesh parameters can be found in the Star User Guide, under Mesh Metrics
[22].
The skewness angle of a cell is the difference between the perpendicular vector on the
face of the cell and the line connecting the centroids of the cells. Higher angles can cause
divergence. It is desirable for the skewness angle of a mesh to be less than ninety degrees.
The y+ value is one of great importance. The flow through the channel in the current
study yields a very high Reynolds number, on the order of millions. This ensures that the
flow is turbulent [9]. In turbulent flows, the velocity profile near the wall is largely
influenced by the y+ value. This is because a region exists that is not suitable for modeling
purposes. This region, referred to as the buffer layer lays between y+ values of 5 to 30. The
log-law region exists above the buffer region at y+ values of 30 to 200. The region below the
buffer layer is called the viscous sublayer, which exists at y+ values of less than 5. The buffer
layer is not suitable for modeling because the log of the wall does not resolve velocity
accurately in this region.
𝑦+ =𝑦
𝜈√
𝜏𝑤
𝜌 𝑜𝑟 𝑦+ =
𝑦𝜇𝜏
𝜈 (14)
The channel Reynolds number is very high and correspondingly has high velocity. The
y+ parameter is indirectly affected by velocity, equation (14). It is a function of shear stress,
and higher velocities increase the shear stress. In the equation, y is the distance from the wall,
𝜈 is the kinematic viscosity, 𝜏𝑤 is the wall shear stress, 𝜌 is the fluid density, and 𝜇𝜏 is the
shear velocity. In order to drive down the y+ value in the model prism layers are used near
38
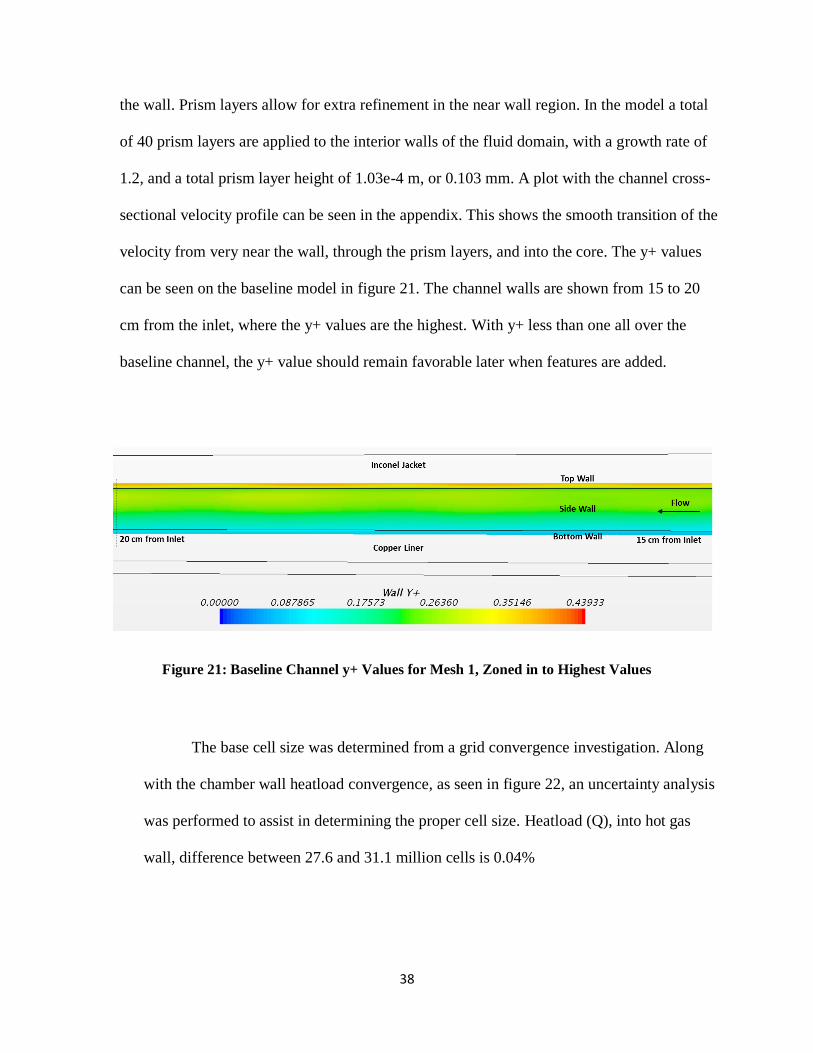
the wall. Prism layers allow for extra refinement in the near wall region. In the model a total
of 40 prism layers are applied to the interior walls of the fluid domain, with a growth rate of
1.2, and a total prism layer height of 1.03e-4 m, or 0.103 mm. A plot with the channel cross-
sectional velocity profile can be seen in the appendix. This shows the smooth transition of the
velocity from very near the wall, through the prism layers, and into the core. The y+ values
can be seen on the baseline model in figure 21. The channel walls are shown from 15 to 20
cm from the inlet, where the y+ values are the highest. With y+ less than one all over the
baseline channel, the y+ value should remain favorable later when features are added.
Figure 21: Baseline Channel y+ Values for Mesh 1, Zoned in to Highest Values
The base cell size was determined from a grid convergence investigation. Along
with the chamber wall heatload convergence, as seen in figure 22, an uncertainty analysis
was performed to assist in determining the proper cell size. Heatload (Q), into hot gas
wall, difference between 27.6 and 31.1 million cells is 0.04%

39
Figure 22: Baseline Case Pressure Drop Convergence
The method used for the uncertainty analysis is that as described by Celik et al [22]. The
method entails using at least three different mesh sizes to compare key parameters to each other
for the various mesh sizes. The mesh sizes used for the gird convergence investigation for the
current study can be seen in table 3. The three meshes from the grid convergence investigation
can be seen in the appendix. Mesh case one is the mesh that is used for the baseline simulation.
Table 3: List of Mesh Sizes in Grid Convergence Investigation
Volume Cell Count
Mesh 1 27612336
Mesh 2 16395027
Mesh 3 1482731

40
All boundary conditions for the grid convergence investigation are the same as they would be
for a normal simulation which is run for the purpose of obtaining results. The results from the
grid convergence investigation can be seen in table 4.
Table 4: Grid Convergence Investigation Results for Baseline Case
With the model being run using computational fluid dynamics (CFD), physics conditions
need to be established. The physics models and parameters are listed below:
For Fluid Region:
Steady State
3D
Reynolds Averaged Navier-Stokes (RANS)
Coupled Energy
Coupled Flow (2nd Order)
Gas: H2
Ideal Gas
Realizable K-Epsilon Turbulence (2nd Order), Two Layer
For Solid Regions:
Steady State
3D
Constant Density
dP 2.103 2.211 2.291 0.051 0.035 0.176 2.613 0.522
221.2 215.6 219.6 0.025 0.018 0.090 235.4 0.995
q'' 2.89E+04 2.82E+04 2.86E+04 0.024 0.014 0.071 3.03E+04 1.000
459.7 449.2 454.7 0.023 0.012 0.061 476.8 0.997
Extrapolated
ValueMesh 3 Mesh 2 Mesh 1 𝑎 2(%) 𝑎
21(%) 𝑓 𝑛 21
𝑡21 (%)
𝑇 𝑜 𝑡
𝑜 𝑡

41
Coupled Solid Energy
The hydrogen in the model is in supercritical form. This means that the fluid exceeds the
supercritical temperature and supercritical pressure. For hydrogen those are 1.3 MPa and 33
K, respectively. The inlet temperature of 44.4 K and outlet pressure of 11MPa means that at
the minimum temperatures and pressures of the channel, the fluid is still in the supercritical
region. It gets further away from the limits as it travels through the channel. Near the critical
limits, fluid properties can change greatly, but as you move away from the critical limits, a
supercritical fluid behaves like an ideal gas. Figure 23 shows a T-S diagram [23] for
hydrogen showing that the flow stays in the critical regime the entire time it is in the channel.
Figure 23: T-S Diagram for Hydrogen [23]

42
Table 5: Entire Baseline Channel Dimensions
The boundary conditions established for the baseline condition were made to emulate the
environment from the baseline study in Wadel’s [12] investigation. Dimensions of the whole
baseline channel from the current study can be seen in table 5. Half of one channel is represented
by the computational domain. With that, the inlet mass flow rate is keep at a constant 0.0115
kg/s. The outlet pressure is kept at 11 MPa, as this represents the chamber pressure from the
Wadel [12] study. The exterior walls are adiabatic, while the midplane of each region is defined
as a symmetry plane. The hot gas wall temperature profile from Wadel’s [12] baseline study,
figure 24, is applied to the hot gas side wall in the current studies model. Table 6 lists a summary
of baseline case boundary conditions.
Geometric ParameterFull
Channel
Computational
Domain
Channel Height [mm] 3.18 3.18
Channel Width [mm] 1.27 0.64
Aspect Ratio 2.50 2.50
Copper Liner Thickness [mm] 2.10 2.10
Inco Jacket Thickness [mm] 2.10 2.10
Sidewall Thickness[mm] 1.52 1.52
Total Width [mm] 4.32 2.16
Total Height [mm] 7.37 7.37

43
Figure 24: Baseline Case Hot Gas Wall Temperature Profile
Table 6: Baseline Case Boundary Conditions
Inlet Re Number 1.12E+06
Total ṁ (100 channels) [kg/s] 2.2
½ Channel ṁ [kg/s] 0.0115
Uniform Inlet Temperature [K] 44.4
Outlet Pressure [MPa] 11.0
Midplane condition Symmetry
Outer Wall Condition Adiabatic

44
4.3 Baseline Results
With the baseline analysis complete, results can be reviewed. The main goal of running the
baseline was to build and establish a quality mesh, determine a hot gas wall heat flux that can be
set as a boundary condition for the following cases, and to compare results from the following
cases. The pressure drop for the baseline case was found to be 2.29 MPa. The maximum hot gas
wall temperature (as applied) is 765 K. The heat flux going through the hot gas wall for the
baseline case can be seen in figure 25. Other results from the baseline case will be shown later as
a means to compare the following cases.
Figure 25: Baseline Case Hot Gas Wall Heat Flux
45
CHAPTER 5: ANALYSIS OF RIBBED TURBULATOR CASE
5.1 Ribbed Case Geometry and Domain
The focus of the current study is to test the feasibility of using turbulators in LRE cooling
channels. The intention was to do the primary analysis using wedged turbulators, as they are
believed to be more efficient than ribbed turbulators. However, much research has been done
on the topic of ribbed turbulators. For comparison purposes, a ribbed turbulator analysis if
carried out in the current study.
For both the ribbed case and the initial wedge case, the turbulators will not be place in the
entire channel. They will be place only in the near throat area where the heat flux is greatest
and the hot gas wall temperature is also the largest. The goal of the current investigation is to
reduce the hot gas wall maximum temperature. By placing turbulators only in the near throat
area, the benefits of increased mixing near the hottest part of the channel can be gained while
minimizing the pressure losses from the turbulators themselves. The near throat area is made
to be from -4.89 cm from the throat location to 2.97 cm from the throat location.
The geometry for the ribbed turbulator is influenced by Han’s [16] research on efficient
ribbed turbulator designs. In the current study, a sixty-degree broken V rib design is utilized,
as seen in figure 11. The channel with the rib feature can be seen in figure 26. A more
detailed image of the ribbed feature can be seen in figure 27 showing the top-down view of
the channel bottom wall, and figure 28 showing the side view from the midplane.

46
Figure 26: Ribbed Case Channel Geometry
Figure 27: Ribbed Case Top Down View (top wall removed)

47
Figure 28: Ribbed Case Side View from Midplane
The rib parameters from Han [16] are used as much as they can be applied. All the ribs
are square with a rib height to hydraulic diameter ratio (e/D.h) is 0.0625, and a rib height to pitch
ratio of 10. The detailed geometry can be seen in figure 29.

48
Figure 29: Ribbed Case Detailed Geometry
5.2 Meshing and Boundary Conditions
Meshing of the ribbed case was done using the same base parameters as the baseline case.
The region near the ribs however, on the channel bottom wall, has been refined so that the
recirculation, separation, and boundary layer disruption can be accurately resolved. The core of
the ribbed channel uses a base cell size of 6e-5, the same as the baseline case, but the refined
region near the featured wall uses a base cell size of 5.5e-5. Further refinement of the core and
the near rib area was tested. Those tests showed no appreciable difference in results. Figure 30
shows the max hot gas wall temperature convergence. The max temperature difference between
the 31.9 and 35.1 million cell meshes is 0.13%. Figure 31 shows the region of highest y+ values
in the domain, which still lie below 1.

49
Figure 30: Max Hot Gas Wall Temperature Convergence
Figure 31: Max y+ values for ribbed case mesh
The addition of features on the channel bottom wall affects the mesh. Figure 32 shows the
mesh from 0.05 mm away from the midplane side view (to show refinement zone). Another
image of the prism layer near the ribs is available in the appendix. Note that from the side view
one set of ribs from each pitch can be seen due to the broken configuration.

50
Figure 32: Rib Case Mesh Midplane Side View
The boundary conditions for the ribbed case are the same as in the baseline case, save for
the hot gas wall. The hot gas wall for the ribbed case has a heat flux applied to it which was
derived from the baseline case.
5.3 Ribbed Case Results
To investigate the feasibility of using turbulators in LRE cooling channels, the main
result of interest is the hot gas side wall temperatures. These can be seen in figure 33, where they
are compared against the baseline condition. Hot channel wall (bottom channel) temperatures are
also included, as the reduction in the hot channel wall (or bottom channel wall) temperatures is
what drives the reduction in the hot gas wall temperatures.
It is found that the hot gas wall maximum temperature from the rib case is 755 K. This
represents a reduction of only 10 K when compared to the baseline results. The pressure drop
through the channel of the rib case was 2.83 MPa. This is a 23.7% increase in pressure drop over

51
the baseline case. This could imply that using ribs in LRE cooling channels are likely not
feasible, as the slight reduction in hot gas wall temperatures is at a large pressure drop penalty.
A potential reason for the ineffectiveness of the ribbed geometry in the channel is its
effect of causing a step change in the oncoming flow. The flow which hits the leading edge of
the rib is forced to greatly reduce its velocity, due to the rib obstruction, and move largely over
the rib and also around the rib. Ninety-degree ribs have the effect of causing recirculation zones
just downstream of the trailing edge of the rib, from the core fluid which is reattaching to the
wall. This effect is reduced with the sixty-degree broken V rib configuration; however, the
square rib still appears to cause a great loss of pressure.
Figure 33: Hot Gas Wall and Hot Channel Wall Temperature Profiles of Rib Case and Baseline
Case

52
The sixty-degree broken V ribs, to the authors’ knowledge, have not been tested at such
high Reynolds numbers as was modeled in the current study, at about 1.1 million. This high
Reynolds number also corresponds to a high velocity. With high Reynolds number and high
velocity flow, the ribs may present an obstacle that cannot be traversed thoroughly by the flow,
as its stream wise momentum is too great. Figure 34 shows temperature and velocity overlaid on
streamlines from the midplane side view of the first 4 pitches of ribs, which because of the
staggered broken V shape, corresponds to 8 ribs. A zone of recirculation exists just downstream
of the trailing edge of the ribs. This effect contributes to the lack of mixing and the lack of a
substantial hot gas wall temperature reduction, due to lack of mixing.
Figure 34: Line Integral Convolution Generated Streamlines Along Channel Midplane with A)
Velocity Magnitude and B) Temperature Results Shown for Ribbed Case. Side View
From the overall channel perspective, the ribs do not efficiently mix the flow. The heat transfer
coefficient through the channel of the rib case compared to the baseline case can be seen in
figure 35.

53
Figure 35: Midplane Channel Bottom Wall HTC from Rib Case and Baseline Case

54
CHAPTER 6: ANALYSIS OF WEDGE TURBULATORS
6.1 Initial Wedge Geometry and Domain
The focus of the current study is to test the feasibility of using turbulators in LRE cooling
channels. Ribbed turbulators were analyzed for reference, but backward facing delta wedges
were the turbulator of greater interest. In this section the initial wedge case is discussed, then in
the following section, a multiple wedge configuration analysis is discussed. The purpose of
starting with an initial wedge geometry is to serve as a starting point for later comparison and to
start with a geometry that is believed to be of high thermal hydraulic performance.
The geometry for the initial wedge case turbulator is obtained largely from Valentino’s [18]
research, who used a single larger wedge in a channel as opposed to multiple smaller ones. The
initial wedge case turbulators are backward facing delta wedges, with a rib height to hydraulic
diameter ratio (e/D.h) is 0.1, as per [18], a wedge angle of sixty degrees, as per [16] and a rib
height to pitch ratio of 8.85. Detailed geometry can be seen in figure 36. The channel with the
initial wedge feature can be seen in figure 37. A more detailed image of the initial wedge feature
can be seen in figure 38 showing the top-down view of the channel bottom wall, and figure 39
showing the side view from the midplane.
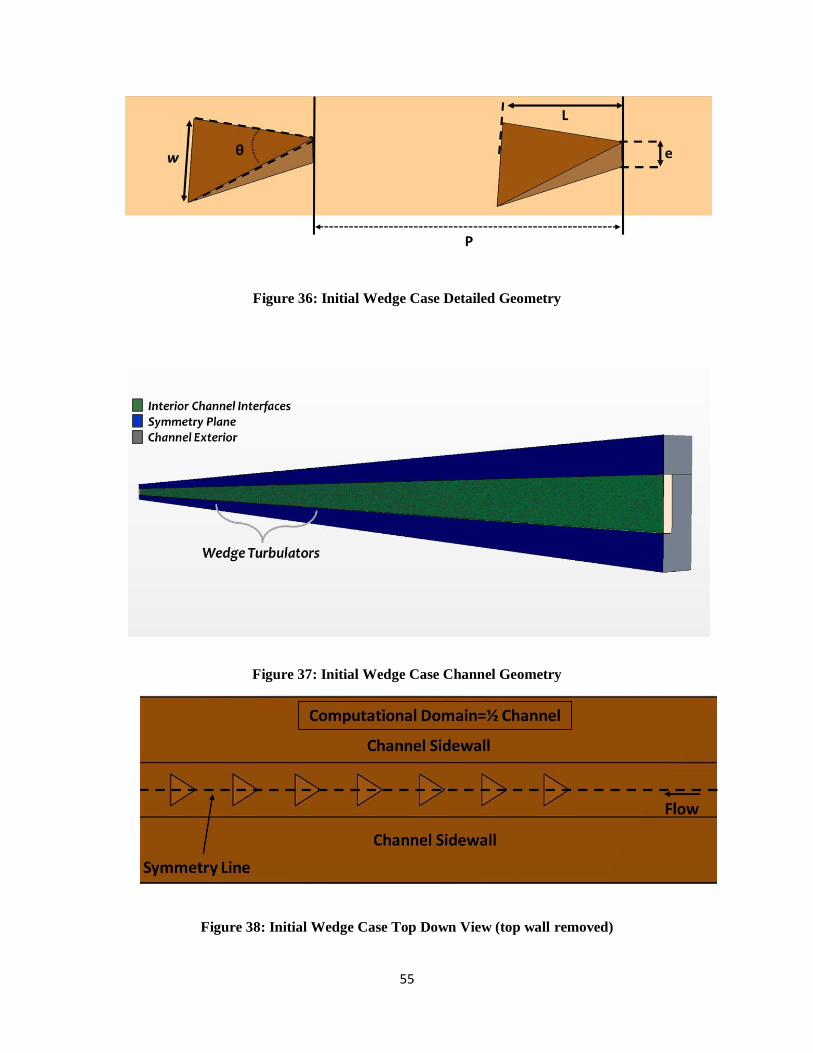
55
Figure 36: Initial Wedge Case Detailed Geometry
Figure 37: Initial Wedge Case Channel Geometry
Figure 38: Initial Wedge Case Top Down View (top wall removed)

56
Figure 39: Initial Wedge Case Side View from Midplane
6.2 Meshing and Boundary Conditions
Meshing of the initial wedge case was done using the same base parameters as the baseline
case and rib case. The region near the wedges however, on the channel bottom wall, has been
refined so that the recirculation, separation, and boundary layer disruption can be accurately
resolved. The core of the ribbed channel uses a base cell size of 6e-5, the same as the baseline
case, but the refined region near the featured wall uses a base cell size of 5.5e-5. Further
refinement of the core and the near rib area was tested. Those tests showed no appreciable
difference in results.
The addition of features on the channel bottom wall affects the mesh. Figure 42 shows the
mesh from the midplane side view. A view of the initial wedge case mesh closer to the prism
layers can be found in the appendix. Figure 40 shows the max hot gas wall temperature

57
convergence. The max temperature difference between the 29.5 and 31 million cell meshes is
0.08%. Figure 41 shows the region of highest y+ values in the domain, which still lie below 1.5.
Figure 40: Max Hot Gas Wall Temperature Convergence
Figure 41: Max y+ Values for Initial Wedge Case Mesh

58
Figure 42: Initial Wedge Case Mesh Midplane Side View
The boundary conditions for the initial wedge case are the same as in the baseline case
and rib case, save for the hot gas wall. The hot gas wall for the initial wedge case, like the rib
case, has a heat flux applied to it which was derived from the baseline case.
6.3 Initial Wedge Results
The main result of interest is the hot gas side wall temperatures, to study the feasibility of
using wedges in LRE cooling channels. These can be seen in figure 43, where they are compared
against the baseline condition. Hot channel wall (bottom channel wall) temperatures are also
included, as mentioned before, the reduction in the hot channel wall (or bottom channel wall)
temperatures is what drives the reduction in the hot gas wall temperatures.
It is found that the hot gas wall maximum temperature from the initial wedge case is 661
K. This represents a reduction of 104 K when compared to the baseline results. The pressure

59
drop through the channel of the initial wedge case was 2.58 MPa. This is a 12.4% increase in
pressure drop over the baseline case. This implies that using the initial wedge geometry in LRE
cooling channels are more feasible than sixty-degree broken V shaped ribs, as used in the rib
case. The hot gas wall temperature has been reduced over ten times more than the ribbed case,
and the pressure increase (as a percentage of original pressure drop) is about half of what it is in
the ribbed case.
Figure 43: Hot Gas Wall and Hot Channel Wall Temperature Profiles of Initial Wedge Case and
Baseline Case
A potential reason for the effectiveness of the initial wedge geometry in the channel is
how it mixes. A backward facing wedge does more efficiently what a ribbed turbulator intends to
do. For instance, the square rib directs flow laterally around it, but it also directs flow directly
over it which, which increase pressure losses. The backward facing delta wedge on the other

60
hand, serves to separate the flow laterally, while forcing very little fluid to abruptly change
direction by moving completely over the wedge. This lateral separation of the oncoming flow
turns into vortices which rotate largely normal to the stream wise direction, which means it can
increase mixing on the featured surface and maintain its stream wise momentum much better
than the ribbed case. When these vortices are created near the surface, due to the conservation of
angular momentum, mirrored vortices are created alongside them closer to the core, which
further increases mixing. There are also secondary vortices which occur when the flow reaches
the end of the wedge near the channel wall surface and begin to rotate due to the lower pressure
fluid traveling down the backward face of the wedge. Vortices are also created as the flow passes
the edge wall of the wedge and mixes with the lower pressure fluid traveling down the backward
face of the wedge. The mentioned vortices can be seen in figure 44. This axially rotating
(swirling) motion is more efficient for mixing the flow than rib induced rotation which creates
recirculation zones. The swirling of the fluid mixes the fluid from the hot wall nearer the core.
Figure 44: Initial Wedge Case Line Integral Convolution with Velocity Magnitude Shown Along the
First Wedge in the Axial Direction

61
The initial wedge case geometry, to the authors knowledge, have not been tested at such high
Reynolds numbers as was modeled in the current study, at about 5.6 million. Wedges appear to
mix the flow better than the rib case geometry in this high Reynolds number flow. This could be
due to the method by which the wedge creates vortices as opposed to the rib case geometry, as
discussed earlier. Figure 45 shows temperature and velocity overlaid on streamlines from the
midplane side view of the first four wedges. Figure 46 shows temperature and velocity overlaid
on streamlines from the top-down view (0.07mm from surface) of the first four wedges. It can be
seen that mixing near the hot channel wall (channel bottom wall) surface is much greater than the
mixing caused by the rib case.
Figure 45: Line Integral Convolution Generated Streamlines Along Channel Midplane with A)
Velocity Magnitude and B) Temperature Results Shown for Initial Wedge Case. Side View

62
Figure 46: Line Integral Convolution Generated Streamlines 0.07 mm above bottom channel wall
with A) Velocity Magnitude and B) Temperature Results Shown for Initial Wedge Case. Top-Down
View
From the overall channel perspective, the initial wedges are much more feasible than the
ribbed case. The heat transfer coefficient through the channel of the initial wedge case compared
to the baseline case can be seen in figure 47. Table 7 compares the results of the initial wedge
case, ribbed case, and the baseline case.

63
Figure 47: Midplane Channel Bottom Wall HTC from Initial Wedge Case and Baseline Case
Table 7: Comparison of Results of Rib, Initial Wedge, and the Baseline Case
6.4 Multi-Configuration Wedge Geometry
After analyzing the initial wedge design, an analysis is conducted on numerous wedge
configurations. Of interest in this study is how the various configurations compare against each
Case Baseline Rib Initial Wedge
Maximum Hot Wall Temp [K] 765 755 661
Max Temp Reduction [K] N/A 10 104
Pressure Drop Through Channel [MPa] 2.29 2.83 2.58
Pressure Drop Increase [%] N/A 23.65 12.40
Baseline, Rib, & Initial Wedge Results

64
other. It reveals which wedge configuration is most efficient of those studied in the current
investigation. In order to parameterize the various wedge configurations, it was determined that
three factors of the wedge geometries would change, which are factors frequently studied. The
wedge angle, the wedge height, and the wedge pitch changes. The angle has a great effect on
mixing and how vigorously the flow is redirected toward the sidewalls. The height determines
how much of the flow is pierced by the feature, which causes mixing further from the feature
wall surface. The pitch has the effect of determining how periodically the flow will be tripped,
thus causing more or less mixing depending on how far apart the feature are.
The initial wedge configuration was sixty degrees. In the multi wedge analysis, the wedge
angles studied are twenty, fourth, sixty, and eighty degrees. The eighty degrees came from a
geometric limitation of the channel, it is the largest angle that can be used without completely
blocking the flow near the surface. Intervals of twenty the initial sixty lead to the forty and
twenty-degree wedges.
In the initial wedge case, the wedge height is related to wedge height and the hydraulic
diameter by e/D.h. For the initial wedge case that ratio is equal to 0.1. To establish bounds for
the multi configuration analysis, it was determined that the wedges used will also include wedge
height to hydraulic diameter ratios (e/D.h) of double (0.2) and half (0.05) of the initial wedge
case’s ratio of 0.1. In absolute terms that comes to a height of 0.09 mm for e/D.h of 0.05, a
height of 0.18 mm for e/D.h of 0.1, and 0.36 mm for e/D.h of 0.2.
The pitch of the initial wedge case is 1.1 mm. This means that every 1.6 mm a new
wedge begins. This corresponds to a total of 49 wedges in the channel, in the near throat region.
Like the wedge height, it is desired to double, and halve the pitch. This however cannot be done,
as if the pitch were to halve, the wedge features would interfere with each other, occupying the

65
same space. With this in mind, the wedge configurations studied utilized pitches that were,
doubled at 3.3 mm and corresponding to 24 total wedges in the channel near throat region, and
reduced to two thirds of the initial wedge pitch at 1.1 mm, which corresponds to 74 total wedges
in the channel near throat region.
In total Thirty-six different configurations of a delta wedge in the present study’s cooling
channel were simulated. Wedge angle, wedge height, and pitch were the three parameters that
were varied for the multiple configuration study. Table 8 shows the parameters that were varied
and by how much.
Table 8: Wedge Parameter Values for Multi-Configuration Study
6.5 Multi-Configuration Wedge Results
It is desired to investigate the effects of the parameters on the thermal performance of each
geometry. Figures 48 and 49 show the max hot gas wall temperature and channel pressure drop,
respectively, for the multi-configuration cases with respect to their angle. The plotted
Wedge Angle θ [Degrees] 20 40 60 80
Absolute [mm] 0.09 0.18 0.36
e/D.h 0.05 0.1 0.2
Absolute [mm] 1.06 1.61 3.28
# of Wedges 74 49 24
Initial Scale 2/3 1 2
Length (L, fixed) = 0.64 mm Width (W, variable) = f(θ)
Wedge Height e [mm]
Pitch

66
configurations colors and shapes represent; height (e/D.h) = 0.05 (blue), 0.1 (orange), 0.2
(green), and pitch (mm) = 1.06 (triangle), 1.61 (circle), 3.28 (square). The plots show that there
is a large decrease in max temperature as the wedge angle is increased from 20 to 40 degrees,
then the returns begin to diminish as the wedge angle is further increased. The pressure drop on
the other hand seems to continue to increase as the wedge angle is increased further.
Figure 48: Max Hot Gas Wall Temperature vs Wedge Angle for Multi-Config Wedges
Figure 49: Channel Pressure Drop vs Wedge Angle for Multi-Config Wedges

67
Figure 50: LIC with Vorticity Magnitude Shown for 80 and 20 Degree Wedges. Directly Aft of the
Wedge.
Figure 50 shows the Line Interval Convolution plots (LIC) for 80 and 20-degree cases with a
constant e/D.h of 0.1 and a constant pitch of 1.61 mm. The larger wedge angle creates vortices
over a larger area of the bottom wall surface thereby improving mixing. Their larger angle
increases pressure drop continually because it represents a larger obstacle for the flow to
overcome.
Figures 51 and 52 show the max hot gas wall temperature and channel pressure drop,
respectively, for the multi-configuration cases with respect to their height. The plotted
configurations colors and shapes represent; Angle (Deg) =20 (grey), 40 (blue), 60 (orange), 80
(green), and pitch (mm) = 1.06 (triangle), 1.61 (circle), 3.28 (square). The plots show that there

68
is a continual decrease in max temperature as the wedge height is increased from an e/D.h value
of 0.05 to 0.2. The pressure drop also continues to raise as the wedge height increases.
Figure 51: Max Hot Gas Wall Temperature vs Wedge Height for Multi-Config Wedges
Figure 52: Channel Pressure Drop vs Wedge Height for Multi-Config Wedges

69
Figure 53: LIC with Vorticity Magnitude Shown for 80 and 20 Degree Wedges. Directly Aft of the
Wedge.
Figure 53 shows the Line Interval Convolution plots (LIC) for an e/D.h value of 0.05 and 0.2,
with a constant angle of 60 degrees and a constant pitch of 1.61 mm. The taller rib, by
penetrating the flow more than a shorter one, serves to create a swirling effect in the fluid
parallel with the flow direction that extends further from the bottom channel wall. This larger
vortex created serves to increase mixing which helps lower the max hot gas wall temperature, but
it also contributes to a greater pressure loss in the channel due to the increased chaos of the fluid
near the bottom wall.
Figures 54 and 55 show the max hot gas wall temperature and channel pressure drop,
respectively, for the multi-configuration cases with respect to their pitch. The plotted
configurations colors and shapes represent; Angle (Deg) =20 (grey), 40 (blue), 60 (orange), 80

70
(green), and height (e/D.h) = 0.05 (triangle), 0.1 (circle), 0.2 (square). The plots show that there
is a decrease in max hot gas wall temperature as the pitch changes from 1.06 to 1.61 mm, then an
increase as the pitch increases again to 3.28. The pressure drop on average is lowest for the
largest pitch of 3.28 mm. It is similar for the 1.06 and 1.61mm pitches with exaggerated pressure
drops for the larger angle wedges.
Figure 54: Max Hot Gas Wall Temperature vs Wedge Pitch for Multi-Config Wedges
Figure 55: Channel Pressure Drop vs Wedge Pitch for Multi-Config Wedges

71
Figure 56: Heat Flux Through Bottom Channel Wall and Wedges for Pitches of 1.61 and 1.04 mm
with Constant Angle of 60 Degrees and e/D.h of 0.1
Figure 56 shows the heat flux through the bottom channel wall and wedges. It shows that the
downwash zone aft of the wedge is an area that sees increased flux. This may help reduce the
max temperature of the 1.61 mm pitch configurations compared to the 1.04 mm pitch
configurations by increasing the surface area on the bottom channel wall in the downwash zone
where the increased heat transfer is occurring. For the largest pitch of 3.28 mm the wedges

72
communication between one another is much less than the lower pitch cases. The increased
pressure drop of the 1.61mm pitch configuration over the 1.04 mm pitch configuration is
exaggerated with higher angle and height wedges, and may also result from the increased bottom
wall surface area and more room for reattachment of the boundary layer, which when disrupted
again contributes to increasing pressure losses.
Table 9 shows the tabulated results of all the multi-configuration wedge cases. In the baseline
case twice as much heat traveled through the channel sidewall than the bottom channel wall. The
sidewall makes up about 70 percent of the channel surface area and the bottom wall only about
15 percent. In all other cases with wedges, the flux through the bottom wall increased and the
flux through the sidewalls decreased. This is due to the wedges increasing the HTC on the
bottom wall much more effectively than on the sidewalls. As the max hot wall temperature
decreases, the ratio of sidewall flux to bottom wall flux also decreases. Figure 57 shows the h/h.0
(channel average HTC over Baseline channel average HTC) and f/f.0 (channel friction factor
over Baseline friction factor) for all wedge cases run. The HTC and Darcy friction factor used
for this calculation can be seen in equations (15) and (16), respectively. Some configurations are
more efficient by increasing the HTC with little increase in the friction factor. The baseline
channel average HTC is 2.39e5 W/m2K and the baseline Darcy friction factor is 0.01696.
(15)
(16)

73
Table 9: Tabulated Results from All Wedge Cases
Angle Pitch Wedges dP
Degrees mm Total K MPa
765 2.29 1.00 1 2.08 1
20 0.1 1.61 49 725 2.44 1.18 1.06 1.72 0.98
20 0.1 3.28 24 748 2.31 1.12 1.01 1.93 0.99
20 0.1 1.06 74 706 2.40 1.21 1.02 1.61 0.95
20 0.2 1.61 49 701 2.53 1.21 1.11 1.65 0.97
20 0.2 3.28 24 713 2.36 1.19 1.05 1.66 0.96
20 0.2 1.06 74 697 2.47 1.25 1.10 1.61 0.96
20 0.05 1.61 49 710 2.36 1.17 1.02 1.58 0.92
20 0.05 3.28 24 764 2.31 1.10 1.00 1.89 1.00
20 0.05 1.06 74 737 2.35 1.15 1.01 1.73 0.97
40 0.1 1.61 49 675 2.52 1.27 1.07 1.53 0.92
40 0.1 3.28 24 703 2.36 1.20 1.02 1.59 0.93
40 0.1 1.06 74 693 2.41 1.25 1.08 1.60 0.95
40 0.2 1.61 49 658 2.76 1.28 1.19 1.55 0.93
40 0.2 3.28 24 685 2.48 1.24 1.06 1.56 0.92
40 0.2 1.06 74 688 2.69 1.24 1.20 1.62 0.95
40 0.05 1.61 49 698 2.40 1.25 1.06 1.58 0.94
40 0.05 3.28 24 743 2.32 1.13 1.01 1.83 0.98
40 0.05 1.06 74 701 2.41 1.22 1.03 1.60 0.95
60 0.1 1.61 49 661 2.58 1.28 1.10 1.52 0.91
60 0.1 3.28 24 666 2.58 1.28 1.12 1.53 0.93
60 0.1 1.06 74 694 2.55 1.27 1.17 1.62 0.95
60 0.2 1.61 49 657 2.83 1.28 1.24 1.61 0.93
60 0.2 3.28 24 679 2.73 1.24 1.19 1.59 0.94
60 0.2 1.06 74 673 2.79 1.26 1.27 1.62 0.94
60 0.05 1.61 49 689 2.41 1.27 1.06 1.53 0.93
60 0.05 3.28 24 735 2.38 1.19 1.08 1.77 0.98
60 0.05 1.06 74 699 2.52 1.25 1.12 1.57 0.95
80 0.1 1.61 49 660 2.63 1.28 1.14 1.52 0.91
80 0.1 3.28 24 670 2.62 1.24 1.20 1.62 0.97
80 0.1 1.06 74 690 2.59 1.26 1.17 1.58 0.95
80 0.2 1.61 49 656 2.90 1.29 1.29 1.61 0.93
80 0.2 3.28 24 675 2.74 1.25 1.23 1.61 0.96
80 0.2 1.06 74 665 2.82 1.27 1.29 1.61 0.96
80 0.05 1.61 49 686 2.46 1.23 1.08 1.52 0.93
80 0.05 3.28 24 733 2.41 1.20 1.10 1.75 0.97
80 0.05 1.06 74 680 2.54 1.24 1.13 1.57 0.95
Baseline Case

74
Figure 57: h/h.0 vs f/f.0 for All Wedge Cases
Figure 58 shows the feasibility front with all wedge cases run. It reveals what thermal
performance is possible with the investigated geometries. To the left of the front is not possible
to reach, and to the right is a sub-optimal area where the temperature decrease is at a greater
pressure loss. The front is made of points laying closest to the x and y axis. The best tradeoff
point is the point closest to the origin in the plot. Figure 59 shows the feasibility front with all
wedge cases labeled. No cases with a pitch of 1.06 mm lay on the front, indicating that is not an
efficient configuration. Smaller wedge angles and heights are nearer the left end of the plot while
larger wedge angles and heights are nearer the right end of the plot.

75
Figure 58: Feasibility Front Results Obtained by Analysis of Many Wedge Configurations
Figure 59 Feasibility Front Results with All Wedge Cases Labeled

76
Using the best tradeoff case, the low cycle fatigue can be determined for the potential use of
wedges in LRE cooling channels. To start, the baseline maximum hot gas wall temperature is
765 K with the number of cycles to failure (based on equation 11) equal to 330. The best tradeoff
case has a max hot gas wall temperature of 689 K and the number of cycles to failure is 549.
This is a large increase in component life.

77
CONCLUSIONS
The feasibility of using turbulators in a LRE cooling channel was investigated. The primary
goal being to reduce the hot gas wall maximum temperature. A benchmark case for the present
study was obtained from [2], and made into this study’s baseline case. The hot wall flux from the
baseline case was used as a boundary condition for all rib and wedge cases, to allow temperature
to change and be compared from case to case. It is additive manufacturing techniques that allow
the discussion of designing featured channels as small as those investigated in the current study.
The addition of ribs had little heat transfer enhancement effects and only served to increase
the pressure drop. The addition of wedges in the initial wedge configuration showed that the heat
transfer can be greatly increased with for a given pressure drop. The multi-configuration wedge
study showed the thermal performance characteristics of many wedges configurations in this
study’s cooling channel. The greatest temperature reduction yielded a maximum hot wall
temperature of 656 K with an associated pressure drop of 2.9 MPa. That configuration was with
an 80-degree wedge, e/D.h of 0.2, and 49 (pitch of 1.61 mm) wedges in the channel. The point
closest to the origin yielded a maximum hot wall temperature of 689 K with an associated
pressure drop of 2.411 MPa. That configuration was with a 60-degree wedge, e/D.h of 0.05, and
49 wedges (pitch of 1.61 mm) in the channel.
The number of cycles to failure, based on low cycle fatigue correlations, increased from 330
for the baseline case to 549 for the best tradeoff case, which consists of a 60-degree wedge, e/D.h
of 0.05, and a pitch of 1.61 mm (49 wedges in channel).

78
High aspect ratio channels from the baseline case investigator, Wadel et al, are more
effective at heat transfer enhancement than the best tradeoff case in the current study. Wadel’s
best case yielded a hot gas wall max temperature of 618 K with an increase in channel pressure
drop of 7.5%. The best tradeoff case from the current study yielded a hot gas wall max
temperature of 689 K with an increase in pressure drop of 5.0%. Additional parameter changes
such as mass flow rate, aspect ratio, sidewall thickness, etc, may improve the thermal
performance of using wedges.

79
FUTURE WORK
Based on the current study, there are beneficial paths for continuing investigations into
improving their thermal hydraulic performance of LRE cooling channels. Some of those include:
Performing a study with similarly shaped wedge turbulators in a similar LRE cooling
channel, and impose an improved boundary condition. Instead of imposing a constant
heat flux on the hot gas wall, the combustion environment should be simulated to
determine the magnitude of the hot gas wall temperature decrease.
A study with wedged turbulators should be performed with the goal comparing turbulator
performance of a fixed geometry wedge, but with variable aspect ratio channels. This will
have a large impact on the performance of the turbulator features.
A study should be done with focus on the system level. To this end, a turbulator featured
channel should be analyzed while changing parameters such as mass flow rate through
the channel, the number of channels, varying pressure inlet or outlet conditions, and
varying temperature inlet conditions. This study can reveal whether an optimal balance of
all these parameters exists.
Printing a channel or channels for experimental study serves to verify and correct existing
models.

80
APPENDIX: MESH IMAGES

81
Figure A.1: Baseline Mesh 1, Midplane Near Inlet
Figure A.2: Baseline Mesh 2

82
Figure A.3: Baseline Mesh 3
Figure A.4: Baseline Cross-Sectional Velocity Profile

83
Figure A.5: Rib Case Mesh Midplane Side View near ribs
Figure A.6: Initial Wedge Case Mesh Midplane Side View near Wedges

84
REFERENCES
[1] Garner, Rob. “Dr. Robert H. Goddard, American Rocketry Pioneer.” NASA, NASA, 11 Feb.
2015, www.nasa.gov/centers/goddard/about/history/dr_goddard.html.
[2] “Turnaround Operations and Maintenance.” Space Shuttle Main Engine Pocket Data, by
Rockwell International, Rockwell International, 1987. RI/RD87-142.
[3] Image by Duk, distributed under a CC-BY 2.0 license.
[4] Sippel, Martin, et al. “Studies on Expander Bleed Cycle Engines for Launchers.” 39th
AIAA/ASME/SAE/ASEE Joint Propulsion Conference and Exhibit, 2003,
doi:10.2514/6.2003-4597.
[5] Rajagopal, Manikanda. “Numerical Modeling of Regenerative Cooling System for Large
Expansion Ratio Rocket Engines.” Journal of Thermal Science and Engineering
Applications, vol. 7, no. 1, 2014, p. 011012., doi:10.1115/1.4028979.
[6] Quentmeyer, R J. “Experimental fatigue life investigation of cylindrical thrust chambers.”
American Institute of Aeronautics and Astronautics, 13th Propulsion Conference, ed,
1977.
[7] Pizzarelli, Marco. (2017). Regenerative cooling of liquid rocket engine thrust chambers.
10.13140/RG.2.2.30668.92804.
[8] Lakshminarayana, Budugur. Fluid Dynamics and Heat Transfer of Turbomachinery. J. Wiley
and Sons, 1996.

85
[9] Incropera, Frank P., and David P. DeWitt. Fundamentals of Heat and Mass Transfer. 7th ed.,
Wiley.
[10] Xometry.com. (2018). DMLS | Direct Metal Laser Sintering | Metal 3D Printing - Xometry.
[online] Available at: https://www.xometry.com/direct-metal-laser-sintering.
[11] Harbaugh, Jennifer. “NASA 3-D Prints First Full-Scale Copper Rocket Engine Part.” NASA,
NASA, 21 Apr. 2015, www.nasa.gov/marshall/news/nasa-3-D-prints-first-full-scale-
copper-rocket-engine-part.html.
[12] Wadel, Mary, and Mary Wadel. “Comparison of high aspect ratio cooling channel designs
for a rocket combustion chamber.” 33rd Joint Propulsion Conference and Exhibit,
June 1997.
[13] Ulas, A., and E. Boysan. “Numerical Analysis of Regenerative Cooling in Liquid Propellant
Rocket Engines.” Aerospace Science and Technology, vol. 24, no. 1, 2013, pp. 187–
197., doi:10.1016/j.ast.2011.11.006.
[14] Hossain, J, et al. “Numerical Study of Enhancement of Regenerative Cooling Using Ribs.”
49th AIAA/ASME/SAE/ASEE Joint Propulsion Conference, Dec. 2013,
doi:10.2514/6.2013-3996.
[15] Han, J. C. “Heat Transfer and Friction in Channels With Two Opposite Rib-Roughened
Walls.” Journal of Heat Transfer, vol. 106, no. 4, 1984, p. 774.,
doi:10.1115/1.3246751.

86
[16] Han, J.c., and Y.m. Zhang. “High Performance Heat Transfer Ducts with Parallel Broken
and V-Shaped Broken Ribs.” International Journal of Heat and Mass Transfer, vol.
35, no. 2, 1992, pp. 513–523., doi:10.1016/0017-9310(92)90286-2.
[17] Han, Je-Chin, et al. “Augmented Heat Transfer in Square Channels with Wedge-Shaped and
Delta-Shaped Turbulence Promoters.” Journal of Enhanced Heat Transfer, vol. 1, no.
1, 1993, pp. 37–52., doi:10.1615/jenhheattransf.v1.i1.40.
[18] Valentino, Michelle, et al. “Comparison of Heat Transfer and Friction Augmentation for
Symmetric and Non-Symmetric Wedge Turbulators on Two Opposite Walls.” 47th
AIAA/ASME/SAE/ASEE Joint Propulsion Conference &Amp; Exhibit, 2011,
doi:10.2514/6.2011-6021.
[19] Henze, M., et al. “The Effects Of Vortex Structures On Heat Transfer And Flow Field
Behind Multielement Arrays Of Vortex Generators.” Heat Transfer Enhancement,
2006.
[20] M. Peric and S. Ferguson, "The advantage of polyhedral meshes," CD-adapco< http://www.
cd-adapco. com/press_room/dynamics/24/testVspoly. html, 2005.
[21] STAR-CCM+ User Guide, Mesh Metrics," https://stevedocs.cd-
adapco.com/starccmplus_latest_en/index.html#page/STARCCMP%2FGU ID-
733A3104-A053-47A1-AD86-8B16F4E4757B%3Den%3D.html.
[22] I. B. Celik, U. Ghia, and P. J. Roache, "Procedure for estimation and reporting of
uncertainty due to discretization in {CFD} applications," Journal of fluids
{Engineering-Transactions} of the {ASME}, vol. 130, 2008.

87
[23] “NIST Reference Thermodynamic and Transport Properties -- REFPROP.”