investigation of cardiac myosin binding protein c (cmybpc ... · n-terminal domain cc0 using nmr...
TRANSCRIPT

1
Investigation of Cardiac Myosin Binding
protein C (cMyBPC) Domains and their
Interactions.
Thesis submitted for the Degree of
Doctor of Philosophy
at the University of Leicester
by
Joyce Ratti, MSc
Department of Biochemistry
University of Liecester
March 2009

2
Joyce Ratti
Title: Investigation of cardiac Myosin Binding Protein C (cMyBPC) domains and their
interactions.
Abstract
Myosin binding protein C (MyBPC) is a multidomain protein present in the thick
filament of striated muscles involved in both sarcomere formation and contraction. It
appears that the C-terminus of the protein is involved in sarcomere formation, through
interaction with Light Meromyosin (LMM), while the N-terminus seems to play a role
in muscle contraction, being localized close to the motor domain of myosin that
interacts with the thin filament protein actin, causing muscles to contract. It exists in
three different isoforms, one for each type of muscle, the cardiac isoform being linked
to hypertrophic cardiomyopathy (HCM), a genetic disorder associated with cardiac
dysfunction that can manifest itself through arrhythmias, heart failure and sudden
cardiac death, especially in the young. The present work has focused on two aspects of
the cardiac isoform (cMyBPC) investigating both the function and the role in sarcomere
assembly played by cMyBPC. The first part of the research presented in this thesis
consisted in the determination of the three dimensional structure of the cardiac specific
N-terminal domain cC0 using NMR spectroscopy, and the investigation of the
interaction with its probable binding partner, the regulatory light chain of myosin,
through 1H/15N HSQC NMR spectroscopy titrations. The knowledge of the three
dimensional structure has proven a vital tool to map the interacting surface on cC0,
giving the possibility to make hypothesis on the way cMyBPC might interact with the
S1 domain of myosin, thus influencing muscle contraction. The second part of this
research is based on the hypothesis that the central domain cC5 could interact with
domain cC8 of another molecule of the same protein, suggesting that the way cMyBPC
could incorporate in the sarcomere would be through a trimeric collar wrapped around
the myosin filament. This aspect has being studied using 1H/15N HSQC NMR
spectroscopy titrations but no conclusive results were obtained, suggesting that this
interaction might not take place and indicating an axial arrangement, with cMyBPC
running parallel to the thick filament, as the most likely.

3
Acknowledgments
Firstly, I would like offer my thanks to my supervisor Dr. Mark Pfuhl for providing me
with the opportunity to conduct this research and for all his guidance. I would also like
to thank the members of my committee, Prof. Clive Bagshaw and Prof. Mark Carr, and
Prof. Mathias Gautel for their advise and input throughout the course of my research. I
would also like to offer my gratitude to the British Heart Foundation for funding this
studentship.
I would like to thank all those who have directly and indirectly contributed to the work
described in this thesis, inparticular Dr Fred Muskett for his invaluable help in
performing both NMR experiments and structure calculation and Dr Phil Renshaw for
his advise and expertise in the lab work.
All my thanks also go to the members of Dr Mark Pfuhl’s group, Dr Sam Schroder, Dr
Didier Philippe and especially Claudia Fogl, who, together with Dr Mohammed El-
Mezgueldi, has helped me perform the actin binding assay, and to everyone at the
Henry Wellcome Laboratories for Structural Biology.
My sincerest thanks go to my parents for their love and for always believing in me and
to Cosimo for all his love and dedication.
Finally, to all my friends and family who I have not been able to mention above, thank
you for your support, understanding and friendship.
Joyce Ratti, Leicester, March 2009

4
Contents
Abstract 1
Acknowledgements 2
Contents 3
Figures 7
Tables 12
Abbreviations 14
Chapter 1, General Introduction
1.1 Myosin Binding Protein C (MyBPC) 15
1.1.1 Muscle structure and function 15
1.1.2 Striated muscles and sarcomere organization 16
1.1.2.1 The thick filament 20
1.1.2.2 The thin filament 25
1.1.2.3 The titin filament 29
1.1.3 Myosin Binding Protein C (MyBPC) 30
1.1.4 Hypertrophic Cardiomyopathy (HCM) 42
1.1.5 Main HCM related mutations found in cMyBPC role
in Hypertrophic cardiomyopathy 50
1.1.6 How does MyBPC assemble into the sarcomere? 57
1.1.6.1 Trimeric collar model 59
1.1.6.2 Axial model 61
1.1.7 Aims of the project 62
1.2 Structure determination 63

5
1.2.1 NMR spectroscopy 63
1.2.2 Three dimensional structure determination with the
program CYANA 68
1.2.2.1 TALOS 70
1.2.2.2 Automated NOE assignment using the CANDID algorithm 72
1.2.2.3 Structure calculation 76
1.2.2.4 Structure validation 78
1.2.3 Protein dynamics 81
1.2.3.1 Relaxation 81
1.2.3.2 Model free analysis 83
Chapter 2, Materials and Methods
2.1 DNA Methods 87
2.1.1 PCR 87
2.1.2 Ligation 89
2.1.3 Competent cells transformation 89
2.1.4 PCR Screening 90
2.2 Protein expression and purification 91
2.2.1 Competent cells transformation for protein expression 91
2.2.2 Expression in Luria- Bertani (LB) medium 91
2.2.3 Expression in minimal medium (M9) 92
2.2.4 Protein purification 92
2.2.5 Refolding of insoluble proteins 95
2.3 Actin Binding assay 96
2.4 NMR spectroscopy 97
Chapter 3, Solution structure of domain cC0 of cardiac Myosin
Binding Protein C (cMyBPC) and characterisation of its interaction
with the Regulatory Light Chain (RLC) of myosin.
3.1 Results 98
3.1.1 Protein expression and purification 98
3.1.1.1 cC0 98

6
3.1.1.2 RLC 100
3.1.2 NMR spectroscopy 101
3.1.3 Sequence specific assignment of domain cC0 106
3.1.4 Structure calculation of domain cC0 106
3.1.5 Structure validation 113
3.1.6 Protein dynamics 116
3.1.7 Studies of the interaction between cC0 and RLC 120
3.1.7.1 1H/ 15N NMR spectroscopy titration between cC0
and miniHMM 123
3.1.7.2 1H/ 15N NMR spectroscopy titration between cC0
and RLC 125
3.1.8 Mutogenesis studies 130
3.1.9 Actin binding assay 135
3.2 Discussion 138
3.2.1 Structural features of domain cC0 138
3.2.2 Characterisation of the interaction between cC0 and
the Regulatory Light Chain 144
3.2.3 Hypertrophic Cardiomyopathy (HCM) missense
mutations in domain cC0 of cMyBPC 149
3.2.4 Model of the incorporation of the cMyBPC N-terminus
in the sarcomere 150
3.2.5 Conclusions 155
Chapter 4, Study of the interaction between domains cC5 and cC8 of cMyBPC
4.1 Results 156
4.1.1 cC5 protein expression and purification 156
4.1.2 Expression of domain cC8 158
4.1.3 Is domain cC8 properly folded? 158
4.1.3.1 Urea denaturation 160
4.1.3.2 1D 1H NMR melting curve 164
4.1.4 cC8 expressed as a fusion protein 166
4.1.4.1 Cloning of cC8 in pETM-20 and expression of TrxA_cC8 167
4.1.4.2 Cloning of cC8 in pETM-60 and expression of NusA_cC8 173

7
4.1.5 Expression of t-RNA supplemented hosts cells 175
4.1.5.1 Expression of cC8 in BL21 Codon Plus (DE3)
RP competent cells 175
4.1.5.2 Expression of cC8 in Arctic Express RP competent cells 178
4.1.6 Study of the interaction between domains cC5 and cC8 180
4.1.7 Cloning and protein expression of groups of domains
cC5-7 and cC8-10 181
4.1.7.1 Group of domains cC8-10 185
4.1.7.2 Group of domains cC5-7 186
4.2 Discussion 192
4.2.1 Problem of the solubility of domain cC8 192
4.2.2 Stability of domain cC8 194
4.2.2.1 Thermodynamic stability of domain cC8 194
4.2.2.2 Stability of the hydrophobic core of the domain 196
4.2.3 Interaction between cC5 and cC8 of cMyBPC 198
4.2.4 Conclusion 200
Chapter 5, Conclusions 202
Appendices 205
A.1 Culture Media 205
A.2 Sequence specific assignment for domain cC0 208
A.3 Sequence alignment of cMyBPC 219
References 222

8
Figures
Figure 1.1 Types of muscles as seen under the light microscope 16
Figure 1.2 Muscle structure 17
Figure 1.3 Striated muscles appearance under the electron microscope 18
Figure 1.4 Sarcomere structure 19
Figure 1.5 Myosin head disposition in the thick filament 21
Figure 1.6 Sarcomere cross section 22
Figure 1.7 Myosin 23
Figure 1.8 Myosin S1 domain 24
Figure 1.9 Actin filament 27
Figure 1.10 Molecular structure of the thin filament 28
Figure 1.11 Isoforms of MyBPC 31
Figure 1.12 IgI and FnIII folds 32
Figure 1.13 Sequence alignment of C1-linker-C2 for the three human
isofoms
38
Figure 1.14 Cardiac remodelling 44
Figure 1.15 Model of cC1-cC2 interaction with S2∆ 58
Figure 1.16 Trimeric collar model 60
Figure 1.17 Axial model 61
Figure 1.18 Heteronuclear coupling constants J between nuclei of a
protein backbone
64
Figure 1.19 Phase coherence transfer between nuclei in triple resonance
NMR experiments
66
Figure 1.20 Iterative process followed by the program CYANA 69

9
Figure 1.21 ϕ, ψ and ω torsion angles 70
Figure 1.22 Graphic interface of the TALOS output 71
Figure 1.23 Conditions that must be fulfilled by a valid assignment 73
Figure 1.24 Constraints combination 76
Figure 1.25 Relaxation processes 82
Figure 3.1 Purification of domain cC0 99
Figure 3.2 HtTRLC after TEV digestion and purification with IMAC on
Ni2+ columns
100
Figure 3.3 1H/15N HSQC spectrum for domain cC0 102
Figure 3.4 15N strips for HNCaCb and HN(CO)CaCb spectra of domain
cC0
103
Figure 3.5 1H/1H/15N TOCSY and NOESY spectra of domain cC0 104
Figure 3.6 HCCH-TOCSY and 1H/1H/13C NOESY spectra of residue
Gln75 of domain cC0
105
Figure 3.7 Longrange NOEs obtained for domain cC0 109
Figure 3.8 Structure of domain cC0 of cMyBPC 110
Figure3.9 Ribbon view of domain cC0 structure 111
Figure3.10 Number of constraints per residue 112
Figure 3.11 Ramachandran plot obtained for the structure of domain
cC0
113
Figure 3.12 Procheck NMR residue by residue results for the calculated
structure of domain cC0
115
Figure 3.13 Correlation time values 118
Figure 3.14 Rigidity of the molecule versus number of constraints 119
Figure 3.15 Sequence alignment of the regulatory Light Chain (RLC) of

10
myosin 121
Figure 3.16 Structure of myosin and how it could interact with domain
cC0
122
Figure 3.17 1H/15N HSQC spectrum for the cC0+miniHMM titration 124
Figure 3.18 Chemical shift changes for the amide groups of domain cC0
following the titration with miniHMM
125
Figure 3.19 1H/15N HSQC spectrum for the cC0+RLC titration. Panel 1 127
Figure 3.20 1H/15N HSQC spectrum for the cC0+RLC titration. Panel 2 127
Figure 3.21 Residue Lys14 during the cC0+RLC titration 128
Figure 3.22 Residue Arg16 during the cC0+RLC titration 128
Figure 3.23 Chemical shift changes for amide groups of domain cC0
following the titration with RLC
129
Figure 3.24 Results of the cC0+RLC titration 130
Figure 3.25 pLEICS-3 vector map 131
Figure 3.26 Chemical shift changes for amide groups of domain
cC0_G4R following the titration with RLC
133
Figure 3.27 Chemical shift changes for amide groups of domain
cC0_R34Wfollowing the titration with RLC
134
Figure 3.28 Chemical shift changes for amide groups of domain
cC0_K89E following the titration with RLC
135
Figure 3.29 Actin binding assay 137
Figure 3.30 Sequence alignment for domain cC0 139
Figure 3.31 β-bulge 140
Figure 3.32 Aromatic residues at the core of domain cC0 141
Figure 3.33 Electrostatic surface of domain cC0 142

11
Figure 3.34 Sequence alignment of the top five structures identified by
the DALI server
144
Figure 3.35 Sequence alignment of human cardiac and Aequipecten
Irradians (bay scallop) isoforms of RLC
145
Figure 3.36 Model of human cardiac RLC 146
Figure 3.37 Electrostatic surface of RLC 148
Figure 3.38 HCM missense mutations of domain cC0 150
Figure 3.39 Model of the interaction between the N-terminus of cMyBPC
and myosin
152
Figure 3.40 Model of a possible interaction between cMyBPC and
myosin
153
Figure 3.41 Model of a possible interaction between cMyBPC and
myosin
154
Figure 4.1 Purification of cC5 157
Figure 4.2 1D 1H NMR spectrum of domain cC8 159
Figure 4.3 Urea denaturation of domain cC8 161
Figure 4.4 Urea denaturation curve and Gibbs free energy for domain
cC8
162
Figure4.5 Melting curve for domain cC8 165
Figure 4.6 pETM-20 vector map 168
Figure 4.7 Cloning of cC8 in pETM-20 168
Figure 4.8 SDS-PAGE gel of cC8_TrxA expressed in different
competent cells
169
Figure 4.9 SDS-PAGE gel of cC8_TrxA expressed in Rosetta (DE3)
PLysS at 15°C after IMAC nurification on Ni2+ columns
170

12
Figure 4.10 Size exclusion chromatography purification step of
TrxA_cC8
171
Figure 4.11 1H/15N HSQC spectrum of cC5 after different additions of
TrxA_cC8
172
Figure 4.12 pETM-20 173
Figure 4.13 Purification of cC8_NusA 174
Figure 4.14 SDS-PAGE gel and size exclusion chromatogram of domain
cC8 in pET-8c expressed in Codon Plus (DE3) RP cells
177
Figure 4.15 Purification of cC8 expressed in Arctic Express RP cells 179
Figure 4.16 SDS-PAGE gel of the samples used to study the C5+cC8
interaction
180
Figure 4.17 1H/15N HSQC spectrum for the cC5+cC8 titration. Panel 1 181
Figure 4.18 pETM-11 vector map 182
Figure4.19 Cloning of cC5-7 in vector pETM-11 184
Figure 4.20 Cloning of cC8-10 in vector pETM-11 185
Figure 4.21 SDS-PAGE gel of group of domains cC8-10 expressed in
BL21 Star (DE3) cells after IMAC purification on Ni2+
columns
186
Figure4.22 SDS-PAGE gel andsize exclusion chromatogram of group
of domains cC5-7 expressed in BL21 Star (DE3) cells
187
Figure 4.23 1D 1H NMR spectrum of cC5-7 188
Figure 4.24 1H/15N HSQC spectrum of group of domains cC5-7 190
Figure 4.25 1H/15N TROSY spectrum of group of domains cC5-7 191
Figure 4.26 Effect of the ring current generated by the aromatic systems. 197

13
Tables
Table 1.1 HCM related mutations identified in sarcomeric proteins 46
Table 1.2 cMyBPC point mutations causing HCM 48
Table 1.3 NMR experiments necessary for a structure calculation 64
Table 1.4 Spectral density function used in the numerical fit to the
experimental T1, T2 and NOE values.
85
Table 2.1 PCR conditions 88
Table 2.2 PCR cycles 88
Table 2.3 Restriction digestion reaction 88
Table 2.4 Ligation reaction conditions 89
Table 2.5 PCR screening reaction 90
Table 2.6 PCR screening cycles 90
Table 2.7 Sample composition of the solutions used in the actin binding
cosedimentation assay
97
Table 3.1 NMR constraints and structural statistics for domain cC0 107
Table 3.2 Delay used for the relaxation experiments 116
Table 3.3 Ratios and final concentrations of cC0 and miniHMM
fragment used in the titration performed to study their
interaction
123
Table 3.4 Ratios and final concentrations of cC0 and RLC used in the
titration performed to study their interaction
126
Table 3.5 Primers used to clone wildtype cC0 and the four mutants 131
Table 3.6 DALI results. Proteins with the most similar structure to
domain cC0 within the Protein Data Bank
143
Table 4.1 Urea denaturation of domain cC8 160

14
Table 4.2 1D NMR melting curve of domain cC8 164
Table 4.3 Primers used to clone cC8 in both vectors pETM-20 and
pETM-60
167
Table 4.4 Ratios of cC5 and cC8_TrxA used in the titration performed
to study their interaction
172
Table 4.5 Ratios of cC5 and cC8_NusA used in the titration performed
to study their interaction
174
Table 4.6 Ratios of cC5 and cC8 used in the titration performed to
study their interaction
180
Table 4.7 Primers used to clone cC5-7 and cC8-10 in pETM-11 182

15
Abbreviations
CANDID Combined automated NOE assignment and structure
CYANA Combine assignment and dynamic algorithm for NMR applications
DSC Differential scanning calorimetry
DTT 1,4- dithiothreitol
HCM Hypertrophic cardiomyopathy
HSQC Heteronuclear Single Quantum Coherence
IMAC Immobilised metal affinity chromatography
IPTG Isopropyl- 1- thio-β- D- galactopyranoside
LB Luria- Bertani
MyBPC Myosin Binding Protein C
NMR Nuclear Magnetic Resonance
NOE Nuclear Overhauser Effect
NOESY Nuclear Overhauser Effect SpectroscopY
PCR Polymerase Chain Reaction
PDB Protein Data Bank
RLC Regulatory Light Chain
TOCSY TOtal Correlation SpectroscopY
TROSY Transverse Relaxation Optimized Correlation SpectroscopY
βME 2-Mercaptoethanol
ϕ Phi, the dihedral angle between amide nitrogen and alpha carbon
ψ Psi, dihedral angle between alpha and carboxyl carbons
ω Omega, dihedral angle between amide nitrogen and carboxyl carbon
Ht Six Histdine tag
HtT Six Histidine tag with TEV protease digestion site

16
Chapter 1
Introduction
1.1 Myosin Binding protein C (MyBPC)
1.1.1 Muscle structure and function
The capacity to move is one of the most important characteristics of higher organisms
and the way this is achieved may vary. The basic machinery involved in movement is
formed by muscles and different types of muscle exist to meet the need of different
species or of different parts of an organism.
In mammals different kind of muscles can be identified, some voluntary some
involuntary.
Three type of muscle exist: skeletal, smooth and cardiac muscles.
• Skeletal muscles have a characteristic striated appearance under the light
microscope due to the alignments of their myofibrils, they are responsible for
voluntary movements and are under nervous regulation. They can be divided in
two main categories, according to the function they have, which is mirrored at
the molecular level. We can distinguish between red and white skeletal muscles,
the red, also called slow skeletal muscles, being responsible to keep the posture
and perambulate, their colour is due to the presence of myoglobin that stores the
oxygen needed for the sustained contraction necessary to maintain the posture
and walk; white muscles, also known as fast skeletal, on the other hand, are
more rarely used and rely on glycogen as fuel and can give rise to short burst of
contraction for a limited period of time.

17
• The cardiac muscle is an involuntary muscle whose contraction is regular and
continuous throughout the organism’s life. Its appearance under the light
microscope is similar to that of skeletal muscles but instead of having parallel
fibres, as in skeletal muscles, they appear forming irregular angles between one
another (Figure 1.1).
Figure 1.1 Types of muscle as seen under the light microscope. Three types of muscle exist: a) Skeletal muscles are characterized by a highly ordered striated appearance; b) Smooth muscles appear un-striated and have a low degree of order; c) Cardiac muscles have an ordered structure similar to the one characteristic for skeletal muscles where the fibres do not result parallel to each other as in skeletal muscle but at irregular angles. Picture available at http://training.seer.cancer.gov.
Figure 1.1 Types of muscle as seen under the light microscope. Three types of muscle exist: a) Skeletal muscles are characterized by a highly ordered striated appearance; b) Smooth muscles appear un-striated and have a low degree of order; c) Cardiac muscles have an ordered structure similar to the one characteristic for skeletal muscles where the fibres do not result parallel to each other as in skeletal muscle but at irregular angles. Picture available at http://training.seer.cancer.gov.
• Smooth muscles are involuntary, they appear un-striated at the light microscope.
They are not under nervous regulation and are responsible for a variety of
function in the body, from contraction of blood vessels to skin response to cold
temperatures. Theirs structure is less ordered than that of striated muscles.
1.1.2 Striated muscles and sarcomere organization
Morphologically striated muscles are formed by a belly that is surrounded by the
epimysium, a membrane that enclose the fibres, and contains a connective tissue, the

18
endomysium, between adjacent fibres and the perimysium around the boundle of fibres.
The muscle is formed by primary fibres, called fasciculus, that are divided in secondary
(sarcolemma) and tertiary (myofibril) fibres (Guyton, 2005). Each fibre is a giant
multinucleated cell formed by thousands myofibrils that form 80% of the total volume
of a muscle (Figure 1.2).
Figure 1.2 Muscle structure. The muscle is formed by parallel fibres that contain smaller fibres inside, called myofibrils that are the basic constituents of muscle cells. Picture available on thewebsite www.colorado.edu
Figure 1.2 Muscle structure. The muscle is formed by parallel fibres that contain smaller fibres inside, called myofibrils that are the basic constituents of muscle cells. Picture available on thewebsite www.colorado.edu
In striated muscles it is possible to individuate cross bands arising from aligned striation
on each myofibril. The contractile unit of striated muscles is the sarcomere, which
possesses three properties that are fundamental for its function: the ability to shorten
rapidly and efficiently, the ability to switch on an off in milliseconds and its structural
regularity. The sarcomere is bordered at each end by the Z- disc, a dark narrow line that
appear in stained muscle fibres, which bisects the I band that is shared by adjoining
sarcomeres. At the centre of each sarcomere is a darker A band bisected by a less dense

19
H band; inside the H band is located a still less dense region named the pseudo H band
at the centre of which is the M line, that is also at the centre of the whole sarcomere
(Figure 1.3).
Figure 1.3 Striated muscle appearance under the electron microscope. The main features of the sarcomere are visible, A-band, I-band, the central M-line and the two Z-disc that determine the sarcomere contractile unit. Picture available at the website www.ks.uiuc.edu
Figure 1.3 Striated muscle appearance under the electron microscope. The main features of the sarcomere are visible, A-band, I-band, the central M-line and the two Z-disc that determine the sarcomere contractile unit. Picture available at the website www.ks.uiuc.edu
The A band is formed by an array of thick filaments in longitudinal register and running
parallel to the fibre axis, while each half I band contains an array of thin filaments also
in longitudinal register. The thin filaments starts at the Z line and run through the I band
to the A band where they overlap with the thick filaments. The H band is less dense
than the st of the A band due to the absence of thin filaments. Simplifying the structure
of the sarcomere, we could say that it comprises three different type of proteins:
contractile, regulatory and structural. Actin and myosin are the main contractile
constituents, they organise in polymers called thin and thick filaments respectively, that
interact with one another to give rise to muscle contraction. Their interaction is
mediated by the presence of regulatory proteins, such as tropomyosin and the troponin
complex that regulate actin- myosin interaction and hence contraction in response to
Ca2+ concentration. A large number of structural proteins play a role during
development to achieve the final structure of the sarcomere. Myosin binding proteins

20
help the assembly of the myosin thick filament and play a role also in contraction in the
cardiac muscle. Capping proteins, localised at the end of the filaments, prevent
polymerisation or depolymerisation, thus helping to maintain precise filament length.
Cross -linking proteins in the Z and M line link the thin and thick filaments respectively
into ordered longitudinally registered three dimensional lattice. Finally, the giant
proteins titin and nebulin specify the assembly of the thick and thin filaments in the
sarcomere and titin also plays a critical mechanical role in contraction (Figure 1.4).
Figure 1.4 Structure of the sarcomere. Every sarcomere is identified as the region between two Z-discs. From the Z-disc have origin the thin filament, that goes through the I-band and the C-zone of the A-band, where thin and thick filaments overlap, and the titin filament that goes through the whole half sarcomere, from the Z-disc to the M line. The A-band is the region of incorporation of the thick filament. The H-zone of the A-band is less dense due to the absence of the thin filament. Picture adapted from (Gregorio et al., 1999).
Figure 1.4 Structure of the sarcomere. Every sarcomere is identified as the region between two Z-discs. From the Z-disc have origin the thin filament, that goes through the I-band and the C-zone of the A-band, where thin and thick filaments overlap, and the titin filament that goes through the whole half sarcomere, from the Z-disc to the M line. The A-band is the region of incorporation of the thick filament. The H-zone of the A-band is less dense due to the absence of the thin filament. Picture adapted from (Gregorio et al., 1999).
The sarcomere contains at least 28 different proteins of which actin and myosin account
for more than 70% of the total (actin 20%, myosin 54%) (Hanson and Huxley, 1957;
Huxley and Hanson, 1957). The actin- myosin complex hydrolyzes ATP, the source of
energy for contraction.

21
It was long believed that the myofibrils were formed by a single sets of filaments and
that contraction resulted from some form of internal unfolding, until works in the early
1950s show quite a different situation. In 1954 it was suggested (Huxley and
Niedergerke, 1954; Huxley and Hanson, 1954) that muscle contraction was the result of
sliding of filaments over one another, without changes in their lengths. The sliding
filament model was based on the observation at the light microscope that the A band did
not change its length during contraction, while the I band and the H band shortened.
It was noted (Huxley, 1957) that the thick filaments had projections (cross-bridges) on
their surfaces that bound to the thin filaments in the region where the thick and thin
filaments overlap. This suggested the idea that cross-bridge formation could provide the
link between the filaments to enable them to slide.
1.1.2.1 The thick filament
The thick filament of vertebrate skeletal muscles is 1.6 µm long and 15 nm in diameter
(Huxley, 1969), with a rough appearance along most of its length due to the presence of
cross-bridges formed with the thin filament. The only region without cross-bridges is
the central H band. The thick filament is a polymer formed by 300 molecules of the
protein myosin II (Huxley, 1963), a hexamer consisting of two heavy chains (223 kDa)
and two pairs of light chains (15- 22 kDa). Myosin is both an enzyme and a structural
protein and its structure reflects it, having an enzymatic domain (head) physically
separated from the tail of the protein that has a structural function. The α-helices twist
around each other to form a stable α-helical coiled- coil tail 155 nm long (Lowey et al.,
1969). Sequence analysis of the myosin tails show the presence of a heptad repeat
where hydrophobic residues are packed against each other causing the packing of the

22
two helices in a stable coiled- coil in a structure that is repeated every seven residues.
Another longer repeating structural unit of 28 amino acids has been identified in which
a region of positive charged residues is separated from a region of negatively charged
amino acids by 14 residues (McLachlan and Karn, 1982). At the N-terminus, each
heavy chain folds into a globular head 19 nm long and 5 nm wide at its maximum
(Rayment et al., 1993). The myosin heads stretch out from the α-helical coiled-coil to
interact with actin, forming the cross- bridges. In all vertebrate striated muscles the axial
distance between adjacent levels of myosin heads is 14.3 nm and the repeat distance of
the helix is three times this, so 43 nm (Huxley and Brown, 1967; Matsubara, 1974;
Matsubara and Millman, 1974) (Figure 1.5).
Figure 1.5: Myosin heads disposition in the thick filament. The thick filament has a three fold symmetry, with three heads forming a crown around the myosin rod. Each layer is 14 nm apart and the arrangement is repeated every three layers, so every 43 nm. Picture adapted from (Hudson et al., 1997).
14 nm
43 nm
Looking at myofibril in cross section, it is easy to identify the myosin rod and three
molecule of myosin head, each of them formed by two heads respectively, that reach

23
out to interact with actin, as shown in figure 1.6. This causes the appearance of the
sarcomeric A-band when seen under the light microscope.
Figure 1.6: Sarcomeric A-band cross section under the light microscope.From the myosin rod, in the centre, six molecules of myosin heads interact with six molecules of actin, causing the hexagonal symmetry of the cross section of the sarcomere typical of the A-band.
thick
thin
1 2
3
45
6
Figure 1.6: Sarcomeric A-band cross section under the light microscope.From the myosin rod, in the centre, six molecules of myosin heads interact with six molecules of actin, causing the hexagonal symmetry of the cross section of the sarcomere typical of the A-band.
thick
thin
1 2
3
45
6
Different myosin fragments have been identified through proteolysis (figure 1.7). Two
big fragments named heavy and light meromyosin, HMM and LMM respectively, have
been obtained after digestion with the enzyme trypsin. LMM corresponds to the coiled-
coil region. HMM can be divided in two parts through digestion with papain:
subfragment 1 (S1) comprises the heads of myosin, the domains that interact with actin
and have a ATPase activity and the two light chains, and subfragment 2 (S2), the coiled-
coil region of myosin.
LMM is insoluble at physiological ionic strength, indicating a strong propensity to self
associate; the other coiled-coil fragment, S2, is more soluble than LMM, indicating a
weaker tendency to self-associate and this is very important as it allows the myosin

24
heads the freedom of movement they need to interact with actin during muscle
contraction.
Each myosin head (S1), which is soluble at physiological condition, has a molecular
mass of 130 kDa (Vibert and Cohen, 1988) and comprises the first 843 residues of the
heavy chain, together with the two light chains.
Figure 1.7: Myosin. The enzyme trypsine digest myosin in two big fragment Light Meromyosin (LMM) and heavy Meromyosin (HMM). A second enzyme papain can digest HMM in subfragment 1 (S1), that contains the globular head of myosin, and subfragment 2 (S2), which is a coiled-coil region known as the lever arm. Picture adapted from (Craig, 2004).
Figure 1.7: Myosin. The enzyme trypsine digest myosin in two big fragment Light Meromyosin (LMM) and heavy Meromyosin (HMM). A second enzyme papain can digest HMM in subfragment 1 (S1), that contains the globular head of myosin, and subfragment 2 (S2), which is a coiled-coil region known as the lever arm. Picture adapted from (Craig, 2004).
Three different domains have been identified proteolytically (Mornet et al., 1981) in S1,
named after their molecular masses: 25K (N-terminus), 50K (middle) and 20K (C-

25
terminus) (Mornet et al., 1979). All the three fragments contribute to a 7-stranded β-
sheet with numerous α- helices surrounding it to form a cleft that extends from the ATP
to the actin binding sites.
Figure 1.8: Myosin S1 domain. The myosin S1 domain is formed by a C-terminal tail or “neck” (blue) that carries the two calmodulin like essential light chain (dark green) and regulatory light chain (purple). The head region can be divided in the 50K domain that consist of the 50k upper domain (red) and the actin binding domain (gray) and the 25K N-terminal domain (green). In the ATP-binding site is located between the 25K and the 50K upper domains. Picture adapted from (Geeves and Holmes, 1999)
Figure 1.8: Myosin S1 domain. The myosin S1 domain is formed by a C-terminal tail or “neck” (blue) that carries the two calmodulin like essential light chain (dark green) and regulatory light chain (purple). The head region can be divided in the 50K domain that consist of the 50k upper domain (red) and the actin binding domain (gray) and the 25K N-terminal domain (green). In the ATP-binding site is located between the 25K and the 50K upper domains. Picture adapted from (Geeves and Holmes, 1999)
The 50K domain can be divided in two subdomains, named 50K upper and 50K lower,
or actin binding, domains respectively (Rayment et al., 1993). The N-terminus (25K
domain) is in proximity to the neck region where the two light chains are and, together
with the 50K upper domain, forms the bulk of the protein that contains the ATP binding
site, which is located at the boundary between the two domains. The 50K lower domain
forms the actin binding site, followed by a large, positively charged loop also involved
in the interaction with actin. This 75 kDa (50+25 kDa) region of myosin is known as the
motor domain, while the remaining 20K domain and the two light chains, forms the

26
regulatory domain or lever arm because of its function during contraction (Dominguez
et al., 1998; Rayment et al., 1993). The ATPase site is 5nm from the tip of the head and
4 nm opposite the actin binding site.
1.1.2.2 Thin filament
The thin filament in the sarcomere runs from the Z disc to the edge of the H band, is
about 1µm long and 10 nm in diameter (Huxley, 1969). The major component of the
thin filament is actin (Pollard, 1990; Sheterline et al., 1995) a globular protein (G actin)
with a molecular mass of 42 kDa, that self-associate to form a helical polymer known as
F actin formed by 360 molecules of G actin. Attached to actin are regulatory proteins,
such as tropomyosin and troponin (Gordon et al., 2000; Solaro and Rarick, 1998; Zot
and Potter, 1987), that regulate the actin-myosin interaction, and the giant protein
nebulin (Gregorio et al., 1999; Horowits et al., 1996; Wang and Wright, 1988) that runs
for the entire length of the thin filament and is thought to be involved in determining the
filament length.
At low ionic strength in vitro, actin exists in its monomeric form G-actin; when the
ionic strength is increased to its physiological value then actin tends to polymerize to
form F-actin. The filament is formed by two helices of F-actin twisted around each
other to form an double helix. G-actin is a globular protein formed by a single
polypeptide chain containing 375 amino acids, its secondary structure is partially
formed by α-helices, part by β-sheets and about two quarters random coil (Kabsch and
Vandekerckhove, 1992). The sequence of actin is widely conserved between isomers
(skeletal, cardiac, non-muscolar actins) and species, this is probably due to the fact that
actin interacts with a great variety of proteins and needs to conserve a large number of
binding sites.

27
Muscle contraction is regulated by the concentration of Ca2+: at low level of Ca2+ (10-8
M) the muscle is relaxed, at high concentration of Ca2+ (10-5 M) the muscle contracts. In
vertebrate muscles the contraction is regulated primarily by the thin filament proteins
tropomyosin and troponin, which respond to changes in the concentration of Ca2+ in the
sarcoplasmic reticulum. Tropomyosin (Perry, 2001) is an elongated protein that
associate with seven actin monomers, while troponin is a complex of three subunits
which attach every 38.5 nm to a specific site of tropomyosin. Troponin is the Ca2+
binding protein that regulates contraction inhibiting actin-myosin interaction at low Ca2+
concentration; when the concentration increases troponin binds to Ca2+, releasing the
inhibitory effect of the troponin- tropomyosin complex, allowing actin and myosin to
interact causing the sarcomere to contract.
Tropomyosin is a two-stranded α-helical coiled-coil of molecular mass 65kDa. Its
chains run parallel to each other, wrapping around the F-actin molecule, 41 nm long and
2 nm in diameter (Perry, 2001).

28
Figure 1.9 Actin filament. The thin filament is formed by the F-actin filament around which is wrapped the tropomyosin protein that has the function of regulating the interaction of actin with myosin. Tropomyosin, in fact, covers the myosin binding site on actin. Its function is further regulated by the troponin complex that is located on tropomyosin at precise intervals. Picture available from the website www.embl-heidelberg.de
Figure 1.9 Actin filament. The thin filament is formed by the F-actin filament around which is wrapped the tropomyosin protein that has the function of regulating the interaction of actin with myosin. Tropomyosin, in fact, covers the myosin binding site on actin. Its function is further regulated by the troponin complex that is located on tropomyosin at precise intervals. Picture available from the website www.embl-heidelberg.de
Troponin is a 80 kDa complex formed by three subunits, TnI, TnT and TnC. Troponin I
is the inhibitory component and when bound to actin is able to inhibit the actin-myosin
interaction on its own, without the presence of any other component . When Ca2+ binds
to TnC, the bond between TnI and TnC becomes stronger and the link between TnI and
actin weakens, making it possible for actin and myosin to interact. TnC is the Ca2+
binding component of the troponin complex, it belongs to the family of EF-hand
proteins, all of which are able to coordinate metal ions. Fast skeletal isoforms of TnC

29
have four metal binding site of the helix-loop-helix kind, two high affinity sites
occupied by Mg2+ in the cell, and two low affinity sites where Ca2+ binds, bringing on
muscle contraction (Gordon et al., 2000).
TnC
TnITnT
Figure 1.10: Molecular structure of the thin filament. The protein at the centre of the picture is F-actin, the single globular domains are easily recognisable. Tropomyosin is the double helix that wraps around actin. In this picture are also shown the three elements that form the troponin complex, TnC (pink), TnT(yellow) and TnI (cyan). Picture adapted from (Poole et al., 2006).
TnC
TnITnT
TnC
TnITnT
Figure 1.10: Molecular structure of the thin filament. The protein at the centre of the picture is F-actin, the single globular domains are easily recognisable. Tropomyosin is the double helix that wraps around actin. In this picture are also shown the three elements that form the troponin complex, TnC (pink), TnT(yellow) and TnI (cyan). Picture adapted from (Poole et al., 2006).
TnT (Perry, 1998) is the component of troponin that binds to tropomyosin. It binds to
the other two subunits of troponin, to tropomyosin and to actin, working as a glue to
keep the three proteins in contact. TnT is responsible for the positioning of the troponin
complex on tropomyosin at its characteristic 38.5 nm intervals along the thin filament.

30
1.1.2.3 Titin filament
The idea that a third set of filaments might exist was suggested by the integrity of
sarcomeres stretched beyond actin-myosin overlap and from which actin and myosin
have been extracted. A giant protein named titin, (Gregorio et al., 1999; Maruyama,
1999; Trinick, 1996) is responsible for this behaviour. Titin is a single polypeptide
chain with molecular mass of 3 MDa, formed by 27000 amino acids (Labeit et al.,
1997). It is the largest protein known and constitutes 10 percent of the myofibrillar
mass, being the third most abundant sarcomeric protein. A single molecule of titin is
extraordinarily long (1µm) and thin (4 nm in diameter). In the muscle a molecule of titin
extends for half the sarcomere, from the Z disc to the M line. The molecule originates at
the Z disc, then follows an elastic region which runs parallel to the thin filament through
the I band, while the C-terminus of the proteins forms part of the thick filament, binding
to myosin and ending in the M line (Gregorio et al., 1998). At the Z disc and M line titin
from neighbouring sarcomeres overlap creating a continuous system of filaments.
Like other myosin binding proteins, titin has a modular structure and is formed by
immunoglobulin (Ig) and fibronectin (Fn) like domains. Fn like domain are present only
in the A band and are arranged in superrepeat, together with the Ig-domains. The I-band
region of titin contains just Ig-like domains, organised in two blocks of repeats
separated by a region rich in proline (P), glutamate (E), valine (V) and lysine (K), the so
called PEVK domain (Labeit et al., 1997).
Titin is one of the first proteins to assemble in the sarcomere during its development and
is the only one that extends for half sarcomere, interacting with various other proteins at
precise interval, suggesting a structural role as a molecular template during sarcomere
assembly, coordinating thin and thick filament incorporation.

31
In a mature sarcomere titin seems to have the important mechanical role of elastic
element; titin elasticity is found in the I band where the two block of Ig domains are
separated by the PEVK region (Horowits, 1999). Passive tension and slack length of a
muscle are determined primarily by titin, when a muscle is stretched beyond its slack
length the Ig region straightens with a little increase in tension, and if stretched even
more, the PEVK domains unravels, with exponentially increasing tension.
1.1.3 Myosin binding protein C
A set of proteins that bind to myosin at regular intervals is found in all vertebrates
striated muscles, both skeletal and cardiac, and being totally absent from smooth,
invertebrate and nonmuscle cells it can be considered a feature of the highly specialised
A band of striated muscles (Bennett et al., 1999). Myosin binding protein C (MyBPC)
(Offer et al., 1973), the most abundant of this set of proteins, is a multidomain protein
located in a region of the A-band where thick and thin filaments overlap, known as C-
zone (Figure 1.4). In mammalian muscles MyBPC usually forms seven to nine of the
eleven structurally regular transverse C- zone stripes, however, the distribution of this
and othe myosin binding protein tends to be species and fibre specific. The distance
between stripes corresponds with the myosin helical repeat, that is one every third
myosin molecule, so 43 nm apart. The position of MyBPC seems to be dictated by the
presence of binding sites on titin (Bennett et al., 1999). MyBPC is present only in this
specific region of the A- band and is absent from any other region of the sarcomere,
representing about 2% of the myofibril mass. All this, limits the interaction between
myosin and MyBPC to one every three myosin heads.
MyBPC exists in three isoforms, fast skeletal, slow skeletal and cardiac (Yamamoto and

32
Moos, 1983). In human, the three isoforms map to different chromosomes: fast skeletal
to chromosome 19q13.33, slow skeletal to chromosome 12q23.3 and cardiac to
chromosome 11p11.2, showing that the three isoforms are not products of alternative
splicing. The isoforms tent to be fibre specific, with the cardiac form present only in the
heart; however, fast and slow skeletal isoforms seem to co-exist in some form of muscle
(Flashman et al., 2004).
Each skeletal MyBPC contains ten domains, seven I-class immunoglobulin (Ig-I)
domains and three fibronectin type III (FnIII) domains arranged in the same order (Ig-
Ig-Ig-Ig-Ig-Fn-Fn-Ig-Fn-Ig), identified as domains C1 to C10 (Okagaki et al., 1993).
`
Figure 1.11 Skeletal versus cardiac isoforms of MyBPC. In green are reported the the cardiac specific insertions: an extra N-terminus domain (cC0), three phosphorylation sites whereas in the skeletal isoforms just one is present and a 28 residues insertion in domain cC5. The two skeletal isoforms are similar in their overall structure and are therefore represented as one.
C0
S2 bindingLMM
Titin
Immunoglobulin I like domains
Fibronectin type III domains
Phosphorylation sites
Cardiac specific insertion
C1 C2 C3 C4 C5 C6 C7 C8 C9 C10
Skeletal isoforms
Cardiac isoform
Figure 1.11 Skeletal versus cardiac isoforms of MyBPC. In green are reported the the cardiac specific insertions: an extra N-terminus domain (cC0), three phosphorylation sites whereas in the skeletal isoforms just one is present and a 28 residues insertion in domain cC5. The two skeletal isoforms are similar in their overall structure and are therefore represented as one.
C0
S2 bindingLMM
Titin
Immunoglobulin I like domains
Fibronectin type III domains
Phosphorylation sites
Cardiac specific insertion
C1 C2 C3 C4 C5 C6 C7 C8 C9 C10
C0
S2 bindingLMM
Titin
Immunoglobulin I like domains
Fibronectin type III domains
Phosphorylation sites
Cardiac specific insertion
C1 C2 C3 C4 C5 C6 C7 C8 C9 C10
S2 bindingLMM
Titin
Immunoglobulin I like domains
Fibronectin type III domains
Phosphorylation sites
Cardiac specific insertion
C1 C2 C3 C4 C5 C6 C7 C8 C9 C10
S2 bindingLMM
Titin
Immunoglobulin I like domains
Fibronectin type III domains
Phosphorylation sites
Cardiac specific insertion
C1 C2 C3 C4 C5 C6 C7 C8 C9 C10
Skeletal isoforms
Cardiac isoform
The immunoglobulin fold is composed of two β-sheets comprising five anti parallel β-
strands in each sheet. In an Ig-I domain one of the β-sheet is composed of strands A, B,

33
E and D and the other of strands A', G, F, C and C' (Harpaz and Chothia, 1994). The
other class of protein modules found in MyBPC is, as already mentioned, the FnIII that
are also composed of two β-sheets, one containing strands A, B and E and the other G,
F, C and C', that fold into a β-sandwich (Goll et al., 1998; Main et al., 1992).
D E B A A’ G F C C’
ABE G F C C’
Figure 1.12 Schematic representation of IgI and FnIII folds. IgI domains are formed by strands D, E, B, A and A’, G, F, C, C’, while the FnIII are composed of strands E, B, A and G, F, C, C’. Both fold in two β-sheets.
IgI
FnIII
D E B A A’ G F C C’D E B A A’ G F C C’
ABE G F C C’ABE G F C C’
Figure 1.12 Schematic representation of IgI and FnIII folds. IgI domains are formed by strands D, E, B, A and A’, G, F, C, C’, while the FnIII are composed of strands E, B, A and G, F, C, C’. Both fold in two β-sheets.
IgI
FnIII
The alignment of different forms of this protein shows that the sequence identity across
human isoforms (domains C1-C10) is 39.6% (Thompson et al., 1997), regions of low
identity were found outside the Ig and Fn domains, especially the sequence that
precedes domain C1, the linker between domains C1 and C2 and, in the cardiac isoform,
in the insert of domain C5. The identity between cardiac isoforms from different species
is 46.8% (see appendix A3 p. 210).

34
The cardiac isoform differs from the two skeletal isoforms in four ways:
1. it contains an additional amino terminal Ig-I domain (C0) (Gautel et al., 1995);
2. there is a 9- residue insertion in the linker between domain C1 and C2, the so
called MyBPC motif, in the cardiac variant, which is the key substrate site for
the phosphorylation (Gautel et al., 1995). In this region in the cardiac isoform
are present three phosphorylation sites, while just one is present in both types of
skeletal muscle cells. The number of phosphorylation sites seems to vary
between species but the cardiac isoform always present more sites, usually three.
3. it contains a prolin/charged residue-rich insertion into the domain C5 (Gautel et
al., 1995).
4. it shows a ten residues insertion between C4 and C5 that contribute to the
formation of the enlarged β- bulge present in domain cC5 (Idowu et al., 2003).
The skeletal isoforms are 3 nm in diameter and 40 nm long (Hartzell and Sale, 1985;
Swan and Fischman, 1986) and have a molecular mass of 128 kDa, whereas the cardiac
isoform is longer, with a length of ~44 nm with an approximately 137 kDa molecular
mass (Bennett et al., 1999).
MyBPC seems to have diverse functions in the sarcomere physiology, it might be
involved in sarcomere formation and stability as well as show a regulatory function,
specially via phosphorylation/ de-phosphorylation of the MyBPC motif.
Because of the inability of myosin to form normal thick filaments in the absence of
MyBPC (Koretz, 1979a; Rhee, 1994; Schultheiss, 1990), this protein is assumed to play
an important role in the formation of a normal thick filaments; however, a research
using cMyBPC knockout mice suggests that the role of MyBPC could be more
modulatory rather than essential, as all the knockouts were viable and possessed well
developed sarcomeres even though showed a significant cardiac hypertrophy, fibrosis

35
and myocytes disarray (Harris et al., 2002). It has also been shown that myosin forms
disordered filaments in vitro at low concentration of MyBPC (Moos et al., 1975) and
addition of physiological ratios of the protein results in increased filament compactness
and length (Davis, 1988; Koretz, 1979b). Moreover, in presence of cMyBPC, synthetic
myosin filaments display a decrease in diameter and an increase in length and
uniformity (Flashman et al., 2004). The MyBPC role in sarcomere assembly seems to be
mediated by the C-terminal part of the protein. The last four domains of the protein (C7-
C10) interact with LMM(Okagaki et al., 1993), the presence of the final domain C10 is
essential for binding to myosin (Alyonycheva et al., 1997; Okagaki et al., 1993), in fact
it binds to four molecules of LMM via positively charged residues that are found on it
surface (Miyamoto et al., 1999). To reach the maximal binding to myosin is necessary
also the presence of the other three C-terminal domains, C7, C8 and C9, so the presence
of this C-terminal fragment C7-C10, seems to be essential for sarcomere incorporation
of MyBPC (Welikson and Fischman, 2002).
An interaction with titin also occurs (Furst et al., 1992; Koretz et al., 1993; Labeit et al.,
1997; Soteriou et al., 1993), via the C-terminal region. The fragment containing
domains C8-C10 has been shown to bind to titin, while domains C5-C8 do not, this
leads to the conclusion that the interaction with titin occurs via domains C9 and/ or C10
of MyBPC (Freiburg and Gautel, 1996). As said previously, MyBPC is found only in
the C-zone of the sarcomere, region where is also present the 11 superrepeat of titin,
also made up of IgI and FnIII domains (Labeit et al., 1992; Labeit and Kolmerer, 1995),
each repeat has a 43 nm periodicity (Furst et al., 1989) and MyBPC binds only to this
specific part of titin, always at the firs domain of the 11 superrepeat (Freiburg and
Gautel, 1996). However MyBPC is not present in every C-zone stripe, being absent in
the first two, therefore an additional localisation mechanism must be present that

36
localises MyBPC only in those strips.
It is by the interaction with the thick and titin filaments that MyBPC contribute to the
sarcomere structure and stabilisation. When these interactions are prevented by the
missing of the myosin and titin binding sites, a defective sarcomere is formed.
Experiments on mutant cardiac MyBPC (cMyBPC) have shown that truncated forms of
this protein missing all C-terminal domains following cC1, cC3 or cC4, incorporate in
the sarcomere in 10% of the expressing myocytes, even without the C-terminal titin/
myosin binding domains, while wild type and forms of the protein containing missense
mutations, like E542Q, incorporate in the A band in 76% of the expressing myocytes
(Flavigny et al., 1999). In their study Flavigny et al. showed that even MyBPC
truncated after domain C1, and therefore not possessing the MyBPC motif, could
incorporate in the sarcomere. This evidence lead to the hypothesis that an additional
myosin binding site must be present at the N-terminus of the protein, possibly in the
cardiac specific domain C0 or in the linker between C0 and C1. Recent studies on the
N-terminal domains of cMyBPC have shown that they bind to the S2∆ fragment of
myosin, formed by the first 125 residues of the S2 fragment of myosin, domain cC1
close to the hinge between the myosin rod and the lever arm (Ababou et al., 2008), cC2
a bit more towards the C-terminus (Ababou et al., 2007), confirming an interaction
between MyBPC and myosin other than through the C-terminal domains.
A second role proposed for cMyBPC is localised at the N-terminus of the protein and
consists in the regulation of muscle contraction via phosphorylation/ dephosphorylation.
Regulation of protein- protein interaction by phosphorylation is a common mechanism
to control cell function and in cMyBPC it seems to be achieved via the three
phosphorylation sites present in the so called MyBPC motif, a 100 residue long linker
between domains cC1 and cC2. This linker has recently been suggested to be an IgI

37
domain on the basis of small angle X-ray scattering studies (Jeffries et al., 2008),
however, this was not confirmed by NMR data registered for the group of domains C1-
C2, including the MyBPC motif that links them; in a 1H/ 15N HSQC spectrum it was
shown how all the linker residues are localised in the random coil region of the
spectrum and additional dynamic studies on this region showed that it is highly mobile
and with a low degree of order (Ababou et al., 2008), as expected for an unstructured
peptide. It is therefore possible that the linker is unfolded in solution but that it can
adopts a compact shape, as seen for other unstructured peptides, such as α- synuclein
(Eliezer et al., 2001). The N-terminus of cMyBPC is the part of the protein most
dissimilar from the skeletal isoforms, due to the presence of the extra domain cC0 and
an insertion in the MyBPC motif that comprises two of the three phosphorylation sites,
named from A to C, in contrast with the only site present in the skeletal isoforms which
corresponds to site A in cMyBPC. This fact could be indicating that cMyBPC might
play an important role in regulating cardiac contraction in response to β- adrenergic
stimulation due to the presence of the two extra phosphorylation sites. In fact, cMyBPC
is rapidly phosphorylated when the myocardium is stimulated by β- adrenergic agonists,
such as adrenalin (Garvey et al., 1988), resulting in an increase in contraction force and
speed. Dephosphorylation occurs in response to cholinergic agonists, such as
acetylcholine (Hartzell and Titus, 1982); in vitro studies have shown that this occurs by
action of a protein phosphatise 2A (Schlender et al., 1987) that co-purifies with
cMyBPC (Schlender and Bean, 1991). Heart disease and cardiac failure are often
associated with diminished β-adrenergic sensitivity, impaired cardiac contractility,
abnormalities in Ca2+ flux (Houser et al., 2000; Port and Bristow, 2001) and altered
sarcomeric protein phosphorylation (Decker et al., 2005; van der Velden et al., 2003).
cMyBPC is extensively phosphorylated in basal conditions, but it undergoes partial

38
dephosphorylation during heart disease or pathological hypertrophy, with the three-
phosphorylated form largely absent in case of advanced heart failure as demonstrated by
Sadayappan by works on transgenic animal models: this seems to be independent of the
type of cardiac stress, as pressure overload and genetic alteration in the cardiac
machinery both resulted in significantly reduced phosphorylation (Sadayappan et al.,
2005). The phosphorylation sensitive region of cMyBPC is found in the linker between
domains C1 and C2; when de-phosphorylated, the C1-C2 region interacts with the S2
fragment of myosin but, upon phosphorylation of the MyBPC motif, this binding is
inhibited (Kunst et al., 2000; Levine et al., 2001).
Three different kinases have been identified that can phosphorylate the three sites
Ser275, Ser284 and Ser304, the cyclic adenosine monophosphate (cAMP)- dependant
kinase (PKA), protein kinase C (PKC) and a Ca2+/ calmodulin dependent kinase (CaM-
II). PKA has the capacity to phosphorylated all the three sites, while PKC can act on
Ser275 and Ser304 and CaM-II is active only on the central phosphorylation site B
(Gautel et al., 1995). It has been proven that phosphorylation of cMyBPC has an effect
on filament orientation and contractile mechanisms (Gautel et al., 1995; Kunst et al.,
2000; Winegrad, 2000). In vitro studies have shown that PKA mediated
phosphorylation of cMyBPC extends the myosin-actin crossbridges from the backbone
of the thick filament, increases their degree of order, changes their orientation and
decreases crossbridge flexibility (Weisberg and Winegrad, 1996). The alignment of
cardiac and fast skeletal isoforms shows an insertion in cMyBPC of the residues
LAGGGRRIS, that is probably preceded by a flexible sequence and is the region where
phosphorylation site B is located (Figure 1.13). This site seems to be very important for
cardiac contraction regulation since, when made inactive by substitution of the serine
residue with an alanine, the other two phosphorylation sites are inactivated as well

39
(Gautel et al., 1995). This could mean that, upon phosphorylation of site B, the MyBPC
motif undergoes conformational changes that make the further sites accessible. This has
been confirmed by the fact that mutating this serine to an acid residue, such as aspartate,
thus mimicking the phosphorylated state, can restore the accessibility of A and C
phosphorylation sites, probably by inducing a conformational change in the flexible
loop surrounding site B.
Figure 1.13 Sequence allignment of the C1-linker-C2 region for the three human isoforms, cardiac (HC), fast skeletal (HFSk) and slow skeletal (HSSk). The three cardiac phosphorilationsites are shown by an orange circle, the first (Ser275) is common to all three isoforms, while Ser284 and Ser304 are unique to the cardiac isoform and are found in a cardiac specific insertion.
Figure 1.13 Sequence allignment of the C1-linker-C2 region for the three human isoforms, cardiac (HC), fast skeletal (HFSk) and slow skeletal (HSSk). The three cardiac phosphorilationsites are shown by an orange circle, the first (Ser275) is common to all three isoforms, while Ser284 and Ser304 are unique to the cardiac isoform and are found in a cardiac specific insertion.
A further evidence of the importance of Ser284 is the result of deletion of the
LAGGGRRIS insertion from cMyBPC, resulting in a region more similar to that present
in the skeletal isoforms; in this mutated form of the protein the phosphorylation of sites
A and C was unregulated, with decreased phosphorylation by both PKA and CaM-II
like kinases (Gautel et al., 1995). All this suggests that this cardiac specific insertion has
a strong regulatory function. Moreover, it seems that the thick filament would change its
structure upon phosphorylation of cMyBPC (Levine et al., 2001; Weisberg and
Winegrad, 1998); in the fully phosphorylated state, in fact, the myosin heads appear to
extend from the thick filament backbone in a more ordered fashion, thus the packing of
myosin filaments and their heads seem to be closely linked to the state of cMyBPC
phosphorylation: the more cMyBPC is phosphorylated the easier it is for myosin to

40
interact with the thin filament. MyBPC motif phosphorylation appear also to have an
effect on the ATPase activity of myosin S1, with dephosphorylation of cMyBPC
decreasing ATPase activity the most (Winegrad, 1999). It has been suggested by
Weisberg and Winegrad that regulation of myosin ATPase activity may be mediated by
changes in myosin S1 position and flexibility upon cMyBPC phosphorylation
(Weisberg and Winegrad, 1998). As the level of cMyBPC phosphorylation increases,
contractility is increased, generating a higher maximum Ca2+- activated force (Fmax),
together with a higher Ca2+ sensitivity, that is, a lower concentration of Ca2+ is
necessary to initiate muscle contraction (McClellan et al., 2001). This has been
confirmed by a mouse model, where the three serines have been replaced by alanine,
mimicking the dephosphorylated state of cMyBPC, that had impaired contractility
function (Sadayappan et al., 2005).
It is well established that, in absence of phosphorylation, the C1-C2 region, that
comprises also the phosphorylation sites, interacts with the S2 region of myosin (Kunst
et al., 2000; Levine et al., 2001), as confirmed on more recent studies (Ababou et al.,
2007; Ababou et al., 2008), and that upon phosphorylation this interaction is abolished
(Gruen et al., 1999). This would allow the myosin heads to become free of any steric
constraint that could be imposed on them by cMyBPC.
Interestingly, the N-terminal fragments C0-C2 and C0-C1, can affect force production
and crossbridge activity in skinned myocytes (Herron et al., 2006). At concentration
higher than 10 µM of C0-C2 and C0-C1 on skinned myocytes, both fragments induced a
Ca2+ independent activation of crossbridge cycling and force development. It is well
established that Ca2+ is required to switch on crossbridge cycling and produce force
development, however Herron et al. found that at concentration above 10 µM the two
N-terminal fragments of cMyBPC, C0-C2 and C0-C1, had an activating effect similar to

41
that of Ca2+. On the other hand, the activation by cMyBPC fragments achieved a smaller
maximum force but a higher rate of crossbridge cycling. Moreover, this activating affect
was present also in myocytes where TnC has been extracted, in which Ca2+ activation
was therefore abolished. These effects suggest that cMyBPC fragments are activating
the thin filament via a mechanism different from the one that relies on Ca2+.
It was shown by Herron and co-workers that the fragment C0-C1 binds weakly to S2
but has the same effect of the fragment C0-C2 on crossbridge activation, while fragment
C1-C2, that binds to myosin S2, does not have any effect on force generation or
crossbridge cycling; this brings to the conclusion that the MyBPC motif, present in both
fragments, does not have an influence in these regulatory functions, and that the Pro/
Ala rich linker between domains C0 and C1, present only in fragment C0-C2, could
play this important role. This Ca2+ independent crossbridge cycling could be achieved
by the N-terminus of cMyBPC by either binding to the thin filament directly, as
suggested by two independent studies (Kulikovskaya et al., 2003; Squire et al., 2003),
or by binding to the thick filament to promote the attachment of myosin S1 to actin in a
sufficient number to activate the thin filament. Labelling studies (Herron et al., 2006)
have also demonstrated that the C0-C2 and C0-C1 fragments bind to the thick filament
crossbridge region; this A-band localization of exogenous C0-C1 fragment, that do not
contain the whole S2 binding site, suggests the presence of a region, possibly the Pro/
Ala rich region between C0 and C1, that could bind to a thick filament protein. It has
been hypothesised (Flavigny et al., 1999) that domain cC0 could bind to the myomesin
binding site on myosin; however, cC0 alone did not show any effect on crossbridge
activation and was localized diffusely in the ventricular cells used for the studies carried
out by Herron at al. It was also found that the fragment C0-C2 increased the Ca2+
sensitivity at sarcomere length (SL) 1.9 µm; this is probably achieved by binding to

42
myosin and increasing the freedom and flexibility of the myosin heads, allowing them
to interact more readily with actin. Surprisingly, this effect was absent at SL=2.3 µm
and this could be due to the fact that at this sarcomere length, the spacing between thick
and thin filaments is small enough for this interaction to be favoured. All this leads to
the conclusion that the N-terminus of cMyBPC may function to modulate the Ca2+
activation of crossbridge cycling in cardiac myofibrils.
It has been suggested by different groups (Flavigny et al., 1999; Kulikovskaya et al.,
2003; Squire et al., 2003; Witt et al., 2001) that the N-terminus of MyBPC could
interact with actin and the fact that all isoforms have shown a low affinity for the F-
actin in co-sedimentation assays (Moos et al., 1978; Yamamoto and Moos, 1983) makes
it improbable that this interaction might take place via a cardiac specific insertion, such
as domain cC0. The Pro/ Ala rich region between domain cC0 and cC1 is also thought
to be capable of interacting with the F-actin filament (Kulikovskaya et al., 2003; Squire
et al., 2003). This hypothesis is based on the fact that the essential light chain (ELC) has
at its N-terminal end a region of similar composition that is thought to form an extended
rod-shaped structure, stable under a variety of conditions, that binds to actin (Timson
and Trayer, 1997). An interesting possible function of this extension might be that the
binding to actin may affect the actomyosin ATPase properties of myosin. It is
conceivable, in conclusion, to think that also the Pro/ Ala rich region of MyBPC might
have a similar function. That an interaction between this region of cMyBPC and actin
takes place has been shown by Kulikovskaya (Kulikovskaya et al., 2003) and is reported
as unpublished data by Govada et al (Govada et al., 2008), in both cases as results of co-
sedimentation assays. The first report of an interaction between MyBPC and actin dates
back to 1978 (Moos et al., 1978) but the exact location of this interaction has not yet
being conclusively determined. There have been reports of increased actomyosin

43
ATPase activity upon MyBPC binding to actin, presumably by producing links between
actin and myosin, to form aggregates of the two contractile proteins (Moos et al., 1978).
It has been demonstrated that binding of MyBPC to actin is Ca2+ sensitive and that
binding of this protein to F-actin causes side-by-side association of thin filaments
(Yamamoto, 1986). A more recent study has shown that cMyBPC, and more precisely
the C1-C2 fragment, binds to F-actin, even in the presence of tropomyosin, troponin and
Ca2+, with both motility assays and co-sedimentation experiments (Razumova et al.,
2006); even though increasing ionic strength was found to reduce the interaction,
binding was still evident at physiological ionic strength (0.2 M KCl), indicating a
persistent interaction between the C1-C2 fragment and actin at physiological conditions.
Using a variety of fragments, C0-C1, C0-C2, C1-C2 and C2-C4, Razumova et al have
demonstrated that the presence of the MyBPC motif affected both the sliding motility of
F-actin on myosin filaments and reduced the myosin ATPase rates in solution. They
found that the C1-C2 region, that has already been shown to bind to the S2 fragment of
myosin, binds to actin, and confirmed it, finding that fragments missing C1 and the
MyBPC motif, like C2-C4, fail to show any effect on actin binding (Razumova et al.,
2006).
1.1.4 Hypertrophic cardiomyopathy (HCM)
The reason of the growing interest in cMyBPC is its connection with the disease
Hypertrophic Cardiomyopathy (HCM). Cardiomyopathies are diseases of the
myocardium associated to cardiac dysfunction that can be complicated by heart failure,
arrhythmias and sudden death (Richardson et al., 1996) and are a major cause of
cardiovascular morbidity and mortality, being a frequent reason of cardiac

44
transplantation. HCM, as well as other forms of cardiomyopathy, is a genetic disorder
associated with mutated forms of sarcomeric proteins. The first HCM-related mutation
was discovered in a large French-Canadian family in 1990 and affects the β-myosin
heavy chain (Geisterfer-Lowrance et al., 1990). Since then many other mutations have
been identified in genes coding for sarcomeric proteins, including MYBPC3.
HMC is defined by an unexplained left ventricular hypertrophy (LVH), usually
involving the inter-ventricular septum, in cases where other detectable causes of heart
remodelling, such as hypertension or amyloidosis, must be excluded. A consequence of
hypertrophy is that the left ventricular volume is diminished. Histopathology of the
hypertrophic heart can be noticeably abnormal with the highly registered alignment of
myocytes, typical of the healthy myocardyum, distorted by hypertrophic growth of the
myocyte that can produce enlarged and deformed myocytes and disorientation of
adjacent cells (Figure 1.14). These features are collectively known as myocyte disarray
and can be found mixed with normal myocyte or widespread throughout the left
ventricle (Maron, 2002; Seidman and Seidman, 2001) . In HCM, systolic function is
increased or at least preserved, while most affected individual develop dyspnea and
angina due to impaired diastolic relaxation of the hypertrophied heart (Spirito et al.,
1997).

45
1)
2)
Figure 1.14 1) Cardiac remodeling. The hypertrophic heart (A) has a ventricular wall thicker than the non affected myocardium (B);2) Histopathology of hypertrophic heart. The highly ordered alignment of myocytes typical of the normal myocardium (A) is disrupted by hypertrophic growth of the myocytes, which can results in myocytes deformed and disoriented (B).Picture adapted from (Seidman and Seidman, 2001).
1)
2)
1)
2)
Figure 1.14 1) Cardiac remodeling. The hypertrophic heart (A) has a ventricular wall thicker than the non affected myocardium (B);2) Histopathology of hypertrophic heart. The highly ordered alignment of myocytes typical of the normal myocardium (A) is disrupted by hypertrophic growth of the myocytes, which can results in myocytes deformed and disoriented (B).Picture adapted from (Seidman and Seidman, 2001).
Despite the fact that in the hypertrophic left ventricle the internal cavity is a lot smaller
than in a normal heart, usually the heart muscle is able to pump properly and thus most
people do not have limiting symptoms. However in some cases the thickened heart
muscle is abnormally stiff and so when the left ventricle fills with blood, the stiffness of
the muscle increases the pressure inside the right ventricle and this is reflected into the
lungs, causing shortness of breath. In some cases the increase in the thickness of the
ventricular septum occurs just below the aortic valve and may block the normal flow
out of the heart into the large blood vessel that supply the whole body, the aorta, this
phenomenon is better described as hypertrophic obstructive cardiomyopathy. This kind
of HCM can also affect the second cardiac valve, the mitral valve, which prevents
backwards flow from the left ventricle to the left atrium; when there is distortion of the

46
mitral valve motion, the blood can flow backwards causing shortness of breath.
Individuals with HCM can experience two major types of arrythmia, atrial fibrillation,
which is an abnormal heart rhythm where the top part of the heart, the atrium,
undergoes disorganized electrical activation and sends multiple, fast, irregular impulses
to the left ventricle, resulting in the heart beating rapidly and irregularly leading to
palpitations, shortness of breath and decreased exercise capacity, and the more serious
ventricular tachycardia, also called ventricular fibrillation, that can lead to cardiac death.
The incidence of HCM is of 1 person every 500 people with an annual mortality of 1%
and being the first cause of death in athletes (Maron, 1996). HCM is inherited as a
mendelian autosomal dominant trait caused by mutations in genes encoding 13 proteins
of the cardiac sarcomere, making it primarily a sarcomeric disorder.
The proteins that carry the HCM-related mutations are reported in table 1.1: three
myofilament proteins, β-myosin heavy chain (β-MyHC), the essential light chain
(MLC-3) and the regulatory light chain (MLC-2); three thin-filament proteins, cardiac
troponin T (cTnT), cardiac troponin I (cTnI), and α-tropomyosin (α-TM) and, finally, in
the cardiac isoform of myosin binding protein C (cMyBPC). The gene MYBPC3 that
encodes cMyBPC is located in the chromosome 11p11.2 and comprises 24000 bp
divided in 35 exons.
In all clinical studies the two genes MYH7 and MYBPC3 were the most common genes
responsible for the disease, each of them being involved in 30% to 40% of cases.

47
70% of the MYH7 mutations are located in the region coding for the globular head and
neck domain, while 30% affect the rod of myosin. Almost the all of these (96%) are
missense mutations. In MYBPC3, on the other hand, half of the ~150 mutations are non-
sense mutations leading to termination codons, splice site mutations, small deletion or
insertion disrupting the reading frame that bring to the formation of truncated forms of
the protein. Truncation mutations are thought to cause haploinsufficiency since the
mutated cMyBPC without the C-terminus seems not to incorporate in the sarcomere
(Rottbauer et al., 1997). 75 missense mutations have been found in MYBPC3 (table 1.2)
so far. Investigations of the consequence of some of these point mutations have been
particularly informative in defining structure and function of the domains in which they
have been found. Nevertheless, the mechanism by which many of these mutations cause
HCM remains unsolved and is still very difficult to predict the exact functional
consequences of mutations only form their nature and position.
In recent years, the generation of engineered animal models of human mutations has
allowed a more accurate evaluation of the process leading from gene defect to HCM
phenotype (Geisterfer-Lowrance et al., 1996; Marian et al., 1999; Tardiff et al., 1998;
Yang et al., 1998), however the results of studies performed either in vitro or on animal
Sarcomeric Protein Gene Locus n° HCM point mutations
β- Myosin heavy chain MYH7 14q12 194 Myosin Binding Protein C MYBPC3 11q11.2 149 Cardiac troponin T TNNT2 1q32 31 Cardiac troponin I TNNI3 19p13.2 27 α-tropomyosin TPM1 15q22.1 11 Regulatory light chain MYL2 12q23- q24.3 10 Cardiac α actin ACTC 11q 7 Essential light chain MYL3 3p21.3- p21.2 5
Table 1.1: HCM related mutations identified in sarcomeric protein. Data obtained from from databases http://genepath.med.harvard.edu/~seidman/cg3/ and
http://beta.uniprot.org/uniprot/Q14896

48
models have been contradictory. In some cases Ca2+ sensitivity and ATPase activity
were reduced, resulting in decrease of actin-myosin interactions and diminished
myocyte contractility (Crilley et al., 2003; Lankford et al., 1995). The impaired
contractility is supposed to activate the release of stress-related signalling kinases and
trophic factors which stimulate myocyte hypertrophy. Contrasting results have shown,
on the other hand, an enhancement of ATPase activity in myosin, with a consequently
increase in actin-myosin interaction leading to enhanced force generation and
cardiomyocyte contractility (Olsson et al., 2004) with a consequent increase in work
and energy consumption. Moreover, the presence of both wild-type and mutant protein
within the sarcomere may result in uncoordinated contraction. There is also a high
probability of energy depletion, myocyte death and fibrosis. (Seidman and Seidman,
2001). All these results reveal the complexity of this condition and the probable
involvement of multiple mechanisms implicating multiprotein complexes in the
pathophysiology of HCM. Most of the patients are heterozygous for the mutation that is
transmitted by one of the parents. The symptoms tend to be more severe the earlier the
disease presents in life, so elderly patients are very unlikely to be severely affected, with
just a minority of over 75 to show heart failure.

49
Domain Mutation Domain Mutation Domain Mutation
cC0 Gly5Arg cC3 Arg470Gln cC5 Asp770Asn
cC0 Arg35Trp cC3 Gly490Arg cC6 Val771Met
cC0 Thr59Ala cC3 Arg495Gln cC6 Trp792Arg
cC1 Pro161Ser cC3 Arg502Trp cC6 Arg810His
cC1 Arg177Cys cC3 Arg502Gln cC6 Lys811Arg
cC1 Gln208His cC3 Gly507Arg cC6 Arg820Gln
cC1 Val219Leu cC3 Gly523Trp cC6 Ala833Thr
cC1 Asp228Asn cC3 Gly531Arg cC6 Ala833Val
cC1 Tyr237Ser cC3 Glu542Gln cC6 Arg834Thr
cC1 Val256Ile cC4 Leu545Met cC6 Arg834Trp
MyBPC motif His257Pro cC4 Cys566Arg cC7 Pro873His
MyBPC motif Glu258Lys cC4 Asp604Val cC7 Val896Met
MyBPC motif Gly263Arg cC4 Asp605Asn cC7 Asn948Thr
MyBPC motif Arg273His cC4 Pro608Leu cC7 Thr958Ile
MyBPC motif Gly278Glu cC4 Glu619Lys cC8 Gln998Arg
MyBPC motif Gly279Ala cC4 Ala627Val cC8 Arg1002Gln
MyBPC motif Arg282Trp cC5 Arg654His cC8 Pro1003Gln
MyBPC motif Arg326Gln cC5 Arg668His cC8 Glu1017Lys
MyBPC motif Cal342Asp cC5 Arg668Pro cC9 Phe1113Ile
MyBPC motif Leu352Pro cC5 Pro677Leu cC9 Val1115Ile
cC2 Gly415Ser cC5 Arg733Cys cC9 Val1125Met
cC2 Ala416Ser cC5 Asn755Lys cC9 Ile1131Thr
cC2 Glu441Lys cC5 Val757Met cC10 Ala1194Thr
cC2 Glu451Gln cC5 Gly758Asp cC10 Gly1206A sp
cC3 Arg458His cC5 Glu759Asp cC10 Ala1255Thr
Table 1.2: cMyBPC point mutation causing HCM obtained from from databases
http://genepath.med.harvard.edu/~seidman/cg3/ and http://beta.uniprot.org/uniprot/Q14896.

50
The degree of hypertrophy, the age of onset and the prognosis seem to be dependent
directly from the precise gene mutation, for example mutations in the gene TNNT2, that
code for troponin T, are usually associated with a severe phenotype and high risk of
sudden death, specially in young patients, despite the mild degree of hypertrophy
(Watkins et al., 1995b). In MYH7 mutations the phenotype varies considerably
according to the mutations, some being associated with a benign phenotype, like
V606M, while others, like R403Q, are associated with severe hypertrophy and reduced
survival expectances (Charron et al., 1998; Watkins et al., 1992). Mutations in the
MYBPC3 gene are usually associated with late onset and milder phenotype and delayed
penetrance until the fifth decade of life, while mutations in other genes are almost
completely penetrant by the second or third decade. However, recent data report of
cardiac death in extremely young patients with a mutated MYBPC3 gene (Lekanne
Deprez et al., 2006). Survival of patients with cMyBPC mutations have shown to be
better than that observed with mutations in cardiac troponin T or in malignant cardiac β-
myosin heavy chain. Many young and middle-age persons presenting a mutation in the
MYBPC3 gene show no symptoms of HCM and it is possible that some of these
mutations will remain nonpenetrant throughout life. HCM penetrance seems to decrease
with age in people with cMyBPC mutations (Niimura et al., 1998). For this reason, it
has been suggested that MYBPC3 is the most commonly involved in HCM but, given its
benign phenotypes and low penetrance, the prevalence of the mutations found in these
gene has been underestimated (Richard, 2003a). However, contrasting results were
obtained by VanDriest and co-workers (Van Driest et al., 2004) that fail to identify a
difference in age of diagnosis in patients with mutations in the MYH7 and MYBPC3
genes.Patients with multiple sarcomeric mutations had the most severe phenotype,
which means youngest at diagnosis and higher degree of hypertrophy.

51
1.1.5 Main HCM related missense mutations found in cMyBPC role in
Hypertrophic cardiomyopathy
Given the strong association of cMyBPC with HCM, mutagenesis studies are an
extremely important tool to try and elucidate the function of the domains that contain a
specific mutation. This kind of analysis has been carried out on domain cC1 (Ababou et
al., 2008), cC2 (Ababou et al., 2007) and cC5 (Idowu et al., 2003), and have given
important insight on both the domains structure and function. Despite being unique to
the cardiac isoform of MyBPC, domain cC0 presents a small number of HCM related
mutations. The function of this domain is still unclear as well as its presence in the heart
muscle. An interaction between domain C0 and myosin has been thought to occur on the
basis of a mutant MyBPC mouse model (Okagaki et al., 1993), as MyBPC missing the
C-terminal domains was still incorporated in the sarcomere (around 10%), an additional
myosin binding site must be present toward the N-terminus. Sequence comparison
between C0 and myomesin suggests that C0 contains a novel LMM binding site
(Flavigny et al., 1999). Whether this interaction occurs and what is its function is still
unclear. An actin binding site has been proposed but it has been shown that all the
isoforms of MyBPC have a low affinity for actin (Moos et al., 1978; Yamamoto and
Moos, 1983) indicating that any interaction with actin via a cardiac- specific region,
such as cC0, is very unlikely to occur. The linker between C0 and C1, that in the
skeletal isoforms represent the N-terminus of the whole protein, is thought to be a more
likely candidate for binding actin (Squire et al., 2003) but no HCM related mutations
have been found in this region to confirm this hypothesis. More recently it has been
shown that fragments of MyBPC containing C0 are able to bind to actin and has been
suggested that it may contribute to the weak binding state by shifting the binding of the

52
N-terminus of the C-protein between actin and myosin (Kulikovskaya et al., 2003).
However, C0 and the cC0-cC1 linker are very unlikely to be able to bind to the myosin
crossbridge, the myosin backbone and actin at the same time but it is possible that
MyBPC cycles trough different binding partners. Further research is required to clarify
this point.
As discussed diffusely in a previous section, domains C1 and C2 and the linker between
them interact with the S2∆ fragment of myosin (Gruen and Gautel, 1999) that comprises
the first 18 heptad repeats of myosin S2 formed by the first 125 residues, from residue
838 to residue 963; this region contains the R870H mutation linked to HCM. This
interaction between the N-terminus of cMyBPC and S2∆ is regulated by
phosphorylation of the three phosphorylation sites (S275, S284 and S304) present in the
C1-C2 linker. Detailed studies on this interaction carried out using NMR spectroscopy
have recently been published elucidating the role of domains cC1 and cC2 and their
interaction with S2∆ (Ababou et al., 2007; Ababou et al., 2008). Monitoring the binding
of the two domains with S2∆ by NMR spectroscopy had the advantage of allowing,
once the structure was known, to map the residues more affected by the interaction on
the domain surface. Several HCM related missense mutations have been identified in
domain cC1, all of them seem to be found around the C-terminus surface of the protein.
Some of them, like Y237S and V256I, involve mutation of very conserved residues
found in the hydrophobic core of the protein, fundamental for the overall folding of the
domain and, as a consequence, are thought to cause strong destabilization of the
domain; others, like D288N involve residues exposed on the surface that have a role in
the interaction with the myosin S2∆ fragment. At the centre of the interaction between
cC1 and S2∆ there is residue W196 which is located in CD-loop and, with A232, forms
a little hydrophobic patch that interacts with residues F856 and M852 on S2∆; all the

53
other residues involved in the interaction are of a polar nature. Of the HCM related
mutations, two have been incorporated in recombinant cC1, D228N and Y237S
(Ababou et al., 2008). The latter involves an hydrophobic residue highly conserved
through isoforms and species which has a strong influence on the domain stability; as a
consequence, it was impossible to produce soluble protein, confirming the hypothesis
that the protein was not able to assume a proper fold. Interestingly, Y237S results in a
mild HCM phenotype but shows a strong disease association (Morner et al., 2003). The
second mutation D228N, on the other hand, involves a polar residue positioned on the
interaction surface with S2∆ and causes a weakening of this interaction without
affecting the stability of the domain. Two other HCM related mutations, R177C and
V219L, are distant from the S2∆ binding surface and, affecting residues whose side
chain is exposed on the surface, are unlikely to affect the structural stability of the
protein; on the other hand they might affect the interaction of domain cC1 with a
sarcomeric protein other than S2. also domain cC2 was shown to interact with S2∆,
precisely at the regions between resides 220 and 230 and residues 280 and 300. All the
residues involved in the interaction with S2∆ are grouped on the F, G and A’ strands
and the A’B loop of cC2, all in the vicinity of the C-terminus of the domain. The
chemical shift changes were small but significant, as expected for an interaction
happening via polar residues. The surface involved in the interaction with S2∆ is
completely free from positively charged residues, in a domain where charges are
otherwise evenly distributed; this pattern is well established for the C2 domain in
different isoforms and species. To confirm these results, the same experiments were
repeated with a mutant of fragment S2∆, that contained the missense mutation R870H,
which has been reported to cause HMC (Gruen and Gautel, 1999); the results obtained
indicated that residues in the same region were affected but the binding was

54
significantly reduced (Ababou et al., 2007) by a factor between 3 and 4, in agreement
with the results obtained previously by ITC (Gruen and Gautel, 1999). The reason of
this reduction seems to be due to the difference in shape between the side chains of
arginine and histidine; R870 is forming a salt bridge or hydrogen bond with the cC2
residue Glu445 that cannot be formed if an histidine replaces an arginine. Interestingly,
using the mutant S2∆-R870H, some residues that were not involved in the interaction
using the wildtype myosin fragment, showed a perturbed chemical shift; this could be
explained by a rearrangement occurring so that Glu445 could interact with either
Arg869 or Arg871 which are available and very near. It is worth noting that residue
R869, when mutated to cysteine, glycine or histidine, has been reported to cause HCM
(Anan et al., 2000).
Domains C3 and C4 are thought to play a role in the flexibility of the N- terminal region
and in its interaction with either the S2 region of myosin or the actin filament. Three of
the HCM mutations found in C3 (R495Q, R502Q and R502W) involve highly
conserved residues but they seem to be not essential for defining the IgI fold and the
three mutations result in a favourable disease prognosis (Maron et al., 2001; Niimura et
al., 1998; Richard, 2003b). C5 domain has two cardiac-specific insertion. It shows a ten
residues long segment at the N-terminus that previously was assumed to be part of a
linker between the domains C4 and C5 but that has been shown to be part of the
enlarged β-bulge of domain C5(Idowu et al., 2003). The second peculiarity of the
domain cC5 is the 28 amino acids insertion between the strands C and D, known as the
CD-loop. This region is completely unstructured and highly dynamic. It presents a
proline/ charge rich insert that points away from the domain’s surface. This insertion is
always present in the cardiac isoforms but varies greatly in sequence and length
between different species. Domain C5 has been studied by different groups because of

55
its unique cardiac insertion and the identification of several HCM related mutations. A
study has shown that domain C5 bind to domain C8 of a different molecule of the same
protein using a yeast two-hybrid assay, with domain C5 as a “bait” (Moolman-Smook
et al., 2002). The same kind of experiment has shown that domain C7 interacts with
domain C10 and an interaction between C6 and C9 has been proposed too. As a
consequence of these results, a model of the myosin filament was developed, where
three MyBP-C molecules form a collar around the thick filament of myosin, stabilized
by intermolecular interaction between domains cC5-7 of each molecule and the domains
cC8-10 of the next molecule. Only three of the ten HCM related mutations identified so
in domain cC5 have been studied in detail so far: N755K, R654H and R668H. The first
point mutation exhibits a severe phenotype, as Asn755 is located in the highly
conserved position 1 of the β-turn connecting the F and G strands, the mutation makes
the protein unstable and unfolded compared to the wild-type cC5, due to the loss of
several key interactions (Idowu et al., 2003); phenotype corresponding with this
mutation is extremely severe, associated with marked hypertrophy even in children and
sudden cardiac death in one of eight affected patients (Okagaki et al., 1993), suggesting
a complete or partial loss of structure and thus of function. Mutation R654H is
characterised by a milder phenotype with low penetrance and moderate hypertrophy
even in adults (Moolman-Smook et al., 1998). Being residue R654 localised on the
domain surface it does not affect the stability of the domain (Daehmlow, 2002). The
surface where residue Arg654 is found has a high percentage of negatively charged
amino acids and it has been proposed to be the binding site of domain cC8, as a
consequence the R654H mutation could affect the proposed interation with domain cC8.
A third mutations, R668H, has been found in this domain (Morner et al., 2003) but,
since the polar positive histidine substitutes the polar positive arginine, it does not seem

56
to cause significant structural instability of the fold of domain C5. R668H could have an
impact on the ability to bind a ligand, however, this residue is not located on the surface
proposed to be a target for domain C8 and is unlikely to interfere with C8 binding.
Domain C6 is the first of the three FnIII domains in the protein, together with domains
C7 and domain C9, that is thought to be its binding partner; this interaction has not been
tested yet and is postulated based on the interactions between domains 5 and 8 and
domains 7 and 10 that have been shown to occur. Usually two interacting FnIII domains
interact via electrostatic charges: the EF loop at the end of the first domain (C6) is
supposed to form a salt bridge and hydrogen bonds with the BC loop of the following
domain (C7). Residue A833 is a highly conserved amino acid located in the strand E of
C6 and is probably involved in the bond between domains C6 and C7; when mutated it
may disrupt bonds between the two residues and cause an incorrect packing and
assembly of the protein (Morner et al., 2003; Richard, 2003b). Two mutations occur in
strand C at the conserved residues R810 and K811 (Nanni et al., 2003; Richard, 2003b) .
The reported mutation, R810H and K811R, do not alter the charge of the residue and are
not likely to affect the stability of the domain. These mutations result in a mild
phenotype. Another mutation found in domain cC6 is R820Q but it is not clear whether
this is an HCM related mutation or a neutral polymorphism, since the phenotype
appears to be mild, usually with first presentation late in life (de Pereda, 1999; Sharma
et al., 1999).
The C-terminal region is where the binding sites for myosin thick filament (Moos et al.,
1975; Starr and Offer, 1978) are situated . The primary myosin and titin binding regions
of MyBP-C are localised to domain 10 and domains 8-10, respectively (Freiburg and
Gautel, 1996; Okagaki et al., 1993). These three domains C8-C10 are the minimal
requirement for incorporation into the A-band of the sarcomere (Gautel et al., 1995),

57
while domain C7 improves the targeting of MyBP-C to the C-zone (Gilbert et al., 1999).
The C-terminus of MyBPC plays an important role in the formation of a normal
sarcomere, so C-terminal truncated forms of the protein cause severe changes in hearts
ultrastructure both in transgenic mouse models (McConnell et al., 1999; Yang et al.,
1998; Yang et al., 1999) and in HCM affected individuals (Bonne et al., 1998; Niimura
et al., 1998).
A large number of HCM mutations result in premature termination of translation of the
C-terminus of MyBP-C, resulting in loss of the titin and/ or myosin binding sites
(Bonne et al., 1995; Niimura et al., 1998; Rottbauer et al., 1997; Watkins et al., 1995a;
Yu et al., 1998). As a consequence these truncated mutant protein do not incorporate in
the sarcomere and can cause extremely severe cases of HCM (Lekanne Deprez et al.,
2006). Several missense mutations are located in domain cC7. P873H (Hartzell and
Sale, 1985) is a very rare mutation found in just one patient with a mild phenotype. It
occurs in a residue that is highly conserved across species and isoforms and is thought
to affect the formation of strand A or the stability of the linker between cC6 and cC7. It
is not clear whether mutation V896M is disease causing, disease modifying or a neutral
polymorphism (Jaaskelainen et al., 2002; Richard, 2003b). Usually patients with this
mutations also show other HCM related mutations in the myosin heavy chain (Morner
et al., 2003; Richard, 2003b), thus this mutations may not cause disease but it may
increase the severity of the disease in presence of other HCM mutations. Residue V896
is conserved and is predicted to point into the core of the FnIII domain; when a
methionine replaces a valine, the domain stability may be affected but this mutation is
unlikely to lead to incorrect folding of the domain given the non-polar nature of the
residues involved. N948T occurs in a conserved position but was found in only one
patient resulting in a severe disease phenotype (Daehmlow, 2002). Residue Asn948 is

58
expected to be located in the β-type turn connecting strand F and strand G (Goll et al.,
1998), in a position similar to the residue Asn755 in cC5, where an important mutation
has been found. Therefore, Asn948 is probably of crucial importance for the domain
folding and its loss could result in a poorly folded domain unable to target MyBP-C to
the A band of the sarcomere and that may disrupt the interaction between domain C7
and its possible binding partner C10.
Domain C10 is of great importance due to its binding to myosin with nine key residues
involved in binding to this filament been identified (Gilbert et al., 1996; Miyamoto et
al., 1999; Okagaki et al., 1993). The myosin binding faces are thought to be located on
two surfaces, the first formed by strands B and E, the other by strand C of the IgI fold.
Of the mutations found in this domain, an insertion-mutation of residues 1248-1253
(Watkins et al., 1995a) and a missense mutation, A1255T (Richard, 2003b), are very
unlikely to interfere with myosin binding since the mutated residues are not found on
the surface involved in the interaction with this sarcomeric protein (Maron et al., 2001;
Richard, 2003b). These result suggests that they both may affect some other function of
domain C10, possibly its binding to titin (Moolman-Smook et al., 1998) or an alteration
in the interaction that may occur with C7 or the adjacent C9.
Mutation A1194T (Richard, 2003b) could interfere with myosin binding as residue
Arg1194 is found close to two identified key myosin-binding residues (Miyamoto et al.,
1999) and therefore may disrupt binding of MyBP-C to the myosin filament.
1.1.6 How does the cMyBPC assemble in the sarcomere?
Following the detailed mutagenesis studies Ababou and coworkers were able to build a
model of the interaction between the cC1-cC2 fragment of cMyBPC and the S2∆ part of
myosin (Ababou et al., 2008). The position of C1 and C2 is such that the MyBPC motif
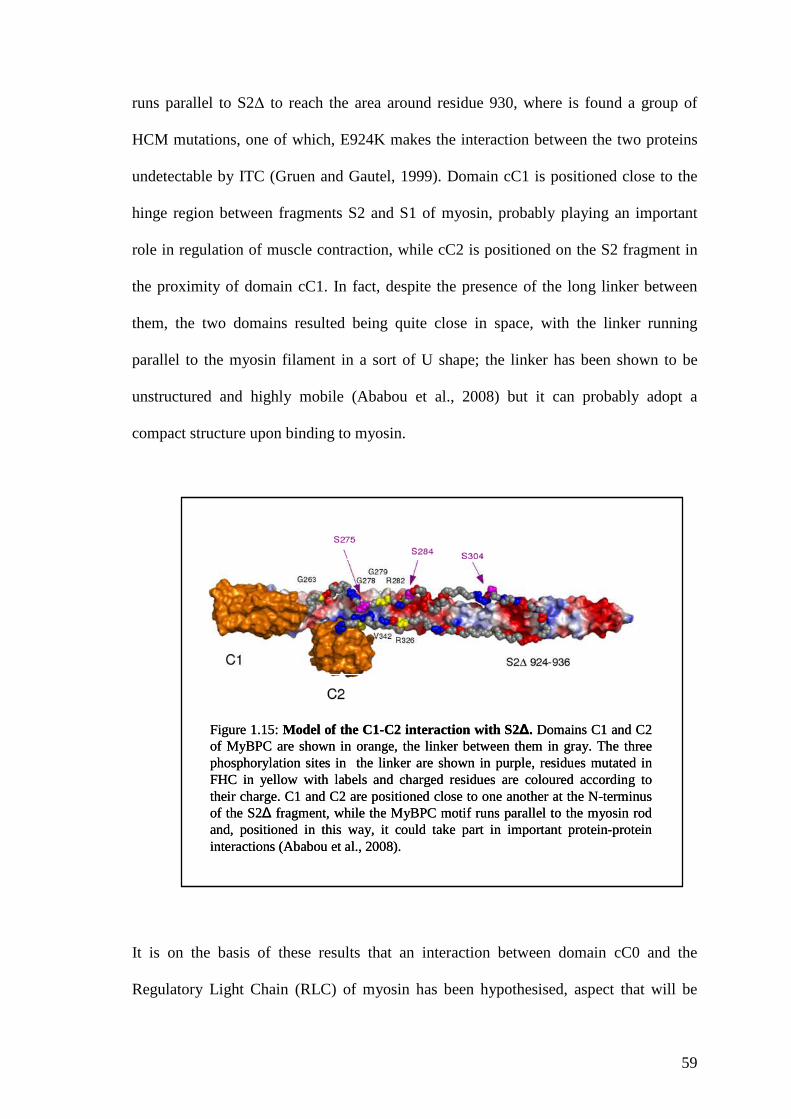
59
runs parallel to S2∆ to reach the area around residue 930, where is found a group of
HCM mutations, one of which, E924K makes the interaction between the two proteins
undetectable by ITC (Gruen and Gautel, 1999). Domain cC1 is positioned close to the
hinge region between fragments S2 and S1 of myosin, probably playing an important
role in regulation of muscle contraction, while cC2 is positioned on the S2 fragment in
the proximity of domain cC1. In fact, despite the presence of the long linker between
them, the two domains resulted being quite close in space, with the linker running
parallel to the myosin filament in a sort of U shape; the linker has been shown to be
unstructured and highly mobile (Ababou et al., 2008) but it can probably adopt a
compact structure upon binding to myosin.
Figure 1.15: Model of the C1-C2 interaction with S2∆. Domains C1 and C2 of MyBPC are shown in orange, the linker between them in gray. The three phosphorylation sites in the linker are shown in purple, residues mutated in FHC in yellow with labels and charged residues are coloured according to their charge. C1 and C2 are positioned close to one another at the N-terminus of the S2∆ fragment, while the MyBPC motif runs parallel to the myosin rodand, positioned in this way, it could take part in important protein-protein interactions (Ababou et al., 2008).
Figure 1.15: Model of the C1-C2 interaction with S2∆. Domains C1 and C2 of MyBPC are shown in orange, the linker between them in gray. The three phosphorylation sites in the linker are shown in purple, residues mutated in FHC in yellow with labels and charged residues are coloured according to their charge. C1 and C2 are positioned close to one another at the N-terminus of the S2∆ fragment, while the MyBPC motif runs parallel to the myosin rodand, positioned in this way, it could take part in important protein-protein interactions (Ababou et al., 2008).
It is on the basis of these results that an interaction between domain cC0 and the
Regulatory Light Chain (RLC) of myosin has been hypothesised, aspect that will be
60
dealt with in this thesis. All these results give an insight in the manner the N-terminus of
the protein can assemble into the sarcomere, while on the overall way of incorporation
of MyBPC in the sarcomere two different models have been proposed.
1.1.6.1 Trimeric collar model
In the trimeric collar model, proposed by Moolman- Smook co-workers (Moolman-
Smook et al., 2002), three cMyBPC molecules form a ring around the thick filament,
interactions between domains C5-C7 and domain C8-C10 of another molecule of
MyBPC are needed to stabilized this model, while domains C0-C4 are thought to reach
out from the thick filament and interact with the myosin crossbridge and/or the actin
filament (Squire et al., 2003; Witt et al., 2001). Although this model is able to explain
some aspects, it is not satisfactory on others, firstly the diameter of the myosin thick
filament is 13-15 nm (Squire et al., 1998), resulting in a circumference of approximately
41-44 nm but according to this trimeric collar model, the ring around the thick filament
is formed by nine IgI domains, which have a diameter of maximum 3.4-3.9 nm,
resulting in the largest ring possible being 35-36 nm, so 5-12 nm shorter than the
measured circumference of the myosin thick filament (47 nm). Furthermore, there is no
evidence that the C-terminal region of MyBP-C is subjected to high degree of stretch. It
is possible that some of the linkers may provide additional length to form a collar
around the myosin filament, however, the only linker of significant length in this region
is the one between domains C9 and C10, but stretching it may result in mismatch
between interacting domains in the trimeric collar model. A second unsolved problem is
how the titin molecule fits in this model; titin is the molecular ruler of the sarcomere
(Whiting et al., 1989). The C-terminal domains C7- C10 of MyBPC bind to both titin

61
and the LMM of the myosin thick filament but this model does not clarify how
cMyBPC interacts with titin, since in the model the titin molecule would be
perpendicular to the trimeric collar (Freiburg and Gautel, 1996). Recent data (Flashman
et al., 2008) have given support to this model, confirming the presence of the C5-C8
interaction also in fast skeletal muscle but interestingly not in slow skeletal muscles.
Figure 1.16 Trimeric collar model of incorporation of MyBPC in the sarcomere. In the trimeric collar model three molecules of MyBPC wrap around the myosin backbone. This hypothesis is based on results showing that domains C5 and C7 of one molecule of MyBPC interact with domains C8 and C10 of another molecule of the same protein. According to this model a interaction between domains C6 and C9 is thought to occur. Picture adapted from (Moolman-Smook et al., 2002).
Figure 1.16 Trimeric collar model of incorporation of MyBPC in the sarcomere. In the trimeric collar model three molecules of MyBPC wrap around the myosin backbone. This hypothesis is based on results showing that domains C5 and C7 of one molecule of MyBPC interact with domains C8 and C10 of another molecule of the same protein. According to this model a interaction between domains C6 and C9 is thought to occur. Picture adapted from (Moolman-Smook et al., 2002).

62
1.1.6.2.Axial model
In a second model, proposed by Squire and co-workers (Squire et al., 2003), cMyBPC is
arranged axially along the myosin backbone and is able to interact with titin and LMM
with its C-terminus while the N-terminus reaches out to interact with the myosin
crossbridge and/ or actin.
Figure 1.17 Axial model of incorporation of MyBPC in the sarcomere. In this model a molecule of MyBPC runs parallel to the myosin thick filament, and different molecules of MyBPC do not interact with one another. In this model the N-terminus reaches out to interact with the actin thin filament. Picture adapted from (Squire et al., 2003).
Figure 1.17 Axial model of incorporation of MyBPC in the sarcomere. In this model a molecule of MyBPC runs parallel to the myosin thick filament, and different molecules of MyBPC do not interact with one another. In this model the N-terminus reaches out to interact with the actin thin filament. Picture adapted from (Squire et al., 2003).
In this model two MyBPC molecules are separated by 43 nm on the myosin filament.
The N-terminal region is allowed to interact with the myosin head or actin, while the C-
terminal zone is involved in binding the C-protein to the myosin thick filament. Figure
1.17 shows how MyBP-C would assemble in the sarcomere: according to this model

63
domains C7-C10 run axially along the myosin filament backbone not allowing different
molecules of the same protein to interact with one another; this model does not take into
consideration the observed cC5-cC8 and cC7-cC10 interaction.
1.1.7 Aim of the project
To have a better understanding of the function of cMyBPC, it is important to
characterize the interactions between this protein an other sarcomeric polypeptides. To
do so, many techniques have been used, but a particular potent method to study protein-
protein interactions on a molecular level, is to follow the changes in an NMR spectrum
of a protein of known structure. The structures of three domains of cMyBPC have been
determined so far, domain C1 (PDB ID: 2avg) (Ababou et al., 2008), C2 (PDB ID:
1pd6) (Ababou et al., 2007) and the central domain C5 (Idowu et al., 2003) have been
solved by NMR spectroscopy and the X-ray structure of domain C1 has been very
recently deposited and published (PDB ID: 2v6h) (Govada et al., 2008). It is in this
contest that the preset study has been developed.
The aims of the project are:
• To determine the structure of domain cC0 and to study its interaction with the
Regulatory Light Chain (RLC) of myosin.
• To study the interaction that is thought to happen between domains C5 and C8 of
cMyBPC (Moolman-Smook et al., 2002).

64
1.2 Structur determination
1.2.1 NMR spectroscopy
The following section describes the mains steps followed to obtain all the NMR data
needed to determine the three dimensional structure of domain cC0. First is given a
description of the triple- resonance experiments used for the backbone assignment of
the proteins, then the NOE effect and its use in structure determination is described.
NMR spectra contain all the information needed to determine the three-dimensional
structure of a protein in solution. However, none of these information can be used
without a sequence specific resonance assignment that associates NMR signals with
specific atoms in the protein. The experiments that are necessary to record to carry out a
sequence specific assignment need to contain information about all hydrogen, nitrogen
and carbon atoms but, since the naturally abundant isotopes of the latter two nuclei are
either not NMR-active (12C) or have a quadrupole moment that dominates its relaxation
behaviour and prevents its use in most structural work on biological macromolecules
(14N), it is necessary to produce protein samples labelled with 13C and 15N. In such
samples, it is possible to transfer phase coherence between 1H, 15N and 13C by using
one-bond connectivities which are strong and make it possible to overcome the
sensitivity problems caused by the small magnetogyric ratios of 13C and 15N that lead to
low sensitivity detection.

65
N
H
Cα
H
C
O
N
H
Cα
H
C
O
90
11 55
140 90 140
5511
7
Figure 1.18: Heteronuclear coupling constants J (in Hz) between nuclei of a protein backbone. In this picture of shown the diagram of a protein backbone together with the coupling constants characteristic of every bond.
Cβ Cβ
35 35
N
H
Cα
H
C
O
N
H
Cα
H
C
O
90
11 55
140 90 140
5511
7
Figure 1.18: Heteronuclear coupling constants J (in Hz) between nuclei of a protein backbone. In this picture of shown the diagram of a protein backbone together with the coupling constants characteristic of every bond.
N
H
Cα
H
C
O
N
H
Cα
H
C
O
90
11 55
140 90 140
5511
7
Figure 1.18: Heteronuclear coupling constants J (in Hz) between nuclei of a protein backbone. In this picture of shown the diagram of a protein backbone together with the coupling constants characteristic of every bond.
Cβ Cβ
35 35
In these experiments, phase coherence that is generated on protons is transferred to
nitrogen or carbon atoms and then transferred back to protons, as shown in Figure 2.2
The experiments that are necessary to record for a protein sample to be able to solve the
three-dimensional structure are reported in table 2.7; in some of these experiments the
magnetization is transferred through the bonds, while in other experiments, based on the
Nuclear Overhauser Effect (NOE), it is transferred through space.
n° exp Type of exp Assignement Through 1 1H/15N HSQC Backbone Bond 2 1H/13C HSQC Backbone Bond 3 HNCaCb Backbone Bond 4 HN(CO)CaCb Backbone Bond 5 HN(Ca)CO Backbone Bond 6 HNCO Backbone Bond 7 HN(CaCb)HaHb Backbone Bond 8 HN(CaCbCO)HaHb Backbone Bond 9 1H/15N TOCSY-HSQC Sidechain Bond 10 1H/13C HCCH TOCSY Sidechain Bond 11 TROSY Sidechain Bond 12 1H/15N NOESY-HSQC Sidechain Space 13 1H/13C NOESY-HSQC Sidechain Space 14 1H/1H NOESY Sidechain Space 15 1H/1H TOCSY Sidechain Bond
Table 1.3: NMR experiments needed for the structure calculation.

66
The first experiment to be recorded for any new protein is the 1H/15N- HSQC spectrum
(Bodenhausen, 1980). This 2D experiment consists of an H,N chemical shift correlation
map and the number of correlation signals should roughly correspond to the number of
residues present in the protein. Prolines, however, do not give a signal, due the absence
of a free N-H group, while additional signals could be present caused by side-chain NH
groups.
The same kind of experiment can be performed for 1H and 13C correlation (1H/13C-
HSQC). In this case the spectrum will present more peaks as every C-H group present
in the macromolecule will give a signal.
Four triple- resonance experiments have been performed to carry out the sequence-
specific assignment: HNCACB (Wittekind, 1993), HN(CO)CACB (Grzesiek and Bax,
1993; Grzesiek et al., 1992), HNCO (Ikura et al., 1990) and HN(CA)CO. Figure 2.2
shows the magnetization transfers that takes place in these experiments. In HNCACB
the magnetization is transferred through the bonds, from the amide proton, to the Cα
and Cβ atoms of the same and previous residues, while in HN(CO)CACB the
magnetization is forced through the carbonyl and so in the spectrum just two peaks will
be present, the Cα and Cβ of the preceding amino acid. Combining these two
experiments it is therefore possible to identify uniquely the Cα and Cβ nuclei for the
sequential residues.

67
C
N
Cαααα
C
N
O
O
Cββββ
H
Cαααα
C
H
Cββββ
O
R2
H
H
H
H R2
C
N
Cαααα
C
N
O
O
Cββββ
H
Cα
C
H
Cβ
O
R2
H
H
H
H R2
HNCACB (i, i-1) HN(CO)CACB (i-1)
C
N
Cα
C
N
O
O
Cβ
H
Cα
C
H
Cβ
O
R2
H
H
H
H R2
HNCO (i-1)
C
N
Cαααα
C
N
O
O
Cβ
H
Cαααα
C
H
Cβ
O
R2
H
H
H
H R2
HN(CA)CO (i, i-1)
Figure 1.19: Phase coherence transfer between nuclei in triple- resonance NMR experiments. In this diagram is shown how the triple- resonance NMR experiments used to perform the sequence specific assignment work. The phase coherence is represented by the green arrows that show how it flows through the molecules. It is clear from this picture how the experiments on the left give information about two residues, i and i-1, while the two experiments on the right contain the information about the i residues alone. Combining the two experiments on top, HNCACB and HN(CO)CACB, and the two experiments at the bottom, HN(CA)CO and HNCO, it is possible to assign the spectra.
C
N
Cαααα
C
N
O
O
Cββββ
H
Cαααα
C
H
Cββββ
O
R2
H
H
H
H R2
C
N
Cαααα
C
N
O
O
Cββββ
H
Cα
C
H
Cβ
O
R2
H
H
H
H R2
HNCACB (i, i-1) HN(CO)CACB (i-1)
C
N
Cα
C
N
O
O
Cβ
H
Cα
C
H
Cβ
O
R2
H
H
H
H R2
HNCO (i-1)
C
N
Cαααα
C
N
O
O
Cβ
H
Cαααα
C
H
Cβ
O
R2
H
H
H
H R2
HN(CA)CO (i, i-1)
Figure 1.19: Phase coherence transfer between nuclei in triple- resonance NMR experiments. In this diagram is shown how the triple- resonance NMR experiments used to perform the sequence specific assignment work. The phase coherence is represented by the green arrows that show how it flows through the molecules. It is clear from this picture how the experiments on the left give information about two residues, i and i-1, while the two experiments on the right contain the information about the i residues alone. Combining the two experiments on top, HNCACB and HN(CO)CACB, and the two experiments at the bottom, HN(CA)CO and HNCO, it is possible to assign the spectra.
Experiments HNCO and HN(CA)CO work in the same way and give information about
the carbonyls, these are also the only experiments that give us information about the
C=O groups. In HN(CA)CO, magnetization is transferred from the amide proton to the
13C of the carbon alpha, thus involving two coupling constants, 1J(N,H) which is 90Hz,
and 1J(N,CA), which is 11Hz, and give rise to two peaks, one for the same and one for
the preceding residue. On the other hand, NHCO gives rise to one peak corresponding
to the i-1 residue. Again, combining the two experiments it is possible to identify the
signal of each amino acid and, as a consequence, carry out a sequence specific
assignment.

68
To identify the proton chemical shifts, other experiments, like 1H/15N TOCSY-HSQC
(Marion et al., 1989 a; Marion, 1989 b) have been recorded. This experiment yields a
1H/1H TOCSY plane for each 15N chemical shift. An analogue experiment could be
done taking advantage of the Nuclear Overhauser Effect, that is the 1H/15N NOESY-
HSQC (Marion, 1989 b); similarly to the TOCSY corresponding experiment, in this
case a 1H/1H NOESY plane is obtained for each 15N chemical shift, in which the
selected NH proton gives NOE cross- peaks with protons of the same amino acid as
well as protons of residues close in space. Combining 1H/15N TOCSY-HSQC and
1H/15N NOESY-HSQC it is possible to distinguish between cross-peaks generated by
protons in the same residue, that are present in both experiments, and the protons that
are close in space but not in the sequence, that are present only in the 1H/15N NOESY-
HSQC spectrum. The latter experiment is very important as it contains vital information
to determine the structure of the protein.
All the experiments described so far give information about the backbone nuclei; to
perform a side-chain assignment it is necessary to record specific experiments, such as
1H/13C HCCH-TOCSY (Bax, 1990); in this experiment the magnetization of the
aliphatic protons is transferred to their 13C nuclei through the whole aliphatic side-chain.
After a back-transfer, the chemical shift of the aliphatic protons are recorded. The
spectra resulting from this experiment are 1H/1H TOCSY planes edited by the 13C
chemical shift and generated by a TOCSY transfer through the carbon chain.
Once the 1H/13C HCCH TOCSY spectrum has been fully assigned, it is possible to
assign also the 1H/13C NOESY-HSQC which is the spectrum that, together with the
1H/15N NOESY-HSQC, contains all the information for the three-dimensional structure
determination. Ideally it should be possible to obtain one 1H/1H NOESY plane for each
13C chemical shift and, being the experiment based on the Nuclear Overhauser Effect, it
69
shows peaks that are both from sequential amino acid and residues that are close in
space but not necessarily in the sequence. The assignment of the 1H/13C NOESY-HSQC
is now done automatically using software that also carry out the structure calculation.
Additional experiments, such as 1H/1H TOCSY and 1H/1H NOESY have been recorded
in the aromatic region to do the assignment of the aromatic side-chains.
1.2.2 Three dimensional Structure determination with the program
CYANA
This is an iterative process that consists in assignment of all NOEs peaks and
subsequent calculation of a three dimensional structure that will be used in the
following cycle to carry out the new NOE assignment. A CYANA calculation
comprises normally of seven cycles of automatic NOE assignment and subsequent
structure calculation, to obtain a final optimized structure .

70
•Amino acid sequence•Sequence-specific Assignment •NOESY cross peaks•Dihedral angles (TALOS)
NOE assignment
Structure calculation
Evaluation of NOE assignment
NOE assignment
3D structure
Simulated Annealing
Figure 1.20 Iterative process followed by the program CYANA. The program repeats this process of NOE assignment and structure calculation for seven cycles. The structure is used starting from cycle 2 to check the goodness of the NOE assignment of the preceding cycle and to perform a new assignment on the following cycle. The minimization is carried out by simulated annealing in torsion angle dynamics space. Picture adapted from (Guntert, 2003).
•Amino acid sequence•Sequence-specific Assignment •NOESY cross peaks•Dihedral angles (TALOS)
NOE assignment
Structure calculation
Evaluation of NOE assignment
NOE assignment
3D structure
Simulated Annealing
•Amino acid sequence•Sequence-specific Assignment •NOESY cross peaks•Dihedral angles (TALOS)
•Amino acid sequence•Sequence-specific Assignment •NOESY cross peaks•Dihedral angles (TALOS)
NOE assignment
Structure calculation
Evaluation of NOE assignment
NOE assignment
Structure calculation
Evaluation of NOE assignment
NOE assignment
3D structure
Simulated AnnealingSimulated AnnealingSimulated Annealing
Figure 1.20 Iterative process followed by the program CYANA. The program repeats this process of NOE assignment and structure calculation for seven cycles. The structure is used starting from cycle 2 to check the goodness of the NOE assignment of the preceding cycle and to perform a new assignment on the following cycle. The minimization is carried out by simulated annealing in torsion angle dynamics space. Picture adapted from (Guntert, 2003).
In the 3D structure determination of proteins in solution by NMR spectroscopy, the data
containing the conformational information are upper distance constraints derived from
the NOE spectra. It is therefore necessary to assign each cross peak, to identify the pairs
of interacting hydrogen atoms. The NOESY assignment is based on previously
determined chemical shift values that result from the assignment of different spectra, as
discussed in the previous section. Nowadays the assignment of the NOEs is done
automatically by a software, in this work the program CYANA (Guntert et al., 1997)
was used, which contains the CANDID algorithm for automated NOE assignment
(Herrmann et al., 2002).

71
The input data for CANDID comprise amino acid sequence, chemical shift lists from
sequence specific resonance assignment, list of NOESY cross peaks positions and
volumes and, optionally, additional information such as dihedral angles constraints
derived form the program TALOS (Cornilescu et al., 1999).
1.2.2.1 TALOS
H2N
HN
NH
O
O
H3CH
ψψψψ
ϕϕϕϕω
Figure 1.21 ϕϕϕϕ, ψψψψ and ωωωω torsion angles. In this diagram are shown how the torsion angles ϕ, ψ and ω are defined. The program TALOS considers only the angles ϕ and ψ ignoring the torsion angle ω that is nearly flat given its nature of partially double bond.
H2N
HN
NH
O
O
H3CH
ψψψψ
ϕϕϕϕω
Figure 1.21 ϕϕϕϕ, ψψψψ and ωωωω torsion angles. In this diagram are shown how the torsion angles ϕ, ψ and ω are defined. The program TALOS considers only the angles ϕ and ψ ignoring the torsion angle ω that is nearly flat given its nature of partially double bond.
TALOS compares the similarity in amino acid sequence and secondary shifts of the
protein in exam with twenty proteins of known structure. TALOS database, in fact,
contains 13Cα, 13Cβ, 13C’, 1Hα and 15N chemical shifts assignments of these twenty
proteins, together with the backbone torsion angles ϕ and ψ derived from the crystal
structures. When analysing a new protein, TALOS reads the experimental chemical
shifts of the protein and converts them in secondary chemical shifts before entering
them into the database. A graphical interface makes very easy and intuitive the use of
the program, three windows display the output obtained from the comparison of the

72
experimental secondary chemical shift with the database data: in the sequence display
the amino acid sequence of the examined protein is shown with all residues colour-
coded corresponding to a good (green), bad (red) or ambiguous (yellow), standard
deviation bigger than 45°, prediction.
Figure 1.22: Graphical interface of the TALOS output. Three windows are present A) amino acid sequence window where all the residues of the protein in exam are displayed with the prediction for each residue shown in a color-coded fashion that represents the accordance with the torsion angles contained in the database : green (good), red (bad) and yellow (ambiguous); B) prediction display where the values of ϕ and ψ and a calculated similarity factor S(i,j) are compared to those of ten of the proteins present in the database. C) Ramachandran plot display shows the ten ϕ and ψ angles for the ten database proteins as green dots and for the calculated structure of the unknown protein as a blue dot.
A
B
C
A
B
C
The TALOS output for the ϕ and ψ dihedral angles of the centre residue in each three
residue string taken into consideration, consists in the average of the corresponding
angles in the ten strings in the database with the highest degree of similarity. In the first
run, the program classifies only those prediction for which at least 9 out of 10 fall in the
same region of the Ramachandran plot and none of the central residues has a positive
value of ϕ. If a residue has ϕ and ψ that fall outside the region in the Ramachandran plot

73
where all the other nine residues are located, this residue will be excluded form the
calculation of the average and rmsd. In the prediction display of the program are shown
the ten proteins with the most similar torsion angles to the three residue string taken in
exam. At the bottom is shown the calculated average value and the similarity factor.
These results are also shown in the third window, the Ramachandran plot display, where
the ten green dots shown represent the ten protein listed in the prediction window, with
the average values for ϕ and ψ in evidence on the ϕ and ψ axis of the map, respectively,
and the standard deviation is shown as a circle around the point with coordinates ϕ and
ψ. When available, a blue dot shows the structure calculated for the protein under
investigation, this is present only after the first cycle of structure calculation when
TALOS can be revised to improve the final result by checking the accordance between
the experimental values of ϕ and ψ and the same values for the ten proteins in the
database that give the best result. This step is done on the ambiguous residues so that
the amino acids that were depicted in yellow in the first output program window, can be
set manually by the operator as in good accordance with the ϕ and ψ values contained in
the database or discard if in bad accordance.
1.2.2.2 Automated NOE assignment using the CANDID algorithm
A CANDID cycle starts by generating an assignment list that contains the hydrogen
atoms that could contribute to a peak. For each cross peak, these initial assignments are
weighted against filtering criteria, such as agreement between values of chemical shifts
and peak position, self consistency within the entire network of NOEs (network
anchoring) and, if available, the compatibility with the 3D structure calculated in the
preceding cycle. In the first cycle, where a 3D structure is not available, network

74
anchoring has a predominant effect. Initial assignments with low overall score are
discarded.
Figure 1.23 Condition that must be fulfilled by a valid assignments. (a) agreement between chemical shift and peak position; (b) network anchoring; (c) proximity in the preliminary structure. Picture adapted from (Guntert, 2003)
Figure 1.23 Condition that must be fulfilled by a valid assignments. (a) agreement between chemical shift and peak position; (b) network anchoring; (c) proximity in the preliminary structure. Picture adapted from (Guntert, 2003)
For each cross peak, the retained assignments are interpreted as upper distance limits
derived from the cross peak volume; upper distance constraints can be obtained from a
single assigned cross peak or can be ambiguous distance constraints if more than one
assignment is retained by the cross peak. The introduction of ambiguous constraints
revolutionised the automated NOE assignment as, before, just unambiguously assigned
NOEs could be used as distance constraints for the structure calculation. The majority
of NOEs, however, cannot be assigned unambiguously from chemical shift information
alone and this severely limited the application of automated NOE assignment in the
past. When including the ambiguous distance constraints, each NOESY cross peak with
n> 1 possible assignments can be seen as the superimposition of n degenerate signals.

75
• Network anchoring
Any network of distance constraints that is dense enough for the determination of a
protein 3D structure, forms a self-consistent subset of correctly assigned constraints.
Network anchoring evaluates this self-consistency of NOE assignments independently
from the knowledge of the three dimensional structure of the protein in question and can
thus be used in the first cycles of NOE assignments when a 3D structure is not available
to evaluate the goodness of the assignment. The fact that each NOE assignment must be
embedded in the network of all other assignments makes this approach very powerful in
detecting erroneous constraints that are not reinforced by the presence of consistent
NOEs around it.
Network anchoring for two atoms α and β consists in looking for all atoms γ present
either in the same or in the neighbouring residues, that are connected simultaneously to
α and β. The connection might be an assignment or the fact that the structure implies
that the corresponding distance must be short enough to give rise to an observable NOE.
Interestingly, all peaks from the peak list contribute simultaneously to the network
anchored assignment.
• Constraints combination
The presence of artifacts and the misinterpretation of noise signals, could lead to
erroneous structure calculations. This is particularly true at the first cycles of NOE
assignments as a 3D structure based filtering of constraints is not available. Constraints
combination is applied in the first two cycles of CANDID to minimize the impact of the
experimental imperfection of the spectra on the resulting structure at the expense of a
temporarily loss of information.

76
Constraints combination consists in generating distance constraints with combined
assignments from different, unrelated cross peaks. The basic property for ambiguous
constraints is that a constraint will be fulfilled by a correct structure as long as at least
one of its assignments is correct, even if additional, erroneous assignments are
associated with the constraint. This implies that the combined constraints have a lower
probability of being wrong than the corresponding original constraints, provided that
less than half of the original constraints are erroneous.
CANDID provides two methods of constraints combination:
• 2→1 in which two assignments A and B are replaced by a single ambiguous
constraint with assignment BA∪
• 4→4 is a pairwise combination that replaces four assignments A, B, C and D
with four distance constraints BA∪ , CA∪ , DA∪ and CB ∪ .
Since in case of error the effect on the global fold is more pronounced with long range
NOEs, the constraints combination is applied only on these signals and not on short or
medium range NOEs.
In the 2→1 case, the number of long-range constraints is halved, whereas in the 4→4
combination more of the original information are conserved. The latter combination,
moreover, takes into account that some peaks have assignments more reliable than
others, as the four peaks A, B, C and D are used 3, 2, 2 and 1 times respectively, to form
the final combined constraints.

77
Figure 1.24 Constraints combination. The correct, unknown structure (a) is distorted when two constraints are considered independently, whereas a combined constraint will produce a structure more closer to the real situation. Picture adapted from (Guntert, 2003)
Figure 1.24 Constraints combination. The correct, unknown structure (a) is distorted when two constraints are considered independently, whereas a combined constraint will produce a structure more closer to the real situation. Picture adapted from (Guntert, 2003)
1.2.2.3 Structure calculation
In the program CYANA, the calculation of the three dimensional structure of a protein
is a minimization of a target function that measures the agreement between a structure
and its set of constraints. The CYANA target function (Guntert et al., 1997) is defined
such as it is zero if all experimental distance and torsion angle constraints are fulfilled
and all non bounded atom pairs satisfy a check for the absence of steric overlap, a
conformation that satisfies these criteria more closely than another, will lead to a lower
value of the target function.
78
• Torsion angles dynamics
The minimization algorithm in CYANA is based on simulated annealing (Kirkpatrick et
al., 1983) by molecular dynamic simulation in torsion angle space. Torsion angle
dynamics consists in molecular dynamic simulation using torsion angles instead of
Cartesian coordinates as degree of freedom. Compared to the minimization of a target
function, the molecular dynamics simulation comprises also the kinetic energy that
allows overcoming barriers of potential, reducing the probability of encountering a local
minimum.
The only degree of freedom in torsion angle dynamics is the rotation about the covalent
bonds, so that the conformation of the protein is defined by the values of all torsion
angles.
• Simulated Annealing
In solving a protein structure, the potential energy profile is complex and studded with
local minima, it is therefore important to adopt a calculation method that will minimize
the probability of being stuck in one of these local minima. The method of choice is
simulated annealing, a combinatorial optimization method. The concept of simulated
annealing is taken from the crystallisation procedures applied to metals, where a metal
is melted at high temperature (high kinetic energy phase) and then slowly cooled down
in order to minimize the structural defects.
The standard simulated annealing protocol in CYANA starts from a conformation with
all torsion angles treated as independent and consists of five steps. An initial
minimization step, including only constraints between atoms up to three residues apart
along the sequence, is performed to reduce high- energy interaction that could disrupt
the torsion angle dynamics algorithm, and is then followed by the high- temperature

79
phase, a torsion angle dynamics calculation carried out at constant high temperature, so
to ensure of not falling in any local minima. The third step consists in the slow cooling
close to a zero temperature. Up to this point the hydrogen atoms have not been included
in the calculation and are included at this stage of low temperature phase with
individual hydrogen atoms, then a final minimization is carried out, consisting of 1000
conjugate gradient steps.
With torsion angle dynamics it is possible to calculate protein structure on the basis of
NMR data efficiently.
1.2.2.4 Structure validation
Once the structure has been determined, it has to be evaluated to understand how
reliable the result obtained is. Cyana implements six criteria (Guntert, 2003) that allow
to evaluate the goodness of a structure; these criteria are as follow:
1. average target function for cycle 1 below 250 Ǻ
2. average target function for cycle 7 below 10 Ǻ
3. less than 20% unassigned NOEs
4. less than 20% discarded long- range NOEs
5. RMSD for cycle 1 below 3Ǻ
6. RMSD between cycles 1 and 7 below 3Ǻ
Thanks to these criteria it is possible to evaluate a newly determined three dimensional
structure, however this can be done also with the help of different software. An
important one and also the one used in this work is PROCHECK in its version
PROCHECK NMR (Laskowski et al., 1996), that carries out validation of the geometric
quality of the structure determined. Since the information contained in NMR data alone

80
is not enough to determine a molecular structure, it is particularly important to check
NMR structures for geometric abnormalities and errors.
Most of the checks use reference values of the considered geometric parameter to judge
if a structure is normal or not. The validation criteria used to evaluate the goodness of a
structure could be concerning the local geometry, like bond lengths and angles,
chirality, tetrahedral geometry and side chain planarity, or overall quality, evaluated by
the Ramachandran plot, rotameric states, backbone conformation and packing of the
side-chains in the hydrophobic core of the protein, plus additional criteria like inter-
atomic bumps, hydrogen bonds and electrostatics.
The most relevant of the local geometry criteria to be considered are the χ1 and χ2
angles that define the states of the rotamers. Side-chain rotamers have a preferred
staggered conformation with dihedral angles of -60, 60 and 180°; this preference is due
to the difference in energy between the eclipsed conformation, that is characterised by a
more relevant steric interaction and as a consequence has a higher energy, and the
staggered conformation, that is energetically favoured; both states can occur in a
protein, as transitions are possible between the two states. The relative population
between these two states vary with amino acid type, secondary structure elements and
environment. In PROCHECK the χ1- χ2 side chain rotamer distribution is considered
for each amino acid in the sequence and displayed on a graphic where allowed and
disallowed regions are depicted.
A similar kind of evaluation could be done for the backbone dihedral angles ϕ and ψ.
Based on steric consideration, it was shown (Ramachandran et al., 1963) that the
combination of the two angles in a polypeptide chain are restricted to certain ranges,
which can be visualised in the so-called Ramachandran plot. Apart from steric
restrictions, ϕ and ψ show different preferences that depends on residue type and

81
secondary structure elements. The Ramachandran plot is a renowned method to evaluate
the quality of a structure (Hooft et al., 1997) and the most widely used method to do so
is to divide the plot in four regions: favoured, additionally allowed, generously allowed
and disallowed. This is also the method used in the program PROCHECK.
Another important angle to be considered is the torsion angle ω about the peptide bond.
Given its partially double-bond nature, its free rotation is impaired and the peptide bond
is always close to planarity. The angle ω is mostly found in the trans conformation
(180°) but can be found also in the less favoured cis conformation (0°). Most of the cis
peptide bonds involve a proline (Xaa-Pro) but rare cases of cis conformations without
the presence of a proline residue are also known.
Particularly interesting are the non-bonded interactions such as inter-atomic bumps.
These occur when the distance between the centres of two atoms is less then physically
realistic; PROCHECK identifies atoms as being involved in a bad contact if they are
closer in space than 2.6 Å. This is done considering only the non-hydrogen atoms and
those pairs that do not form hydrogen bonds. Hydrogen bonding in fact, plays a very
important role in the stability and overall folding of a polypeptide. The difference in
energy between the folded and unfolded state of a protein is between 5 and 15 kcal mol-
1, while the energy for the formation of a single hydrogen bond is in the order of 2-5
kcal mol-1 (Branden, 1999) so the absence or presence of as little as 1 to 3 hydrogen
bonds can have a profound effect on the protein stability. The packing of the side chains
in the hydrophobic core is another important parameters that can give an idea of the
goodness of a calculated structure, as different type of amino acids display a different
preference for their neighbouring residues and these preference have a strong impact in
determining the global fold of the protein. This is particularly true for aromatic and
hydrophobic residues that should pack against one another in the core of the protein

82
structure. All these aspect together give an idea of how good and reliable a structure
calculated based on NMR data is. The PROCHECK results are all displayed in graphic
form so they are very direct and intuitive (see figures 3.11 and 3.12 p 111- 112).
1.2.3 Protein dynamics
Dynamics play an important role in protein function (Brooks et al., 1988; Jardezky,
1996; McCammon and Harvey, 1987) and NMR sensitivity to motion makes it a
powerful tool for the study of macromolecular dynamics through the phenomenon of
nuclear spin relaxation (Palmer, 1997; Wagner et al., 1993). Some spectral properties, in
fact, can be correlated to intra-molecular motion, so once the NMR peaks of a spectrum,
usually a 1H/15N HSQC spectrum, are assigned it is possible to investigate the properties
of the corresponding nuclei based on their relaxation behaviour.
1.2.3.1 Relaxation
Once a spin has been perturbed, it tends to relax back to its equilibrium state over a
period of time. Every spin has two different kind of relaxation:

83
a)
b)
T1
Mz
t
T2
Mxy
t
Figure 1.25 Relaxation processes. a) T1 relaxation. The perturbed population of the energy states tends to return to the equilibrium Boltzman distribution; the z magnetization returns to its original value exponentially. b) T2 relaxation. The spins that are on thexy plane after the 90° pulse, de-phase so that the net magnetization on the xy plane decreases exponentially to zero.
z
y
x
z
y
x
z
y
x
z
y
x
z
y
x
z
y
x
180° Decay
90° Decay
z
y
x
z
y
x
z
y
x
z
y
x
z
y
x
z
y
x
180° Decay
90° Decay
z
y
x
z
y
x
z
y
x
z
y
x
z
y
x
z
y
x
z
y
x
z
y
x
z
y
x
z
y
x
z
y
x
z
y
x
z
y
x
z
y
x
z
y
x
z
y
x
z
y
x
z
y
x
z
y
x
z
y
x
z
y
x
z
y
x
z
y
x
180°180° DecayDecay
90°90° DecayDecay
• Longitudinal relaxation (T1) is the time necessary for the population of the energy
states to return to the original Boltzman distribution and corresponds to the time
taken by the net z magnetization (Mz) to return exponentially to its starting value +z.
• Transversal relaxation (T2) is the time necessary for the coherence in the xy plane
(Mxy) generated by the 90° pulse, to de-phase decaying exponentially to zero.
Dynamic information is derived by both longitudinal and transverse relaxation rates R1
(1/T1) and R2 (1/T2) and also from the cross-relaxation 1H/15N rates (NOE). For the
evaluation of the dipole cross-relaxation two separate experiments are run, a reference
experiment, corresponding to a 1H/15N HSQC without the initial INEPT step, so the
initial magnetization is localized on 15N nuclei instead of 1H as in the 1H/15N HSQC
experiment. Nevertheless the peaks obtained correspond to the one of the 1H/15N HSQC

84
experiment so the assignment can be transferred between the two. This will have the
function of reference spectrum, while the second experiment is registered with 1H
saturation so to generate a Nuclear Overhauser Effect (heteronuclear NOE). Comparing
the two spectra it is then possible to recognize which residues are more affected by the
NOE and so take part in dynamic phenomena. From these experimental data it is
possible to extract information on the dynamic processes specific for the molecule in
exam.
1.2.3.2 Model free analysis
The dynamic information on fast internal motion that can be extracted from the
NMR experiments are contained in two parameters:
• General order parameter (S): is a measure of the degree of spatial restriction of
the motion; it can assume values between 0 and 1.
• Effective correlation time (τe): is a measure of the rate of the motion.
These two parameters can be defined in a model independent way and are at the core of
the Lipari-Szabo analysis (Lipari and Szabo, 1982a; Lipari and Szabo, 1982b) to obtain
dynamic information from relaxation experiments. The idea of using a model-free
analysis is to avoid the danger of over-interpretation of a limited set of data.
The first step of this analysis is to determine the nature of the overall motion by
determining the correlation time (τc) which corresponds to the average time taken by a
molecule to achieve an orientation of one radian from its starting position due to

85
random motion. The correlation time is linked to the correlation function G(τ) that is a
way of characterizing the time dependence of the random internal motion; performing a
Fourier transformation on G(τ) that is a function of time, a function of frequency is
obtained, exactly in the same way the time dependent FID is transformed in a frequency
dependent spectrum. This frequency dependent quantity is the spectral density J(ω) and
tells us how much motion is present at a particular Larmor frequency.
Assuming the molecule subject to an isotropic motion, τc can be extracted directly from
the relaxation data for nuclei rigidly attached to the macromolecule. Once this is fixed,
it is possible to extract the information on the internal motion, determining the spectral
density J(ω) that is linked to the three observable NMR relaxation parameter:
( ) ( ) ( )[ ]NHN JcJJd
R ωωβω 21
2
1 734
++
=
( ) ( ) ( )[ ] ( ) ( )[ ]NHN JJc
JJJd
R ωωβω 3046
133048
2
2
2
2 ++++
=
( )HJd
NOE ωβ3
2
54
=
where 6
222
NH
HN
rd
γγh= is the sipolar relaxation contribution and β1= 0.921 β2= 0.955 β3=
0.87 for 15N.
The spectral density J(ω) can be described in terms of S2 and τe without considering a
specific model for internal motion; these two quantities, in fact, are treated in the Lipari-
Szabo approach, as adjustable parameters; S2 and τe, in fact, uniquely determine T1, T2
and NOE via the spectral density, so S2 and τe are varied in such a way to minimize the

86
sum of the squared differences between the theoretical and experimental values. Five
models have been used in this work to describe the molecular motion:
Model Spectral density function Parameters 1
( )
+= 2
2
15
2)(
c
cSJ
ωττω
S2
2
( )
+= 2
2
15
2)(
c
cSJ
ωττω
R2,ex= R2+Rex
S2, R2,ex
3
( )( )
+−+
+= 2
2
2
2
)(1
1
15
2)(
ωττ
ωττω SS
Jc
c S2, τe
ec τττ111 +=
4
( )( )
+−+
+= 2
2
2
2
)(1
1
15
2)(
ωττ
ωττω SS
Jc
c
R2,ex= R2+Rex
S2, τe, R2,ex
ec τττ111 +=
5
( )( )
+−+
+= 2
2
2
22
)(1
1
15
2)(
ωττ
ωττ
ω s
c
csf
SJ ss
S2, S2s, τe,
ec τττ111 +=
Table.1.4: spectral density function used in the numerical fit to the experimental T1, T2 and NOE values. S2 is the generalised order parameter, S2
s Is the order parameter for slow internal motions; Rex is the function of the chemical shift evaluated as an exchange term; τc is the rotational correlation time of the molecule; τe is the effective correlation time of the internal motion. S2
f is the order parameter for fast internal motion. Note that S2=S2
fS2s. Rex is given as an additional term in the transverse relaxation time.
Model 1 is the simplified Lipari- Szabo model which assumes that only very fast
internal motions take place, such as thermal vibrations. Model 2 takes into account also
relaxation phenomena that might happen in the molecule, with the result of a relaxation
faster than expected; in this case R2,ex is the experimental result and R2 the calculated
transverse relaxation rate, from these it is possible to obtain Rex that gives an estimation
of the exchange rate that the molecule undergoes. Model 3 and 4 correspond to the
complete Lipari- Szabo model, with model 4 taking into account exchange phenomena,
similarly to what happens in model 2, and model 5 is the extended form of the Lipari-
Szabo equation (Clore et al., 1990) used when fast (τf) and slow (τs) correlation times

87
differ by at least one order of magnitude and it is then necessary to consider the two
motions separately and, as a consequence, two values for Ss and Sf should be taken into
account on calculating the spectral density.
For every residue present in the analyzed protein, the spectral density is calculated by
the five models shown above; for each residue is then chosen the model that gives the
best fit between calculated and experimental values. The way a model is chosen over
another is by evaluating the error using F-test and P values; if increasing the number of
parameters used, that is using a more complex model, the error does not diminish
significantly, it is not worth using such a model; for this reason the most used model is
normally model number 1.

88
Chapter 2
Materials and Methods
2.1 DNA Methods
2.1.1 PCR
The Polymerase Chain Reaction (PCR) was used to clone the DNA fragments coding
for different domains of cMyBPC in vectors of the pET family. The majority of the
cloning has been carried out in collaboration with Dr Elena Rostkova (King’s College,
London); the fragments coding for the domains of cMyBPC have been cloned in a
modified version of vector pET-8C.
For certain domains it was necessary to repeat the procedure to clone the DNA coding
fragments in different vectors, essentially to increase the protein solubility by producing
a fusion protein with either Thioredoxin (pETM-20) (LaVallie et al., 1993) or NusA
(pETM-60) (De Marco et al., 2004).
To do this, primers have been designed to be compatible with the chosen vector and to
contain appropriate restriction sites in order to be able to digest the amplified DNA
fragments with NcoI and BamH1 restriction enzymes and, subsequently, to ligate the
fragments in the desired vector.
For the PCR the PfX DNA Polymerase (form Invitrogen) was used with the reaction
conditions are reported in table 2.1.

89
Volume Final concentration 10X Amplification Buffer 5 µl 1X PCRx Enhancer Solution 5 µl 1X
10mM dNTP mix 1.5 µl 0.3 mM each 50 mM MgSO4 1 µl 1 mM
Primers mix (10 µM each) 2 µl 0.3 µM each Template DNA 2 µl 100ng
Pfx DNA Polymerase 1 µl 2.5 units H2O 32.5 µl
Table 2.1: PCR conditions
The general cycle used for the PCR are reported in table 2.2
Temperature Time Cycles 94°C 2 min 1 94°C 15 sec
50-60 °C 30 sec 68°C 30 sec
30
72°C 12 minutes 1 4°C Until the end 1
Table.2.2: PCR cycles
For best results, the PCR products were purified using QIAGEN QIAquick PCR
purification kit before proceeding with the restriction digestion with BamH1 and NcoI
(both from Roche).
The restriction reaction was carried out using the following quantities:
Plasmid 1 ng 10x Buffer B 5 µl BamH1 1 µl (10 units) Nco1 1 µl (10 units) dH2O 3 µl
Table 2.3: restriction digestion reaction
The reaction has been incubated for 2 h 30 min at 37°C. Buffer B was chosen as it gave
the maximum activity (100%) to BamH1 and high activity (50-75%) to Nco1, while
buffer H would have given a maximum activity (100%) to Nco1 but a low activity (25-
50%) to BamH1, so the choice was the best compromise to be able to carry out a double
digestion using the two enzymes together.

90
The products were then purified by gel extraction using the QUIAGEN QIAquick gel
extraction kit.
2.1.2 Ligation
The restriction endonuclease digested fragments were gel purified from a 1% agrose gel
using QIAagen Gel Extraction Kit. The resultant vector and fragment were ligated using
T4 DNA ligase (from Roche):
Control (µl) Ratio 1:1 (µl) Ratio 1:3 (µl) Plasmid 2 2 2 DNA fragment - 2 6 1x DNA diltion buffer 1 6 2 T4 DNA ligation buffer 10 10 10 Ligase 1 U/ µl 1 1 1
Table 2.4: Ligation reaction conditions
The reaction has been incubated at room temperature for 30 minutes and the product
transformed into competent DH5α cells.
2.1.3 Competent cells transformation
The competent cells were thawed for 1 hour on ice before inoculating with 2 µl of the
vector containing the desired cDNA fragment.
After leaving the cells on ice for 30 minutes, they were heated at 42°C for 30-45
seconds, and then 250 µl of SOC medium (from Invitrogen) were added. After
incubation at 37°C for 60 minutes, a 50 µl aliquot of transformed cells was plated out
on LB- Agar plates containing appropriate antibiotic, while the remaining 200 µl of

91
cells were spun down at 13000 rpm for 1 minute, the pellet resuspend in 50 µl of
autoclaved water and plated out on LB- Agar plates containing appropriate antibiotic.
2.1.4 PCR screening
After incubating overnight, a PCR screen was performed on the colonies grown on the
plate. Each colony was resuspended in 50 µl of H2O and then a PCR reaction was
performed.
DNA template 10 µl Primers mix 1 µl dH2O 1.5 µl Red taq (from Sigma) 12.5 µl
Table 2.5: PCR screening reaction
The PCR reaction was performed as follows:
Temperacture Time Cycles 94°C 5 min 1 94°C 30 sec 60 °C 30 sec 72°C 30 sec
30
72°C 8 minutes 1 4°C Until the end 1
Table 2.6: PCR screening cycles
Of the colonies that resulted positive at the PCR screening was performed either a mini
prep (High Pure Plasmid Isolation Kit from Roche) form a 50 µl culture or a midi prep
(S.N.A.P. midi from Invitrogen) for a 50 ml colture, to produce enough DNA to be
checked by DNA sequencing and to be used in the following procedures.All DNA
samples were sequenced by the Protein Nucleic Acid Chemistry Laboratory (PNACL)
at the University of Leicester.

92
2.2. Protein Expression and Purification
2.2.1. Competent cells Transformation for protein expression
The competent cells were thawed for 1 hour on ice before inoculating with 2 µl of the
vector containing the desired cDNA fragment.
After leaving the cells on ice for 30 minutes, they were heated at 42°C for 30-45
seconds, and then 250 µl of SOC medium (from Invitrogen) were added. After
incubation at 37°C for 60 minutes, the transformed cells were plated out in 20 and 50 µl
aliquots of culture, on LB- Agar plates containing appropriate antibiotic.
2.2.2 Expression in Luria- Bertani (LB) medium
The transformed E. Coli cells were grown in 5 ml LB cultures containing appropriate
antibiotic during the day (8 hours) and then grown in 200 ml LB cultures overnight. In
the morning, 4L of LB medium with antibiotic, were inoculated with 20 ml culture each.
All the cultures were grown at 37°C while shaking (200 rpm), if not specified
otherwise. Protein expression has been induced in the late- log phase, A600nm between
0.7 and 1, with 0.75 mM IPTG (Isopropyl β-D-1.thiogalactopyranoside) (form Sigma).
Four hours after induction, the cultures have been harvested spinning down for 15
minutes at 6000 rpm (9782 g) in Sorvall rotor SLC-6000 at 4°C. the pellets were kept at
–20°C until needed for purification.
93
2.2.3 Expression in Minimal medium M9
Minimal medium has been used to obtain 15N or 15N/ 13C labelled protein. The same
procedure for protein expression in LB was repeated as described in the section above,
until reaching an OD of 0.8, then the culture has been spun down at 5000 rpm (9782 x
g)for 8 minutes in a Sorvall rotor SLC-6000. After centrifugation the pellet has been re-
suspended in 1X M9 salts and then spun down again for 8 minutes at 5000 rpm. The
pellet has been re-suspended in 50 ml minimal medium (M9), containing 15NH4Cl to
15N labelled protein or 15NH4Cl and 13C glucose to doubly label the protein, and then
transfered in the M9 medium and left in the shaker at 37°C for 1hour before inducing
protein expression with 1 ml IPTG 0.75M (Isopropyl β-D-1.thiogalactopyranoside)
(form Melford). After 4 hours induction the cells have been harvested spinning down
for 15 minutes at 6000 rpm and kept at –20°C until needed for the purification.
2.2.4 Protein Purification
The pellet obtained from 4L of LB colture has been re-suspended in 10 ml FF6 wash
buffer, sonicated for 2 minutes (20 sec on, 20 sec off, 10 amplitude) and spun down
again for 90 minutes at18000 rpm (59768 x g).
Running a SDS PAGE ( Sodium DodecylSulphate PolyAcrylamide Gel Electrophoresis)
it was possible to determine if the protein expressed in the conditions reported above is
soluble, being present in the supernatant.
In case of soluble protein, the supernatant has been kept and purified by Immobilized
Metal ion Affinity Chromatography (IMAC) using Ni Sepharose 6 Fast Flow columns

94
(form Amersham), due to the presence of the hexa- histidine tag. The resin contained in
each column consists of 90 µm beads of agarose with a coupled chelating group, which
has been charged with Ni2+ ions. The columns were packed using 4 ml of re-suspended
resin, corresponding to 2 ml of resin in each column. The protein, once loaded on the
columns, was washed with 40 ml of FF6 buffer and finally eluted with 8 ml of FF6
elution buffer, containing 500 mM Imidazole (form buffer composiotion see appendix
A.1 p. 198).
Further purification was achieved using Size Exclusion Chromatography on a Superdex
75 HiLoad 16/60 pre-packed column, or by Immobilized Metal ion Affinity
Chromatography (IMAC) following digestion with Tev protease.
Size Exclusion Chromatography is based on the fact that the stationary phase is formed
by a surface, that can be made of silica or a polymer, that presents pores of different
size. The sample that has to be purified is injected in the column and the different
components will travel through the column at different rates, according to their size:
bigger molecules, that cannot permeate the resin entering the small diameter pores, will
travel through the column faster than the small components that are able to enter the
pores and then following a longer root through the column before being elute.
Molecules with dimensions bigger than the average pore size will not be retained and
will be excluded; on the other hand, molecules that are sensibly smaller than the pores
can be retained for a long time and they will be the last to be eluted. Between the two
extremes there are the molecules with an intermediate size that travel through the
column according to their molecular weight. Another factor that can influence the
retention time of a molecule is its shape, as molecules with a bigger steric hindrance
will travel faster through the column at equal molecular weight. An important aspect of
this technique is the absence of physical- chemical interaction between the sample

95
components and the stationary phase, as happens in all other liquid chromatography
techniques. Two types of size exclusion chromatography exist, one, called gel-
filtration, uses hydrophilic substrates in the columns, the other, known as gel
permeation, based on hydrophobic substrates. In this work only gel filtration was used
as all the samples were present in aqueous solution.
All the plasmid used in this research, except pET-8C, have a TEV protease recognition
site that allow to cut away the hexa- histidine tag at the N-terminus of the expressed
protein. In some cases the chromatography step showed difficult and it was preferred to
repeat the IMAC purification after digestion with TEV protease. In this second step of
Metal Ion Affinity Chromatography the protein of interest will not be retained by the
column and will flow through, while the hexa- histidine tag will be chelated by the resin
and will not pass through the column. At the end of this step the protein is obtained in
its pure form.
To run the NMR experiments, all the proteins were dialysed against NMR buffer using
either dialysis membranes (Spectra/ Pro Dyalisis membranes MWCO: 3500) or
cassettes (PIERCE Slide-A-Lyzer Dyalisis Cassettes MWCO: 3500, 3-12 ml) . Usually
three steps of dialysis were performed using 1L of NMR buffer each (see appendix A.1
for buffer composition). Finally, the proteins were concentrated by centrifugation
(concentrators: Viva Spin MWCO:3000, 20 ml or Amicon Centriprep MWCO: 3000, 15
ml). the protein concentration was checked measuring the absorbance of the protein
solution at 280 nm and then calculating the concentration according to the Beer-
Lambert law.
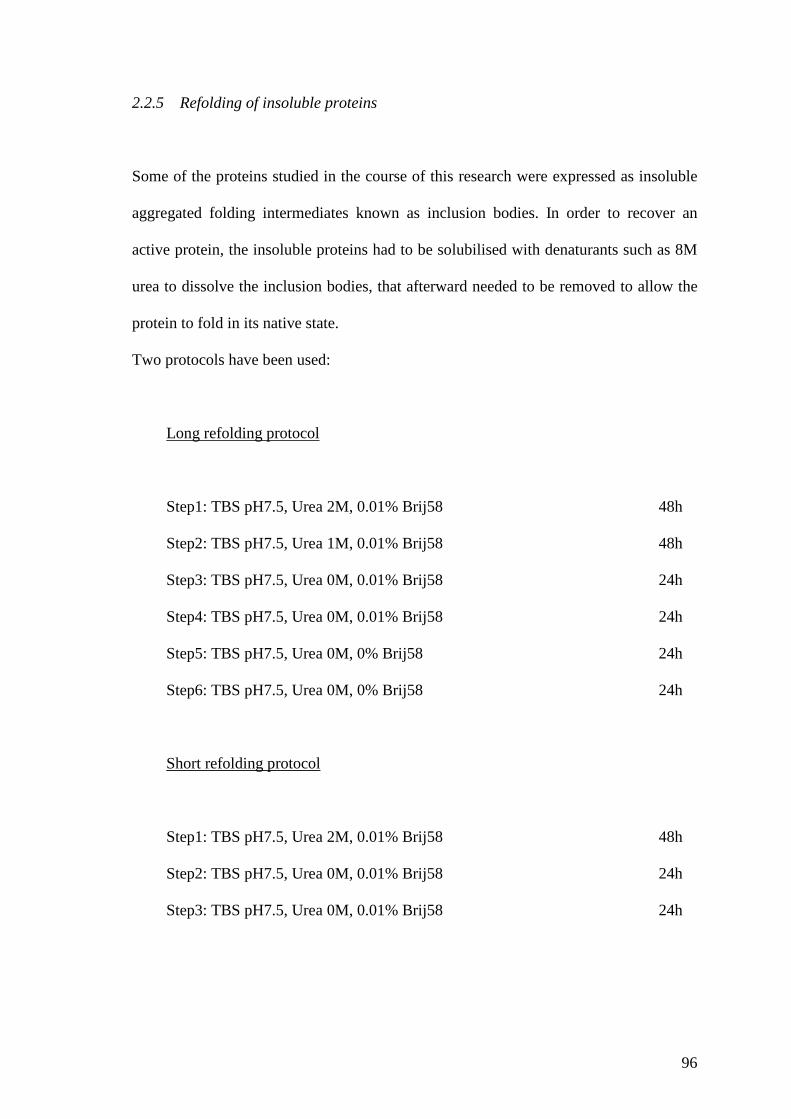
96
2.2.5 Refolding of insoluble proteins
Some of the proteins studied in the course of this research were expressed as insoluble
aggregated folding intermediates known as inclusion bodies. In order to recover an
active protein, the insoluble proteins had to be solubilised with denaturants such as 8M
urea to dissolve the inclusion bodies, that afterward needed to be removed to allow the
protein to fold in its native state.
Two protocols have been used:
Long refolding protocol
Step1: TBS pH7.5, Urea 2M, 0.01% Brij58 48h
Step2: TBS pH7.5, Urea 1M, 0.01% Brij58 48h
Step3: TBS pH7.5, Urea 0M, 0.01% Brij58 24h
Step4: TBS pH7.5, Urea 0M, 0.01% Brij58 24h
Step5: TBS pH7.5, Urea 0M, 0% Brij58 24h
Step6: TBS pH7.5, Urea 0M, 0% Brij58 24h
Short refolding protocol
Step1: TBS pH7.5, Urea 2M, 0.01% Brij58 48h
Step2: TBS pH7.5, Urea 0M, 0.01% Brij58 24h
Step3: TBS pH7.5, Urea 0M, 0.01% Brij58 24h

97
Every one of these steps was performed using 1L of each buffer and in a cold room at
4°C, using dialysis membranes (Spectra/ Pro Dialysis membranes MWCO: 3500).
The problem arising from this procedure is the fact that many conditions, such as buffer
composition, protein concentration, temperature, just to mention the most common,
have to be optimized for each specific protein. And even for optimized refolding
processes, the yield of re-natured protein may be limited.
2.3 Actin binding assay by cosedimentation
All proteins studied in the course of this research being muscle proteins, it was
necessary to perform on some of them an actin binding assay to determine whether or
not they interacted with the second main constituent of muscle fibres. The purified actin
for the assay was donated by Dr El-Mezgueldi’s group.
To perform the assay, 50 µl aliquots of the two proteins at a concentration of 50 µM
were used. The assay consists in mixing the two proteins together at room temperature
incubating for 10 minutes and then spinning down the samples at 8500 rpm (436159 x
g)for 30 minutes at 4°C in a Beckman Optima TLX centrifuge. The supernatant was
then freeze dried and re-suspended in SDS-PAGE buffer, while the pellet was washed
with actin binding assay buffer and then re-suspended in SDS-PAGE buffer. Different
samples were used, some containing the mixture of actin and protein of interests, and
some controls. The result of the assay consists in establishing, though SDS-PAGE
analysis, whether the protein precipitates together with actin as a consequence of the
ultracentrifugation or stays in the supernatant. An essential condition for this assay to
work is that the protein should not precipitate in the pellet during ultracentrifugation in
absence of actin.

98
1 2 3 4 5
Actin - - 159 µl 159 µl 159 µl
cC0 333 µl - - 333 µl -
MS1 - 134 µl - - 134 µl
Buffer 667 µl 866 µl 841 µl 508 µl 707 µl
Table 2.7 Sample composition of the solutions used in the Actin Binding cosedimentation assay
2.2 NMR spectroscopy
All NMR spectra were obtained running the corresponding experiments on 600 MHz,
with or without cryoprobe, or 800 MHz with cryoprobe Brucker spectrometers. All
experiments were carried out at 30°C for domain cC0 and 25°C for domain cC8. The
pulse sequences used were the ones implemented by NMR centre manager.

99
Chapter 3
Solution structure of domain C0 of cardiac Myosin Binding Protein C
(cMyBPC) and characterisation of its interaction with the Regulatory
Light Chain (RLC) of Myosin
3.1 Results
In order to understand the function of domain cC0, the only unique domain of the
cardiac isoform of MyBPC, its structure was determined and a study of the interaction
between cC0 and its probable binding partner, the Regulatory Light chain of Myosin,
was performed. The results obtained are reported in this chapter.
3.1.1 Protein Expression and Purification
3.1.1.1 cC0
DNA sequences coding for human cardiac cC0 and RLC have been cloned in vectors
pET-8C and pLEICS-1 respectively. Both vectors were inoculated in E. Coli host cells:
in BL21(DE3) STAR (from Invitrogen) were used for both proteins, while RLC was
also expressed in Arctic Express (from Stratagene) with comparable results. The
regulatory light chain was expressed in LB to produce unlabelled samples, while cC0
was expressed in M9 medium, enriched with either 15N to produce singly labelled
samples or 15N and 13C to produce the doubly labelled samples, necessary for triple
resonance experiments, and in LB to produce the unlabelled sample used for the
assignment of the aromatic side chains. Due to the presence of a hexa- histidine tag at

100
the N-terminus, both proteins were purified by Immobilized Metal ion affinity
chromatography (IMAC) and then either by gel filtration (cC0) or by cleavage using
TEV protease and repeating the metal affinity chromatography step (RLC).
Figure 3.1 Purification of cC0. 1a) Purification of domain cC0 by Immobilized Metal ion Affinity Chromatography (IMAC). In lane 1 of the SDS-PAGE gel is visible the marker and in lane 2 a stock of cC0 obtained by Ni- column purification; 2) Chromatogram resulting from Size exclusion chromatography. cC0 is present in fractions A9, A10, A11 and A12, these four fractions have checked on a SDS-PAGE, as shown in picture 1b), and then been pooled together.
2)
1)
36.531.0
21.5
14.4
6.0
3.52.5
cC0 11kDa
MWkDa
1 2 3 4 5 6
36.531.0
21.5
14.4
6.0
3.52.5
7
a) b)
c C0 2001:10_U V1_280nm c C 0 2001 :10_F rac tions cC 0 2001 :10_ Inject
-5.0
0.0
5.0
10 .0
15 .0
20 .0
25 .0
30 .0
35 .0
m A U
0 20 40 60 80 100 ml
F2 A 1 A 2 A 3 A 4 A 5 A 6 A 7 A8 A9 A 10 A 11 A 12 B 12 B 11 B 10 B 9 B 8-5
0
5
10
15
20
25
30
35
0 4020 60 80 100 ml
mAU
cC0 was expressed in both LB and M9 media giving good yields, 23 mg/l and 19 mg/l
respectively.

101
3.1.1.2 Regulatory Light Chain
The original construct intended for the study of the interaction with domain cC0 was
that of a complex formed by the Regulatory Light Chain (RLC) and its binding site on
myosin (MyBS) that is located between residues 808 and 842. Expression and
purification of this complex proved very difficult and so, after various failed attempt to
produce enough protein to perform a titration, it was decided to use the RLC alone,
despite the fact that its stability in absence of the MyBS seems to be limited. In fact the
α- helical content of the protein when not bound to myosin is as low as 18% as shown
by the result obtained by CD spectroscopy (Szczesna et al., 2001).
6.0
14.4
21.5
31.5
36.5
55.4
1 2 3 4
Figure 3.2 HtTRLC after TEV digestion and purification with IMAC on Ni 2+ columns. In lane 1 is shown the marker. In lanes 2 and 3 the HtTRLC before digestion and in lane 4 the HtTRLC after digestion with TEV protease and IMAC purification. This sample was used to perform the studies on the interaction between this protein and domain cC0.
6.0
14.4
21.5
31.5
36.5
55.4
1 2 3 4
6.0
14.4
21.5
31.5
36.5
55.4
1 2 3 4
Figure 3.2 HtTRLC after TEV digestion and purification with IMAC on Ni 2+ columns. In lane 1 is shown the marker. In lanes 2 and 3 the HtTRLC before digestion and in lane 4 the HtTRLC after digestion with TEV protease and IMAC purification. This sample was used to perform the studies on the interaction between this protein and domain cC0.

102
The expression of the Regulatory Light Chain (RLC) in pET-8C in BL21Star (DE3)
competent cells was not satisfactory, so the gene coding for this protein was re-cloned in
vector pLEICS1 and expressed in both BL21Star (DE3) (from Invitrogen) and Arctic
Express RIL (from Stratagene) giving good results. The RLC was purified by
Immobilized Metal Affinity Chromatography after digestion with standard uncalibrated
stock of TEV protease obtained from the PROTEX laboratory at the University of
Leicester, as described in the Material and Methods section. The protein was expressed
giving a yield of 7mg/l.
3.1.2 NMR spectroscopy
Different samples were made to perform the NMR experiments:
• [13C/ 15N cC0]= 1.4 mM
• [15N cC0]= 670 µM
• [cC0Ar]= 1.7 mM
The first, doubly labelled sample was used to record the triple resonance experiments,
HNCaCb, HN(CO)CaCb, HN(Ca)CO, HNCO, HN(CaCb)HaHb, HN(CaCbCO)HaHb
and the 13C specific experiments such as 1H/13C HSQC, 1H/13C HCCH TOCSY and
1H/13C NOESY-HSQC; while from the 15N enriched sample were obtained 1H/15N
HSQC, 1H/15N TOCSY-HSQC and 1H/15N NOESY-HSQC. An unlabelled sample was
used to record the spectra relative to the aromatic side chains 1H/1H TOCSY, 1H/1H
NOESY. The NMR samples were concentrated down and transferred to a clean NMR
tube. The 13C/ 15N cC0 and cC0Ar samples were frozen and lyophilized overnight to
eliminate the water and then re-suspended in high purity D2O (from Sigma). All the 15N
spectra, recorded using the 15N cC0 sample, were, on the other hand, recorded in H2O
with addition of 5% of D2O to allow locking the machine and water suppression.

103
Fig
ure
3.3
1 H/15
N H
SQ
C s
pect
rum
of
dom
ain
cC0.
Th
e as
sign
men
t fo
r e
ach
ba
ckb
one
am
ide
pe
ak i
s in
dica
ted
by
resi
due
ty
pe
and
num
ber
. It
was
po
ssib
le t
o as
sign
th
e m
ajo
rity
of
the
pe
aks
pres
ent
in t
he s
pect
rum
. A
t th
e t
op
righ
t o
f th
e s
pect
rum
ar
e e
vid
ent
the
NH 2gr
oups
of t
he G
luta
min
e an
d A
spar
agi
ne
sid
ech
ains
. Pic
ture
gen
era
ted
with
CC
PN
MR
Ana
lysi
s.
F2
1 H (
ppm
)
W41N
e1
V67
A30
T67
W41
H63
L65
E59
K92
A82
K38
F102
I94
A21
E19
K6
K88
L56
E95
I81 V
87
Y78
D47
K14
I48
A57
V93
R68
A50
R99
A22
E100
A26
I91
E29
V20
V39
27V
E101
K13
R62
S49
V8
Q75
V70
S46
T98
S97
S77
F11D74
G83
G78
G98
G4
E33
S24
R16
F89
R43
S85
T58
D90
S12
V80
A79
V18
T61
9S
S17
A73
R34
G38
G55
G23
G71
T32
S51 Q42
T64
G60
Y54
V37
F115N (ppm)
F28
A35
K86
A10
K53
E69
K5
E31

104
Gln
75G
ly76
Se
r77
Tyr
78A
la79
Fig
ure
3.4
15N
str
ips
from
the
HN
CaC
ban
d H
N(C
O)C
aCb
spec
tra
of d
omai
n cC
0 ill
ustr
atin
g th
e se
quen
tial
conn
ectio
ns
betw
een
resi
dues
. On
the
x a
xis
are
repo
rted
th
e 1
3 C c
hem
ical
shi
fts,
on t
he
y a
xis
are
the
1 H c
oord
inat
es,
whi
le t
he
15N
dim
ensi
on
is s
how
n b
y th
e nu
mbe
r on
th
e le
ft c
orne
r o
f ev
ery
stri
p. T
he t
wo
spe
ctra
are
sup
erim
pose
d; H
NC
aCb
peak
s ar
e or
ange
(Cα)
and
pu
rple
(Cβ
) w
hile
th
e p
eak
s of
th
e H
N(C
O)C
aCb
spec
trum
are
gre
en.
Th
e d
oub
le p
eak
s (o
ran
ge/
pur
pean
d gr
een
) ar
e g
ive
n b
y th
e
prec
edin
g re
sidu
e, w
her
eas
sin
gle
pea
ks a
re c
har
act
eris
tic o
f th
e re
sidu
e in
exa
m.
Fro
m t
he c
ombi
na
tion
of it
was
pos
sibl
e to
iden
tify
the
con
ne
ctiv
ity b
etw
ee
n re
sidu
es a
nd c
arry
out
the
seq
uen
ce s
peci
fic a
ssig
nmen
t. P
ictu
re g
ene
rate
d w
ith
th
e p
rogr
am C
CP
NM
R
An
alys
is.
Gln
75G
ly76
Se
r77
Tyr
78A
la79
Gln
75G
ly76
Se
r77
Tyr
78A
la79
Fig
ure
3.4
15N
str
ips
from
the
HN
CaC
ban
d H
N(C
O)C
aCb
spec
tra
of d
omai
n cC
0 ill
ustr
atin
g th
e se
quen
tial
conn
ectio
ns
betw
een
resi
dues
. On
the
x a
xis
are
repo
rted
th
e 1
3 C c
hem
ical
shi
fts,
on t
he
y a
xis
are
the
1 H c
oord
inat
es,
whi
le t
he
15N
dim
ensi
on
is s
how
n b
y th
e nu
mbe
r on
th
e le
ft c
orne
r o
f ev
ery
stri
p. T
he t
wo
spe
ctra
are
sup
erim
pose
d; H
NC
aCb
peak
s ar
e or
ange
(Cα)
and
pu
rple
(Cβ
) w
hile
th
e p
eak
s of
th
e H
N(C
O)C
aCb
spec
trum
are
gre
en.
Th
e d
oub
le p
eak
s (o
ran
ge/
pur
pean
d gr
een
) ar
e g
ive
n b
y th
e
prec
edin
g re
sidu
e, w
her
eas
sin
gle
pea
ks a
re c
har
act
eris
tic o
f th
e re
sidu
e in
exa
m.
Fro
m t
he c
ombi
na
tion
of it
was
pos
sibl
e to
iden
tify
the
con
ne
ctiv
ity b
etw
ee
n re
sidu
es a
nd c
arry
out
the
seq
uen
ce s
peci
fic a
ssig
nmen
t. P
ictu
re g
ene
rate
d w
ith
th
e p
rogr
am C
CP
NM
R
An
alys
is.

105
Gln
75
Gly
76
Ser
77
Tyr
78
Ala
79
Fig
ure
3.5
1 H/1 H
/15N
TO
CS
Y a
nd N
OE
SY
spe
ctra
of
dom
ain
cC0.
Thi
s is
an
exa
mp
le o
f h
ow
th
e a
ssig
nm
ent
wa
s ca
rrie
d o
ut
on
th
e 3
D 15 N
sp
ect
ra.
On
th
e x
and
y a
xis
are
rep
orte
d t
he
1 H c
oord
ina
tes,
whi
le t
he 15
N d
imen
sio
n is
sh
own
by
the
num
ber
on
the
left
co
rner
of
ever
y st
rip.
All
the
stri
ps a
re c
ente
red
on
th
e a
mid
e p
roto
n (r
ed li
nes
) a
nd
nucl
ei H
a (
blu
e)
and
Hb
(pu
rple
) a
re s
how
n in
e
very
str
ip,
exc
ept
for
G7
6 t
hat
has
two
Ha
and
no
Hb
nucl
ei.
Fro
m t
he
co
mbi
natio
n o
f 1 H
/1 H/1
5 N T
OC
SY
HS
QC
(p
ink)
an
d
1 H/1 H
/15 N
NO
ES
Y H
SQ
C (
gre
en)
it w
as
po
ssib
le t
o id
entif
y th
e c
onn
ect
ivity
be
twee
n r
esid
ue
s a
nd c
arr
y ou
t th
e s
equ
ence
sp
eci
fic
ass
ign
me
nt . P
ictu
re g
en
erat
ed w
ith t
he
pro
gra
m C
CP
NM
R A
naly
sis.
Gln
75
Gly
76
Ser
77
Tyr
78
Ala
79
Gln
75
Gly
76
Ser
77
Tyr
78
Ala
79
Fig
ure
3.5
1 H/1 H
/15N
TO
CS
Y a
nd N
OE
SY
spe
ctra
of
dom
ain
cC0.
Thi
s is
an
exa
mp
le o
f h
ow
th
e a
ssig
nm
ent
wa
s ca
rrie
d o
ut
on
th
e 3
D 15 N
sp
ect
ra.
On
th
e x
and
y a
xis
are
rep
orte
d t
he
1 H c
oord
ina
tes,
whi
le t
he 15
N d
imen
sio
n is
sh
own
by
the
num
ber
on
the
left
co
rner
of
ever
y st
rip.
All
the
stri
ps a
re c
ente
red
on
th
e a
mid
e p
roto
n (r
ed li
nes
) a
nd
nucl
ei H
a (
blu
e)
and
Hb
(pu
rple
) a
re s
how
n in
e
very
str
ip,
exc
ept
for
G7
6 t
hat
has
two
Ha
and
no
Hb
nucl
ei.
Fro
m t
he
co
mbi
natio
n o
f 1 H
/1 H/1
5 N T
OC
SY
HS
QC
(p
ink)
an
d
1 H/1 H
/15 N
NO
ES
Y H
SQ
C (
gre
en)
it w
as
po
ssib
le t
o id
entif
y th
e c
onn
ect
ivity
be
twee
n r
esid
ue
s a
nd c
arr
y ou
t th
e s
equ
ence
sp
eci
fic
ass
ign
me
nt . P
ictu
re g
en
erat
ed w
ith t
he
pro
gra
m C
CP
NM
R A
naly
sis.

106
Fig
ure
3.6
HC
CH
-TO
CS
Y H
SQ
C a
nd
1 H/1 H
/13C
NO
ES
Y H
SQ
C s
pect
ra o
f res
idue
Gln
75 o
f do
mai
n c
C0. T
his
is a
n e
xam
ple
of
how
the
ass
ign
me
nt w
as
carr
ied
out
on
the
3D
13
C s
pec
tra
. O
n t
he
x a
nd
y a
xis
are
re
por
ted
the
1 H
co
ord
ina
tes,
whi
le t
he
13
C
dim
en
sion
is
sho
wn
by
the
num
ber
on
the
left
cor
ner
of
ever
y st
rip.
Th
e st
rip
s a
re c
ent
ere
d o
n a
tom
th
at
give
s th
e p
eaks
on
the
di
ago
nal
Ha
(re
d),
Hb
(blu
e) a
nd
Hg
(pu
rple
). F
rom
th
e co
mbi
natio
n o
f H
CC
H T
OC
SY
HS
QC
(gre
en)
and
1 H
/1 H/13
C N
OE
SY
H
SQ
C (
blu
e) i
t w
as
po
ssib
le t
o id
ent
ify t
he
con
ne
ctiv
ity b
etw
ee
nsi
de
cha
in n
ucl
ei.
The
1 H
/1 H/13
C N
OE
SY
HS
QC
pea
ks a
re
ext
rem
ely
imp
orta
nt a
s th
ey
are
th
e on
e th
at
con
tai
n in
form
atio
na
bou
t th
e s
tru
ctu
re o
f th
e pr
ote
in;
as
sign
me
nts
fro
m t
his
spe
ctru
m
wer
e u
sed
in t
he
stru
ctu
re c
alc
ula
tion.
Pic
ture
ge
ner
ate
d w
ith t
he
prog
ram
CC
PN
MR
Ana
lysi
s.

107
3.1.3 Sequence specific Assignments for domain cC0
Very comprehensive sequence specific assignments were carried out for domain cC0,
with all non- proline backbone amides identified in the 1H/ 15N HSQC spectrum except
for residues Glu2, Gly44, Gly45 Asn52 and Ser85 (95%). Backbone nuclei Cα and Cβ
were assigned in the triple resonance experiments with a very high percentage of
completion, being missing the assignments for only the first two residues at the N-
terminus of the domain; the aliphatic side chains were assigned in the 1H/13C HCCH
TOCSY experiment.
Aromatics 1H signals were assigned in the two dimensional 1H/1H TOCSY experiment,
while the 13C signals were identified in the TROSY experiment.
3.1.4 Structure Calculation of domain cC0
The automatic assignment of the peaks picked manually in the three- dimensional
1H/13C NOESY-HSQC experiment was carried out using the CANDID protocol, as part
of the software CYANA 2.1. Out of the total 2460 peaks, 88% were assigned (2170)
while just 292 (12%) were left unassigned at the end of the procedure; all these
unassigned peaks were the product of artefacts in the NMR experiments and were all
checked manually at the end of the automatic assignment procedure. The uniquely
assigned NOE peaks produced 1154 upper distance limits that were used as constraints
on which to base the structure determination.
The final family of structures for domain cC0 was obtained using 1360 structural
constraints derived from experimental NMR data, including 441 sequential (i, i+1), 85
medium range (i, i≤4) and 628 long range (i, i≥5) upper distance limits, 180 backbone

108
torsion angles constraints (90 ϕ and 90 ψ) and 26 hydrogen bond constraints found in
region with defined secondary structure.
Following the final round of CYANA calculation, 81 converged structures were
obtained from 100 random starting structures. The converged structures contain no
distance or van der Waals violation grater than 0.5Å and no dihedral angle violations
grater than 5°, with an average value of the CYANA target function of 1.08±0.0637Å2.
The rmsds of the violations for upper distance limit, lower distance limit and torsion
angles are 0.0109±0.0006 Å, 0.0007±0.0009 Å and 0.3582±0.0579° respectively, while
the sum of the van der Waals violations is 4.1±0.3 Å. Similarly, the maximum
violations for the converged structures were 0.28±0.02 Å, 0.01±0.01 Å, 2.8±0.63° and
0.27±0.01 Å.
Number of constraints used in the final structure calculation Total number NOEs 1154 Sequential NOEs (i, i+1) 441 Medium- range NOEs (i, i≤4) 85 Long range NOEs (i, i≥5) 628 Torsion angles 180 (90 ϕ and 90 ψ) Hydrogen bonds 26 Maximum and total constraints violations in the converged structures (RMSD) Upper distance limits (Å) 0.28±0.02 0.0109±0.0006 Lower distance limits (Å) 0.01±0.01 0.0007±0.0009 Van der Waals contants (Å) 0.27±0.01 4.1±0.3 Torsion angle ranges (°) 2.8±0.63 0.3582±0.0579 Average CYANA target function (Å2)
1.08±0.0637
Structural statistics for the family of converged structures for domain cC0 Residues within the allowed region of the Ramachandran plot (%)
98.7
Average Backbone atom r.m.s.d. 0.40±0.07 Average Heavy atoms r.m.s.d. 0.92±0.07
Table 3.1: NMR constraints and structural statistics for domain cC0.

109
The solution structure of domain cC0 of cMyBPC has been deposited in the Protein
Data Bank (accession code 2K1M).
The structure is determined to a good quality, which is evident from the superimposition
of the protein backbone shown for the family of converged structures in figure 3.8 and
is also reflected in low root mean square deviation (r.m.s.d) values to the mean structure
for both the backbone and all heavy atoms, 0.40±0.07 Å and 0.92±0.07 Å respectively.

110
A
B
E
D
A’
G
F
C
C’
G
F
E
D
C’
C
B
A’
A
Sheet ASheet B
Figure 3.7 Long range NOEs obtained for domain cC0. Long range NOEsbetween atoms five or more residues apart recorded for domain cC0 of cMyBPC and used to solve its structure. Lines that goes from lines that goes from upper left to lower right represent restraints between side chain atoms, lines that go from upper right to lower left represent backbone atoms. It is evident from the picture that the residues of cC0 give NOEs to each other even if they are far from each other in the sequence. In green and red are shown the different β-strands that form the two β-sheets in the domain. It is evident how different β-strands give NOEs to one another. This determine the secondary structure of the protein. Picture generated by the program Cyana 2.1.
A
B
E
D
A’
G
F
C
C’
G
F
E
D
C’
C
B
A’
A
Sheet ASheet B
A
B
E
D
A’
G
F
C
C’
G
F
E
D
C’
C
B
A’
A
Sheet ASheet BSheet ASheet B
Figure 3.7 Long range NOEs obtained for domain cC0. Long range NOEsbetween atoms five or more residues apart recorded for domain cC0 of cMyBPC and used to solve its structure. Lines that goes from lines that goes from upper left to lower right represent restraints between side chain atoms, lines that go from upper right to lower left represent backbone atoms. It is evident from the picture that the residues of cC0 give NOEs to each other even if they are far from each other in the sequence. In green and red are shown the different β-strands that form the two β-sheets in the domain. It is evident how different β-strands give NOEs to one another. This determine the secondary structure of the protein. Picture generated by the program Cyana 2.1.

111
Fig
ure
3.8
Str
uctu
re o
f do
mai
n cC
0 of
cM
yBP
C. T
he
high
res
olu
tion
of
the
str
uct
ure
det
erm
inat
ion
is e
vid
ent
by
the
good
su
per
impo
sitio
n of
th
e
20
stru
ctur
e sh
own.
T
he
dom
ain
is
fo
rmed
b
y tw
o β-
she
ets
form
ed
by
stra
nds
AB
DE
an
d A
’CC
’FG
re
spe
ctiv
ely.
Pic
ture
gen
erat
ed w
ith t
he
pro
gram
Mo
lmol
.
N-t
erm
inus
C-t
erm
inus
N-t
erm
inus
C-t
erm
inus
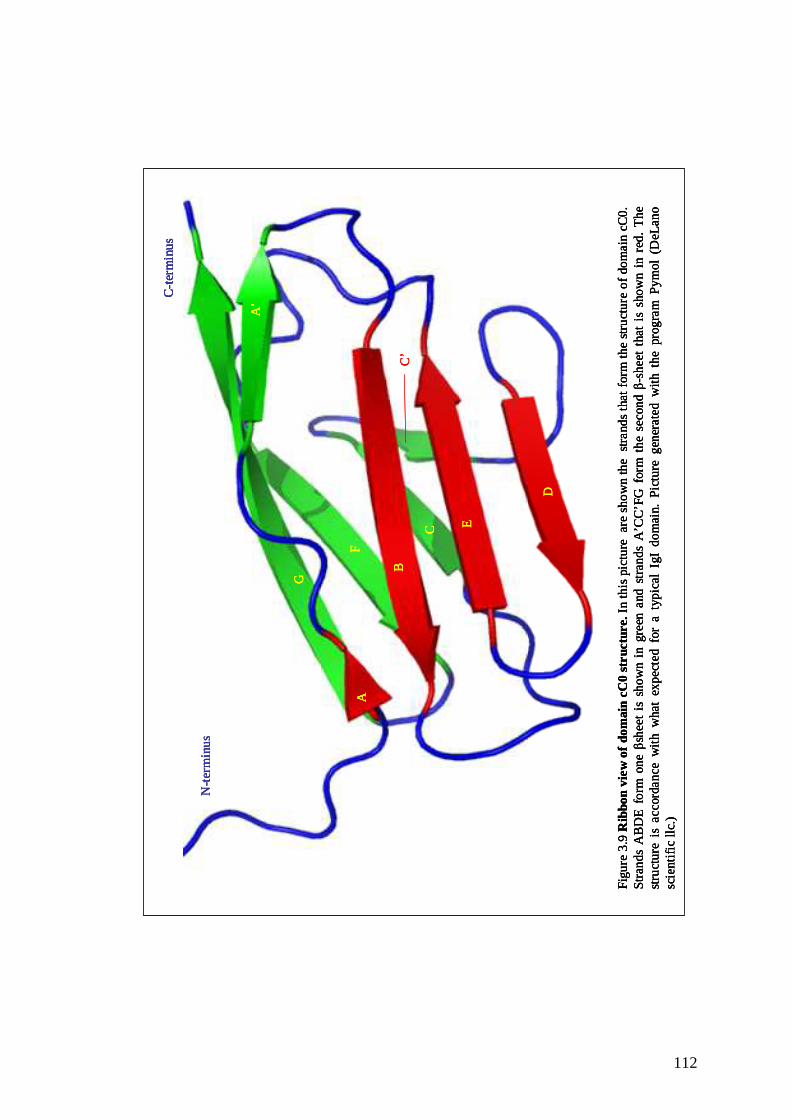
112
Fig
ure
3.9
Rib
bon
vie
w o
f do
mai
n cC
0 st
ruct
ure.
In t
his
pic
ture
a
re s
ho
wn
the
st
rand
s th
at
form
th
e s
tru
ctu
re o
f do
ma
in c
C0
. S
tra
nd
s A
BD
E f
orm
on
e βs
he
et
is s
ho
wn
in g
reen
and
str
an
ds
A’C
C’F
G f
orm
th
e se
con
d β-s
he
et t
hat
is s
how
n in
red
. T
he
stru
ctu
re i
s a
ccor
dan
ce w
ith w
hat
exp
ect
ed
for
a t
yp
ica
l Ig
Id
om
ain
. P
ictu
re g
ener
ate
d w
ith t
he
prog
ram
Pym
ol(D
eLa
no
scie
ntifi
c llc
.)
A
A’
B
C
C’
D
E
F
G
N-t
erm
inu
s
C-t
erm
inu
s
A
A’
B
C
C’
D
E
F
G
N-t
erm
inu
s
C-t
erm
inu
s

113
The domain is formed by two β-sheets, formed by strands ABDE and A’CC’FG
respectively. In picture 3.9 the two sheets are shown in different colours, sheet A in red
and sheet B in green, using the same colour coding seen in picture 3.7 where the NOEs
between amino acids localised in different strands are shown.
The long range NOEs, shown in black in the following graph, correspond to amino
acids positioned in the β-strands, while regions with low number of NOEs or short
distance NOEs are given by residues found in unstructured regions, such as loops or the
termini of the domain.
Figure 3.10 Number of constraints per residue. This picture shows the number of NOEs per residue used for the structure calculation. The long range NOEs are shown in black, medium range NOEs are depicted in gray and short range NOEsin white. It is obvious that short range NOEs are common to all residues while long range NOEs are present just for those residues that are part of a region with a precise secondary structure. The regions with the highest number of long range NOEs in fact, correspond to the β-strands that form the two β-sheets of the domain. Picture generated by the program Cyana 2.1.
Figure 3.10 Number of constraints per residue. This picture shows the number of NOEs per residue used for the structure calculation. The long range NOEs are shown in black, medium range NOEs are depicted in gray and short range NOEsin white. It is obvious that short range NOEs are common to all residues while long range NOEs are present just for those residues that are part of a region with a precise secondary structure. The regions with the highest number of long range NOEs in fact, correspond to the β-strands that form the two β-sheets of the domain. Picture generated by the program Cyana 2.1.
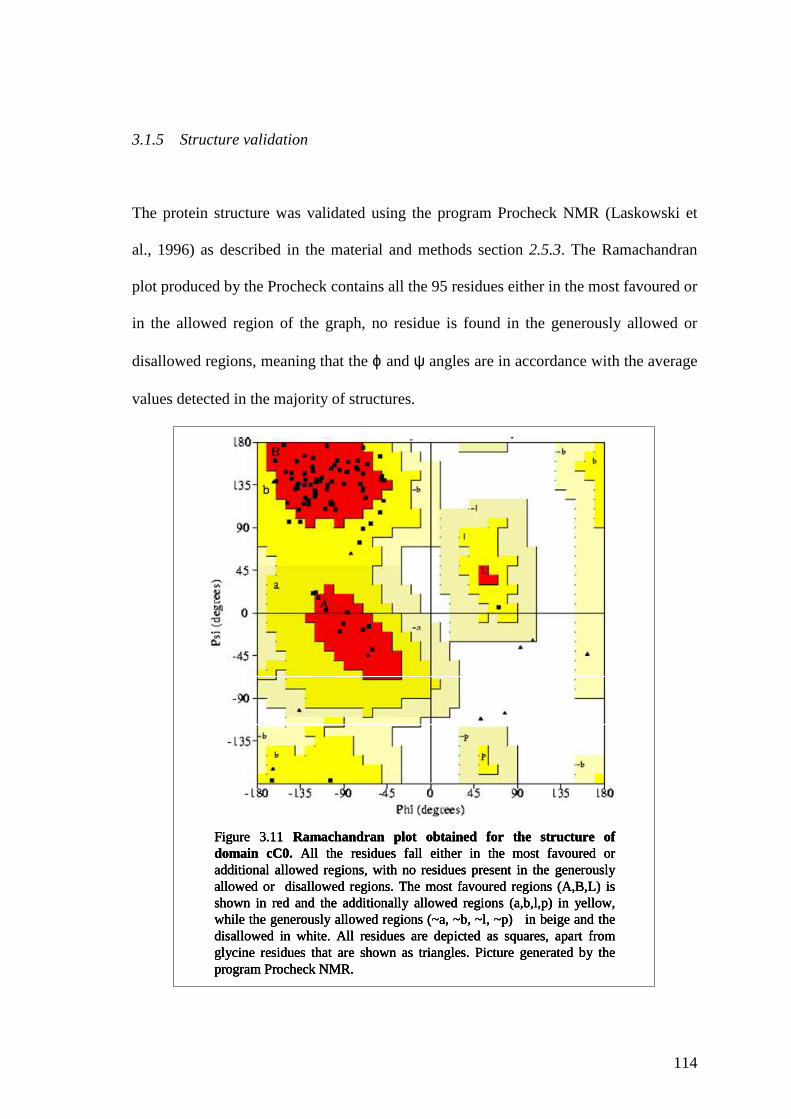
114
3.1.5 Structure validation
The protein structure was validated using the program Procheck NMR (Laskowski et
al., 1996) as described in the material and methods section 2.5.3. The Ramachandran
plot produced by the Procheck contains all the 95 residues either in the most favoured or
in the allowed region of the graph, no residue is found in the generously allowed or
disallowed regions, meaning that the ϕ and ψ angles are in accordance with the average
values detected in the majority of structures.
Figure 3.11 Ramachandran plot obtained for the structure of domain cC0. All the residues fall either in the most favoured or additional allowed regions, with no residues present in the generously allowed or disallowed regions. The most favoured regions (A,B,L) is shown in red and the additionally allowed regions (a,b,l,p) in yellow, while the generously allowed regions (~a, ~b, ~l, ~p) in beige and the disallowed in white. All residues are depicted as squares, apart from glycine residues that are shown as triangles. Picture generated by the program Procheck NMR.
Figure 3.11 Ramachandran plot obtained for the structure of domain cC0. All the residues fall either in the most favoured or additional allowed regions, with no residues present in the generously allowed or disallowed regions. The most favoured regions (A,B,L) is shown in red and the additionally allowed regions (a,b,l,p) in yellow, while the generously allowed regions (~a, ~b, ~l, ~p) in beige and the disallowed in white. All residues are depicted as squares, apart from glycine residues that are shown as triangles. Picture generated by the program Procheck NMR.
Figure 3.11 Ramachandran plot obtained for the structure of domain cC0. All the residues fall either in the most favoured or additional allowed regions, with no residues present in the generously allowed or disallowed regions. The most favoured regions (A,B,L) is shown in red and the additionally allowed regions (a,b,l,p) in yellow, while the generously allowed regions (~a, ~b, ~l, ~p) in beige and the disallowed in white. All residues are depicted as squares, apart from glycine residues that are shown as triangles. Picture generated by the program Procheck NMR.

115
Procheck also displays the RMSD calculated for each residue, its accessibility, defining
whether or not an amino acid is positioned on the surface or buried in the hydrophobic
core and the secondary structure. All these parameters are shown in picture 3.12 From
the Procheck results is obvious like the structure obtained for domain cC0 is a good
quality structure, with low RMSD, apart from the poorly structured N-terminus and a
secondary structure corresponding to the one expected for an IgI domain, with very well
defined secondary structure elements, also confirmed by the accessibility analysis
carried out on each residue, as shown in picture 3.12 c).

116
a)
RM
SD
fro
m m
ean
coor
dina
tes:
ma
in c
hain
(bl
ack
) a
nd s
ide
cha
in(g
ray)
b) S
eco
nda
ry s
tru
ctu
re a
nd
ave
rag
e e
stim
ate
of a
cce
ssib
ility
c) S
equ
en
ce a
nd
ave
rag
e e
stim
ate
of a
cce
ssib
ility
Fig
ure
3.1
2 Pro
chec
kN
MR
res
idue
by
resi
due
resu
lts fo
r the
cal
culat
ed s
truct
ure
of d
omai
n cC
0. a)
RM
SD
from
the
coo
rdin
ate
s of
bot
h ba
ckbo
ne a
nd s
ide
cha
ins.
It
is e
vide
nt h
ow
the
RM
SD
val
ues
are
hig
her
at t
he N
-te
rmin
us o
f th
e p
rote
in,
as
exp
ect
ed f
or a
n un
stru
ctur
ed
part
of
the
pro
tein
, w
hile
the
dec
rea
se
in
the
re
gion
s ch
ara
cte
rized
by
a s
peci
fic s
eco
nda
ry s
truc
ture
; b)
se
cond
ary
st
ruct
ure
of
dom
ain
cC
0; c
) in
thi
s se
ctio
n o
the
pic
ture
is
sho
wn
the
se
que
nce
of
the
dom
ain
toge
the
r w
ith a
n e
stim
ate
of
how
are
sid
ue i
s a
cce
ssib
le o
r bu
ried
in
the
hyd
roph
obic
co
re.
It is
ea
sy t
o sp
ot t
hat
the
burie
d re
sid
ues
te
nd t
o co
rre
spon
d t
o th
e
β-sh
eet
re
gion
s of
the
dom
ain
s.
a)
RM
SD
fro
m m
ean
coor
dina
tes:
ma
in c
hain
(bl
ack
) a
nd s
ide
cha
in(g
ray)
b) S
eco
nda
ry s
tru
ctu
re a
nd
ave
rag
e e
stim
ate
of a
cce
ssib
ility
c) S
equ
en
ce a
nd
ave
rag
e e
stim
ate
of a
cce
ssib
ility
a)
RM
SD
fro
m m
ean
coor
dina
tes:
ma
in c
hain
(bl
ack
) a
nd s
ide
cha
in(g
ray)
b) S
eco
nda
ry s
tru
ctu
re a
nd
ave
rag
e e
stim
ate
of a
cce
ssib
ility
c) S
equ
en
ce a
nd
ave
rag
e e
stim
ate
of a
cce
ssib
ility
Fig
ure
3.1
2 Pro
chec
kN
MR
res
idue
by
resi
due
resu
lts fo
r the
cal
culat
ed s
truct
ure
of d
omai
n cC
0. a)
RM
SD
from
the
coo
rdin
ate
s of
bot
h ba
ckbo
ne a
nd s
ide
cha
ins.
It
is e
vide
nt h
ow
the
RM
SD
val
ues
are
hig
her
at t
he N
-te
rmin
us o
f th
e p
rote
in,
as
exp
ect
ed f
or a
n un
stru
ctur
ed
part
of
the
pro
tein
, w
hile
the
dec
rea
se
in
the
re
gion
s ch
ara
cte
rized
by
a s
peci
fic s
eco
nda
ry s
truc
ture
; b)
se
cond
ary
st
ruct
ure
of
dom
ain
cC
0; c
) in
thi
s se
ctio
n o
the
pic
ture
is
sho
wn
the
se
que
nce
of
the
dom
ain
toge
the
r w
ith a
n e
stim
ate
of
how
are
sid
ue i
s a
cce
ssib
le o
r bu
ried
in
the
hyd
roph
obic
co
re.
It is
ea
sy t
o sp
ot t
hat
the
burie
d re
sid
ues
te
nd t
o co
rre
spon
d t
o th
e
β-sh
eet
re
gion
s of
the
dom
ain
s.
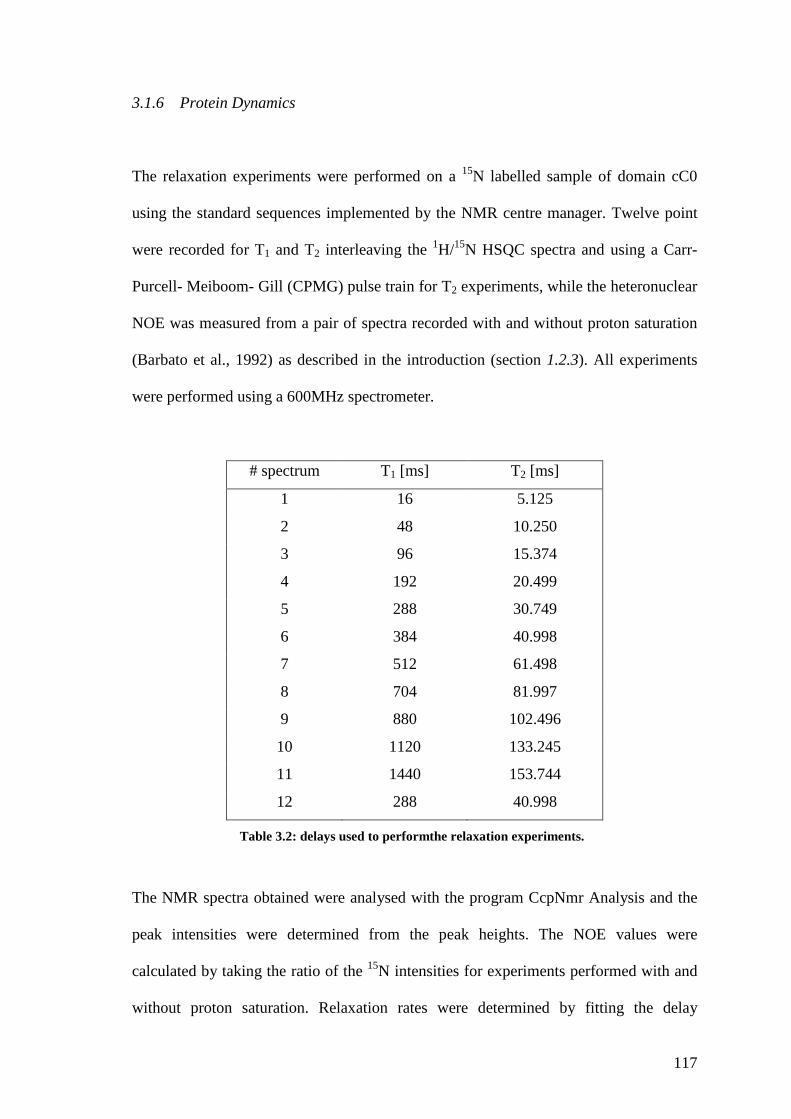
117
3.1.6 Protein Dynamics
The relaxation experiments were performed on a 15N labelled sample of domain cC0
using the standard sequences implemented by the NMR centre manager. Twelve point
were recorded for T1 and T2 interleaving the 1H/15N HSQC spectra and using a Carr-
Purcell- Meiboom- Gill (CPMG) pulse train for T2 experiments, while the heteronuclear
NOE was measured from a pair of spectra recorded with and without proton saturation
(Barbato et al., 1992) as described in the introduction (section 1.2.3). All experiments
were performed using a 600MHz spectrometer.
# spectrum T1 [ms] T2 [ms]
1 16 5.125
2 48 10.250
3 96 15.374
4 192 20.499
5 288 30.749
6 384 40.998
7 512 61.498
8 704 81.997
9 880 102.496
10 1120 133.245
11 1440 153.744
12 288 40.998
Table 3.2: delays used to performthe relaxation experiments.
The NMR spectra obtained were analysed with the program CcpNmr Analysis and the
peak intensities were determined from the peak heights. The NOE values were
calculated by taking the ratio of the 15N intensities for experiments performed with and
without proton saturation. Relaxation rates were determined by fitting the delay

118
dependent peak intensities to an exponential function using the program
MATHEMATICA (Wolfram research).
An estimation of the overall correlation time (τc) was obtained from R2/R1 ratios using
MATHEMATICA with a filter applied to ensure that only residues that do not suffer
from large amplitude fast motions and chemical exchange are included in the
determination; a standard deviation cut-off of 1.5 and a NOE cut-off of 0.65 were
applied to all data. Residues with an NOE effect larger than 0.65 are considered rigid,
while if the NOE effect is below this value the residue involved is in a flexible region. It
is important to note that the Lipari-Szabo analysis used in this research considers the
protein as a spherical object, not taking into account any anisotropy that might be
present in the molecule.
The initial data consisted of 75 residues, out of which seven were eliminated because of
the NOE cut-off and four were removed due to the R2/R1 standard deviation cut-off that
resulted more that the set 1.5. As a consequence the fit was performed on 64 residues.
The average values obtained were:
R1= 1.44± 0.10 s-1
R2=10.68± 2.02 s-1
NOE= 0.78± 0.04
The value of τc was fitted from the experimental data and calculated with the Monte
Carlo simulation algorithm, which provides an estimate of the expected value of a
random variable, τc in this case, and predicts the estimation error which is proportional
to the number of iteration. The results obtained from these two fits show how the values
follow a Gaussian distribution and are reported in picture 3.13, for the 64 experimental
values taken into account in this analysis and for the 500 synthetic residues used in the
Monte Carlo simulation. The second fit is better defined than the experimental value but

119
we can notice the good agreement between experimental and simulation results. The
average value for τc was determined to be 5.81 ± 0.16 ns.
a) b)
Figure 3.13. Correlation time τc values. a) experimental fit of τc values per residues. b) values of correlation time calculated using the Montecarlo algorithm. It is evident from these two pictures the good agreement between experimental and calculated values. Both curves have a maximum around 5.8 that is the average value determined for τc. Picture obtained with the program MATHEMATICA.
a) b)a) b)
Figure 3.13. Correlation time τc values. a) experimental fit of τc values per residues. b) values of correlation time calculated using the Montecarlo algorithm. It is evident from these two pictures the good agreement between experimental and calculated values. Both curves have a maximum around 5.8 that is the average value determined for τc. Picture obtained with the program MATHEMATICA.
Once τc has been determined, the five different models shown in table 2.8 were used in
the numerical fit to the experimental R1, R2 and NOE values. The equation that fit better
the experimental data was then used to calculate the appropriate variables necessary to
describe the motion, such as S2, Rex, S2f, τi,, etc.
S2 it is an important parameter as it gives an idea of the local dynamics of the protein
analysed. S2, in fact, can assume any value between 0, corresponding to maximal
flexibility, and 1, corresponding with maximal rigidity.
From picture 3.14 a) it is clear how the protein is rigid, having almost all residues listed
with a S2 value larger than 0.7, value taken arbitrarily as the threshold between
flexibility and rigidity of the region of the protein where the residue in question is
located. Only the N-terminus of the protein appear flexible, together with a few residues
at the C-terminus of the domain, confirming what found in the structure derived by the
calculation.

120
a)
b)
Figure 3.14 Rigidity of the molecule v. number of constraints.a) General order parameter S2
values for each residue in the sequence of domain cC0. For some of the residues it was not possible to determine S2, mainly due to the lack of experimental data as, for example, for Gly44 and Gly45. The residues with a S2 value lower than 0.7 are considered to be positioned in a flexible region, while residues with S2 values above 0.7 are thought to be in a rigid part of the protein. 0.7 has been chosen empirically as a threshold value and residues with S2 values close to 0.7 have to be evaluated case by case. It is evident how the whole protein seems to be rigid, apart from few residues at the C-terminus and the first 10 residues at the N-terminus of the domain. This is consistent with what found in the three dimensional structure of cC0. b) Constraints obtained for any given residue and used to perform the structure calculation. It is evident from these two pictures that no loop regions seem to be present in cC0 according to the S2 values graph (figure a) but this is probably due to the absence of constraints available for the resides located in loop region (figure b).
a)
b)
a)
b)
Figure 3.14 Rigidity of the molecule v. number of constraints.a) General order parameter S2
values for each residue in the sequence of domain cC0. For some of the residues it was not possible to determine S2, mainly due to the lack of experimental data as, for example, for Gly44 and Gly45. The residues with a S2 value lower than 0.7 are considered to be positioned in a flexible region, while residues with S2 values above 0.7 are thought to be in a rigid part of the protein. 0.7 has been chosen empirically as a threshold value and residues with S2 values close to 0.7 have to be evaluated case by case. It is evident how the whole protein seems to be rigid, apart from few residues at the C-terminus and the first 10 residues at the N-terminus of the domain. This is consistent with what found in the three dimensional structure of cC0. b) Constraints obtained for any given residue and used to perform the structure calculation. It is evident from these two pictures that no loop regions seem to be present in cC0 according to the S2 values graph (figure a) but this is probably due to the absence of constraints available for the resides located in loop region (figure b).

121
3.1.7 Studies of the interaction between cC0 and RLC
Studies carried out by our collaborator Dr Elena Rostkova (King’s Collage, London)
based on Differential Scanning Calorimetry (DSC), showed that domain cC0 interacts
with the miniHMM fraction of myosin, comprising of two myosin heads, two essential
light chains, two regulatory light chains and S2∆, the first 125 residues of myosin S2
forming a coiled coil and, more precisely, with the Regulatory Light Chain (RLC). The
RLC is positioned in the neck region of myosin and, together with the Essential Light
Chain (ELC), stabilises the 8.5 nm long α- helical fragment that forms it. The N-
terminus of the RLC is wrapped around the myosin heavy chain (Rayment et al., 1993)
in the region comprised between residues 808 and 842. The RLC seems to be of great
importance for both myosin structure and function; in fact, selective removal of the
RLC caused a change in the structure of the cardiac myosin molecule (Margossian and
Slayter, 1987) and, upon removal of the RLC, myosin would lose its ordered structure
(Levine et al., 1998). The regulatory light chain is a member of the superfamily of EF-
hand Ca2+ binding protein, even thought it has lost its ability to bind to Ca2+ in sites 2, 3
and 4 (Moncrief et al., 1990) and presents only one high affinity binding site at the N-
terminus (Reinach et al., 1986), between residues 37 and 48 (Szczesna et al., 2001). The
RLC shows also a phosphorylation site at reside Ser15. This domain results being
highly conserved throughout species, as visible from the alignment shown below. Also
the RLC is linked to HCM, presenting 8 missense mutations that cause the disease.

122
Figure 3.15 Sequence alignment of the Regulatory Light Chain (RLC) of myosin. It is evident from this picture how the sequence of the RLC is highly conserved throughout species.
Figure 3.15 Sequence alignment of the Regulatory Light Chain (RLC) of myosin. It is evident from this picture how the sequence of the RLC is highly conserved throughout species.
The first preliminary analysis on the interaction of domain cC0 and miniHMM and RLC
was performed by our collaborator Dr Elena Roskova (King’s College, London) using
the technique of differential scanning calorimentry (DSC). The results obtained with
this analysis showed that the two protein interact with one another. To confirm these
results and to take advantage of the structure of domain cC0, NMR spectroscopy was
used to tudy this interaction, first with miniHMM and then with RLC.

123
Fig
ure
3.1
6 Str
uctu
re o
f m
yosi
n he
ads
and
how
the
y co
uld
inte
ract
with
dom
ain
cC0.
The
thi
ck f
ilam
ent
is m
ade
of
Ligh
t M
ero
Myo
sin
(LM
M)
and
He
avy
Me
roM
yosi
n(H
MM
), w
hich
is the
n f
orm
ed b
y th
e S
2 r
od f
rag
men
t, th
e R
egu
lato
ry L
ight
Ch
ain
(R
LC),
th
e E
ssen
tial
Ligh
t C
hain
(E
LC)
and
th
e M
yos
in h
ead
do
mai
n (
S1)
. T
he
pre
limin
ary
stu
dy
of
the
in
tera
ctio
n h
ave
be
en
ca
rrie
d ou
t us
ing
a fr
agm
ent
calle
d m
ini
HM
M f
orm
ed by
a pa
rt o
fth
e S
2 ro
d fr
agm
ent,
nam
ed S
2∆
, an
d th
e R
LC (
in b
lue)
. D
omai
n c
C0
is s
how
n in
re
d.
RLCELC
ELC
RLC
cC0
cC0
S2
S2∆
HM
M
LMM
THICK
FILAM
ENT
S1S1
Min
iH
MM
RLCELC
ELC
RLC
cC0
cC0
S2
S2∆
HM
M
LMM
THICK
FILAM
ENT
S1S1
Min
iH
MM

124
3.1.7.1 1H/ 15N NMR spectroscopy titration between cC0 and
miniHMM
Domain cC0 is thought to interact with Myosin Regulatory Light Chain (RLC) located
in the Heavy MeroMyosin (HMM), the fragment containing the Myosin heads. To prove
that this interaction takes place, a preliminary titration was carried out using as a
binding partner the so called mini HMM, which is formed by a fragment of the S2 rod,
the so called S2∆, and the Regulatory Light Chain (RLC). The five steps of the titration
are reported in table 3.3
Ratios [cC0] µM [miniHMM] µM
1:0 200 0
1:0.5 200 96
1:1 200 289
1:2.5 200 481
1:3.5 200 673
Table 3.3: ratios and final concentations of cC0 and the miniHMM fragment used in the titration.
At the time of this experiment the assignment for domain cC0 was not available yet, so
these changes in the spectrum were interpreted as a proof that the interaction was
happening. Once the spectra for domain cC0 have been fully assigned, it was possible to
repeat the titration, with both miniHMM and RLC, and to map the result on cC0
surface, so to understand where the two proteins interact with each other. The peaks in
the green spectrum (Fig. 3.17) are less intense than the ones shown in the other
preceding spectra, this is due to the large dimensions of miniHMM; at very high
concentrations of miniHMM the spectrum of cC0 would completely disappear due to

125
the slow tumbling of a large molecule, such as the complex formed by cC0 and
miniHMM, that leads to fast transverse relaxation (T2), causing broadening of the
signals and ultimately disappearance of any signal.
Figure 3.17 1H/ 15N HSQC spectrum for the cC0+miniHMM titration. This portions of the spectrum show that some peaks of domain cC0 are affected by the presence of miniHMM, proving that the two protein interact with each other. The blue spectrum is the first one, registered in absence of miniHMM, while the red and green are the following spectra, registered at increasing concentration ofminiHMM in cC0. The peaks move in the direction shown by the red arrow.
Figure 3.17 1H/ 15N HSQC spectrum for the cC0+miniHMM titration. This portions of the spectrum show that some peaks of domain cC0 are affected by the presence of miniHMM, proving that the two protein interact with each other. The blue spectrum is the first one, registered in absence of miniHMM, while the red and green are the following spectra, registered at increasing concentration ofminiHMM in cC0. The peaks move in the direction shown by the red arrow.
The chemical shift perturbations are reported on the histogram (Fig. 3.18). The most
affected residues resulted being F11, K14, R16, R34, V37, S46, G60, K86, V87, K88,
F89, showing a δ∆ bigger than 0.017 ppm, depicted in the figure as the higher red
horizontal line.

126
13
57
911
1315
1719
2123
2527
2931
3335
3739
4143
4547
4951
5355
5759
6163
6567
6971
7375
7779
8183
8587
8991
9395
9799101
0.0000
0.0050
0.0100
0.0150
0.0200
0.0250
0.0300
0.0350
0.0400C0wt + miniHMM
Figure 3.18 Chemical Shift changes for amide groups of domain cC0 during thecC0+miniHMM titration. Here are shown the changes in chemical shifts for the 1H nuclei of the cC0 amide grups following the titration with miniHMM. Some residues show quite considerable shift, while others seem not to be affected by the presence of the miniHMM at all.
Residues
δ∆/
ppm
13
57
911
1315
1719
2123
2527
2931
3335
3739
4143
4547
4951
5355
5759
6163
6567
6971
7375
7779
8183
8587
8991
9395
9799101
0.0000
0.0050
0.0100
0.0150
0.0200
0.0250
0.0300
0.0350
0.0400C0wt + miniHMM
13
57
911
1315
1719
2123
2527
2931
3335
3739
4143
4547
4951
5355
5759
6163
6567
6971
7375
7779
8183
8587
8991
9395
9799101
0.0000
0.0050
0.0100
0.0150
0.0200
0.0250
0.0300
0.0350
0.0400C0wt + miniHMM
Figure 3.18 Chemical Shift changes for amide groups of domain cC0 during thecC0+miniHMM titration. Here are shown the changes in chemical shifts for the 1H nuclei of the cC0 amide grups following the titration with miniHMM. Some residues show quite considerable shift, while others seem not to be affected by the presence of the miniHMM at all.
Residues
δ∆/
ppm
Most of the residues involved in this interaction are positively charged amino acids,
mainly Lysines and Arginines, all exposed on the domain surface, as expected for
charged residues.
3.1.7.2 1H/ 15N NMR spectroscopy titration between cC0 and RLC
A titration was performed using a 15N labelled NMR sample of cC0 to which an
increasing concentration of RLC was added. 1H/15N HSQC spectra were recorded after
every addition. The ratios used in this experiments are reported in the table following.

127
Ratios [cC0] µM [RLC] µM
1:0 50 0
1:1 50 50
1:2 50 100
1:4 50 200
1:6 50 300
Table 3.4: ratios and final concentrations of cC0 and RLC used in the titration performer to study their interaction.
The changes in the 1H/15N HSQC spectrum have been monitored and are reported in
figures 3.20- 3.23 For clarity only three points have been reported in the pictures,
corresponding to the ratios 1:0, 1:1 and 1:6.
The histogram shows which residues were more affected by the addition of RLC to
cC0; being the 1H/15N HSQC spectrum fully assigned, it was possible to identify the
residues that show the main shifts. As expected all of them are to be found on the
surface of cC0 and most of them are charged residues, such as Lys and Arg.

128
R16
F89R43 S24
E33
K5
S49
K13
R62
V8
S85
T61
S9
S17A73
E69
T58
V20
E29
A79
K53
8.6 8.5 84 8.3 8.2 8.1 8.1 8.0 7.8
122
121
120
119
118
Figure 3.19 1H/ 15N HSQC spectrum for the cC0+RLC titration. Panel 1.in the picture are shown some of the peaks of the 1H/15N HSQC spectrum, one of which corresponds to the residue R16 that is the most affected by the addition of RLC to cC0. for clarity in the picture are shown only three of the five titration points registered during the experiment. (Ratios cC0:RLC Red 1:0: Blue 1:6)
K14
I48 A50
D47I81
E59V86
Y78
K92K38
A82
I94A21
R40
A57
K6
E19V93
V93
A36
Figure 3.20 1H/ 15N HSQC spectrum for the cC0+RLC titration. Panel 2.In the picture are shown some of the peaks of the 1H/15N HSQC spectrum, one of which corresponds to the residue K14 one of the most affected peaks by the addition of RLC to cC0. For clarity in the picture are shown only three of the five titration points registered during the experiment.
9.0 8.9 8.8 8.7 8.6 8.5 8.4 8.3 8.2 8.1 8.0
129
128
127
126
125
124
K14
I48 A50
D47I81
E59V86
Y78
K92K38
A82
I94A21
R40
A57
K6
E19V93
V93
A36K14
I48 A50
D47I81
E59V86
Y78
K92K38
A82
I94A21
R40
A57
K6
E19V93
V93
A36
Figure 3.20 1H/ 15N HSQC spectrum for the cC0+RLC titration. Panel 2.In the picture are shown some of the peaks of the 1H/15N HSQC spectrum, one of which corresponds to the residue K14 one of the most affected peaks by the addition of RLC to cC0. For clarity in the picture are shown only three of the five titration points registered during the experiment.
9.0 8.9 8.8 8.7 8.6 8.5 8.4 8.3 8.2 8.1 8.0
129
128
127
126
125
124

129
8.82 8.80 8.78 8.76 8.74 8.72 8.70 8.68 8.66 8.64
cC0+RLC 1:6
K14cC0 50µM
cC0+RLC 1:1cC0+RLC 1:2cC0+RLC 1:4
Figure 3.21 Reside Lys14 during the cC0+RLC titration. In the picture are shown the successive shifts of the K14 peak during the cC0+RLC titration, showing all five points registered during the experiment. It is clearly visible how the peak moves in the arrow direction, starting from the red spectrum, corresponding to cC0, to the blue spectrum, corresponding to a ratio of cC0 and RLC 1:6 respectively.
125.8
125.6
125.4
125.2
125.0
8.82 8.80 8.78 8.76 8.74 8.72 8.70 8.68 8.66 8.648.82 8.80 8.78 8.76 8.74 8.72 8.70 8.68 8.66 8.64
cC0+RLC 1:6
K14cC0 50µM
cC0+RLC 1:1cC0+RLC 1:2cC0+RLC 1:4
Figure 3.21 Reside Lys14 during the cC0+RLC titration. In the picture are shown the successive shifts of the K14 peak during the cC0+RLC titration, showing all five points registered during the experiment. It is clearly visible how the peak moves in the arrow direction, starting from the red spectrum, corresponding to cC0, to the blue spectrum, corresponding to a ratio of cC0 and RLC 1:6 respectively.
125.8
125.6
125.4
125.2
125.0
120.4
120.2
120.0
119.8
119.6
119.4
119.2
R16
cC0 50µMcC0+RLC 1:1
cC0+RLC 1:2cC0+RLC 1:4
cC0+RLC 1:6
Figure 3.22 Reside Arg16 during the cC0+RLC titration. In the picture are shown the successive shifts of the R16 peak during the cC0+RLC titration, showing all five points registered during the experiment. It is clearly visible how the peak moves in the arrow direction, starting from the red spectrum, corresponding to cC0, to the blue spectrum, corresponding to a ratio of cC0 and RLC 1:6 respectively.
8.20 8.15 8.10 8.05 8.00120.4
120.2
120.0
119.8
119.6
119.4
119.2
R16
cC0 50µMcC0+RLC 1:1
cC0+RLC 1:2cC0+RLC 1:4
cC0+RLC 1:6
Figure 3.22 Reside Arg16 during the cC0+RLC titration. In the picture are shown the successive shifts of the R16 peak during the cC0+RLC titration, showing all five points registered during the experiment. It is clearly visible how the peak moves in the arrow direction, starting from the red spectrum, corresponding to cC0, to the blue spectrum, corresponding to a ratio of cC0 and RLC 1:6 respectively.
8.20 8.15 8.10 8.05 8.00

130
13
57
911
1315
1719
2123
2527
2931
3335
3739
4143
4547
4951
5355
5759
6163
6567
6971
7375
7779
8183
8587
8991
9395
9799101
0.0000
0.0050
0.0100
0.0150
0.0200
0.0250
0.0300
0.0350
0.0400C0wt + RLC/MyBS
Figure 3.23 Chemical Shift changes for amide groups of domain cC0 during thecC0+RLC titration. Here are shown the changes in chemical shifts for the 1H nuclei of the cC0 amide grups following the titration with RLC. Some residues show quite considerable shift, while others seem not to be affected by the presence of the RLC at all.
δ∆/
ppm
Residues1
35
7911
1315
1719
2123
2527
2931
3335
3739
4143
4547
4951
5355
5759
6163
6567
6971
7375
7779
8183
8587
8991
9395
9799101
0.0000
0.0050
0.0100
0.0150
0.0200
0.0250
0.0300
0.0350
0.0400C0wt + RLC/MyBS
13
57
911
1315
1719
2123
2527
2931
3335
3739
4143
4547
4951
5355
5759
6163
6567
6971
7375
7779
8183
8587
8991
9395
9799101
0.0000
0.0050
0.0100
0.0150
0.0200
0.0250
0.0300
0.0350
0.0400C0wt + RLC/MyBS
Figure 3.23 Chemical Shift changes for amide groups of domain cC0 during thecC0+RLC titration. Here are shown the changes in chemical shifts for the 1H nuclei of the cC0 amide grups following the titration with RLC. Some residues show quite considerable shift, while others seem not to be affected by the presence of the RLC at all.
δ∆/
ppm
Residues
In Fig. 3.23 above are shown the peaks that moved the most in the 1H/ 15N HSQC
spectrum due to the addition of HtTRLC, corresponding to the residues more affected by
the interaction. Most of the residues involved in this interaction are positively charged
amino acids, mainly Lysines and Arginines, all exposed on the domain surface, as
expected for charged residues. Moreover, all the peaks in the spectrum appear broaden;
this is a consequence of the formation of the complex between cC0 and the HtTRLC, the
peaks in the spectra registered at a high concentration of HtTRLC behave like those in
the spectrum of a molecule with a higher molecular weight, hence the broadening of the
NMR signals.
It was possible to identify on the domains surface the residues that more resulted
affected by the titration and are reported below.

131
R34
F11
K14
R16S17
K86
K88
V37
S46F89
Figure 3.24 Result of the cC0+RLC titration. A main area of cC0 comprising residues Phe11, Lys14, Arg16 Ser17, Lys86, Lys88 and Phe89 resulted affected by the presence of the RLC in solution. Also residues Arg34, Val37 and Ser46, the last two being positioned at the back of the domain, were affected by the titration. Picture generated with Pymol (DeLano Scientific llc.)
R34
F11
K14
R16S17
K86
K88
V37
S46F89
R34
F11
K14
R16S17
K86
K88
V37
S46F89
Figure 3.24 Result of the cC0+RLC titration. A main area of cC0 comprising residues Phe11, Lys14, Arg16 Ser17, Lys86, Lys88 and Phe89 resulted affected by the presence of the RLC in solution. Also residues Arg34, Val37 and Ser46, the last two being positioned at the back of the domain, were affected by the titration. Picture generated with Pymol (DeLano Scientific llc.)
3.1.8 Mutogenesis Studies
Only three HCM related mutation have been identified in domain cC0 (Table 1.2). G4R
(Van Driest et al., 2004) is shown to have an early onset (around 20 years of age) while
T59A (Niimura et al., 2002) has a more delayed onset and it appeared in individuals 56
years old. This last mutation is thought to be mild as many species present an Ala
residue in this position instead of the Thr present in the human cardiac isoform, so no
great disruption in either structure or function can be expected. The last of the cC0
mutations is R34W (Peng et al., 2005. direct submission at
http://genepath.med.harvard.edu/~seidman/cg3/), involving one of the residues affected

132
by the interaction with RLC. No clinical information have been deposited or published
so far regarding this mutation.
To determine the effect of these mutations on cC0 structure and function, four mutants
were produced of the protein to study their interaction with RLC and to compare their
behaviour with wildtype cC0 used in the previous interaction studies. The primers used
are reortend in table 3.5.
Table 3.5 Primers used to clone wildtype cC0 and the four mutants
pLEICS-03
7128 bp
lac I
SacB
pBR322 Origin
Kan
f1 origin
T7 terminator
TEV site
His-Tag
T7 Promoter
Ava I (4987)
BamHI (5027)
EcoRI (5021)
Xho I (4987)
Nde I (1 )
HindIII (5002)
HindIII (5202)
BseRI (5049)
BseRI (7062)
Apa LI (81 1 )
Apa LI (2509)
Apa LI (3009)
Cla I (108)
Cla I (3588)
Cla I (5844)
Cla I (6181 )
Figure 3.25 pLEICS-03 vector map. All the cC0 mutants were cloned in pLEICS-03 vector. The cloning procedure was carried out in the Protex lab at the University of Leicester.
Primers for generating entry vector Tm
F 5'-ACTTCCCAATCCATGCCTGAGCCGGGGAAGAAGCCA-3' 70°C cC0_WT R 5'-TATCCACCTTTACTGTCAAAATTCCTCACGCGTGGA-3' 64°C F 5'-ACTTCCCAATCCATGCCTGAGCCGCGGAAGAAG-3' 68°C cC0_G4R R 5'-TATCCACCTTTACTGTCAAAATTCCTCACGCGTGGA-3' 64°C F 5'-GCCGAGACAGAGTGGGCAGGAGTG-3' 64°C cC0_R34W R 5'- CACTCCTGCCCACTCTGTCTCGGC-3' 64°C F 5'-GTGTTCGAGCCCGAGACAGAGCGG-3' 64°C cC0_A30P R 5'-CCGCTCTGTCTCGGGCTCGAACAC-3' 64°C F 5'-GGCTCCTCCGAGGTCAAGTTCGAC-3' 63°C cC0_K86E R 5'-GTCGAACTTGACCTCGGAGGAGCC-5' 63°C

133
The first two mutants, cC0_G4R and cC0_R34W, are obvious choices as they are
natural occuring mutations in human cardiac isoform; T58R was not chosen as in all
other species analysed of cMyBPC the threonine residue is in fact substituted by an
alanine, so the effect of this mutation is not expected to be extreme, a fact confirmed
also by what concluded by clinical studies. The mutant cC0_A30P was produced as an
A30P missense mutation has been found in Maine Coon cats (Meurs et al., 2005).
Finally, cC0_K86E was cloned to confirm the hypothesis that the positive patch of
which residue Lys86 is part, is involved in the interaction with the RLC as mutating the
lysine residue to glutamic acid should have an impact on the interaction and possibly
abolish it due to the inversion of charges. All mutants expressed well, apart from
cC0_G4R that went into inclusion bodies being probably insoluble. The lack of stability
of this mutant is confirmed by the clinical observation reported for this mutation. The
experiment was repeated for cC0_G4R, cC0_R34W and cC0_K86E using 50 µM 15N
labelled sample of the cC0 mutants and 200 µM unlabelled samples RLC/ MyBS.

134
13
57
911
1315
1719
2123
2527
2931
3335
3739
4143
4547
4951
5355
5759
6163
6567
6971
7375
7779
8183
8587
8991
9395
9799101
0.0000
0.0050
0.0100
0.0150
0.0200
0.0250
0.0300
0.0350
0.0400C0wt G4R + RLC/MyBS
δ∆/
ppm
Residues
Figure 3.26 Chemical Shift changes for amide groups of domain cC0_G4R during the titration with RLC. Here are shown the changes in chemical shifts for the 1H nuclei of the cC0_G4R amide grups following the titration with RLC. The residues affected are still the one affected in cC0_WT but the interaction appear to be a lot less intense, as shown by the bars of the histogram. The residues positioned at the N-terminus seem to be more affected.
13
57
911
1315
1719
2123
2527
2931
3335
3739
4143
4547
4951
5355
5759
6163
6567
6971
7375
7779
8183
8587
8991
9395
9799101
0.0000
0.0050
0.0100
0.0150
0.0200
0.0250
0.0300
0.0350
0.0400C0wt G4R + RLC/MyBS
13
57
911
1315
1719
2123
2527
2931
3335
3739
4143
4547
4951
5355
5759
6163
6567
6971
7375
7779
8183
8587
8991
9395
9799101
0.0000
0.0050
0.0100
0.0150
0.0200
0.0250
0.0300
0.0350
0.0400C0wt G4R + RLC/MyBS
δ∆/
ppm
Residues
Figure 3.26 Chemical Shift changes for amide groups of domain cC0_G4R during the titration with RLC. Here are shown the changes in chemical shifts for the 1H nuclei of the cC0_G4R amide grups following the titration with RLC. The residues affected are still the one affected in cC0_WT but the interaction appear to be a lot less intense, as shown by the bars of the histogram. The residues positioned at the N-terminus seem to be more affected.
It is interesting to note how the mutation, despite reducing the strenght of the
interaction, does not disrupt the interaction completely and the same residues that are
affected in cC0_WT resulted being affected in the cC0_G4R mutant.
Mutation cC0_R34W affected even more the interaction with RLC that resulted being
almost annulled by the substitution of Arg 34 with a Trp. This result could be
hypothesised on the basis of the nature of the mutation, where a positively charged
residue is substituated with an hydrophobic amino acid
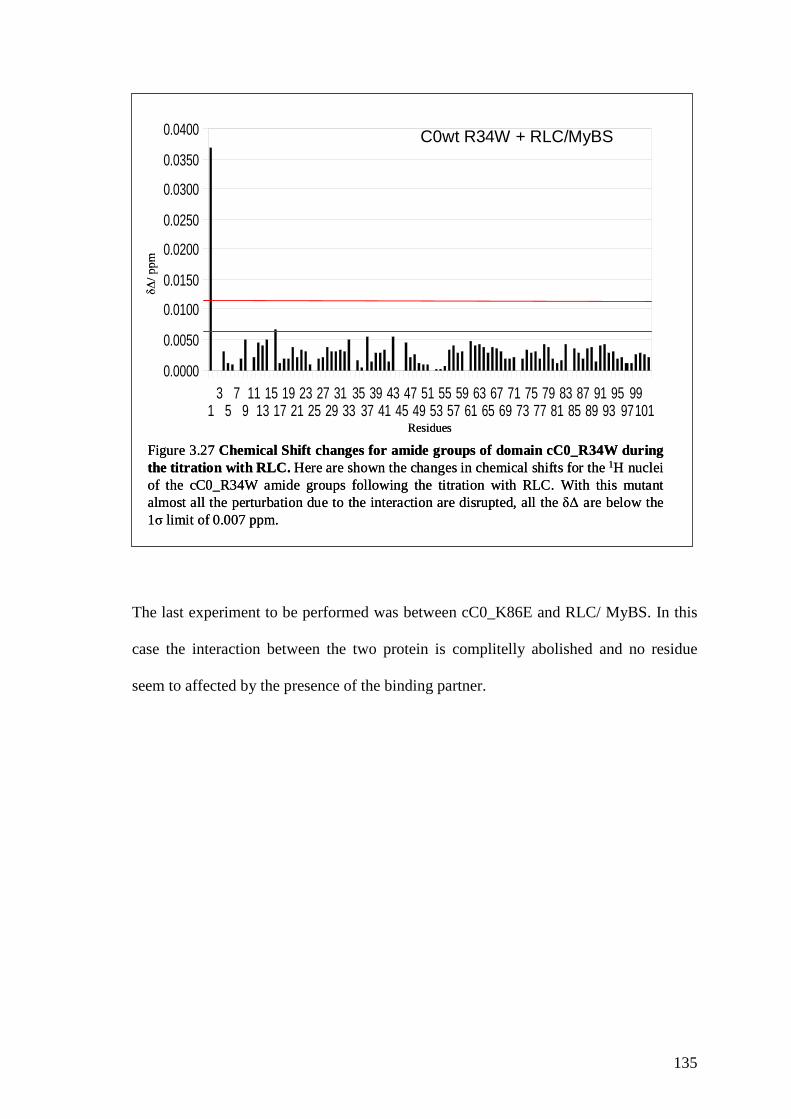
135
13
57
911
1315
1719
2123
2527
2931
3335
3739
4143
4547
4951
5355
5759
6163
6567
6971
7375
7779
8183
8587
8991
9395
9799101
0.0000
0.0050
0.0100
0.0150
0.0200
0.0250
0.0300
0.0350
0.0400 C0wt R34W + RLC/MyBSδ∆
/ pp
m
Residues
Figure 3.27 Chemical Shift changes for amide groups of domain cC0_R34W during the titration with RLC. Here are shown the changes in chemical shifts for the 1H nuclei of the cC0_R34W amide groups following the titration with RLC. With this mutant almost all the perturbation due to the interaction are disrupted, all the δ∆ are below the 1σ limit of 0.007 ppm.
13
57
911
1315
1719
2123
2527
2931
3335
3739
4143
4547
4951
5355
5759
6163
6567
6971
7375
7779
8183
8587
8991
9395
9799101
0.0000
0.0050
0.0100
0.0150
0.0200
0.0250
0.0300
0.0350
0.0400 C0wt R34W + RLC/MyBS
13
57
911
1315
1719
2123
2527
2931
3335
3739
4143
4547
4951
5355
5759
6163
6567
6971
7375
7779
8183
8587
8991
9395
9799101
0.0000
0.0050
0.0100
0.0150
0.0200
0.0250
0.0300
0.0350
0.0400 C0wt R34W + RLC/MyBSδ∆
/ pp
m
Residues
Figure 3.27 Chemical Shift changes for amide groups of domain cC0_R34W during the titration with RLC. Here are shown the changes in chemical shifts for the 1H nuclei of the cC0_R34W amide groups following the titration with RLC. With this mutant almost all the perturbation due to the interaction are disrupted, all the δ∆ are below the 1σ limit of 0.007 ppm.
The last experiment to be performed was between cC0_K86E and RLC/ MyBS. In this
case the interaction between the two protein is complitelly abolished and no residue
seem to affected by the presence of the binding partner.

136
13
57
911
1315
1719
2123
2527
2931
3335
3739
4143
4547
4951
5355
5759
6163
6567
6971
7375
7779
8183
8587
8991
9395
9799101
0.0000
0.0050
0.0100
0.0150
0.0200
0.0250
0.0300
0.0350
0.0400C0wt K86E + RLC/MyBS
δ∆/
ppm
Residues
Figure 3.28 Chemical Shift changes for amide groups of domain cC0_K86E during the titration with RLC/ MyBS. Here are shown the changes in chemical shifts for the 1H nuclei of the cC0 amide grups following the titration with RLC/ MyBS. The interaction between the two proteins is completely disrupted and no δ∆is observed for any residue, as expected for a mutation of this kind, where a positively charged residue is substituted by a negatively charged amino acid.
13
57
911
1315
1719
2123
2527
2931
3335
3739
4143
4547
4951
5355
5759
6163
6567
6971
7375
7779
8183
8587
8991
9395
9799101
0.0000
0.0050
0.0100
0.0150
0.0200
0.0250
0.0300
0.0350
0.0400C0wt K86E + RLC/MyBS
13
57
911
1315
1719
2123
2527
2931
3335
3739
4143
4547
4951
5355
5759
6163
6567
6971
7375
7779
8183
8587
8991
9395
9799101
0.0000
0.0050
0.0100
0.0150
0.0200
0.0250
0.0300
0.0350
0.0400C0wt K86E + RLC/MyBS
δ∆/
ppm
Residues
Figure 3.28 Chemical Shift changes for amide groups of domain cC0_K86E during the titration with RLC/ MyBS. Here are shown the changes in chemical shifts for the 1H nuclei of the cC0 amide grups following the titration with RLC/ MyBS. The interaction between the two proteins is completely disrupted and no δ∆is observed for any residue, as expected for a mutation of this kind, where a positively charged residue is substituted by a negatively charged amino acid.
The expertiments with the mutants confirmed that the interaction between cC0 and RLC
does in fact happen and that the residues perturbed are the one that take part in the
interaction.
3.1.9 Actin Binding Assay
It has been suggested by different researchers that MyBPC might interact with
actin, some think that the interaction would occur via a proline rich sequence that is
located in the linker between cC0 and cC1 (Squire et al., 2003), which constitutes the
N-terminus of the protein in non- cardiac isoforms, while others have pointed at domain
cC0 as the binding partner of actin (Kulikovskaya et al., 2003). To understand better the

137
situation, an actin binding assay was performed, as described in the material and
methods section.
The intent was to repeat this experiment for different groups of domains, cC0-2, cC1-2
and cC0 alone. The first preliminary experiment was performed with cC0, to understand
if the protein would in fact interact with F-actin. A protein, MS1 (Arai et al., 2002), was
used as a control as it has been shown to give a positive result at the actin binding assay.
The concentration of the three stock solutions used to perform this assay are:
[Actin]= 314 µM, [cC0]= 183 µM and [MS1]= 373 µM
This reaction was performed using a total volume of 1ml; the final concentrations of the
three proteins is 50 µM for actin and MS1, while it was a bit higher at 61 µM for cC0.
1 2 3 4 5
Actin - - 159 µl 159 µl 159 µl
cC0 333 µl - - 333 µl -
MS1 - 134 µl - - 134 µl
Buffer 667 µl 866 µl 841 µl 508 µl 707 µl
Table 2.7: sample composition of the solutions used in the Actin Binding cosedimentation assay
After ultracentrifugation for 30 minutes at 4°C, an SDS-PAGE gel of the supernatant
and the pellet was run, as described in the material and methods. The result show the
behaviour of the three proteins on their own and then combined. From the SDS-PAGE
picture is clear that both cC0 and MS1 do not tend to sediment during
ultracentrifugation as they are not present in the pellet fraction, lanes 3 and 5 in the
picture, while being present in lanes 2 and 4, corresponding to the supernatant fractions,
they have a tendency for staying in solution.

138
Figure 3.29 Actin binding assay. In lane 1 is reported the marker. Lanes with even number show the supernatant of the different samples, while lanes with odd number show the pellet. Lane 2 and 3 show the supernatant and the pellet when performing the ultracentrifugation with cC0 alone; lanes 4 and 5 show the muscle protein MS1, used in this case as a control; both proteins do not precipitate after ultracentrifugation. Lanes 6 and 7 show, on the other hand, actin behavior, almost all of the protein sediment after ultracentrifugation. Lanes 8 and 9 show that when cC0 undergoes ultracentrifugation do not co-sediment with actin, as MS1, that is shown in lanes 10 and 11. this means that cC0 does not bind to actin.
1 2 3 4 5 6 7 8 9 10 11
3.5
6.0
14.4
21.5
31.5
36.5
55.4
1 2 3 4 5 6 7 8 9 10 11
3.5
6.0
14.4
21.5
31.5
36.5
55.4
3.5
6.0
14.4
21.5
31.5
36.5
55.4
Actin, on the other hand, sediments, as it is evident from lanes 6 and 7 that show that
the major part of actin goes in the pellet and just a small fraction is present in the
supernatant. When cC0 is combined with actin it does not shows the same behaviour of
MS1, it is present only in the supernatant meaning that do not interact with actin as in
this case the protein would co-sediment with actin and would be present in the pellet.
From this result it was possible to conclude that cC0 does not bind to actin.

139
3.2 Discussion
3.2.1 Structural features of domain cC0
The structure of domain cC0 conforms to the IgI fold (Harpaz and Chothia, 1994)
typical of the majority of MyBPC domains, being formed by a β-sandwich composed of
two β-sheets, ABED and C’CFGA’ respectively. Also the C’ strand whose presence has
caused controversy in the past (Mayans et al., 2001), is observed in this domain, as it is
in the structures of domains cC1 (Ababou et al., 2008) and cC2 (Ababou et al., 2007),
and seems to be a recurring feature in MyBPC domains. The hydrophobic core of the
protein is well defined by the aromatic residues Trp41, which is highly conserved
through species and is central to the domain stability, Tyr54 and Tyr78, the latter being
also involved in the tyrosine corner (Hemmingsen et al., 1994), another characteristic
feature of these domains, and Phe11, Phe28 and Phe89. Other hydrophobic residues
positioned in the core of the protein and, as such considered of great importance for the
protein to maintain its fold, are Ile48, Leu56, Leu65 and Leu91. Domain cC0 sequence
appears to be well conserved between species, being unique to the cardiac isoform it
was not possible to perform a comparison between isoforms, as usually done for the
other domains studied so far. All the residues involved in the hydrophobic core of the
protein appear to be well conserved, with Leu56 being the only one substitute by Ile in
the chicken cardiac isoform.

140
Figure 3.30 Sequence alignment of domain cC0. The domain appear to be well conserved through species. The residues localised in the hydrophobic core of the protein, Trp41, Tyr54, Tyr78, Phe11, Phe28, Phe89,Ile48, Leu56, Leu65 and Leu91, that are responsible for the three dimensional structure of the protein are clearly conserved as is Asp74 involved in the formation of the tyrosine corner. Picture generated with the program Jalview.
Figure 3.30 Sequence alignment of domain cC0. The domain appear to be well conserved through species. The residues localised in the hydrophobic core of the protein, Trp41, Tyr54, Tyr78, Phe11, Phe28, Phe89,Ile48, Leu56, Leu65 and Leu91, that are responsible for the three dimensional structure of the protein are clearly conserved as is Asp74 involved in the formation of the tyrosine corner. Picture generated with the program Jalview.
Strand A is composed of a very short β-sheet that does not form a proper strand
antiparallel to the B strand as just one hydrogen bond can be formed between Lys13 and
Glu31. The β bulge, a disruption of the regular hydrogen bonding of a β-sheet usually
achieved by insertion of residues with helical dihedral angles (Richardson et al., 1978),
seems to be a reoccurring feature of IgI domains and it is present in all other three
MyBPC domains whose structure has being determined so far, being grossly enlarged in
domain cC5 (Idowu et al., 2003). It appears that the β bulge is conserved in
immunoglobulin domains as it helps dimerization and, as such, it is present in cMyBPC
domains as an inherited feature with no apparent function as cMyBPC does not seem to
dimerize. Domains cC0, cC1 and cC2 all show a phenylalanine residue at the N-
terminus, in a poorly structured part of the protein, that is involved in the formation of
the β bulge. Other human cMyBPC domains show the same kind of pattern, with an
aromatic residue, either phenylalanine or tyrosine, positioned at the N-terminus, a fact
that might suggest that more IgI domains of cMyBPC will present this feature in their
structure. On the other hand, this is not true for domain cC5 that has a characteristically

141
enlarged β bulge. It is possible that the presence of an aromatic residue that anchors the
N-terminus of the protein to its hydrophobic core is an important aspect of IgI domains
structures.
Figure 3.31 β-bulge. In this picture is well visible the β-bulge localised in the N-terminus of domain cC0. The residues involved in the formation if the β-bulge are Lys13 and Glu31 that form hydrogen bonds with one another. Ser12 is positioned at the beginning of the β-bulge and is characterised by dihedral angles typical of residues localised in an α- helix, causing the bend to form. Picture generated with the program Pymol (Delano Scientific).
Figure 3.31 β-bulge. In this picture is well visible the β-bulge localised in the N-terminus of domain cC0. The residues involved in the formation if the β-bulge are Lys13 and Glu31 that form hydrogen bonds with one another. Ser12 is positioned at the beginning of the β-bulge and is characterised by dihedral angles typical of residues localised in an α- helix, causing the bend to form. Picture generated with the program Pymol (Delano Scientific).
Figure 3.31 β-bulge. In this picture is well visible the β-bulge localised in the N-terminus of domain cC0. The residues involved in the formation if the β-bulge are Lys13 and Glu31 that form hydrogen bonds with one another. Ser12 is positioned at the beginning of the β-bulge and is characterised by dihedral angles typical of residues localised in an α- helix, causing the bend to form. Picture generated with the program Pymol (Delano Scientific).
The tyrosine corner is also present in many IgI structures, being absent only in domain
cC1 of cMyBPC, and, in domain cC0, is caused by the formation of an hydrogen bond
between the –OH group positioned on the aromatic ring of Tyr78 and the carboxyl
group on the sidechain of Asp 74. The distance between the two atoms involved
resulted being 3.84Ǻ, compatible with the formation of an hydrogen bond between the
two. The Tyr corner (Hemmingsen et al., 1994) is a conformation in which a tyrosine
near the beginning or the end of an antiparallel -strand makes an hydrogen bond from
its side-chain -OH group to the backbone NH and/or CO of residue Y – 4 (4 Tyr
corner). Y-2 is almost always a glycine, which helps the backbone curve around the Tyr

142
ring, residue Y - 3 is usually a proline and Y - 5 is an hydrophobic residue, in this case
it is an alanine, that packs next to the tyrosine ring.
Figure 3.32 Aromatic residues at the core of domain cC0. All the aromatic residues are part of the hydrophobic core of the protein and contribute to the three dimensional structure of domain cC0. The Trp41 residue is vital to the domain stability and is positioned in the centre of the hydrophobic core. Picture generated with the program Pymol (Delano Scientific).
Figure 3.32 Aromatic residues at the core of domain cC0. All the aromatic residues are part of the hydrophobic core of the protein and contribute to the three dimensional structure of domain cC0. The Trp41 residue is vital to the domain stability and is positioned in the centre of the hydrophobic core. Picture generated with the program Pymol (Delano Scientific).
The CD loop tends to be the longest loop in MyBPC IgI domains and usually
accommodates additional elements of secondary structure, like C’ strands, found in cC0
and cC2, or α helical turns, as in domain cC1; the CD loop found in the central domain
cC5 is even more peculiar as it is 40 residues long, compared to the 12-15 residues that
form this loop in domains cC0, cC1 and cC2, and it contains the 28 amino acid insertion
that makes the cardiac isoform of cC5 so unique. This loop is thought to play an
important role in protein function, especially when it shows aromatic residues, as in cC1
and cC5, the latter also posses a Pro- rich region that could contribute to the domain
function too (Idowu et al., 2003). The CD loop of domain cC1 comprises a tryptophan

143
residue (Trp196) that is affected by the interaction with the S2∆ fragment (Ababou et
al., 2008). The CD loop of domain cC0 is probably not involved in a protein interaction
as it does not show any of these features.
Figure 3.33 Electrostatic surface of domain cC0. The two images show two different orientations of domain cC0. Positive residues are colored in blue while negative residues are colored in red. It is evident how it is possible to identify a positive region and a negative region. There are in fact four Lysines (Lys5, Lys6, Lys13 and Lys14) positioned towards the N-terminus of the domain, while other two Lysines (Lys86 and Lys88) are close to the C-terminus of cC0 but in the three dimensional structure these four residues end up close to each other, forming a positive surface that might be important for the function of the domain and might be involved in protein-protein interaction. Picture generated with the program Pymol (Delano Scientific llc.).
N-terminusN-terminus
N-terminusN-terminus
Apart from the short strand A positioned in the β-bulge, the N-terminus of cC0, which
comprises resides 1-11, is highly unstructured; this is the only poorly defined part of the
domain, as shown in figure 3.8 where a family of the first 20 structures is shown. This
could be an important aspect linked to cC0 function as the N-terminus could be able to
reach out to interact with another muscle protein component; this hypothesis is also
supported by the presence of three proline residues, Pro1, Pro2 and Pro7, that might be
involved in protein- protein interaction. This region also contains two of the five

144
positively charged residues localised at the N-terminus of the protein, indicating a
second possible way of interaction via charged amino acids.
The electrostatic surface for domain cC0 was determined using the program Pymol amd
is shown in picture 3.30: as expected on analyzing the sequence, domain cC0 shows an
excess of positive charges, especially on the N-terminus side of the protein, as six
Lysine residues, Lys5, Lys6, Lys13, Lys14, Lys86 and Lys88 are close in space in the
structure. Another positively charged residue positioned in the vicinity is Arg16, which
is located right at the end of the β-bulge. On the other hand the residues positioned at
the C-terminus of the protein are predominantly negative, hence the red patch visible in
the picture. Interestingly, two of the three HCM mutations found in this domain appear
to involve charged residues, either mutating a charged residue to an uncharged one, as
in Arg34Trp, or vice versa to mutate an uncharged residue to a charged one, as the case
of Gly4Arg. Both these mutations could affect the binding of cC0 through electrostatic
interaction, causing the onset of the disease.
A search using the DALI server (Holm and Park, 2000) was performed to identify the
proteins with the most similar structure to cC0 present in the Protein Data Bank; the
best fit are reported in the table below.
# Protein Pdb entry z-score RMSD Sequence % identity
1 sSk MyBPC, domain C2 2yxm 14 1.9 27 2 Titin 27th domain 1waa 14 1.9 28 3 Obscurin 32nd domain 2yz8 13.3 1.8 26 4 Obscurin 35th domain 2edt 13.1 2.2 25 5 Obscurin 39th domain 2edl 12.7 3.9 25 6 cMyBPC, domain cC1 2v6h 12.7 1.9 27 7 sSk MyBPC, domain C3 1x44 12.4 2.8 21 8 sSk MyBPC, domain C1 2dav 12.1 2.3 20 9 sSk MyBPC, domain C4 2yuz 11.9 2.4 16
Table 3.6: DALI results. Proteins with the most similar structure to domain cC0 within the Protein Data Bank.

145
Figure 3.34 Sequence alignment of the top five structures identified by the DALI server.The sequence of domain cC0 is aligned with that of domain C1 of the slow skeletal isoform (sSkMyBPC, C1), domain 27 of Titin (Titin 27), domains 32 and 39 of Obscurin (Obscurin32 and Obscurin39) and domain C1 of the cardiac isoform of MyBPC (cMyBPC, C1). the most conserved residues are the ones essential for the domains to adopt their structure, hence the majority of the conserved residues are hydrophobic, with three aromatic residues, one tryptophan and two tyrosines, being highly conserved in the six domains. On the other hand, charged residues, that tend to be positioned on the surface and be involved in protein- protein interaction, do not show a high degree of conservation, as expected. Picture generated with the program Jalview.
Figure 3.34 Sequence alignment of the top five structures identified by the DALI server.The sequence of domain cC0 is aligned with that of domain C1 of the slow skeletal isoform (sSkMyBPC, C1), domain 27 of Titin (Titin 27), domains 32 and 39 of Obscurin (Obscurin32 and Obscurin39) and domain C1 of the cardiac isoform of MyBPC (cMyBPC, C1). the most conserved residues are the ones essential for the domains to adopt their structure, hence the majority of the conserved residues are hydrophobic, with three aromatic residues, one tryptophan and two tyrosines, being highly conserved in the six domains. On the other hand, charged residues, that tend to be positioned on the surface and be involved in protein- protein interaction, do not show a high degree of conservation, as expected. Picture generated with the program Jalview.
3.2.2 Characterization of the interaction between domain cC0 and the Regulatory
Light Chain of Myosin
The preliminary results obtained via Differential Scanning Calorimetry showed that
domain cC0 was interacting with the miniHMM fragment of Myosin, as well as
domains cC1 and cC2 (data not shown); it has since been demonstrated that these two
cMyBPC domains interact with the S2∆ fragment of myosin that is part of miniHMM,
cC1 close to the junction between the myosin rod and the neck region of the myosin
head (Ababou et al., 2008) and cC2 more towards the rod region of Light MeroMyosin
(LMM) (Ababou et al., 2007) using both NMR spectroscopy and site directed
mutagenesis investigation. Using DSC our collaborator at King’s College was able to
narrow down the binding partner of domain cC0, showing that the interaction occurred
with the Regulatory Light Chain of myosin. These results were both confirmed using
1H/15N HSQC NMR spectroscopy on 15N labelled samples of domain cC0 with both

146
miniHMM and RLC. No structure of human cardiac RLC is at present available in the
Protein Data Bank, however a model of the structure of the RLC was produced using
the Swiss Model server (Arnold et al., 2006) based on the deposited structure obtained
from bay scallop [Aequipecten Irradians] (Swiss Prot: P13543; PDB code: 1qvi) that
resulted having a sequence identity of 41% with that of the human ventricular isoform
used in this research (Swiss Prot: Q14908).
Figure 3.35 Sequence alignment of human cardiac for AequipectenIrradians (bay scallop) isoforms of RLC. The bay scallop isoform of RLC is the only one for which the three dimensional structure has been determined so it was used as a structure template to model the possible structure of human cardiac RLC, of which no structure is available in the Protein Data Bank. The two proteins resulted having a sequence identity of 41%. Picture generated with Jalview.
Figure 3.35 Sequence alignment of human cardiac for AequipectenIrradians (bay scallop) isoforms of RLC. The bay scallop isoform of RLC is the only one for which the three dimensional structure has been determined so it was used as a structure template to model the possible structure of human cardiac RLC, of which no structure is available in the Protein Data Bank. The two proteins resulted having a sequence identity of 41%. Picture generated with Jalview.
The model structure obtained in this way is reported in figure 3.31. The regulatory light
chain is a member of the superfamily of EF-hand Ca2+ binding protein, even thought it
has lost its ability to bind to Ca2+ in sites 2, 3 and 4 (Moncrief et al., 1990) and presents
only one high affinity binding site at the N-terminus (Reinach et al., 1986), between
residues 37 and 48 (Szczesna et al., 2001), shown in red in the insert of picture 3.33. It
also has a phosphorylation site (S15) at the N-terminus of the protein not visible in the
model as not defined in the pdb file deposited, being positioned in a poorly structured
region not detected by x-ray crystallography.

147
N-terminus
C-terminus
Figure 3.36 Model of human cardiac RLC. This model of RLC was obtained using the program SWISS MODEL and is based on the 3D strcuture of the bay scallop RLC determined by X-ray crystallography (pdb: 1qvi). In the insert is shown a different orientation that makes the Ca2+ binding site more evident; the amino acids involved in Ca2+
binding, comprised between residues Asp37 and Asp48, are shown in red in the structure. Picture generated with Pymol (DeLano Scientific).
From the experimental results based on a titration of RLC in a sample of 15N labelled
cC0 followed by 1H/15N HSQC NMR spectroscopy, it was possible to identify the
residues involved in the interaction and map them on cC0 structure.
A region towards to N-terminus of the protein is clearly affected by the incremental
additions of RLC, suggesting that these residues are involved in the interaction.

148
R34
F11
K14
R16S17
K86
K88
V37
S46F89
Figure 3.24 Result of the cC0+RLC titration. A main area of cC0 comprising residues Phe11, Lys14, Arg16 Ser17, Lys86, Lys88 and Phe89 resulted affected by the presence of the RLC in solution. Also residues Arg34, Val37 and Ser46, the last two being positioned at the back of the domain, were affected by the titration. Picture generated with Pymol (DeLano Scientific llc.)
R34
F11
K14
R16S17
K86
K88
V37
S46F89
R34
F11
K14
R16S17
K86
K88
V37
S46F89
Figure 3.24 Result of the cC0+RLC titration. A main area of cC0 comprising residues Phe11, Lys14, Arg16 Ser17, Lys86, Lys88 and Phe89 resulted affected by the presence of the RLC in solution. Also residues Arg34, Val37 and Ser46, the last two being positioned at the back of the domain, were affected by the titration. Picture generated with Pymol (DeLano Scientific llc.)
Within the residues most affected by the addition of RLC are Phe11, Lys14, Arg16,
Ser17, Lys86, Lys88 and Phe89 that form a sort of interaction surface clearly visible in
the above figure. Interestingly the two residues involved in the β-bulge, Ser12 and
Lys13, are not affected by the presence of the RLC, even though they are positioned
very closed the two residues that show the biggest shifts in the 1H/15N HSQC spectra,
Lys14 and Arg16. Also residue Arg34 that when mutated to Tryptophan causes HCM,
seems to be affected by the presence of RLC, as confirmed by the mutogenesis studies
carried out: Arg34, together with residues Val37 and Ser46, is positioned on the back
surface of the domain. The two N-terminal lysine residues, Lys5 and Lys6, do not show
any change in peak position during the titration, so it is unlikely that the mutation

149
Gly4Arg could cause HMC due to interference in the cC0-RLC interaction, as shown by
the experiment carried out with the mutant cC0_G4R that showed a total diminished
interaction with the RLC. . Given the nature of the residues that resulted more affected
by the titration, it is very likely that this interaction would happen via electrostatic
interface between the two proteins, this hypothesis being based also on the observation
that the RLC has an excess of negative charge, while cC0, on the contrary, posses more
positive charged residues in its sequence, as visible in figure 3.32 where the electrostatic
surfaces for the RLC model are shown, as obtained with the program Pymol.
N-terminus N-terminus
Figure 3.37 Electrostatic surface of RLC. This result is based on the RLC model obtained with Swiss Model. From the picture it seems that an excess of negative charged residues, colored in red, are present on the RLC surface, making it probable that the interaction with cC0 might happen via electrostatic interaction. In the big space in the centre it is visible the myosin binding site. In the picture myosin filament is represented in section by the yellow shape. Picture generated with Pymol (DeLano Scientific).
Myosin
N-terminus N-terminus
Figure 3.37 Electrostatic surface of RLC. This result is based on the RLC model obtained with Swiss Model. From the picture it seems that an excess of negative charged residues, colored in red, are present on the RLC surface, making it probable that the interaction with cC0 might happen via electrostatic interaction. In the big space in the centre it is visible the myosin binding site. In the picture myosin filament is represented in section by the yellow shape. Picture generated with Pymol (DeLano Scientific).
MyosinMyosin
The big clef in the middle is occupied my the myosin molecule, shown in yellow in the
figure. A possible binding site for domain cC0 is the external surface on the N-terminus
lobe of the protein, characterised by the presence of a negative charged residues patch.
However, no HCM mutations were found in this region to confirm this hypothesis.

150
3.2.3 Hypertrophic CardioMyopathy (HCM) missense mutations in domain cC0 of
cMyBPC
As alredy mentioned, three HCM missense mutations have been identified in domain
cC0: G4R (Van Driest et al., 2004), R34W (http://genepath.med.harvard.edu/~seidman/cg3/)
and T58A (Niimura et al., 2002). G4R is reported in one single case in association with
a second mutation, R502W found in domain cC3, with an age onset of 20.7±11 years
and a left ventricular wall thickness (LVWT) of 25.2±12 mm; the phenotype resulted
being quite severe as in all the combined mutations analysed in the reported study (Van
Driest et al., 2004). Mutation T58A, on the other hand, showed a mild phenotype,
causing HCM in elderly patients with an average age of onset of 56±13.2 years and a
LVWT of 22.7±5.5 mm. For the third mutation no published report was found apart
from the direct submission to the HCM mutation database so anything is at present
known on the clinical effects of this mutation.
Mapping the mutation on cC0 three dimensional structure it was evident how all these
three residues are localised on the surface of the protein (Figure 3.38), probably causing
disease when mutated by interfering with protein- protein interaction; no hydrophobic
residue central to the domains stability resulted being mutated suggesting that the fold
of the domain is not affected by HCM mutations identified so far.
Arg34 is also one of the residues affected by the RLC titration, and it has been shown in
the present work that the mutation R34W disrupts the electrostatic interaction taking
place between the two binding partner; unfortunately, being absent any reference to
clinical observation concerning this mutation, it is not possible to have a clear idea of
the mutation severity, that one could be inclined to assume as severe, based on the
nature of mutation itself.

151
G4R
R34W T58A
Figure 3.38 HCM missense mutations of domain cC0. Three HCM missense mutations have been identified so far in domain cC0: G4R, R34W and T58A. All there three residues are positioned on the surface of the domain and take probably part in protein- protein interaction. No residue important for the three dimensional structure of the protein resulted being mutated, suggesting that the fold of the domain is not affected by HCM mutations identified so far.
G4R
R34W T58A
G4R
R34W T58A
Figure 3.38 HCM missense mutations of domain cC0. Three HCM missense mutations have been identified so far in domain cC0: G4R, R34W and T58A. All there three residues are positioned on the surface of the domain and take probably part in protein- protein interaction. No residue important for the three dimensional structure of the protein resulted being mutated, suggesting that the fold of the domain is not affected by HCM mutations identified so far.
The third mutation Thr58Ala was not studied through mutogenesis due to the mild
phenotype shown by this mutation and also because of the fact that in the majority of
species the cardiac isoform of cC0 presents an Ala in position 58 and not a Thr as in the
human isoform. For this reason it is improbable that this mutation could cause a loss in
stability of the domain or a diminished interaction with another sarcomeric protein.
3.2.4 Model of the incorporation of cMyBPC N-terminus in the sarcomere
It has been shown (Ababou et al., 2007; Ababou et al., 2008) that domains cC1 and cC2
bind to the S2∆ fragment of myosin, which comprises residues from 838 to 936, domain
cC1 at the N-terminus of S2∆, towards the hinge region of myosin, and cC2 very close

152
to cC1 a bit toward the C-terminus of the fragment. The long linker between the two
domains containing the three phosphorylation sites, is proposed as running parallel to
the myosin heavy chain forming a sort of U shape, from domain cC1 to domain cC2.
This place cC1 close to the hinge and the regulatory light chains. Domain cC0 has been
shown to interact with the regulatory light chain and to do so through its N-terminal
surface, on the other hand, domain cC1 is shown to interact with S2∆ via its C-terminal
surface, suggesting that these two domains could be positioned obliquely linking the
myosin rod and the regulatory domain. It has been suggested that cC0 (Kulikovskaya et
al., 2003), or more probably the linker between cC0 and cC1 (Squire et al., 2003), could
interact with actin and this could happen stretching this part of MyBPC to reach for
actin, possibly when the interaction between the N-terminus of MyBPC and the light
chain is abolished.
It is clear how cMyBPC would be capable of regulating muscle contraction from this
position, potentially adjusting the position of the S1 myosin head through its interaction
with the regulatory light chain. It is probable that the phosphorylation of cMyBPC sites
positioned in the linker does not cause dissociation of the N-terminus of the protein
from myosin; the dissociation of the linker and domain cC2 from their position assumed
in the un-phosphorylated form could be sufficient to allow the S1 myosin head to reach
for actin causing muscle contraction.

153
Figure.3.39 Model of the interaction between the N-terminus of cMyBPC and Myosin. a) Domain cC0 interacts through its N-terminus surface with the regulatory light chain of myosin; domain cC1 has been shown to interact through its C-terminus in the hinge region between S2 and S1 while domain cC2 interacts with S2 a bit far off the hinge region. The long linker between cC1 and cC2 that contains the three phosphorylation sites, runs parallel to S2. b) Based of the observation that the interaction between cC0 and the miniHMM is stronger than the interaction with RLC alone, it is possible to hypothesize that cC0 could interact with two molecules of RLC instead of one.This hypothesis is based on NMR and mutagenesis studies (Ababou et al., 2007; Ababou et al., 2008) and on the results obtained with the resent research.
S2
RLC ELC
ELC
RLC
S1
cC0
cC2
cC1
S1
S2
RLCELC
ELC
RLC
S1
cC0
cC2
cC1
S1
a)
b)
Figure.3.39 Model of the interaction between the N-terminus of cMyBPC and Myosin. a) Domain cC0 interacts through its N-terminus surface with the regulatory light chain of myosin; domain cC1 has been shown to interact through its C-terminus in the hinge region between S2 and S1 while domain cC2 interacts with S2 a bit far off the hinge region. The long linker between cC1 and cC2 that contains the three phosphorylation sites, runs parallel to S2. b) Based of the observation that the interaction between cC0 and the miniHMM is stronger than the interaction with RLC alone, it is possible to hypothesize that cC0 could interact with two molecules of RLC instead of one.This hypothesis is based on NMR and mutagenesis studies (Ababou et al., 2007; Ababou et al., 2008) and on the results obtained with the resent research.
S2
RLC ELC
ELC
RLC
S1
cC0
cC2
cC1
S1
S2
RLCELC
ELC
RLC
S1
cC0
cC2
cC1
S1
S2
RLC ELC
ELC
RLC
S1
cC0
cC2
cC1
S1
S2
RLC ELC
ELC
RLC
S1
ELC
RLC
S1
cC0
cC2
cC1
S1
S2
RLCELC
ELC
RLC
S1
cC0
cC2
cC1
S1
S2
RLCELC
ELC
RLC
S1
cC0
cC2
cC1
S1
a)
b)
It is possible that upon phosphorylation the linker and domain cC2 would dislodge from
myosin, while the N-terminus could remain attached, influencing the myosin head
position during cross bridge formation. This would also facilitate domain cC2 and the
linker to re-attach to S2 after de-phosphorylation, making S1 to go back to its resting

154
position. In this model, the N-terminus of cMyBPC is always attached to the myosin
head region whose freedom of movement is adjusted by phosphorylation of the cC1-
cC2 linker. This could be a valid way for regulating actomyosin interaction and, hence,
muscle contraction.
cC0cC2
cC3cC5
cC6cC10
cC0cC1
cC3cC5cC6cC10
cC2
+ PO4
Figure 3.40 Model of a possible interaction between cMyBPC and myosin. Fragment cC0cC2 binds close to the myosin head, cC0 to the RLC and cC1 close to the hinge. Upon phosphorylation the linker between cC1 and cC2 dislodge from myosin S2, while cC0 and cC1 stay attached close to myosin S1. In this way myosin would be able to reach out and interact with actin. Upon de-phosphorylation of the three sites positioned in the linker domain cC2 re-associate with myosin S2, as well as the linker that runs on its surface. This could be the way cMyBPC might regulate muscle contraction through phosphorylation. Myosin is shown in yellow, actin in blue and cMyBPC is red, with the phosphorylation sites highlighted as blue dots in the cC1-cC2 linker.
cC0cC2
cC3cC5
cC6cC10
cC0cC1
cC3cC5cC6cC10
cC2
+ PO4cC0cC2
cC3cC5
cC6cC10
cC0cC1
cC3cC5cC6cC10
cC2
+ PO4
Figure 3.40 Model of a possible interaction between cMyBPC and myosin. Fragment cC0cC2 binds close to the myosin head, cC0 to the RLC and cC1 close to the hinge. Upon phosphorylation the linker between cC1 and cC2 dislodge from myosin S2, while cC0 and cC1 stay attached close to myosin S1. In this way myosin would be able to reach out and interact with actin. Upon de-phosphorylation of the three sites positioned in the linker domain cC2 re-associate with myosin S2, as well as the linker that runs on its surface. This could be the way cMyBPC might regulate muscle contraction through phosphorylation. Myosin is shown in yellow, actin in blue and cMyBPC is red, with the phosphorylation sites highlighted as blue dots in the cC1-cC2 linker.
It is also possible that due to presence of the linker between cC1 and cC2, one molecule
of cMyBPC could interact with more than one molecule of myosin, as shown in figure
3.36. while cC2 interacts with the C-terminal region of S2∆, the cC1-cC2 linker could
be extended to allow cC1 and cC0 with S2∆ and RLC of the neighnouring myosin
molecule.

155
cC0cC1
Figure 3.41 Possible model of interaction between cMyBPC and Myosin. In this model a molecule of cMyBPC is shown to interact with two molecules of myosin, with domain cC2-cC10 interacting with one molecule and N-terminus, formed by domaindcC0 and cC1, interacts with another. This hypothesis is possible due to the presence of the cC1-cC2 linker that could be stretched to allow MyBPC the mobility needed for this kind of interaction.
cC3cC5
cC2
cC6cC10
cC0cC1
Figure 3.41 Possible model of interaction between cMyBPC and Myosin. In this model a molecule of cMyBPC is shown to interact with two molecules of myosin, with domain cC2-cC10 interacting with one molecule and N-terminus, formed by domaindcC0 and cC1, interacts with another. This hypothesis is possible due to the presence of the cC1-cC2 linker that could be stretched to allow MyBPC the mobility needed for this kind of interaction.
cC3cC5
cC2
cC6cC10
In conclusion it is possible that cMyBPC could have two different functions, a
regulatory function localised in its N-terminus and mediated by the interactions that
have been shown taking place between domains cC0 and the RLC and domain cC1 with
S2 close to the hinge between the S1 and S2 domains of myosin; a structural function is
probably achieved by the C-terminal domains that bind to LMM coiled-coil region of
myosin.

156
3.2.5 Conclusions
NMR spectroscopy was used to determine the three dimensional structure of the cardiac
specific domain cC0 of cMyBPC, a part of this protein that has been poorly investigated
in the past and of which little was known. The structure determined as part of this
research work has confirmed that domain cC0 is a member of the IgI class of proteins
and it shows a well defines structure with many of the characteristic features of this type
of molecules. Moreover, the data obtained during this research confirmed the
hypothesised interaction between cC0 and the Regulatory Light Chain (RLC) of
myosin, thus placing the N-terminus of the protein in proximity of the motor domain of
myosin, as suggested by the studies carried out on domains cC1 and cC2 (Ababou et al.,
2007; Ababou et al., 2008), and it was confirmed by the results of the mutagenesis
studies. In conclusion, this research has offered new insight on how cMyBPC
incorporate in the sarcomere and how it could contribute to the regulation of muscle
contraction.
157
Chapter 4
Study of the interaction between domains cC5 and cC8 of cMyBPC
4.1 Results
As discussed in the general introduction, it has been suggested that domains cC5 and
cC8 of the cardiac isoform of MyBPC might interact with each other. This hypothesis
was based on yeast two hybrid assay results (Moolman-Smook et al., 2002). One of the
goals of my research was to confirm this result using NMR spectroscopy, taking
advantage of the fact that the structure of domain cC5 has been determined few years
ago (Idowu et al., 2003). It would have been possible, then, to map the cC5 surface
involved in the interaction with cC8.
4.1.1 cC5 protein expression and purification
Expression and purification of domain cC5 was easy to perform, for both labelled and
unlabelled samples. The DNA sequence coding for cC5 has been cloned in vector pET-
8C and then inoculated in E. Coli host cells BL21 STAR (DE3) (from Invitrogen). The
domain was expressed in M9 medium, enriched with 15N to produce singularly labelled
samples in order to perform a titration following the changes in 1H/15N HSQC spectra,
giving a yield around 10 mg/l. The protein was cloned such as it presents a hexa-
histidine tag at the N-terminus, to allow purification by Immobilized Metal ion affinity
chromatography (IMAC), further purification was then achieved by size exclusion
chromatography.
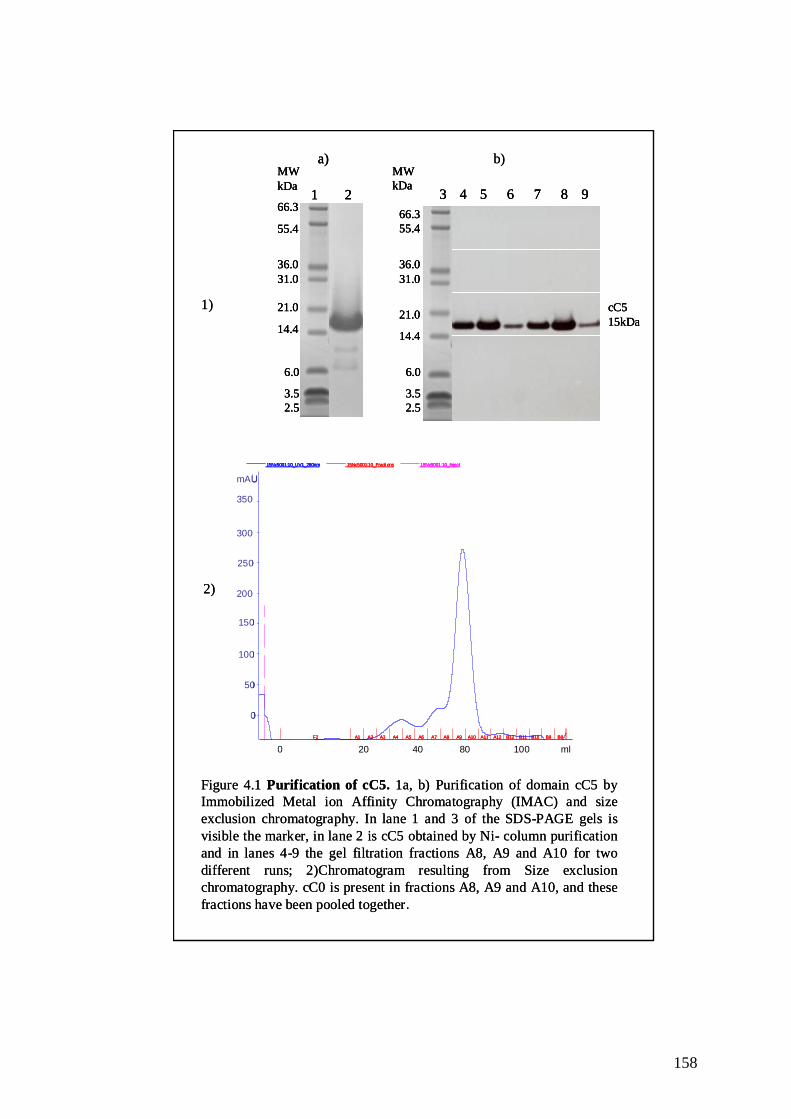
158
Figure 4.1 Purification of cC5. 1a, b) Purification of domain cC5 by Immobilized Metal ion Affinity Chromatography (IMAC) and size exclusion chromatography. In lane 1 and 3 of the SDS-PAGE gels is visible the marker, in lane 2 is cC5 obtained by Ni- column purification and in lanes 4-9 the gel filtration fractions A8, A9 and A10 for two different runs; 2)Chromatogram resulting from Size exclusion chromatography. cC0 is present in fractions A8, A9 and A10, and these fractions have been pooled together.
1)
2)
b)
1 2
6.0
3.5
21.0
31.036.0
2.5
14.4
MWkDa
a)
55.4
66.3
cC515kDa
3 4 5 6 7 8
6.0
3.5
21.0
31.036.0
2.5
14.4
9
MWkDa
55.466.3
15Nc5001:10_UV1_280nm 15Nc5001:10_Fractions 15Nc5001:10_Inject
0
50
100
150
200
250
300
350
mAU
0 20 40 60 80 100 mlF2 A1 A2 A3 A4 A5 A6 A7 A8 A9 A10 A11 A12 B12 B11 B10 B9 B8
0
50
100
150
200
250
300
350
mAU
0 20 40 80 100 ml
Figure 4.1 Purification of cC5. 1a, b) Purification of domain cC5 by Immobilized Metal ion Affinity Chromatography (IMAC) and size exclusion chromatography. In lane 1 and 3 of the SDS-PAGE gels is visible the marker, in lane 2 is cC5 obtained by Ni- column purification and in lanes 4-9 the gel filtration fractions A8, A9 and A10 for two different runs; 2)Chromatogram resulting from Size exclusion chromatography. cC0 is present in fractions A8, A9 and A10, and these fractions have been pooled together.
1)
2)
b)
1 2
6.0
3.5
21.0
31.036.0
2.5
14.4
MWkDa
a)
55.4
66.31 2
6.0
3.5
21.0
31.036.0
2.5
14.4
MWkDa
a)
55.4
66.3
cC515kDa
3 4 5 6 7 8
6.0
3.5
21.0
31.036.0
2.5
14.4
9
MWkDa
55.466.3
cC515kDa
3 4 5 6 7 8
6.0
3.5
21.0
31.036.0
2.5
14.4
9
MWkDa
55.466.3
15Nc5001:10_UV1_280nm 15Nc5001:10_Fractions 15Nc5001:10_Inject
0
50
100
150
200
250
300
350
mAU
0 20 40 60 80 100 mlF2 A1 A2 A3 A4 A5 A6 A7 A8 A9 A10 A11 A12 B12 B11 B10 B9 B8
0
50
100
150
200
250
300
350
mAU
0 20 40 80 100 ml
15Nc5001:10_UV1_280nm 15Nc5001:10_Fractions 15Nc5001:10_Inject
0
50
100
150
200
250
300
350
mAU
0 20 40 60 80 100 mlF2 A1 A2 A3 A4 A5 A6 A7 A8 A9 A10 A11 A12 B12 B11 B10 B9 B8
0
50
100
150
200
250
300
350
mAU
0 20 40 80 100 ml

159
4.1.2 Expression of domain cC8
Domain cC8 was cloned in pET-8C vector and inoculated in BL21 STAR (DE3) cells
(from Invitrogen) but the expression proved difficult from the start. The protein
synthesised was insoluble and tended to precipitate in inclusion bodies. A refolding
procedure was then followed, using the two different protocols, a long method and a
short one, as described in the material and methods (section 2.2.5).
4.1.3 Is domain cC8 properly folded?
To confirm if a protein is folded, it is possible to perform a 1D 1H NMR experiment.
The resulting spectrum for domain cC8 is of an higher order and it is not possible to
interpret and assign it, but in some regions at the far end of the spectrum, specially just
below zero, it is possible to identify peaks characteristic of folded proteins. Proton
signals of organic compounds are usually positive, as the standard molecule TMS is
arbitrarily placed at zero and is very unusual to have nuclei more shielded than the -CH3
groups attached to an atom of Silicon; in proteins, however, the 1H nuclei of residues
buried in the hydrophobic core will be more shielded than the rest and will tend to be at
negative chemical shifts if positioned near aromatic rings that interfere with their ring
currents. This is due to the presence of π electrons in the aromatic rings. When there are
electrons circulating, as in aromatic rings and in compounds with double or triple bonds,
they will cause local magnetic fields that will reduce or increase the total magnetic field
perceived by the nuclei, according to their position is space. The shielding region of
aromatic rings is positioned above and underneath the ring, the so called plus resion,
while nuclei positioned on the ring plane will be de-shielded as the force line of the

160
magnetic field induced by the electronic currents will be added to the external magnetic
field and so the total magnetic field will be stronger for these nuclei than for the rest.
For this reason, nuclei positioned in the plus region of an aromatic ring, will give
signals at low chemical shifts, while aromatic 1H nuclei are typically positioned
between 6 and 8 ppm. If peaks at negative chemical shifts are present, it is reasonable to
think that the protein is folded.
Figure 4.2 1D 1H NMR spectrum of domain cC8. The spectrum shows that domain cC8 is folded, as peaks are present at the very right of the spectrum. The experiment was recorded at 25°C.
Figure 4.2 1D 1H NMR spectrum of domain cC8. The spectrum shows that domain cC8 is folded, as peaks are present at the very right of the spectrum. The experiment was recorded at 25°C.
The amount of protein obtained after refolding was always quite small and it had a
tendency to disappear during dialysis and concentration steps, suggesting that it might
be misfolded, with some hydrophobic residue exposed on the surface. I have at this
point, investigated the stability of domain cC8 after the refolding procedure.
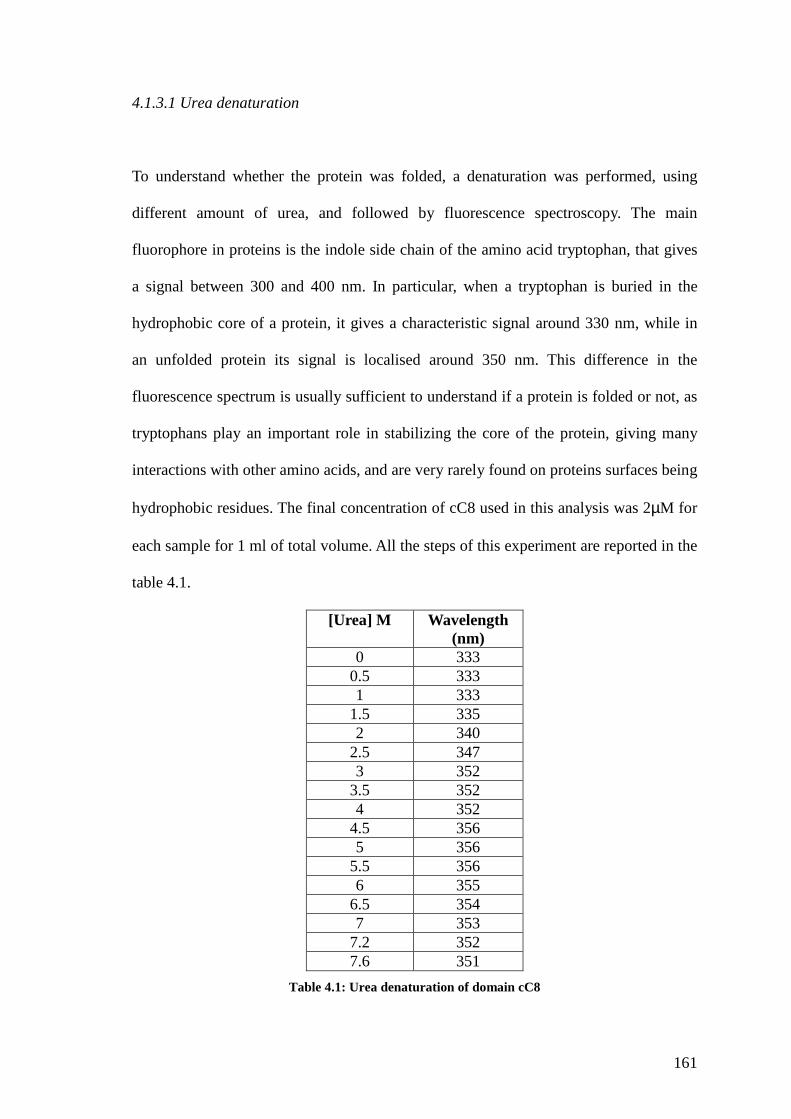
161
4.1.3.1 Urea denaturation
To understand whether the protein was folded, a denaturation was performed, using
different amount of urea, and followed by fluorescence spectroscopy. The main
fluorophore in proteins is the indole side chain of the amino acid tryptophan, that gives
a signal between 300 and 400 nm. In particular, when a tryptophan is buried in the
hydrophobic core of a protein, it gives a characteristic signal around 330 nm, while in
an unfolded protein its signal is localised around 350 nm. This difference in the
fluorescence spectrum is usually sufficient to understand if a protein is folded or not, as
tryptophans play an important role in stabilizing the core of the protein, giving many
interactions with other amino acids, and are very rarely found on proteins surfaces being
hydrophobic residues. The final concentration of cC8 used in this analysis was 2µM for
each sample for 1 ml of total volume. All the steps of this experiment are reported in the
table 4.1.
[Urea] M Wavelength (nm)
0 333 0.5 333 1 333
1.5 335 2 340
2.5 347 3 352
3.5 352 4 352
4.5 356 5 356
5.5 356 6 355
6.5 354 7 353
7.2 352 7.6 351
Table 4.1: Urea denaturation of domain cC8

162
A fluorescence spectrum was recorded for each sample of the series reported in the table
and the results were compared, as shown in picture 4.3.
Figure 4.3 Urea denaturation followed by fluorescence spectroscopy. In the picture are shown the fluorescence spectra for the tryptophan residues in domain cC8. in the higher spectra, registered at low concentration of Urea, the tryptophan peak is at the expected wavelength of 333 nm. As the concentration of denaturant increases, the peak tends to shift toward higher wavelengths, reaching 356 nm when in a solution containing 4.5 M Urea. The significance of this picture is that the more denaturant is present, the more exposed are the tryptphans present in the molecule, signifying a loss of structure by the protein in analysis.
Figure 4.3 Urea denaturation followed by fluorescence spectroscopy. In the picture are shown the fluorescence spectra for the tryptophan residues in domain cC8. in the higher spectra, registered at low concentration of Urea, the tryptophan peak is at the expected wavelength of 333 nm. As the concentration of denaturant increases, the peak tends to shift toward higher wavelengths, reaching 356 nm when in a solution containing 4.5 M Urea. The significance of this picture is that the more denaturant is present, the more exposed are the tryptphans present in the molecule, signifying a loss of structure by the protein in analysis.
The fluorescence spectra show the tryptophan residue in domain cC8. In the first
spectra, registered at low concentration of urea, the tryptophan peak is at the expected
wavelength of 333 nm. As the concentration of denaturant increases, the peak tends to
shift toward higher wavelengths, reaching 356 nm when in a solution containing 4.5 M

163
urea and higher. This means that the more denaturant is present, the more exposed is the
tryptophan residue present in the molecule, signifying a disruption of the hydrophobic
core . This is compatible with a protein that is folded at the beginning of the procedure
and loses its fold as the concentration of denaturant increases.
Using the program MATHEMATICA(Wolfram research) it was possible to fit the
experimental data creating a diagram of the absorbance against urea concentration.
Abs
orba
nce
/ n
m
∆G
cC5: 2.83 kJ
cC8: 8.24 kJ
cC0: 37.74 kJ
Figure 4.4 Urea denaturation curve and Gibbs free energy for domains cC8. the denaturation curve shows that the protein goes from a compact conformation (folded) to an unstractured one (unfolded). The values of ∆G for the three domains show that cC8 is more stable than cC5 but less stable than cC0, that has the highest value of the Gibbs free energy. In the lower part of the picture the error is shown
Wa
vele
ngh
t[n
m]
[Urea]/ M
Abs
orba
nce
/ n
m
∆G
cC5: 2.83 kJ
cC8: 8.24 kJ
cC0: 37.74 kJ
∆G
cC5: 2.83 kJ
cC8: 8.24 kJ
cC0: 37.74 kJ
Figure 4.4 Urea denaturation curve and Gibbs free energy for domains cC8. the denaturation curve shows that the protein goes from a compact conformation (folded) to an unstractured one (unfolded). The values of ∆G for the three domains show that cC8 is more stable than cC5 but less stable than cC0, that has the highest value of the Gibbs free energy. In the lower part of the picture the error is shown
Wa
vele
ngh
t[n
m]
[Urea]/ M

164
The fitting was performed on the basis of the two- state equilibrium hypothesis and the
fequation used is the following:
( )
+
+++=
−∆−
−∆−
RT
XSG
RT
XSG
uf
u
u
f
e
eXSUXSFF
1
)()(
Where Ff is the folded fraction, F is the signal for the folded fraction, U is the signal for
the unfolded fraction, S represents the slope of the curve at either the folded of the
unfolded state and X is the urea concentration.
The curve resulting from this analysis is similar to sigmoid, showing that the tryptophan
residue contained in domain cC8 is buried in the hydrophobic core of the protein at low
concentration of denaturant, as shown by the fluorescence absorbance of 333 nm, but
tends to be exposed at increasing concentrations of urea, to reach a maximum at
concentration of urea 4.5M. After this point the absorbance does not increase any
further even at higher concentrations of urea, meaning that the domain has lost its
structure and is fully denatured. With the program Mathematica it was also possible to
calculate the Gibbs free energy, that resulted, for the process of denaturation of domain
cC8, corresponding to 8.24 kJ. The Gibbs free energy (∆G) is associated with the
thermodynamic stability of a given molecule and tells us if a process is favoured or not.
The same quantity has been previously calculated for other domains of c-MyBPC and
so it was possible to compare the same value for different domains of the same protein,
comparing in this way the stability of domain cC8 with the stability of known domains.
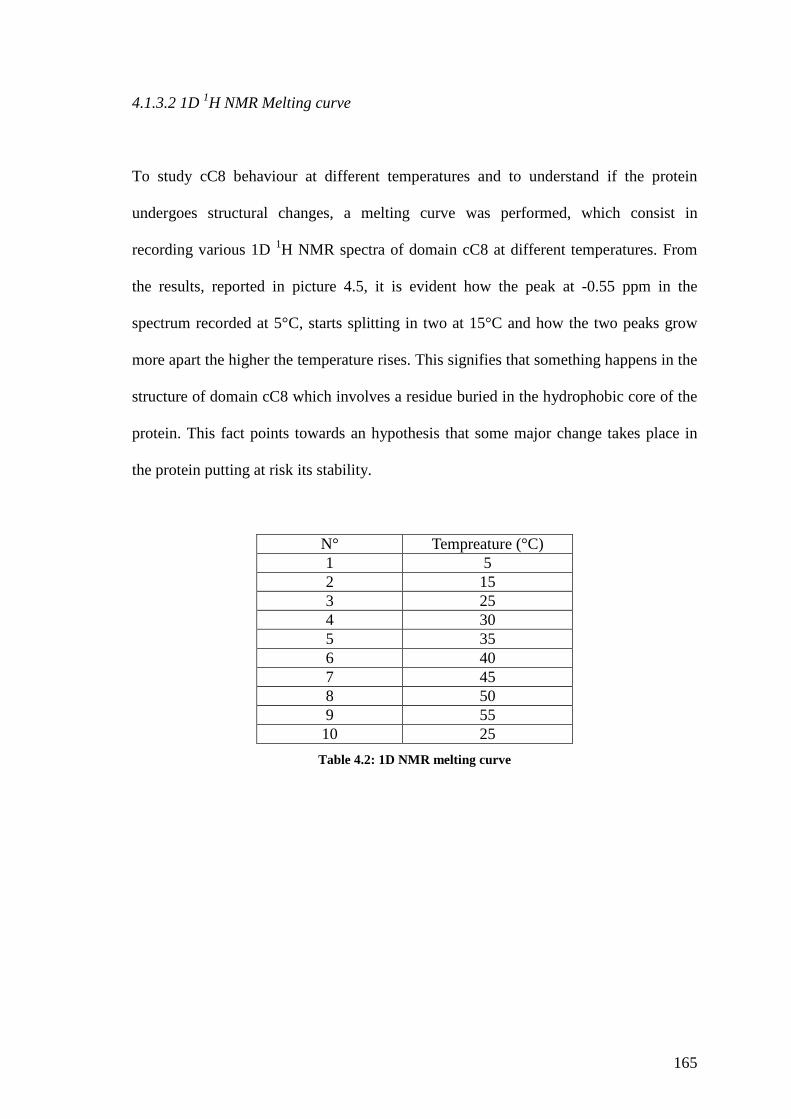
165
4.1.3.2 1D 1H NMR Melting curve
To study cC8 behaviour at different temperatures and to understand if the protein
undergoes structural changes, a melting curve was performed, which consist in
recording various 1D 1H NMR spectra of domain cC8 at different temperatures. From
the results, reported in picture 4.5, it is evident how the peak at -0.55 ppm in the
spectrum recorded at 5°C, starts splitting in two at 15°C and how the two peaks grow
more apart the higher the temperature rises. This signifies that something happens in the
structure of domain cC8 which involves a residue buried in the hydrophobic core of the
protein. This fact points towards an hypothesis that some major change takes place in
the protein putting at risk its stability.
N° Tempreature (°C) 1 5 2 15 3 25 4 30 5 35 6 40 7 45 8 50 9 55 10 25
Table 4.2: 1D NMR melting curve

166
Figure 4.5 Melting curve for domain cC8. Four 1H 1D NMR spectra have been acquired at four different temperatures. It is very evident that the peak at -0.55 ppmis a singulet at 5°C but starts splitting in two at 15°C. The two peaks move more apart the higher the temperature goes. This means that the protein is in two different conformations, at least some of its residues change chemical environment going from 5°C to higher temperatures. Moreover, this region at the very right of the spectrum, is where the signals of the internal residues, very shielded from the rest of the protein and so giving a signal at a high field. This means that the hydrophobic core of the protein in involved in this phenomenon.
30°C
25°C
15°C
5°C
Figure 4.5 Melting curve for domain cC8. Four 1H 1D NMR spectra have been acquired at four different temperatures. It is very evident that the peak at -0.55 ppmis a singulet at 5°C but starts splitting in two at 15°C. The two peaks move more apart the higher the temperature goes. This means that the protein is in two different conformations, at least some of its residues change chemical environment going from 5°C to higher temperatures. Moreover, this region at the very right of the spectrum, is where the signals of the internal residues, very shielded from the rest of the protein and so giving a signal at a high field. This means that the hydrophobic core of the protein in involved in this phenomenon.
Figure 4.5 Melting curve for domain cC8. Four 1H 1D NMR spectra have been acquired at four different temperatures. It is very evident that the peak at -0.55 ppmis a singulet at 5°C but starts splitting in two at 15°C. The two peaks move more apart the higher the temperature goes. This means that the protein is in two different conformations, at least some of its residues change chemical environment going from 5°C to higher temperatures. Moreover, this region at the very right of the spectrum, is where the signals of the internal residues, very shielded from the rest of the protein and so giving a signal at a high field. This means that the hydrophobic core of the protein in involved in this phenomenon.
30°C
25°C
15°C
5°C
From the results of both urea denaturation and melting curve, I concluded that cC8
produced by refolding of the insoluble synthesised protein has a fold but it is probably
not the correct one. It is very likely that some of the hydrophobic residues of the
sequence do not find a place in the hydrophobic core during the refolding and end up
being exposed on the surface, causing the protein to stick to dialysis and concentrators
membranes. The ideal solution to this problem would be to express domain cC8 as

167
soluble protein. This would avoid the refolding procedure, leading to the expression and
purification of a protein properly folded.
4.1.4 cC8 expressed as a fusion protein
The production of proteins by genetically engineered E. Coli is a well established
technique, favoured by the fact that E. Coli has a relatively simple genetics, is well
characterised and has a rapid growth rate. However, a possible disadvantage in
expressing heterologous proteins in E.Coli is that these proteins could express as
insoluble aggregated folding intermediates, known as inclusion bodies (Mitraki, 1989).
A wide range of means have been exploited to increase the production of soluble
protein, such as specific bacteria strains (Miroux and Walker, 1996; Prinz et al., 1997;
Sauer and Nygaard, 1999), chaperone co-expression (de Marco and De Marco, 2004; de
Marco et al., 2000), and modification of growth conditions. A further approach is to
clone the gene of interest in vectors that offer the opportunity to fuse the target protein
to a partner to increase its solubility (Kapust and Waugh, 1999; Makrides, 1996).
Glutahione S-transferase (GST) (Nygren et al., 1994), maltose binding protein (MBP)
(Pryor and Leiting, 1997) and thioredoxin (TrxA) (La Vallie, 2000) are the most
popular fusion protein in use. In this research two fusion proteins have been produced,
cloning the sequence coding for domain cC8 in two different vectors, pETM-20 to
express cC8 as a fusion protein with TrxA, and pETM-60 to express a fusion protein
with the E.coli protein NusA, that has been selected for its intrinsic solubility (De
Marco et al., 2004) .

168
4.1.4.1 Cloning of cC8 in pETM-20 and expression of TrxA_ cC8
Thioredoxin (TrxA) has several properties that make it well suited as a protein fusion
partner, specially the fact that when it is expressed from plasmid vectors in E.Coli, it
can accumulate to 40% of the total cellular protein content while remaining soluble.
This extraordinary level of soluble expression suggest a very efficient translation. More
importantly, this remarkable property is usually transferred to heterologous proteins
fused with TrxA, especially when TrxA is positioned at the N-terminus of the protein of
interest. The way TrxA works is probably as a covalently joined chaperone protein that
keeps folding intermediates of linked heterologous proteins in solution long enough for
them to adopt their correct final conformation (La Vallie, 2000). For this reason the cC8
gene was re-cloned in the pETM-20 vector so to express it as a fusion protein with
TrxA.
The cloning procedure followed is the one described in the material and methods
section.
Table 4.3: Primers used to lone cC8 in both vectors pETM-20 and pETM-60 vectors.
Primers for generating entry vector Tm
Forward 5'-GCGCCCATGGCGCAACGGCCACGGCTTCAGC-3' 60°C cC8 Reverse 5'-GCGCGGATCCTACTTGTCAACAACCTGCAGCACC-3' 60°C

169
Figure 4.6 pETM-20 vector map. The protein of interest will be expressed as a fusion protein with TrxA at its N-terminus. An His-tag to allow purification by IMAC using Ni2+ columns is located between the two fused proteins and a TEV site is also present so that it is possible to cut the TrxA away if necessary for analysis.
Figure 4.6 pETM-20 vector map. The protein of interest will be expressed as a fusion protein with TrxA at its N-terminus. An His-tag to allow purification by IMAC using Ni2+ columns is located between the two fused proteins and a TEV site is also present so that it is possible to cut the TrxA away if necessary for analysis.
1) 2)
100
300
500
1000
2000
bp 1 2
100
300
1000
2000
bp3 4 5 6 7
Figure 4.7 Cloning of cC8 in pETM-20. 1) PCR products at annealing temperature of 60°C. 2) PCR screening carried out on the colonies obtained after ligation between the cC8 coding gene and vector pETM-20. In lanes 1 and 7 is shown the DNA marker.
1) 2)
100
300
500
1000
2000
bp 1 2
100
300
1000
2000
bp3 4 5 6 7
1) 2)
100
300
500
1000
2000
bp 1 2
100
300
500
1000
2000
bp 1 2
100
300
1000
2000
bp3 4 5 6 7
100
300
1000
2000
bp3 4 5 6 7
Figure 4.7 Cloning of cC8 in pETM-20. 1) PCR products at annealing temperature of 60°C. 2) PCR screening carried out on the colonies obtained after ligation between the cC8 coding gene and vector pETM-20. In lanes 1 and 7 is shown the DNA marker.

170
Once the cloning procedure was completed, the new DNA construct was inoculated in
different kind of competent cells to confront the efficiency of expression. The
competent cells used in this analysis are the following.
• BL21 STAR (DE3) (from Invitrogen)
• BL21 Codon Plus (DE3) RP (from Stratagene)
• Rosetta (DE3) PlysS (from Novagen)
The results obtained are shown in SDS-PAGE picture following.
TrxA_cC825 kDa
3.5
6.0
14.4
21.5
31.0
36.5
55.4
66.5
1 2 3 4 5 6 7 8 9
Figure 4.8 SDS-PAGE gel of TrxA_cC8 expressed in different competent cells. In lane 1 in shown the marker. In all even numbered lanes are the soluble fractions and in the odd numbered lanes the insoluble fractions. Lane 2 and 3 show the expression in Rosetta (DE3) PlysS cells at 15°C; lanes 4 and 5 show results in expression in Rosetta (DE3) PlysS at 37°C; lanes 6 and 7 show expression results using BL21 Codon Plus (DE3) RP at 37°C; lane 8 and 9 show the results obtained when using BL21STAR (DE3). The best results was the one obtained with Rosetta (DE3) PlysS cells at 15°C but the majority of the protein was in the insoluble fractions with all the different competent cells used.
TrxA_cC825 kDa
3.5
6.0
14.4
21.5
31.0
36.5
55.4
66.5
1 2 3 4 5 6 7 8 9
3.5
6.0
14.4
21.5
31.0
36.5
55.4
66.5
1 2 3 4 5 6 7 8 9
Figure 4.8 SDS-PAGE gel of TrxA_cC8 expressed in different competent cells. In lane 1 in shown the marker. In all even numbered lanes are the soluble fractions and in the odd numbered lanes the insoluble fractions. Lane 2 and 3 show the expression in Rosetta (DE3) PlysS cells at 15°C; lanes 4 and 5 show results in expression in Rosetta (DE3) PlysS at 37°C; lanes 6 and 7 show expression results using BL21 Codon Plus (DE3) RP at 37°C; lane 8 and 9 show the results obtained when using BL21STAR (DE3). The best results was the one obtained with Rosetta (DE3) PlysS cells at 15°C but the majority of the protein was in the insoluble fractions with all the different competent cells used.
According to the results obtained, it was decided to express the protein at 15°C with

171
Rosetta PlysS cells that gave the higher amount of soluble protein comparing to the
other kind of competent cells used in this screening. It was possible to purify the
synthesised fusion protein using IMAC on Ni2+ columns and by size exclusion
chromatography.
Figure 4.9 SDS-PAGE of TrxA_cC8 expressed in Rosetta (DE3) PlysS at 15°C after IMAC purification on Ni2+ columns. In lane 1 in shown the marker. Lanes 2 and 3 show cC8_TrxA after the IMAC purification step.
3.5
6.0
14.4
21.5
31.536.5
55.4
1 3
Figure 4.9 SDS-PAGE of TrxA_cC8 expressed in Rosetta (DE3) PlysS at 15°C after IMAC purification on Ni2+ columns. In lane 1 in shown the marker. Lanes 2 and 3 show cC8_TrxA after the IMAC purification step.
3.5
6.0
14.4
21.5
31.536.5
55.4
1 3
3.5
6.0
14.4
21.5
31.536.5
55.4
3.5
6.0
14.4
21.5
31.536.5
55.4
1 3
The fusion protein was purified with size exclusion chromatography and the three
fractions containing it were pooled together. The protein was then concentrated,
dialysed against NMR buffer and a titration with 15N cC5 was performed. The final
concentration of 15N cC5 was a lot higher than the one of TrxA_cC8 so it was possible
to perform just three addition of TrxA_cC8.
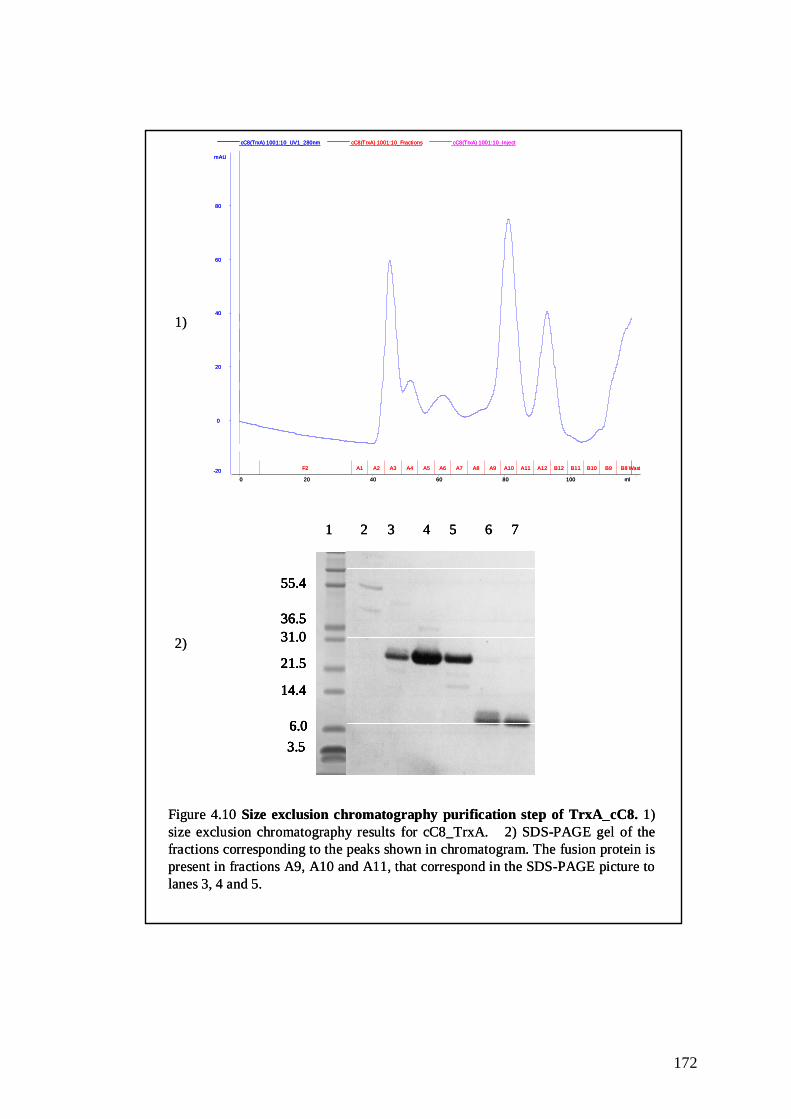
172
cC8(TrxA) 1001:10_UV1_280nm cC8(TrxA) 1001:10_Fractions cC8(TrxA) 1001:10_Inject
-20
0
20
40
60
80
mAU
0 20 40 60 80 100 ml
F2 A1 A2 A3 A4 A5 A6 A7 A8 A9 A10 A11 A12 B12 B11 B10 B9 B8 Waste
2 3 4 5 6 7
31.0
3.5
6.0
14.4
21.5
36.5
55.4
1
1)
2)
Figure 4.10 Size exclusion chromatography purification step of TrxA_cC8. 1) size exclusion chromatography results for cC8_TrxA.2) SDS-PAGE gel of the fractions corresponding to the peaks shown in chromatogram. The fusion protein is present in fractions A9, A10 and A11, that correspond in the SDS-PAGE picture to lanes 3, 4 and 5.
cC8(TrxA) 1001:10_UV1_280nm cC8(TrxA) 1001:10_Fractions cC8(TrxA) 1001:10_Inject
-20
0
20
40
60
80
mAU
0 20 40 60 80 100 ml
F2 A1 A2 A3 A4 A5 A6 A7 A8 A9 A10 A11 A12 B12 B11 B10 B9 B8 Waste
2 3 4 5 6 7
31.0
3.5
6.0
14.4
21.5
36.5
55.4
1 2 3 4 5 6 7
31.0
3.5
6.0
14.4
21.5
36.5
55.4
31.0
3.5
6.0
14.4
21.5
36.5
55.4
3.5
6.0
14.4
21.5
36.5
55.4
1
1)
2)
Figure 4.10 Size exclusion chromatography purification step of TrxA_cC8. 1) size exclusion chromatography results for cC8_TrxA.2) SDS-PAGE gel of the fractions corresponding to the peaks shown in chromatogram. The fusion protein is present in fractions A9, A10 and A11, that correspond in the SDS-PAGE picture to lanes 3, 4 and 5.
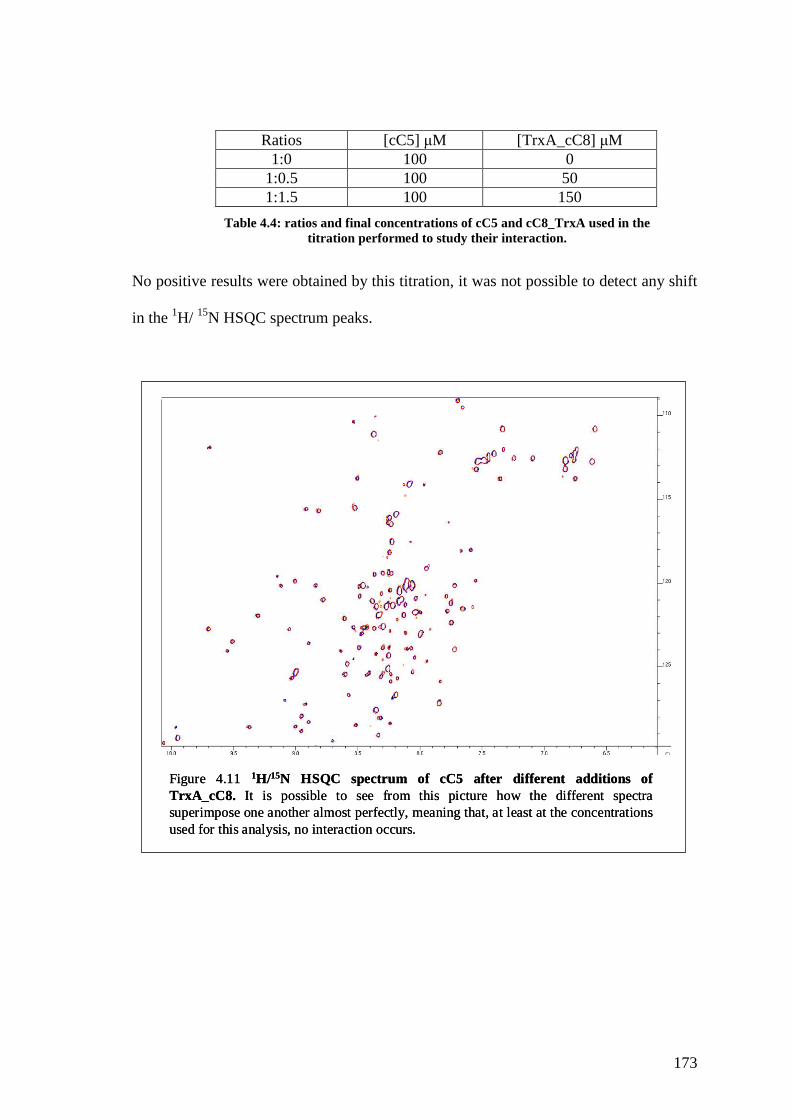
173
Ratios [cC5] µM [TrxA_cC8] µM 1:0 100 0
1:0.5 100 50 1:1.5 100 150
Table 4.4: ratios and final concentrations of cC5 and cC8_TrxA used in the titration performed to study their interaction.
No positive results were obtained by this titration, it was not possible to detect any shift
in the 1H/ 15N HSQC spectrum peaks.
Figure 4.11 1H/15N HSQC spectrum of cC5 after different additions of TrxA_cC8. It is possible to see from this picture how the different spectra superimpose one another almost perfectly, meaning that, at least at the concentrations used for this analysis, no interaction occurs.
Figure 4.11 1H/15N HSQC spectrum of cC5 after different additions of TrxA_cC8. It is possible to see from this picture how the different spectra superimpose one another almost perfectly, meaning that, at least at the concentrations used for this analysis, no interaction occurs.

174
4.1.4.2 Cloning of cC8 in pETM-60 vector and expression of NusA_cC8
The same cC8 DNA fragment amplified by PCR and doubly digested with enzymes
BamH1 and Nco1, was ligated also with pETM-60 (De Marco et al., 2004) with the
finality of expressing cC8 in a fusion protein with a second partner, E.Coli protein
NusA. This protein was chosen as fusion partner on the basis of solubility screenings
(Harrison, 2000), has a molecular weight of 55 kDa and has a role in termination of
transcription; it is characterized by a solubility higher than 95% when over expressed
and it has been proven to enhance the solubility of exogenous protein fused with it.
Figure 4.12 pETM-60 vector map. The protein of interest will be expressed as a fusion protein with NusA at its N-terminus. An His-tag to allow purification by IMAC using Ni2+ columns is located between the two fused proteins and a TEV site is also present so that it is possible to cut the NusA away if necessary for analysis.
Figure 4.12 pETM-60 vector map. The protein of interest will be expressed as a fusion protein with NusA at its N-terminus. An His-tag to allow purification by IMAC using Ni2+ columns is located between the two fused proteins and a TEV site is also present so that it is possible to cut the NusA away if necessary for analysis.
The same competent cells as the ones that gave the best result with the
TrxA_cC8construct were used, so expression was carried out with Rosetta (DE3) PlysS

175
cells (from Novagen). It was possible to purify the protein with both IMAC on Ni2+
columns and by size exclusion chromatography, even though two unresolved peaks
were present in the chromatogram.
2)
1)
MWkDa
2.53.5
6.0
14.421.531.036.5
55.466.3
1 2 3
2.5
Figura 4.13 Purification of NusA_cC8. 1a) Purification of domain cC8_NusA by Immobilized Metal ion Affinity Chromatography (IMAC); 2)Chromatogram resulting from Size exclusion chromatography. cC8_NusA is present in fractions 5, 6 and 7, that are the fractions that have been pooled together. The peak is not well resolved and a second peak is present in fraction 4, which is compatible with the result obtained by SDS-PAGE analysis, shown in figure 1b), where two bands are present at very similar molecular weight.
2007Feb12no001:10_UV 2007Feb12no001:10_Fractions 2007Feb12no001:10_Inject 2007Feb12no001:10_Logbook
0.0
10.0
20.0
30.0
40.0
mAu
0 20 40 60 80 100 120 min
Break point 2 Break point 4 Break point 5
1 2 3 4 5 6 7 8 9 10 11 12 13 14 15 16 17 18 19 Waste
MWkDa
3.5
6.0
14.421.531.036.5
55.466.3
4 5 6
2)
1)
MWkDa
2.53.5
6.0
14.421.531.036.5
55.466.3
1 2 3
2.53.5
6.0
14.421.531.036.5
55.466.3
1 2 3
3.5
6.0
14.421.531.036.5
55.466.3
3.5
6.0
14.421.531.036.5
55.466.3
1 2 3
2.5
Figura 4.13 Purification of NusA_cC8. 1a) Purification of domain cC8_NusA by Immobilized Metal ion Affinity Chromatography (IMAC); 2)Chromatogram resulting from Size exclusion chromatography. cC8_NusA is present in fractions 5, 6 and 7, that are the fractions that have been pooled together. The peak is not well resolved and a second peak is present in fraction 4, which is compatible with the result obtained by SDS-PAGE analysis, shown in figure 1b), where two bands are present at very similar molecular weight.
2007Feb12no001:10_UV 2007Feb12no001:10_Fractions 2007Feb12no001:10_Inject 2007Feb12no001:10_Logbook
0.0
10.0
20.0
30.0
40.0
mAu
0 20 40 60 80 100 120 min
Break point 2 Break point 4 Break point 5
1 2 3 4 5 6 7 8 9 10 11 12 13 14 15 16 17 18 19 Waste
MWkDa
3.5
6.0
14.421.531.036.5
55.466.3
4 5 6MWkDa
3.5
6.0
14.421.531.036.5
55.466.3
3.5
6.0
14.421.531.036.5
55.466.3
4 5 6
A titration was performed to study the interaction between 15N cC5 and NusA_cC8
Ratios [cC5] µM [NusA_cC8] µM 1:0 100 0
1:0.5 100 50 1:1 100 100
1:1.5 100 150
Table 4.5: ratios and final concentrations of cC5 and NusA_cC8used in the titration performed to study their interaction.

176
Some very small shifts were distinguishable, possibly due to small variations in pH or
temperature, but not enough to reach a definitive conclusion about the occurrence of the
interaction; the main problem with NusA_cC8, as well as with TrxA_cC8, is the
impossibility to produce enough soluble protein to perform a titration going to the
higher ratios that might be necessary for this interaction to be clearly detectable.
4.1.5 Expression in tRNA- supplemented host cells
4.1.5.1 Expression of cC8 in BL21 Codon Plus (DE3) RP competent cells
One of the most common problems encountered when over-expressing heterologous
genes in E.Coli, is the failure of synthesis of the desired protein due to the presence of
rare codons. This is caused by the redundancy of the genetic code; since the same amino
acids can often being encoded for by more than one codon, different organisms use the
possible coding triplets with varying frequency. Forced expression of heterologous
genes containing codons rarely used by the host organism, can lead to a reduction of the
corresponding tRNA pools and a stop in the translational process that will appear as a
failure of producing the desired protein. This problem can be overcome co-expressing
extra copies of the rare tRNA genes together with the protein of interest. For this
purpose two pACYC-based vectors were created by Stratagene with copies of the
codons that had the main effect when expressing heterologous proteins in E. coli. Four
codons were implemented: argU (AGA/ AGG), ileY (AUA), leuW (CGA) and proL
(CCC). Ideally all four codons would be present on the same vector but, since a
functional incompatibility between ileY and proL was observed, two different vectors
were made on the basis of their relative GC-richness. AGA (argU), AUA (ileY), CUA

177
(leuW) are more likely to be present in AT-rich organisms, while AGG (argU) and CCC
(proL) are more frequently found in GC- rich organisms. These two vectors were
introduced into the BL21- gold cells and the resulting cells go under the trade-name of
BL21 Codon Plus (DE3) (from Straragene) and exist in two version, RIL and RP
according to the rare codons present in their additional vector.
Since four rare codons are present in the DNA sequence coding for domain cC8, four
CCC (proL) and one AGG (argU), it was decided to use the BL21 Codon Plus (DE3)
RP.
atg cac cat cat cat cat cat tct tct ggt gag aat ctt tat ttt cagggc gcc atg gcg caa cgg ccacgg ctt cag ctgCCCAGG cac ctg cgc cag acc att cag aag aag gtc ggg gag cct gtg aacctt ctc atc cct ttc cag ggc aagCCCcgg cct cag gtg acc tgg acc aaa gag ggg cagCCCctg gca ggc gag gag gtg agc atc cgc aac agcCCCaca gac acc atc ctg ttc atc cgg gccgct cgc cgc gtg cat tca ggc act tac cag gtg acg gtg cgc att gag aac atg gag gac aag gccacg ctg gtg ctg cag gtt gtt gac aag tag
cC8 DNA coding sequence.
The expression was carried out at different temperatures, and the best results were
obtained at 15°C expressing overnight, inducing with a solution of [IPTG]= 0.1 mM.
Using the BL21 Codon Plus (DE3) RP cells around 7 mg/l of soluble protein were
obtained. The protein was purified by IMAC on Ni2+ columns and with size exclusion
chromatography.

178
C8Cplus15002:10_U V1_280nm C 8Cplus15002:10_Fractions C8Cplus15002:10_Inject
220
240
260
280
300
320
340
m AU
0 20 40 60 80 100 m lF2 A1 A2 A3 A4 A5 A6 A7 A8 A9 A10 A11 A12 B12 B11 B10 B9 B8
Figure 4.14 SDS-PAGE gel and size exclusion chromatogram for domain cC8 expressed in Codon Plus (DE3) RP cells.1a) In lane 1 is shown the marker, in lane 2 and 4 is visible the band corresponding to domain cC8 around 11 kDa. In lane 3 and 5 are shown the flow though of the Ni2+ charged columns used for the IMAC purification step. It is clear that no cC8 is flowing through the columns and getting lost during purification. 2) Gel filtration chromatogram for domain cC8; fractions A11, A12 and B12 were pooled together and checked with SDS-PAGE analysis; in lanes 7, 8, and 9 in picture 1b) are shown the three fractions containing the protein.
3.5
6
14.4
21.5
31.036.5
55.466.3
1 2 3 4 5
1)
2)
6
14.4
21.5
31.036.5
6 7 8 9
a) b)

179
4.1.5.2 Expression of cC8 in Arctic Express RP cells
The best results obtained for domain cC8 have been obtained conducting the expression
at low temperature. At standard temperature of 30-37°C the expressed heterologous
protein can impair the cell’s ability to properly process the recombinant protein, so low
temperature expression is a common strategy to increase the recovery of soluble protein
(Schein, 1989) that otherwise would precipitate. One problem that may arise from this
approach is that E. coli chaperonins, that have a fundamental role in stabilizing unfolded
and partially folded proteins keeping them in solution, lose activity at reduced
temperatures. To overcome this obstacle, special competent cells have been engineered
that co-express the cold-adapted chaperonins Cpn10 and Cpn60 from the Oleispira
Antarctica; these chaperonins have 74% and 54% amino acid identity to the E. coli
chaperonins GroEL and GroES respectively, and show high protein folding activities at
temperatures between 4°C and 12°C. The cells used in this research are the Arctic
Express RP (from Stratagene) that also contain extra copies of argU and proL genes
necessary to overcome the rare codon presence in the heterologous gene. The
expression was carried out at 13° overnight inducing with [IPTG]= 0.1 mM giving a
yield of 186 mg/l. The protein was purified by IMAC on Ni2+ columns and with size
exclusion chromatography.
Confronting the two SDS-PAGE gels of cC8 expressed in Codon Plus RP and in Arctic
RP, it does not seem to be a relevant difference in the amount of protein synthesised, I
would conclude that using either of the two competent cells would give a good amount
of recombinant protein.

180
3.5
6.0
14.4
21.5
31.036.5
55.4
1 2
cC8Arctic004:10_UV1_280nm cC8Arctic004:10_Fractions cC8Arctic004:10_Inject
-50.0
-40.0
-30.0
-20.0
-10.0
0.0
10.0
20.0
m AU
0 20 40 60 80 100 ml
F2 A1 A2 A3 A4 A5 A6 A7 A8 A9 A10 A11 A12 B12 B11 B10 B9 B8
1)
2)
Figure 4.15 Purification of cC8 expressed in Arctic Express RP cells. 1) purification of domain cC8 by Immobilized Metal ion Affinity Chromatography (IMAC); 2)Chromatogram resulting from Size exclusion chromatography. cC8 is present in fractions A11, A12 and B12, and these fractions have been poured together. In lanes 4-7 picture 1b) are shown fractions A10, A11, A12 and B12 after SDS-PAGE analysis. Fractions A11, A12 and B12 have been pooled together.
a) b)
3.5
36.5
3 4 5 6 7
6.0
14.4
21.5
31.0
55.4
2.53.5
6.0
14.4
21.5
31.036.5
55.4
3.5
6.0
14.4
21.5
31.036.5
55.4
3.5
6.0
14.4
21.5
31.036.5
55.4
1 2
cC8Arctic004:10_UV1_280nm cC8Arctic004:10_Fractions cC8Arctic004:10_Inject
-50.0
-40.0
-30.0
-20.0
-10.0
0.0
10.0
20.0
m AU
0 20 40 60 80 100 ml
F2 A1 A2 A3 A4 A5 A6 A7 A8 A9 A10 A11 A12 B12 B11 B10 B9 B8
1)
2)
Figure 4.15 Purification of cC8 expressed in Arctic Express RP cells. 1) purification of domain cC8 by Immobilized Metal ion Affinity Chromatography (IMAC); 2)Chromatogram resulting from Size exclusion chromatography. cC8 is present in fractions A11, A12 and B12, and these fractions have been poured together. In lanes 4-7 picture 1b) are shown fractions A10, A11, A12 and B12 after SDS-PAGE analysis. Fractions A11, A12 and B12 have been pooled together.
a) b)
3.5
36.5
3 4 5 6 7
6.0
14.4
21.5
31.0
55.4
2.53.5
36.5
3 4 5 6 7
6.0
14.4
21.5
31.0
55.4
2.5
6.0
14.4
21.5
31.0
55.4
2.5

181
4.1.6 Study of the interaction between domains cC5 and cC8
The interaction between domains cC5 and cC8 of cMyBPC was studied performing a
titration of cC8 in a sample of 15N cC5, following the changes in chemical shift in an
1H/ 15N HSQC spectrum.
Once the problems regarding cC8 expression have been overcome, it was possible to
synthesise enough protein to perform this study. Four points have been recorded,
corresponding to three additions of cC8 to the 15N cC5 NMR sample.
Ratios [cC5] µM [cC8] µM 1:0 50 0
1:0.5 50 25 1:1 50 50 1:2 50 100
Table 4.6: ratios and final concentration of C5 and cC8 used in the titration performed to study their interaction.
3.5
6.0
14.4
21.5
31.5
36.5
55.4
1 2 3 4 5 6 7
Figure 4.16 SDS-PAGE gel of the samples used to study the cC5-cC8 interaction. in lane 1 is the marker. Lane 2 shows the stock of 15N cC5 250 µM; lane 3 shows the stock of cC8 143 µM; in lane 4 is the firs point of the titration, cC5 50 µM alone. The following three lanes show the three addition of cC8 to cC5, both proteins are visible in each lanes and as is the increasing concentration of cC8.
3.5
6.0
14.4
21.5
31.5
36.5
55.4
1 2 3 4 5 6 7
3.5
6.0
14.4
21.5
31.5
36.5
55.4
3.5
6.0
14.4
21.5
31.5
36.5
55.4
1 2 3 4 5 6 71 2 3 4 5 6 7
Figure 4.16 SDS-PAGE gel of the samples used to study the cC5-cC8 interaction. in lane 1 is the marker. Lane 2 shows the stock of 15N cC5 250 µM; lane 3 shows the stock of cC8 143 µM; in lane 4 is the firs point of the titration, cC5 50 µM alone. The following three lanes show the three addition of cC8 to cC5, both proteins are visible in each lanes and as is the increasing concentration of cC8.
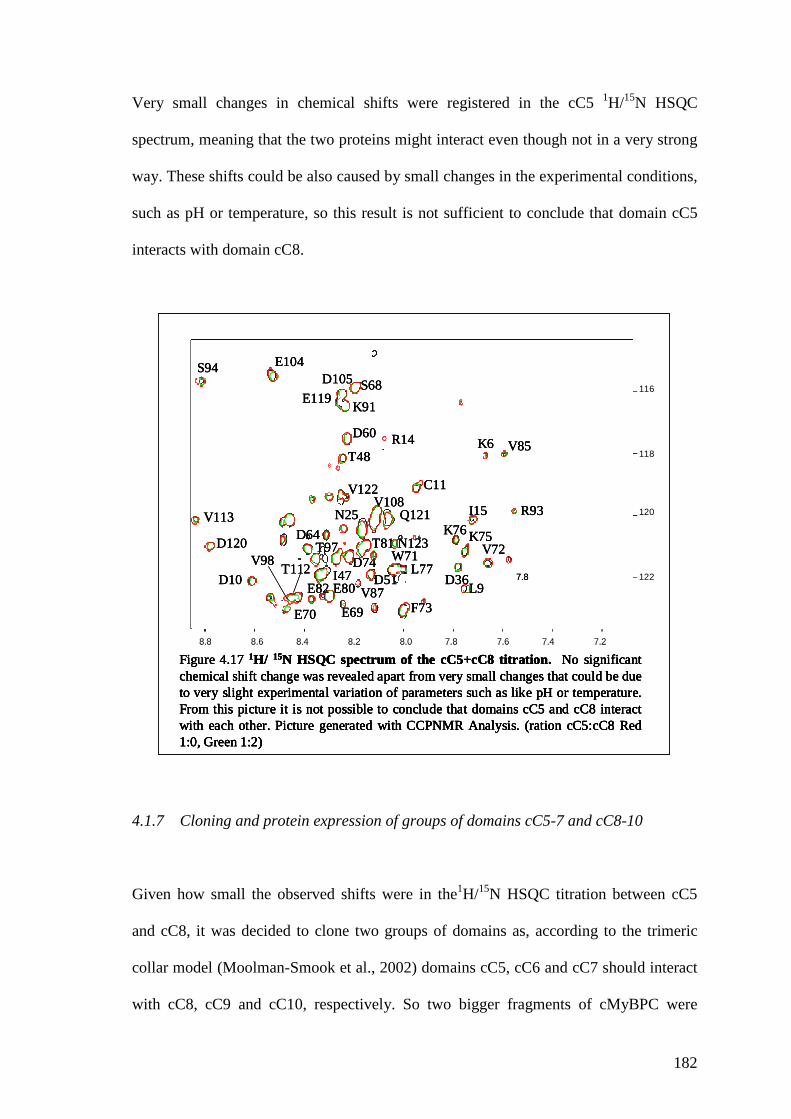
182
Very small changes in chemical shifts were registered in the cC5 1H/15N HSQC
spectrum, meaning that the two proteins might interact even though not in a very strong
way. These shifts could be also caused by small changes in the experimental conditions,
such as pH or temperature, so this result is not sufficient to conclude that domain cC5
interacts with domain cC8.
Figure 4.17 1H/ 15N HSQC spectrum of the cC5+cC8 titration. No significant chemical shift change was revealed apart from very small changes that could be due to very slight experimental variation of parameters such as like pH or temperature. From this picture it is not possible to conclude that domains cC5 and cC8 interact with each other. Picture generated with CCPNMR Analysis. (ration cC5:cC8 Red 1:0, Green 1:2)
S68D105
E119K91
R14 K6
E104S94
V113
D120
D10
V98
E70
T112
E82 E80
E69
I47
T97D64
V122
T48
D60
C11
V87D51
F73
W71L77D74
T81 N123
V108Q121N25
L9D36
V72K75K76
I15 R93
V85
8.8 8.6 8.4 8.2 8.0 7.8 7.6 7.4 7.2
7.8 122
120
118
116
Figure 4.17 1H/ 15N HSQC spectrum of the cC5+cC8 titration. No significant chemical shift change was revealed apart from very small changes that could be due to very slight experimental variation of parameters such as like pH or temperature. From this picture it is not possible to conclude that domains cC5 and cC8 interact with each other. Picture generated with CCPNMR Analysis. (ration cC5:cC8 Red 1:0, Green 1:2)
S68D105
E119K91
R14 K6
E104S94
V113
D120
D10
V98
E70
T112
E82 E80
E69
I47
T97D64
V122
T48
D60
C11
V87D51
F73
W71L77D74
T81 N123
V108Q121N25
L9D36
V72K75K76
I15 R93
V85
Figure 4.17 1H/ 15N HSQC spectrum of the cC5+cC8 titration. No significant chemical shift change was revealed apart from very small changes that could be due to very slight experimental variation of parameters such as like pH or temperature. From this picture it is not possible to conclude that domains cC5 and cC8 interact with each other. Picture generated with CCPNMR Analysis. (ration cC5:cC8 Red 1:0, Green 1:2)
Figure 4.17 1H/ 15N HSQC spectrum of the cC5+cC8 titration. No significant chemical shift change was revealed apart from very small changes that could be due to very slight experimental variation of parameters such as like pH or temperature. From this picture it is not possible to conclude that domains cC5 and cC8 interact with each other. Picture generated with CCPNMR Analysis. (ration cC5:cC8 Red 1:0, Green 1:2)
S68D105
E119K91
R14 K6
E104S94
V113
D120
D10
V98
E70
T112
E82 E80
E69
I47
T97D64
V122
T48
D60
C11
V87D51
F73
W71L77D74
T81 N123
V108Q121N25
L9D36
V72K75K76
I15 R93
V85
8.8 8.6 8.4 8.2 8.0 7.8 7.6 7.4 7.2
7.8 122
120
118
116
4.1.7 Cloning and protein expression of groups of domains cC5-7 and cC8-10
Given how small the observed shifts were in the1H/15N HSQC titration between cC5
and cC8, it was decided to clone two groups of domains as, according to the trimeric
collar model (Moolman-Smook et al., 2002) domains cC5, cC6 and cC7 should interact
with cC8, cC9 and cC10, respectively. So two bigger fragments of cMyBPC were

183
cloned, one comprising of domain cC5 to domain cC7 (fragment cC5-7) and the other
comprising of domains cC8, cC9 and cC10 (fragment cC8-10).
The primers used for this procedure are reported in the following table. The new DNA
fragments were cloned in vector pETM-11.
Primers for generating entry vector Tm
Expression vector
cC5 F 5'-GGCCGAGCCATGGCGCCCAAGATCCACCTGGAC -3' 55°C cC7 R 5'-GGATCCTTACACGGGCTCGGTGGTGGTCACGGG-3' 55°C cC8F 5'-GCCCGAGACATGTCGCCACGGCTTCAGCTGCCC-3' 65°C
cC10 R 5'-GGATCCTTACTGAGGCACTCGCACCTCCAGGCG-3' 65°C
pETM-11
Table 4.7:Pimers used to clone cC5-7 and cC8-10 in pETM-11 vector.
Figure 4.18 pETM-11 vector map. This is the vector used to clone fragments cC5-7 and cC8-10. The two enzyme used for digestion were BamH1 and Nco1 for cC5-7 and BamH1 and Pci1 for cC8-10.
Figure 4.18 pETM-11 vector map. This is the vector used to clone fragments cC5-7 and cC8-10. The two enzyme used for digestion were BamH1 and Nco1 for cC5-7 and BamH1 and Pci1 for cC8-10.
The procedure followed for the two cloning procedures is the same as the one described
in the materials and methods section for the group of domains cC8-10; for cC5-7 it
resulted difficult to perform the ligation directly after the double digestion, as this

184
procedure, repeated twice, failed to give any colony after transformation of TOP 10
cells. It was then decided to perform an extra step, ligating the digested cC5-7 encoding
sequence in the pCR II Blunt TOPO vector (from Invitrogen). To do this the DNA
fragment was allowed to react with pCR II Blunt TOPO vector (from Invitrogen). and
then TOP 10 cells were transformed with this DNA construct. After purification by
MINI PREP, the DNA was doubly digested with BamH1 and NcoI and then ligated to
the doubly digested vector pETM-11 wit ligase T4 (from Roche). This time the reaction
worked and a few colonies were obtained after transformation of TOP 10 cells with this
DNA construct. As shown by picture 4.20, the PCR screening of these colonies showed
that all the colonies contained the right cC5-7 encoding gene, as confirmed by DNA
sequencing.
While cC5-7 was doubly digested by restriction enzymes BamH1 and Nco1, before
ligating it with the vector, cC8-10 was digested by BamH1 and Pci1 (from New
England Bio Labs) due to the presence of a Nco1 cutting site in the sequence. Enzyme
Pci1 creates sticky ends compatible to the ones created by Nco1 but the recognition
sequence is different, being CCATGG for Nco1 and ACATGT for Pci1. The digestion
of cC5-7 was carried out in Buffer B (from Roche), while the cC8-10 digestion was
carried put in NEBuffer 2 (from Roche).

185
12000
bp
2000
1000850
1 2
1) 2)
3 4 5 6 7 8 9 10 11
12000
2000
1000850
bp 12 13
3)
14 15 16 17 18 19 2120 22 2423 25 26 27 28 29
4)
Figure 4.19 Cloning of cC5-7 in vector pETM-11.1) PCR product; 2)PCR screening after ligation of the cC5-7 encoding gene in the PCR-Blunt vector (from Invitrogen) only the colonies shown in lanes 4, 5, 7, 8, 9 and 11 have resulted positive so these were used for procedure that followed; 3) cC5-7 and PCR-Blunt vector after digestion with BamH1 and NcoI enzyme. The DNA corresponding to cC5-7 is the lower band, corresponding to 900 bp. The DNA was purified at this stage by gel extraction. 4) PCR screening of the colonies obtained after ligation of the cC5-7 gene in vector pETM-11. all colonies have resulted positive, so all have worked. The DNA purified by MINI prep was at this point analyzed by DNA sequence analysis.
4)
bp
bp
12000
12000
2000
2000
1000850
1000850
12000
bp
2000
1000850
1 212000
bp
2000
1000850
1 2
2000
1000850
1 2
1) 2)
3 4 5 6 7 8 9 10 11
12000
2000
1000850
bp 12 13
3)
14 15 16 17 18 19 2120 22 2423 25 26 27 28 29
4)
Figure 4.19 Cloning of cC5-7 in vector pETM-11.1) PCR product; 2)PCR screening after ligation of the cC5-7 encoding gene in the PCR-Blunt vector (from Invitrogen) only the colonies shown in lanes 4, 5, 7, 8, 9 and 11 have resulted positive so these were used for procedure that followed; 3) cC5-7 and PCR-Blunt vector after digestion with BamH1 and NcoI enzyme. The DNA corresponding to cC5-7 is the lower band, corresponding to 900 bp. The DNA was purified at this stage by gel extraction. 4) PCR screening of the colonies obtained after ligation of the cC5-7 gene in vector pETM-11. all colonies have resulted positive, so all have worked. The DNA purified by MINI prep was at this point analyzed by DNA sequence analysis.
4)
bp
bp
12000
12000
2000
2000
1000850
1000850

186
Figure 4.20 Cloning of cC8-10 in vector pETM-11. 1) in lane 1 is shown the marker while in lane 2 are the PCR products for cC8-10. 2) PCR screening for cC8-10: lane 3 shows the marker, while the following six lanes present the PCR screening for different colonies obtained after ligation of cC8-10 to the vector pETM-11; it is evident how the colonies in lanes 4, 5 6 and 8 have given a positive result. The DNA purified by MINI PREP was checked by DNA sequence analysis.
1000850
2000
12000
bp
1)
1 2
1000850
2000
12000
bp
2)
3 4 5 6 7 8 9
Figure 4.20 Cloning of cC8-10 in vector pETM-11. 1) in lane 1 is shown the marker while in lane 2 are the PCR products for cC8-10. 2) PCR screening for cC8-10: lane 3 shows the marker, while the following six lanes present the PCR screening for different colonies obtained after ligation of cC8-10 to the vector pETM-11; it is evident how the colonies in lanes 4, 5 6 and 8 have given a positive result. The DNA purified by MINI PREP was checked by DNA sequence analysis.
1000850
2000
12000
bp
1)
1 2
1000850
2000
12000
bp
1000850
2000
12000
bp
1000850
2000
12000
bp
1)
1 2
1000850
2000
12000
bp
2)
3 4 5 6 7 8 9
1000850
2000
12000
bp
1000850
2000
12000
bp
1000850
2000
12000
bp
2)
3 4 5 6 7 8 9
4.1.7.1 Group of domains cC8-10
The DNA construct of cC8-10 in pETM-11 was inoculated in BL21 STAR (DE3)
competent cells (from Invitrogen), expression was carried out at 15°C overnight and
induced with [IPTG]= 0.75 mM.
From preliminary results it looked like cC8-10 expressed normally, as shown in figure
4.22. However, it was not possible to purify the protein using the size exclusion
chromatography, no peak was present in the chromatogram, meaning that no protein
was present in the sample or that part of the protein might be misfolded and stick to the
gel filtration column. The strategies that worked best for domain cC8 were also used for
the group of domains cC8-10, so the corresponding DNA construct was inoculated in
BL21 Codon Plus (DE3) RP and Arctic Express RP but in both cases the amount of
protein express would not improve. The lack of published work on these final domains

187
of cMyBPC suggest an intrinsic difficulty in the synthesis of this fragment of protein
that could explain our lack of success.
3.5
6.0
14.5
21.5
31.036.5
55.4
66.3
1 2 3 4 5
Figure 4.21 SDS-PAGE gel of group of domains cC8-10 expressed in BL21 Star (DE3) after IMAC purification on Ni2+ columns. In lane 1 is shown the marker. In lane 2 and 4 is shown the soluble part obtained by the cells lysidedwith French press and sonicator respectively; lanes 3 and 5 show the flow through. Some of the protein seems to flow through the Ni2+ columns.
cC8-10 38kDa
3.5
6.0
14.5
21.5
31.036.5
55.4
66.3
1 2 3 4 5
3.5
6.0
14.5
21.5
31.036.5
55.4
66.3
3.5
6.0
14.5
21.5
31.036.5
55.4
66.3
1 2 3 4 5
Figure 4.21 SDS-PAGE gel of group of domains cC8-10 expressed in BL21 Star (DE3) after IMAC purification on Ni2+ columns. In lane 1 is shown the marker. In lane 2 and 4 is shown the soluble part obtained by the cells lysidedwith French press and sonicator respectively; lanes 3 and 5 show the flow through. Some of the protein seems to flow through the Ni2+ columns.
cC8-10 38kDa
4.1.7.2 Group of domains cC5-7
Expression of cC5-7 was carried out at 15°C overnight, inducing expression with
[IPTG]= 0.75 mM, giving a yield of 27 mg/l. It was possible to purify the synthesised
protein with both IMAC on Ni2+ columns and size exclusion chromatography.

188
15Nc57001:10COPY1COPY_UV1_280nm 15Nc57001:10COPY1COPY_Fract ions 15Nc57001:10COPY1COPY_Inject
-20
0
20
40
60
mAU
0 20 40 60 80 100 ml
F2 A1 A2 A3 A4 A5 A6 A7 A8 A9 A10 A11 A12 B12 B11 B10 B9 B8
Figure 4.22 SDS gel and size exclusion chromatogram for group of domains cC5-7 expressed in BL21Star (DE3) cells.1) In lane 1 is shown the marker, in lane 2 and 4 is visible the band corresponding to domain cC5-7 domains around 40 kDa. In lane 3 and 5 are shown the flowthough of the Ni2+ charged columns used for the IMAC purification step. It is clear that no cC5-7 is flowing through the columns and getting lost during purification. Lanes 2 and 3 show the result of purification after lysing the cells using the French press, while lanes 4 and 5 show the same after lysing the cells with a sonicatormachine all after Ni column purification. 2) Gel filtration chromatogram for domains cC5-7; fractions A7 and A8 were pooled together on the basis of the chromatogram as the SDS-PAGE analysis gave very thick bands that made difficult to understand whether cC5-7 is also present in fraction A5 and A6.
2)
1)
3.5
6.0
14.4
21.5
31.036.5
55.4
1 2 3 4 5MWkDa
a)
6 7 8 9 10 11
3.5
6.0
14.4
21.0
31.036.5
55.4
MWkDa
b)
cC5-7 35 kDa
15Nc57001:10COPY1COPY_UV1_280nm 15Nc57001:10COPY1COPY_Fract ions 15Nc57001:10COPY1COPY_Inject
-20
0
20
40
60
mAU
0 20 40 60 80 100 ml
F2 A1 A2 A3 A4 A5 A6 A7 A8 A9 A10 A11 A12 B12 B11 B10 B9 B8
Figure 4.22 SDS gel and size exclusion chromatogram for group of domains cC5-7 expressed in BL21Star (DE3) cells.1) In lane 1 is shown the marker, in lane 2 and 4 is visible the band corresponding to domain cC5-7 domains around 40 kDa. In lane 3 and 5 are shown the flowthough of the Ni2+ charged columns used for the IMAC purification step. It is clear that no cC5-7 is flowing through the columns and getting lost during purification. Lanes 2 and 3 show the result of purification after lysing the cells using the French press, while lanes 4 and 5 show the same after lysing the cells with a sonicatormachine all after Ni column purification. 2) Gel filtration chromatogram for domains cC5-7; fractions A7 and A8 were pooled together on the basis of the chromatogram as the SDS-PAGE analysis gave very thick bands that made difficult to understand whether cC5-7 is also present in fraction A5 and A6.
2)
1)
3.5
6.0
14.4
21.5
31.036.5
55.4
1 2 3 4 5MWkDa
a)
3.5
6.0
14.4
21.5
31.036.5
55.4
1 2 3 4 5MWkDa
3.5
6.0
14.4
21.5
31.036.5
55.4
1 2 3 4 5
3.5
6.0
14.4
21.5
31.036.5
55.4
1 2 3 4 5MWkDa
a)
6 7 8 9 10 11
3.5
6.0
14.4
21.0
31.036.5
55.4
MWkDa
b)
6 7 8 9 10 11
3.5
6.0
14.4
21.0
31.036.5
55.4
MWkDa 6 7 8 9 10 11
3.5
6.0
14.4
21.0
31.036.5
55.4
MWkDa
3.5
6.0
14.4
21.0
31.036.5
55.4
3.5
6.0
14.4
21.0
31.036.5
55.4
MWkDa
b)
cC5-7 35 kDa

189
The protein was concentrated and dialysed against NMR buffer. An NMR sample was
produced which concentration was 112µM and a 1D 1H NMR experiment was run to
check whether the protein was folded, as suggested by its being soluble in aqueous
solutions.
Figure 4.23 1D NMR spectrum of cC5-7. 1) aromatic region of the cC5-7 spectrum; the peaks found in this region are typical of 1H nuclei involved in an aromatic system. 2) region at negative chemical shift; the peaks present at chemical shift lower than 0 ppm are typical of –CH3 groups buried in the hydrophobic core positioned near an aromatic ring. A spectrum of this kind induce to believe that the group of domain cC5-7 is folded.
Figure 4.23 1D NMR spectrum of cC5-7. 1) aromatic region of the cC5-7 spectrum; the peaks found in this region are typical of 1H nuclei involved in an aromatic system. 2) region at negative chemical shift; the peaks present at chemical shift lower than 0 ppm are typical of –CH3 groups buried in the hydrophobic core positioned near an aromatic ring. A spectrum of this kind induce to believe that the group of domain cC5-7 is folded.
From the 1D 1H NMR spectrum it is possible to conclude that the protein is probably
folded, due to the presence of peaks at negative chemical shifts, at the far right of the
spectrum. However, to confirm this hypothesis, it was decided to perform a
multidimensional experiment. The molecular weight of the group of domains cC5-7 is
around 35 kDa; proteins larger than 25 kDa tend to give broader NMR signals, due to

190
their slower molecular tumbling rate compared to smaller molecules, causing fast
transverse relaxation. A 1H/ 15N HSQC of a protein this large would give broad signals
and some of them will disappear completely, giving a spectrum with a number of peaks
not corresponding to the number of residues in the protein. However, if we consider a
1H/ 15N correlation experiment without 15N decoupling in both dimensions, every signal
will be split in four signals separated by the N-H spin coupling constant in both
dimensions F1 and F2. It was noted that not all this four signals would broaden in big
proteins spectra. Due to the interference of the cross-correlated dipole relaxation and
chemical shift anisotropy relaxation one of them will stay sharp, one will be very broad
and the remaining two will be intermediate. Based on these observation, a new
experiment was proposed (Pervushin et al., 1997) which singles out the sharp resonance
and detect it without decoupling. To this experiment was given the name TROSY
(Transverse Relaxation Optimized Correlation SpectroscopY). If a 800MHz
spectrometer is available, it is possible to perform experiments based on TROSY that
would enable to solve the structure of a protein larger than 30 kDa. A TROSY
experiment was performed for cC5-7, together with a 1H/15N HSQC. It is evident that
the TROSY spectrum shows a lot more peaks if compared with the 1H/15N HSQC where
mainly just the peack corresponding to the flexible linker of cC5 are shown (Idowu et
al., 2003), this is a significant result that shows how this group of domains is rigid. In
fact while for a flexible protein of around 30 kDa, such as the group of domains cC1-
cC2, the 1H/15N HSQC presents a number of peaks consistent with the number of
residues present in the fragment, for a rigid protein of the same size much of the signal
is lost due to the transverse relaxation so that many peaks will not be visible;
performing a TROSY experiment, on the other hand, will give the opposite result,
giving a good

191
Fig
ure
4.2
4 1 H
/ 15
N-
HS
QC
spe
ctru
m o
f g
roup
of
dom
ains
cC
5-7
.Th
e e
xper
imen
t w
as
reco
rded
at
25
°C.
Thi
s sp
ect
rum
co
nfir
ms
tha
t th
e gr
oup
s o
f do
ma
ins
is f
old
ed
eve
n
thou
gh
the
nu
mb
er o
f p
eaks
is
not
con
sist
ent
with
th
e n
um
ber
of
resi
dues
in t
he
pro
tein
. B
eca
use
of t
he
hig
h m
ole
cula
r w
eig
ht t
he
be
st N
MR
exp
erim
ent
to
per
form
is t
he
1 H/
15 N
-TR
OS
Y
exp
erim
ent.
Pic
ture
ge
ner
ate
d w
ith T
ops
pin
NM
R.

192
Fig
ure
4.2
5 1 H
/ 15
N-T
RO
SY
spe
ctru
m f
or g
roup
of
dom
ains
cC
5-7.
It is
ob
viou
s fr
om
thi
s pi
ctu
re t
hat
usi
ng
the
1 H/1
5 N
TO
CS
Y e
xper
imen
t it
is p
oss
ible
to
obta
in m
ore
pea
ks
com
pare
d to
the
on
es
obt
ain
ed u
sin
g a
1 H
/ 15N
-HS
QC
. T
his
con
firm
s a
s e
xpec
ted
, tha
t th
e T
RO
SY
exp
eri
men
t is
be
tter
su
ited
to
stu
dypr
ote
ins
larg
er t
han
25
kD
a.

193
spectrum for rigid proteins and a bad spectrum for a flexible one. So given the results
obtained for the group of domains cC5-7, we can conclude that this fragment is rigid.
These results also confirms that the TROSY experiment is the best option when
studying rigid proteins bigger than 25 kDa. It is not the finality of this research to
determine the structure of the groups of domains cC5-7 but the quality of this TROSY
spectrum shows that it would be possible to determine its three dimensional structure.
Moreover, since we have shown that the group of domains cC5-7 is stable and expresses
well in bacteria, it would be possible to study the interaction with its hypothetic binding
partner cC8-10. Unfortunately it was not possible to perform a titration to study the
interaction between the two due to the failure to express the group of domains cC8-10,
as reported in the previous section. In conclusion it will be possible to investigate the
interaction between this central domains of the protein and the C-terminal part of
cMyBPC, once the technical problems concerning the latter will be overcome.
4.2 Discussion
4.2.1 Problem of the solubility of domain cC8
Domain cC8, together with the other C-terminal domains of cMyBPC, has shown a
tendency in precipitating into inclusion bodies and limited solubility. Interestingly, the
C-terminal domains are involved in sarcomere incorporation of cMyBPC, and this
features are common to the other isoforms of the protein. The region comprise between
cC7 and cC10 interacts with LMM, even though only domain cC10 seems to be
indispensable for the binding to occur. To achieve maximal binding, on the other hand,
the four C-terminal domains cC7-10 are necessary for cMyBPC to be properly

194
incorporated in the sarcomere (Welikson and Fischman, 2002). The cC8-10 region, also
binds to titin (Furst et al., 1992; Koretz et al., 1993; Labeit et al., 1997; Soteriou et al.,
1993), probably via domain cC9 and/ or cC10 (Freiburg and Gautel, 1996) interaction
that resulted fundamental for the sarcomere to assume its proper structure. All these
aspects point towards an important structural role of the C-terminus of cMyBPC that
could also motivate the insoluble character of these domains when expressed on their
own. It is in fact probable that the presence of the previous domains in the sequence
could stabilise the most terminal domains, such as cC9 and cC10, and that the presence
of other proteins with which the C-terminal domains of cMyBPC interact could play an
important role in the expression of these final domains of the protein.
Another important aspect is the presence of rare codons in the DNA sequence coding
for these domains, as seen for domain cC8 alone and, more importantly, for the group of
domains cC8-10, that could cause a reduction of the tRNA pools of the host organism,
E. Coli in this case, leading to a stop in the translational process, with the consequence
failure in the synthesis of the desired protein. This is not the case for N-terminal
domains, especially the other domain taken into account in this work, domain cC0, that
has a total lack of E. Coli rare codons and consequently is very well expressed by these
host cells.
In conclusion, it is possible that the insolubility problem of domain cC8 and even more
so of the group of domains cC8-10, could be caused by the differences in codon
preference between source and host organisms, and as such being a totally random
phenomenon that does not present any reason lying in the intrinsic structure and protein
synthesis in the real situation.

195
4.2.2 Stability of domain cC8
We have seen in the result section regarding domain cC8 that the main problem
encountered in working with this domain was the production of soluble protein. The
domain, in fact, was synthesised when expressed at 37°C as insoluble and had a high
tendency of precipitating in the so called inclusion bodies. In this situation it was
decided to perform a refolding procedure in order to completely denature the protein
and then allowing it to fold in its native structure removing the denaturant agent, urea
8M, in various steps in conditions of controlled temperature (4°C).
The protein obtained after the refolding procedure was tested in order to asses its
thermodynamic stability, this was motivated by the behaviour of the protein that had a
tendency to stick to surfaces, fact that suggested that cC8 could be misfolded, with
some hydrophobic residue exposed on the surface and capable of interacting with
membranes such as are present in concentrators and dialysis bags. To examine this
aspect of domain cC8 various experiments were performed, as stated in the result
section concerning this protein, comprising primarily in denaturation processes
followed by the different means of fluorescence spectroscopy, in presence of a
denaturant agent, and by 1H 1D NMR spectroscopy performed on the same sample at
different temperatures comprised between 5 and 55 °C.
4.2.2.1 Thermodynamic stability of domain cC8
From the urea denaturation studied by fluorescence spectroscopy it was possible to
conclude, by examination of the different spectra registered in the tryptophan region
comprised between 300 and 400 nm, that in presence of growing concentrations of urea,
196
the tryptophan residue present in the protein, passed from a buried state, characterised
by a fluorescence signal at 330 nm, to a situation where it was exposed on the surface,
giving a peak at 350 nm, typical of this residue when it is not buried in the hydrophobic
core of a protein. These results lead us to conclude that the protein is folded after the
refolding procedure, at least the part where the tryptophan is located. Using the program
Mathematica with the results obtained from this experiment, it was possible to calculate
the Gibbs free energy (∆G) and so to have a thermodynamic parameter to evaluate the
stability of domain cC8. ∆G is defined as
∆G= ∆H-T∆S
for processes at constant pressure and volume, as it is our case.
∆H is the energetic contribution, while ∆S is the entropic contribution. An important
role is played by the temperature of the system.
In general, a process is favoured if ∆G<0, the best situation being that of negative ∆H,
meaning that the system is at a minimum of energy, and positive ∆S, so the system is in
a situation of maximal entropy.
In the case of cC8, since we are considering the denaturation process, we obtain a
positive ∆G, in fact the value obtained for the protein in exam is 8.24 kJ; this is due to
the fact that the denaturation of the protein is not a favoured process in normal
conditions and it happens only in presence of a denaturant agent or at high temperatures.
In this case, the higher the ∆G, the higher is the stability of the protein, as the process
taken into account is the denaturation process.
The same value was determined for other domains of cMyBPC, like cC5 and cC0
(Idowu et al., 2003) and it was then possible to compare the value of this parameter for

197
the three domains. The values of ∆G obtained for these two domains are ∆GcC5= 2.83 kJ
and ∆GcC0= 37.74 kJ. This means that between the three protein here considered, the
most stable, being its denaturation process the less favourable, characterised by the
higher value of ∆G, is domain cC0; on the other hand cC5 resulted the less stable
domain of the group. Interestingly, domain cC8 resulted having an intermediate
stability. The stability of domain cC8 was also confirmed by an experimental procedure
carried out by leaving samples of a solution of cC8 in different conditions such as
different buffer composition (Gel filtration or NMR buffer) at different temperatures
(room temperature, 4°C, -20°C and -80°C) for 30 days. After this period of time a SDS-
PAGE analysis was performed that confirmed how the protein was stable in all the
condition tested as present in every sample without precipitation.
From these analysis it was possible to conclude that domain cC8 is stable enough to be
synthesised and purified in aqueous solution with the methodologies used in this
research work.
4.2.2.2 Stability of the hydrophobic core of the domain
Once assessed the thermodynamic stability of the domain, it was necessary to
understand whether the result of the refolding procedure was properly folded or not. To
do this a 1D 1H NMR spectroscopy analysis was performed at different temperatures,
bringing to the conclusion that the protein exists in two different conformations at low
temperatures and at room temperature. A melting curve was performed, registering a 1D
1H NMR spectrum at different temperatures, between 5 and 55°C at 5°C intervals. The
results, shown in picture 4.2, bring to the conclusion that the hydrophobic core of the
protein undergoes conformational changes going from 5°C to 25°C. The peaks at the

198
very right of the spectrum, at negative chemical shifts, are characteristic of buried
methyl groups that are shielded by the aromatic rings that with their ring current
produce an inducted magnetic field that has an opposite direction to the external applied
magnetic field, for this reason the nuclei are subjected to a weaker magnetic field and
result shielded compared to the normal methyl groups that give signals around 1 ppm.
Figure 4.26 Effect of the ring current generated by aromatic systems. The ring currents caused by the π electrons that form the aromatic system, generate an induced magnetic field that is in the opposite direction compared to the applied magnetic field B0 in the regions above or below the ring, while, as clearly depicted by the force lines , on the plane of the ring the induced magnetic field add up to the external magnetic field. For these reasons nuclei positioned on the ring plane, such as benzene hydrogens, will be de-shielded, experiencing a stronger magnetic field compared to nuclei not subjected to additional magnetic fields, while nuclei that are positioned in the two conical regions, distinguished in b) by a plus sign , will result shielded by the ring current and will have a lower chemical shift than expected. These nuclei tend to have negative chemical shifts in proteins and are at the very right of the 1H spectrum.
a) b)
B0
A peak positioned at -0.55 ppm was observed to split it two signals when the sample
was warmed from 5°C to 25°C, meaning that in this temperature interval the
hydrophobic core where the methyl group responsible of this signal is localised,
undergoes some conformational changes. The hypothesis at this point was that the

199
refolded domain was not very stable as it existed in different conformations according
to the temperature. However, the same experiment was performed on a sample of cC8
obtained using different strategies and not subjected to the refolding protocol as it was
synthesised as soluble protein, but the results were consistent, bringing to the
conclusion that the same phenomena happened in the soluble protein and are to be
considered intrinsic structural features of the domain.
In conclusion it was not possible to detect a difference between samples obtained by
refolding or by expression as soluble compound and, moreover, the refolded protein
gave thermodynamic results compatible with those of a stable protein. Apart from the
behaviour of domain cC8 obtained after refolding, that could bring us to the conclusion
that the refolded protein presented some hydrophobic residue on the surface, there was
no proof that could lead us to believe that the protein obtained after the refolding
procedure was misfolded. In any case it was preferable to produce the protein as a
soluble compound and this was achieved using different strategies.
4.2.3 Interaction between domains cC5 and cC8 of cMyBPC
The interaction between domain cC5 and domain cC8 of cMyBPC was suggested
(Moolman-Smook et al., 2002) together with the hypothesis that a second interaction
between domain cC7 and cC10 took place; these results lead the researchers to propose
the trimeric collar model that took these interactions into account. In this model, also
domains cC6 and cC9 are supposed to interact with one another.
As seen in the result section, soluble cC8 was obtained either as part of a fusion protein,
with TrxA and NusA respectively, or by itself and the interaction was studied with cC8
obtained with both these methods. In none of the 1H/15N HSQC titration experiments

200
performed on cC5 with different additions of cC8, was revealed a proof that the
interaction took place. In the cases where a fusion protein was involved it is possible,
even if not probable, that the protein fused with cC8 to increase its solubility, could
prevent the two proteins from interacting. This could be caused by the sterical
impediment that the fused partner could play. The best procedure would be to cut the
fusion protein away with TEV protease, as a TEV cut site is present in both pETM-20
and pETM-60 vectors between the two fused proteins. This, however was not done in
the first instance as it was not safe given the bad results obtained for domain cC8 alone
and the risk of it precipitating appeared quite relevant. In the meantime, moreover, other
strategies, were pursued and gave better results, so these analysis were not repeated on
cC8 cut from the two fusion proteins.
Using tRNA supplemented competent cells, such as Codon Plus and Arctic Express
cells (both from Stratagene) it was possible to produce soluble protein, easily purified,
to perform 1H/15N HSQC titration experiments on domain cC5, giving negative results.
In this case, in contrast with the techniques used previously, it was obtained a good
amount of domain cC8 that it was not present as part of a fusion protein, so these were
the best conditions to determine whether the interaction took place or not. The fact that
no positive result was detected induce to believe that the interaction between domain
cC5 and cC8 of cMyBPC does not take place and so that the trimeric collar is not a
probable model to describe how cMyBPC incorporate into the sarcomere. Moreover,
from personal correspondence with Drs. Pugh and Atkinson, collaborators of Moolman.
Smoock at the University of Western Cape in South Africa, we have learned that the
same analysis on domains cC7 and cC10 was carried out, performing a titration
followed by NMR spectroscopy on both labelled domains after the addition of a ratio
1:3 of the counterpart, in both cases without observing any shift of the peaks present in

201
the 1H/15N HSQC spectrum (unpublished data). They have also encountered great
difficulty in synthesising soluble cC8-10 that they intended to use to test its interaction
with domain cC5, thus studying the system analysed by surface Plasmon resonance
(Flashman et al., 2008; Moolman-Smook et al., 2002). Finally, the results obtained from
the TROSY experiment performed on the group of domains cC5-7, have shown that this
part of the protein is rigid, compared to the N-terminus that is flexible (Ababou et al.,
2008); this makes it even harder to believe that the central and C-terminal fragments of
cMyBPC could interact with one another to form a trimeric collar wrapped around the
myosin filament. All these negative results cast a doubt on the veracity of the original
yeast two hybrid assay and on the proposed trimeric collar model based on that result.
4.2.4 Conclusions
Given the difficulties encountered in the attempt to synthesise soluble samples of
domain cC8 of cMyBPC, the stability of the protein was studied using an array of
different techniques. As a result of these studies it was shown that domain cC8 has a
three dimensional fold and that it is thermodynamically stable. The problems faced in
the synthesis of the protein are probably due to the codon content of its coding gene that
create problems when trying to overexpress the protein in E. Coli, as using tRNA
supplemented host cells gave a good protein yield. Once the solubility problems have
been overcome, the possible interaction between domains cC5 and cC8 of cMyBPC was
investigated, failing to give positive results. Moreover, the central part of the cMyBPC,
formed by domains cC5, cC6 and cC7, has been shown to be rigid, and not flexible as it
should be to be able to wrap around the thick filament. All these facts suggest that the

202
interaction between cC5 and cC8 might not take place and that the trimeric collar model
is not a realistic hypothesis on how cMyBPC incorporate into the sarcomere.

203
Chapter 5
Conclusions
The first part of this research project focused on domain cC0 of cMyBPC; NMR was
used to both determine the three dimensional structure of the cardiac specific domain
cC0 and study its interaction with the Regulatory Light Chain of Myosin. The structure
has been determined to high precision, showing all the features for an IgI domain, being
formed, as expected, by two β-sheets that form a β-sandwich. An interesting
characteristic of domain cC0 is that despite having a very well defined fold and a very
compact structure, the first ten residues, containing proline residues together with
patches of positively charged amino acids, are unstructured and could stretch from the
domain to reach out for a still undefined binding partner. This most N-terminal
fragment of cMyBPC, in fact has shown not to take part to the interaction with the RLC,
suggesting that it might have a different function, specific to the cardiac isoform of
MyBPC.
From the titration performed with domain cC0 and RLC it is evident how the two
proteins interact via electrostatic surfaces, involving the majority of positively charged
residues positioned on the N-terminal side of the domain but crucially not two lysines
that are part of the unstructured region that precedes the A’ strand. From the interaction
studies carried out with both miniHMM and RLC is evident how domain cC0 interacts
with this region of the thick filament, confirming the hypothesised (Ababou et al., 2008)
mechanism by which cMyBPC could regulate cardiac contraction. It is important to
note that both cC0 and two of the three phosphorylation sites present in the cC1-cC2
linker, are specific for the cardiac isoform, suggesting a direct role of cMyBPC in the
continuous and rhythmic myocardial contraction. On the basis of what obtained from

204
interaction studies between cC1 and the S2∆ fragment of myosin, that is very close to
the RLC, it has been hypothesised that the N-terminus of cMyBPC would play an
important role in cardiac contraction, keeping the myosin heads in place to be ready to
interact with actin; upon phosphorylation of the cC1-cC2 linker the myosin heads are
free to move away from the thick filament to interact with actin, probably keeping the
N-terminus of cMyBPC attached through domains cC0 and cC1, being then facilitated
to go back to its resting position when the interaction with actin ceases and cMyBPC
returns to its unphosphorylated form. It is also possible that not all the myosin
molecules present in a sarcomere do iteract with actin in normal conditions, the ones
interacting with cMyBPC being impared to do so; they could work as reinforcement
when needed, allowing the heart to beat faster and increase its output upon cMyBPC
phosporilation.
The results obtained in this research work confirm this prominent role of cMyBPC in
cardiac contraction, via cC0 interaction with the Regulatory Light Chain.
As for the second part of this project, focusing on domain cC8 and its possible
interaction with domain cC5, it was not possible to conclude, from the results obtained,
that the two domains interact with each other. Different experiments have been
performed without a positive result obtained in this respect. From the results presented
in this work and other data, not shown here and unpublished, obtained by other groups
on the hypothesised interaction between domains cC7 and cC10, it is not possible to
assume as valid the trimeric collar proposed by Moolman- Smook (Moolman-Smook et
al., 2002) that was essentially based on the findings that the two couple of domains
taken in exam gave a positive result when tested for interaction with a yeast two hybrid
assay analysis.

205
Between the two models proposed for the incorporation of cMyBPC in the sarcomere is,
as a consequence, more reliable the one proposed by Squire (Squire et al., 2003) where
cMyBPC is arranged parallel to the myosin filament and the groups of domains cC5-7
and cC8-10 do not interact with each other. This is also confirmed by structural studies
carried on the thick filament that showed as the trimeric geometry proposed by
Moolman- Smoock and co-workers, would be too tight and so not allowed. In fact, the
diameter of the thick filament around which cMyBPC should wrap, is 13-15 nm (Squire
et al., 1998), resulting in 41-47 nm circumference, while the cMyBPC ring is supposed
to be formed by three sets of three IgI domains, that have a diameter of 3.4 -3.9 nm
(Improta et al., 1996; Pfuhl et al., 1995), giving a circumference of the collar around 35
nm, too short to be able to wrap around the think filament efficiently.
In conclusion, even though not positive and conclusive results can be shown regarding
the structure and the function of domain cC8, the results obtained by these studies are
relevant for what concern the sarcomeric structure and the role that cMyBPC have in it.
It remains to understand the function of domain cC8 and in this matter would be
interesting to solve the structure of the domain, now that it has been shown that the
protein can be produced in good quantity as a soluble compound. Moreover it will be
important to identify its binding partner to understand whether this domain has a role
other that structural in the protein.
Finally, now that domain cC8 has been shown not to be the binding partner of the
central domain of cMyBPC, it would be of vital importance to identify the protein that
interacts with it as to unveil the function of domain cC5 and, especially, of its cardiac
specific insertion that makes it so unique.

206
Appendices
A.1 Culture media and Buffers Luria Bertani culture medium Per litre: Yeast 5 g Tryptone 10 g NaCl 10 g Make up to volume with deionised H2O and autoclave. When cool, add the desired antibiotics. M9 medium modified according to Chen This medium allows the introduction of selective nitrogen and carbon isotopes into expressed proteins and was prepared as follows: Place 50ml 20X salts solution in a flask and make up to volume (1L) and autoclave. When cool, add the followings: MgSO4 1M 2ml CaCl2 0.1M 100 µl Glucose 6g dissolved in 50 ml of H20 NH4Cl 1g Vitamins 1ml Micronutrients 1ml.
20X salts solution (per 1L) Na2HPO4 120g KH2PO4 60g NaCl 10g Micronutrients NaMoO4 0.73 mg H3BO3 24.7 mg CoCl2 7.1 mg CuSO4 2.5 mg MnCl2 15.8 mg ZnSO4 2.9 mg

207
Vitamins Choline Chloride 0.4 g Folic Acid 0.5 g FF6 Wash Buffer PO4 20 mM NaCl 500 mM Imidazole 10 mM βME 2.5 mM NaN3 0.02% pH = 7.5-8.0 FF6 Elution Buffer PO4 20 mM NaCl 500 mM Imidazole 500 mM βME 2.5 mM NaN3 0.02% pH = 7.5-8.0 Gel Filtration Buffer PO4 40 mM NaCl 250 mM DTT 2mM pH = 7.0 NMR Buffer PO4 40 mM NaCl 50 mM DTT 2mM pH = 7.0

208
SOC medium Per litre: Yeast 5 g Tryptone 10 g NaCl 10 mM KCl 2.5 mM MgCl2 10 mM MgSO4 10 mM Glucose 20 mM TBS buffer Tris.HCl 50 mM NaCl 150 mM BME 2.5 mM pH 7.5.

209
Chimical shifts Chimical shifts
A.2 Sequence Specific Assignment for domain cC0
3 PRO CA 63.375
CB 31.835 CG 27.043 HA 4.235 HB2 2.196 HB3 1.852 HD2 3.731 HD3 3.608 HG2 1.931 HG3 1.931
4 GLY CA 45.043
H 8.439 HA2 3.854 HA3 3.819 N 108.904
5 LYS CA 55.709
CB 33.081 CD 28.328 CE 41.719 CG 25.020 H 7.974 HA 4.265 HB2 1.638 HB3 1.724 HD2 1.613 HD3 1.613 HE2 2.900 HE3 2.900 HG2 1.280 HG3 1.327 N 120.616
6 LYS CA 54.105
CB 32.381 H 8.291 HA 4.505 HB2 1.651 HB3 1.662 N 124.267
7 PRO CA 62.738
CB 31.942 CD 50.178 CG 27.191 HA 4.371 HB2 1.793 HB3 2.178
HD2 3.561 HD3 3.731 HG2 1.916 HG3 1.913
8 VAL CA 61.883
CB 32.743 CG1 20.005 CG2 20.005 H 8.244 HA 4.012 HB 1.956 HG11 0,588194 HG12 0,588194 HG13 0,588194 HG21 0,58125 HG22 0,58125 HG23 0,58125 N 120.593
9 SER CA 57.429
CB 63.804 H 8.296 HA 4.315 HB2 3.682 HB3 3.874 N 118.557
10 ALA CA 53.042
CB 19.919 H 8.214 HA 4.069 HB1 0,658333 HB2 0,658333 HB3 0,658333 N 125.277
11 PHE CA 57.727
CB 39.854 CD1 131.338 CD2 131.338 CE1 130.933 CE2 130.933 H 8.238 HA 4.816 HB2 2.608 HB3 2.827 HD1 6.982 HD2 6.982
Chemical Shift Chemical Shift

210
HE1 6.675 HE2 6.675 HZ 6.608 N 114.771
12 SER CA 58.641
CB 63.274 H 8.809 HA 4.395 HB2 3.510 HB3 3.747 N 119.399
13 LYS CA 56.362
CB 35.664 H 7.884 HA 4.575 HB2 1.654 HB3 1.653 HD2 1.489 HD3 1.543 HE2 2.843 HE3 2.843 HG2 1.249 HG3 1.358 N 121.565
14 LYS CA 53.374
CB 32.741 CD 29.184 CG 25.400 H 8.744 HA 4.313 HB2 1.578 HB3 1.578 HD2 1.619 HD3 1.671 HG2 1.029 HG3 1.368 N 125.096
15 PRO CA 62.248
CB 31.343 CD 49.521 CG 27.823 HA 4.693 HB2 1.584 HB3 0,578472 HD2 3.086 HD3 2.915 HG2 1.458 HG3 1.446
16 ARG CA 53.951 CB 32.456 CD 43.269 CG 27.018 H 8.118 HA 4.592 HB2 1.966 HB3 1.966 HD2 3.189 HD3 3.189 HG2 1.697 HG3 1.697 N 119.622
17 SER CA 59.888
CB 63.405 H 8.511 HA 5.281 HB2 4.304 HB3 4.238 N 117.935
18 VAL CA 60.004
CB 36.675 CG1 21.498 CG2 21.498 H 8.389 HA 4.660 HB 1.942 HG11 0,542361 HG12 0,542361 HG13 0,542361 HG21 0,546528 HG22 0,546528 HG23 0,546528 N 117.416
19 GLU CA 54.138
CB 31.658 H 8.190 HA 5.351 HB2 1.790 HB3 1.710 HG2 1.923 HG3 1.978 N 124.652
20 VAL CA 59.013
CB 36.048 CG1 21.605 CG2 20.411 H 8.616 HA 4.491

211
HB 1.846 HG11 0,453472 HG12 0,453472 HG13 0,453472 HG21 0,517361 HG22 0,517361 HG23 0,517361 N 120.245
21 ALA CA 51.307
CB 18.726 H 8.375 HA 4.364 HB1 1.275 HB2 1.275 HB3 1.275 N 126.173
22 ALA CA 53.104
CB 17.631 H 8.287 HA 3.899 HB1 1.284 HB2 1.284 HB3 1.284 N 123.045
23 GLY CA 44.741
H 9.862 HA2 3.255 HA3 4.371 N 112.047
24 SER CA 57.787
CB 63.296 H 7.944 HA 4.750 HB2 3.874 HB3 3.932 N 119.405
25 PRO CA 61.743
CB 31.751 CD 49.384 CG 26.460 HA 5.142 HB2 2.010 HB3 1.433 HD2 3.651 HD3 3.743 HG2 1.949 HG3 1.958
26 ALA CA 49.972 CB 22.877 H 8.688 HA 4.396 HB1 0,670833 HB2 0,670833 HB3 0,670833 N 123.024
27 VAL CA 60.899
CB 33.331 CG1 20.663 H 7.751 HA 4.522 HB 1.525 HG11 0,384028 HG12 0,384028 HG13 0,384028 HG21 0,455556 HG22 0,455556 HG23 0,455556 N 121.938
28 PHE CA 56.051
CB 42.218 CD1 133.446 CD2 133.446 CE1 132.118 CE2 132.118 H 9.196 HA 4.561 HB2 2.356 HB3 2.354 HD1 6.719 HD2 6.719 HE1 6.992 HE2 6.992 HZ 6.781 N 126.818
29 GLU CA 54.508
CB 33.692 H 8.583 HA 5.405 HB2 1.811 HB3 1.744 HG2 1.933 HG3 2.002 N 120.733
30 ALA CA 49.421
CB 23.523 H 9.484

212
HA 4.691 HB1 1.169 HB2 1.169 HB3 1.169 N 124.341
31 GLU CA 54.301
CB 33.336 CG 36.469 H 9.001 HA 6.016 HB2 1.955 HB3 1.779 HG2 2.114 HG3 2.162 N 120.169
32 THR CA 59.738
CB 69.791 CG2 22.123 H 9.330 HA 4.842 HB 4.515 HG21 0,477083 HG22 0,477083 HG23 0,477083 N 115.538
33 GLU CA 58.563
CB 29.836 CG 35.634 H 7.950 HA 3.944 HB2 1.911 HB3 1.839 HG2 2.019 HG3 2.143 N 119.723
34 ARG CA 53.485
CB 32.411 CD 42.823 CG 26.552 H 7.791 HA 4.490 HB2 1.743 HB3 1.511 HD2 3.134 HD3 3.134 HG2 1.488 HG3 1.486 N 113.251
35 ALA CA 51.762 H 8.614 HA 4.050 HB1 1.247 HB2 1.247 HB3 1.247 N 125.041
36 GLY CA 45.703
H 8.647 HA2 3.634 HA3 3.960 N 108.031
37 VAL CA 61.469
CB 32.942 CG1 21.112 CG2 21.112 H 7.077 HA 3.869 HB 1.750 HG11 0,447917 HG12 0,447917 HG13 0,447917 HG21 0,508333 HG22 0,508333 HG23 0,508333 N 119.457
38 LYS CA 55.873
CB 30.881 CD 26.795 CG 26.885 H 8.467 HA 4.267 HB2 1.755 HB3 1.656 HD2 3.085 HD3 3.085 HG2 1.502 HG3 1.502 N 128.214
39 VAL CA 60.114
CB 33.719 CG1 20.059 CG2 20.375 H 7.993 HA 4.537 HB 1.126 HG11 -0.059 HG12 -0.059 HG13 -0.059

213
HG21 -0.072 HG22 -0.072 HG23 -0.072 N 123.133
40 ARG CA 54.098
CB 33.701 CD 43.962 CG 26.219 H 8.507 HA 4.503 HB2 1.689 HB3 1.401 HD2 2.923 HD3 3.162 HG2 1.357 HG3 1.524 N 124.492
41 TRP CA 55.134
CB 31.370 CE3 121.341 CH2 123.826 CZ2 114.432 H 9.083 HA 5.311 HB2 2.829 HB3 3.113 HD1 7.214 HE1 10.427 HE3 7.464 HH2 6.488 HZ2 7.013 HZ3 6.434 N 123.367 NE1 129.996
42 GLN CA 54.445
CB 34.775 CG 33.383 H 9.532 HA 5.159 HB2 1.606 HB3 1.443 HE21 7.520 HE22 7.520 HG2 1.776 HG3 2.011 N 118.692
43 ARG CA 54.790
CB 32.202 CD 42.579
CG 26.530 H 8.209 HA 4.039 HB2 1.515 HB3 1.325 HD2 2.471 HD3 2.742 HG2 0,593056 HG3 1.032 N 119.579
46 SER CA 56.766
CB 64.815 H 7.513 HA 4.674 HB2 3.771 HB3 3.631 N 114.927
47 ASP CA 55.177
CB 40.385 H 8.698 HA 4.830 HB2 2.522 HB3 2.522 N 125.553
48 ILE CA 61.218
CB 39.345 CD1 13.311 CG1 27.943 CG2 17.465 H 8.781 HA 3.879 HB 1.326 HD11 0,270139 HD12 0,270139 HD13 0,270139 HG12 0,286806 HG13 0,294444 HG21 0,1125 HG22 0,1125 HG23 0,1125 N 124.032
49 SER CA 56.256
CB 65.243 H 7.963 HA 4.681 HB2 3.840 HB3 3.813 N 121.077

214
50 ALA CA 53.052 CB 18.821 H 8.516 HA 4.302 HB1 1.496 HB2 1.496 HB3 1.496 N 123.977
51 SER CA 56.946
CB 65.759 H 9.564 HA 4.797 HB2 4.118 HB3 4.245 N 117.545
52 ASN CA 55.930
CB 37.045 HB2 1.603
53 LYS CA 53.699
CB 33.687 CD 26.920 CE 42.339 CG 23.075 H 8.053 HA 3.995 HB2 1.049 HB3 1.364 HD2 1.307 HD3 1.541 HE2 2.413 HE3 2.776 HG2 0,507639 HG3 0.014 N 121.638
54 TYR CA 55.016
CB 40.147 CD1 134.261 CD2 134.261 CE1 118.090 CE2 118.090 H 6.779 HA 5.484 HB2 2.414 HB3 2.893 HD1 7.116 HD2 7.116 HE1 6.832 HE2 6.832 N 114.754
55 GLY CA 44.332
H 9.666 HA2 4.653 HA3 3.343 N 110.691
56 LEU CA 54.213
CB 45.206 CD1 25.698 CD2 25.698 CG 27.947 H 8.542 HA 5.138 HB2 1.609 HB3 1.609 HD11 0,478472 HD12 0,574306 HD13 0,574306 HD21 0,58125 HD22 0,565278 HD23 0,58125 HG 1.372 N 125.972
57 ALA CA 51.318
CB 22.564 H 8.594 HA 4.790 HB1 1.296 HB2 1.296 HB3 1.296 N 124.534
58 THR CA 62.034
CB 72.197 CG2 21.244 H 8.602 HA 4.862 HB 3.824 HG21 1.078 HG22 1.078 HG23 1.078 N 119.396
59 GLU CA 54.955
CB 31.121 CG 35.799 H 8.883 HA 4.378 HB2 1.872 HB3 1.775 HG2 2.025

215
HG3 2.031 N 128.594
60 GLY CA 47.127
H 9.045 HA2 4.081 HA3 3.529 N 117.047
61 THR CA 61.659
CB 68.477 CG2 21.961 H 8.332 HA 4.129 HB 4.973 HG21 0,626389 HG22 0,626389 HG23 0,626389 N 118.086
62 ARG CA 56.040 CB 31.775 CD 43.198 CG 27.651 H 7.906 HA 4.754 HB2 1.757 HB3 1.860 HD2 3.083 HD3 3.083 HG2 1.381 HG3 1.505 N 121.911
63 HIS CA 55.066
CB 33.860 CE1 139.890 H 9.212 HA 5.364 HB2 2.971 HB3 3.572 HD2 6.870 HE1 7.786 N 127.111
64 THR CA 60.691
CB 71.788 CG2 21.532 H 9.261 HA 5.510 HB 3.763 HG21 1.002
HG22 1.002 HG23 1.002 N 117.400
65 LEU CA 52.783
CB 41.350 CD1 23.288 CD2 25.721 CG 27.621 H 8.456 HA 4.642 HB2 -1.049 HB3 0,184028 HD11 0,268056 HD12 0,268056 HD13 0,268056 HD21 0,315278 HD22 0,315278 HD23 0,315278 HG 1.036 N 129.806
66 THR CA 61.072
CB 70.346 CG2 20.199 H 9.381 HA 4.975 HB 3.668 HG21 0,613889 HG22 0,613889 HG23 0,613889 N 123.110
67 VAL CA 61.300
CB 31.636 CG1 21.786 CG2 19.338 H 9.493 HA 4.317 HB 2.034 HG11 0,593056 HG12 0,593056 HG13 0,593056 HG21 0,593056 HG22 0,593056 HG23 0,593056 N 128.451
68 ARG CA 57.379
CB 30.481 CD 42.878 CG 29.809 H 8.500
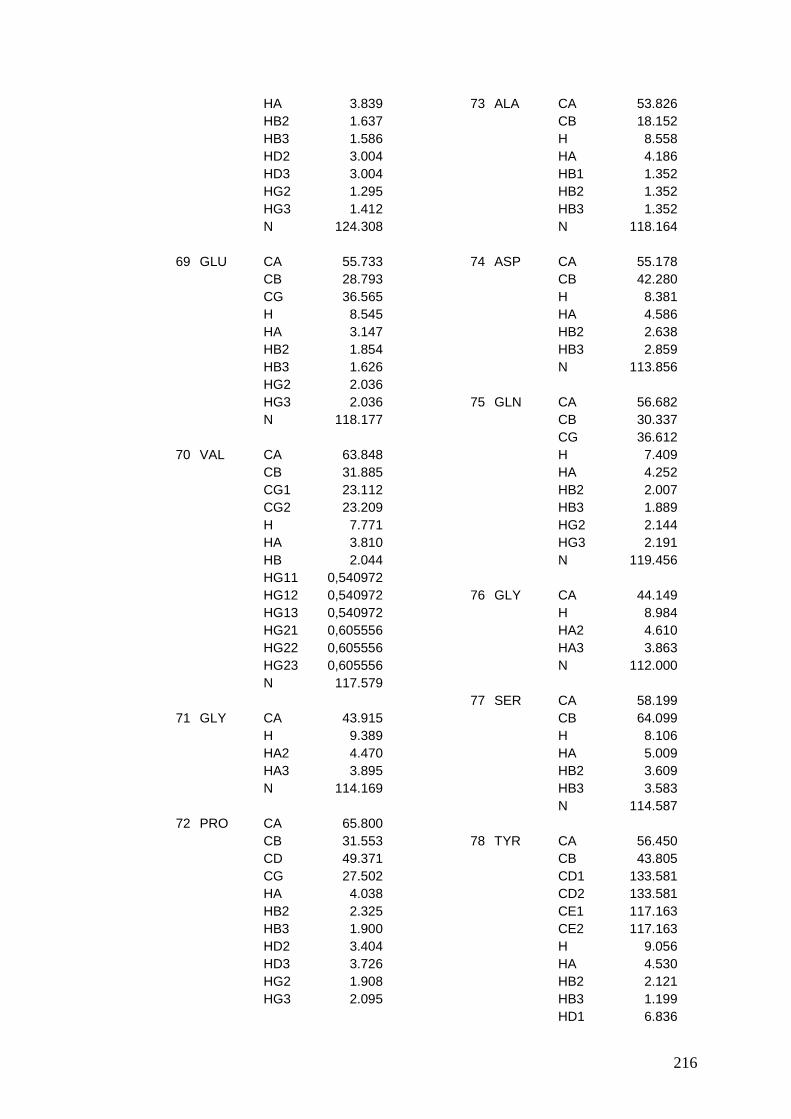
216
HA 3.839 HB2 1.637 HB3 1.586 HD2 3.004 HD3 3.004 HG2 1.295 HG3 1.412 N 124.308
69 GLU CA 55.733
CB 28.793 CG 36.565 H 8.545 HA 3.147 HB2 1.854 HB3 1.626 HG2 2.036 HG3 2.036 N 118.177
70 VAL CA 63.848
CB 31.885 CG1 23.112 CG2 23.209 H 7.771 HA 3.810 HB 2.044 HG11 0,540972 HG12 0,540972 HG13 0,540972 HG21 0,605556 HG22 0,605556 HG23 0,605556 N 117.579
71 GLY CA 43.915
H 9.389 HA2 4.470 HA3 3.895 N 114.169
72 PRO CA 65.800
CB 31.553 CD 49.371 CG 27.502 HA 4.038 HB2 2.325 HB3 1.900 HD2 3.404 HD3 3.726 HG2 1.908 HG3 2.095
73 ALA CA 53.826 CB 18.152 H 8.558 HA 4.186 HB1 1.352 HB2 1.352 HB3 1.352 N 118.164
74 ASP CA 55.178
CB 42.280 H 8.381 HA 4.586 HB2 2.638 HB3 2.859 N 113.856
75 GLN CA 56.682
CB 30.337 CG 36.612 H 7.409 HA 4.252 HB2 2.007 HB3 1.889 HG2 2.144 HG3 2.191 N 119.456
76 GLY CA 44.149
H 8.984 HA2 4.610 HA3 3.863 N 112.000
77 SER CA 58.199
CB 64.099 H 8.106 HA 5.009 HB2 3.609 HB3 3.583 N 114.587
78 TYR CA 56.450
CB 43.805 CD1 133.581 CD2 133.581 CE1 117.163 CE2 117.163 H 9.056 HA 4.530 HB2 2.121 HB3 1.199 HD1 6.836

217
HD2 6.836 HE1 6.590 HE2 6.590 N 127.751
79 ALA CA 50.806
CB 23.130 H 8.558 HA 5.233 HB1 1.027 HB2 1.027 HB3 1.027 N 118.647
80 VAL CA 58.760
CB 35.087 CG1 20.518 CG2 19.044 H 8.717 HA 4.905 HB 1.464 HG11 -0.604 HG12 -0.604 HG13 -0.604 HG21 0,092361 HG22 0,092361 HG23 0,092361 N 118.846
81 ILE CA 59.751
CB 42.030 CD1 13.667 CG1 27.852 CG2 17.484 H 8.739 HA 5.012 HB 1.342 HD11 0,358333 HD12 0,358333 HD13 0,358333 HG12 1.140 HG13 0,471528 HG21 0,446528 HG22 0,446528 HG23 0,446528 N 126.232
82 ALA CA 50.839
CB 21.160 H 8.388 HA 4.449 HB1 0,345833 HB2 0,345833
HB3 0,345833 N 128.273
83 GLY CA 46.917
H 8.841 HA2 3.815 HA3 3.509 N 113.065
85 SER CA 58.485
CB 64.397 H 8.423 HA 4.659 HB2 3.951 HB3 3.956 N 119.428
86 LYS CA 54.822
CB 35.340 CD 29.225 CE 41.340 CG 24.861 H 8.490 HA 5.243 HB2 1.631 HB3 1.507 HD2 1.431 HD3 1.431 HE2 2.592 HE3 2.592 HG2 0,654861 HG3 1.040 N 125.678
87 VAL CA 60.870
CB 34.228 CG1 21.238 CG2 21.404 H 8.863 HA 4.300 HB 1.633 HG11 0,583333 HG12 0,583333 HG13 0,583333 HG21 0,396528 HG22 0,396528 HG23 0,396528 N 126.631
88 LYS CA 55.124
CB 34.479 CD 29.073 CG 24.829

218
H 8.475 HA 5.065 HB2 1.756 HB3 1.615 HD2 1.527 HD3 1.527 HE2 2.784 HE3 2.784 HG2 1.245 HG3 1.354 N 125.592
89 PHE CA 56.311
CB 39.383 CD1 133.287 CD2 133.287 H 8.152 HA 4.601 HB2 2.657 HB3 2.886 HD1 6.387 HD2 6.387 HE1 5.811 HE2 5.811 HZ 6.748 N 119.005
90 ASP CA 53.532
CB 45.151 H 9.006 HA 5.565 HB2 2.464 HB3 2.464 N 118.742
91 LEU CA 54.171
CB 45.625 CD2 24.928 CG 28.631 H 8.733 HA 5.137 HB2 1.358 HB3 2.245 HD11 0,480556 HD12 0,480556 HD13 0,480556 HD21 0,577083 HD22 0,577083 HD23 0,577083 HG 1.358 N 121.344
92 LYS CA 54.910
CB 35.261 CD 28.775 CE 41.729 CG 25.087 H 8.892 HA 4.733 HB2 1.799 HB3 1.706 HD2 1.617 HD3 1.617 HE2 2.882 HE3 2.882 HG2 1.287 HG3 1.407 N 128.486
93 VAL CA 60.568
CB 33.024 CG1 21.362 CG2 21.362 H 8.563 HA 4.818 HB 1.712 HG11 0,41875 HG12 0,41875 HG13 0,41875 HG21 0,41875 HG22 0,41875 HG23 0,41875 N 124.459
94 ILE CA 60.238
CB 39.279 CD1 12.635 CG1 26.893 CG2 17.256 H 8.395 HA 4.162 HB 1.617 HD11 0,458333 HD12 0,458333 HD13 0,458333 HG12 0,583333 HG13 1.181 HG21 0,532639 HG22 0,532639 HG23 0,532639 N 126.433
95 GLU CA 56.738
CB 30.590 H 8.707 HA 4.317

219
HB2 1.979 HB3 1.979 HG2 2.245 HG3 2.245 N 126.596

220
A.3 Sequence alignment for cMyBPC
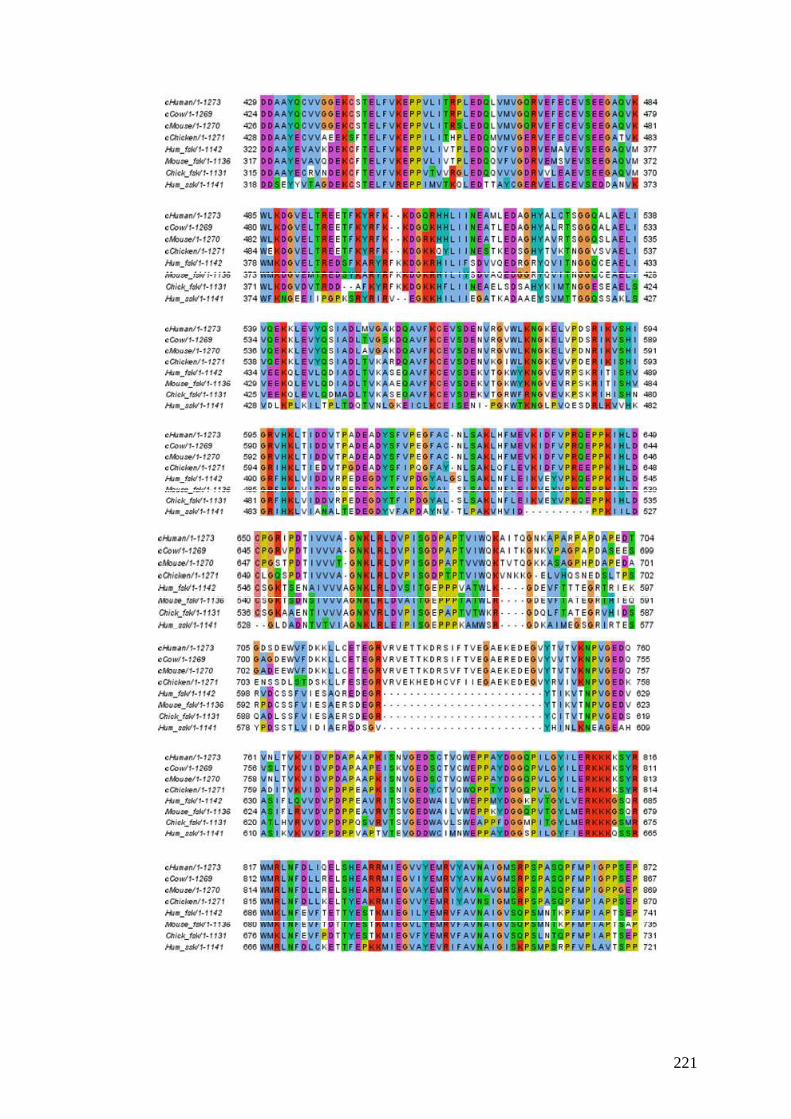
221

222

223
References
Ababou, A., M. Gautel, and M. Pfuhl. 2007. Dissecting the N-terminal myosin binding site of human cardiac myosin-binding protein C. Structure and myosin binding of domain C2. J Biol Chem. 282:9204-15.
Ababou, A., E. Rostkova, S. Mistry, C. Le Masurier, M. Gautel, and M. Pfuhl. 2008. Myosin binding protein C positioned to play a key role in regulation of muscle contraction: structure and interactions of domain C1. J Mol Biol. 384:615-30.
Alyonycheva, T.N., T. Mikawa, F.C. Reinach, and D.A. Fischman. 1997. Isoform-specific interaction of the myosin-binding proteins (MyBPs) with skeletal and cardiac myosin is a property of the C-terminal immunoglobulin domain. J Biol Chem. 272:20866-72.
Anan, R., H. Shono, and C. Tei. 2000. Novel cardiac beta-myosin heavy chain gene missense mutations (R869C and R870C) that cause familial hypertrophic cardiomyopathy. Hum Mutat. 15:584.
Arai, A., J.A. Spencer, and E.N. Olson. 2002. STARS, a striated muscle activator of Rho signaling and serum response factor-dependent transcription. J Biol Chem. 277:24453-9.
Arnold, K., L. Bordoli, J. Kopp, and T. Schwede. 2006. The SWISS-MODEL workspace: a web-based environment for protein structure homology modelling. Bioinformatics. 22:195-201.
Barbato, G., M. Ikura, L.E. Kay, R.W. Pastor, and A. Bax. 1992. Backbone dynamics of calmodulin studied by 15N relaxation using inverse detected two-dimensional NMR spectroscopy: the central helix is flexible. Biochemistry. 31:5269-78.
Bax, A., Clore, G.M., Gronenborg, A. M. 1990. H-1-H1 correlation via isotopic mixing of C-13 magnetization, a new 3-dimensional approch for assigning H-1 and C-13 spectra of C-13 enriched proteins. J Magn Reson. 88:425- 431.
Bennett, P.M., D.O. Furst, and M. Gautel. 1999. The C-protein (myosin binding protein C) family: regulators of contraction and sarcomere formation? Rev Physiol Biochem Pharmacol. 138:203-34.
Bodenhausen, G.R., DJ. 1980. Natural abundance N-15 NMR by enhanced heteronuclear spectroscopy. Chem. Phys. Lett. 69:185-189.
Bonne, G., L. Carrier, J. Bercovici, C. Cruaud, P. Richard, B. Hainque, M. Gautel, S. Labeit, M. James, J. Beckmann, J. Weissenbach, H.P. Vosberg, M. Fiszman, M. Komajda, and K. Schwartz. 1995. Cardiac myosin binding protein-C gene splice acceptor site mutation is associated with familial hypertrophic cardiomyopathy. Nat Genet. 11:438-40.
Bonne, G., L. Carrier, P. Richard, B. Hainque, and K. Schwartz. 1998. Familial hypertrophic cardiomyopathy: from mutations to functional defects. Circ Res. 83:580-93.
Branden, C.I., Tooze J. 1999. Introduction to Protein Structure. Garland Publisher. Brooks, C.L., M. Karplus, and B.M. Petit. 1988. Proteins: a Theoretical Prospective of
Dynamics, Structure and Thermodinamics. Wiley, New York. Charron, P., O. Dubourg, M. Desnos, M. Bennaceur, L. Carrier, A.C. Camproux, R.
Isnard, A. Hagege, J.M. Langlard, G. Bonne, P. Richard, B. Hainque, J.B. Bouhour, K. Schwartz, and M. Komajda. 1998. Clinical features and prognostic implications of familial hypertrophic cardiomyopathy related to the cardiac myosin-binding protein C gene. Circulation. 97:2230-6.

224
Clore, G.M., A. Szabo, A. Bax, L.E. Kay, P.C. Driscoll, and A.M. Gronenborn. 1990. Deviation from the single two- parameter model-free approach to the interpretation of nitrogen-15 nuclear magnetic relaxation of proteins. J Am Chem Soc. 112:4989- 4991.
Cornilescu, G., F. Delaglio, and A. Bax. 1999. Protein backbone angle restraints from searching a database for chemical shift and sequence homology. J Biomol NMR. 13:289-302.
Crilley, J.G., E.A. Boehm, E. Blair, B. Rajagopalan, A.M. Blamire, P. Styles, W.J. McKenna, I. Ostman-Smith, K. Clarke, and H. Watkins. 2003. Hypertrophic cardiomyopathy due to sarcomeric gene mutations is characterized by impaired energy metabolism irrespective of the degree of hypertrophy. J Am Coll Cardiol. 41:1776-82.
Daehmlow, S. 2002. Novel mutations in sarcomeric protein genes in dilated cardiomyopathy. Biochem Biophys Res Commun. 298:116-120.
Davis, J.S. 1988. Interaction of C-protein with pH 8.0 synthetic thick filaments prepared from the myosin of vertebrate skeletal muscle. J Muscle Res Cell Motil. 9:174-83.
de Marco, A., and V. De Marco. 2004. Bacteria co-transformed with recombinant proteins and chaperones cloned in independent plasmids are suitable for expression tuning. J Biotechnol. 109:45-52.
de Marco, A., S. Volrath, T. Bruyere, M. Law, and R. Fonne-Pfister. 2000. Recombinant maize protoporphyrinogen IX oxidase expressed in Escherichia coli forms complexes with GroEL and DnaK chaperones. Protein Expr Purif. 20:81-6.
De Marco, V., G. Stier, S. Blandin, and A. de Marco. 2004. The solubility and stability of recombinant proteins are increased by their fusion to NusA. Biochem Biophys Res Commun. 322:766-71.
de Pereda, J. 1999. Crystal structure of a tandem pair of fibronectin type III domains from the cytoplasmic tail of integrin alpha6beta4. 18:1468_1479.
Decker, R.S., M.L. Decker, I. Kulikovskaya, S. Nakamura, D.C. Lee, K. Harris, F.J. Klocke, and S. Winegrad. 2005. Myosin-binding protein C phosphorylation, myofibril structure, and contractile function during low-flow ischemia. Circulation. 111:906-12.
Dominguez, R., Y. Freyzon, K.M. Trybus, and C. Cohen. 1998. Crystal structure of a vertebrate smooth muscle myosin motor domain and its complex with the essential light chain: visualization of the pre-power stroke state. Cell. 94:559-71.
Eliezer, D., E. Kutluay, R. Bussell, Jr., and G. Browne. 2001. Conformational properties of alpha-synuclein in its free and lipid-associated states. J Mol Biol. 307:1061-73.
Flashman, E., L. Korkie, H. Watkins, C. Redwood, and J.C. Moolman-Smook. 2008. Support for a trimeric collar of myosin binding protein C in cardiac and fast skeletal muscle, but not in slow skeletal muscle. FEBS Lett. 582:434-8.
Flashman, E., C. Redwood, J. Moolman-Smook, and H. Watkins. 2004. Cardiac myosin binding protein C: its role in physiology and disease. Circ Res. 94:1279-89.
Flavigny, J., M. Souchet, P. Sebillon, I. Berrebi-Bertrand, B. Hainque, A. Mallet, A. Bril, K. Schwartz, and L. Carrier. 1999. COOH-terminal truncated cardiac myosin-binding protein C mutants resulting from familial hypertrophic cardiomyopathy mutations exhibit altered expression and/or incorporation in fetal rat cardiomyocytes. J Mol Biol. 294:443-56.

225
Freiburg, A., and M. Gautel. 1996. A molecular map of the interactions between titin and myosin-binding protein C. Implications for sarcomeric assembly in familial hypertrophic cardiomyopathy. Eur J Biochem. 235:317-23.
Furst, D.O., R. Nave, M. Osborn, and K. Weber. 1989. Repetitive titin epitopes with a 42 nm spacing coincide in relative position with known A band striations also identified by major myosin-associated proteins. An immunoelectron-microscopical study on myofibrils. J Cell Sci. 94 (Pt 1):119-25.
Furst, D.O., U. Vinkemeier, and K. Weber. 1992. Mammalian skeletal muscle C-protein: purification from bovine muscle, binding to titin and the characterization of a full-length human cDNA. J Cell Sci. 102 (Pt 4):769-78.
Garvey, J.L., E.G. Kranias, and R.J. Solaro. 1988. Phosphorylation of C-protein, troponin I and phospholamban in isolated rabbit hearts. Biochem J. 249:709-14.
Gautel, M., O. Zuffardi, A. Freiburg, and S. Labeit. 1995. Phosphorylation switches specific for the cardiac isoform of myosin binding protein-C: a modulator of cardiac contraction? Embo J. 14:1952-60.
Geisterfer-Lowrance, A.A., M. Christe, D.A. Conner, J.S. Ingwall, F.J. Schoen, C.E. Seidman, and J.G. Seidman. 1996. A mouse model of familial hypertrophic cardiomyopathy. Science. 272:731-4.
Geisterfer-Lowrance, A.A., S. Kass, G. Tanigawa, H.P. Vosberg, W. McKenna, C.E. Seidman, and J.G. Seidman. 1990. A molecular basis for familial hypertrophic cardiomyopathy: a beta cardiac myosin heavy chain gene missense mutation. Cell. 62:999-1006.
Gilbert, R., J.A. Cohen, S. Pardo, A. Basu, and D.A. Fischman. 1999. Identification of the A-band localization domain of myosin binding proteins C and H (MyBP-C, MyBP-H) in skeletal muscle. J Cell Sci. 112 (Pt 1):69-79.
Gilbert, R., M.G. Kelly, T. Mikawa, and D.A. Fischman. 1996. The carboxyl terminus of myosin binding protein C (MyBP-C, C-protein) specifies incorporation into the A-band of striated muscle. J Cell Sci. 109 (Pt 1):101-11.
Goll, C.M., A. Pastore, and M. Nilges. 1998. The three-dimensional structure of a type I module from titin: a prototype of intracellular fibronectin type III domains. Structure. 6:1291-302.
Gordon, A.M., E. Homsher, and M. Regnier. 2000. Regulation of contraction in striated muscle. Physiol Rev. 80:853-924.
Govada, L., L. Carpenter, P.C. da Fonseca, J.R. Helliwell, P. Rizkallah, E. Flashman, N.E. Chayen, C. Redwood, and J.M. Squire. 2008. Crystal structure of the C1 domain of cardiac myosin binding protein-C: implications for hypertrophic cardiomyopathy. J Mol Biol. 378:387-97.
Gregorio, C.C., H. Granzier, H. Sorimachi, and S. Labeit. 1999. Muscle assembly: a titanic achievement? Curr Opin Cell Biol. 11:18-25.
Gregorio, C.C., K. Trombitas, T. Centner, B. Kolmerer, G. Stier, K. Kunke, K. Suzuki, F. Obermayr, B. Herrmann, H. Granzier, H. Sorimachi, and S. Labeit. 1998. The NH2 terminus of titin spans the Z-disc: its interaction with a novel 19-kD ligand (T-cap) is required for sarcomeric integrity. J Cell Biol. 143:1013-27.
Gruen, M., and M. Gautel. 1999. Mutations in beta-myosin S2 that cause familial hypertrophic cardiomyopathy (FHC) abolish the interaction with the regulatory domain of myosin-binding protein-C. J Mol Biol. 286:933-49.
Gruen, M., H. Prinz, and M. Gautel. 1999. cAPK-phosphorylation controls the interaction of the regulatory domain of cardiac myosin binding protein C with myosin-S2 in an on-off fashion. FEBS Lett. 453:254-9.

226
Grzesiek, S., and A. Bax. 1993. Amino acid type determination in the sequential assignment procedure of uniformly 13C/15N-enriched proteins. J Biomol NMR. 3:185-204.
Grzesiek, S., H. Dobeli, R. Gentz, G. Garotta, A.M. Labhardt, and A. Bax. 1992. 1H, 13C, and 15N NMR backbone assignments and secondary structure of human interferon-gamma. Biochemistry. 31:8180-90.
Guntert, P. 2003. Automated NMR protein structure calculation. Progress in nuclear magnetic resonance spectroscopy. 43:105-125.
Guntert, P., C. Mumenthaler, and K. Wuthrich. 1997. Torsion angle dynamics for NMR structure calculation with the new program DYANA. J Mol Biol. 273:283-98.
Guyton, H. 2005. Textbook of Medical Physiology. Saunders (W.B.) Co Ltd. Hanson, J., and H.E. Huxley. 1957. Quantitative studies on the structure of cross-
striated myofibrils. II. Investigations by biochemical techniques. Biochim Biophys Acta. 23:250-60.
Harpaz, Y., and C. Chothia. 1994. Many of the immunoglobulin superfamily domains in cell adhesion molecules and surface receptors belong to a new structural set which is close to that containing variable domains. J Mol Biol. 238:528-39.
Harris, S.P., C.R. Bartley, T.A. Hacker, K.S. McDonald, P.S. Douglas, M.L. Greaser, P.A. Powers, and R.L. Moss. 2002. Hypertrophic cardiomyopathy in cardiac myosin binding protein-C knockout mice. Circ Res. 90:594-601.
Harrison, R.G. 2000. Expression of soluble heterologous proteins via fusion with NusA protein. inNovation (newsletter of Novagen).
Hartzell, H.C., and W.S. Sale. 1985. Structure of C protein purified from cardiac muscle. J Cell Biol. 100:208-15.
Hartzell, H.C., and L. Titus. 1982. Effects of cholinergic and adrenergic agonists on phosphorylation of a 165,000-dalton myofibrillar protein in intact cardiac muscle. J Biol Chem. 257:2111-20.
Hemmingsen, J.M., K.M. Gernert, J.S. Richardson, and D.C. Richardson. 1994. The tyrosine corner: a feature of most Greek key beta-barrel proteins. Protein Sci. 3:1927-37.
Herrmann, T., P. Güntert, and K. Wuthrich. 2002. Protein NMR structure determination with automated NOE assignment using the new software CANDID and the torsion angle dynamics algorithm DYANA. J Mol Biol. 319:209-27.
Herron, T.J., E. Rostkova, G. Kunst, R. Chaturvedi, M. Gautel, and J.C. Kentish. 2006. Activation of myocardial contraction by the N-terminal domains of myosin binding protein-C. Circ Res. 98:1290-8.
Holm, L., and J. Park. 2000. DaliLite workbench for protein structure comparison. Bioinformatics. 16:566-7.
Hooft, R.W., C. Sander, and G. Vriend. 1997. Objectively judging the quality of a protein structure from a Ramachandran plot. Comput Appl Biosci. 13:425-30.
Horowits, R. 1999. The physiological role of titin in striated muscle. Rev Physiol Biochem Pharmacol. 138:57-96.
Horowits, R., G. Luo, J.Q. Zhang, and A.H. Herrera. 1996. Nebulin and nebulin-related proteins in striated muscle. Adv Biophys. 33:143-50.
Houser, S.R., V. Piacentino, 3rd, and J. Weisser. 2000. Abnormalities of calcium cycling in the hypertrophied and failing heart. J Mol Cell Cardiol. 32:1595-607.
Huxley, A.F., and R. Niedergerke. 1954. Structural changes in muscle during contraction; interference microscopy of living muscle fibres. Nature. 173:971-3.
Huxley, H., and J. Hanson. 1954. Changes in the cross-striations of muscle during contraction and stretch and their structural interpretation. Nature. 173:973-6.

227
Huxley, H.E. 1957. The double array of filaments in cross-striated muscle. J Biophys Biochem Cytol. 3:631-48.
Huxley, H.E. 1963. Electron Microscope Studies On The Structure Of Natural And Synthetic Protein Filaments From Striated Muscle. J Mol Biol. 7:281-308.
Huxley, H.E. 1969. The mechanism of muscular contraction. Science. 164:1356-65. Huxley, H.E., and W. Brown. 1967. The low-angle x-ray diagram of vertebrate striated
muscle and its behaviour during contraction and rigor. J Mol Biol. 30:383-434. Huxley, H.E., and J. Hanson. 1957. Quantitative studies on the structure of cross-
striated myofibrils. I. Investigations by interference microscopy. Biochim Biophys Acta. 23:229-49.
Idowu, S.M., M. Gautel, S.J. Perkins, and M. Pfuhl. 2003. Structure, stability and dynamics of the central domain of cardiac myosin binding protein C (MyBP-C): implications for multidomain assembly and causes for cardiomyopathy. J Mol Biol. 329:745-61.
Ikura, M., L.E. Kay, and A. Bax. 1990. A novel approach for sequential assignment of 1H, 13C, and 15N spectra of proteins: heteronuclear triple-resonance three-dimensional NMR spectroscopy. Application to calmodulin. Biochemistry. 29:4659-67.
Improta, S., A.S. Politou, and A. Pastore. 1996. Immunoglobulin-like modules from titin I-band: extensible components of muscle elasticity. Structure. 4:323-37.
Jaaskelainen, P., J. Kuusisto, R. Miettinen, P. Karkkainen, S. Karkkainen, S. Heikkinen, P. Peltola, J. Pihlajamaki, I. Vauhkonen, and M. Laakso. 2002. Mutations in the cardiac myosin-binding protein C gene are the predominant cause of familial hypertrophic cardiomyopathy in eastern Finland. J Mol Med. 80:412-22.
Jardezky, O. 1996. Protein dynamics and conformational transitions in allosteric proteins. Prog Biophys Mol Biol. 65:171-219.
Jeffries, C.M., A.E. Whitten, S.P. Harris, and J. Trewhella. 2008. Small-angle X-ray scattering reveals the N-terminal domain organization of cardiac myosin binding protein C. J Mol Biol. 377:1186-99.
Kabsch, W., and J. Vandekerckhove. 1992. Structure and function of actin. Annu Rev Biophys Biomol Struct. 21:49-76.
Kapust, R.B., and D.S. Waugh. 1999. Escherichia coli maltose-binding protein is uncommonly effective at promoting the solubility of polypeptides to which it is fused. Protein Sci. 8:1668-74.
Kirkpatrick, S., C.D. Gelatt, Jr., and M.P. Vecchi. 1983. Optimization by Simulated Annealing. Science. 220:671-680.
Koretz, J.F. 1979a. Effects of C-protein on syntetic myosin filament structure. Biophys J. 27:433-446.
Koretz, J.F. 1979b. Effects of C-protein on synthetic myosin filament structure. Biophys J. 27:433-46.
Koretz, J.F., T.C. Irving, and K. Wang. 1993. Filamentous aggregates of native titin and binding of C-protein and AMP-deaminase. Arch Biochem Biophys. 304:305-9.
Kulikovskaya, I., G. McClellan, J. Flavigny, L. Carrier, and S. Winegrad. 2003. Effect of MyBP-C binding to actin on contractility in heart muscle. J Gen Physiol. 122:761-74.
Kunst, G., K.R. Kress, M. Gruen, D. Uttenweiler, M. Gautel, and R.H. Fink. 2000. Myosin binding protein C, a phosphorylation-dependent force regulator in muscle that controls the attachment of myosin heads by its interaction with myosin S2. Circ Res. 86:51-8.

228
La Vallie, E.R. 2000. Thioredoxin as a fusion partner for soluble recombinant protein production in Escherichia coli. Methods Enzymology.
Labeit, S., M. Gautel, A. Lakey, and J. Trinick. 1992. Towards a molecular understanding of titin. Embo J. 11:1711-6.
Labeit, S., and B. Kolmerer. 1995. Titins: giant proteins in charge of muscle ultrastructure and elasticity. Science. 270:293-6.
Labeit, S., B. Kolmerer, and W.A. Linke. 1997. The giant protein titin. Emerging roles in physiology and pathophysiology. Circ Res. 80:290-4.
Lankford, E.B., N.D. Epstein, L. Fananapazir, and H.L. Sweeney. 1995. Abnormal contractile properties of muscle fibers expressing beta-myosin heavy chain gene mutations in patients with hypertrophic cardiomyopathy. J Clin Invest. 95:1409-14.
Laskowski, R.A., J.A. Rullmannn, M.W. MacArthur, R. Kaptein, and J.M. Thornton. 1996. AQUA and PROCHECK-NMR: programs for checking the quality of protein structures solved by NMR. J Biomol NMR. 8:477-86.
LaVallie, E.R., E.A. DiBlasio, S. Kovacic, K.L. Grant, P.F. Schendel, and J.M. McCoy. 1993. A thioredoxin gene fusion expression system that circumvents inclusion body formation in the E. coli cytoplasm. Biotechnology (N Y). 11:187-93.
Lekanne Deprez, R.H., J.J. Muurling-Vlietman, J. Hruda, M.J. Baars, L.C. Wijnaendts, I. Stolte-Dijkstra, M. Alders, and J.M. van Hagen. 2006. Two cases of severe neonatal hypertrophic cardiomyopathy caused by compound heterozygous mutations in the MYBPC3 gene. J Med Genet. 43:829-32.
Levine, R., A. Weisberg, I. Kulikovskaya, G. McClellan, and S. Winegrad. 2001. Multiple structures of thick filaments in resting cardiac muscle and their influence on cross-bridge interactions. Biophys J. 81:1070-82.
Levine, R.J., Z. Yang, N.D. Epstein, L. Fananapazir, J.T. Stull, and H.L. Sweeney. 1998. Structural and functional responses of mammalian thick filaments to alterations in myosin regulatory light chains. J Struct Biol. 122:149-61.
Lipari, G., and A. Szabo. 1982a. Model-free approach to the interpretation of nuclear magnetic resonance relaxation in macromolecules. 1. Theory and range of validity. J Am Chem Soc. 104:4546- 4559.
Lipari, G., and A. Szabo. 1982b. Model-free approach to the interpretation of nuclear magnetic resonance relaxation in macromolecules. 2. Analysis of experimental results. J Am Chem Soc. 104:4559-4570.
Lowey, S., H.S. Slayter, A.G. Weeds, and H. Baker. 1969. Substructure of the myosin molecule. I. Subfragments of myosin by enzymic degradation. J Mol Biol. 42:1-29.
Main, A.L., T.S. Harvey, M. Baron, J. Boyd, and I.D. Campbell. 1992. The three-dimensional structure of the tenth type III module of fibronectin: an insight into RGD-mediated interactions. Cell. 71:671-8.
Makrides, S.C. 1996. Strategies for achieving high-level expression of genes in Escherichia coli. Microbiol Rev. 60:512-38.
Margossian, S.S., and H.S. Slayter. 1987. Electron microscopy of cardiac myosin: its shape and properties as determined by the regulatory light chain. J Muscle Res Cell Motil. 8:437-47.
Marian, A.J., Y. Wu, D.S. Lim, M. McCluggage, K. Youker, Q.T. Yu, R. Brugada, F. DeMayo, M. Quinones, and R. Roberts. 1999. A transgenic rabbit model for human hypertrophic cardiomyopathy. J Clin Invest. 104:1683-92.
Marion, D., P.C. Driscoll, L.E. Kay, P.T. Wingfield, A. Bax, A.M. Gronenborn, and G.M. Clore. 1989 a. Overcoming the overlap problem in the assignment of 1H

229
NMR spectra of larger proteins by use of three-dimensional heteronuclear 1H-15N Hartmann-Hahn-multiple quantum coherence and nuclear Overhauser-multiple quantum coherence spectroscopy: application to interleukin 1 beta. Biochemistry. 28:6150-6.
Marion, D., Kay,L.E., Sparks, S.W., Torchia, D.A., Bax, A. 1989 b. 3-Dimensional heteronuclear NMR of N-15 labeled proteins. J Am Chem Soc. 111:1515-1517.
Maron, B.J. 1996. Triggers for sudden cardiac death in the athlete. Cardiol Clin. 14:195-210.
Maron, B.J. 2002. Hypertrophic cardiomyopathy: a systematic review. Jama. 287:1308-20.
Maron, B.J., H. Niimura, S.A. Casey, M.K. Soper, G.B. Wright, J.G. Seidman, and C.E. Seidman. 2001. Development of left ventricular hypertrophy in adults in hypertrophic cardiomyopathy caused by cardiac myosin-binding protein C gene mutations. J Am Coll Cardiol. 38:315-21.
Maruyama, K. 1999. Comparative aspects of muscle elastic proteins. Rev Physiol Biochem Pharmacol. 138:1-18.
Matsubara, I. 1974. Light and x-ray diffraction studies on chick skeletal muscle under controlled physiological conditions. J Physiol. 238:473-86.
Matsubara, I., and B.M. Millman. 1974. X-ray diffraction patterns from mammalian heart muscle. J Mol Biol. 82:527-36.
Mayans, O., J. Wuerges, S. Canela, M. Gautel, and M. Wilmanns. 2001. Structural evidence for a possible role of reversible disulphide bridge formation in the elasticity of the muscle protein titin. Structure. 9:331-40.
McCammon, J.A., and S. Harvey. 1987. Dynamics of Proteins and Nuclei Acids. Cambridge University Press.
McClellan, G., I. Kulikovskaya, and S. Winegrad. 2001. Changes in cardiac contractility related to calcium-mediated changes in phosphorylation of myosin-binding protein C. Biophys J. 81:1083-92.
McConnell, B.K., K.A. Jones, D. Fatkin, L.H. Arroyo, R.T. Lee, O. Aristizabal, D.H. Turnbull, D. Georgakopoulos, D. Kass, M. Bond, H. Niimura, F.J. Schoen, D. Conner, D.A. Fischman, C.E. Seidman, and J.G. Seidman. 1999. Dilated cardiomyopathy in homozygous myosin-binding protein-C mutant mice. J Clin Invest. 104:1771.
McLachlan, A.D., and J. Karn. 1982. Periodic charge distributions in the myosin rod amino acid sequence match cross-bridge spacings in muscle. Nature. 299:226-31.
Meurs, K.M., X. Sanchez, R.M. David, N.E. Bowles, J.A. Towbin, P.J. Reiser, J.A. Kittleson, M.J. Munro, K. Dryburgh, K.A. Macdonald, and M.D. Kittleson. 2005. A cardiac myosin binding protein C mutation in the Maine Coon cat with familial hypertrophic cardiomyopathy. Hum Mol Genet. 14:3587-93.
Miroux, B., and J.E. Walker. 1996. Over-production of proteins in Escherichia coli: mutant hosts that allow synthesis of some membrane proteins and globular proteins at high levels. J Mol Biol. 260:289-98.
Mitraki, A.K., J. 1989. Protein folding intermediates and inclusion body formation. Bio/ Technology.
Miyamoto, C.A., D.A. Fischman, and F.C. Reinach. 1999. The interface between MyBP-C and myosin: site-directed mutagenesis of the CX myosin-binding domain of MyBP-C. J Muscle Res Cell Motil. 20:703-15.

230
Moncrief, N.D., R.H. Kretsinger, and M. Goodman. 1990. Evolution of EF-hand calcium-modulated proteins. I. Relationships based on amino acid sequences. J Mol Evol. 30:522-62.
Moolman-Smook, J., E. Flashman, W. de Lange, Z. Li, V. Corfield, C. Redwood, and H. Watkins. 2002. Identification of novel interactions between domains of Myosin binding protein-C that are modulated by hypertrophic cardiomyopathy missense mutations. Circ Res. 91:704-11.
Moolman-Smook, J.C., B. Mayosi, P. Brink, and V.A. Corfield. 1998. Identification of a new missense mutation in MyBP-C associated with hypertrophic cardiomyopathy. J Med Genet. 35:253-4.
Moos, C., C.M. Mason, J.M. Besterman, I.N. Feng, and J.H. Dubin. 1978. The binding of skeletal muscle C-protein to F-actin, and its relation to the interaction of actin with myosin subfragment-1. J Mol Biol. 124:571-86.
Moos, C., G. Offer, R. Starr, and P. Bennett. 1975. Interaction of C-protein with myosin, myosin rod and light meromyosin. J Mol Biol. 97:1-9.
Morner, S., P. Richard, E. Kazzam, U. Hellman, B. Hainque, K. Schwartz, and A. Waldenstrom. 2003. Identification of the genotypes causing hypertrophic cardiomyopathy in northern Sweden. J Mol Cell Cardiol. 35:841-9.
Mornet, D., R.U. Bertrand, P. Pantel, E. Audemard, and R. Kassab. 1981. Proteolytic approach to structure and function of actin recognition site in myosin heads. Biochemistry. 20:2110-20.
Mornet, D., P. Pantel, E. Audemard, and R. Kassab. 1979. The limited tryptic cleavage of chymotryptic S-1: an approach to the characterization of the actin site in myosin heads. Biochem Biophys Res Commun. 89:925-32.
Nanni, L., M. Pieroni, C. Chimenti, B. Simionati, R. Zimbello, A. Maseri, A. Frustaci, and G. Lanfranchi. 2003. Hypertrophic cardiomyopathy: two homozygous cases with "typical" hypertrophic cardiomyopathy and three new mutations in cases with progression to dilated cardiomyopathy. Biochem Biophys Res Commun. 309:391-8.
Niimura, H., L.L. Bachinski, S. Sangwatanaroj, H. Watkins, A.E. Chudley, W. McKenna, A. Kristinsson, R. Roberts, M. Sole, B.J. Maron, J.G. Seidman, and C.E. Seidman. 1998. Mutations in the gene for cardiac myosin-binding protein C and late-onset familial hypertrophic cardiomyopathy. N Engl J Med. 338:1248-57.
Niimura, H., K.K. Patton, W.J. McKenna, J. Soults, B.J. Maron, J.G. Seidman, and C.E. Seidman. 2002. Sarcomere protein gene mutations in hypertrophic cardiomyopathy of the elderly. Circulation. 105:446-51.
Nygren, P.A., S. Stahl, and M. Uhlen. 1994. Engineering proteins to facilitate bioprocessing. Trends Biotechnol. 12:184-8.
Offer, G., C. Moos, and R. Starr. 1973. A new protein of the thick filaments of vertebrate skeletal myofibrils. Extractions, purification and characterization. J Mol Biol. 74:653-76.
Okagaki, T., F.E. Weber, D.A. Fischman, K.T. Vaughan, T. Mikawa, and F.C. Reinach. 1993. The major myosin-binding domain of skeletal muscle MyBP-C (C protein) resides in the COOH-terminal, immunoglobulin C2 motif. J Cell Biol. 123:619-26.
Olsson, M.C., B.M. Palmer, B.L. Stauffer, L.A. Leinwand, and R.L. Moore. 2004. Morphological and functional alterations in ventricular myocytes from male transgenic mice with hypertrophic cardiomyopathy. Circ Res. 94:201-7.

231
Palmer, A.G., 3rd. 1997. Probing molecular motion by NMR. Curr Opin Struct Biol. 7:732-7.
Perry, S.V. 1998. Troponin T: genetics, properties and function. J Muscle Res Cell Motil. 19:575-602.
Perry, S.V. 2001. Vertebrate tropomyosin: distribution, properties and function. J Muscle Res Cell Motil. 22:5-49.
Pervushin, K., R. Riek, G. Wider, and K. Wuthrich. 1997. Attenuated T2 relaxation by mutual cancellation of dipole-dipole coupling and chemical shift anisotropy indicates an avenue to NMR structures of very large biological macromolecules in solution. Proc Natl Acad Sci U S A. 94:12366-71.
Pfuhl, M., M. Gautel, A.S. Politou, C. Joseph, and A. Pastore. 1995. Secondary structure determination by NMR spectroscopy of an immunoglobulin-like domain from the giant muscle protein titin. J Biomol NMR. 6:48-58.
Pollard, T.D. 1990. Actin. Curr Opin Cell Biol. 2:33-40. Port, J.D., and M.R. Bristow. 2001. Altered beta-adrenergic receptor gene regulation
and signaling in chronic heart failure. J Mol Cell Cardiol. 33:887-905. Prinz, W.A., F. Aslund, A. Holmgren, and J. Beckwith. 1997. The role of the
thioredoxin and glutaredoxin pathways in reducing protein disulfide bonds in the Escherichia coli cytoplasm. J Biol Chem. 272:15661-7.
Pryor, K.D., and B. Leiting. 1997. High-level expression of soluble protein in Escherichia coli using a His6-tag and maltose-binding-protein double-affinity fusion system. Protein Expr Purif. 10:309-19.
Ramachandran, G.N., C. Ramakrishnan, and V. Sasisekharan. 1963. Stereochemistry of polypeptide chain configurations. J Mol Biol. 7:95-9.
Rayment, I., W.R. Rypniewski, K. Schmidt-Base, R. Smith, D.R. Tomchick, M.M. Benning, D.A. Winkelmann, G. Wesenberg, and H.M. Holden. 1993. Three-dimensional structure of myosin subfragment-1: a molecular motor. Science. 261:50-8.
Razumova, M.V., J.F. Shaffer, A.Y. Tu, G.V. Flint, M. Regnier, and S.P. Harris. 2006. Effects of the N-terminal domains of myosin binding protein-C in an in vitro motility assay: Evidence for long-lived cross-bridges. J Biol Chem. 281:35846-54.
Reinach, F.C., K. Nagai, and J. Kendrick-Jones. 1986. Site-directed mutagenesis of the regulatory light-chain Ca2+/Mg2+ binding site and its role in hybrid myosins. Nature. 322:80-3.
Rhee, D.S., J.W. 1994. The premyofibil: evidence for its role in myofibrillogenesis. Cell Motil Cytoskeleton. 28:1-24.
Richard, P.C. 2003a. "Hypertrophic Cardiomyopathy: Distribution of Disease Genes, Spectrum of Mutations, and Implications for a Molecular Diagnosis Strategy." Circulation. 107:2227-2232.
Richard, P.C., P. 2003b. Hypertrophic Cardiomyopathy: Distribution of Disease Genes, Spectrum of Mutations, and Implications for a Molecular Diagnosis Strategy. Circulation. 107:2227-2232.
Richardson, J.S., E.D. Getzoff, and D.C. Richardson. 1978. The beta bulge: a common small unit of nonrepetitive protein structure. Proc Natl Acad Sci U S A. 75:2574-8.
Richardson, P., W. McKenna, M. Bristow, B. Maisch, B. Mautner, J. O'Connell, E. Olsen, G. Thiene, J. Goodwin, I. Gyarfas, I. Martin, and P. Nordet. 1996. Report of the 1995 World Health Organization/International Society and Federation of

232
Cardiology Task Force on the Definition and Classification of cardiomyopathies. Circulation. 93:841-2.
Rottbauer, W., M. Gautel, J. Zehelein, S. Labeit, W.M. Franz, C. Fischer, B. Vollrath, G. Mall, R. Dietz, W. Kubler, and H.A. Katus. 1997. Novel splice donor site mutation in the cardiac myosin-binding protein-C gene in familial hypertrophic cardiomyopathy. Characterization Of cardiac transcript and protein. J Clin Invest. 100:475-82.
Sadayappan, S., J. Gulick, H. Osinska, L.A. Martin, H.S. Hahn, G.W. Dorn, 2nd, R. Klevitsky, C.E. Seidman, J.G. Seidman, and J. Robbins. 2005. Cardiac myosin-binding protein-C phosphorylation and cardiac function. Circ Res. 97:1156-63.
Sauer, J., and P. Nygaard. 1999. Expression of the Methanobacterium thermoautotrophicum hpt gene, encoding hypoxanthine (Guanine) phosphoribosyltransferase, in Escherichia coli. J Bacteriol. 181:1958-62.
Schein, C. 1989. Production of soluble protein in bacteria. Bio/ Technology:1141- 1149. Schlender, K.K., and L.J. Bean. 1991. Phosphorylation of chicken cardiac C-protein by
calcium/calmodulin-dependent protein kinase II. J Biol Chem. 266:2811-7. Schlender, K.K., M.G. Hegazy, and T.J. Thysseril. 1987. Dephosphorylation of cardiac
myofibril C-protein by protein phosphatase 1 and protein phosphatase 2A. Biochim Biophys Acta. 928:312-9.
Schultheiss, T.L., Z.X. 1990. Differential distribution of subset of myofibrillar proteins in cardiac, nonstrated and strated myofibrils. J Cell Biol. 110:1159-1172.
Seidman, J.G., and C. Seidman. 2001. The genetic basis for cardiomyopathy: from mutation identification to mechanistic paradigms. Cell. 104:557-67.
Sharma, A., J.A. Askari, M.J. Humphries, E.Y. Jones, and D.I. Stuart. 1999. Crystal structure of a heparin- and integrin-binding segment of human fibronectin. Embo J. 18:1468-79.
Sheterline, P., J. Clayton, and J. Sparrow. 1995. Actin. Protein Profile. 2:1-103. Solaro, R.J., and H.M. Rarick. 1998. Troponin and tropomyosin: proteins that switch on
and tune in the activity of cardiac myofilaments. Circ Res. 83:471-80. Soteriou, A., M. Gamage, and J. Trinick. 1993. A survey of interactions made by the
giant protein titin. J Cell Sci. 104 (Pt 1):119-23. Spirito, P., C.E. Seidman, W.J. McKenna, and B.J. Maron. 1997. The management of
hypertrophic cardiomyopathy. N Engl J Med. 336:775-85. Squire, J., M. Cantino, M. Chew, R. Denny, J. Harford, L. Hudson, and P. Luther. 1998.
Myosin rod-packing schemes in vertebrate muscle thick filaments. J Struct Biol. 122:128-38.
Squire, J.M., P.K. Luther, and C. Knupp. 2003. Structural evidence for the interaction of C-protein (MyBP-C) with actin and sequence identification of a possible actin-binding domain. J Mol Biol. 331:713-24.
Starr, R., and G. Offer. 1978. The interaction of C-protein with heavy meromyosin and subfragment-2. Biochem J. 171:813-6.
Swan, R.C., and D.A. Fischman. 1986. Electron microscopy of C-protein molecules from chicken skeletal muscle. J Muscle Res Cell Motil. 7:160-6.
Szczesna, D., D. Ghosh, Q. Li, A.V. Gomes, G. Guzman, C. Arana, G. Zhi, J.T. Stull, and J.D. Potter. 2001. Familial hypertrophic cardiomyopathy mutations in the regulatory light chains of myosin affect their structure, Ca2+ binding, and phosphorylation. J Biol Chem. 276:7086-92.
Tardiff, J.C., S.M. Factor, B.D. Tompkins, T.E. Hewett, B.M. Palmer, R.L. Moore, S. Schwartz, J. Robbins, and L.A. Leinwand. 1998. A truncated cardiac troponin T

233
molecule in transgenic mice suggests multiple cellular mechanisms for familial hypertrophic cardiomyopathy. J Clin Invest. 101:2800-11.
Thompson, J.D., T.J. Gibson, F. Plewniak, F. Jeanmougin, and D.G. Higgins. 1997. The CLUSTAL_X windows interface: flexible strategies for multiple sequence alignment aided by quality analysis tools. Nucleic Acids Res. 25:4876-82.
Timson, D.J., and I.P. Trayer. 1997. The role of the proline-rich region in A1-type myosin essential light chains: implications for information transmission in the actomyosin complex. FEBS Lett. 400:31-6.
Trinick, J. 1996. Titin as a scaffold and spring. Cytoskeleton. Curr Biol. 6:258-60. van der Velden, J., Z. Papp, R. Zaremba, N.M. Boontje, J.W. de Jong, V.J. Owen, P.B.
Burton, P. Goldmann, K. Jaquet, and G.J. Stienen. 2003. Increased Ca2+-sensitivity of the contractile apparatus in end-stage human heart failure results from altered phosphorylation of contractile proteins. Cardiovasc Res. 57:37-47.
Van Driest, S.L., V.C. Vasile, S.R. Ommen, M.L. Will, A.J. Tajik, B.J. Gersh, and M.J. Ackerman. 2004. Myosin binding protein C mutations and compound heterozygosity in hypertrophic cardiomyopathy. J Am Coll Cardiol. 44:1903-10.
Vibert, P., and C. Cohen. 1988. Domains, motions and regulation in the myosin head. J Muscle Res Cell Motil. 9:296-305.
Wagner, G., S. Hyberts, and J.W. Peng. 1993. Study of protein dynamics by NMR. Macmillan, London. 220-257 pp.
Wang, K., and J. Wright. 1988. Architecture of the sarcomere matrix of skeletal muscle: immunoelectron microscopic evidence that suggests a set of parallel inextensible nebulin filaments anchored at the Z line. J Cell Biol. 107:2199-212.
Watkins, H., D. Conner, L. Thierfelder, J.A. Jarcho, C. MacRae, W.J. McKenna, B.J. Maron, J.G. Seidman, and C.E. Seidman. 1995a. Mutations in the cardiac myosin binding protein-C gene on chromosome 11 cause familial hypertrophic cardiomyopathy. Nat Genet. 11:434-7.
Watkins, H., W.J. McKenna, L. Thierfelder, H.J. Suk, R. Anan, A. O'Donoghue, P. Spirito, A. Matsumori, C.S. Moravec, J.G. Seidman, and et al. 1995b. Mutations in the genes for cardiac troponin T and alpha-tropomyosin in hypertrophic cardiomyopathy. N Engl J Med. 332:1058-64.
Watkins, H., A. Rosenzweig, D.S. Hwang, T. Levi, W. McKenna, C.E. Seidman, and J.G. Seidman. 1992. Characteristics and prognostic implications of myosin missense mutations in familial hypertrophic cardiomyopathy. N Engl J Med. 326:1108-14.
Weisberg, A., and S. Winegrad. 1996. Alteration of myosin cross bridges by phosphorylation of myosin-binding protein C in cardiac muscle. Proc Natl Acad Sci U S A. 93:8999-9003.
Weisberg, A., and S. Winegrad. 1998. Relation between crossbridge structure and actomyosin ATPase activity in rat heart. Circ Res. 83:60-72.
Welikson, R.E., and D.A. Fischman. 2002. The C-terminal IgI domains of myosin-binding proteins C and H (MyBP-C and MyBP-H) are both necessary and sufficient for the intracellular crosslinking of sarcomeric myosin in transfected non-muscle cells. J Cell Sci. 115:3517-26.
Whiting, A., J. Wardale, and J. Trinick. 1989. Does titin regulate the length of muscle thick filaments? J Mol Biol. 205:263-8.
Winegrad, S. 1999. Cardiac myosin binding protein C. Circ Res. 84:1117-26. Winegrad, S. 2000. Myosin binding protein C, a potential regulator of cardiac
contractility. Circ Res. 86:6-7.

234
Witt, C.C., B. Gerull, M.J. Davies, T. Centner, W.A. Linke, and L. Thierfelder. 2001. Hypercontractile properties of cardiac muscle fibers in a knock-in mouse model of cardiac myosin-binding protein-C. J Biol Chem. 276:5353-9.
Wittekind, M.M., L. 1993. HNCACB, a high-sensitivity 3D NMR experiment to correlate amide- proton and nitrogen resonances with the alpha- carbon and beta- carbon resonances in proteins. J Magn Reson. 101:201- 205.
Yamamoto, K. 1986. The binding of skeletal muscle C-protein to regulated actin. FEBS Lett. 208:123-7.
Yamamoto, K., and C. Moos. 1983. The C-proteins of rabbit red, white, and cardiac muscles. J Biol Chem. 258:8395-401.
Yang, Q., A. Sanbe, H. Osinska, T.E. Hewett, R. Klevitsky, and J. Robbins. 1998. A mouse model of myosin binding protein C human familial hypertrophic cardiomyopathy. J Clin Invest. 102:1292-300.
Yang, Q., A. Sanbe, H. Osinska, T.E. Hewett, R. Klevitsky, and J. Robbins. 1999. In vivo modeling of myosin binding protein C familial hypertrophic cardiomyopathy. Circ Res. 85:841-7.
Yu, B., J.A. French, L. Carrier, R.W. Jeremy, D.R. McTaggart, M.R. Nicholson, B. Hambly, C. Semsarian, D.R. Richmond, K. Schwartz, and R.J. Trent. 1998. Molecular pathology of familial hypertrophic cardiomyopathy caused by mutations in the cardiac myosin binding protein C gene. J Med Genet. 35:205-10.
Zot, A.S., and J.D. Potter. 1987. Structural aspects of troponin-tropomyosin regulation of skeletal muscle contraction. Annu Rev Biophys Biophys Chem. 16:535-59.