investigation of cryogenic cooling systems activated by ... · possess different configurations and...
TRANSCRIPT

S. Sobol, G. Grossman
Technion – Israel Institute of Technology Haifa, Israel 32000
ABSTRACT
A compressor for a cryocooler based on a new drive mechanism employing a piezo actuator with mechanical amplification was developed theoretically and was built practically during this research. The compressor development includes modeling, calculations, optimization and dynamic simulations of the entire system involving the ANSYS finite elements software. An approximate linear analytical model of the compressor was also developed. The analytical model confirms the numerical results and enables parametric analysis for static and harmonic system responses as well as further compressor design for specific performances. The entire compressor has been manufactured and assembled, and has been tested in the laboratory. Good qualitative and partial numerical agreements were found between the actual compressor experimental results, and both the analytical and the ANSYS models.
INTRODUCTION
All Stirling-type cryocoolers employ a pressure wave generator, or valve-less compressor, to produce an oscillating pressure in the working gas. The pressure wave generator is a critical component particularly in pulse tube cryocoolers, since it is the only mechanically active component subject to wear and failure. Therefore, the lifetime and reliability of the cryocooler depends mostly on the compressor.
Each compressor involves some motor, which activates the gas oscillator, commonly presented by some kind of a piston or a membrane. Both the motor and the gas oscillator may possess different configurations and reciprocal attachments. Mainly two compressor types are employed in cryocoolers today. The rotary compressor is driven by a traditional rotary electrical motor involving a crankshaft mechanism transforming the motor rotation into linear movement. The linear compressor involves a solenoid operated electromagnetic valve, which produces a direct linear sine motion. The above-mentioned types of motors and gas oscillators have a variety of subtypes.
Both rotary and linear motor types possess some disadvantages. A rotary compressor has generally a shorter lifetime than a linear one due to wear of bearings and enhanced piston-cylinder wear caused by radial forces applied by the crank shaft mechanism. Moreover, a rotary compressor produces a troublesome angular momentum, which is hard to eliminate or reduce. Disadvantages of the linear compressors are a lower efficiency, complicated electronic and control systems, increased weight and volume (particularly due to the electronics).
Investigation of Cryogenic Cooling Systems
Activated by Piezoelectric Elements
289

transforming energy into motion applicable to miniature actuators. Several general conclusions can be drawn from the survey. First, electrostatic and electromagnetic type devices provide efficient operation and low forces. Piezoelectric devices are excellent for large force, small displacement applications where higher voltages are available. Other methods of the motion generation considered in the survey are less compatible with a high performance compressor or have not been studied sufficiently. According to the survey the piezoelectric devices exhibit the highest efficiency, fast speed of operation and high power density relative to other methods. These advantages make the piezoelectric devices potentially attractive for implementation in the miniature cryogenic compressors.
The major problem in employing the piezo actuators is an extremely small elongation of the piezo materials, which is about 0.1% of the total actuator length, and is on the order of microns in standard piezo actuators. For the cooling cycle it is required to produce cooling gas motion amplitude on the order of millimeters and to apply on the gas pressures on the order of atmospheres. Therefore, the main goal of this research has been to develop an efficient motion amplification and transfer of force from a piezo actuator to the cooling gas oscillator. Other disadvantages of a piezo actuator are a high supply voltage needed – typically between 60 and 1000 Volts, large hysteresis and creep (drift). The last two disadvantages are not relevant in our applications since the piezo actuator is intended to be applied in a dynamic periodic mode.
Amplifier mechanisms for piezo actuators can be broadly classified into four groups: directly amplified mechanisms, accumulating mechanisms, ultrasonic mechanisms and pump actuator structures. Directly amplified mechanisms are the simplest and are quite effective, especially for low amplification ratios. They include one or two stage mechanical levers with either diamond or elliptical shaped structures or direct hydraulic amplification systems. Mechanical systems usually use a solid hinge as a rotating point to lever the force and the movement. The output force of the lever system is significantly smaller than the actuator force not only because the amplification ratio but also due to a finite stiffness of the lever. Hydraulic amplification systems employ an incompressible liquid, which transfers a volumetric flow change from a large area diaphragm to a small area diaphragm or a piston. Hydraulic systems are generally stiffer than mechanical (particularly in large amplification systems), more compact, and their compactness is weakly dependent on the amplification ratio. On the other hand, in dynamic operation the efficiency of the hydraulic amplification systems decreases with a flow speed due to the viscous friction losses, while the lever amplification systems become more efficient with frequency due to the resonance effect. As a conclusion, for the large amplification ratios the hydraulic system is preferred at 'low' working frequencies, where the viscous friction forces can be neglected. Mechanical amplifiers should be perfect while operating at resonance. In this case the efficiency of the amplification system should be close to one.
In this work a mechanical resonant system was chosen for providing motion amplification of a piezoelectric actuator. Three models of the compressor are involved in the study: numerical finite elements ANSYS® model, analytical model approximating the amplification system by a linear elastic lever, and actual experimental prototypes. Both theoretical models are intended to provide a design tool for the proposed compressor in the steady state and dynamic modes, while the function of the actual prototypes is an experimental validation of the models. The analytical model is preferred for comparison with the actual system since it is much more intuitive for qualitative understanding and does not require considerable calculation time as does the ANSYS model.
THEORETICAL MODELS OF THE PROPOSED AMPLIFICATION SYSTEM
The proposed amplification system is intended to supply a significant piston motion for a pulse-tube cryocooler employing a miniature PZT stack actuator. The principle of the amplifier is based on a two-steps mechanical lever of special configuration. Figure 1 illustrates the symmetric half of the system (with respect to the Y axis) schematically and numerically as it is was modeled in ANSYS® - finite elements software.
Gilbertson and Busch (199 ) first presented a survey of ten different methods of 6
290 compreSSor Development anD moDeling

Idealized Kinematics Of The Rigid Amplification System
Bold lines on the scheme (Figure 1 left) represent the initial system structure, while dashed lines approximate the shape of the structure after being deflected by the PZT actuator. Elongation of the PZT actuator, x, is transferred completely to the rigid L-shaped lever marked by parameters L1-L2-L3 by a semi-rigid L-shaped link, marked by length L, through a revolute joint. The finite bending stiffness of the semi-rigid link is vital for providing a rotation of the L1-L2-L3 lever. The tension stiffness of the link L is assumed infinite. The ratio L3/L1 provides the first-step amplification of the system. The second step of the amplification is provided by rigid link L4 connected to L3 by a revolute joint at specific angle. The compressor piston is connected to the other end of link L4, which produces a final amplified motion y. The second-step amplification is possible as long as the angle between L4 and -X axis direction, Ө, is bounded between 0 and 45º (not including the boundaries). The following relation can be created employing the Pythagoras' theorem according to the Fig.1 (left) nomenclature: ( ) ( )2 22 2 2
4L a b a a b b= + = − ∆ + + ∆ (1) Solving the last equation for ∆b provides the displacement of the piston as a result of change in ∆a, which is given by the following equation:
3
1
La xL
∆ = (2)
The final displacement of the piston, marked by y, is the sum of the vertical displacement of the link L1-L2-L3 and the elongation of distance b:
2
2 3 31 2
1 1 1
L LL Ly x b 2a x x bL L L
⎡ ⎤⎛ ⎞+ ⎢ ⎥= + + − −⎜ ⎟⎢ ⎥⎝ ⎠⎣ ⎦
(3)
An approximate linear relation between y and x can be obtained using the first order term of the power series expansion for y about the point x=0:
Figure 1. Indeterminate schematic kinematics (left) and a full ANSYS model of the amplification system in the scaled deformed mode (right).
291Cooling SySTem ACTivATeD by PiezoeleCTriC elemenTS

32
1 1
LL ay 1 xL L b
⎛ ⎞≈ + +⎜ ⎟⎝ ⎠
(4)
It is obvious that the dominant term in the amplification ratio, defined by y/x, is the last term in (4), since it represents a product of both amplification steps. Therefore, in order to obtain a better amplification, a larger ratio between L3 and L1, and a smaller angle Ө must be selected.
Numerical Finite Elements ANSYS Model
Figure 1 (right) illustrates the entire system assembly as it was modeled in ANSYS finite elements software after being deflected by the piezo actuator. In this case the dashed lines plot the original contour of the structure. The main system area is meshed with 2-D 6-node triangular structural solid elements named PLANE2 in ANSYS. An option of plane stress with thickness input is applied to the elements. The second-step amplification link is simulated by a link element with a constant cross section. The angle of the link with respect to the -X axis is set to 10°. A mass element simulates the mass of the piston. Line 1 is subject to the rigid attachment, lines 2 and 3 are defined as symmetric boundaries above the YZ plane. Spring-damper element 1 simulates the internal PZT properties, while the external gas stiffness and damping are simulated by spring-damper 2. Two identical forces generated by the PZT actuator, 1/2FPZT, are applied on the PZT spring-damper ends.
The overall size of the first-step amplification frame is restricted by square 50x50 mm with 13 mm thickness. The PZT stack actuator restricts the internal space of the frame by rectangular 17x29.5 mm. Ten additional independent parameters shape the inner contours of the ANSYS model, and they are exploited for the system performances optimization.
The first-step amplification frame consists of a single component, made from AISI 4340 steel. The complexity of the component is not too high, so that the component can be manufactured employing conventional machining process. No fatigue failure is expected in the frame since the maximum equivalent stress does not exceed 200 MPa, while the yield stress of the employed steel has been estimated at 600-700 MPa.
Elastic Lever Model
An approximate linear model of the proposed amplification system can be represented as a combination of an elastic lever, springs, lumped masses and damping coefficients, according to the scheme on Figure 2. (Note: Parameters L1, L2, L3 do not match the nomenclature of the schematic drawing in Figure 1 - left)
The PZT stiffness in engineering design is normally expressed in terms of the spring constant kPZT, which describes the deformation of the body in response to an external force. For small external forces and small-signal conditions the following equation is valid for the PZT stack actuators: PZT PZTF k x= (5) Whereas the stiffness of the external springy force is on the order of the PZT stiffness, both stiffnesses can be simply combined and substituted in equation (5). One of the additional stiffnesses in the actual amplification system is the stiffness of the bending joints of the first-step amplification frame. In the analytical model the stiffness of the bending joints is approximated by parameter kj.
The masses m1, m2 and m3 in Figure 2 represent a PZT actuator, the lever and the piston lumped masses respectively. There is not much benefit in considering m2 as an additional degree of freedom whereas the mode of the m2 motion has too high a frequency, which is out of our interest. For simplicity it is proposed to distribute mass m2 among two other masses in the relative location ratios. The distribution of m2 creates new effective masses, M1 and M3, which replace masses m1 and m3 according to the following equations:
( )1 1 2 2
3 3 2 2
M m 1 r mM m r m
= + −
= + (6)
292 compreSSor Development anD moDeling

Where, r2 is the relative center of mass of the lever. In the current analytical model r2 is equal to the following ratio: r2 = (L2-L1)/(L3-L1).
The unloaded lever is plotted by a continues line connected to a static revolute joint O. If the lever was completely rigid or if the external force, Fext, was zero, the lever would possess a dotted shape as a result of the PZT force application. In case of the rigid lever the amplification ratio is R=L3/L1. If the lever possesses some elasticity, the stiffness of the lever, ka, can be obtained from the following relation: ext
a
Fy Rxk
= − (7)
Parameters c1 and c3 represent damping coefficients of the PZT and the external gas, respectively. Parameter ke is the gas stiffness in a special case of the model, which assumes the external force being a pure springy load. The gas stiffness can be calculated employing an ideal gas equation and assuming either adiabatic or isothermal quasistatic compression of the cooling gas. In case of the pure springy external force the motion equations of the system can be derived as follows:
( ) ( )( )
1 PZT PZT j a 1
3 e a 3
M x F k k x Rk Rx y c x
M y k y k y Rx c y
⎧ = − + − − −⎪⎨
= − − − −⎪⎩ (8)
The motion equations were solved for obtaining the following transfer functions with a complex argument s:
( ) ( ) ( ) ( )
( ) ( ) ( ) ( )
23 3 3
4 3 2 2PZT 1 3 3 1 1 3 1 3 3 1 1 3 3 1 1 3 1 3 13
134 3 2 2
PZT 1 3 3 1 1 3 1 3 3 1 1 3 3 1 1 3 1 3 13
132
3 3 3
M s c s KxF M M s c M c M s M K M K c c s c K c K s K K K
KyF M M s c M c M s M K M K c c s c K c K s K K K
Kyx M s c s K
+ +=
+ + + + + + + + −
=+ + + + + + + + −
=+ +
21 PZT j a 13 a 3 e aK k k k R ; K k R; K k k= + + = = + (10)
System (9) has three natural frequencies. The first (the lowest), f1, corresponds to the maximum amplitude of the piston at the desired operating mode. The second frequency, f2, corresponds to the anti-resonance of the PZT and consequently to the maximum amplification ratio y/x. The third frequency, f3, is the highest and it corresponds to the maximum PZT amplitude. The natural frequencies are given by set equations (11).
Figure 2. An approximate linear model of the lever-like amplification system.
(9)
In the elastic case the lever would possess the dashed shape in Figure 2.
here: w
293Cooling SySTem ACTivATeD by PiezoeleCTriC elemenTS

2 23 3 131 1
1,31 3 1 3 1 3
3 e a2
3 3 2 2
K K 4KK K1 1f2 2 M M M M M M
K k k1 1f2 M 2 m r m
⎛ ⎞⎛ ⎞⎜ ⎟= + ± − +⎜ ⎟⎜ ⎟π ⎝ ⎠⎝ ⎠
+= =
π π +
(11)
The steady state relations between the system displacements and the PZT force can be derived substituting s=0 in the transfer functions (9):
1
2PZT PZT j
e a
PZT j ePZT e
a
1
e
a
1 1F k k R xk k
k k kF 1 Rk yR k
ky R 1 xk
−
−
⎡ ⎤⎛ ⎞= + + +⎢ ⎥⎜ ⎟⎢ ⎥⎝ ⎠⎣ ⎦⎡ ⎤+ ⎛ ⎞
= + +⎢ ⎥⎜ ⎟⎝ ⎠⎣ ⎦
⎛ ⎞= +⎜ ⎟
⎝ ⎠
(12)
According to set equations (12) the amplification system can be easily optimized for demanded performances in the steady state operation, such as maximization of the PZT power exploitation, maximization of the gas compression work or maximization of the amplifier efficiency.
PROTOTYPE OF THE PIEZOELECTRIC COMPRESSOR Figure 3 illustrates the major components of the fabricated piezoelectric compressor and the
experimental setup. 1 is the first-step amplification frame with a preloading screw, marked by number 2. The PZT actuator of PI™ (P-016.20, 30µm stroke, 1000V) is marked by 5. Numbers 3 and 8 are the strain gauge and the supply voltage sets of wires respectively connected to the inner pins of the feed-through connectors. 6 is the piston (13 mm diameter), and 4 is an aperture in the cover of the compressor serving as a cylinder for the piston. 7 is one of two links providing the second-step motion amplification. 9 is the high pressure housing of the compressor. 10 is a transparent container, which is intended to simulate a gas volume of a cryocooler in the experimental setup. The mean compression volume above the piston is 1.4 cc. The volume beneath the piston is around 6cc and is considered as well in the gas stiffness calculations. 11 is a fast high pressure transducer. 12 is a valve of the helium filling installation.
Experiments of the piezo compressor were separated into two parts: primary testing of the amplification system outside the compressor housing, and main testing of the compressor filled with helium including a compression volume. The primary test validates the compatibility of the actual amplification system with the ANSYS model in the steady state operation mode by analyzing the actual system displacements. Moreover, some parameters for the analytical lever model can be captured from the actual system applying appropriate boundary conditions and
Figure 3. Pictures of the compressor prototype.
1 2 3 4 5 6 7 8 9 10 11 12
294 compreSSor Development anD moDeling

measuring the system displacements. The compressor filled with helium was tested in dynamic operation modes only, since the piston does not seal perfectly against the cylinder and gas compression is enabled only in dynamic operation. The assembled compressor enables measurement of the PZT voltage supply, the PZT elongation, and the pressure in the compression volume. The piston displacement can be estimated from the pressure measurement assuming no helium leakage through the piston perimeter. For the adiabatic and quasistatic helium compression the piston's displacement can be estimated applying the following equation:
1
02
V4 1y 11 r d
κ⎡ ⎤
⎛ ⎞⎢ ⎥= − ⎜ ⎟⎢ ⎥π +⎝ ⎠⎣ ⎦
(13)
Where V0 is the average volume of the cooling gas, r = ∆P/P0 – compression ratio, d is the piston's diameter and κ is the adiabatic index of the cooling gas (κ = 5/3 for Helium). For small values of the compression ratio, up to 0.1, the relation between the piston displacement and the pressure change is almost linear.
RESULTS Several dynamic responses of the compressor prototype are illustrated in Figures 4-7. It
must be noticed that the maximum peak-to-peak amplitude of the loaded high voltage amplifier, which was employed in our experiments, decreases almost linearly with the frequency according to the following equation: MAXVolt 1000 1.71 Hz= − × (14) Thus, the periodic response experiments are limited to low frequencies – up to 500 Hz at the most. As a result, it is more feasible to test the compressor with relatively low filling pressure, since the resonance frequency is lower in this case. Either way, the qualitative dynamic behavior of the compressor filled with different helium pressures does not alter much with the pressures.
The response of the pressure to the PZT excitation by a step in voltage yields the free vibration frequency of the system and the time constant of the helium leakage through the piston perimeter, and provides an estimation of the damping coefficients, which can be substituted in the analytical model for comparison. Figure 4 (left) illustrates an example of the system response to the high voltage step signal. The figure shows that for filling pressure 2050 kPa the oscillations period is 2.23 msec and the leakage time constant of Helium is around 0.1 sec. Figure 4 (right) summarizes the free vibration frequencies for different filling pressures.
Figures 5 and 6 illustrate two examples of the pressure response for a periodic excitation of the PZT actuator, while the filling pressure is set to 10 Bar. For excitation frequency 50 Hz (Figure 5) the peak-to-peak high voltage is measured at 956 V, peak-to-peak PZT elongation is 24.7 µm and the peak-to-peak pressure oscillation is 21.8 kPa. For excitation frequency 300 Hz (Figure 6) the peak-to-peak high voltage is measured at 468 V, peak-to-peak PZT elongation is 23.5 µm and the peak-to-peak pressure oscillation is 118.8 kPa. It can be seen in Figure 5 (right) that the odd harmonics of the 50 Hz pressure response are dominant over the even ones. The magnitude of the third harmonic is close to the first one, and thus, the third harmonic is easily distinguished on the time response curves of the pressure. According to Figure 6 (right) the integer multiples of the fundamental 300 Hz frequency decrease in magnitudes gradually with increasing frequency. The fundamental harmonic is significantly higher than the other harmonics, and thus, only the fundamental harmonic is distinguished on the time response curves of the pressure. An interesting phenomenon in the periodic response of the pressure near the 300 Hz frequencies is an appearance of the sub-harmonics at the middle frequencies of the integer multiples of the fundamental harmonics.
Periodic responses of the compressor filled with 10 and 20 Bar, as well the analytically calculated results corresponding to 10 Bar, are summarized in the amplitude and phase response diagrams, which are illustrated in Figure 7. The actual displacements of the piston are calculated by equation (13). For the filling pressure of 10 Bar the compression ratio, r, reaches 0.16 at the resonance frequency, which is 370 Hz. It should be noticed that at this frequency the high
295Cooling SySTem ACTivATeD by PiezoeleCTriC elemenTS

voltage amplifier supplies only 343 peak-to-peak Volts, and the PZT has a stroke of 19.4µm. For the filling pressure of 20 Bar the compression ratio, r, reaches 0.11 at the resonance frequency, which is 420Hz. At this frequency the high voltage amplifier supplies only 280 peak-to-peak Volts, and the PZT has a stroke of 17.1µm. Despite the somewhat scattered results of phase lags in Figures 7 the trends in all the curves are evident. It follows from the figures that all the phase lags begin from zero, and vary in the resonance range. The main pressure resonance results in 90 degrees phase lag of the pressure and in around 20 degrees phase lag of the PZT after the high voltage. At the higher frequencies the pressure phase lag decreases further, while the PZT phase lag stabilizes at the same value and even comes back towards zero.
Comparison between the actual compressor results and the analytical lever model requires an experimental estimation of the actual parameters according to the nomenclature of the analytical model. Primary parameters, such as stiffnesses and masses, were measured directly on the actual amplification system in steady state employing appropriate equipment and setting appropriate boundary conditions to the system. Comparison between the step response of the analytical model and the actual compressor allowed estimation of the damping coefficients.
3.72 3.74 3.76 3.78 3.8 3.82 3.84 3.86 3.882040
2060
2080
2100
2120
Time [s]
Pre
ssur
e [k
Pa]
3.72 3.725 3.73
2060
2080
2100
2120
ZOOM
0
100
200
300
400
500
600
0 5 10 15 20 25 30Filling pressure [Bar]
Res
onan
ce fr
eq. [
Hz]
Figure 4. On the left is the pressure response to a 500 Volts step excitation of the PZT with filling
pressure 2050 kPa. On the right is the free vibration frequency of the system versus the filling pressure.
3.7 3.75 3.8 3.85
1000
1020
1040
Pre
ssur
e [k
Pa]
Time [sec]0 100 200 300 400 500
100
105
Frequency [Hz] Figure 5. Pressure response to 50 Hz excitation with filling pressure 10 Bar. On the left are transient and
periodic responses; on the right is a periodic spectrum of frequencies.
3.715 3.72 3.725 3.73 3.735 3.74
950
1000
1050
Pre
ssur
e [k
Pa]
Time [sec]0 200 400 600 800 1000 1200
100
105
1010
Frequency [Hz] Figure 6. Pressure response to 300 Hz excitation with filling pressure 10 Bar. On the left are transient
and periodic responses; on the right is a periodic spectrum of frequencies.
296 compreSSor Development anD moDeling

The final parameters for the analytical model are the following: FPZT = 5500 sin(2πft) N; kPZT = 183.3x10⁶ N/m; kj = 5.1x10⁶ N/m; ke = 27613 N/m (Corresponds to the gas stiffness in compressor filled with 10 Bar helium); ka = 61600 N/m; c1 = 1000 Ns/m; c3 = 12 Ns/m; m1 = 0.057 kg; m2 = 0.227 kg; m3 = 0.006 kg; r2 = 0.041 (taken from the comparison with the ANSYS model); R = 28.
Figure 7 presents a fine agreement between the piston resonances positions and the phase behaviors of both the analytical model and the actual compressor. An evident disagreement between the analytical and experimental results is in the piston amplitudes, especially at ‘low’ frequencies. The PZT elongation amplitudes are in a fine qualitative agreement, but differ in the resonance frequencies locations (especially in the 20 Bar response). Note that the experimental PZT elongations must lag in magnitude after the theoretical amplitudes as the frequency increases due to the fact that the actual supplied voltage decreases with the frequency according to equation (14). As a result, the actual piston displacement should be larger at the nearby resonance frequencies, if the supplied voltage amplitude had remained constant. The main reason
0 100 200 300 400 50010
15
20
25
30
PZT
elo
ngat
ion
[ µm
]
0 100 200 300 400 500-30
-20
-10
0
10
20
Freq. [Hz]
PZT
pha
se [d
eg]
0 100 200 300 400 500-180
-150-120-90
-60-30
030
Freq. [Hz]
Pis
ton
phas
e [d
eg]
0 100 200 300 400 5000
0.20.40.60.8
11.21.4
Pis
ton
disp
lace
men
t [m
m]
10Bar20Bar10Bar Analytic Lever
Figure 7. Periodic response of the actual compressor, and comparison with the analytical model.
0 100 200 300 400 50010
15
20
25
30
PZT
elo
ng. [µm
]
0 100 200 300 400 5000.60.8
11.21.41.61.8
Pis
ton
disp
l. [m
m]
0 100 200 300 400 50020
40
60
80
100
Am
plifi
catio
n
0 100 200 300 400 500-50
-40
-30
-20
-10
0
Freq. [Hz]
PZT
pha
se [d
eg]
0 100 200 300 400 500-180-150-120-90-60-30
0
Freq. [Hz]
Pis
ton
phas
e [d
eg]
0 100 200 300 400 500-180-150-120-90-60-30
0
Freq. [Hz]
Am
pl. p
hase
[deg
]
ANSYSAnalytic Origin.Analytic Fixed
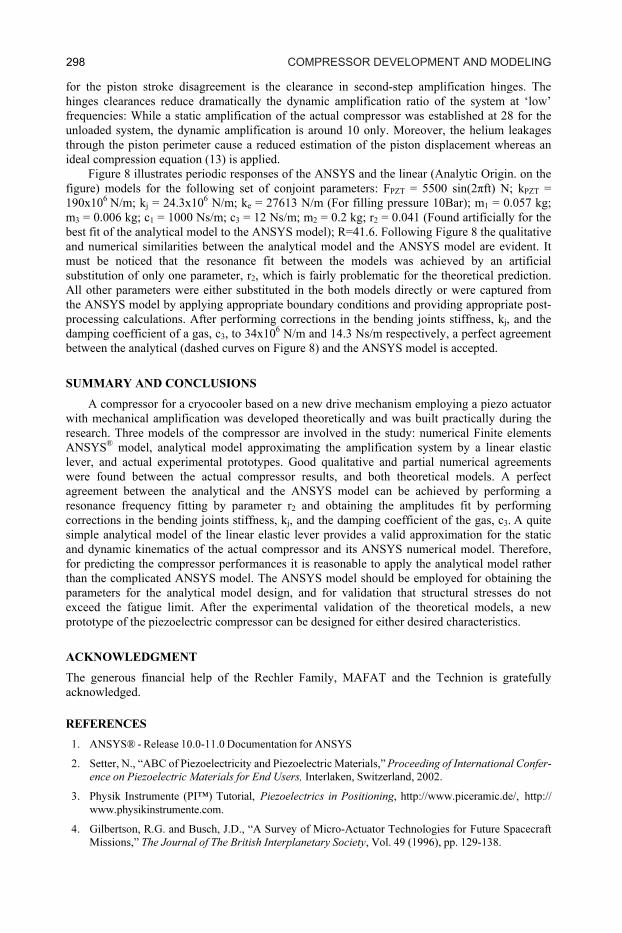
Figure 8. Periodic response of the ANSYS model of the compressor with 10 Bar filling pressure, and
comparison with the analytical model.
297Cooling SySTem ACTivATeD by PiezoeleCTriC elemenTS
for the piston stroke disagreement is the clearance in second-step amplification hinges. The hinges clearances reduce dramatically the dynamic amplification ratio of the system at ‘low’ frequencies: While a static amplification of the actual compressor was established at 28 for the unloaded system, the dynamic amplification is around 10 only. Moreover, the helium leakages through the piston perimeter cause a reduced estimation of the piston displacement whereas an ideal compression equation (13) is applied.
Figure 8 illustrates periodic responses of the ANSYS and the linear (Analytic Origin. on the figure) models for the following set of conjoint parameters: FPZT = 5500 sin(2πft) N; kPZT = 190x106 N/m; kj = 24.3x10⁶ N/m; ke = 27613 N/m (For filling pressure 10Bar); m1 = 0.057 kg; m3 = 0.006 kg; c1 = 1000 Ns/m; c3 = 12 Ns/m; m2 = 0.2 kg; r2 = 0.041 (Found artificially for the best fit of the analytical model to the ANSYS model); R=41.6. Following Figure 8 the qualitative and numerical similarities between the analytical model and the ANSYS model are evident. It must be noticed that the resonance fit between the models was achieved by an artificial substitution of only one parameter, r2, which is fairly problematic for the theoretical prediction. All other parameters were either substituted in the both models directly or were captured from the ANSYS model by applying appropriate boundary conditions and providing appropriate post-processing calculations. After performing corrections in the bending joints stiffness, kj, and the damping coefficient of a gas, c3, to 34x106 N/m and 14.3 Ns/m respectively, a perfect agreement between the analytical (dashed curves on Figure 8) and the ANSYS model is accepted.
SUMMARY AND CONCLUSIONS
A compressor for a cryocooler based on a new drive mechanism employing a piezo actuator with mechanical amplification was developed theoretically and was built practically during the research. Three models of the compressor are involved in the study: numerical Finite elements ANSYS® model, analytical model approximating the amplification system by a linear elastic lever, and actual experimental prototypes. Good qualitative and partial numerical agreements were found between the actual compressor results, and both theoretical models. A perfect agreement between the analytical and the ANSYS model can be achieved by performing a resonance frequency fitting by parameter r2 and obtaining the amplitudes fit by performing corrections in the bending joints stiffness, kj, and the damping coefficient of the gas, c3. A quite simple analytical model of the linear elastic lever provides a valid approximation for the static and dynamic kinematics of the actual compressor and its ANSYS numerical model. Therefore, for predicting the compressor performances it is reasonable to apply the analytical model rather than the complicated ANSYS model. The ANSYS model should be employed for obtaining the parameters for the analytical model design, and for validation that structural stresses do not exceed the fatigue limit. After the experimental validation of the theoretical models, a new prototype of the piezoelectric compressor can be designed for either desired characteristics.
ACKNOWLEDGMENT
The generous financial help of the Rechler Family, MAFAT and the Technion is gratefully acknowledged.
REFERENCES
1. ANSYS® - Release 10.0-11.0 Documentation for ANSYS
2. Setter, N., “ABC of Piezoelectricity and Piezoelectric Materials,” Proceeding of International Confer-
ence on Piezoelectric Materials for End Users, Interlaken, Switzerland, 2002.
3. Physik Instrumente (PI™) Tutorial, Piezoelectrics in Positioning, http://www.piceramic.de/, http://
www.physikinstrumente.com.
4. Gilbertson, R.G. and Busch, J.D., “A Survey of Micro-Actuator Technologies for Future Spacecraft
Missions,” The Journal of The British Interplanetary Society, Vol. 49 (1996), pp. 129-138.
298 compreSSor Development anD moDeling