investigation of fusarium mycotoxins in uk barley and oat … · 2019-10-22 · investigation of...
TRANSCRIPT

Project Report No. 415 July 2007 Price: £5.50
Investigation of Fusarium mycotoxins in UK barley
and oat production
by
S Edwards
Harper Adams University College, Newport, Shropshire, TF10 8NB
This is the final report of a four year project which started in July 2002. The project was sponsored by the HGCA (£46,217, Project No. RD-2002-2706) and the Food Standards Agency (£285,947, Projects No CO4033 and CO4034), making a total of £332,164. The Home-Grown Cereals Authority (HGCA) has provided funding for this project but has not conducted the research or written this report. While the authors have worked on the best information available to them, neither HGCA nor the authors shall in any event be liable for any loss, damage or injury howsoever suffered directly or indirectly in relation to the report or the research on which it is based. Reference herein to trade names and proprietary products without stating that they are protected does not imply that they may be regarded as unprotected and thus free for general use. No endorsement of named products is intended nor is it any criticism implied of other alternative, but unnamed, products.

Table of contents
1.1 EXECUTIVE SUMMARY ................................................................................................................ 1
1.2 INTRODUCTION ............................................................................................................................ 4
1.2.1 FUSARIUM EAR BLIGHT.................................................................................................................... 4 1.2.2 FUSARIUM MYCOTOXINS.................................................................................................................. 6 1.2.3 FUSARIUM MYCOTOXIN LEGISLATION ................................................................................................ 8 1.2.4 EFFECTS OF AGRONOMIC FACTORS.................................................................................................. 9 1.2.5 EFFECTS OF PROCESSING............................................................................................................... 9
1.3 AIMS AND OBJECTIVES .............................................................................................................. 9
2. METHODS...................................................................................................................................... 10
2.1 SAMPLING....................................................................................................................................... 10 2.2 MYCOTOXIN ANALYSIS ..................................................................................................................... 11 2.3 TRICHOTHECENE ANALYSIS OF EXPERIMENTAL OAT MATERIAL ............................................................. 12 2.4 IMPACT OF DE-HULLING ON TRICHOTHECENE CONTENT OF OATS.......................................................... 14 2.5 STATISTICAL ANALYSIS..................................................................................................................... 14
3. RESULTS....................................................................................................................................... 15
3.1 SUMMARY OF SAMPLES RECEIVED.................................................................................................... 15 3.2 SUMMARY STATISTICS FOR BARLEY................................................................................................... 17 3.3 REGRESSION ANALYSIS FOR BARLEY................................................................................................. 21 3.4 SUMMARY STATISTICS FOR OATS ...................................................................................................... 22 3.5 REGRESSION ANALYSIS FOR OATS .................................................................................................... 27 3.6 STATISTICAL ANALYSIS FOR HT2+T2 IN OATS .................................................................................... 30 3.7 TRICHOTHECENE ANALYSIS OF EXPERIMENTAL OAT MATERIAL ............................................................. 34 3.8 IMPACT OF DE-HULLING ON TRICHOTHECENE CONTENT OF OATS.......................................................... 36 3.9 STATISTICAL ANALYSIS FOR HT2+T2 IN BARLEY ................................................................................ 40
DISCUSSION ..................................................................................................................................... 42
ACKNOWLEDGEMENTS .................................................................................................................. 47
REFERENCES ................................................................................................................................... 48
APPENDIX 1 - DESCRIPTION OF OAT AGRONOMIC FACTORS.................................................. 51
APPENDIX 2 – NUMBER OF OAT SAMPLES FOR EACH LEVEL WITHIN EACH AGRONOMY FACTOR FROM DATASET WITH BLANKS REMOVED................................................................... 52
APPENDIX 3 – STATISTICAL ANALYSIS FOR HT2+T2 IN OATS................................................... 54
A3.1 STEPWISE MODEL SELECTION ........................................................................................................ 54 A3.2 ASSESSMENT OF GOODNESS OF FIT FOR LOGA BY RESIDUAL PLOTS................................................... 56 A3.3 TABLES OF PREDICTED MEANS AND STANDARD ERROR OF THE PREDICTED MEAN FOR......................... 57 A3.4 HT2+T2 PARAMETER ESTIMATES ................................................................................................... 59 A3.5 STABILITY OF EACH AGRONOMIC FACTOR’S EFFECT ON HT2+T2 CONCENTRATION OVER TIME ............. 63 A3.6 CROSS-VALIDATION BY SPLITTING THE DATASET .............................................................................. 64
APPENDIX 4 - DESCRIPTION OF BARLEY AGRONOMIC FACTORS............................................ 65
APPENDIX 5 - NUMBER OF BARLEY SAMPLES FOR EACH LEVEL WITHIN EACH AGRONOMY FACTOR FROM DATASET WITH BLANKS REMOVED AND FROM DATASET OF POSITIVE HT2+T2 SAMPLES ............................................................................................................................ 66
APPENDIX 6 - STATISTICAL ANALYSIS FOR HT2+T2 IN BARLEY............................................... 67
A6.1 STEPWISE MODEL SELECTION FOR HT2+T2 INCIDENCE.................................................................... 67 A6.2 ASSESSMENT OF GOODNESS OF FIT BY ROC CURVE ANALYSIS ......................................................... 67 A6.3 TABLES OF PREDICTED PROPORTIONS FOR HT2+T2 INCIDENCE (>LOQ). .......................................... 69 A6.4 STEPWISE MODEL SELECTION FOR POSITIVE HT2+T2 DATASET ........................................................ 70 A6.5 ASSESSMENT OF GOODNESS OF FIT FOR LOGA BY RESIDUAL PLOTS................................................... 71 A6.6 TABLES OF PREDICTED MEANS FOR HT2+T2 CONCENTRATION ON THE LOG10 SCALE (LOGA) ............... 72

Glossary DAS diacetoxyscirpenol DON deoxynivalenol FDG Fusarium damaged grain FEB fusarium ear blight FIG Fusarium infected grain FUS-X fusarenone X Groat oat grain with hull removed HT2 HT2 toxin HT2+T2 combined concentration of HT2 and T2 toxins Hull outer layer of oat grain (removed during de-hulling) Husk synonymous with hull above LoQ Limit of Quantification PGR plant growth regulator Naked oat Type of oat with a loose hull which is removed during harvesting NEO neosolaniol NIV nivalenol No-till drilling of seed directly into previous crop residue Min-till non-inversion cultivation of soil before drilling MON moniliformin T2 T2 toxin ZEAR zearalenone

1
1.1 Executive summary This four-year project started in 2002 to ascertain the effects of agronomic practices on the concentration of fusarium mycotoxins in UK barley and oats over a number of seasons. One hundred samples both of barley and oats were collected each year at harvest, together with agronomic details, and analysed for ten trichothecenes (including DON, nivalenol, HT2 and T2), zearalenone and moniliformin. The project anticipated the introduction by the European Commission (EC) of legislative limits for the fusarium mycotoxins, deoxynivalenol (DON) and zearalenone in cereals and cereal products intended for human consumption in July 2006. A combined limit for HT2 toxin and T2 toxin (HT2+T2) will be introduced in the near future. Fusarium mycotoxins are produced as a result of the disease fusarium ear blight (panicle blight in oats) caused by Fusarium species. The most important ear blight pathogens on cereals worldwide are F. graminearum and F. culmorum which produce DON and zearalenone. The vast majority of ear blight research and surveys of mycotoxin occurrence have been conducted on wheat as this is the most economically important small grain cereal worldwide and it is the most susceptible cereal to ear blight infection. The incidence and concentration of most fusarium mycotoxins, including DON and zearalenone, were low in both barley and oats compared to values for wheat. This indicates that with current agronomic practices and varieties, wheat is the most susceptible host to F. culmorum and F. graminearum with barley and oats having considerably lower levels. Concentrations of DON and zearalenone were below legislative limits for both barley and oats over the four year period 2002-2005. The incidence and concentration of HT2 and T2 in UK barley samples was similar to UK wheat with ca. 1% of samples exceeding a combined concentration of 100 ppb. The highest concentration was 138 ppb HT2+T2, which may, or may not exceed the legal limit if set at 100 ppb depending on the measurement of uncertainty with the assay used. Regression analysis failed to identify relationships between fusarium mycotoxin concentrations in barley. This is probably due to the low number of positive samples and the low concentration of these mycotoxins in positive samples. Modelling of HT2+T2 concentration against the agronomy of barley failed to identify an effect of any agronomic factor other than year and region. The incidence and concentration of HT2 and T2 were high in UK oats with quantifiable concentrations in 92% of samples and a combined concentration (HT2+T2) of 570 ppb for all samples analysed from 2002 to 2005. The concentration of HT2+T2 was modelled against agronomic practices applied to each field. Year, region, practice (organic or conventional), previous crop, cultivation and variety all had statistically significant effects on HT2+T2 concentration in oats. There was a degree of multicolinearity (ie related trends between different agronomic factors) within the observational data in that many conventional farmers grew the variety Gerald after another cereal, usually wheat; whereas organic farmers were more likely to grow other varieties after a non-cereal. Consequently it could be identified that organic samples had a significantly lower HT2+T2 content compared to conventional samples and that this was partly due to organic growers growing Gerald and not

2
following a cereal as frequently as conventional growers. Analysis indicated that one or more factors not included in the model, which differed between organic and conventional practice, also had an impact on HT2+T2 concentrations. One possible difference is rotation, with organic growers tending to use longer, less cereal intense rotations. Statistical tests of the predictive quality of the model indicated it may not be a good predictor of new observations. This indicates that the model should be used to formulate hypotheses as to the role of agronomic factors which can be quantified in field experiments under controlled conditions, rather than to predict the mycotoxin content in commercial samples based on known agronomy. There was a significant interaction between year and region, which is probably due to fluctuation in weather between years and regions. There was no trend from North to South, as seen for DON in wheat, which would indicate that the temperature difference across the UK does not limit HT2 and T2 production in oats. Oat samples with more than 500 ppb HT2+T2 were detected in all regions of the UK at similar frequencies. Highest concentrations of HT2+T2 occurred in oat crops grown after a previous cereal crop. Oat samples from fields following a non-cereal and ploughing had significantly lower HT2+T2 than oat crops after wheat, barley or oats. Oat samples from fields following a non-cereal and min-till had a HT2+T2 concentration equivalent to oat crops after a cereal. This suggests that crop debris is important in the epidemiology of HT2+T2 producing Fusarium species. There were significant differences in the HT2+T2 content of different UK varieties. Of the five varieties with sufficient samples to include within the analysis, Gerald, the most popular oat variety in recent years, had the highest HT2+T2 content. Analysis of the HT2+T2 content of oat samples from the HGCA Recommended List trials allowed all current UK varieties to be compared from replicated field trials. Results agreed with the observational data, with Gerald having the highest content of current varieties. HT2+T2 content of spring oat variety trial samples were consistently lower than winter oat samples and there was no significant difference between spring oat varieties tested in 2005. Naked oat varieties tended to have a lower HT2+T2 content compared to conventional (covered) oat varieties. Naked oats have a loose hull which is removed during harvesting. Analysis of HT2+T2 content of two agronomy trials with different seed and nitrogen rates indicated that they had no significant effect on HT2+T2 content of harvested oats. High levels of HT2 and T2 were detected in UK oats. The combined HT2+T2 median, mean and maximum were 213, 570 and 9990 ppb respectively. The previous European Commission limit for discussion was 500 ppb HT2+T2. Thirty percent of samples in this study would have exceeded this limit; in each year of this study, between 18 to 50 percent of conventional oat samples would have exceeded this limit. Prior to this study there was very limited data as to the concentration of HT2+T2 in oats worldwide. In recent years (2002-2006) high HT2+T2 levels have occurred in northern European countries. There was a good correlation between concentrations of all the type A trichothecenes detected (HT2, T2, T2 triol and neosolaniol). These mycotoxins are likely to be produced by the same Fusarium species within the same metabolic pathway, and

3
can be considered as co-contaminants. There appeared to be some mutual exclusion between HT2, DON and nivalenol indicating that these mycotoxins are produced by different Fusarium species, which either actively compete with one another or have different environmental requirements. All oats used for human consumption are de-hulled; the resulting groats are further processed into oat products and the hulls are pelleted for inclusion in animal feed. De-hulling experiments were conducted to identify the impact of processing on the mycotoxin content of oats. High levels of reduction, greater than 90%, were identified in an initial experiment of four samples, with a corresponding high level of HT2+T2 in the hulls. A second, larger experiment of 66 samples showed a wider range of reduction (58-98%, average 89%), however this may have been due to sampling error as smaller samples were de-hulled (100 g compared to 500 g in the first experiment). This experiment identified no significant effect in the reduction during de-hulling of variety, groat content or the initial mycotoxin content of the oat sample. A recent experiment on the impact of industrial processing on HT2+T2 content of oats found consistently high reductions of more than 90% from oats to groats and corresponding high levels in the pelleted hulls. The impact of de-hulling explains the difference in mycotoxin content of oats at harvest as identified in this project and the low concentrations of HT2+T2 detected in retail oat products as found in a recent survey conducted in 2003 by the FSA.
4
1.2 Introduction 1.2.1 Fusarium ear blight Fusarium ear blight (FEB) of UK cereals may be caused by several fungal pathogens. The disease is also referred to as fusarium head blight or scab or fusarium panicle blight for oats. The vast majority of research conducted on FEB is concerned with wheat as this is the most economically important small grain cereal world-wide and is the most susceptible to FEB and mycotoxin contamination in many countries. Some FEB pathogens produce fusarium mycotoxins whilst others do not. Fusarium ear blight can be detected in crops around the milky ripe stage (Growth Stage 75) as premature ripening (bleaching) of individual spikelets. Orange/pink spores of Fusarium may be seen on infected spikelets. Infection can result in bleaching of the ear above the point of infection. As the whole crop ripens the symptoms are less visible. At harvest, fusarium ear blight can result in fusarium damaged grains that may be shrivelled with a chalky white or pink appearance, although this is not always the case. The presence of fusarium damaged grains is an indication that the fusarium mycotoxins may be present. Fusarium species can be readily isolated from seed, stem bases, soil, weeds and insects although the main source of inoculum is crop debris. The ideal conditions for Fusarium infection are heavy rainfall to splash spores from the crop debris up onto the cereal ear; warm, humid weather then allows the fusarium spores to germinate and infect the cereal ear. Once infection has occurred, further rainfall and humid conditions during the summer will allow secondary infection to occur. Cereal crops are most susceptible to FEB infection during flowering (Growth Stage 61-69); the crop is also susceptible once ripe (Growth Stage 92). Most Fusarium species are facultative plant pathogens, i.e. they are capable of living on dead organic material in the soil but can switch to a pathogenic mode of existence when suitable host plants appear (Parry et al. 1995). Several species, including F. culmorum and F. graminearum, can cause fusarium seedling blight, brown foot rot and fusarium ear blight (FEB). FEB infection may be due to inoculum present in the soil, on crop debris or be seed borne. There is strong evidence that rain is important in the dispersal of F. culmorum and F. graminearum. For F. culmorum, macroconidia which are produced at ground level are splashed onto the wheat ears during rainfall (Jenkinson and Parry 1994; Horberg 2002). This may occur in a stepwise manner, from leaf to leaf, and finally the ear. It was noted that during epidemic years in Idaho in 1982 and 1984, when F. culmorum was the dominant FEB pathogen, sprinkler irrigated fields had severe FEB whereas surface irrigated fields had little or no FEB (Mihuta-Grimm and Forster 1989). For F. graminearum, ascospores are produced at ground level and are released throughout the day, spore release peaks late evening and is highest 1-3 days after rainfall events (>5 mm) (Fernando et al. 2000; Inch et al. 2005). Rainfall events also result in splash dispersal of F. graminearum ascospores and macroconidia (Paul et al. 2004). An observational study of wheat fields in Washington State showed that FEB was much more prevalent in fields with irrigation compared to fields with no irrigation (Strausbaugh and Maloy 1986).

5
Wheat is most susceptible to FEB during flowering (Obst et al. 1997; Lacey et al. 1999) with symptoms developing two to four weeks later. Flowering in the UK occurs from early June in the south of England to mid-July in the north of Scotland. Flowering time varies with drilling date, weather and variety. Flowering duration varies with weather and variety. FEB is assessed in the field after flowering, usually one to four weeks post-anthesis and is based on the number of ears with blight symptoms (incidence) or the number of spikelets with blight symptoms (severity). The two measurements are closely correlated (Xu et al. 2004). At harvest, grains can be visually assessed for Fusarium damaged grain (FDG) or infection can be measured by culturing the Fusarium from grain on blotting paper or microbiological media to determine Fusarium infected grain (FIG). Many studies have been directed at the control of FEB and have not assessed mycotoxin concentration. In most countries where these studies have been performed, F. graminearum is the predominant FEB pathogen, and as this is the most potent DON producing species, there is a reasonable relationship between FEB severity, %FDG or %FIG and DON concentration. It is however important to note that in the UK, Microdochium species can be the predominant FEB pathogen and these species do not result in FDG or FIG or any known mycotoxin. For UK data it is therefore advisable not to assume that a measurement of FEB is closely related to DON concentration at harvest (Edwards et al. 2001). A similar situation has been reported in France (Champeil et al. 2004). Few studies have compared the FEB severity or mycotoxin contamination of wheat, barley and oats either from replicated field experiments or observational studies. In western Canada, observational data showed highest DON content was found on wheat, then barley and lowest amounts in oats from 1991 to 1998 (Campbell et al. 2002). The percentage of samples exceeding 1000 ppb DON was 31, 22 and 1.4% for wheat, barley and oats respectively. This data was matched in a study of ear blight susceptibility of cereal species in inoculated glasshouse experiments (Langevin et al. 2004). In the epidemic years of 1993 and 1994 in Minnesota commercial cereal samples were analysed for DON. Average DON concentrations in wheat, barley and oat samples were 8.3, 10.4, and 1.4 ppm respectively (Jones and Mirocha 1999). There is limited data on occurrence of fusarium mycotoxins in UK cereals prior to 2001. A previous survey conducted in 1999 found highest amounts of DON on wheat, with lower levels on barley and oats. It should be remembered that the relative degree of mycotoxin contamination between cereals will vary between years and between regions depending on climatic conditions when each host species is in flower. This variation will also exist between winter and spring sown varieties of the same host species. In Norway, a large scale study over 6 years identified that highest DON concentrations occurred in oat samples, then wheat, and barley had the lowest DON average concentrations (Langseth and Elen 1996). The observed variation in contamination levels between cereals was not observed in experimental field trials indicating that the observed differences were not solely due to inherent differences in resistance but also due to differences in agronomy.

6
There is less data as to the relative concentration of other fusarium mycotoxins in wheat, barley and oats. For HT2 and T2, highest levels were detected in oats, then barley and lowest in wheat samples in Norway (Langseth and Rundberget 1999). Moniliformin has been detected in cereal samples from Nordic countries. In Norway, highest levels were observed on wheat, with similar, lower amounts on barley and oats (Uhlig et al. 2004). It should be noted that the relationship between cereals and ear blight is not a static one and changes have been observed over recent years. For example, until 1993, FEB in barley was not observed in Western Canada, by 1999, barley was deemed to be as susceptible as wheat to FEB (Tekauz et al. 2000). This may have been due to a fundamental shift in the pathogen population or changes in agronomy, in particular, changes in varieties grown. 1.2.2 Fusarium mycotoxins The trichothecene mycotoxins are produced by some of the Fusarium ear blight pathogens and their levels within grain depend on weather conditions. High humidity during and after flowering is conducive to ear blight epidemics and mycotoxin production. The main method to control Fusarium ear blight in the UK is a fungicide application. A recent Home-Grown Cereals Authority (HGCA) project report (Nicholson et al. 2003) has shown that the azole and strobilurin fungicides have different activities towards the dominant UK ear blight pathogens, Fusarium culmorum (a mycotoxin producer) and Microdochium nivale (not a mycotoxin producer). DON and nivalenol (NIV) are Type B trichothecenes produced predominantly by F. culmorum and F. graminearum. Isolates of both these species are either DON or NIV producers. DON producers are referred to as Type 1 chemotype, this chemotype is further divided into 1A and 1B depending on the acetylated DON that is produced as a co-contaminant, 3- or 15-acetyl DON respectively. F. poae has also been linked to high levels of NIV. HT2 and T2 are Type A trichothecenes, which are thought to be produced predominantly by F. sporotrichioides and F. langsethiae. The predominant fusarium mycotoxin found in UK wheat grain at harvest is DON. During the wheat project (FSA CO4022/HGCA 2452 – Investigation of Fusarium mycotoxins in UK wheat production) it was identified that DON was detectable (>10 ppb) in 86% of samples with a mean and median value of 230 and 42 ppb from 2001-2005. HT2 and zearalenone were detected in 31 and 19% (>10 ppb) of samples respectively. Surveys of cereal products have indicated that fusarium mycotoxins are a common contaminant of human and animal diets. They frequently occur at low concentrations. DON causes reduced feed intake, reduced weight gain and vomiting in farm animals (Anon. 2004a). Nausea, vomiting, diarrhoea, abdominal pain, headache, dizziness and fever have been reported when high concentrations of DON were consumed by humans (Anon. 1999). Other trichothecenes have the same cellular activity which is disruption of protein synthesis, and have a higher cellular toxicity than DON. Nivalenol and T2 are ca. 20 times more toxic than DON, although

7
the relative differences are dependent on the target cell or animal studied (Desjardins 2006). HT2 and T2 were implicated in Alimentary Toxic Aluekia caused by the consumption of cereals which had overwintered in fields in Russia in the 1940s (Desjardins 2006). Although DON is considered the predominant trichothecene mycotoxin within grain, some of the other trichothecenes have greater toxicity, so it is important that they are also monitored. Of the other trichothecenes, the only other ones currently being considered for legislation are HT2 and T2 toxins, which had a proposed combined maximum level of 100 ppb for unprocessed wheat and barley grains; 500 ppb for unprocessed oat grains; 200 ppb for finished products and 50 ppb for cereal-based infant foods. Zearalenone is another mycotoxin produced predominantly by F. culmorum and F. graminearum. Zearalenone has no known function in the fungus and is predominantly produced late in the crop growing season, near to harvest (Matthaus et al. 2004). Zearalenone has low cellular toxicity but is problematic as it has high estrogenic activity causing hyperoestrogenism in animals and humans. In animals the mycotoxin causes a range of fertility problems, with young female pigs being particularly susceptible (Anon. 2004b). There are no proven cases of human exposure but the mycotoxin has been implicated in cases of premature puberty in young females (Anon. 2000). Moniliformin is another fusarium mycotoxin produced by a large number of Fusarium species. Moniliformin is more commonly detected on maize than small grain cereals; however, it has been recently detected in Nordic countries and Poland, with high levels being associated with long periods of high rainfall and F. avenaceum infections (Tomczak et al. 2002; Jestoi et al. 2004). Toxicity is believed to be due to inhibition of pyruvate dehydrogenase (Desjardins 2006). Oral toxicity is similar to HT2 and T2, which are the most toxic trichothecenes.

8
1.2.3 Fusarium mycotoxin legislation The European Commission (EC) has set legislative limits for the fusarium mycotoxins including the trichothecene, deoxynivalenol (DON) and zearalenone in cereal grains and cereal-based products intended for human consumption (Table 1.2.1) (Anon 2005a; Anon. 2006a). Limits will also be introduced for the trichothecenes, HT2 and T2 combined, and fumonisins in the near future. Table 1.2.1 Maximum limits for DON and zearalenone in unprocessed cereals and finished products intended for human consumption
Mycotoxin (ppb) Product
DON zearalenone Unprocessed cereals other than durum wheat and oats 1250 100 Unprocessed durum wheat and oats 1750 100 Cereal flour 750 75 Bread, pastries, biscuits, cereal snacks and breakfast cereals
500
50
Processed cereal-based food for infants and young children and baby food
200
20
The maximum levels set for unprocessed cereals apply to cereals placed on the market for processing. Cereal grains may have been cleaned, dried and/or sorted prior to being placed on the market; these grains are still classified as unprocessed cereals. Maximum levels are set on unprocessed cereals to avoid highly contaminated cereals entering the food chain and to encourage all measures to minimise fusarium mycotoxin contamination to be taken in the field and storage stages of the production chain. Processing can reduce the mycotoxin content of some cereal products; limits for processed products are therefore lower. However, a processor may specify their own limits for unprocessed grain due to the limited ability of their process to reduce the mycotoxin content of certain products. The European Commission also set guideline limits in 2006 for fusarium mycotoxins in animal feed (Anon. 2006b). The lowest guidance limits have been set for pigs due to their higher sensitivity to fusarium mycotoxins. The DON guidance value for complementary and complete feedingstuffs for pigs is 900 ppb. The zearalenone guidance value for complementary and complete feedingstuffs for sows and fattening pigs is 250 ppb and for piglets and gilts is 100 ppb.

9
1.2.4 Effects of agronomic factors The vast majority of previous research on the impact of agronomic factors on the mycotoxin content of cereals has been conducted on wheat. Previous studies, primarily in North America and elsewhere in Europe have identified a number of agronomic factors which can affect the concentration of fusarium mycotoxins in wheat. Studies in the UK have primarily focussed on the use of fungicides applied to wheat during flowering to reduce fusarium ear blight; this is traditionally the third spray timing and referred to as T3. Previous studies of FEB and DON in wheat are reviewed in the wheat project report (FSA CO4022/HGCA 2452 – Investigation of Fusarium mycotoxins in UK wheat production). Results from the wheat project identified that the year, region, previous crop, cultivation, variety (varietal resistance to FEB) and T3 fungicides all had a significant impact on DON content of harvested wheat. Previous studies on barley and oats have primarily been restricted to varietal resistance to ear/panicle blight (Buerstmayr et al. 2004; Tekauz et al. 2004; Yoshida et al. 2005). 1.2.5 Effects of processing Oats for human consumption are de-hulled during processing. De-hulling is the removal of the outer coat, referred to as hull or husk. The de-hulled oat is referred to as a groat. The groat is further processed into various finished products for human consumption. The hulls are pelleted and used as a component in animal feeds. A recent study of industrial processing has identified a large reduction in the mycotoxin content of oats to groats during de-hulling (Scudamore et al. 2007). Naked oats have a loose hull which is removed during harvesting consequently only the groat is harvested. Naked oats are used as an animal feed.
1.3 Aims and objectives Determine how agronomic factors affect the concentration of trichothecenes, zearalenone and moniliformin in harvested barley and oat grain in the UK. These factors included organic production, rotation, cultivation, variety and T3 fungicide. Determine the range of trichothecene, zearalenone and moniliformin contamination within harvested UK barley and oat grain over a four year period (2002 – 2005).
10
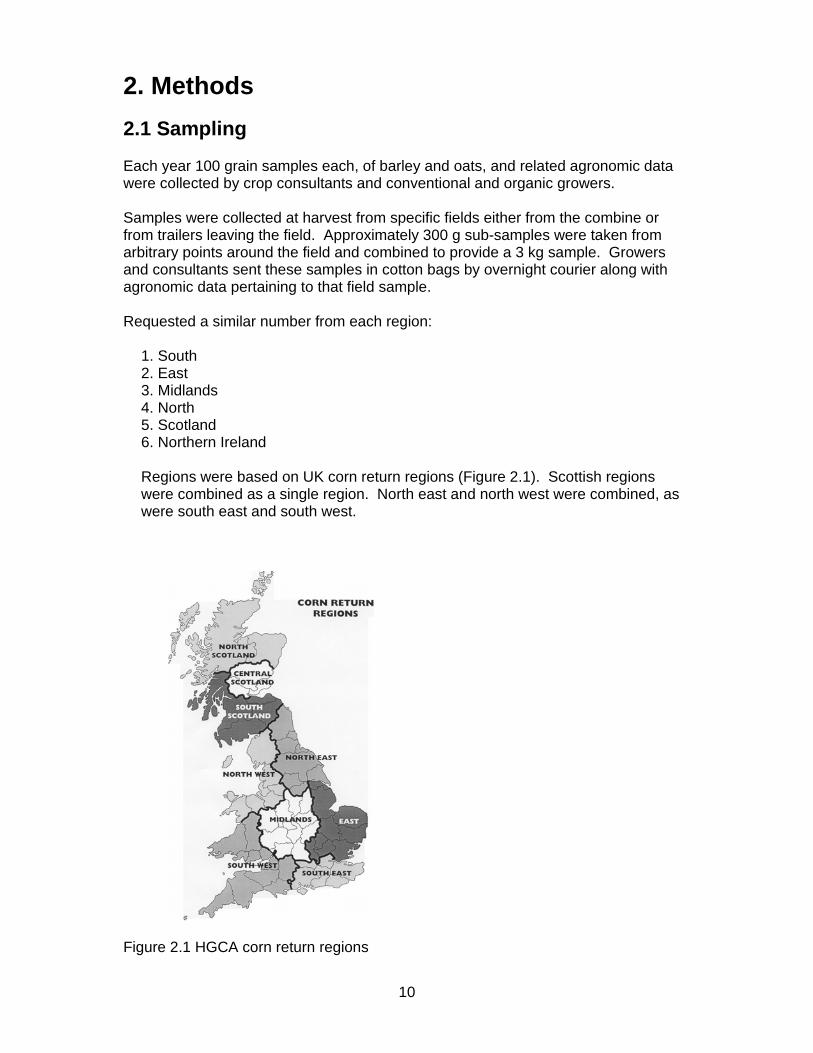
2. Methods 2.1 Sampling Each year 100 grain samples each, of barley and oats, and related agronomic data were collected by crop consultants and conventional and organic growers. Samples were collected at harvest from specific fields either from the combine or from trailers leaving the field. Approximately 300 g sub-samples were taken from arbitrary points around the field and combined to provide a 3 kg sample. Growers and consultants sent these samples in cotton bags by overnight courier along with agronomic data pertaining to that field sample. Requested a similar number from each region:
1. South 2. East 3. Midlands 4. North 5. Scotland 6. Northern Ireland
Regions were based on UK corn return regions (Figure 2.1). Scottish regions were combined as a single region. North east and north west were combined, as were south east and south west.
Figure 2.1 HGCA corn return regions

11
Requested a similar number from each of the following categories: 1. Organic production 2. Conventional production Agronomy details requested were:
Field name or reference number Acreage of wheat grown County Variety Intended end use Cultivation technique Previous crop Maize in the rotation? Maize next to this crop? What fungicides were applied at T3, at what growth stage, on what date? What fungicides were applied at T2, at what growth stage, on what date?
On receipt of samples their moisture content was determined. A 500 g sub-sample of grain was removed using a ripple divider, dried to 12% moisture content and stored at room temperature for visual assessment. The remaining sample was milled with a 1 mm screen, mixed in a tumbler mixer before two 300 g sub-samples were collected. One sample was sent to RHM Technology for mycotoxin analysis, the remaining sample was held at Harper Adams as an archive sample at –20°C. 2.2 Mycotoxin analysis All mycotoxin analysis was performed by RHM Technology (High Wycombe) using UKAS accredited procedures. The trichothecenes deoxynivalenol (DON), nivalenol (NIV), 3-acetylDON, 15-acetylDON, fusarenone X, T2 toxin, HT2 toxin, diacetoxyscirpenol (DAS), neosolaniol and T2 triol were analysed by GC-MS. Spiked samples were included in each batch to determine extraction recovery. The method had acceptable recovery range for each trichothecene of 70-110%. Results were corrected for recovery. For this study the calculation of the measurement uncertainty was carried out using in-house data, performance in international collaborative trials and Food Analysis Performance Assessment Scheme (www.fapas.co.uk/fapas.cfm) thus incorporating repeatability and reproducibility data. The expanded measurement of uncertainty was calculated using a standard coverage factor of 2, equivalent to a confidence of approximately 95% that the actual level of the mycotoxin being measured lies within the quoted range. The expanded measurement of uncertainty was calculated to be ±25%. The limit of quantification (LoQ) was determined as six times the baseline noise and calculated to be 10 ppb. Samples below the LoQ were entered as (LoQ)/6, ie 1.667 ppb in the calculation of mean values. Zearalenone was analysed by HPLC. Spiked samples were included in each batch to determine extraction recovery. The UKAS accredited method had acceptable recovery range for zearalenone of 70-110%. Results were adjusted according to recovery. For this study the calculation of the measurement uncertainty was carried

12
out using in-house data, performance in international collaborative trials and Food Analysis Performance Assessment Scheme (www.fapas.co.uk/fapas.cfm) thus incorporating repeatability and reproducibility data. The expanded measurement of uncertainty was calculated using a standard coverage factor of 2, equivalent to a confidence of approximately 95% that the actual level of the mycotoxin being measured lies within the quoted range. The expanded measurement of uncertainty was calculated to be ±18%. The limit of quantification (LoQ) was determined as six times the baseline noise and calculated to be 3 ppb. Samples below the LoQ were entered as (LoQ)/6, ie 0.5 ppb in the calculation of mean values. Moniliformin was analysed by HPLC. Spiked samples were included in each batch to determine extraction recovery. The UKAS accredited method had acceptable recovery range for moniliformin of 70-110%. Results were adjusted according to recovery. For this study the calculation of the measurement uncertainty was carried out using in-house data. The expanded measurement of uncertainty was calculated using a standard coverage factor of 2, equivalent to a confidence of approximately 95% that the actual level of the mycotoxin being measured lies within the quoted range. The expanded measurement of uncertainty was calculated to be ± 19%. The limit of quantification (LoQ) was determined as six times the baseline noise and calculated to be 10 ppb. Samples below the LoQ were entered as (LoQ)/6, ie 1.667 ppb in the calculation of mean values. 2.2.1 Amendment to methodology From 2003 it was identified that moniliformin and zearalenone were rarely detected in UK barley and oats and when detected they were only present at low concentrations. It was therefore agreed to reduce zearalenone samples from 100 to 50 per year and cease moniliformin analysis. Funds released from this amendment allowed an increase in oat samples analysed for trichothecenes each year from 100 to 150 samples and allowed the analysis of experimental oat material from industry-funded agronomy trials. 2.3 Trichothecene analysis of experimental oat material As a consequence of the multicolinearity of the observational data it was decided to identify available experimental oat material from replicated agronomy trials which could allow the impact of specific agronomic factors to be determined. Of the limited material available the following samples were tested:
1) HGCA recommended list oat variety trials 2) Oat samples from a factorial designed experiment of seed and nitrogen rate
2.3.1 HGCA Recommended List oat variety trials In 2004 and 2005, composite samples from replicated plots were collected from each HGCA recommended list variety trial across the UK. Samples were sent to DARD in Northern Ireland for assessment of quality parameters. A sub-sample of each

13
composite sample was forwarded to Harper Adams for milling and subsequent trichothecene analysis as detailed previously. Each trial site was screened for trichothecene content using standard varieties for winter (Gerald) and spring (Firth) oats. Trial sites were selected based on the HT2+T2 concentration of these two varieties. Each year all varieties were analysed for up to five selected trials. Effect of variety was tested for winter and spring oats using trial site as a block factor. 2.3.2 Seed and nitrogen rate agronomy trials Oat samples were provided by Quaker Oats from a series of agronomy trials with different seed rates and nitrogen inputs. All experiments were screened for HT2 and T2 content using a standard treatment (seed rate = 250 m-2 and 100 kg ha-1 nitrogen). Four trials were selected with high HT2+T2 content. These were trials at a single site, Balgonie, with varieties Gerald and Buffalo after ploughing and min-till cultivation. Four treatments were selected for trichothecene analysis. These were 100 (40:40:20) and 160 (40:40:80) kg ha-1 nitrogen at two seed rates (250 and 400 m-2) in a randomised block design with three replicates. Trials were analysed using factorial analysis of variance (seed rate x nitrogen rate) with blocks (trial + block). 2.3.3 Oat samples from PGR field experiments Oat samples were provided from HGCA-funded field experiments conducted by DARD and ADAS on the impact of plant growth regulators (PGR) on oat agronomy. No experiments had high HT2 and T2, however, all samples were analysed for two experiments. Analysis of variance was used to compare the results for untreated and chlormequat-treated samples in a randomised block design with three replicates analysed using treatment (± chlormequat at GS32) with blocks (trial + block).

14
2.4 Impact of de-hulling on trichothecene content of oats 2.4.1 First experiment Four samples of oats with moderate to high HT2 and T2 were identified from the 2002 harvest. One kg of each sample was split using a riffle divider, 500 g was milled as a raw oat sample, and the remaining 500 g was de-hulled. Separated hulls and groats were milled. Raw oat, groats and hulls were analysed for trichothecenes as previously described. Mass balance calculations were performed for HT2 and T2 for each oat sample. For mass balance calculations the weights of the separated hulls and groats, and their respective mycotoxin contents were used to calculate the concentrations of HT2 and T2 in the original, unprocessed oats. The calculated concentration of the original oat samples were then compared to the concentration value obtained by direct measurement of the intact oats. Percentage reduction of mycotoxins as a result of de-hulling was determined. 2.4.2 Second experiment Samples of oats with a HT2+T2 concentration of more than 200 ppb were selected from each year. A sample of oat grains (100 g) was de-hulled, separated, groats and hulls were milled and analysed for trichothecenes. Mass balance calculations were performed for HT2 and T2. Percentage reduction of HT2 and T2 as a result of de-hulling was determined. The effect of year, variety, percentage groat content (mass of groat compared to oat) and oat HT2 content on percentage reduction was analysed by analysis of variance. 2.5 Statistical analysis For summary statistics, samples with a mycotoxin content below the limit of quantification (LoQ) were assigned a value of (LoQ)/6 for calculation of mean values according to the methodology of the fusarium mycotoxin SCOOP project (Anon 2003a). Summary statistics (percentage greater than 10 ppb, mean, median, 90th percentile, 95th percentile and maximum) were calculated using Excel (Microsoft v.2002). All other statistical analysis was completed using Genstat (Lawes Agricultural Trust, v8) unless stated otherwise. Relationships between mycotoxin concentrations were determined using regression analysis. Statistical analysis to determine agronomic factors on the fusarium mycotoxin concentration of oats was performed using a stepwise selection ANOVA. For modelling the mycotoxin concentration of samples, samples with a mycotoxin concentration below the LoQ were assigned a value of (LoQ)/2 and log10 transformed and analysed using a normal distribution. For mycotoxins with a low incidence, the incidence and concentration of positive samples was modelled. For modelling the incidence of samples, samples below the LoQ were assigned a value of 0 and those above the LoQ a value of 1 and analysed using a Bernoulli distribution. Models of mycotoxin concentrations were validated using residual plots and models of incidence were validated by Receiver Operating Characteristic (ROC) curve analysis (SPSS, v14). The predictive ability of the HT2+T2 model for oats was assessed by observing the stability of the parameter estimates for each year and by calculating the Prediction Error Sum of Squares (PRESS) (Montgomery & Peck, 1992).

15
3. Results 3.1 Summary of samples received Overall the target of 900 samples was achieved (904 samples received); however the number of received barley and oat samples was 11.5% over and 9% under the target respectively (Table 3.1.1). Table 3.1.1 Number of samples received compared to target. Barley Oats Year Target Received Target Received 2002 100 111 100 92 2003 100 128 100 104 2004 100 110 150 128 2005 100 97 150 134 Total 400 446 500 458
Numbers of samples collected from all regions were reasonably balanced for barley. The balance across regions was less balanced for oats due to oat production being focussed around the major oat processors (Table 3.1.2 and 3.1.3). Table 3.1.2 Barley sample distribution by year and region.
Region Year South East Midlands North Scotland N.Ireland
Total
2002 27 14 20 17 14 19 111 2003 21 20 17 25 21 24 128 2004 17 17 24 23 14 15 110 2005 12 15 23 15 19 13 97 Total 77 66 84 80 68 71 446
Table 3.1.3 Oat sample distribution by year and region.
Region Year South East Midlands North Scotland N.Ireland
Total
2002 14 12 27 13 11 15 92 2003 22 5 16 22 27 12 104 2004 22 19 27 33 18 9 128 2005 27 17 33 27 21 9 134 Total 85 53 103 95 77 45 458

16
The vast majority of UK barley and oats received no fungicide spray at T3 (Table 3.1.4 and 3.1.5). T3 fungicide spray categories are detailed in Appendix 1. A sufficient number of organic samples were collected to allow a valid statistical comparison of organic and conventional samples. Table 3.1.4 Barley sample distribution by year and T3 fungicide category. T3 fungicide Year Azole Strob Azole/Strob No T3 Organic Total 2002 1 3 4 67 36 111 2003 6 10 11 66 35 128 2004 1 5 9 72 23 110 2005 5 4 9 65 14 97 Total 13 22 33 270 108 446
Table 3.1.5 Oat sample distribution by year and T3 fungicide category. T3 fungicide Year Azole Strob Azole/Strob No T3 Organic Total 2002 0 3 5 54 30 92 2003 5 4 1 49 45 104 2004 6 1 2 105 14 128 2005 4 1 3 100 26 134 Total 15 9 11 308 115 458

17
3.2 Summary statistics for barley Of the twelve fusarium mycotoxins analysed, ten were detected. Diacetoxyscirpenol and neosolaniol were not detected in any sample (LoQ = 10 ppb). Acetylated versions of DON (3AcDON and 15AcDON), fusarenone X and T2 triol were detected in less than 1% of samples. Zearalenone and moniliformin were detected in 2% of samples. All the rarely occurring mycotoxins above were only detected at low concentrations. DON, nivalenol and HT2 were occasionally detected above 100 ppb. Tables 3.2.1 to 3.2.5 below show the percentage above 10 ppb (the limit of quantification for trichothecenes), the mean, median, the 90th percentile, the 95th percentile and the maximum concentration for each mycotoxin detected in each year. Combined values are provided for HT2 and T2 as these closely related mycotoxins have equivalent toxicity and European legal limits will be based on a combined concentration. Table 3.2.1 Mycotoxin concentrations for all mycotoxins detected in UK barley in 2002 (111 samples).
Mycotoxin concentration (ppb) %>10ppb Mean Median 90% 95% Max
DON 51 16 11 31 58 277 NIV 25 <10 <10 18 28 157 15AcDON 1 <10 <10 <10 <10 21 HT2 18 <10 <10 18 28 98 T2 3 <10 <10 <10 <10 32 HT2+T2 18 <20 <20 20 33 130 Zearalenone 3 <3 <3 4 6 44 Moniliformin 4 <10 <10 <10 <10 45
Means are based on an imputation of 1.667 (0.5 for zearalenone) for all samples below the limit of quantification (10 ppb; 3 ppb for zearalenone). Table 3.2.2 Mycotoxin concentrations for all mycotoxins detected in UK barley in 2003 (128 samples).
Mycotoxin concentration (ppb) %>10ppb Mean Median 90% 95% Max
DON 61 17 12 35 45 207 NIV 33 10 <10 31 50 105 HT2 48 13 <10 33 57 80 T2 17 <10 <10 15 20 34 HT2+T2 48 <20 <20 45 80 105 ZEAR 1 <3 <3 <3 <3 35
Means are based on an imputation of 1.667 (0.5 for zearalenone) for all samples below the limit of quantification (10 ppb; 3 ppb for zearalenone).

18
Analysis of moniliformin was discontinued and analysis of zearalenone was reduced to 50 samples per year from 2004 onwards. Table 3.2.3 Mycotoxin concentrations for all mycotoxins detected in UK barley in 2004 (110 samples).
Mycotoxin concentration (ppb) %>10ppb Mean Median 90th% 95th% Max
DON 60 17 11 41 58 147 NIV 20 <10 <10 26 41 144 FUS-X 4 <10 <10 <10 <10 55 HT2 28 <10 <10 21 36 105 T2 9 <10 <10 <10 20 36 T2 triol 1 <10 <10 <10 <10 11 HT2+T2 30 <20 <20 22 53 138 ZEAR 6 <3 <3 <3 6 21
Means are based on an imputation of 1.667 (0.5 for zearalenone) for all samples below the limit of quantification (10 ppb; 3 ppb for zearalenone). Table 3.2.4 Mycotoxin concentrations for all mycotoxins detected in UK barley in 2005 (97 samples).
Mycotoxin concentration (ppb) %>10ppb Mean Median 90th% 95th% Max
DON 54 28 11 32 46 1416 NIV 21 <10 <10 17 40 95 3AcDON 1 <10 <10 <10 <10 15 15AcDON 1 <10 <10 <10 <10 35 HT2 48 13 <10 39 52 91 T2 18 <10 <10 14 16 39 HT2+T2 48 <20 <20 49 66 113 ZEAR 2 <3 <3 <3 <3 13
Means are based on an imputation of 1.667 (0.5 for zearalenone) for all samples below the limit of quantification (10 ppb; 3 ppb for zearalenone).

19
Table 3.2.5 Mycotoxin concentrations for all mycotoxins detected in UK barley in 2001-2005 (446 samples). Mycotoxin concentration (ppb)
Year
Number of
samples %>10ppb Mean Median 90th% 95th% Max
DON 2002-2005 446 57 19 11 35 50 1416
15AcDON 2002-2005 446 0.5 <10 <10 <10 <10 35
3AcDON 2002-2005 446 0.2 <10 <10 <10 <10 15
NIV 2002-2005 446 25 <10 <10 24 45 157
FUS-X 2002-2005 446 0.7 <10 <10 <10 <10 55
DAS 2002-2005 446 0 <10 <10 <10 <10 <10
NEO 2002-2005 446 0 <10 <10 <10 <10 <10
T2 triol 2002-2005 446 0.2 <10 <10 <10 <10 11
T2 2002-2005 446 12 <10 <10 11 17 39
HT2 2002-2005 446 36 10 <10 28 45 105
HT2+T2 2002-2005 446 36 <20 <20 37 64 138
ZEAR 2002-2005 339 2 <3 <3 <3 6 44
MON 2002-2003 239 2 <10 <10 <10 <10 45
Means are based on an imputation of 1.667 (0.5 for zearalenone) for all samples below the limit of quantification (10 ppb; 3 ppb for zearalenone). DON was the most frequently detected fusarium mycotoxin and was usually present at the highest concentration. The distribution was skewed as can be seen by the large difference between the mean and median values and the frequency distribution graph (Fig 3.2.1). HT2 was the next most common fusarium mycotoxin detected although it was never detected at a high concentration (maximum = 105 ppb). HT2 and T2 were detected in 36 and 12% of samples respectively, the concentration was usually low but some samples did exceed the proposed combined limit of 100 ppb HT2 and T2 (Table 3.2.6). Zearalenone was detected in 10% of samples (LoQ = 3 ppb), only 2% of samples exceeded 10 ppb. No samples exceeded 100 ppb zearalenone. As for DON, the zearalenone distribution was also skewed (Fig 3.2.2). Comparisons of the mean, median, 90th percentile, 95th percentile and maximum values indicates that all mycotoxin detected had a skewed distribution similar to DON and zearalenone.

20
Table 3.2.6 Percentage of samples exceeding 1250 ppb DON, 100 ppb HT2+T2 and 100 ppb zearalenone.
DON HT2+T2 Zear 2002 0.0 0.9 0.0 2003 0.0 1.6 0.0 2004 0.0 0.9 0.0 2005 1.0 1.0 0.0 ALL 0.2 1.1 0.0
It should be noted that the legal limits for DON and zearalenone include a measurement of uncertainty. Therefore for a consignment of unprocessed barley intended for human consumption to exceed the legal limit for DON the concentration as determined by the analytical procedures employed in this project would have to exceed 1563 ppb DON (1250+25%). The one sample which exceeded 1250 ppb was below 1563 ppb DON. If the limit for HT2+T2 is set at 100 ppb; the legal limit including the measurement of uncertainty using the analysis in this project would be 125 ppb. One sample of UK barley (138 ppb) exceeded 125 ppb HT2+T2 during this project.
0
10
20
30
40
50
60
<10 50 100 200 500 750 1250 2500 >2500DON (ppb)
Perc
enta
ge fr
eque
ncy
Fig 3.2.1 Percentage frequency of DON contamination in UK barley in 2002-2005 (n = 446).
EU limit (1250 ppb)

21
0102030405060708090
100
<3 10 20 50 100 200 400 >400Zearalenone (ppb)
Perc
enta
ge fr
eque
ncy
Fig 3.2.2 Percentage frequency of zearalenone contamination in UK barley in 2002-2005 (n = 339). It should be noted that this is not a stratified survey and as such the results may not be an accurate representation of the UK situation. The selection of particular samples from specific cropping practices may bias the summary data. 3.3 Regression analysis for barley Regression analysis failed to find any relationships between the concentrations of fusarium mycotoxins. This is probably due to the low incidence of many of the mycotoxins and the low concentration of the mycotoxins that were detected.
EU limit (100 ppb)

22
3.4 Summary statistics for oats Of the twelve fusarium mycotoxins analysed eight were detected, of these, DON, NIV, HT2, T2, T2 triol and NEO were detected above 100 ppb. Tables 3.4.1 to 3.4.5 below show the percentage above 10 ppb (the limit of quantification for trichothecenes), the mean, median, the 90th percentile, the 95th percentile and the maximum concentration for each mycotoxin detected in each year. Combined values are provided for HT2 and T2 as these closely related mycotoxins have equivalent toxicity and European legal limits will be based on a combined concentration. Table 3.4.1 Mycotoxin concentrations for all mycotoxins detected in UK oats in 2002 (92 samples). Mycotoxin concentration (ppb) %>10ppb Mean Median 90% 95% Max DON 12 <10 <10 11 14 92 NIV 60 41 18 93 167 606 HT2 85 224 66 494 1058 3685 T2 76 87 34 224 385 1159 T2 triol 11 <10 <10 <10 29 89 NEO 32 10 <10 22 44 107 HT2+T2 85 311 106 706 1444 4844 ZEAR 1 <3 <3 <3 <3 21
Means are based on an imputation of 1.667 (0.5 for zearalenone) for all samples below the limit of quantification (10 ppb; 3 ppb for zearalenone). Table 3.4.2 Mycotoxin concentrations for all mycotoxins detected in UK oats in 2003 (104 samples).
Concentration (ppb) %>10ppb Mean Median 90% 95% Max
DON 32 <10 <10 19 27 160 NIV 69 42 22 78 158 346 HT2 90 551 144 1246 1490 7584 T2 80 176 59 374 469 2406 T2 triol 47 21 <10 38 67 263 NEO 40 15 <10 36 54 189 HT2+T2 90 727 204 1656 2033 9990 ZEAR 1 <3 <3 <3 <3 12
Means are based on an imputation of 1.667 (0.5 for zearalenone) for all samples below the limit of quantification (10 ppb; 3 ppb for zearalenone). Analysis of moniliformin was discontinued and analysis of zearalenone was reduced to 50 samples per year from 2004 onwards.

23
Table 3.4.3 Mycotoxin concentrations for all mycotoxins detected in UK oats in 2004 (128 samples).
Mycotoxin concentration (ppb) %>10ppb Mean Median 90th% 95th% Max
DON 33 11 <10 24 41 282 NIV 65 35 16 69 158 497 3AcDON 1 <10 <10 <10 <10 26 HT2 94 398 149 1024 1627 5821 T2 87 103 47 241 451 1176 T2 triol 41 17 <10 49 74 257 NEO 36 12 <10 31 50 152 HT2+T2 94 500 202 1246 2004 6997 ZEAR 2 <3 <3 <3 <3 29
Means are based on an imputation of 1.667 (0.5 for zearalenone) for all samples below the limit of quantification (10 ppb; 3 ppb for zearalenone). Table 3.4.4 Mycotoxin concentrations for all mycotoxins detected in UK oats in 2005 (134 samples). Mycotoxin concentration (ppb) %>10ppb Mean Median 90th% 95th% Max DON 45 18 <10 59 68 224 NIV 91 74 45 144 206 847 HT2 97 510 284 1359 1898 2370 T2 91 184 106 480 547 870 T2 triol 57 20 13 59 69 109 NEO 54 17 11 45 54 86 HT2+T2 97 694 403 1905 2432 3188 ZEAR 0 <3 <3 <3 <3 9.7
Means are based on an imputation of 1.667 (0.5 for zearalenone) for all samples below the limit of quantification (10 ppb; 3 ppb for zearalenone).

24
Table 3.4.5. Mycotoxin concentrations for all mycotoxins detected in UK oats in 2002-2005 (458 samples). Mycotoxin concentration (ppb) Year
Number of
samples %>10ppb Mean Median 90th% 95th% Max
DON 2002-2005 458 32 11 0 24 50 282
15AcDON 2002-2005 458 0 <10 <10 <10 <10 <10
3AcDON 2002-2005 458 0.2 <10 <10 <10 <10 26
NIV 2002-2005 458 72 49 24 120 176 847
FUS-X 2002-2005 458 0 <10 <10 <10 <10 <10
DAS 2002-2005 458 0 <10 <10 <10 <10 <10
NEO 2002-2005 458 41 14 <10 38 53 189
T2 triol 2002-2005 458 41 17 <10 46 68 263
T2 2002-2005 458 84 140 58 389 502 2406
HT2 2002-2005 458 92 430 151 1110 1727 7584
HT2+T2 2002-2005 458 92 570 213 1492 2160 9990
ZEAR 2002-2005 296 1 <3 <3 <3 <3 29
MON 2002-2003 196 0 <10 <10 <10 <10 <10
Means are based on an imputation of 1.667 (0.833 for zearalenone) for all samples below the limit of quantification (10 ppb; 3 ppb for zearalenone). HT2 was the most frequently detected fusarium mycotoxin and was usually present at the highest concentration (Table 3.4.5). There was a good regression relationship between this and other type A trichothecenes; T2, T2 triol and NEO (Section 3.5). The distribution of all mycotoxins was skewed as can be seen by the large difference between the mean and median values and as demonstrated in the frequency distribution graph of HT2+T2 (Fig 3.4.1). Nivalenol was detected in a high percentage of samples (72% above 10 ppb) but was never present at a high concentration (>1000 ppb). DON was only an occasional contaminant of oats (32% above 10 ppb) and was never present above 500 ppb. Acetyl derivatives of DON and nivalenol were not detected in any sample (LoQ = 10 ppb). Zearalenone was rarely detected (5% of samples above 3 ppb), 1% of samples exceeded 10 ppb. Moniliformin was not detected in any oat sample (LoQ = 10 ppb; n=196). Analysis of moniliformin was discontinued after 2003 and analysis of zearalenone was restricted to 50 samples each year in 2004 and 2005.

25
The number of samples of UK oats that would exceed legal limits for HT2+T2 will depend on the final limits set. The number of samples exceeding 500 ppb ranged from 16 to 42% whereas the number of samples exceeding 2000 ppb ranged from two to nine percent (Table 3.4.6). Table 3.4.6 Percentage of oat samples exceeding 500, 1000, 1500 and 2000 ppb HT2+T2 (n=458).
Percentage of samples Year > 500 > 1000 > 1500 > 2000
2002 16 7 4 2 2003 33 18 13 6 2004 24 13 7 5 2005 42 25 14 9 Overall 30 17 10 6
In general, organic samples had lower HT2+T2 compared to conventional samples. The average HT2+T2 content of organic and conventional samples was 238 and 687 ppb respectively. As the vast majority of oats grown in the UK are produced using conventional practice the percentage of samples exceeding 500 ppb for both organic and conventional samples was compared (Table 3.4.7). Results indicate that between 20-50% of conventional UK oat samples exceeded 500 ppb HT2+T2 in any one year from 2002-2005. Table 3.4.7 Percentage of conventional and organic oat samples exceeding 500 ppb HT2+T2.
Year Conventional Organic Overall 2002 18 13 16 2003 41 22 33 2004 31 0 24 2005 50 8 42 Overall 36 11 30
It should be noted that the legal limits for fusarium mycotoxins include a measurement of uncertainty. Therefore for a consignment of unprocessed oats intended for human consumption to exceed the legal limit for HT2+T2, if set at 500 ppb, the concentration as determined by the analytical procedures employed in this project would have to exceed 625 ppb HT2+T2.

26
0
5
10
15
20
25
30
35
<10 125 250 500 1000 2000 4000 8000 >8000HT2+T2 (ppb)
Perc
enta
ge fr
eque
ncy
Fig 3.4.1 Percentage frequency of HT2+T2 contamination in UK oats in 2001-2005 (n = 458). It should be noted that this was not a stratified survey and as such the results may not be an accurate representation of the UK situation. The selection of particular samples from specific cropping practices will bias the summary data. For example, 25% of samples came from organic crops. The actual percentage of UK oat crops which were organic between 2002 and 2005 is estimated to be less than 10% (area grown) based on Defra statistics (Anon. 2007).
Proposed EU limit (500 ppb)

27
3.5 Regression analysis for oats There was a strong positive relationship (r2=0.91) between HT2 and T2 (Fig 3.5.1). There were weaker positive relationships between concentrations of T2 triol and neosolaniol against HT2 (Fig 3.5.2 and 3.5.3). These positive relationships are to be expected as these mycotoxins are all type A trichothecenes which are produced by the same species, namely F. langsethiae, F. sporotrichioides and F. armeniacum. To determine the effect of year on the relationship between HT2 and T2, values were log10 transformed and grouped by year. The regression was highly significant (p<0.001) and was significantly different between years (p=0.011). Across all years log10HT2 accounted for 89.9% of the variance in log10T2 concentration. Year accounted for only a further 1.3% of the variance accounted for, indicating that although there were significant differences in the regression between years, these differences were small; consequently the relationship between HT2 and T2 was fairly consistent during the four years of the project.
y = 0.27x + 30R2 = 0.91
0
500
1000
1500
2000
2500
3000
0 2000 4000 6000 8000
HT2 (ppb)
T2 (p
pb)
Figure 3.5.1 T2 against HT2 for oat samples from 2002-2005 (n=458). Samples with no quantifiable T2 were removed from the dataset.
y = 0.032x + 9.7R2 = 0.84
0
50
100
150
200
250
300
0 1000 2000 3000 4000 5000 6000 7000 8000
HT2 (ppb)
T2 tr
iol (
ppb)
Figure 3.5.2 T2 triol against HT2 for oat samples from 2002-2005 (n=458). Samples with no quantifiable T2 triol were removed from the dataset.

28
y = 0.019x + 13R2 = 0.67
0
50
100
150
200
0 1000 2000 3000 4000 5000 6000 7000 8000HT2 (ppb)
Neo
sola
niol
(ppb
)
Figure 3.5.3 Neosolaniol against HT2 for oat samples from 2002-2005 (n=458). Samples with no quantifiable neosolaniol were removed from the dataset. There are no other positive relationships between the concentrations of other commonly detected fusarium mycotoxins detected in UK oats. In fact both NIV and DON showed signs of mutual exclusion towards HT2+T2 and towards one another, ie when one mycotoxin was present at high concentration then the other was low (Fig 3.5.4-3.5.6). This would suggest that DON, NIV and HT2+T2 are produced by different Fusarium species which have different environmental requirements or actively compete against one another within the same environmental niche.
0
50
100
150
200
250
300
0 2000 4000 6000 8000 10000 12000HT2+T2 (ppb)
DO
N (p
pb)
Figure 3.5.4 DON against HT2+T2 concentration for oat samples from 2002-2005 (n=458).

29
0
200
400
600
800
1000
0 2000 4000 6000 8000 10000 12000HT2+T2 (ppb)
Niv
alen
ol (p
pb)
Figure 3.5.5 NIV against HT2+T2 concentration for oat samples from 2002-2005 (n=458).
0
50
100
150
200
250
300
0 200 400 600 800 1000Nivalenol (ppb)
DO
N (p
pb)
Figure 3.5.6 DON against NIV concentration for oat samples from 2002-2005 (n=458).

30
3.6 Statistical analysis for HT2+T2 in oats The aim of the statistical analysis was to determine the affect of agronomic factors on the fusarium mycotoxin contamination of oats. Results will determine “Good Agricultural Practice” for growers to minimise fusarium mycotoxins in oats. Samples with less than the LoQ were given a value of ½(LoQ) i.e. 5 ppb and all samples log10 transformed (loga = Log10 [HT2+T2]) to stabilise the variance. Significant agronomic factors were selected for the model using a stepwise selection ANOVA on Genstat (v8, Lawes Agricultural Trust). Temporal (year) and spatial (region) factors were forced into the model. Other agronomic factors were ordered based on the order in which they occur within a growing season. See Appendix 1 for a description of agronomic factors. Interactions between factors were entered into the model where there was a biological reason to expect one to occur. As weather is an important parameter of fusarium ear blight epidemiology one could expect a temporal (year) and spatial (region) interaction. As crop debris is an important parameter of fusarium ear blight epidemiology, as in the type and amount of crop debris, then one could expect an interaction between previous crop and the method of cultivation (± ploughing). Agronomic factors entered for selection were:
Year*region Practice Previous crop*plough Variety T3
(* indicates an interaction) After selection of factors to be used in the model, the data file was filtered of all samples containing blanks within these factors and the data was re-analysed. Of the factors tested, year, region, practice, previous crop and variety were all significant. There were significant interactions between year and region and between previous crop and cultivation. The model accounted for 46% of the observed variance. The figures below (Figure 3.6.1 to 3.6.4) show the back-transformed predicted means for each significant factor and the 95% confidence limits for the predicted means. For some agronomic factors there are low numbers of samples, this is usually indicated by the large confidence limits. Frequency of samples within agronomic factors, after removal of blanks, is displayed in Appendix 2. Statistical analysis of HT2+T2 in oats is detailed in Appendix 3. There was a highly significant (p<0.001) interaction between year and region with no apparent trend for differences between regions (Fig. 3.6.1). Therefore, high levels could occur in any region across the UK. There appears to be a trend for increasing amounts of HT2+T2 in England during the four years of the project. As there is no previous data for fusarium mycotoxins in UK oats it is not possible to determine if high levels of HT2+T2 is a recent occurrence.

31
0
200
400
600
800
1000
1200
South East Midlands North Scotland N. Ireland
Region
HT2
and
T2
(ppb
) .
2002200320042005
Figure 3.6.1 HT2+T2 contamination of oats by region for each year. Bars represent 95% confidence limits for predictions. Cultivation alone did not have a significant effect on HT2+T2 concentration (p=0.876). There was however a significant interaction between previous crop and cultivation (p=0.015) (Figure 3.6.2). The HT2+T2 concentration was significantly lower for “other” crops if ploughed. Ploughing had no significant effect when the previous crop was a cereal. In the case of grass as a previous crop, it was not possible to assess the effect of ploughing as no unploughed samples were obtained; nevertheless it was evident that HT2+T2 levels were significantly lower when grass was the previous crop.
0
200
400
600
800
1000
Wheat Barley Oats Grass Other
Previous crop
HT2
and
T2
(ppb
) . Ploughed
Not ploughed
Figure 3.6.2 Effect of cultivation and previous crop on HT2+T2 contamination of oats. Bars represent 95% confidence limits for predictions. Of the 28 oat varieties sampled within the project only five were present in high enough numbers (>10 samples) to allow valid statistical analysis. Of these five varieties, Gerald was the most common variety, composing 43% of total samples. Gerald had significantly higher HT2+T2 than any other variety (Figure 3.6.3).

32
Figure 3.6.3 HT2+T2 content of oat varieties. Bars represent 95% confidence limits for predictions. There was a highly significant (p<0.001) difference between oat samples from conventional and organic farms (Figure 3.6.4). The concentration of HT2+T2 in conventional samples was five times higher than in organic samples. There was some multicolinearity within the dataset as conventional and organic growers favoured different previous crops and varieties. Consequently it was difficult to identify a cause and effect relationship, and to distinguish the importance of practice, previous crop and variety. What can be identified by moving practice to the end of the model is that organic practice is still a highly significant factor (p<0.001) when previous crop and variety have already been taken into consideration by the model, indicating that other differences between the two practices not identified in the model also had a significant influence on HT2+T2 concentrations.
0
50
100
150
200
250
300
Conventional OrganicPractice
HT2
and
T2
(ppb
) .
Figure 3.6.4 HT2+T2 content of oat samples grouped by practice. Bars represent 95% confidence limits for predictions.
0
50100
150200
250
300350
400
Gerald Firth Grafton Jalna Millennium Other
Variety
HT2
and
T2 (p
pb)
.

33
3.6.1 Predictive quality of HT2+T2 model For a model to be used to predict the concentration of HT2+T2 based on known agronomy the predictive ability of the model developed must be assessed. The HT2+T2 model was tested in two ways. Firstly, the stability of the effect of the agronomic factors on HT2+T2 concentration was observed over the four year period (Appendix 3.5). The scatterplot of parameter estimate versus year showed that the estimates were relatively stable over the four year period for each agronomic factor. Factor levels which did show greatest variation over time were those with low numbers of samples and therefore expected to be less accurate, i.e. various previous crop/cultivation interactions. Secondly the predictive ability of the model was tested using the Prediction Error Sum of Squares (PRESS) statistic (Appendix 3.6; Montgomery & Peck, 1992). This method calculates R2
prediction, which if close to the R2 of the model indicates it may be a good predictive model. The R2
prediction was calculated to be 33% compared to the overall R2 of the model of 46% indicating that the model may not be a good predictor of new observations.
34
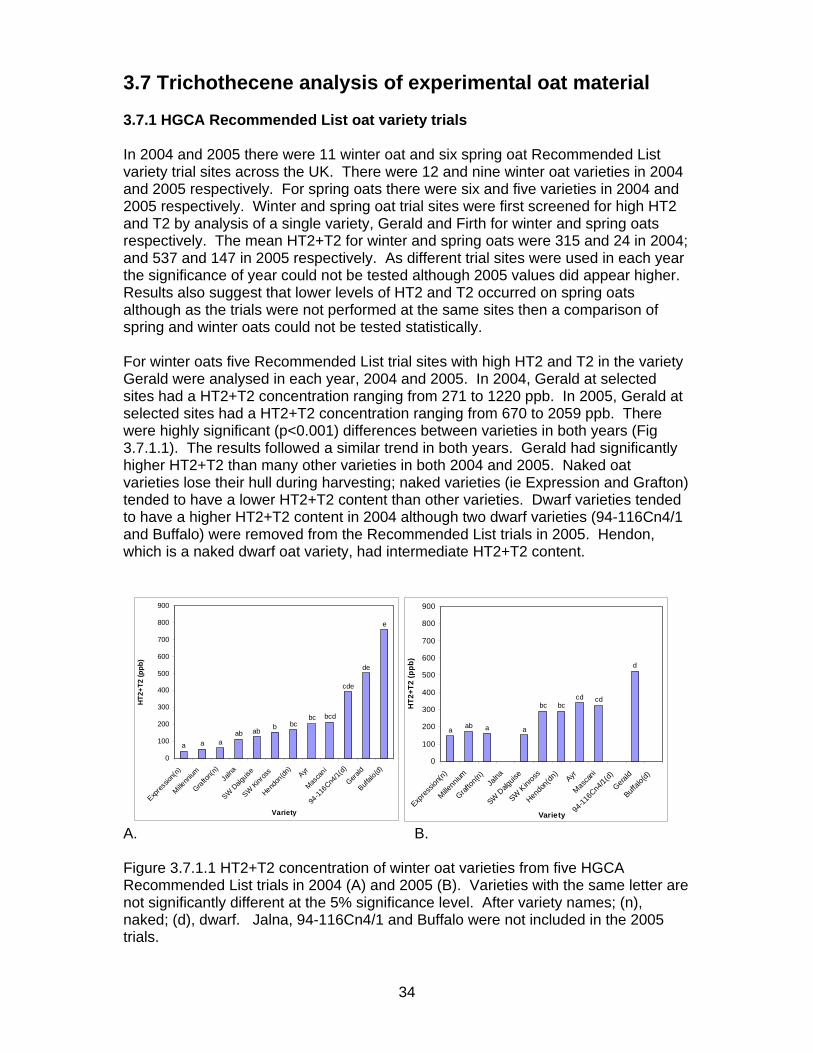
3.7 Trichothecene analysis of experimental oat material 3.7.1 HGCA Recommended List oat variety trials In 2004 and 2005 there were 11 winter oat and six spring oat Recommended List variety trial sites across the UK. There were 12 and nine winter oat varieties in 2004 and 2005 respectively. For spring oats there were six and five varieties in 2004 and 2005 respectively. Winter and spring oat trial sites were first screened for high HT2 and T2 by analysis of a single variety, Gerald and Firth for winter and spring oats respectively. The mean HT2+T2 for winter and spring oats were 315 and 24 in 2004; and 537 and 147 in 2005 respectively. As different trial sites were used in each year the significance of year could not be tested although 2005 values did appear higher. Results also suggest that lower levels of HT2 and T2 occurred on spring oats although as the trials were not performed at the same sites then a comparison of spring and winter oats could not be tested statistically. For winter oats five Recommended List trial sites with high HT2 and T2 in the variety Gerald were analysed in each year, 2004 and 2005. In 2004, Gerald at selected sites had a HT2+T2 concentration ranging from 271 to 1220 ppb. In 2005, Gerald at selected sites had a HT2+T2 concentration ranging from 670 to 2059 ppb. There were highly significant (p<0.001) differences between varieties in both years (Fig 3.7.1.1). The results followed a similar trend in both years. Gerald had significantly higher HT2+T2 than many other varieties in both 2004 and 2005. Naked oat varieties lose their hull during harvesting; naked varieties (ie Expression and Grafton) tended to have a lower HT2+T2 content than other varieties. Dwarf varieties tended to have a higher HT2+T2 content in 2004 although two dwarf varieties (94-116Cn4/1 and Buffalo) were removed from the Recommended List trials in 2005. Hendon, which is a naked dwarf oat variety, had intermediate HT2+T2 content.
A. B. Figure 3.7.1.1 HT2+T2 concentration of winter oat varieties from five HGCA Recommended List trials in 2004 (A) and 2005 (B). Varieties with the same letter are not significantly different at the 5% significance level. After variety names; (n), naked; (d), dwarf. Jalna, 94-116Cn4/1 and Buffalo were not included in the 2005 trials.
0
100
200
300
400
500
600
700
800
900
Expres
sion(n
)
Millenn
ium
Grafton
(n)Ja
lna
SW D
alguis
e
SW Kinr
oss
Hendo
n(dn) Ayr
Masca
ni
94-11
6Cn4
/1(d)
Gerald
Buffalo
(d)
Variety
HT2
+T2
(ppb
)
0
100
200
300
400
500
600
700
800
900
Expres
sion(n
)
Millenn
ium
Grafton(n
)Ja
lna
SW Dalg
uise
SW Kinros
s
Hendon
(dn)
Ayr
Masca
ni
94-11
6Cn4/1(
d)
Gerald
Buffalo
(d)
Variety
HT2+
T2 (p
pb)
a a aab
bc bccd cd
d
a a aab ab b bc
bc bcd
cde
de
e

35
For spring oats in 2004 all sites had low HT2 and T2 in variety Firth (<37 ppb). All spring oat varieties were analysed from the site with highest HT2+T2 concentration. Varieties at this single site had a HT2+T2 concentration range of <20 to 53 ppb. In 2005 the concentration of HT2 and T2 was generally higher and HT2 and T2 could be quantified at five of the six sites. There was no significant difference between varieties analysed from these five sites with a general mean of 130 ppb HT2+T2. 3.7.2 Oat samples from factorial designed field experiments of seed and nitrogen rate There was no significant difference in HT2+T2 content between seed rates (250 and 400 m-2) or nitrogen rates (100 and 160 kg ha-1) or a significant interaction (p=0.309, 0.635 and 0.196 respectively). The average HT2+T2 content for each trial is detailed in Table 3.7.2.1. As the trials were conducted at the same site with standardised agronomy the results would suggest that higher HT2+T2 occurred on Buffalo compared to Gerald and a higher HT2+T2 occurred after min-till compared to after ploughing. Table 3.7.2.1 Mean HT2+T2 content of agronomy trials in 2004
Cultivation Variety plough min-tillBuffalo 1052 1641 Gerald 614 698
3.7.3 Oat samples from PGR field experiments Oat samples were provided from three HGCA-funded field experiments conducted by DARD and ADAS on the impact of plant growth regulators (PGR) on oat agronomy. None of the experiments had high HT2 and T2, however, all samples were analysed for two experiments. There was no indication of any effect of the PGR chlormequat or trinexapac-ethyl (Moddus) on HT2+T2 concentration. Chlormequat was applied in both experiments at GS32. In an ANOVA of the results for untreated and chlormequat-treated samples in a randomised block design with three replicates analysed using treatment (± chlormequat at GS32) with blocks (trial + block), there was no significant difference (p=0.50) between treatments with a general mean of 30 ppb HT2+T2. However, due to the low concentration of HT2 and T2 in both experiments it is not known if a PGR could have an impact when the general concentration of HT2 and T2 was higher.

36
3.8 Impact of de-hulling on trichothecene content of oats 3.8.1 First experiment Results from the mass balance calculations show that there was a good relationship between the original concentration in unprocessed oats and the calculated concentration for unprocessed oats based on the mass and amount of mycotoxins found in the products of de-hulling i.e. groats and hulls. Regression analysis of the actual and mass balance calculated concentrations were close to one another. The gradient was close to one, the constant close to zero and the r2 was 0.97 (Figure 3.8.1.1).
y = 1.04x + 0.11R² = 0.97
2
2.5
3
3.5
2 2.5 3 3.5
Mas
s ba
lanc
e co
ncen
tratio
n (p
pb)
Original concentration (ppb)
HT2
T2
HT2+T2
Linear ( )Combined regression
Fig 3.8.1.1 Mass balance correlation for four oat samples. There was a consistent and high reduction of HT2 and T2 during de-hulling of between 90-98% and a corresponding increase in the oat hulls of ca. 300% (Table 3.8.1.1 and Figure 3.8.1.2) Table 3.8.1.1 Mycotoxin content of oats, groats and hulls from four samples and corresponding percentage reduction/increase

37
Mycotoxin Sample Oat Groat Hull
Conc (ppb)
Conc (ppb)
% Reduction Conc. (ppb)
% Increase
HT2 1 352 24 93 1213 345 2 630 58 91 2219 352 3 1981 146 93 6162 311 4 2228 46 98 7832 352 T2 1 140 10 93 487 348 2 413 36 91 1415 342 3 840 64 92 2270 270 4 692 36 95 2282 330 HT2+T2 1 492 34 93 1700 346 2 1043 94 91 3634 348 3 2821 210 93 8432 299 4 2920 82 97 10114 346
Fig 3.8.1.2 Concentration of HT2+T2 in unprocessed oats and corresponding de-hulled groats for four commercial samples of oats.
0
500
1000
1500
2000
2500
3000
3500
1 2 3 4Sample Number
HT2
+T2
(ppb
)
OatGroat

38
3.8.2 Second experiment A total of 88 samples were de-hulled and resulting groats and hulls analysed for trichothecenes to determine the consistency of de-hulling and the effect of year of harvest, variety, percentage groat content and oat trichothecene content. Samples were selected based on a HT2+T2 content of more than 200 ppb. Some samples had no quantifiable T2 in groats (n=25) whilst a few had no quantifiable HT2 or T2 (n=11). A mass balance and a percentage reduction can only be determined when the mycotoxin can be quantified in all fractions. Analysis of samples with quantifiable HT2 and T2, or samples with quantifiable HT2 gave similar results for the impact of de-hulling on mycotoxin content of groats and hulls. Results for HT2 are shown here as this includes more samples. The mass balance calculations showed that the calculated concentration with the 100 g de-hulled sample did not match the original 2.5 kg oat sample (difference greater than 50%) for 13 samples; as a consequence these samples were not included in the analysis. A lack of correlation may have been due to the small sample size de-hulled. Figure 3.8.2.1 shows the correlation between actual and calculated concentrations for each oat sample. The 13 samples with an unacceptable mass balance are shown as pink squares. The regression of mass balance against original HT2 concentration of acceptable samples had a constant of zero, a gradient close to one and an r2 of 0.86.
Fig 3.8.2.1 Mass balance correlation for 77 oat samples. Sixty six samples had quantifiable HT2 in all fractions and an acceptable mass balance. The percentage reduction of these samples was analysed to determine the effect of year, variety, percentage groat content (relative mass of groat to oat) and oat HT2 concentration. The percentage reduction was significantly higher in 2004 compared to all other years (p=0.005). There was no significant effect of variety
y = 0.995xR2 = 0.86
1.5
2
2.5
3
3.5
4
1.5 2 2.5 3 3.5 4
Log(Original HT2 concentration ppb)
Log(
Mas
s ba
lanc
e H
T2 c
once
ntra
tion
ppb)

39
(p=0.691). Groat content and oat HT2 concentration had no effect on the percentage reduction. However it can be observed that the range of percentage reduction observed was greatest at lower concentrations of HT2 in oat samples (Figure 3.8.2.2). It should also be noted that the wider range observed compared to the first de-hulling experiment may have been due to the small sample size used in this experiment. Sample size was limited due to the amount of oat grain material available, less than 500 g and the capacity of laboratory de-hullers, which can only de-hull 50 g per batch. The average reduction of HT2 during de-hulling was 89% and the content of hulls was 324% higher than the raw oat content. The maximum HT2+T2 content of groats and hulls were 928 and 27286 ppb respectively, which resulted from an oat sample with 9990 ppb original concentration of HT2+T2.
50
60
70
80
90
100
0 2000 4000 6000 8000
% re
duct
ion
durin
g de
hulli
ng
Oat HT2 concentration ppb
2002
2003
2004
2005
Figure 3.8.2.2 Percentage reduction in HT2 concentration during de-hulling

40
3.9 Statistical analysis for HT2+T2 in barley As for HT2+T2 in oats, the aim of the statistical analysis was to determine the effect of agronomic factors on the fusarium mycotoxin contamination of barley. Results will determine “Good Agricultural Practice” for growers to minimise fusarium mycotoxins in barley. Significant agronomic factors were selected for the model using a stepwise selection ANOVA on Genstat (v8, Lawes Agricultural Trust). Temporal (year) and spatial (region) factors were forced into the model. All other agronomic factors were ordered based on the order in which they occur within a growing season. After selection of factors to be used in the model the data file was filtered of all samples containing blanks within these factors and the data was re-analysed. Due to the low frequency of samples with detectable levels of HT2 and T2 (36% with quantifiable HT2 and/or T2) the dataset was analysed by incidence and the sub-set of positive samples was analysed by concentration. Agronomic factors are detailed in Appendix 4, frequency of samples within agronomic factors, after removal of blanks, is displayed in Appendix 5. Statistical analysis of HT2 and T2 in barley is detailed in Appendix 6. Samples with less than the LoQ were given a value of 0 (absence) and those above the LoQ a value of 1 (presence). A logistic model with a Bernoulli distribution was used to model the incidence of HT2+T2 for each individual sample. For positive samples the combined concentration was log10 transformed (loga = Log10 [HT2+T2]) to stabilise the variance. Of the factors tested for incidence, year*region and type were all significant. The figures below show the estimated mean proportions of samples with quantifiable levels of HT2+T2 for each significant factor. The incidence model accounted for 22% of the observed variance. Of the factors tested; only year*region were significant for HT2+T2 concentration of positive samples. The concentration model accounted for 32% of the observed variance. The figures below show the back-transformed predicted means for each significant factor and the 95% confidence limits for the predicted means. For some year / region combinations there are low numbers of samples, this is usually indicated by the large confidence limits. Results indicate that HT2 and T2 were not detected in barley samples from the North of England and Scotland in 2002 (Fig 3.9.1). In positive samples the concentration was not significantly different between years (p=0.852) although there was a highly significant difference between regions (p<0.002) and an interaction between year and region (p<0.004). The predicted mean HT2+T2 content for positive samples fluctuated between 12 and 57 ppb for any year / region combination.

41
A. B. Fig. 3.9.1 A. Predicted proportion of UK barley samples with quantifiable HT2+T2 by region. B. Predicted concentration of HT2+T2 in positive samples (>LoQ). Bars represent 95% confidence limits for predictions.
The incidence of HT2+T2 was significantly different (p<0.001) between types of barley (Fig 3.9.2). Spring malting barley had the highest incidence of HT2+T2. There were no significant differences in the HT2+T2 concentration of positive samples between each type of barley.
Fig. 3.9.2 Predicted proportion of UK barley samples with detectable HT2+T2 grouped by type. Bars represent 95% confidence limits for predictions.
0
0.1
0.2
0.3
0.4
0.5
0.6
0.7
0.8
0.9
1
South
East
Midland
sNort
h N.I
Scotla
nd
Region
Pred
icte
d in
cide
nce
of H
T2 a
nd T
22002
20032004
2005
0
10
20
30
40
50
60
70
80
90
100
South
East
Midlan
dsNort
h N.I
Scotla
nd
Region
HT2
+T2
(ppb
) 2002
2003
2004
2005
0
0.1
0.2
0.3
0.4
0.5
0.6
0.7
0.8
0.9
1
Winter Malt Winter TwoRow
Winter SixRow
Spring Malt Spring Feed
Type
Pre
dict
ed in
cide
nce
of H
T2 a
nd T
2

42
Discussion Amounts of fusarium mycotoxins in UK barley samples from 2002-2005 were consistently low. Due to the low levels of mycotoxins detected in UK barley there was no regression relationships between mycotoxins. Modelling of HT2+T2 incidence and concentration failed to identify any agronomic factors other than year and region which had an impact on the concentration of HT2+T2. The lack of significant agronomic factors identified compared to the analysis of HT2+T2 concentration in wheat, which had a similar distribution of HT2+T2 (See FSA project CO4022/HGCA project 2452), may have been due to the lower number of samples of barley analysed (n=395) compared to wheat (n=1453). The type of barley grown had an impact on the incidence of HT2+T2; spring malting barley had a significantly higher incidence compared to other types. This may indicate that spring malting barley has a lower resistance to HT2+T2 producing Fusarium species compared to other barley types. Amounts of fusarium mycotoxins In UK oat samples from 2002-2005 were generally low. However, there was a high incidence and high mean concentration of HT2 and T2. Modelling of HT2+T2 concentration of oat samples against agronomic factors identified a significant interaction between year and region. This is probably due to fluctuation in weather between years and regions. There was no trend from North to South, as seen for DON in wheat, which would indicate that the temperature difference across the UK does not limit HT2 and T2 production in oats. This is different to DON in wheat where there was a lower concentration in the North of Britain. Oat samples with more than 500 ppb HT2+T2 were detected in all regions of the UK at similar frequencies. The highest concentration of HT2+T2 occurred in 2005, which was a relatively dry summer. High levels of HT2+T2 were not seen in 2004, when DON and zearalenone were highest on wheat after a wet harvest. This would indicate that the HT2+T2-producing Fusarium species probably have different environmental requirements than F. culmorum and F. graminearum, which produce DON and prefer wet conditions. Most conventional oat samples were from fields that were ploughed after a cereal, in particular wheat. A greater percentage of organic oat samples were from fields after a non-cereal compared to conventional samples. Samples of oats following crops other than cereals or grass were combined as “other” to allow them to be included within the analysis. HT2+T2 concentrations were significantly lower following non-cereals. There was a significant interaction between previous crop and cultivation, the main observation of the interaction was that oats following non-cereal crops had a higher HT2+T2 content if the field was min-tilled rather than ploughed. The interaction of previous crop and cultivation would indicate that crop debris is a source of inoculum of HT2+T2-producing Fusarium species. No oat samples were collected from oat crops after maize, indicating this crop sequence must be rare within current rotations. Wheat grown after maize was identified as a high risk for DON in the wheat project (FSA CO4022/HGCA 2452). The model indicated that the most popular UK oat variety during the project, Gerald, had the highest HT2+T2 content of the five most commonly sampled varieties. Gerald accounted for 42% of certified oat seed sold in England and Wales in the

43
2004/2005 season (Anon, 2005b) and accounted for 43% of oat samples within this project. There was a five-fold difference in the predicted mean HT2+T2 content of conventional and organic oat samples with organic samples having a significantly lower HT2 and T2 content compared to conventional oats. Previous studies of organic and conventional cereals tend to include few organic samples and they either identified no difference between organic and conventional samples or they identified a significant but small difference which may occur in a limited number of regions or seasons within a study. There was a degree of multicolinearity within the dataset in that organic growers tended to use different varieties and previous crops compared to conventional growers. This resulted in the model not being able to clearly distinguish the degree to which some agronomic factors were having an impact on the HT2 and T2 content of oats. However, by moving practice from the front to the end of the model it could be identified that other agronomic factors that differ between the two practices, not included within the model, also had a significant effect. Therefore organic samples were significantly lower than conventional crops due to variety choice, previous crop and one or more other factors. One possible other factor not included in the model is crop rotation. Organic growers tend to have longer rotations which are more diverse and less cereal intensive than conventional growers. This could result in a lower level of the HT2+T2-producing Fusarium inoculum within organic production. This is in agreement with the wheat project (FSA CO4022/ HGCA 2452) which identified a significantly lower (ca. two-fold) incidence of HT2+T2 in organic compared to conventional wheat samples. The predictive quality of the oat HT2+T2 model was tested using two methods. Firstly, the parameter estimates for each agronomic factor where determined for each year. The results showed that the estimates were stable for the majority of factors over the course of the project. The levels within a factor which showed relatively large variation were those levels with low sample numbers and therefore known to be less accurate. Using the Prediction Sum of Squares analysis (Montgomery and Peck 1992) the calculated R2
prediction was markedly lower than the model’s overall R2 indicating that the model may not be a good predictor of new observations. Consequently, the results from this project should not be used to predict the HT2+T2 content of samples with known agronomy but should be used to design field experiments which can test the effect of individual agronomic factors where all other agronomy is standardised to test specific hypotheses. A good example of this principle is the oat variety data. Results from the model indicated that Gerald had a higher HT2+T2 content than the other five most popular varieties. The availability of the samples from HGCA Recommended List trials allowed the HT2 and T2 content of all current UK varieties to be compared from replicated field trials from across the UK. Results were similar to the observational data levels, highest to lowest in the winter oats Gerald, Jalna, Grafton and Millennium. Firth was the only spring variety with enough samples to be analysed in the observational data. This variety was the lowest of the five varieties analysed. Analysis of Firth from all spring oat Recommended List trials in 2004 and 2005 indicated that HT2 and T2 concentrations were consistently low on these sites compared to the winter oat trial sites. In 2005, all varieties of five spring oat variety trials were analysed for HT2 and T2; there was no significant difference between varieties, which all had a low HT2+T2 content (general mean = 130 ppb). Naked oats appeared to have a lower HT2 and T2 content at harvest; these varieties lose

44
their hulls during harvest. These results agree with a study in Austria where three covered (conventional) and three naked oat varieties were compared at three locations. The naked oats had a consistently lower HT2 and T2 content compared to covered oats (Adler et al. 2003). From the Recommended List samples, dwarf varieties appeared to have a higher HT2+T2 content although there were only two examples in 2004, which were removed from the Recommended List trials in 2005. Hendon is a dwarf naked variety which had a moderate HT2+T2 content. Results from this project have clearly identified that differences in oat variety resistance to Fusarium exists and this should be a priority for oat breeders and monitored during breeding programs and variety performance trials. Other agronomy trial samples showed there was no significant effect of nitrogen fertiliser rate or seed rate and there was no indication of a large effect of PGR use on HT2+T2 content. Further work is needed to clearly identify the agronomic factors that contribute to HT2 and T2 concentration in UK harvested oats. The benefits of organic production need to be identified so methods can be adopted by conventional growers. It is very expensive and time consuming to perform field experiments which involve different rotations and/or cultivation methods over a number of seasons. It may be more appropriate to identify differences in rotations from observational experiments and to study the epidemiology of HT2 and T2-producing Fusarium species on oats to allow targeted control strategies to reduce these Fusarium species on oats. Amounts of fusarium mycotoxins in UK barley samples from 2002-2005 were consistently low. No samples exceeded the legal limits for zearalenone and DON. A low percentage of samples contained HT2+T2 above 100 ppb. These results from field samples are in agreement with previous survey data from stores in 1999 (MacDonald et al. 2004) and more recent survey data of UK feed and malting barley from stores (Baxter 2006; Baxter and Salmon 2006). These results however, do differ from fusarium mycotoxin concentrations detected in barley in other countries. In North America high levels of DON have been detected in barley (Jones and Mirocha 1999; Campbell et al. 2002) and in France significant levels of HT2 and T2 have been detected in recent years (Galtier, 2007). This may be due to various differences in agronomy between countries but the most likely explanation is differences in the genetic background, with UK barley breeding stock being inherently more resistant to Fusarium head blight than barley in other countries. UK oats in general had a high content of HT2 and T2. This is the first reported study on mycotoxin content of oats at harvest in the UK. Until legislative limits for HT2+T2 are set, the extent to which these limits will impact on the UK oat industry can not be determined. The results agree with the recently reported content of oats used for feed (Baxter and Salmon 2006). The presence of HT2 and T2, although at a lower concentration than identified in this project, were first reported in oats in Norway (Langseth and Elen 1996). Results of high HT2 and T2 concentrations have recently been reported in other European countries, particular in Nordic countries (Pettersson 2007). Of concern is that data from the 1990s to 2006 would indicate that HT2 and T2 concentration in oats appears to be increasing in Sweden in recent years. UK results differ from those in Sweden and Norway, where high DON can also occur (Langseth and Elen 1996; Langseth and Elen 1997; Langseth and Rundberget 1999). In Canada, high concentrations of DON have been detected in oats, but analysis of HT2 and T2 are not reported (Tekauz et al. 2004). Of concern is that relatively nothing is known about the Fusarium species that produce HT2 and T2 or the factors involved in the presence of HT2 and T2 on cereals and cereal products.

45
Further research on this topic is documented within current European legislation as necessary and of a high priority (Anon. 2006a). The initial de-hulling experiment with four oat samples of 500 g ranging in HT2+T2 content of ca. 500-3000 ppb had a reduction of mycotoxin content during de-hulling of 91-98%. The second de-hulling experiment of 88 oat samples of 100 g ranging in HT2+T2 content of ca. 200-10000 ppb had a reduction of 58-98% during de-hulling. In the second experiment only HT2 was analysed as many samples had undetectable T2 in the groats. There was no significant difference between varieties and no significant effect of groat content or the original HT2 content of oat samples. The percentage reduction was less variable for samples with a higher HT2 content. This may have been as a result of the small size of the de-hulled sample (100 g) not been truly representative of the larger raw oat sample. Samples with higher HT2 are probably more homogenous as more grains would be expected to contain HT2, and therefore the 100 g sample would be more representative compared to samples with a lower HT2 content. The de-hulling reduction was significantly higher for 2004 compared to other years; 2004 was the wet harvest year with conditions quite distinct to other years. It is not clear why 2004 may have had a higher reduction than other years. Analysis of the impact of industrial scale processing of oats on the reduction of HT2 and T2 identified that the range of reduction was consistently greater than 90% in all samples (Scudamore et al. 2007). These experiments were performed on 50 ton batches with 18 sub-samples of 500 g removed at various sampling points for analysis. The consistently high reduction observed at this scale would again suggest that the more variable reduction observed in the second experiment may have been a result of the 100 g de-hulled sample not being truly representative of the 3 kg raw oat sample. The high level of reduction seen during de-hulling is consistent with low level of HT2+T2 content of retail oat products, as all oats for human consumption are de-hulled during processing. In 2003 the FSA conducted a retail survey of oat products. The majority of samples had unquantifiable amounts of HT2 and T2 (<10 ppb) and the maximum was 129 ppb HT2+T2. The overall conclusion from the survey was that estimates of exposure based on the results indicated that exposure to these toxins from this food group in the UK diet is very low. The reduction experienced during de-hulling is also consistent with the low level of HT2 and T2 observed on naked oats at harvest, as these oat varieties lose their hull during harvest. Comparison of naked oats to conventional oats would suggest that mycotoxin levels would be higher on naked oats at harvest compared to the groats of conventional oats after de-hulling. Oat hulls are a by-product of the oat processing industry and are sold for animal feed. As the hulls constitute about 30% of oats by weight, they are an important component of oat processing. Due to the high fibre content, the pelleted by-product is used at a low percentage within ruminant diets. There is limited data as to the toxicity of HT2 and T2 to ruminants. As the hulls can contain very high levels of HT2 and T2 it is important to determine if these mycotoxins cause ill effects to livestock at the concentrations present in animal diets. This project has identified high concentrations of the mycotoxins, HT2 and T2 in UK oats. Similar high levels have been identified in other European countries,

46
particularly in Northern Europe. The majority of these mycotoxins are present on the hull, which is removed during processing of oats for human consumption. The European Commission will soon decide if there is a need to set maximum limits for HT2+T2, and if so, what these limits will be for cereals and cereal products intended for human consumption. Depending on the limits set for unprocessed oats, this legislation could have a major impact on the oat industry in the UK and elsewhere within Europe. If the intended limit for finished oat products is determined to be 100 ppb HT2+T2 and the minimum reduction achievable by processing was identified as 90%, then a limit of 1000 ppb for HT2+T2 in unprocessed oats maybe set. More than 20% of conventional samples exceeded 1000 ppb HT2+T2 over all four years with 30% of conventional samples exceeding this limit in 2005. There is a need to identify the Fusarium species responsible for production of HT2 and T2 in oats and to understand the relationship between the fungus and host plant. This will allow strategies to be developed to minimise the HT2 and T2 content of oats.

47
Acknowledgements I would like to acknowledge all growers who supplied samples either directly or via their agronomists. I would like to thank all the agronomists from Association of Independent Crop Consultants, Agrovista and the Department of Agriculture and Rural Development who co-ordinated collection of samples. Without the samples and associated agronomic information provided this project could not have existed. Technical support at Harper Adams was provided by Luda Ibrahim, Katerina Pirgozlieva and Rumiana Ray of the Molecular Diagnostics Laboratory and the field trial officers of the Crop and Environment Research Centre. Mycotoxin analysis was conducted by Sue Patel at RHM Technology. Statistical advice was provided by Sandro Leidi at Statistical Services Centre, University of Reading. Oat agronomy samples were supplied from experiments funded by the Home-Grown Cereals Authority and Quaker Oats. The Food Standards Agency funded the additional de-hulling experiments. The overall project was funded by the Food Standards Agency and the Home-Grown Cereals Authority.

48
References Adler, A., Lew, H., Moudry, J., Sterba, Z., Vratilova, K., Edinger, W., Brodacz, W. and
Kiendler, E. (2003). Microbiological and mycotoxicological quality parameters of naked and covered oats with regard to the production of bran and flakes. Bodenkultur 54: 41-48.
Anon. (1999). Opinion of the Scientific Committee on Food on Fusarium toxins. Part 1: Deoxynivalenol, European Commission, Brussels (http://ec.europa.eu/food/fs/sc/scf/out44_en.pdf).
Anon. (2000). Opinion of the Scientific Committee on Food on Fusarium toxins. Part 2: Zearalenone, European Commission, Brussels (http://ec.europa.eu/food/fs/sc/scf/out65_en.pdf).
Anon. (2004a). Opinion of the scientific panel on the contaminants in the food chain on a request from the Commission related to deoxynivalenol (DON) as undesirable substance in animal feed. The EFSA Journal 73: 1-41.
Anon. (2004b). Opinion of the scientific panel on the contaminants in the food chain on a request from the Commission related to zearalenone as undesirable substance in animal feed. The EFSA Journal 89: 1-35.
Anon (2005a). Commission Regulation (EC) No 856/2005 of 6 June 2005 amending Regulation (EC) No 466/2001 as regards Fusarium toxins. Official Journal of the European Union L143: 3-8.
Anon (2005b) NIAB Seed Production: Seed Certification Statistics for England and Wales: No. 4
Anon. (2006a). Commission Regulation (EC) No 1881/2006 setting maximum levels of certain contaminants in foodstuffs. Official Journal of the European Union L364: 5-24.
Anon. (2006b). Commission recommendation on the presence of deoxynivalenol, zearalenone, ochratoxin A, T-2 and HT-2 and fumonisins in products intended for animal feeding. Official Journal of the European Union L229: 7-9.
Anon. (2007). Defra - Economics and statistics, http://statistics.defra.gov.uk/esg/default.asp.
Baxter, D. (2006). Review of food safety issues relating to the supply and market acceptability of UK malting barley and UK malt. London, Home-Grown Cereals Authority: Project Report No. 380.
Baxter, D. and Salmon, S. (2006). Monitoring the quality and safety of grain and grain-derived co-products destined for animal feed. London, Home-Grown Cereals Authority: Project Report No. 387.
Buerstmayr, H., Legzdina, L., Steiner, B. and Lemmens, M. (2004). Variation for resistance to Fusarium head blight in spring barley. Euphytica 137: 279-290.
Campbell, H., Choo, T. M., Vigier, B. and Underhill, L. (2002). Comparison of mycotoxin profiles among cereal samples from eastern Canada. Canadian Journal of Botany-Revue Canadienne De Botanique 80: 526-532.
Champeil, A., Fourbet, J. F., Dore, T. and Rossignol, L. (2004). Influence of cropping system on Fusarium head blight and mycotoxin levels in winter wheat. Crop Protection 23: 531-537.
Desjardins, A. E. (2006). Fusarium Mycotoxins: Chemistry, Genetics and Biology. St. Paul, Minnesota, American Phytopathological Society.
Edwards, S. G., Pirgozliev, S. R., Hare, M. C. and Jenkinson, P. (2001). Quantification of trichothecene-producing Fusarium species in harvested grain by competitive PCR to determine efficacies of fungicides against fusarium head blight of winter wheat. Applied and Environmental Microbiology 67: 1575-1580.

49
Galtier, P (2007) Les 1ers enseignements des enquêtes parcellaires pluri annulles en orges. 4éme Colloque Qualités des Céréales, Versailles. (Conference presentation).
Fernando, W. G. D., Miller, J. D., Seaman, W. L., Seifert, K. and Paulitz, T. C. (2000). Daily and seasonal dynamics of airborne spores of Fusarium graminearum and other Fusarium species sampled over wheat plots. Canadian Journal of Botany-Revue Canadienne De Botanique 78: 497-505.
Horberg, H. M. (2002). Patterns of splash dispersed conidia of Fusarium poae and Fusarium culmorum. European Journal of Plant Pathology 108: 73-80.
Inch, S., Fernando, W. G. D. and Gilbert, J. (2005). Seasonal and daily variation in the airborne concentration of Gibberella zeae (Schw.) Petch spores in Manitoba. Canadian Journal of Plant Pathology-Revue Canadienne De Phytopathologie 27: 357-363.
Jenkinson, P. and Parry, D. W. (1994). Splash Dispersal of Conidia of Fusarium culmorum and Fusarium avenaceum. Mycological Research 98: 506-510.
Jestoi, M., Rokka, M., Yli-Mattila, T., Parikka, P., Rizzo, A. and Peltonen, K. (2004). Presence and concentrations of the Fusarium-related mycotoxins beauvericin, enniatins and moniliformin in Finnish grain samples. Food Additives and Contaminants 21: 794-802.
Jones, R. K. and Mirocha, C. J. (1999). Quality parameters in small grains from Minnesota affected by Fusarium head blight. Plant Disease 83: 506-511.
Lacey, J., Bateman, G. L. and Mirocha, C. J. (1999). Effects of infection time and moisture on development of ear blight and deoxynivalenol production by Fusarium spp. in wheat. Annals of Applied Biology 134: 277-283.
Langevin, F., Eudes, F. and Comeau, A. (2004). Effect of trichothecenes produced by Fusarium graminearum during Fusarium head blight development in six cereal species. European Journal of Plant Pathology 110: 735-746.
Langseth, W. and Elen, O. (1996). Differences between barley, oats and wheat in the occurrence of deoxynivalenol and other trichothecenes in Norwegian grain. Journal of Phytopathology-Phytopathologische Zeitschrift 144: 113-118.
Langseth, W. and Elen, O. (1997). The occurrence of deoxynivalenol in Norwegian cereals - Differences between years and districts, 1988-1996. Acta Agriculturae Scandinavica Section B-Soil and Plant Science 47: 176-184.
Langseth, W. and Rundberget, T. (1999). The occurrence of HT-2 toxin and other trichothecenes in Norwegian cereals. Mycopathologia 147: 157-165.
MacDonald, S., Prickett, T. J., Wildey, K. B. and Chan, D. (2004). Survey of ochratoxin A and deoxynivalenol in stored grains from the 1999 harvest in the UK. Food Additives and Contaminants 21: 172-181.
Matthaus, K., Danicke, S., Vahjen, W., Simon, O., Wang, J., Valenta, H., Meyer, K., Strumpf, A., Ziesenib, H. and Flachowsky, G. (2004). Progression of mycotoxin and nutrient concentrations in wheat after inoculation with Fusarium culmorum. Archives of Animal Nutrition 58: 19-35.
Mihuta-Grimm, L. and Forster, R. L. (1989). Scab of wheat and barley in Southern Idaho and evaluation of seed treatments for eradication of Fusarium spp. Plant Disease 73: 769-771.
Montgomery, D. C. and Peck, E. A. (1992). Introduction to linear regression analysis., Wiley Interscience.
Nicholson, P., Turner, J. A., Jenkinson, P., Jennings, P., Stonehouse, J., Nuttall, M., Dring, D., Weston, G. and Thomsett, M. (2003). Maximising control with fungicides of fusarium ear blight (FEB) in order to reduce toxin contamination of wheat. HGCA Project Report: No. 297.

50
Obst, A., Gleissenthall, J. L. and Beck, R. (1997). On the etiology of Fusarium head blight of wheat in south Germany - Preceding crops, weather conditions for inoculum production and head infection, proneness of the crop to infection and mycotoxin production. Cereal Research Communications 25: 699-703.
Parry, D. W., Jenkinson, P. and McLeod, L. (1995). Fusarium Ear Blight (Scab) in Small-Grain Cereals - a Review. Plant Pathology 44: 207-238.
Paul, P. A., El-Allaf, S. M., Lipps, P. E. and Madden, L. V. (2004). Rain splash dispersal of Gibberella zeae within wheat canopies in Ohio. Phytopathology 94: 1342-1349.
Pettersson, H. (2007). Occurrence of T2 and HT2 toxins in oats. Nordforsk "New emerging mycotoxins and secondary metabolites in toxigenic fungi in Northern Europe" Network Meeting, Ås, (Conference Presentation). http://fou02.planteforsk.no/NordforskNetworkMycotox/Network2007.htm.
Prickett, A. J., MacDonald, S. and Wildey, K. B. (2000). Survey of mycotoxins in stored grain from the 1999 harvest in the UK. HGCA Project report: No. 230.
Scudamore, K., Baillie, H., Patel, S. and Edwards, S. G. (2007). The occurrence and fate of Fusarium mycotoxins during the industrial processing of oats in the UK. Food Additives and Contaminants In Press.
Strausbaugh, C. A. and Maloy, O. C. (1986). Fusarium Scab of Irrigated Wheat in Central Washington. Plant Disease 70: 1104-1106.
Tekauz, A., McCallum, B., Ames, N. and Fetch, J. M. (2004). Fusarium head blight of oat - current status in western Canada. Canadian Journal of Plant Pathology-Revue Canadienne De Phytopathologie 26: 473-479.
Tekauz, A., McCallum, B. and Gilbert, J. (2000). Review: Fusarium head blight of barley in western Canada. Canadian Journal of Plant Pathology-Revue Canadienne De Phytopathologie 22: 9-16.
Tomczak, M., Wisniewska, H., Stepien, L., Kostecki, M., Chelkowski, J. and Golinski, P. (2002). Deoxynivalenol, nivalenol and moniliformin in wheat samples with head blight (scab) symptoms in Poland (1998-2000). European Journal of Plant Pathology 108: 625-630.
Turner, J. E., Jennings, P. and Nicholson, P. (1999). Investigation of fusarium infection and mycotoxin levels in harvested grain (1998). HGCA Project Report: No. 207.
Uhlig, S., Torp, M., Jarp, J., Parich, A., Gutleb, A. C. and Krska, R. (2004). Moniliformin in Norwegian grain. Food Additives and Contaminants 21: 598-606.
Xu, X. M., Parry, D. W., Edwards, S. G., Cooke, B. M., Doohan, F. M., van Maanen, A., Brennan, J. M., Monaghan, S., Moretti, A., Tocco, G., Mule, G., Hornok, L., Giczey, G., Tatnell, J., Nicholson, P. and Ritieni, A. (2004). Relationship between the incidences of ear and spikelet infection of Fusarium ear blight in wheat. European Journal of Plant Pathology 110: 959-971.
Yoshida, M., Kawada, N. and Tohnooka, T. (2005). Effect of row type, flowering type and several other spike characters on resistance to Fusarium head blight in barley. Euphytica 141: 217-227.

51
Appendix 1 - Description of oat agronomic factors All agronomic factors are detailed below. Year 2002 to 2005 Region South, East, Midlands, North, Scotland, Northern Ireland
HGCA defined regions except combined two Northern and two Southern Regions into two (North and South) as two regions have low sample number (North West and South East).
Practice Organic or conventional. Previous crop Wheat, barley, oats, grass, and other. Previous crops with less
than 10 samples within the dataset were categorised as “other” Plough Method of cultivation; ploughed or not ploughed. Type Winter, spring or naked winter variety. Var Variety. Varieties with less than 10 samples within the dataset
were categorised as “other” T3 T3 fungicide regime (T3 applied at flowering, growth stage 59-
69) categories include azole, strobilurin, azole plus strobilurin mixture, no T3, organic. As includes all organic and conventional samples this is a sub-set of practice above.
Use Intended end use – Seed, feed or human consumption. Maize in rotation Yes/No. Maize adjacent Yes/No. Source Who supplied sample – agrochemical distributor, independent
agronomist, farmer.

52
Appendix 2 – Number of oat samples for each level within each agronomy factor from dataset with blanks removed. Table A2.1 Number of observations for year x region
Year Region 2002 2003 2004 2005 South 14 17 21 23 East 12 4 16 14 Midlands 25 15 24 30 North 13 18 32 25 Scotland 10 22 17 19 Northern Ireland 12 11 6 7
Table A2.2 Number of observations for cultivation x previous crop
Cultivation Previous crop ploughed not ploughed Wheat 177 25 Barley 96 8 Oats 34 6 Grass Other
21 34
0 6
Table A2.3 Number of observations for each variety
Variety Number Gerald 174 Firth 87 Grafton 16 Jalna 54 Millennium 16 Other 60
Table A2.4 Number of observations for each practice
Practice Number Conventional 310 Organic 97

53
To demonstrate the extent of multicolinearity the distribution of varieties and previous crops within organic and conventional oat samples is detailed in Table A2.5 and A2.6. Table A2.5 Percentage of each variety within organic and conventional samples
Table A2.6 Percentage of each previous crop within organic and conventional samples
Practice Variety Gerald Firth Grafton Jalna Millennium Other Conventional 53 11 5 17 4 10 Organic 10 55 0 1 5 29
Practice Previous crop Wheat Barley Oats Grass Other
Conventional 58 27 8 2 5 Organic 24 22 15 14 25

54
Appendix 3 – Statistical analysis for HT2+T2 in oats HT2+T2 concentration was not normally distributed. Log10 transformation resulted in a distribution which approached normality. Loga = log10(HT2+T2) A3.1 Stepwise model selection All years data sets were combined and significant agronomic factors were selected for the model using a stepwise model selection ANOVA on Genstat 8. Temporal (year) and spatial (region) factors were forced into the model. All other agronomic factors were ordered based on the order in which they occur within a growing season. After selection of factors to be used in the model the data file was filtered of all samples containing blanks within these factors and the data was re-analysed. Tables of accumulated ANOVA of log10(HT2+T2) using selected factors are shown below (Table A3.1 and A3.2). There was some multicolinearity within the dataset as conventional and organic growers favoured different previous crops and varieties (see Table A2.5 and A2.6). Consequently it is difficult to identify a cause and effect relationship, and to measure the importance for the agronomic factors practice, previous crop and variety. What can be identified by moving practice to the end of the model is that “organic” practice is still a highly significant factor when previous crop and variety have already been taken into consideration within the model, indicating that other differences between the two practices not identified in the statistical model also have a significant influence on HT2+T2 concentrations. Null Hypothesis: There is no difference in HT2+T2 concentration between organic and conventional UK oat samples. Place practice to the front of the model (Table 3.1). Practice p value <0.001 Reject Null hypothesis – There was a significant difference in HT2+T2 concentration between organic and conventional UK oat samples. Null Hypothesis: There is no difference in HT2+T2 concentration between organic and conventional UK oat samples other than the effect of previous crop and variety. Place practice to the end of the model (Table 3.2). Practice p value <0.001 Reject Null hypothesis – There was a significant difference in HT2+T2 concentration between organic and conventional UK oat samples other than the effect of previous crop and variety.

55
Table A3.1 Accumulated analysis of variance table for Log10(HT2+T2) concentration (with organic at front of model)
Change d.f. s.s. m.s. v.r. F pr. year 3 11.5823 3.8608 11.4 <.001
region 5 8.3132 1.6626 4.91 <.001 year.region 15 19.7999 1.32 3.9 <.001
practice 1 35.1836 35.1836 103.86 <.001 previous crop 4 12.1961 3.049 9 <.001
plough 1 0.0083 0.0083 0.02 0.876 previous crop.plough 3 3.6126 1.2042 3.55 0.015
variety 5 15.3786 3.0757 9.08 <.001 Residual 369 124.9989 0.3388
Total 406 231.0736 0.5691
Table A3.2 Accumulated analysis of variance table for Log10(HT2+T2) concentration (with organic at end of model)
Change d.f. s.s. m.s. v.r. F pr. + year 3 11.5823 3.8608 11.4 <.001 + hgcaregion2 5 8.3132 1.6626 4.91 <.001 + year.hgcaregion2 15 19.7999 1.32 3.9 <.001 + pcrops 4 27.5087 6.8772 20.3 <.001 + plough 1 0.6899 0.6899 2.04 0.154 + pcrops.plough 3 5.4488 1.8163 5.36 0.001 + var 5 24.4815 4.8963 14.45 <.001 + practice 1 8.2503 8.2503 24.36 <.001 Residual 369 124.9989 0.3388 Total 406 231.0736 0.5691
The models accounted for 46% of the observed variance. Seventeen percent of the observed variance was attributable to the temporal and spatial factors (year, region and year*region).

56
A3.2 Assessment of goodness of fit for loga by residual plots Normal plot of a good model should have residual values in a straight line 45° diagonally through the axis. Fitted values plot of a good model should show a random scatter. These plots show that the model is not a bad fit (Fig A3.2.1).
Figure A3.2.1 Residual plots of loga (log10 transformed HT2+T2 concentration).

57
A3.3 Tables of predicted means and standard error of the predicted mean for HT2+T2 concentration on the log10 scale (loga) Graphs presented in the main text of report are the back-transformed predicted values below (10loga) and the bars are the 95% confidence limits (10[loga±2*s.e.]). Table A3.3.1 Predicted mean and standard error for oat samples from each region/year combination
Region 2002 2003 2004 Prediction s.e. Prediction s.e. Prediction s.e.
South 1.623 0.156 2.172 0.143 2.233 0.128 East 1.784 0.168 2.408 0.291 2.488 0.151 Midlands 1.74 0.119 2.072 0.151 2.134 0.121 North 1.851 0.162 2.146 0.139 1.807 0.105 Scotland 2.31 0.185 1.971 0.129 2.147 0.142 N Ireland 2.063 0.17 2.548 0.176 1.943 0.238
Region 2005 Prediction s.e.
South 2.49 0.124 East 2.567 0.157 Midlands 2.529 0.11 North 2.417 0.118 Scotland 1.639 0.136 N Ireland 2.613 0.221

58
Table A3.3.2 Predicted mean and standard error for each previous crop/cultivation combination Previous Ploughed Not ploughed crop Prediction s.e. Prediction s.e. Wheat 2.3132 0.0478 2.4181 0.1174 Barley 2.139 0.0611 2.4302 0.2071 Oats 2.4978 0.1039 1.9687 0.2381 Grass 1.4553 0.1275 Other 1.53 0.1012 2.4969 0.2376
Table A3.3.3 Predicted mean and standard error for each variety of oats. Variety Prediction s.e. Gerald 2.4722 0.0484 Firth 1.9669 0.0649 Grafton 2.0339 0.1491 Jalna 2.1991 0.0813 Millennium 1.9547 0.146 Other 1.8189 0.0762
Table A3.3.4 Predicted mean and standard error for organic and conventional oats Practice Prediction s.e. Conventional 2.3424 0.0363 Organic 1.6114 0.0607

59
A3.4 HT2+T2 parameter estimates Parameter estimates for each factor are differences compared with a reference level. Table 3.4.1 shows reference levels set for each agronomic factor. Table 3.4.1 Reference levels for HT2+T2 concentration model
Factor Reference Level Reason year 2001 first year of study region East region with most wheat grown practice conventional most common practice previous crop wheat most common previous crop cultivation ploughed most common cultivation variety Gerald most common variety Table 3.4.2 Parameter estimates for HT2+T2 with standard error, t value and t probability
estimate s.e. t(1396) t pr. Constant 2.178 0.177 12.32 <.001
Year 2003 0.811 0.342 2.37 0.018 2004 0.752 0.226 3.33 <.001 2005 0.863 0.232 3.72 <.001
Region South 0.233 0.235 0.99 0.323 Midlands 0.198 0.213 0.93 0.353 North 0.304 0.24 1.27 0.205 Scotland 0.751 0.269 2.79 0.006 N Ireland 0.483 0.245 1.97 0.049
Year*Region 2003 South -0.216 0.398 -0.54 0.587 2003 Midlands -0.576 0.394 -1.46 0.145 2003 North -0.698 0.402 -1.73 0.084 2003 Scotland -0.975 0.412 -2.37 0.018 2003 N Ireland -0.412 0.422 -0.98 0.33 2004 South -0.52 0.305 -1.71 0.089 2004 Midlands -0.633 0.281 -2.25 0.025 2004 North -0.958 0.299 -3.21 0.001 2004 Scotland -1.119 0.327 -3.42 <.001 2004 N Ireland -1.212 0.377 -3.21 0.001 2005 South -0.167 0.305 -0.55 0.585 2005 Midlands -0.364 0.282 -1.29 0.198 2005 North -0.4 0.306 -1.31 0.192 2005 Scotland -1.536 0.324 -4.74 <.001 2005 N Ireland -0.734 0.366 -2.01 0.046

60
Table 3.4.2 cont. Parameter estimates for HT2+T2 with standard error, t value and t probability
estimate s.e. t(1396) t pr. Practice Organic -0.4593 0.0931 -4.94 <.001
Previous crop Barley -0.1201 0.0799 -1.5 0.134 Oats 0.171 0.123 1.4 0.164 Grass -0.645 0.148 -4.35 <.001 Other -0.533 0.125 -4.27 <.001
Cultivation Not ploughed -0.058 0.129 -0.45 0.651 Barley NP 0.323 0.255 1.27 0.206 Oats NP -0.378 0.304 -1.24 0.215 Grass NP 0 * * * Other NP 0.632 0.299 2.11 0.035
Variety Firth -0.264 0.107 -2.45 0.015 Grafton -0.445 0.166 -2.68 0.008 Jalna -0.365 0.099 -3.69 <.001 Millennium -0.805 0.167 -4.81 <.001 Other -0.4277 0.0988 -4.33 <.001
NP = Not ploughed Constant estimate is estimated log10 transformed HT2+T2 concentration (loga) for conventional samples of Gerald from 2002, from the East, after wheat, after ploughing. Other estimates are the ratio of that factor level and the constant. T probability indicates significance of difference between HT2+T2 concentration of the factor level and the reference level.

61
Back transformed parameter estimates and 95% confidence intervals are shown in Table 3.4.3. Table 3.4.3 Back-transformed (10X) parameter estimates for HT2+T2 with 95% confidence intervals
ratio low upp Constant 150.738 67.699 335.63
Year 2003 6.469 1.378 30.38 2004 5.655 2.03 15.75 2005 7.295 2.554 20.84
Region South 1.71 0.589 4.96 Midlands 1.578 0.601 4.14 North 2.014 0.681 5.96 Scotland 5.642 1.668 19.09 N Ireland 3.041 1.005 9.2
Year*Region 2003 South 0.608 0.1 3.69 2003 Midlands 0.266 0.045 1.58 2003 North 0.201 0.032 1.24 2003 Scotland 0.106 0.016 0.68 2003 N Ireland 0.387 0.057 2.62 2004 South 0.302 0.076 1.20 2004 Midlands 0.233 0.065 0.83 2004 North 0.110 0.029 0.43 2004 Scotland 0.076 0.017 0.33 2004 N Ireland 0.061 0.011 0.34 2005 South 0.681 0.171 2.71 2005 Midlands 0.433 0.120 1.55 2005 North 0.398 0.100 1.59 2005 Scotland 0.029 0.007 0.13 2005 N Ireland 0.184 0.035 0.97

62
Table 3.4.3 cont. Back transformed (10X) parameter estimates for HT2+T2 with 95% confidence intervals
Ratio Lower Upper Practice
Previous crop Organic
Barley 0.347 0.758
0.228 0.528
0.53 1.09
Oats 1.484 0.851 2.59 Grass 0.226 0.116 0.44 Other 0.293 0.166 0.52
Cultivation Not ploughed 0.874 0.488 1.57 Barley NP 2.103 0.663 6.67 Oats NP 0.419 0.106 1.66 Grass NP 1.000 * * Other NP 4.286 1.106 16.61
Variety Firth 0.545 0.335 0.89 Grafton 0.359 0.169 0.76 Jalna 0.432 0.276 0.68 Millennium 0.157 0.073 0.33 Other 0.374 0.239 0.58
NP = Not ploughed Constant estimate is estimated HT2+T2 concentration for conventional Gerald samples in 2002, from the East, after wheat, after ploughing. Other estimates are the ratio of that factor level and the constant. The lower and upper values are the 95% confidence limits for the estimated ratio.

63
A3.5 Stability of each agronomic factor’s effect on HT2+T2 concentration over time When data are collected across time, the stability of the coefficients over a shorter time span can be examined i.e. fit the same model for each year separately and compare the magnitude of estimates over time. Consistent estimates give support that the chosen model is applicable to broader circumstance than those related to the original data i.e. the model is stable over time. The coefficients shown in Fig A3.5.1 are arranged alphabetically. In general they appear quite stable over time. Coefficients that show appreciable changes over time include various previous crop/cultivation interactions. The common feature of these predictors is that they have low sample numbers.
Figure A3.5.1 Scatterplot of parameter estimate for each year
year
est
imat
e
2
0
-2
4321 4321
2
0
-2
2
0
-2
4321 4321
2
0
-2
4321
2
0
-2
Constant hgcaregion2 Midlands hgcaregion2 N. Ir eland hgcaregion2 North hgcaregion2 Scotland
hgcaregion2 Sout h pcrops Barley pcrops Barley .plough N ot ploughed pcrops Gras s pcrops Grass .plough N ot ploughed
pcrops Oats pcrops Oats .plough Not ploughed pcrops Other pcrops Other .plough N ot ploughed plough Not ploughed
practice Organic var Firth var Grafton var Jalna var Millenium
var Other
Panel variable: coefficient
parameter estimate vs year for oats

64
A3.6 Cross-validation by splitting the dataset The dataset was split into a training set and a validation set. The regression coefficients are derived from the training set and used to form predictions for the observed responses in the validation set. Then the discrepancy between observed and predicted responses in the validation set was used to compute R2
prediction as a summary measure that indicates roughly how much of the variability in new observations the selected model might be expected to explain. Due to the observational nature of the study and the number of factors and levels in each factor it was difficult to split the dataset into a balanced validation and training set. Therefore the PRESS statistic was used to calculate R2
prediction (Montgomery & Peck, 1992). PRESS stands for Prediction Error Sum of Squares and is the analogous of the Residual Sum of Squares from a model fitted omitting one observation at a time. Thus PRESS uses each possible subset of (n-1) observations as the training set, and every omitted observation in turn is predicted. So: R2
prediction = 1 - PRESS = 0.355 = 33%
Syy
where Syy is the Total (corrected) Sum of Squares for the entire dataset. R2
prediction is markedly lower than R2 of 46% from the full dataset, indicating the model may not be a good predictor of new observations.

65
Appendix 4 - Description of barley agronomic factors All agronomic factors are detailed below. Year 2002 to 2005 Region South, East, Midlands, North, Scotland, Northern Ireland
HGCA defined regions except combined two Northern and two Southern Regions into two (North and South) as two regions have low sample number (North West and South East).
Practice Organic or conventional. Previous crop Wheat, barley, oats, potatoes, sugar beet, brassicas, legumes,
grass and other. Plough Method of cultivation; ploughed or not ploughed. Type Winter malting, winter two row feed, winter six row feed, spring
malting or spring feed. Var Variety. Varieties with less than 10 samples within the dataset
were categorised as “other” T3 T3 fungicide regime (T3 applied at flowering, growth stage 59-
69) categories include azole, strobilurin, azole plus strobilurin mixture, no T3, organic. As includes all organic and conventional samples this is a sub-set of practice above.
Use Intended end use – Seed, feed or human consumption. Maize in rotation Yes/No. Maize adjacent Yes/No. Source Who supplied sample – agrochemical distributor, independent
agronomist, farmer.

66
Appendix 5 - Number of barley samples for each level within each agronomy factor from dataset with blanks removed and from dataset of positive HT2+T2 samples Table A5.1 Number of observations for year x region
Year Region 2002 2003 2004 2005
South 24 14 16 11 East 14 16 13 15 Midlands 19 16 24 21 North 16 24 18 13 Scotland 16 18 12 13 Northern Ireland 12 19 13 18
Table A5.2 Number of observations for each type
Type Number Winter Malt 58 Winter Two Row Feed 121 Winter Six Row Feed 26 Spring Malt 126 Spring Feed 64
Table A5.3 Number of observations with quantifiable HT2+T2 by year and region
Year Region 2001 2002 2003 2004 2005
South 7 11 6 8 7 East 3 10 5 5 3 Midlands 5 8 9 10 5 North 0 8 4 8 0 N. Ireland 1 5 4 5 1 Scotland 0 7 1 7 0

67
Appendix 6 - Statistical analysis for HT2+T2 in barley Due to the low number of quantifiable samples (above LoQ) for HT2+T2 then the incidence of HT2+T2 was modelled using the Bernoulli distribution and then the concentration (log10 transformed) of the quantifiable samples was modelled using a normal distribution. A6.1 Stepwise model selection for HT2+T2 incidence As for HT2+T2 analysis of oats, significant agronomic factors were selected for the model using a stepwise model selection method on Genstat 6. Temporal (year) or spatial (region) factors were forced into the model. All other agronomic factors were ordered based on the order in which they occur within a growing season. To analyse incidence, samples above LoQ were set a value of one, samples below the LoQ for HT2+T2 were given a value of zero. Table of accumulated analysis of deviance of HT2+T2 incidence using selected factors is shown below. Table A6.1 Accumulated analysis of deviance table for HT2+T2 incidence
mean deviance approx Change d.f. deviance deviance ratio chi pr + year 3 30.561 10.187 10.19 <.001 + region 5 21.952 4.390 4.39 <.001 + year.region 15 18.360 1.224 1.22 0.244 + type 4 40.432 10.108 10.11 <.001 Residual 367 398.613 1.086 Total 394 509.918 1.294
The model accounted for 22% of the observed variance A6.2 Assessment of goodness of fit by ROC curve analysis Receiver Operating Characteristic curve (or ROC curve) is a plot of the true positives [sensitivity] against the false positives [1 - specificity]. The closer the curve follows the left-hand and top border of the ROC space (area under curve approaches 1), the more accurate the classification based on the model used. The null hypothesis is that the model is not a good fit (ie area under curve = 0.5)

68
Table 6.2.1 ROC curve case processing summary
HT2+T2
Valid N (listwise)
Positivea 137 Negative 258
Larger values of the test result variable(s) indicate stronger evidence for a positive actual state. aThe positive actual state is 1. Of 395 samples, 258 (65%) were below the LoQ.
Fig 6.2.1 ROC curve for HT2+T2 incidence Table 6.2.2 Area under the ROC Curve
Area Std. Error
Asymptotic Sig.a
Asymptotic 95% Confidence Interval
Lower Bound
Upper Bound
.803 .023 .000 .759 .848 aNull hypothesis: true area = 0.5 Area under curve = 0.803; therefore the model is not a bad fit.
1.00.80.60.40.20.0
1 - Specificity
1.0
0.8
0.6
0.4
0.2
0.0
Sens
itivi
ty
ROC Curve
Diagonal segments are produced by ties.

69
A6.3 Tables of predicted proportions and standard error of the predicted proportions for HT2+T2 incidence (>LoQ). Table 6.3.1 Predicted proportion of samples with HT2+T2 greater than the LoQ and standard error for each region/year combination
2002 2003 2004 2005 Region Prediction s.e. Prediction s.e. Prediction s.e. Prediction s.e.
South 0.2649 0.08231 0.7764 0.108 0.2793 0.09929 0.7249 0.12543 East 0.2642 0.11853 0.5538 0.12597 0.4468 0.1353 0.3286 0.10811 Midlands 0.3091 0.1019 0.39 0.11002 0.4631 0.08703 0.5268 0.09304 North 0.0002 0.00187 0.2896 0.08555 0.1795 0.07953 0.6582 0.1172 N.Ireland 0.0764 0.07139 0.2744 0.09932 0.4274 0.13647 0.4029 0.12727 Scotland 0.0002 0.00194 0.2065 0.07341 0.0434 0.04221 0.2392 0.08247 Table 6.3.2 Predicted proportion of samples with HT2+T2 greater than the LoQ and standard error for each barley type
Type Prediction s.e. Winter Malting 0.2242 0.05501 Winter Two Row 0.2609 0.0392 Winter Six Row 0.1773 0.06549 Spring Malting 0.5725 0.04162 Spring Feed 0.3025 0.05621

70
A6.4 Stepwise model selection for positive HT2+T2 dataset As for HT2+T2 in oats, significant agronomic factors were selected for the model using a stepwise model selection ANOVA on Genstat 8 for a dataset containing barley samples above the LoQ for HT2+T2. HT2+T2 concentration was log10 transformed to normalise the data (loga). Table of accumulated ANOVA of log10(HT2+T2) using selected factors is shown below (A6.4.1). There was no significant effect of agronomy except for region and the interaction between year and region. Table A6.4.1 Accumulated analysis of variance table for Log10(HT2+T2) concentration Change d.f. s.s. m.s. v.r. F pr. + year 3 0.05602 0.01867 0.26 0.852 + region 5 1.48492 0.29698 4.17 0.002 + year.region 13 2.33531 0.17964 2.52 0.004 Residual 115 8.18655 0.07119 Total 136 12.06280 0.08870
The model accounted for 32% of the observed variance.

71
A6.5 Assessment of goodness of fit for loga by residual plots Plots show the model is not a bad fit (Fig A6.5.1).
Figure A6.5.1 Residual plots of loga (log10 transformed HT2 + T2 concentration)

72
A6.6 Tables of predicted means and standard error of the predicted mean for HT2+T2 concentration on the log10 scale (loga) Graphs presented in the main text of the report are the back-transformed predicted values from the tables below (10[loga]) and the bars are the 95% confidence limits (10[loga±2*s.e.]) Table 6.6.1 Predicted mean and standard error for each year combination
2002 2003 2004 2005 Region Prediction s.e. Prediction s.e. Prediction s.e. Prediction s.e.
South 1.517 0.1008 1.419 0.0804 1.548 0.1089 1.661 0.0943East 1.415 0.154 1.288 0.0844 1.607 0.1193 1.077 0.1193Midlands 1.338 0.1193 1.757 0.0943 1.287 0.0889 1.433 0.0844North 1.404 0.0943 1.132 0.1334 1.298 0.0943N.Ireland 1.166 0.2668 1.385 0.1193 1.321 0.1334 1.537 0.1193Scotland 1.254 0.1008 1.067 0.2668 1.203 0.1008