investigation of hydrogeochemical characteristics … · investigation of hydrogeochemical...
TRANSCRIPT

Journal of Tethys: Vol. 1, No. 3, 189-198 ISSN: 2345-2471 ©2013
Rezaeian-Langeroudi et al., 2013 189 Available online at http://jtethys.org
Investigation of Hydrogeochemical Characteristics and Groundwater Quality of Hoz–e–
Soltan Lake, Qom, Iran
Saeed Rezaeian Langeroudi1*
, Razyeh Lak2, Saeed Mahdlou Turkamani
3
1– M.Sc. of Sedimentology, Kharazmi University, Tehran, Iran.
2– Research Institute for earth sciences, Geological Survey of Iran.
3– M.Sc. of Hydrology, Kharazmi University, Tehran, Iran.
* Corresponding Author: [email protected]
Abstract
In this research, the groundwater quality of Hoz–e–Soltan Lake and its catchment was studied for
drinking, domestic and irrigation uses according to different parameters. This Lake with 195 km2
catchment area is located 85 km of southwest of Tehran–Qom highway. In order to investigate
groundwater quality characteristics in the study area, 34 data from water of well belong to 2008
selected to processing and interpretation. The data was edited and processed to determine
groundwater quality parameters such as Magnesium Absorption Ratio (MAR), Sodium Solution
Percent (SSP), Residual Sodium Bicarbonate (RSBC), Permeability Index (PI), Kelly Ratio (KR)
and Sodium Absorption Ratio (SAR), Electric Conductivity (EC), Na+, K
+, Mg
2+, Ca
2+, SO4
2–, Cl
–,
HCO3–. Based on Piper diagram and cations and anions abundance order, the groundwater type of
the study area is currently classified as Na+–Cl
––SO4
2–. On the basis of Schoeller diagram, amounts
of Na+, Cl
–, SO4
2–, Total Hardness (TH) and Total Dissolved Solid (TDS) are higher than
permissible limit and therefore, the water is unsuitable for drinking and domestic uses. The average
pH values of the groundwater equal to 8, indicating alkaline nature of groundwater. Total hardness
average of samples equal to 806.8, shows that the Hoz–e–Soltan groundwater was not suitable for
drinking, domestic and irrigation uses. Sodium Content (Na %) average equal to 67.1, groundwater
resources of the study area was belongs to the suspicious class. As a result, high salinity, SAR, TH,
TDS, EC and Na% in most water samples have restricted the water quality for drinking, domestic
and irrigation uses.
Keywords: Groundwater quality, Major ions, WHO standards, Semi–arid climate, Iran.
1–Introduction
Groundwater is the only reliable water resource
for human consumption, as well as for
agriculture and industrial uses in arid to semi–
arid country like Iran. Rapid depletion of
groundwater, continued population growth and
industrialization that result in degradation of
water quality, increase of pumping costs,
emissions and pollution of groundwater
resources, are the most threats for the quality of
many aquifers in Iran. To evaluate the
suitability of groundwater for different
purposes, understanding the chemical
composition of groundwater is necessary.
Furthermore, it is possible to understand the
change in quality due to rock–water interaction
(weathering) or any type of anthropogenic
influence (Todd, 1980; Kelly, 1940). Such
improved knowledge can contribute to effective
management and utilization of this vital
resource. In this view, monitoring the quality of
groundwater (chemical, physical, and biological
constituents) is as important as assessing it’s
quantity. The main goal of the study was to
determine the hydrogeochemistry of the
groundwater and to classify the water in order to
evaluate its suitability for drinking, domestic
and irrigation uses.
2– Study Area
Hoz–e–Soltan Lake is an ephemeral saline Lake
and according to the Sonnenfeld classification
scheme (1991), is regarded as an intra–
189
Journal of Tethys: Vol. 1, No. 3, 189-198 ISSN: 2345-2471 ©2013
Rezaeian-Langeroudi et al., 2013 190 Available online at http://jtethys.org
continental basin. Hoz–e–Soltan Lake has a 195
km2 catchment area, 25–50 cm depth and is
located 85 km of southwest of Tehran, in
Central Part of Iran (Fig. 1). It is situated
between 43°56' and 35°31' north and 50°53' and
51°20' east at western–north of Hoz–e–Masileh
(Fayazi, 1991). The maximum superficial relief
is about 1940 meters above mean sea level to
the north and 1150 meters to the south. On the
basis of Aqanabati's classification (2006), the
study area is located in Central Iran geological.
It is surrounded by Ali–Abad and Kushk–e–
Nosrat Mountains in north and northeast,
Manzarieh and Chahar Mountains in west, and
Mohammad–Abad and Badamcheh Mountains
in south and southeast). Orogenic movements
and volcanic eruptions in late Cretaceous in
early Eocene resulted in Eocene volcanic
formation in north and central part of Iran,
particularly around Hoz–e–Soltan Lake.
Faulting resulting from volcanic activities
caused the formation of a graben which was
later filled with salt Lake. Up–stream outcrops
of Hoz–e–Soltan Lake which include northern,
north–eastern and western Mountains affect
sediment type and Lake hydrogeochemistry.
These up–stream outcrops are mainly composed
of Eocene volcanic rocks (interlayering tuffs,
andesite with sedimentary rocks). Oligo–
Miocene sedimentary rocks (mainly composed
of reefal limestone, glauconitic limestone with
clastic basal conglomerate) distributed on
southeast of the Lake (Motamed and
Pourmotamed, 1979).
3– Sampling and Analytical Procedure
In order to study the quality variation of
groundwater in the study area, 34 groundwater
samples were collected from the pumping wells
at the study area. Samples were collected with
high density polyethylene (HDPE) bottles of
one–liter capacity. In order to determination of
different cations and anions concentration,
methods such as ICP–OES, flame photometer
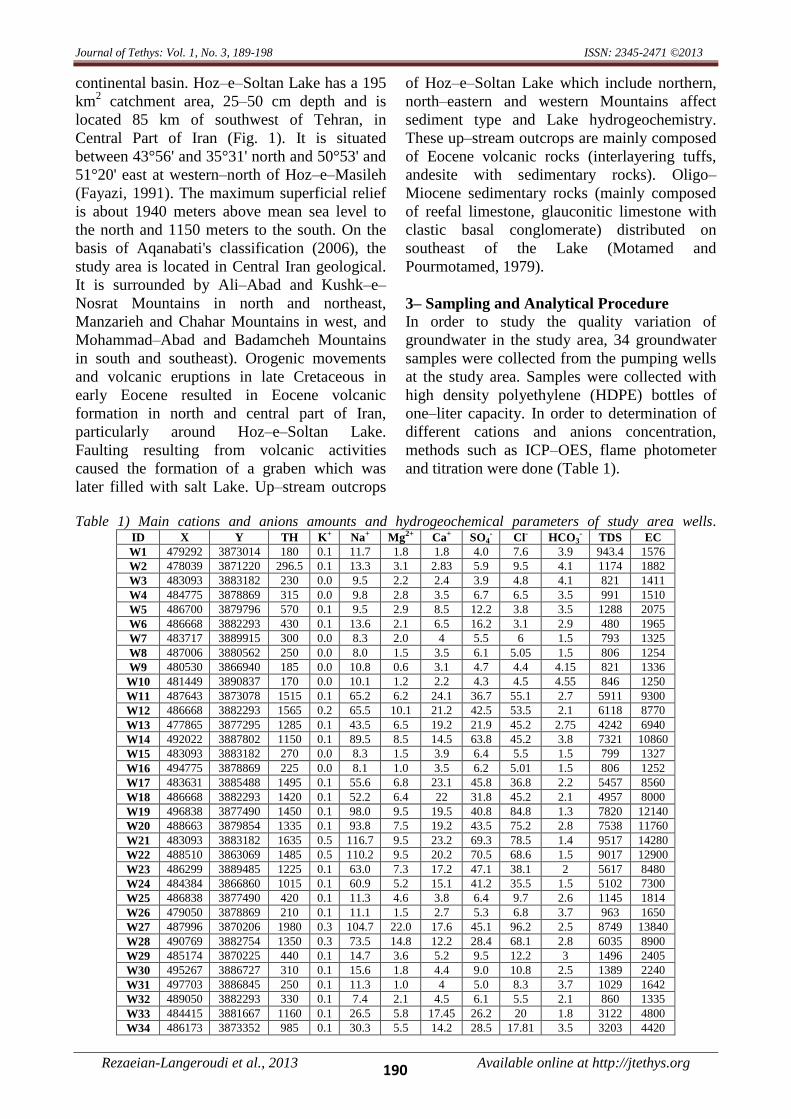
and titration were done (Table 1).
Table 1) Main cations and anions amounts and hydrogeochemical parameters of study area wells.ID X Y TH K+ Na+ Mg2+ Ca+ SO4
- Cl- HCO3- TDS EC
W1 479292 3873014 180 0.1 11.7 1.8 1.8 4.0 7.6 3.9 943.4 1576
W2 478039 3871220 296.5 0.1 13.3 3.1 2.83 5.9 9.5 4.1 1174 1882
W3 483093 3883182 230 0.0 9.5 2.2 2.4 3.9 4.8 4.1 821 1411
W4 484775 3878869 315 0.0 9.8 2.8 3.5 6.7 6.5 3.5 991 1510
W5 486700 3879796 570 0.1 9.5 2.9 8.5 12.2 3.8 3.5 1288 2075
W6 486668 3882293 430 0.1 13.6 2.1 6.5 16.2 3.1 2.9 480 1965
W7 483717 3889915 300 0.0 8.3 2.0 4 5.5 6 1.5 793 1325
W8 487006 3880562 250 0.0 8.0 1.5 3.5 6.1 5.05 1.5 806 1254
W9 480530 3866940 185 0.0 10.8 0.6 3.1 4.7 4.4 4.15 821 1336
W10 481449 3890837 170 0.0 10.1 1.2 2.2 4.3 4.5 4.55 846 1250
W11 487643 3873078 1515 0.1 65.2 6.2 24.1 36.7 55.1 2.7 5911 9300
W12 486668 3882293 1565 0.2 65.5 10.1 21.2 42.5 53.5 2.1 6118 8770
W13 477865 3877295 1285 0.1 43.5 6.5 19.2 21.9 45.2 2.75 4242 6940
W14 492022 3887802 1150 0.1 89.5 8.5 14.5 63.8 45.2 3.8 7321 10860
W15 483093 3883182 270 0.0 8.3 1.5 3.9 6.4 5.5 1.5 799 1327
W16 494775 3878869 225 0.0 8.1 1.0 3.5 6.2 5.01 1.5 806 1252
W17 483631 3885488 1495 0.1 55.6 6.8 23.1 45.8 36.8 2.2 5457 8560
W18 486668 3882293 1420 0.1 52.2 6.4 22 31.8 45.2 2.1 4957 8000
W19 496838 3877490 1450 0.1 98.0 9.5 19.5 40.8 84.8 1.3 7820 12140
W20 488663 3879854 1335 0.1 93.8 7.5 19.2 43.5 75.2 2.8 7538 11760
W21 483093 3883182 1635 0.5 116.7 9.5 23.2 69.3 78.5 1.4 9517 14280
W22 488510 3863069 1485 0.5 110.2 9.5 20.2 70.5 68.6 1.5 9017 12900
W23 486299 3889485 1225 0.1 63.0 7.3 17.2 47.1 38.1 2 5617 8480
W24 484384 3866860 1015 0.1 60.9 5.2 15.1 41.2 35.5 1.5 5102 7300
W25 486838 3877490 420 0.1 11.3 4.6 3.8 6.4 9.7 2.6 1145 1814
W26 479050 3878869 210 0.1 11.1 1.5 2.7 5.3 6.8 3.7 963 1650
W27 487996 3870206 1980 0.3 104.7 22.0 17.6 45.1 96.2 2.5 8749 13840
W28 490769 3882754 1350 0.3 73.5 14.8 12.2 28.4 68.1 2.8 6035 8900
W29 485174 3870225 440 0.1 14.7 3.6 5.2 9.5 12.2 3 1496 2405
W30 495267 3886727 310 0.1 15.6 1.8 4.4 9.0 10.8 2.5 1389 2240
W31 497703 3886845 250 0.1 11.3 1.0 4 5.0 8.3 3.7 1029 1642
W32 489050 3882293 330 0.1 7.4 2.1 4.5 6.1 5.5 2.1 860 1335
W33 484415 3881667 1160 0.1 26.5 5.8 17.45 26.2 20 1.8 3122 4800
W34 486173 3873352 985 0.1 30.3 5.5 14.2 28.5 17.81 3.5 3203 4420
190

Journal of Tethys: Vol. 1, No. 3, 189-198 ISSN: 2345-2471 ©2013
Rezaeian-Langeroudi et al., 2013 189 Available online at http://jtethys.org
At the time of sampling, the chemical and
physical parameters of the water samples such
as pH, EC, TH and TDS were measured using a
Hach SensIon system. Model of SensIon is 156
multi–parameter following a standard operating
procedure explained by California State Water
Resources Control Board (2002).
Figure 1) Geological map of Hoz-e-Soltan Lake and groundwater sampling locations.
Several authors have reported results using this
device (e.g., Suangkiattikum, 2005; Ermilio,
2005; Ikhu–Omoregbel et al., 2005; Hunt et al.,
2006). Other parameters such as MAR, SSP,
SAR, RSBC, PI, KR and Na% were analyzed in
the laboratory. The analytical precision for the
measured major ions was within ±5%. In order
to study the quality of water, the obtained
chemical data was evaluated in terms of its
suitability for drinking, domestic and irrigation
purposes. All samples were analyzed in applied
research center of Geological Survey of Iran.
The analytical data not only can be used for the
classification of water for utilization purposes
but also for ascertaining various factors on
which the chemical characteristics of water
depend (Sadashivaiah et al., 2008). Statistical
summary of the chemical data is listed in Table
2.
Table 2) Water chemistry analysis of groundwater samples in the study area. P. TH SAR K
+ Na
+ Mg
2+ Ca
2+ SO4
2- Cl
- HCO3
- pH TDS EC
AVE 806.8 12.4 0.1 39.4 5.2 10.9 23.7 28.9 2.7 8 3447 5308.9
MAX 1980 28.87 0.51 116.7 22 24.1 70.5 96.2 4.55 8.45 9517 14280
MIN 170 3.98 0.00 7.43 0.6 1.8 3.94 3.1 1.3 7.15 480 1250
WHO 500 - 200 200 150 200 250 250 240 6.5-9.2 1000 1500
Units mg/l meq/l mg/l mg/l mg/l mg/l mg/l mg/l mg/l mg/l mg/l µs/cm
4– Results and Discussion
4–1– Groundwater Chemistry
Among major cations, sodium was generally
dominant representing on average 75.29% of all
191

Journal of Tethys: Vol. 1, No. 3, 189-198 ISSN: 2345-2471 ©2013
Rezaeian-Langeroudi et al., 2013 190 Available online at http://jtethys.org
the cations. Calcium and magnesium ions were
of secondary importance, representing on
average 18.89% and 5.46% of all cations,
respectively. Potassium ion was almost absent,
representing on average 0.34% of all the
cations. Among the major anions, the average
concentrations of the chloride, sulfate and
bicarbonate ions is 47.59%, 45.345 and 7.05%
respectively. The order of anion abundance
(water type) is Cl–> SO4
2–> HCO3
–, contributing
on average (mg/l), 52.27, 42.89 and 4.84% of
the total anions, respectively. The EC varies
from 1250 to 14280 μmhos/cm indicating that
there are probably marginal (500–1500
μmhos/cm) and brackish water types (>1500
μmhos/cm) in the area. TDS ranges from 480 to
9517 with an average of 3446.4 mg/l. The
maximum value of brine pH was 8.45 and
minimum was 7.15. To determine the type of
brine the measured cations and anions
concentrations were plotted on a ternary
diagram developed by Piper (1994) (Fig. 2). The
diagram can be used to display the relative
abundance of major anions and cations in dilute
natural inflow waters and the concentrated brine
of their associated closed–basin Lakes (Hardie
and Eugster, 1970). Based on the plots on the
Piper diagram (Fig. 2) the brine water type is
currently Na+–Cl
––SO4
2– which is comparable
with Maharlou Lake in Iran and Brystol Salt
Lake and Great Salt Lake in the USA.
Hydrogeochemical analyses of catchment
waters showed that the difference of cations and
anions is a cause for the different geological
features (e.g. Jones and Deocampo 2004). The
order of cations and anions abundance in the
brine is: sodium, magnesium, calcium and
potassium and chloral, sulfate and bio–
carbonate respectively. Chemical analysis of
input waters including runoff and groundwater
indicate that the path of brine on the Eugster and
Hardie flow diagram is II (Eugster and Hardie
1978), and after separation of different minerals,
the brine type of the Lake is Na–Ca (Mg)–Cl,
which is comparable with Maharlou, Brystol
and Great Salt Lake in USA.
Figure 2) Piper diagram for essential cations and anions Hoz-e-Soltan Lake.
4–2– Water Quality Assessment The classical use of water analyses in
groundwater hydrology result in to produce
information concerning the water quality. The
water quality may yield information about the
environments through which the water has
circulated (Janardhana, 2007). The main
objective following a hydrogeochemical
assessment is to determine groundwater
suitability to different uses based on different
chemical indices. In this paper, assessment of
the suitability for drinking and domestic
192

Journal of Tethys: Vol. 1, No. 3, 189-198 ISSN: 2345-2471 ©2013
Rezaeian-Langeroudi et al., 2013 190 Available online at http://jtethys.org
consumption was evaluated using Schoeller
diagram. Hydrogeochemical parameters of
groundwater in the study are compared to the
prescribed specification of World Health
Organization (WHO, 2004) (see Table 2 and
Fig. 3). The pH values of the groundwater vary
between 7.15 and 8.45, indicating slightly
alkaline to alkaline nature of groundwater.
Figure 3) Schoeller diagram for Hoz-e-Soltan Lake
samples.
According to the WHO (2004), the range of
desirable pH values of water prescribed for
drinking purposes is 6.5 – 9.2. There are no
water samples with pH values outside of the
desirable ranges. Table 2 shows that most of the
parameters exceed the maximum permissible
limits of WHO recommended standards (2004).
The EC and concentration of TDS is more than
the maximum permissible limits of 1500
μmhos/cm and 1000 mg/l respectively, in 76.47
(26 samples) and 64.70% (22 samples) of the
total groundwater samples. According to
Sawyer et al. (2003) classification for hardness,
67.64%, 32.36% of total groundwater samples
are very hard (˃ 300 mg/l) and hard (150–300
mg/l) respectively (Table 3). Water hardness has
no known adverse effects; however, hard water
is unsuitable for domestic use. Depending on
factors such as pH and alkalinity, a hardness of
more than about 200 mg/l will lead to scale
deposits in the piping system (N.G.F.M. van der
Aa, 2003).
Table 3) Groundwater classification based on total hardness TH (mg/l) classification Sample number Sample percent
˂75 Soft - -
75-150 Approximately hard - -
150-300 Hard 11 32.36
˃300 Very hard 23 67.64
4–3– Suitability for Irrigation Use The water quality evaluation in the area of study
was also carried out to determine their
suitability for agricultural purposes. The
suitability of groundwater for irrigation is
depending on the effects on the mineral
constituents of the water on both the plant and
the soil. In fact, salts can be highly harmful.
They can limit growth of plants physically, by
restricting the taking up of water through
modification of osmotic processes. Also salts
may damage plant growth chemically by the
effects of toxic substances upon metabolic
processes. Salinity, sodicity and toxicity
generally need to be considered when
evaluating of the suitable quality of
groundwater for irrigation (Todd, 1980;
Shainberg and Oster, 1976). Parameters such as
Na%, MAR, SSP, RSBC, PI, KI, SAR, EC and
TDS were used to assess the suitability of water
for irrigation purposes (see Table 4).
4–3.1– Salinity Hazard Excess salt increases the osmotic pressure of the
soil solution that can result in a physiological
drought condition. Even though a field can
appear to have plenty of moisture, the plants
wilt because insufficient water is absorbed by
the roots to replace that lost from transpiration.
The total soluble salt content of irrigation water
generally is measured either by determining its
EC, reported in this paper as µmhos per
centimeter, or by determining the actual salt
content in parts per million (ppm). The EC
values ranged from 1250 to 14280 μmhos/cm.
The large variation in EC is mainly attributed to
lithologic composition and anthropogenic
activities prevailing in this region (Khodapanah
et al., 2009). Normally, irrigation water with an
EC of < 700 μmhos/cm causes little or no threat
to most crops while EC of > 3000 μmhos/cm
may limit their growth (Tijani, 1994). Based on
the US Salinity Laboratory classification
(1954), the salinity hazard for water samples in
Hoz–e–Soltan Lake is classified as high (EC:
193

Journal of Tethys: Vol. 1, No. 3, 189-198 ISSN: 2345-2471 ©2013
Rezaeian-Langeroudi et al., 2013 190 Available online at http://jtethys.org
750–2250 μmhos/cm) and very high (EC: ˃2250
μmhos/cm) (Fig. 4). Most of the groundwater
samples belong to very high and high salinity
hazard (C4, C3) as per the salinity hazard
classification in the basin. None of water
samples had low and medium salinity
contamination (Table 4). Groundwater that falls
in the medium salinity hazard class (C2) can be
used in most cases without any special practices
for salinity control.
However, water samples that fall in the high
salinity hazard class (C3) may have detrimental
effects on sensitive crops and adverse effects on
many plants. Such samples require careful
management practices. Very high salinity water
(C4) is not suitable for irrigation under ordinary
conditions but may be used for salt tolerant
plants on permeable soils with special
management practices.
Figure 4) Salinity diagram for classification of
irrigation waters (from Richards, 1954).
Table 4) Calculated statistical parameters for different groundwater samples index in studied area. ID MAR PI KR SAR RSBC SSP Na% SAR Class
W1 50 89.2 3.26 8.7 2.1 76.6 76.3 8.7 C3-S2
W2 52.3 79.8 2.23 7.7 1.27 69.2 68.9 7.7 C3-S2
W3 47.8 82.0 2.07 6.3 1.7 67.5 67.5 6.3 C3-S2
W4 44.4 71.7 1.55 5.5 0 60.7 60.8 5.5 C3-S2
W5 25.4 53.8 0.83 4.0 -5 45.7 45.3 4.0 C3-S1
W6 24.4 67.8 1.58 6.5 -3.6 61.4 61.0 6.5 C3-S2
W7 33.3 63.2 1.38 4.8 -2.5 57.9 57.9 4.8 C3-S1
W8 30.0 67.2 1.59 5.0 -2 61.4 61.4 5.0 C3-S1
W9 16.2 88.8 2.92 7.9 1.05 74.5 74.5 7.9 C3-S2
W10 35.3 91.7 2.96 7.7 2.35 74.8 74.6 7.7 C3-S2
W11 20.5 69.7 2.15 16.8 -21.4 68.3 68.2 16.8 C4-S4
W12 32.3 68.8 2.09 16.6 -19.1 67.7 67.5 16.6 C4-S4
W13 25.3 64.8 1.69 12.1 -16.5 62.9 62.8 12.1 C4-S4
W14 37.0 81.2 3.89 26.4 -10.7 79.6 79.5 26.4 C4-S4
W15 27.8 65.9 1.53 5.0 -2.4 60.4 60.4 5.0 C3-S1
W16 22.2 70.3 1.81 5.4 -2 64.4 64.4 5.4 C3-S2
W17 22.7 66.3 1.86 14.4 -20.9 65.0 64.9 14.4 C4-S4
W18 22.5 66.1 1.84 13.8 -19.9 64.8 64.7 13.8 C4-S4
W19 32.8 77.7 3.38 25.7 -18.2 77.2 77.1 25.7 C4-S4
W20 28.1 79.0 3.51 25.7 -16.4 77.9 77.8 25.7 C4-S4
W21 29.1 78.6 3.57 28.9 -21.8 78.2 77.9 28.9 C4-S4
W22 32.0 79.3 3.71 28.6 -18.7 78.8 78.5 28.6 C4-S4
W23 29.8 73.2 2.57 18.0 -15.2 72.0 71.9 18.0 C4-S4
W24 25.6 75.9 3.00 19.1 -13.6 75.0 74.9 19.1 C4-S4
W25 54.8 64.0 1.35 5.5 -1.2 57.6 57.3 5.5 C3-S2
W26 35.7 84.6 2.64 7.7 1 72.7 72.3 7.7 C3-S2
W27 55.6 73.4 2.64 23.5 -15.1 72.6 72.4 23.5 C4-S4
W28 54.8 74.5 2.72 20.0 -9.4 73.2 72.9 20.0 C4-S4
W29 40.9 68.9 1.67 7.0 -2.2 62.7 62.2 7.0 C4-S2
W30 29.0 77.3 2.51 8.8 -1.9 71.7 71.2 8.8 C3-S2
W31 20.0 80.7 2.27 7.2 -0.3 69.5 69.2 7.2 C3-S2
W32 31.8 60.4 1.13 4.1 -2.4 53.2 52.7 4.1 C3-S1
W33 24.8 55.1 1.14 7.8 -15.7 53.4 53.2 7.8 C4-S3
W34 27.9 64.1 1.54 9.6 -10.7 60.6 60.5 9.6 C4-S3
194

Journal of Tethys: Vol. 1, No. 3, 189-198 ISSN: 2345-2471 ©2013
Rezaeian-Langeroudi et al., 2013 189 Available online at http://jtethys.org
Figure 5, shows spatial distribution of EC in the
groundwater. It can be seen that from the north,
east and west to the center and south of the
studied area, EC values increases. Increasing of
the soluble mineral materials along flow path,
groundwater movement through salt flat zone of
playa and evaporation are the major causes of
salinization in eastern and northeastern zones of
the Hoz–e–Soltan Lake plain. Moreover,
irrigation with saline water, dissolution of the
chemical fertilizers by irrigation water and
industrial and municipal waste disposal also
increases the rate of salinization in north and
western parts of Hoz–e–Soltan Lake plain
(Rouabhia et al., 2009; Andradea et al., 2008).
Figure 5) The spatial distribution of EC in the
groundwater.
4–3.2– Alkali Hazard
Although sodium contributes directly to the
total salinity the main problem with a high Na+
concentration is its effect on the physical
properties of soil. While a high salt content
(high EC) in water leads to formation of saline
soil, SAR leads to development of an alkaline
soil. Irrigation with Na–enriched water results in
ion exchange reactions: uptake of Na+
and
release of Ca2+
and Mg2+
. This causes soil
aggregates to disperse thereby reducing its
permeability (Tijani, 1994). The Na+ alkali
hazard in the use of water for irrigation is
determined by the absolute and relative
concentration of cations and is expressed as the
SAR. There is a significant relationship between
SAR values of irrigation water and the extent to
which sodium is absorbed by the soils.
Continued use of water with a high SAR value
leads to a breakdown in the physical structure of
the soil caused by excessive amounts of
colloidally absorbed sodium. This breakdown
results in the dispersion of clay soil that causes
the soil to become hard and compact when dry
which increases impervious to water penetration
due to dispersion and swelling when wet. Fine–
textured soils, those high in clay, are especially
subject to this action (Khodapanah et al., 2009).
The calculated SAR values of the groundwater
in the study area range from 4 to 28.89. As per
the Richard (1954) classification based on SAR
values (Table 3), 20 samples (58.82%) are in the
excellent category because none of the samples
exceeded SAR value of 10 (Table 3). Six
samples (17.65%) fall in the medium alkali
hazard category (S2), while 8 samples (23.53%)
belong to the high and very high salinity hazard
category.
4–3.3– Sodium Content Sodium in irrigation waters is also expressed as
Na% or SSP. The values of Na% in the study
area range from 45.3 to 79.5%. It is observed
that about 29 samples have high sodium percent
(above 60%) and are therefore not suitable for
irrigation purposes (table 5). High percentage of
Na+ with respect to (Ca
2+, Mg
2+, Na
+) in
irrigation water causes deflocculating and
impairing of soil permeability (Singh et al.,
2008).
Table 5) Classification of irrigation quality based on Na%. Na% classification Sample number Sample percent
˂ 20 Excellent - -
20-40 Good - -
40-60 Permissible 5 11.77
60-80 Suspicious 29 88.23
˃ 80 Inappropriate - -
4–3.4– Water Classification In order to classify the groundwater samples for
irrigation uses, the salinity hazard, sodium
content, EC, SAR and SSP values have been
used (see Table 4). Electrical conductivity
values measured in the groundwater samples
195

Journal of Tethys: Vol. 1, No. 3, 189-198 ISSN: 2345-2471 ©2013
Rezaeian-Langeroudi et al., 2013 190 Available online at http://jtethys.org
ranges between 1250 and 14280 μmhos/cm and
the calculated SAR values varies from 4 to
28.89 in the study area. Results in Table 3 show
that 14 samples (41.17%) are confined in C4–
S4, 12 samples (35.30%) are in C3–S2, 5
samples (14.70%) are in C3–S1, 2 samples
(5.88%) are in C4–S3 and 1 sample are in C4–
S2. Due to low sodium and medium salinity
groundwater C2–S1 class can be used for
irrigation on almost all soils with little danger of
sodium problem, if a moderate amount of
leaching occurs. Groundwater in C4–S4 class is
generally not suitable for irrigation. Salinity in
C3–S2, C4–S3 and C4–S4 classes is high and
very high respectively. It will result sodium
problem in most soils and therefore not suitable
for irrigation under ordinary conditions. This
water can however be used on soils with
considerable drainage. But even with adequate
drainage, special circumstances for salinity
control may be required. According to Table 4
and Figure 5, most of samples are in C4–S4 and
C3–S2 classes thereby making the water
unsuitable for irrigation purposes. The SSP
values vary from 45.7 to 79.6%. Because the
majority of samples exceed the allowance limit
of 60%, it can therefore be concluded that the
water in study region is not appropriate for
irrigation purposes.
5– Conclusions The groundwater quality of Hoz–e–Soltan Lake
has been evaluated for its chemical composition
and suitability for drinking, domestic and
irrigation uses. The investigation indicates that
among major cations, Na+
is generally dominant
representing on average 75.29% of all the
cations. The order of anion abundance is Cl–>
SO42–
> HCO3–. The EC varies from 1250 to
14280 μmhos/cm indicating that there is
probably marginal water and brackish water
types in the area. According to the Piper
diagram, the brine water type is currently Na+–
Cl––SO4
2– which is comparable with Mahrlou
Lake in Iran and Brystol Salt Lake and Great
Salt Lake in the USA. TH average values equal
to 806.8 mg/l the water lies in hard (150–300
mg/l) and very hard (˃ 300 mg/l) water classes
which make it unsuitable for drinking, domestic
and irrigation use. Alkali hazard also is
classified from excellent (58.82% of samples) to
medium (17.65% of samples), high and very
high (23.53% of samples). Results show that
about 29 samples have high sodium percent
(above 60%) and are therefore not suitable for
irrigation purposes. Increasing soluble mineral
materials along the flow path, groundwater
movement through salt flat and evaporation are
the major causes of salinization in eastern and
northeastern zones of the Hoz–e–Soltan Lake
plain. Moreover, irrigation with saline water,
dissolution of the chemical fertilizers by
irrigation water and industrial and municipal
waste disposal increases the rate of salinization
in north and western parts of Hoz–e–Soltan
Lake plain. Based on high salinity, SAR, TH,
TDS, EC, SSP and Na% values in most water
samples, the water is not recommended for
drinking, domestic and irrigation uses.
Acknowledgments
The authors would like to thank Dr. A. A. Ako
and Dr. M. Gomo for their kind and careful
comments that made the manuscript improved.
References
Andradea E.M., Queiroz Pala´ciob, H.A.,
Souzab, I.H., de Oliveira Leaoa, R.A.,
Guerreiro, M.J. 2008. Land use effects in
groundwater composition of an alluvial
aquifer (Trussu River, Brazil) by multivariate
techniques. Journal of Environmental
Research: 106, 170–177.
Aqanabati, S.A. 2006. Geology of Iran.
Geological Survey of Iran, Tehran, 586 p.
Ermilio, J.R. 2005. Characterization study of
bio–infiltration storm water BMP. M.Sc.
thesis, Villanova University, 130 p.
Eugster, H.P., Hardie, L.A. 1978. Saline Lakes,
In Lerman A. (ed.), Lakes, Chemistry,
Geology and Physics: Springer–Verlag, 237–
293.
Fayazi, F. 1991. Sedimentological studies in the
Qom area, PhD. Thesis, Unpublished
University of East Anglia, U.K., 145 p.
Hardie, L.A., Eugster, H.P. 1970. The evolution
of closed–basin brines. Mineralogical Society
of America, Special Paper: 3, 273–290.
196

Journal of Tethys: Vol. 1, No. 3, 189-198 ISSN: 2345-2471 ©2013
Rezaeian-Langeroudi et al., 2013 191 Available online at http://jtethys.org
Hunt, J.W., Anderson, B.S., Phillips, B.M.,
Tjeerdema, R.S., Richard, N., Valconnor, V.,
Worcester, K., Angelo, M., Bern, A.,
Fulfrost, B., Mulvaney, D. 2006. Spatial
relationship between water quality and
pesticide application rates in agricultural
watersheds. Journal of Environmental
Monitoring and Assessment: 121, 245–262.
Ikhu–Omoregbe, D., Kuip, P.K., Hove, M.
2005. An assessment of the quality of liquid
effluents from opaque beer–brewing plants in
Bulawayo, Zimbabwe. Water South African
Journal: 31, 40–150.
Janardhana, N.R. 2007. Hydrogeochemical
parameters for assessment of groundwater
quality in the upper Gunjanaeru River basin,
Cuddapah District, Andhra Pradesh, South
India. Journal of Environmental Geology: 52,
1067–1074.
Jones, B.F., and Deocampo, D.M. 2004.
Geochemistry of saline Lakes, In Treatise on
Geochemistry. US Geological Survey: 393–
424.
Kelly, W.P. 1940. Diagnosis and improvement
of saline alkali soils: Agriculture, 160.
Handbook 60, US Department of agriculture,
Washington D.C.
Khodapanah, L., Sulaiman, W.N.A.,
Khodapanah, N. 2009. Groundwater Quality
Assessment for Different Purposes in
Eshtehard District, Tehran, Iran. European
Journal of Scientific Research: 36, 543–553.
Motamed A., Pourmotamed, F. 1979. Geology
north of Hoz–e–Soltan. Bulletin of Faculty of
Science. Tehran University: 11, 1–2.
Piper, A.M. 1994. A graphical procedure in the
geochemical interpretation of water analysis.
The American Geophysical Union
Transactions: 25, 914–928.
Richards, L.A. 1954. Diagnosis and
improvement of saline and alkali soils.
Agricultural Handbook 60, USDA and IBH
Publishing Co. Ltd. New Delhi, India, 98–99.
Rouabhia, A., Fehdi, Ch., Baali, A., Djabri, R.,
Rouabhi, R. 2009. Impact of human activities
on quality and geochemistry of groundwater
in the Merdja area, Tebessa Algeria. Journal
of Environmental Geology: 56, 1259–1268.
Sadashivaiah C., Ramakrishnaiah, C.R.,
Ranganna, G. 2008. Hydrochemical analysis
and evaluation of groundwater quality in
Tumkur Taluk, Karnataka State, India.
International Journal of Environmental
Research: 53, 158–164.
Sawyer, G.N., McCartly, D.L., Parkin, G.F.
2003. Chemistry for environmental
engineering and science, fifth ed., McGraw
Hill, New York, 752 p.
Shainberg I, Oster, J.D. 1976. Quality of
irrigation water. International Irrigation
Information Center publication, no. 2.
Singh, A.K., Mondal, G.C., Singh, T.B.,
Tewary, B.K., Sinha, A. 2008. Major ion
chemistry, weathering processes and water
quality assessment in upper catchment of
Damodar River basin, India. Journal of
Environmental Geology: 54, 745–758.
State Water Resources Control Board, 2002.
Central valley regional water quality control
board, CWA section 303(d) List of water
quality limited segments. Sacramento, CA.
Sonnenfeld, P. 1991. Evaporite basin analysis,
in: Force, E.R. (ed.), Sedimentary and
Diagenetic Mineral Deposits: a basin analysis
approach to exploration, pp.159–169.
Suangkiattikum, C. 2005. Solute balance
modeling of Lake Naivasha (Kenya):
application of DMS, M.Sc. thesis, The
International Institute for Geo–information
Science and Earth Observation (ITC),
Enschede, 114 p.
Tijani, M.N. 1994. Hydrochemical assessment
of groundwater in Moro area, Kwara State,
Nigeria. Journal of Environmental Geology:
24, 194–202.
Todd, D. 1980. Groundwater hydrology, second
ed. Wiley, New York, 535 p.
197
Journal of Tethys: Vol. 1, No. 3, 189-198 ISSN: 2345-2471 ©2013
Rezaeian-Langeroudi et al., 2013 192 Available online at http://jtethys.org
US Salinity Laboratory, 1954. Diagnosis and
improvement of saline and alkali soils,
Agricultural Handbook No. 60. USDA, 160
p.
Van der Aa, N.G.F.M. 2003. Classification of
mineral water types and comparison with
drinking water standards. Journal of
Environmental Geology: 44, 554–563.
World Health Organization (WHO), 2004.
Guidelines for drinking–water quality:
Recommendations, third ed. Volume 1,
Geneva.
Received: 04 September 2013 / Accepted: 27 October
2013 / Published online: 27 October 2013
EDITOR–IN–CHIEF:
Dr. Vahid Ahadnejad:
Payame Noor University, Department of Geology .PO
BOX 13395–3697, Tehran, Iran.
E–Mail: [email protected]
EDITORIAL BOARD:
Dr. Jessica Kind:
ETH Zürich Institut für Geophysik, NO H11.3, Sonnegg
strasse 5, 8092 Zürich, Switzerland
E–Mail: [email protected]
Prof. David Lentz University of New Brunswick, Department of Earth
Sciences, Box 4400, 2 Bailey Drive
Fredericton, NB E3B 5A3, Canada
E–Mail: [email protected]
Dr. Anita Parbhakar–Fox
School of Earth Sciences, University of Tasmania, Private
Bag 126, Hobart 7001, Australia
E–Mail: [email protected]
Prof. Roberto Barbieri
Dipartimento di Scienze della Terra e Geoambientali,
Università di Bologna, Via Zamboni 67 – 40126,
Bologna, Italy
E–Mail: [email protected]
Dr. Anne–Sophie Bouvier
Faculty of Geosciences and Environment, Institut des
science de la Terre, Université deLausanne, Office:
4145.4, CH–1015 Lausann, Switzerland
E–Mail: Anne–[email protected]
Dr. Matthieu Angeli
The Faculty of Mathematics and Natural Sciences,
Department of Geosciences, University of Oslo
Postboks 1047 Blindern, 0316 OSLO, Norway
E–Mail: [email protected]
Dr. Miloš Gregor
Geological Institute of Dionys Stur, Mlynska Dolina,
Podjavorinskej 597/15 Dubnica nadVahom, 01841,
Slovak Republic
E–Mail: [email protected]
Dr. Alexander K. Stewart
Department of Geology, St. Lawrence University, Canton,
NY, USA
E–mail: [email protected]
Dr. Cristina C. Bicalho
Environmental Geochemistry, Universidade Federal
Fluminense – UFF, Niteroi–RJ, Brazil
E–mail: [email protected]
Dr. Lenka Findoráková
Institute of Geotechnics, Slovak Academy of Sciences,
Watsonova 45,043 53 Košice, Slovak Republic
E–Mail: [email protected]
Dr. Mohamed Omran M. Khalifa
Geology Department, Faculty of Science, South Valley,
Qena, 83523, Egypt
E–Mail: [email protected]
Prof. A. K. Sinha
D.Sc. (Moscow), FGS (London). B 602,
Vigyan Vihar, Sector 56, GURGAON 122011,
NCR DELHI, Haryana
E–Mail: [email protected]
198