investigation of nucleation and crystal growth kinetics...
TRANSCRIPT
Investigation of nucleation and crystal growth kinetics of nickel manganese oxalates
Montaha Aoun-Habbache, Sophie Guillemet-Fritsch, Jacques Lemaîtreand Alan Jones
Centre Inter-Universitaire de Recherche et d’Ingénierie des Matériaux (CIRIMAT), Université Paul Sabatier-Bâtiment 2R1, 118 Route de Narbonne, 31062 Toulouse Cedex4, FrancePowder Technology Laboratory, Departement of Materials Science, Swiss Federal Institution of Technology, CH-1015 Lausanne, SwitzerlandDepartment of Chemical Engineering, University College London, Torrington Place, London WC1E 7JE, UK
Abstract
The nucleation and the crystal growth rates of mixed nickel manganese oxalates have been determined from the changes of the ionic concentration of the solution and the crystal size distribution during the precipitation process within a supersaturation range 0–0.1 M. Thermodynamic solubility calculations have been used to identify the different species contributing the precipitation reaction and for estimation of the thermodynamic constant. Experimental data show that the nucleation rate of mixed nickel manganese oxalate in this supersaturation range is consistent with a primary heterogeneous mechanism and was found to obey to an exponential law. The crystal growth rates indicate a surface-integration-controlled mechanism with a first-order law with respect to the supersaturation.
Keywords: A1. Nucleation; A2. Growth from solutions; B1. Mixed nickel manganese oxalate
1. Introduction 2. Experimental study 3. Results and discussion 3.1. Evolution of the solution and the precipitate characteristics 3.2. Nucleation rate 3.3. Crystal growth rate4. Conclusions Acknowledgements References
1. Introduction
Mixed Ni–Mn oxalate is a precursor for producing ceramic materials [1] and [2] and more precisely negative temperature coefficient thermistors. The mixed Ni–Mn oxalate is synthesized by a co-precipitation process. An effective control of the precipitation process is desired for the production of high-quality ceramics, since the quality of the precipitated precursor (for example,
the crystal size, the crystal morphology, the specific surface area and the purity) has a direct effect on the properties of the resulting ceramic powders. Fine particles with a narrow particle size distribution are required to obtain highly reliable ceramic components. A better control of the precipitation process should help produce the powder quality desired for ceramic processing. Very few kinetic data concerning the particle number concentration, the critical nucleus, the induction period and the precipitation rate of oxalate systems have been published [1] and [3]. No previous data have been reported concerning the nucleation and the crystal growth rates of Ni–Mn mixed oxalates. A systematic experimental study has been undertaken to determine the effect of the experimental parameters on the precursor powder quality and to establish the precipitation rates of nucleation and growth. Most of the studies concerning the nickel manganese mixed oxalates found in the literature are mainly dedicated to the effect of the thermal treatments on the precipitated precursors and sintering parameters on the electrical properties [1] and [2]. In the present work, a particular attention has been given to the determination of the nucleation and the crystal growth rates of coprecipitated oxalates.
2. Experimental study
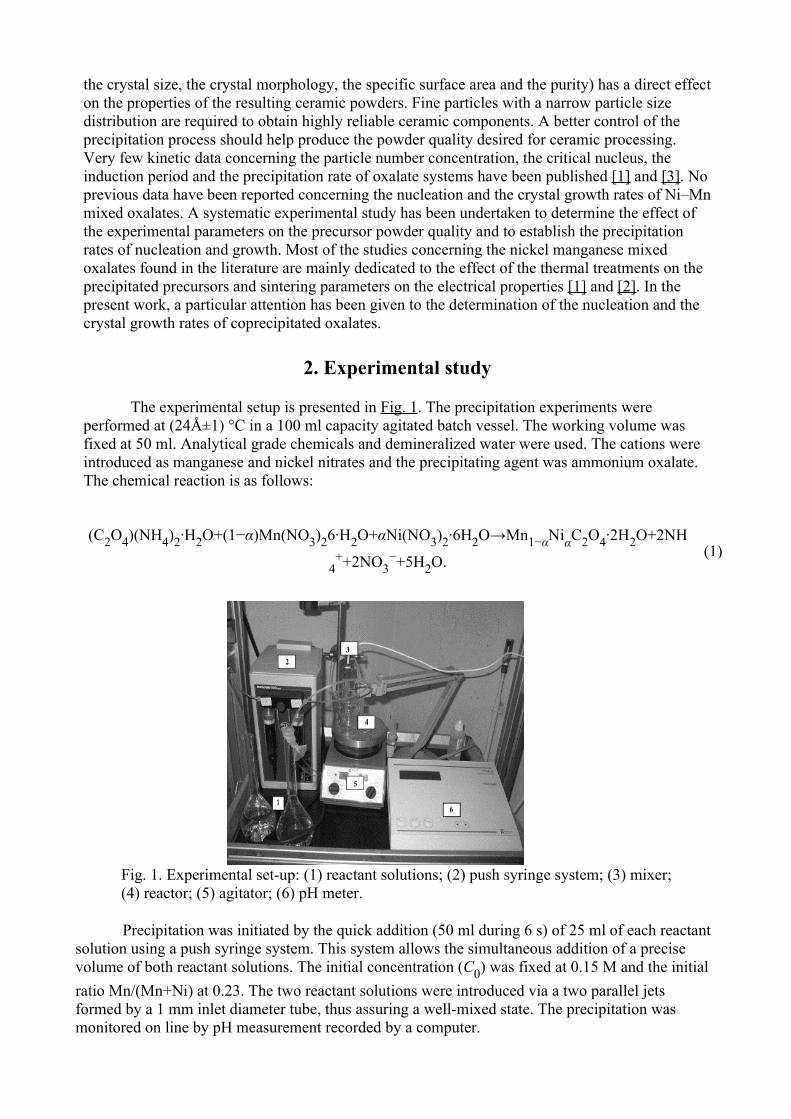
The experimental setup is presented in Fig. 1. The precipitation experiments were performed at (24ű1) °C in a 100 ml capacity agitated batch vessel. The working volume was fixed at 50 ml. Analytical grade chemicals and demineralized water were used. The cations were introduced as manganese and nickel nitrates and the precipitating agent was ammonium oxalate. The chemical reaction is as follows:
(C2O4)(NH4)2·H2O+(1−α)Mn(NO3)26·H2O+αNi(NO3)2·6H2O→Mn1−αNiαC2O4·2H2O+2NH
4++2NO3
−+5H2O.(1)
Fig. 1. Experimental set-up: (1) reactant solutions; (2) push syringe system; (3) mixer; (4) reactor; (5) agitator; (6) pH meter.
Precipitation was initiated by the quick addition (50 ml during 6 s) of 25 ml of each reactant solution using a push syringe system. This system allows the simultaneous addition of a precise volume of both reactant solutions. The initial concentration (C0) was fixed at 0.15 M and the initial ratio Mn/(Mn+Ni) at 0.23. The two reactant solutions were introduced via a two parallel jets formed by a 1 mm inlet diameter tube, thus assuring a well-mixed state. The precipitation was monitored on line by pH measurement recorded by a computer.
During the precipitation experiment, some suspension samples (1 ml) were withdrawn from the reactor and filtered quickly through a 0.2 μm-membrane. The filtrate was diluted using a hydrochloric acid solution and analyzed using the inductively coupled plasma (ICP) atomic emission spectroscopy technique. The powder morphology was observed with a JEOL JSM-6400 scanning electron microscope. The dimensions of the crystals were determined from the SEM micrographs in order to estimate their shape factors. The thermal decomposition of the mixed oxalate was followed by thermogravimetric analyses (92-16.18 Setaram TAG). X-ray diffraction data were collected with an SIEMENS D501 diffractometer using the Cu Kα radiation. The particle size distribution (PSD) of the powder was analyzed using the MALVERN MASTERSIZER 2000.
3. Results and discussion
3.1. Evolution of the solution and the precipitate characteristics
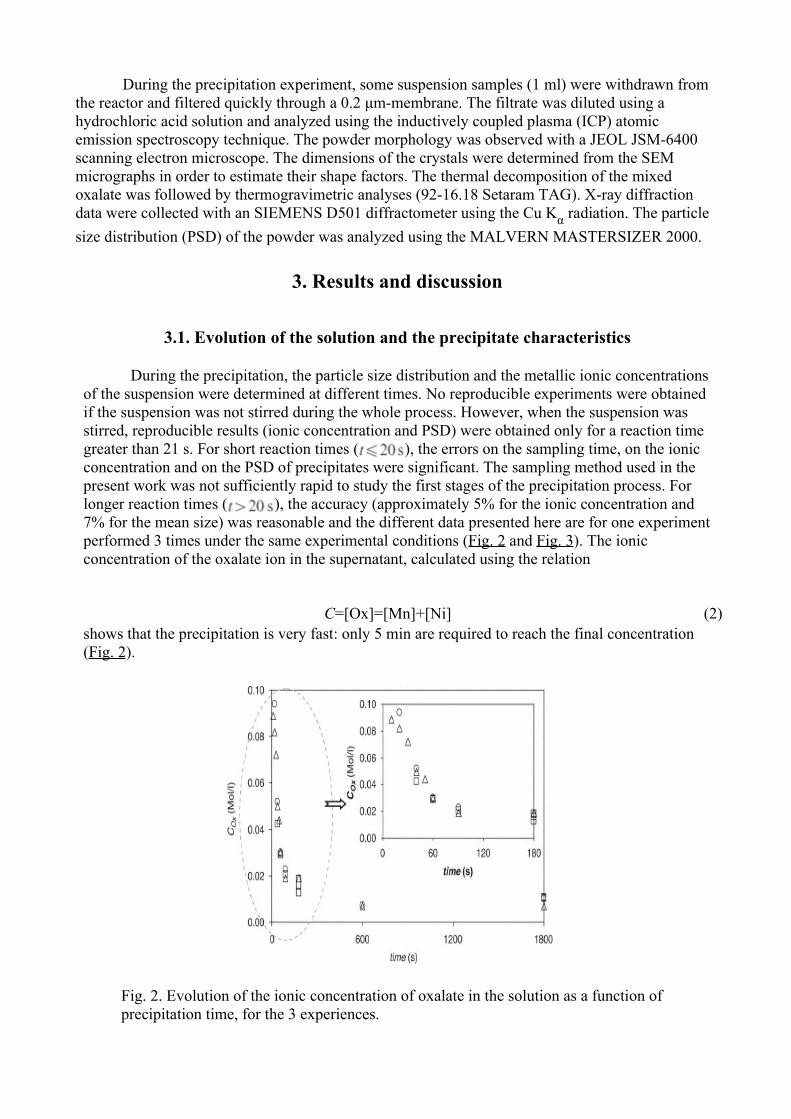
During the precipitation, the particle size distribution and the metallic ionic concentrations of the suspension were determined at different times. No reproducible experiments were obtained if the suspension was not stirred during the whole process. However, when the suspension was stirred, reproducible results (ionic concentration and PSD) were obtained only for a reaction time greater than 21 s. For short reaction times ( ), the errors on the sampling time, on the ionic concentration and on the PSD of precipitates were significant. The sampling method used in the present work was not sufficiently rapid to study the first stages of the precipitation process. For longer reaction times ( ), the accuracy (approximately 5% for the ionic concentration and 7% for the mean size) was reasonable and the different data presented here are for one experiment performed 3 times under the same experimental conditions (Fig. 2 and Fig. 3). The ionic concentration of the oxalate ion in the supernatant, calculated using the relation
C=[Ox]=[Mn]+[Ni] (2)shows that the precipitation is very fast: only 5 min are required to reach the final concentration (Fig. 2).
Fig. 2. Evolution of the ionic concentration of oxalate in the solution as a function of precipitation time, for the 3 experiences.

Fig. 3. Evolution of the volume median size as a function of precipitation time.
The PSD of the precipitated powder is mono-modal and the peak moves toward higher sizes as the process progresses. The evolution of the median volume size shows that it increases to reach (6.0ű0.3) μm after 20 min (Fig. 3). Fig. 4 presents the scanning electron micrographs of the samples collected after an experiment of 60 s. The particles are octahedral and seem to be laminated. The crystal sides become more regular as the process progresses. The SEM observations are used to estimate the surface and volumetric shape factors. The volume shape factor is between an octahedron and a sphere, Φ(o-s)v and is equal to 0.9. It was estimated from scanning electron microscope observations of some crystal dimensions. For the calculation of the PSD using the laser diffraction data, an approximation was made that the particles are spherical. The structure of the precipitate powders was checked by X-ray diffraction analysis. The nickel manganese oxalates synthesized are isostructural with manganese oxalate MnC2O4·2H2O (JCPDS: 25–544). No additional XRD peaks due to nickel oxalate NiC2O4·2H2O were detected on the Mn–Ni oxalate pattern within the accuracy of the diffractometer [4].
Fig. 4. Scanning electron microscope micrograph of an oxalate powder. Precipitation time .
3.2. Nucleation rate
In a batch reactor, the nucleation rate B, defined as the particle number concentration created per time unit, is related to the particle number concentration N and to the crystal size distribution density function ψ(L,t) at time t according to Eq. (3):
(3)
The crystal size distribution density function can be determined experimentally.
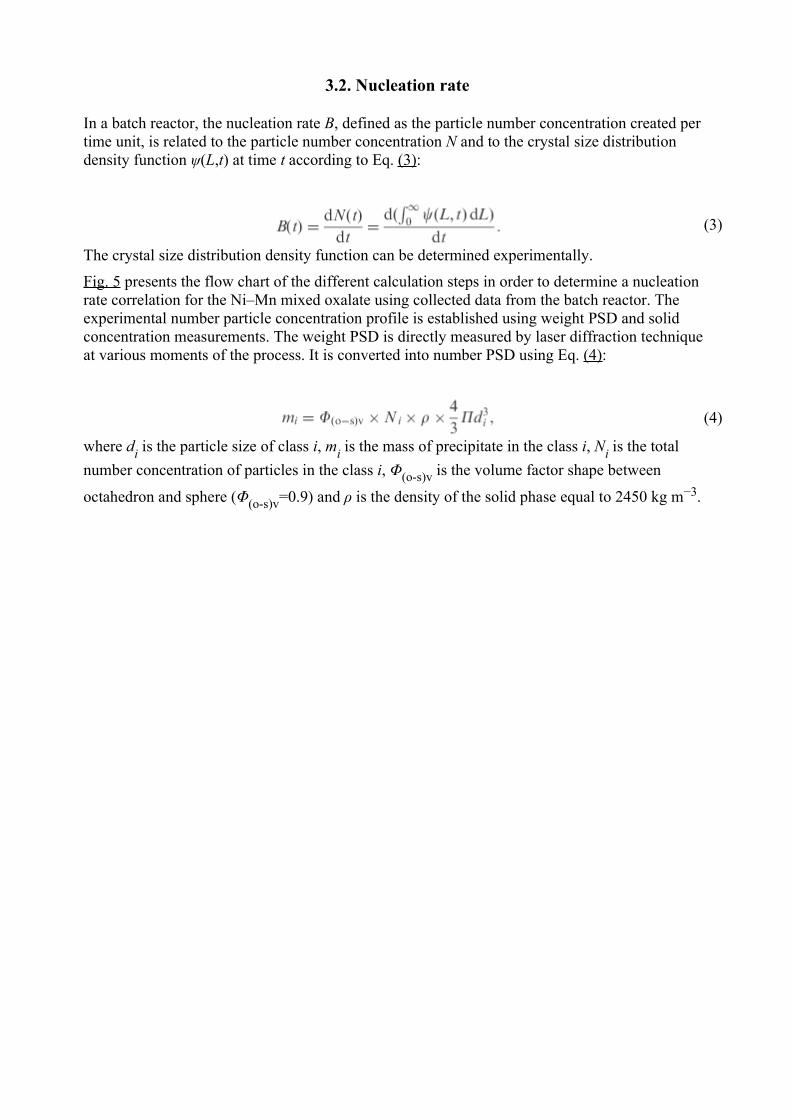
Fig. 5 presents the flow chart of the different calculation steps in order to determine a nucleation rate correlation for the Ni–Mn mixed oxalate using collected data from the batch reactor. The experimental number particle concentration profile is established using weight PSD and solid concentration measurements. The weight PSD is directly measured by laser diffraction technique at various moments of the process. It is converted into number PSD using Eq. (4):
(4)
where di is the particle size of class i, mi is the mass of precipitate in the class i, Ni is the total number concentration of particles in the class i, Φ(o-s)v is the volume factor shape between
octahedron and sphere (Φ(o-s)v=0.9) and ρ is the density of the solid phase equal to 2450 kg m−3.
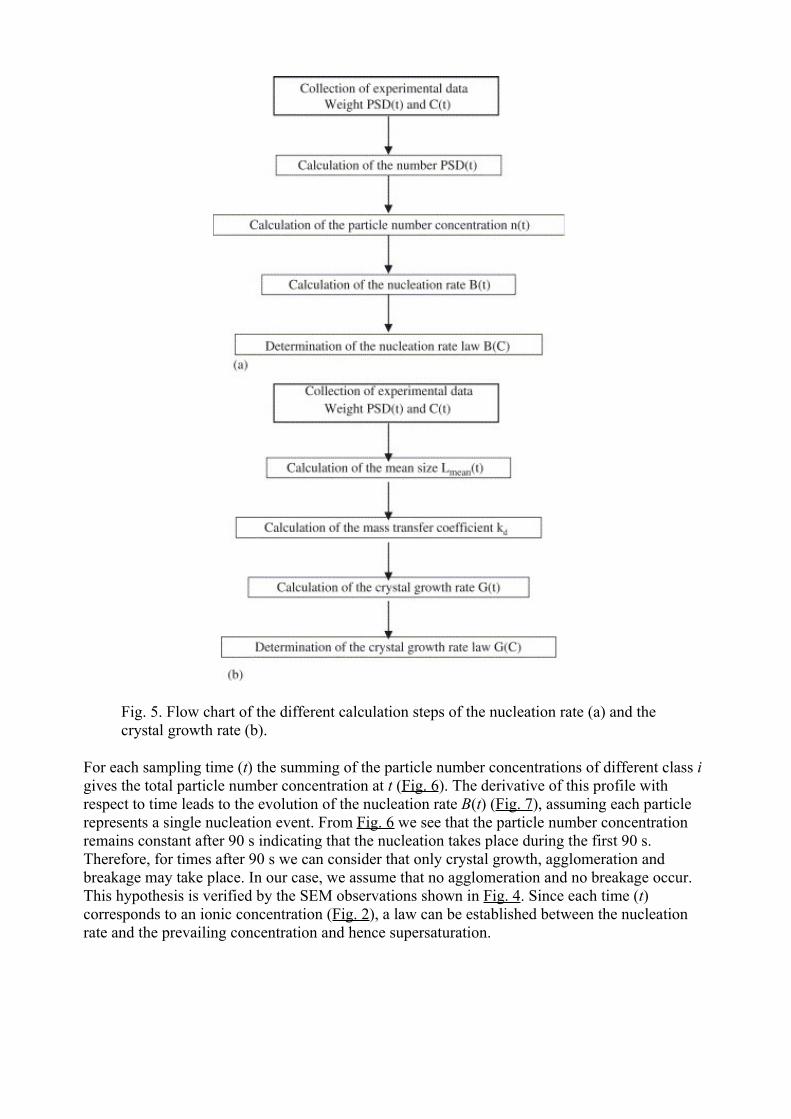
Fig. 5. Flow chart of the different calculation steps of the nucleation rate (a) and the crystal growth rate (b).
For each sampling time (t) the summing of the particle number concentrations of different class i gives the total particle number concentration at t (Fig. 6). The derivative of this profile with respect to time leads to the evolution of the nucleation rate B(t) (Fig. 7), assuming each particle represents a single nucleation event. From Fig. 6 we see that the particle number concentration remains constant after 90 s indicating that the nucleation takes place during the first 90 s. Therefore, for times after 90 s we can consider that only crystal growth, agglomeration and breakage may take place. In our case, we assume that no agglomeration and no breakage occur. This hypothesis is verified by the SEM observations shown in Fig. 4. Since each time (t) corresponds to an ionic concentration (Fig. 2), a law can be established between the nucleation rate and the prevailing concentration and hence supersaturation.

Fig. 6. Evolution of the particle concentration as a function of precipitation time.
Fig. 7. Experimental and calculated profiles of the nucleation rate as a function of the supersaturation.
In a small batch precipitation, secondary nucleation can often be neglected, especially for small
crystals [5]. Only primary nucleation will be treated in this paper as it is often the dominant nucleation mechanism in precipitation. Primary homogeneous nucleation occurs spontaneously after a certain induction time linked to the level of supersaturation. Primary heterogeneous nucleation occurs in the presence of a foreign nucleus. Homogeneous nucleation can usually only be obtained under carefully controlled laboratory conditions. Much more frequently, the formation of a new solid phase within the system appears as a result of a heterogeneous nucleation. The primary nucleation rate, based on a semi-empirical model deduced from the theory of condensation in gases, is given by the following expression of Volmer and Weber [6]:
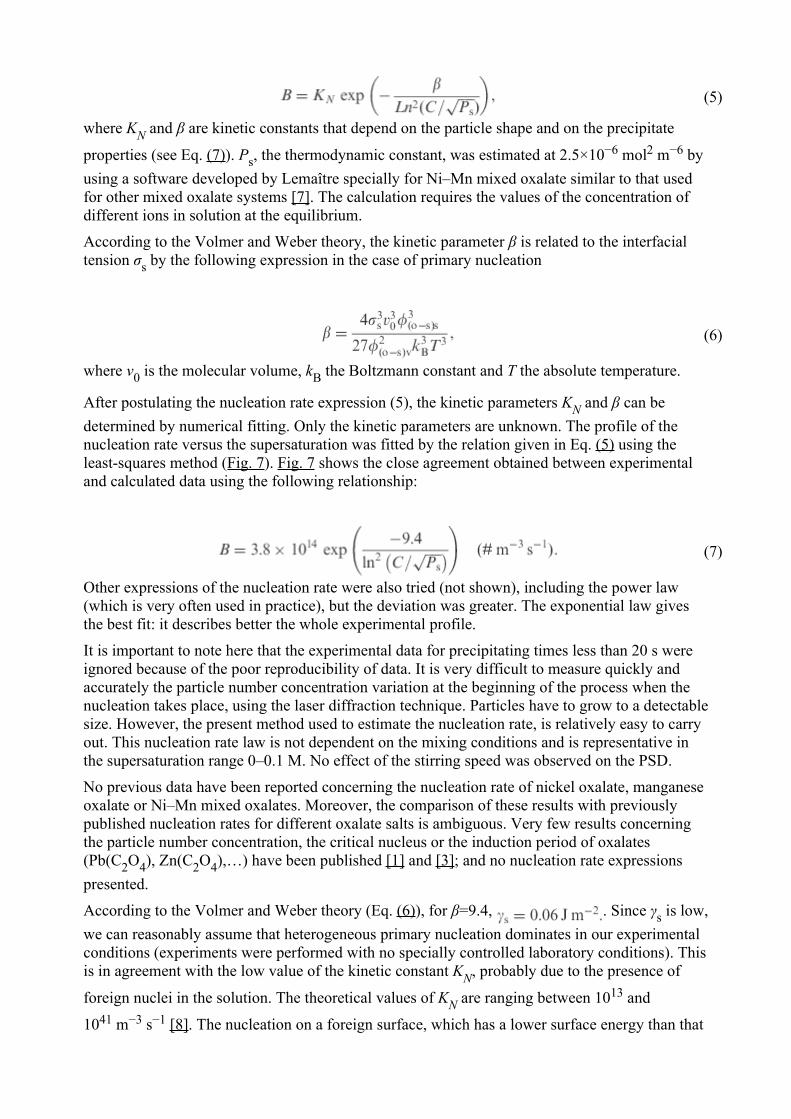
(5)
where KN and β are kinetic constants that depend on the particle shape and on the precipitate
properties (see Eq. (7)). Ps, the thermodynamic constant, was estimated at 2.5×10⁻⁶ mol2 m−6 by using a software developed by Lemaître specially for Ni–Mn mixed oxalate similar to that used for other mixed oxalate systems [7]. The calculation requires the values of the concentration of different ions in solution at the equilibrium.
According to the Volmer and Weber theory, the kinetic parameter β is related to the interfacial tension σs by the following expression in the case of primary nucleation
(6)
where v0 is the molecular volume, kB the Boltzmann constant and T the absolute temperature.
After postulating the nucleation rate expression (5), the kinetic parameters KN and β can be determined by numerical fitting. Only the kinetic parameters are unknown. The profile of the nucleation rate versus the supersaturation was fitted by the relation given in Eq. (5) using the least-squares method (Fig. 7). Fig. 7 shows the close agreement obtained between experimental and calculated data using the following relationship:
(7)
Other expressions of the nucleation rate were also tried (not shown), including the power law (which is very often used in practice), but the deviation was greater. The exponential law gives the best fit: it describes better the whole experimental profile.
It is important to note here that the experimental data for precipitating times less than 20 s were ignored because of the poor reproducibility of data. It is very difficult to measure quickly and accurately the particle number concentration variation at the beginning of the process when the nucleation takes place, using the laser diffraction technique. Particles have to grow to a detectable size. However, the present method used to estimate the nucleation rate, is relatively easy to carry out. This nucleation rate law is not dependent on the mixing conditions and is representative in the supersaturation range 0–0.1 M. No effect of the stirring speed was observed on the PSD.
No previous data have been reported concerning the nucleation rate of nickel oxalate, manganese oxalate or Ni–Mn mixed oxalates. Moreover, the comparison of these results with previously published nucleation rates for different oxalate salts is ambiguous. Very few results concerning the particle number concentration, the critical nucleus or the induction period of oxalates (Pb(C2O4), Zn(C2O4),…) have been published [1] and [3]; and no nucleation rate expressions presented.
According to the Volmer and Weber theory (Eq. (6)), for β=9.4, . Since γs is low, we can reasonably assume that heterogeneous primary nucleation dominates in our experimental conditions (experiments were performed with no specially controlled laboratory conditions). This is in agreement with the low value of the kinetic constant KN, probably due to the presence of
foreign nuclei in the solution. The theoretical values of KN are ranging between 1013 and
1041 m−3 s−1 [8]. The nucleation on a foreign surface, which has a lower surface energy than that
of a new solute particle, takes place at a lower supersaturation.
3.3. Crystal growth rate
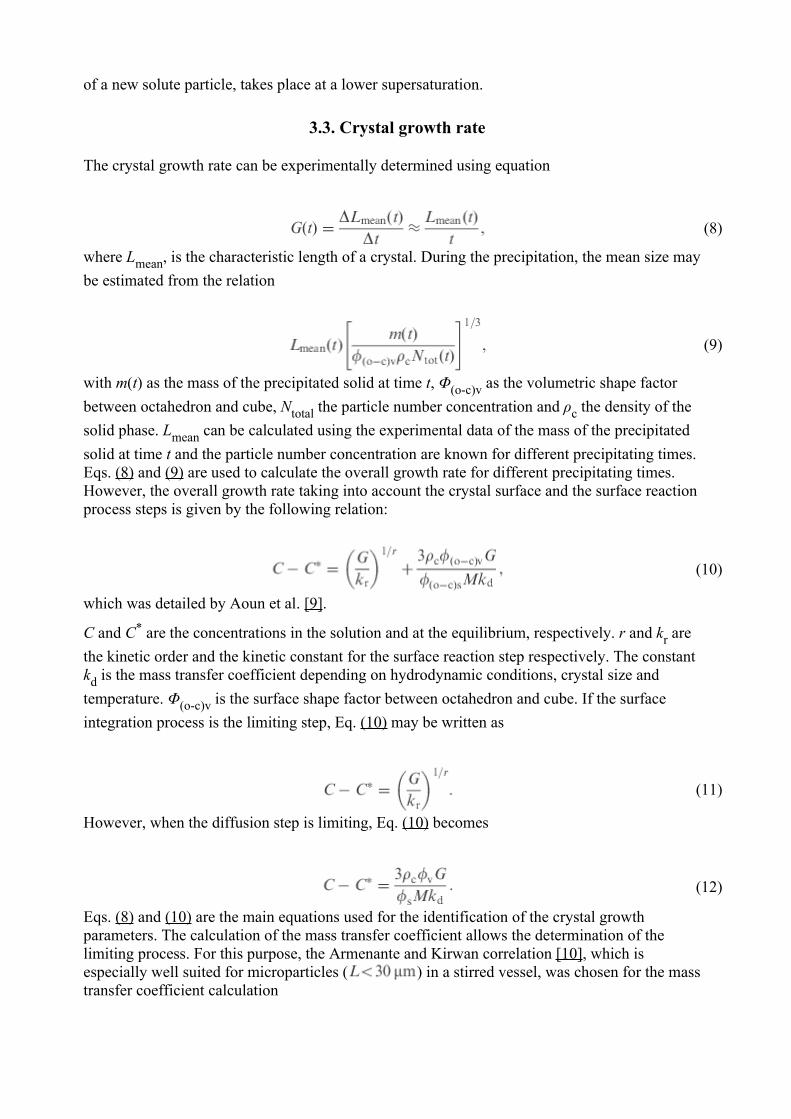
The crystal growth rate can be experimentally determined using equation
(8)
where Lmean, is the characteristic length of a crystal. During the precipitation, the mean size may be estimated from the relation
(9)
with m(t) as the mass of the precipitated solid at time t, Φ(o-c)v as the volumetric shape factor between octahedron and cube, Ntotal the particle number concentration and ρc the density of the solid phase. Lmean can be calculated using the experimental data of the mass of the precipitated solid at time t and the particle number concentration are known for different precipitating times. Eqs. (8) and (9) are used to calculate the overall growth rate for different precipitating times. However, the overall growth rate taking into account the crystal surface and the surface reaction process steps is given by the following relation:
(10)
which was detailed by Aoun et al. [9].
C and C* are the concentrations in the solution and at the equilibrium, respectively. r and kr are the kinetic order and the kinetic constant for the surface reaction step respectively. The constant kd is the mass transfer coefficient depending on hydrodynamic conditions, crystal size and temperature. Φ(o-c)v is the surface shape factor between octahedron and cube. If the surface integration process is the limiting step, Eq. (10) may be written as
(11)
However, when the diffusion step is limiting, Eq. (10) becomes
(12)
Eqs. (8) and (10) are the main equations used for the identification of the crystal growth parameters. The calculation of the mass transfer coefficient allows the determination of the limiting process. For this purpose, the Armenante and Kirwan correlation [10], which is especially well suited for microparticles ( ) in a stirred vessel, was chosen for the mass transfer coefficient calculation
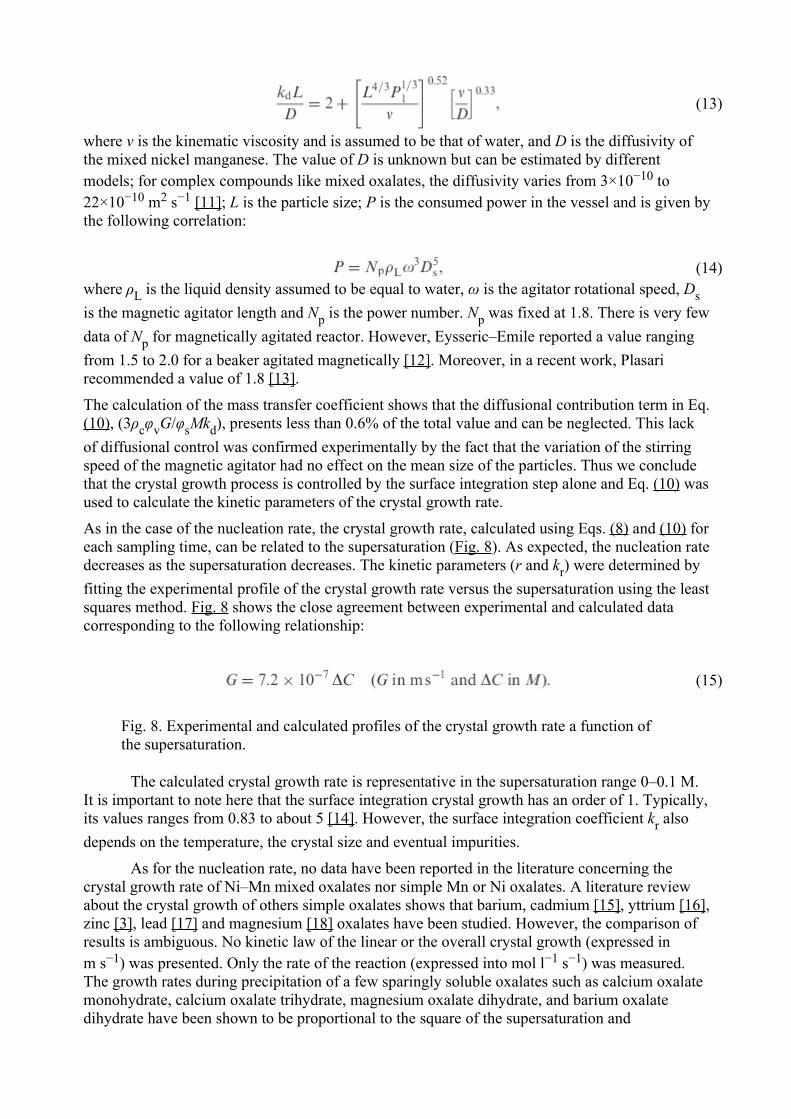
(13)
where ν is the kinematic viscosity and is assumed to be that of water, and D is the diffusivity of the mixed nickel manganese. The value of D is unknown but can be estimated by different models; for complex compounds like mixed oxalates, the diffusivity varies from 3×10⁻¹⁰ to 22×10−10 m2 s−1 [11]; L is the particle size; P is the consumed power in the vessel and is given by the following correlation:
(14)where ρL is the liquid density assumed to be equal to water, ω is the agitator rotational speed, Ds is the magnetic agitator length and Np is the power number. Np was fixed at 1.8. There is very few data of Np for magnetically agitated reactor. However, Eysseric–Emile reported a value ranging from 1.5 to 2.0 for a beaker agitated magnetically [12]. Moreover, in a recent work, Plasari recommended a value of 1.8 [13].
The calculation of the mass transfer coefficient shows that the diffusional contribution term in Eq. (10), (3ρcφvG/φsMkd), presents less than 0.6% of the total value and can be neglected. This lack of diffusional control was confirmed experimentally by the fact that the variation of the stirring speed of the magnetic agitator had no effect on the mean size of the particles. Thus we conclude that the crystal growth process is controlled by the surface integration step alone and Eq. (10) was used to calculate the kinetic parameters of the crystal growth rate.
As in the case of the nucleation rate, the crystal growth rate, calculated using Eqs. (8) and (10) for each sampling time, can be related to the supersaturation (Fig. 8). As expected, the nucleation rate decreases as the supersaturation decreases. The kinetic parameters (r and kr) were determined by fitting the experimental profile of the crystal growth rate versus the supersaturation using the least squares method. Fig. 8 shows the close agreement between experimental and calculated data corresponding to the following relationship:
(15)
Fig. 8. Experimental and calculated profiles of the crystal growth rate a function of the supersaturation.
The calculated crystal growth rate is representative in the supersaturation range 0–0.1 M. It is important to note here that the surface integration crystal growth has an order of 1. Typically, its values ranges from 0.83 to about 5 [14]. However, the surface integration coefficient kr also depends on the temperature, the crystal size and eventual impurities.
As for the nucleation rate, no data have been reported in the literature concerning the crystal growth rate of Ni–Mn mixed oxalates nor simple Mn or Ni oxalates. A literature review about the crystal growth of others simple oxalates shows that barium, cadmium [15], yttrium [16], zinc [3], lead [17] and magnesium [18] oxalates have been studied. However, the comparison of results is ambiguous. No kinetic law of the linear or the overall crystal growth (expressed in m s−1) was presented. Only the rate of the reaction (expressed into mol l−1 s−1) was measured. The growth rates during precipitation of a few sparingly soluble oxalates such as calcium oxalate monohydrate, calcium oxalate trihydrate, magnesium oxalate dihydrate, and barium oxalate dihydrate have been shown to be proportional to the square of the supersaturation and
independent of the fluid dynamics of the systems. Two is the most common growth kinetic order value for sparingly soluble substances. In contrast, the growth kinetic order of strontium and cadmium oxalates were reported to be unity whilst lead oxalate shows a third-order dependence. The growth of the barium oxalate is governed by surface reaction. Thus, the growth rate order of unity for the present mixed oxalate system suggests a behaviour similar to the cadmium and strontium systems.
4. Conclusions
The precipitation kinetics of Ni–Mn mixed oxalate has been studied via agitated batch experiments. The nucleation rate was found to obey to an exponential law and from surface energy considerations is consistent with a primary heterogeneous nucleation mechanism in the concentration range studied up to 0.1 mol l−1. The order of crystal growth rate has been shown to follow a first-order law with respect to supersaturation, indicating that the process is probably limited by a surface integration step. These basic data can now be used in, for example population balance modelling, to help predict precipitation conditions that should enable improved precipitate properties.
Acknowledgements
Project funded by the E.U.: No. G5RDT-CT-1999-00123. The authors are gratefully acknowledged to Dr. Paul Bowen for fruitful discussions and Mr. Floure from MALVERN INSTRUMENTS in Toulouse for the particle size analysis.
References
O. Söhnel and J. Garside, Precipitation: Basic Principles and Industrial Applications, Butterworth-Heinemann, Great Britain (1992).
S. Fritsch, J. Sarrias, M. Brieu, J.J. Couderc, J.L. Baudour, E. Snoeck and A. Rousset, Solid State Ionics 109 (1998), p. 229.
E.K. Kirkova and M. Djarova, Industrial Crystallization 78 (1979), p. 81.
S. Guillemet-Fritsch, M. Aoun-Habbache, J. Sarrias, A. Rousset, N. Jongen, M. Donnet, P. Bowen and J. Lemaître, Solid State Ionics 171 (2004), p. 135.
R.W. Rousseau, K.K. Li and W.L. Mc Cabe, A.I.Ch.E. Symp. Ser. 72 (1976), p. 48.
J.A. Dirksen and T.A. Ring, Chem. Eng. Sci. 46 (1991), p. 2389.
S. Rubattel, J. Lemaître, P. Bowen and T.A. Ring, J. Crystal Growth 135 (1994), p. 135.
D. Kashcheiv, Nucleation: Basic Theory and Application, Butterworth-Heimann, Oxford (2000).
M. Aoun, E. Plasari, R. David and J. Villermaux, Chem. Eng. Sci. 54 (1999), p. 1161.
P.M. Armenante and D.J. Kirwan, Chem. Eng. Sci. 44 (1989), p. 2781.

A. Mersmann, Crystallization Technology Handbook, Marcel Dekker Inc., New York (1995).
Eysseric-Emile, Thesis, INPL, Nancy, 1994.
E. Plasari, private communication.
J. Garside, R.J. Van Rosmalen and P. Bennema, J. Crystal Growth 29 (1975), p. 353.
S.T. Liu and G.H. Nancolas, J. Inorg. Nucl. Chem. 38 (1976), p. 515.
. Sung, J.S. Kim, W.S. Kim, I. Hirasawa and W.S. Kim, J. Crystal Growth 235 (2002), p. 529.
F. Grases, J. Ruiz and A. Costa-Bauza, J. Colloid Interface Sci. 155 (1993), p. 265.
R.H. Doremus, Croat. Chem. Acta 42 (1970), p. 293.
Corresponding author. Tel.: +33 5 61 55 62 83; fax: +33 5 61 55 61 63.
Original text : Elsevier.com