investigation of physiologic uctuations in resting-state
TRANSCRIPT

Investigation of physiologic fluctuations in resting-state fMRI as
biomarkers of cerebral small vessel disease
Joana Filipa Canelas [email protected]
Instituto Superior Tecnico, Lisboa, Portugal
November 2018
Abstract
Cerebral small vessel disease (SVD) is among the most prevalent neurological disorders. It refersto pathological processes affecting brain’s small vessels, leading to cognitive decline and functionalloss in the elderly. The investigation of brain’s spontaneous fluctuations using resting-state functionalmagnetic resonance imaging is increasingly being used to assess alterations in brain activity relatedwith cerebrovascular pathologies. In this work, a characterization of different measures of spontaneousoscillations in blood oxygenation level-dependent (BOLD) signal was conducted and their relationshipwith SVD patients’ neuropsychological evaluations was assessed. Functional data from each subjectwas pre-processed and metrics of spontaneous BOLD signal fluctuations were computed: coefficient ofvariation, physiological fluctuations, amplitude of low frequency fluctuations (ALFF) and fractional ALFF(fALFF). A comparison between metrics was performed in a group of healthy controls. Based on theresults of this comparison, the following metrics were selected for the subsequent analyses: ALFF (0.01-0.1Hz), fALFF1 (0.01-0.023 Hz), fALFF2 (0.023-0.073 Hz) and fALFF3 (0.073-0.2 Hz). In SVD patients,ALFF was found to be significantly lower in white matter hyperintensities compared to normal appearingwhite matter (NAWM). Multiple linear regression analyses demonstrated significant correlations betweenprocessing speed in SVD patients and the following metrics: fALFF2 and fALFF3 in NAWM and ALFFin grey matter and NAWM. Regarding executive function, and attention and working memory, significantcorrelations were found with a group of metrics and also with certain demographic and structural imagingcovariates. The results suggest that measures of spontaneous BOLD fluctuations might aid in the detectionof early changes in the cognitive function of SVD patients and therefore support imaging biomarkers ofthe disease.Keywords: small vessel disease, resting-state functional magnetic resonance imaging, amplitude oflow-frequency fluctuations, physiologic fluctuations, spontaneous brain oscillations
1. Introduction
The term cerebral small vessel disease (SVD) refersto a variety of pathological processes that affect thesmall arteries, arterioles, venules, and capillaries ofthe brain [1], along with the subsequent damagecaused in the white and deep grey matter, which arecrucial to the normal brain function [2]. This is avery common disease, being the lead cause of cogni-tive decline and functional loss in the elderly.
Small vessels are currently defined as all vascularstructures with diameters between around 5 µm to2 mm in the brain parenchyma or the subarachnoidspace [1, 3]. The proper functioning of these ves-sels is crucial to ensure the most essential function ofthe cerebral vasculature - providing oxygen and glu-cose to the brain [2]. SVD is characterized by a widerange of clinical manifestations, from neuropsycho-logical impairments such as depression, cognitive de-cline and dementia, to physical disabilities includingmotor and gait disturbances, urinary incontinence,dysphagia, and progressive loss of autonomy to per-
form daily activities [1–3].
Amongst the different types of SVD, arteri-olosclerosis and cerebral amyloid angiopathy are themost prevalent. Nonetheless, within the heredi-tary types, cerebral autosomal dominant arteriopa-thy with subcortical infarcts and leukoencephalopa-thy (CADASIL) is the most common [4].
The nature of brain lesions derived from SVD canbe hemorragic, such as hemorrages and microbleeds,or ischemic, such as lacunar infarcts and white mat-ter lesions [5]. Other mechanisms involving blood-brain barrier damage, oligodendrocytes apoptosis orlocal inflammation can also be accounted as ischemicforms of SVD [1]. As small vessels are not easily visu-alized in vivo, neuroimaging techniques can be usedfor the characterization of brain lesions derived frompathologies affecting the small vessels. Due to itshigher specificity and sensitivity, magnetic resonanceimaging (MRI) is currently the most used techniqueto image most of SVD manifestations.
In addition, measures of the resting brain’s func-
1

tion using resting-state functional MRI (rs-fMRI)such as functional connectivity or the amplitudeof spontaneous BOLD oscillations might also pro-vide relevant information about hemodynamic im-pairment associated with SVD, providing potentialbiomarkers to assess this pathology [6]. Consider-ing that vascular changes might develop years beforeSVD symptoms, the use of sensitive measures of brainvessels’ hemodynamic may prove useful in an earlycharacterisation of SVD pathological changes [5].
Since the discovery of the BOLD effect by Ogawaand colleages in 1990 [7], fMRI studies have beenevolving as to become one of the most important toolsto investigate the functioning of the human brainin a non-invasive way. This technique relies on themetabolic demands associated with neuronal activityto produce a map of the different levels of activationwithin the brain. The most common fMRI contrast,BOLD, is based on the sensitivity of the MRI sig-nal intensity to the level of oxygenated blood on thebrain.
Dynamic brain activity as measured through hemo-dynamic approaches such as BOLD signal reflects sig-nal changes correlated with neuronal activity, namelyvariations in blood flow, oxygenation and volume.However, other physiological processes might affectthe measured signal as well, contributing to the ob-served oscillations measured through fMRI [8, 9]. Inaddition, non-physiological sources of noise derivedfrom the magnetic resonance scanner might arise andalter the fMRI signal; these include thermal noise andvery low frequency drifts caused by hardware insta-bility [10, 11].
The investigation of rs-fMRI’s timeseries hasbrought a particular interest in BOLD signal’slow frequency fluctuations (∼0.01-0.1 Hz), althoughthe origin of these fluctuations is still not com-pletely understood. Nevertheless, studies involvingfMRI and electroneurophysiological recordings indi-cate that low frequency oscillations are associatedwith spontaneous neuronal activity, thus containingrelevant information about brain’s intrinsic activity[12–14]. Furthermore, physiological processes suchas cardiac (∼1 Hz) and respiratory (∼0.3 Hz) oscilla-tions also play a role in the BOLD signal [15]. Addi-tionally, there are other physiological processes thatexhibit low frequency oscillations (∼0.1 Hz), such ascardiac rate variability, respiratory volume per unittime variability and pressure of end-tidal CO2 fluc-tuations [16, 17]. Another physiological process thatexhibits low frequency oscillations (∼0.1 Hz) is va-somotion. These fluctuations derive from the con-traction of arterioles’ smooth muscle cells as a conse-quence of local vasodilatation [11, 18, 19]. Likewise,the frequency of these fluctuations is characteristicof oscillations in systemic blood pressure known asMayer waves [20].
The study of spontaneous fluctuations in rs-fMRI isincreasingly being used to assess alterations in brain
activity and physiology of patients suffering patho-logical neurological processes compared to healthysubjects’ normal brain activity. Some studies haveaddressed these fluctuations using approaches basedboth on their whole spectrum and on a frequency-based level. SVD has not been thoroughly addressedin this context. Nonetheless, differences in physio-logical fluctuations have been found in patients withSVD and CADASIL compared to healthy controls us-ing a metric based on the standard deviation of theBOLD signal and a metric called amplitude of low-frequency fluctuations (ALFF) based on the powerof the signal within the range of low-frequency os-cillations (0.01-0.8 Hz) [21, 22]. Furthermore, otherrs-fMRI studies on pathologies similar to SVD, suchas leukoaraiosis and subcortical ischemic vascular de-mentia, have reported differences between healthyand diseased cohorts in ALFF values of certain brainregions as well as correlations of this measures withcognitive scores [23–26]. These metrics are simple tocalculate and provide information that might be use-ful in comparisons between brain regions as well asbetween healthy and pathological populations, withthe potential to become biomarkers for neurologicaldisorders such as SVD.
In this study, the main goal was to investigateif physiologic fluctuations of rs-fMRI could be usedas a biomarker of SVD. A large part of this workconcerned the characterization of different techniquesmeasuring the amplitude of brain’s spontaneous os-cillations in order to better understand the origin ofBOLD fluctuations. The association between thesemeasures and SVD patients’ neuropsychological eval-uations could provide new insights on how rs-fMRIcould provide information about functional alter-ations caused by SVD.
2. Methods
2.1. Participants and data acquisition
Imaging and physiological data were gathered in thescope of the project NeuroPhysIm at Hospital da Luzbetween 2015 and 2017. The patients’ diagnosis wasdefined through clinical and neuropsychological eval-uation by neurologists and neuropsychologists at Hos-pital Egas Moniz.
The subjects taking part on this project were com-prised of three groups: 11 (9 females and 2 males)sporadic SVD (sSVD) patients, 6 (4 females and 2males) CADASIL patients, and 12 (6 females and 6males) healthy controls (HC), making a total of 29individuals. The ages of the groups were ranged be-tween 37 and 66 years (mean=52.1±7 years old) forthe sSVD group, 34 and 61 years (47.2±11 years old)for the CADASIL group, and between 37 and 59 years(52±6 years old) for the HC group.
The MRI data, acquired on a 3T Siemens VerioMRI system, were composed by a set of structuraland functional images, whereby the ones analysedin this study were T1-weighted images obtained us-
2

ing an MPRAGE sequence (TR=2250 ms, TE=2.26ms, flip angle=9°, voxel size=1x1x1 mm3, imagesize=240x256x144 mm3, field of view=240x256x144mm3), T2-weighted images obtained using a fluidattenuation inversion recovery (FLAIR) sequence(TR=8500 ms, TE=97 ms, flip angle=150°, voxelsize=0.69x0.69x3 mm3, image size=256x320x47mm3, field of view=179x224x155 mm3), and Resting-State BOLD fMRI images collected using a gradient-echo EPI sequence (TR=2500 ms, TE=30 ms,flip angle=90°, voxel size=3.5x3.5x3 mm3, imagesize=64x64x40 mm3, field of view=224x224x120mm3). The resting-state fMRI acquisition consistedof having the subjects lying with their eyes closedwithout falling asleep and with the least possiblemovement.
End-tidal carbon dioxide pressure (PETCO2) ofeach exhalation was monitored using a capnograph(Cap10 Capnograph, Medlab GmbH).
2.2. Image analysis
PETCO2’s signal was analysed using matlab(https://www.mathworks.com). For each subject,two different quantities were obtained from this data:frequency of the signal (obtained through a FastFourier Transform (FFT) and respective power spec-trum) and average of the maximum peaks.
Analyses of the imaging data were implementedusing FSL tools (https://fsl.fmrib.ox.ac.uk/fsl). Thefirst step while pre-processing the structural imageswas the skull stripping and brain extraction usingFSLs Brain Extraction Tool1 (BET ).
The registration of the FLAIR images to theMPRAGE’s space was performed using FMRIBs Lin-ear Image Registration Tool (FLIRT ) with a tri-linear interpolation2. The registration of the func-tional images to the MPRAGEs space was conductedusing FLIRT, more particularly the Boundary-Based Registration method. The MPRAGE im-ages were also normalized to the standard spaceMontreal Neurologic Institute (MNI-152, 2x2x2mm3) using Advanced Normalization Tools (ANTs,http://stnava.github.io/ANTs/).
In order to segment structural images into differ-ent brain tissues, FMRIBs Automated SegmentationTool (FAST ) and FMRIBs Integrated Registration &Segmentation Tool (FIRST ) were used. White mat-ter lesions (WML) were manually identified and seg-mented in the FLAIR images. This procedure, aswell as the calculation of the normalised white mat-ter lesion volume (nLV) and normalised brain volume(nBV) from the T1-weighted (MPRAGE) structuralimages had already been previously performed in thescope of the project NeuroPhysIm.
Five brain regions masks were obtained for eachpatient using FSLs command fslmaths: (i) lateral
1This pre-processing step had been previously performed inthe scope of the project NeuroPhysIm.
2This pre-processing step had been previously performed inthe scope of the project NeuroPhysIm.
ventricles (LV), obtained from the intersection be-tween the cerebrospinal fluid (CSF) mask resultingfrom FAST s segmentation and a ventricles mask ob-tained from the MNI atlas3; (ii) white matter hyper-intensities (WMH), which resulted from the subtrac-tion of the LV mask to the WMLs segmented from theFLAIR image3; (iii) subcortical grey matter (sGM),which is the result of the output of FIRST s segmen-tation without the brainstem, the CSF and the WMHmask; (iv) cortical grey matter (cGM), obtained bysubtracting from the grey matter (GM) segmentedusing FAST the CSF, all the subcortical structuresand the WMHs; and (v) NAWM, which resulted fromthe subtraction of the brainstem and all the above-mentioned masks (i to iv) to the white matter (WM)obtained during FAST s segmentation.
Pre-processing of functional images
Firstly, EPI distortions due to magnetic field inho-mogeneities were corrected using a B0 field mappingapproach (FUGUE toolbox). This was performedpreviously by another member of the project Neu-roPhysIm.
The following steps of the resting-state BOLDfMRI images pre-processing were performed usingthe FSL tools. The several stages included in thisprocedure were: (i) removal of non-brain tissues us-ing BET ; (ii) head motion correction using FSLtool MCFLIRT (FLIRT adjusted specifically to fM-RIs motion correction); (iii) spatial smoothing us-ing a Gaussian kernel of 5 mm of full-width at half-maximum (FWHM).
In addition, it was conducted a detection of motionoutliers as timepoints in the dataset that have beenaltered by large motion using FSL tool FSL MotionOutliers. A general linear model (GLM) was used inorder to remove the outliers detected and the motionregressors estimated with MCFLIRT ; this step wasperformed using FSL tool FEAT.
Lastly, matlab’s function polyfit was used to finda second-order polynomial fit for each voxels time-course and extracting it from the correspondent vox-els BOLD signal, thus removing low-frequency arti-facts associated with scanner drifts.
Metrics of spontaneous BOLD signal fluctuations
In order to explore the spontaneous BOLD signalfluctuations in different brain regions, the processedimages were converted from NIfTI to mat format us-ing nifti tools matlab toolbox.
Whole spectrum metrics
A physiological noise metric, PF, was computedvoxel-wise. The method used was previously de-scribed by Yacoub et al. [27], and used by Makedonovet al. [21], and follows Equation 1:
3These two masks were previously registered to theMPRAGE space from the MNI and FLAIR spaces, respec-tively.
3

PF =√σEPI
2 − σtherm2, (1)
where PF is the standard deviation due to physio-logical processes, σEPI is the standard deviation overtime of the signal in each pixel belonging to the brain,and σtherm is the standard deviation due to thermalnoise.
To compute the thermal noise, an 8x8 voxel ROIoutside the brain was selected from a corner of oneof rs-fMRI image’s slices and then the standard devi-ation (σtherm) was computed for each subject. Thecalculation of σEPI was computed as the temporalstandard deviation along the 155 timepoints of eachvoxel’s timecourse. The PF metric was then normal-ized by dividing voxel-wise the values obtained by themean signal intensity in each voxel, thus creating amap of physiological fluctuations within the brain.
Frequency-based metricsTwo metrics were computed in order to investigate
rs-fMRI BOLD signal from the perspective of differ-ent frequency ranges: the amplitude of low-frequencyfluctuations (ALFF) and the fractional amplitude oflow-frequency fluctuations (fALFF).
The procedure was performed voxel-wise and in-volved several steps: (i) the conversion of the restingstate BOLD timeseries to percent signal change; (ii)the calculation of the signal’s FFT; (iii) the computa-tion of the power spectrum (PS) as the square of theamplitude of each frequency component divided bythe length of the signal; (iv) finally, ALFF is givenby the calculation of the square root of the PS fora specific frequency range (Equation 2, the differentfrequency ranges used are displayed in Figure 1). ForfALFF, the normalization was conducted by dividingALFF values by the total power (Equation 3), whichcorresponds to the square root of the PS across theentire detectable frequency range (0-0.2 Hz).
ALFFk:fk∈fr
=
∑k
√|FFT |2
N
nk(2)
fALFFk:fk∈fr
=
ALFFk:fk∈fr
ALFFm:fm∈[0:fmax]
, (3)
where fmax = 0.2Hz is the maximum frequency sam-pled (Nyquist frequency), fr is the interval of thedesired frequency range, k are the frequency bins as-sociated with that frequency range, N = 155 andcorresponds to the length of the signal, and nk is thenumber of bins associated with the mentioned fre-quency range.
Low frequency fluctuations were initially studiedas belonging to the frequency range f ∈ [0.01 : 0.1]Hz. However, ALFF and fALFF were also computedon three different frequency bands, which were desig-nated band 1, band 2 and band 3. The classificationof these metrics can be consulted in Table 1.
Figure 1: Scheme of the frequency ranges used for amplitudeof low-frequency fluctuations’ metrics computation.
Table 1: Nomenclature given to ALFF and fALFF’s metricsbased on their different frequency ranges.
Frequencyrange (Hz)
ALFFmetric
fALFFmetric
Low-frequencies
0.01-0.1 ALFF fALFF
Band 1 0.01-0.023 ALFF1 fALFF1Band 2 0.023-0.073 ALFF2 fALFF2Band 3 0.073-0.2 ALFF3 fALFF3
To sum up, nine metrics were computed: PF,ALFF, ALFF1, ALFF2, ALFF3, fALFF, fALFF1,fALFF2 and fALFF3. Moreover, mean values ofthese metrics were calculated for each of the masksobtained: cGM, sGM, LV, NAWM and WMH for thesubjects with sSVD and CADASIL; and cGM, sGM,LV and WM for the healthy controls.
2.3. Statistical analysis
Metrics comparison
Voxel-wise analysis: A voxel-wise comparisonbetween metrics was performed using only data fromthe HC group. Firstly, metrics’ values were trans-formed to z-scores. Differences between metrics wereassessed through a two-sample paired t-test usingFSL tools GLM and randomise.
Region-of-interest analysis: The Pearson cor-relation between metrics region-wise were determinedusing matlab’s function corr. These data providedinformation on which metrics should be used in sub-sequent analyses.
Group comparison
Group differences were assessed using FSL toolsGLM and randomise. Additionally, boxplots werecomputed in order to better understand the distribu-tion of the metrics’ values within each group.
SVD group analysis
A final set of analyses was conducted in the SVDgroup in order to assess the power of the met-rics derived in this work as predictors of cogni-tive decline. Several covariates were introduced inthe study, including patients’ age, gender, group(sSVD/CADASIL), nBV, nLV and PETCO2. Re-garding the metrics, only the ones selected based onvoxel-wise and region-of-interest analyses performedwere included. Moreover, for simplicity only threeROIs were used, namely GM (resultant from themerging cGM and sGM), NAWM and WMH.
4

Furthermore, a t-test was conducted on the se-lected metrics in order to assess if there were signif-icant differences between each of the metrics’ valuesin NAWM and WMH of SVD patients.
Lastly, the relationship between patients’ physio-logic fluctuations and their levels of cognitive func-tion was investigated trough multiple linear regres-sion (MLR) analyses using R statistics software(https://www.r-project.org). SVD patients under-went neuropsychological evaluations comprised of aset of cognitive tests4. Four cognitive domains wereassessed: executive function, processing speed, atten-tion and working memory, and learning and long-term memory. Dysfunctions at these levels are fre-quent in SVD patients, particularly the former two,which are more frequent and may be detectable evenin early stages of the disease [28]. Each cognitivedomain was tested separately and considered as thedependent or response variable, while the metricsand covariates were assumed to be the independentor explanatory variables, also known as predictors.The variables were first converted to z-scores and thenormality of their distributions was tested using theShapiro-Wilk test. In the direction of obtaining thebest set of predictors explaining the dependent vari-able, a stepwise model was used.
3. Results and Discussion
3.1. Metrics comparison
Whole-brain analysis
Regarding the mean map of ALFF presented inFigure 2, increased values surrounding the brain canbe observed, particularly in the upper and lower axialslices of the brain. This can indicate that this met-ric is sensitive to movement since motion can causealterations in the signal of voxels. Therefore, thosevoxels which undergo higher amounts of movementare more prone to changes in the BOLD signal. En-hanced values of PF are also observed near areas withhigher pulsatility, both from arteries and the CSF,particularly around the brainstem. In fact, it hasbeen shown that the amplitude of signal variation re-lated to cardiac effects is more pronounced aroundthe major blood vessels [29]. Moreover, the cardiaccycle plays an important role in blood and CSF flowwhich, along with cerebral blood volume and pressurefluctuations, causes cardiac-related motion artifacts.
Results regarding the mean map of PF’s metric(not displayed) suggest a close resemblance betweenALFF and PF’s spatial distributions - these two met-rics seem to be affected by the same mechanisms.
Results concerning fALFF’s mean map are dis-played in Figure 3. Comparing to ALFF’s mean map,it is noticeable a suppression of ALFF’s increased val-ues in the ventricles, brainstem and borders of thebrain. The total power of each voxel, correspondingto the ALFF metric applied to the entire frequency
4These data were analysed prior to the present study byanother member of the project NeuroPhysIm.
0.30 1.00
Figure 2: Mean map of ALFF metric for the HC group.
1.100.90
Figure 3: Mean map of fALFF metric for the HC group.
spectrum, includes physiologic fluctuations that arisefrom cardiac and respiratory sources. Consideringthat fALFF is a normalization of ALFF with re-spect to the total power, the results observed suggestthat non-neuronal fluctuations detected with ALFFare largely suppressed with the fALFF methodol-ogy. These results suggest an increased sensitivityof this metric to distinguish neuronal activity fromother physiologic processes, merely based on BOLDsignal’s characteristics in terms of the frequency do-main. Furthermore, the total power by which ALFFis divided in order to compute fALFF differs betweeneach voxel, which could explain spatial distributions’differences observed between these two metrics.
Significant differences between metricsPF>ALFF
ALFF>PF
Figure 4: Statistical maps corresponding to 1-p of spatial re-gions with significant differences between PF and ALFF. Redto yellow (0.95 to 1.00) represents regions where PF>ALFF;blue to light blue (0.95 to 1.00) represents regions whereALFF>PF. Significant differences were considered for a cor-rected p-value<0.05.
In Figure 4 can be observed significant differ-ences between PF and ALFF metrics. The yel-low colour represents the areas where the differencebetween PF and ALFF are more significant. In-creased PF values compared to ALFF were foundmainly in the brainstem, lateral ventricles and someWM areas, as well as the thalamus. A possible in-terpretation for this result is the fact that, as PF
5
measures variations in the entire frequency spec-trum of the BOLD signal (as opposed to ALFF thatonly accounts for information contained in the low-frequencies (0.01-0.1 Hz)), this metric might containinformation about higher-frequencies. Since highlyvascularised areas are associated with increased car-diac pulsations, which in turn are related to higherfrequencies in the BOLD signal, PF metric could bemeasuring higher-frequencies that are not detectedusing ALFF. It should be noted that areas near thebrainstem and midbrain, in addition to their highvascularisation, are surrounded by CSF’s pulsatileflow and are also connected to the lungs, which con-tributes to increased signal variations [9]. Areaswhere ALFF presented significant increased valuescompared to PF are located in more superior axialslices and include mainly cortical structures such asthe lateral occipital cortex, cingulate gyrus and pre-cuneous cortex. Following the same logic, this couldbe explained by the increased sensitivity of ALFF todetect lower-frequencies associated with neuronal ac-tivity rather than higher-frequency fluctuations mea-sured with PF’s metric.
ALFF>fALFF
fALFF>ALFF
Figure 5: Statistical maps corresponding to 1-p of spa-tial regions with significant differences between ALFF andfALFF. Red to yellow (0.95 to 1.00) represents regions whereALFF>fALFF; blue to light blue (0.95 to 1.00) represents re-gions where fALFF>ALFF. Significant differences were con-sidered for a corrected p-value<0.05.
Figure 5 displays significant differences betweenALFF and fALFF. This map presents great simi-larities with the one obtained for PF and fALFF(not displayed here). Significantly reduced fALFFvalues compared with ALFF (and PF) were foundmainly in the brainstem, lateral ventricles and someWM areas, as well as subcortical structures suchas the thalamus and pallidum. Areas that havegreater vascularisation, around the middle cerebralartery, present significantly increased ALFF valuescompared to fALFF, suggesting that the former ismore sensitive to non-neuronal fluctuations than thelatter. These results are consistent with the ones re-ported by Zuo and colleagues [30], who found thatALFF was considerably higher than fALFF near largeblood vessels and in areas contiguous to CSF. Regionswhere fALFF is significantly greater than ALFF aremainly related with cortical structures. The observeddominance of cortical grey matter in fALFF’s mea-surements suggests that a normalized index of low-frequency fluctuations can prove more specific to thestudy of neuronal activity. Results also show that
gross pulsatile effects that are captured with ALFFbecome mitigated using fALFF.
Comparison between frequency bands
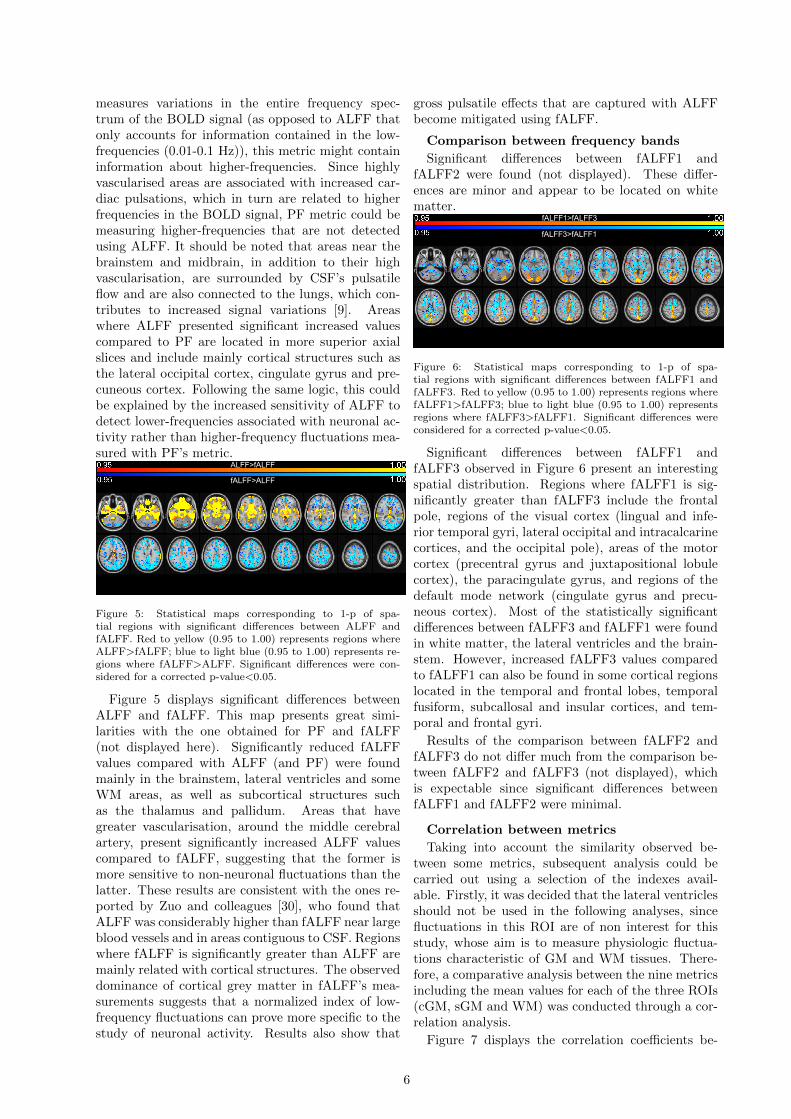
Significant differences between fALFF1 andfALFF2 were found (not displayed). These differ-ences are minor and appear to be located on whitematter.
fALFF1>fALFF3
fALFF3>fALFF1
Figure 6: Statistical maps corresponding to 1-p of spa-tial regions with significant differences between fALFF1 andfALFF3. Red to yellow (0.95 to 1.00) represents regions wherefALFF1>fALFF3; blue to light blue (0.95 to 1.00) representsregions where fALFF3>fALFF1. Significant differences wereconsidered for a corrected p-value<0.05.
Significant differences between fALFF1 andfALFF3 observed in Figure 6 present an interestingspatial distribution. Regions where fALFF1 is sig-nificantly greater than fALFF3 include the frontalpole, regions of the visual cortex (lingual and infe-rior temporal gyri, lateral occipital and intracalcarinecortices, and the occipital pole), areas of the motorcortex (precentral gyrus and juxtapositional lobulecortex), the paracingulate gyrus, and regions of thedefault mode network (cingulate gyrus and precu-neous cortex). Most of the statistically significantdifferences between fALFF3 and fALFF1 were foundin white matter, the lateral ventricles and the brain-stem. However, increased fALFF3 values comparedto fALFF1 can also be found in some cortical regionslocated in the temporal and frontal lobes, temporalfusiform, subcallosal and insular cortices, and tem-poral and frontal gyri.
Results of the comparison between fALFF2 andfALFF3 do not differ much from the comparison be-tween fALFF2 and fALFF3 (not displayed), whichis expectable since significant differences betweenfALFF1 and fALFF2 were minimal.
Correlation between metrics
Taking into account the similarity observed be-tween some metrics, subsequent analysis could becarried out using a selection of the indexes avail-able. Firstly, it was decided that the lateral ventriclesshould not be used in the following analyses, sincefluctuations in this ROI are of non interest for thisstudy, whose aim is to measure physiologic fluctua-tions characteristic of GM and WM tissues. There-fore, a comparative analysis between the nine metricsincluding the mean values for each of the three ROIs(cGM, sGM and WM) was conducted through a cor-relation analysis.
Figure 7 displays the correlation coefficients be-
6

PF
PF
ALFF
ALFF
ALFF1
ALFF1
ALFF2
ALFF2
ALFF3
ALFF3
fALFF
fALFF
fALFF1
fALFF1
fALFF2
fALFF2
fALFF3
fALFF3
cGM
sGM
WM
cGM
sGM
WM
cGM
sGM
WM
cGM
sGM
WM
cGM
sGM
WM
cGM
sGM
WM
cGM
sGM
WM
cGM
sGM
WM
cGM
sGM
WM
5 10 15 20 25
5
10
15
20
25
-1
-0.8
-0.6
-0.4
-0.2
0
0.2
0.4
0.6
0.8
1
Figure 7: Matrix of correlation coefficients for HC betweenmean values of PF, ALFF, ALFF1, ALFF2, ALFF3, fALFF,fALFF1, fALFF2 and fALFF3 within cGM, sGM and WM.Positive correlations are represented in yellow, while dark bluecorresponds to negative correlations.
tween each pair of metrics, where each square bor-dered in red corresponds to the correlation betweentwo metrics and within each of those squares thethree ROIs are differentiated. The dominance of theyellow colour among a group of metrics on the topleft corner indicates that PF, ALFF, ALFF1, ALFF2and ALFF3 are highly correlated among themselves,which means that using all of them in the same anal-ysis would become redundant. Regarding fALFF,fALFF1, fALFF2 and fALFF3, the correlation coef-ficients’ values indicate that these four metrics’ mea-surements present increased differences among them-selves, as well as with the other five metrics pre-viously mentioned. Correlation coefficients betweenfALFF and the other metrics can be found aroundzero, with the exception of fALFF2’s metric. Thesimilarity between fALFF and fALFF2 is expectedsince their frequency range does not differ much; infact, fALFF2’s frequencies (0.023-0.073 Hz) are in-cluded in those of fALFF (0.01-0.1 Hz). RegardingfALFF3, there can be observed high negative corre-lations with the rest of the metrics, with the excep-tion of fALFF1. These results overall suggest thatfALFF should be studied by frequency bands, i.e.,each of fALFF’s frequency bands (fALFF1, fALFF2and fALFF3) should be included in further analyses.
Correlations between ROIs within each metric aredepicted in the diagonal of the matrix represented inFigure 7, inside the red limits. Most of the metricspresent high correlations between ROIs, with corre-lation coefficients generally above 0.7. Between cGMand sGM, correlation coefficients appear to be above0.6, suggesting that these two ROIs could be mergedand studied as one single ROI. Meanwhile, decreasedcorrelations between WM and cGM for fALFF3, andbetween WM and sGM for fALFF1 can be observed,indicating that subsequent analyses should includethe study of both WM and GM as two separate re-gions of interest.
Figure 8 illustrates the matrix of p-values associ-ated with the correlations displayed in Figure 7. Itwas tested the hypothesis of no correlation againstthe alternative hypothesis of a nonzero correlation,
PF
PF
ALFF
ALFF
ALFF1
ALFF1
ALFF2
ALFF2
ALFF3
ALFF3
fALFF
fALFF
fALFF1
fALFF1
fALFF2
fALFF2
fALFF3
fALFF3
cGM
sGM
WM
cGM
sGM
WM
cGM
sGM
WM
cGM
sGM
WM
cGM
sGM
WM
cGM
sGM
WM
cGM
sGM
WM
cGM
sGM
WM
cGM
sGM
WM
5 10 15 20 25
5
10
15
20
25
0
0.005
0.01
0.015
0.02
0.025
0.03
0.035
0.04
0.045
0.05
Figure 8: Matrix of p-values correspondent to the correlationsfor HC between mean values of PF, ALFF, ALFF1, ALFF2,ALFF3, fALFF, fALFF1, fALFF2 and fALFF3 within cGM,sGM and WM. Significant correlations were considered for ap-value<0.05: non-significant correlations (p>0.05) are repre-sented in yellow.
which means that p-values lower than 0.05 (non-yellow) correspond to significant correlations betweenmetrics. The results support the ones previously dis-cussed regarding the correlation matrix. Moreover,it is notable a significant distinction between ROIs,particularly in fALFF1 and fALFF3.
When comparing between bands within the samemetric, it is evident how the normalization of a fre-quency band’s power by the total power influencesthe results. When no normalization is performed, asis the case of ALFF, no significant differences canbe found between bands, at least when the analysisinvolves mean values within the selected ROIs.
In light of the above results, fALFF1, fALFF2 andfALFF3 were chosen to be part of the metrics tobe investigated in subsequent group comparisons andanalyses regarding SVD group. Amongst PF, ALFF,ALFF1, ALFF2 and ALFF3, only ALFF was selectedbased on two grounds: since the other metrics to bestudied have the same basis as ALFF’s metric (differ-ing on the normalization and frequency band range),ALFF was chosen over PF in order to facilitate com-parisons between ALFF and the different fALFF met-rics; on the other hand, since no significant differenceswere found between ALFF’s various frequency ranges(Figure 8), frequencies between 0.01 and 0.1 Hz werechosen to represent this metric, insomuch as it en-compasses band 1 (0.01-0.023 Hz) and band 2 (0.023-0.073 Hz), and corresponds to the low-frequency bandthat is considered to mostly contribute to physiologicfluctuations in BOLD signal [31].
3.2. SVD and HC group comparisons
Taking into account the previous selection of metrics,only ALFF, fALFF1, fALFF2 and fALFF3 were usedin this analysis.
In order to better understand differences in ALFFbetween SVD patients and HC, mean ALFF val-ues were computed for cGM, sGM, LV, NAWM andWMH.
In Figure 9 are represented ALFF distributions forthe three groups analysed: HC, sSVD and CADASIL.
7

HC sSVD CADASIL
0.5
1
1.5
ALF
F
cGM
HC sSVD CADASIL
0.5
1
1.5
sGM
HC sSVD CADASIL
0.5
1
1.5
LV
HC sSVD CADASIL
0.5
1
1.5
NAWM
sSVD CADASIL
0.5
1
1.5
WMH
Figure 9: Boxplots representing the distributions of ALFFmean values in cGM, sGMc LV and NAWM for HC, sSVDand CADASIL.
Regarding the group distributions of ALFF, a muchwider distribution of sSVD group’s values in relationto the other two groups is observed.
Results from a 2-way repeated measures ANOVAwith the factor ROI revealed a significant main ef-fect of this factor (p<0.001). However, including thegroup (HC, sSVD and CADASIL) as a between sub-jects factor did not reveal significant interactions be-tween ROI and group (p=0.521), neither significantbetween subjects, or group, effect (p=0.493). Thesame analysis was conducted using two groups in-stead of three: HC (same as in Figure 9) and SVD(sSVD and CADASIL groups together). Similarlyto the previous results, a 2-way repeated measuresANOVA with the factor ROI revealed a significantmain effect of this factor (p<0.001), but no significantinteraction between ROI and group (HC and SVD)was found (p=0.296). The group also did not presentsignificance as between subjects effect (p=0.943).
Similarly to the results of ALFF’s analysis, no sta-tistically significant group differences were found fornone of the remaining metrics (fALFF1, fALFF2 andfALFF3).
NAWM vs WMHIn order to test the hypothesis that BOLD fluc-
tuations are decreased in WMH relative to NAWM,according to a previous report (Makedonov et al.[21]), a within SVD group t-test was conducted in or-der to assess differences between metrics in NAWMand WMH. A statistically significant reduction wasfound in WMH compared to NAWM for ALFF met-ric (p<0.001), similarly to the result found by Make-donov and colleagues. These results are concordant,given the similarity found between PF and ALFF.Regardless, a t-test was also performed for PF, whoseresults (not displayed) demonstrated the same rela-tion found with ALFF.
3.3. SVD group analysis
Multiple Linear RegressionsThe following results concern regressions which
include both demographic and structural imagingcovariates and the metrics that have been anal-ysed and selected throughout this section, these be-ing: ALFF, fALFF1, fALFF2 and fALFF3 in both
GM and NAWM (ALFF GM, fALFF1 GM, fALFF2GM, fALFF3 GM, ALFF NAWM, fALFF1 NAWM,fALFF2 NAWM and fALFF3 NAWM).
As part of an exploratory analysis, single regres-sions using each of the mentioned metrics were con-ducted, resulting in only processing speed being ex-plained using single predictors.
Figure 10 shows the results of the regressions whichdemonstrated to fit processing speed as the responsevariable with statistic significance. The single pre-dictors are: ALFF both in GM and NAWM, andfALFF2 and fALFF3 in NAWM. The plots observedin the figure show negative correlations between pro-cessing speed and the three first metrics (ALFF GM,ALFF NAWM and fALFF2 NAWM) and a positivecorrelation between processing speed and fALFF3 inNAWM. The inverse relation found among fALFF3NAWM and the other metrics was also observed inFigure 7, where correlations between fALFF3 and theremaining metrics presented negative values. A greatsimilarity is observed between ALFF GM and ALFFNAWM’s regressions - these metrics presented highcorrelations in the analysis conducted subsection 3.1.
These results suggest that SVD patients whopresent increased amplitudes of low-frequency fluctu-ations in GM and NAWM tend to perform poorly inneuropsychological tests related to processing speedtasks. In a previous study by Makedonov and col-leagues [21], increased physiologic fluctuations’ val-ues in NAWM of patients with SVD compared to el-derly controls were found. Given the high correlationfound in the present study between ALFF and physi-ologic fluctuations (PF) metrics and the fact that pro-cessing speed is commonly impaired in SVD patients[28], a similarity can be found between the relationobserved between ALFF in NAWM and processingspeed scores and the results reported by Makedonovet al. Observing Figure 10, results regarding fALFFmetrics in NAWM for band 2 and band 3 suggestthat decreased speed of information processing is as-sociated with increased fALFF2 and, on the otherhand, higher processing speed scores are associatedwith greater fALFF3 values.
Figure 11 presents the results from multiple lin-ear regressions conducted for processing speed using,for each of the previous metrics, a model in whichthe covariates were also included. These results indi-cate that the stepwise analysis in models with ALFFGM and fALFF2 NAWM did not include these met-rics in the selected set of predictors - in these cases,the model becomes the same as the one includingonly the covariates (first bar of the barchart). Re-garding ALFF NAWM and fALFF3 NAWM, in ad-dition to the significant p-values of the overall model(p=0.0185 and p=0.0338, respectively), increased ad-justed R2 values were also found, when comparedto the single regressions (Figure 10) and the regres-sion using only the covariates. More specifically, inthe model with ALFF NAWM, this predictor was se-
8

-2 -1 0 1 2 3
ALFF GM
-3
-2
-1
0
1
2
Pro
cessin
g S
peed
=-0.5978p=0.0145
Adjusted R2=31.14%
-2 -1 0 1 2
ALFF NAWM
-3
-2
-1
0
1
2
Pro
cessin
g S
peed
=-0.5863p=0.017
Adjusted R2=29.69%
-2 -1 0 1 2
fALFF2 NAWM
-3
-2
-1
0
1
2
Pro
cessin
g S
peed
=-0.5347p=0.0328
Adjusted R2=23.49%
-3 -2 -1 0 1 2
fALFF3 NAWM
-3
-2
-1
0
1
2
Pro
cessin
g S
peed
=0.5964p=0.0148
Adjusted R2=30.96%
Figure 10: Relationship between the single predictors and processing speed. β corresponds to the coefficient estimate or slopeof the linear fit; adjusted R2 corresponds to the overall model’s coefficient of variation; p-values are considered significant forp<0.05.
lected as the one with a greater significant contribu-tion (p=0.0053) to predict processing speed scores.
* *
*
*
*
1 2 3 4 5
Processing Speed
0
10
20
30
40
50
60
Adju
ste
d R
2
Only covariates
ALFF GM
ALFF NAWM
fALFF2 NAWM
fALFF3 NAWM
Figure 11: Comparison between adjusted R2 values for pro-cessing speed obtained from models using as predictors: onlycovariates; ALFF GM + covariates; ALFF NAWM + covari-ates; fALFF2 NAWM + covariates; and fALFF3 NAWM + co-variates. Models with an overall significant p-value are markedwith an asterisk.
An additional analysis regarding the single predic-tors was performed. A model with the covariatesand all the single predictors was evaluated, result-ing in an overall p-value=0.0503 (almost significant).Additionally, taking into account that correlationswere found between the four metrics, a compositescore was computed using principal component anal-ysis (PCA) and selecting the principal component ex-plaining at least 80% of the variance. The resultsfrom a stepwise analysis including this compositeand the covariates revealed that only the compositescore (which explains 84.31% of the single predictors’variance) presented a significant p-value (p=0.0027).
Regarding the overall model, a p-value=0.0175 wasobtained, explaining 44.65% of the data’s variance.These results are displayed in Figure 13 (4th and 5th
bars of the barchart).
Analyses using composite scores obtained from allthe metrics (ALFF, fALFF1, fALFF2 and fALFF3)in: (i) GM, (ii) NAWM, and (iii) GM + NAWM wereperformed. Analysis (i) included two composites ex-plaining 87.33% of GM metrics’ variance, analysis (ii)also included two composites explaining 90.79% ofNAWM metrics’ variance, and analysis (iii) includedthree composites explaining 91.99% of all the metrics’variance. Multiple regression analyses were carriedon for the four cognitive domains using the compos-ite scores and the covariates as explanatory variables.The results are displayed in Figure 12.
The analyses performed using GM’s compositesresulted in the prediction of only executive func-tion and processing speed with statistical significance(p=0.0036 and p=0.0400, respectively). Regardingthe analyses performed using NAWM’s composites,three of the cognitive functions (executive function(EF), processing speed (PS), and attention and work-ing memory (AWM) were explained with statistic sig-nificance (p=0.0089, p=0.0200 and p=0.0353, respec-tively). The analysis performed using GM + NAWMcomposites exhibited better results than the previ-ous ones: p-values of the overall models were lower(p=0.0016 for EF, p=0.0034 for PS and p=0.0346 forAWM) and adjusted R2 values increased (Figure 12).
In Figure 13 are illustrated the results from thediverse models tested, with the purpose of compar-
9

**
*
*
*
*
**
Working Memory Long-term memoryExecutive Function Processing Speed Attention and Learning and
0
10
20
30
40
50
60
70
80A
dju
ste
d R
2GM + NAWM composites (3)
GM composites (2)
NAWM composites (2)
Figure 12: Comparison between adjusted R2 values for thefour cognitive domains obtained from models using as predic-tors the covariates plus composite scores of: GM and NAWMmetrics; GM metrics; and NAWM metrics. Models with anoverall significant p-value are marked with an asterisk. Thenumber of metrics is presented in brackets in the legend foreach model.
*
*
*
**
1 2 3 4 5
Processing Speed
0
10
20
30
40
50
60
70
80
90
100
Adju
ste
d R
2
GM + NAWM composites (3)
GM composites (2)
NAWM composites (2)
Single predictors (4)
Single predictors composite (1)
Figure 13: Comparison between adjusted R2 values for pro-cessing speed obtained from models using as predictors thecovariates plus: GM and NAWM metrics’ composite scores;GM metrics’ composite scores; single predictors; and singlepredictors’ composite score. Models with an overall significantp-value are marked with an asterisk. The number of metricsis presented in brackets in the legend for each model.
ing the different predictions obtained for processingspeed. These results indicate that, similarly to execu-tive function and attention and working memory, themodel using composite scores obtained from all themetrics performs better in the prediction of SVD pa-tients’ processing speed scores. However, these com-posite scores are derived from 8 metrics, which is notthe case of the other models, which use fewer met-rics. Nonetheless, models using single predictors alsodemonstrated good predictions, with more than 40%of processing speed’s variance explained.
4. Conclusions
The present study focused on the investigation of rs-fMRI physiologic fluctuations in the context of SVD.In an initial phase, an assessment of these oscilla-tions’ amplitude and spatial distributions was per-formed, which included the comparison of diversemetrics representing different aspects of brain activ-ity and taking into consideration the frequency fac-tor in the BOLD signal. Part of the goals of thisstudy was to investigate whether these metrics couldbe used to differentiate healthy from diseased popu-
lations. However, comparisons between healthy con-trols and SVD patients did not demonstrate statisti-cally significant differences between these groups. Afinal assessment including SVD patients’ neuropsy-chological evaluations demonstrated correlations be-tween their cognitive performance and certain ampli-tude measures of resting brain’s BOLD oscillations,as well as with some of the covariates included in theanalysis.
The differences found between ALFF and fALFFsuggest that the latter detects spontaneous oscilla-tions with increased specificity. Moreover, the studyof the resting brain using frequency analyses demon-strated useful in investigating different parts of theBOLD signal, providing a better differentiation of thesources of physiologic fluctuations present in the di-verse brain regions. Overall, measures of the am-plitude of brain’s spontaneous oscillations indicatethat abnormalities at this level might contribute tocognitive impairments. The tendency was towards anegative correlation between ALFF and fALFF met-rics and SVD patients’ cognitive scores. Althoughthis study lacked statistical power to investigate dif-ferences between SVD patients and healthy controls,findings suggest that measures of abnormal sponta-neous oscillations might aid in the detection of earlychanges in the cognitive function of SVD patients.The use of ALFF and fALFF metrics could providea straightforward way to better characterize and as-sess the progression of the disease by investigatingthe vascular complications associated with it.
One of the main limitations in this study concernsthe small sample size of the cohorts. Significant groupdifferences were not found probably due to the lack ofstatistical power, in addition to the high variabilityof metrics’ values observed within SVD patients. Fu-ture work should include larger samples, which couldalso prove important to confirm the results herebyobtained regarding the prediction of cognitive dys-functions characteristic of SVD. Furthermore, a val-idation of the presented results should be obtainedby conducting longitudinal studies. This could alsoprove useful to the assessment of changes in sponta-neous brain fluctuations throughout the progressionof the disease.
References[1] L. Pantoni. Cerebral small vessel disease: from
pathogenesis and clinical characteristics to therapeu-tic challenges. The Lancet Neurology, 9(7):689–701,2010.
[2] J. M. Wardlaw, C. Smith, and M. Dichgans. Mech-anisms of sporadic cerebral small vessel disease: in-sights from neuroimaging. The Lancet Neurology, 12(5):483–497, 2013.
[3] A. Charidimou, L. Pantoni, and S. Love. The con-cept of sporadic cerebral small vessel disease: a roadmap on key definitions and current concepts. Inter-national Journal of Stroke, 11(1):6–18, 2016.
[4] A. Bersano, S. Debette, E. R Zanier, S. Lanfranconi,M. G De Simoni, O. Zuffardi, and G. Micieli. The
10

genetics of small-vessel disease. Current medicinalchemistry, 19(24):4124–4141, 2012.
[5] L. Pantoni and P. B. Gorelick. Cerebral small vesseldisease. Cambridge University Press, 2014.
[6] E. E. Smith and A. E. Beaudin. New insights intocerebral small vessel disease and vascular cognitiveimpairment from MRI. Current opinion in neurology,31(1):36–43, 2018.
[7] S. Ogawa, T.-M. Lee, A. R. Kay, and D. W. Tank.Brain magnetic resonance imaging with contrast de-pendent on blood oxygenation. Proceedings of theNational Academy of Sciences, 87(24):9868–9872,1990.
[8] C. J. Gauthier and A. Fan. BOLD signal physiology:Models and applications. NeuroImage, 2018.
[9] G.-R. Wu and D. Marinazzo. Sensitivity of theresting-state haemodynamic response function esti-mation to autonomic nervous system fluctuations.Phil. Trans. R. Soc. A, 374(2067):20150190, 2016.
[10] J. W. Evans, P. Kundu, S. G. Horovitz, and P. A.Bandettini. Separating slow BOLD from non-BOLDbaseline drifts using multi-echo fMRI. NeuroImage,105:189–197, 2015.
[11] R. B. Buxton. Introduction to functional magneticresonance imaging: principles and techniques. Cam-bridge university press, 2009.
[12] H. Lu, Y. Zuo, H. Gu, J. A. Waltz, W. Zhan, C. A.Scholl, W. Rea, Y. Yang, and E. A. Stein. Synchro-nized delta oscillations correlate with the resting-state functional MRI signal. Proceedings of the Na-tional Academy of Sciences, 104(46):18265–18269,2007.
[13] D. Mantini, M. G. Perrucci, C. Del Gratta, G. L.Romani, and M. Corbetta. Electrophysiological sig-natures of resting state networks in the human brain.Proceedings of the National Academy of Sciences, 104(32):13170–13175, 2007.
[14] Q.-H. Zou, C.-Z. Zhu, Y. Yang, X.-N. Zuo, X.-Y.Long, Q.-J. Cao, Y.-F. Wang, and Y.-F. Zang. Animproved approach to detection of amplitude of low-frequency fluctuation (ALFF) for resting-state fMRI:fractional ALFF. Journal of neuroscience methods,172(1):137–141, 2008.
[15] M. P. Van Den Heuvel and H. E. H. Pol. Exploringthe brain network: a review on resting-state fMRIfunctional connectivity. European neuropsychophar-macology, 20(8):519–534, 2010.
[16] A. M. Golestani, J. B. Kwinta, Y. B. Khatamian, andJ. J. Chen. The effect of low-frequency physiologicalcorrection on the reproducibility and specificity ofresting-state fMRI metrics: functional connectivity,ALFF, and ReHo. Frontiers in neuroscience, 11:546,2017.
[17] A. Golestani, C. Chang, J. Kwinta, Y. Khatamian,and J. Chen. Corrigendum to” mapping the end-tidalCO2 response function in the resting-state BOLDfMRI signal: Spatial specificity, test-retest reliabilityand effect of fMRI sampling rate.”. NeuroImage, 172:913–913, 2018.
[18] K. Murphy, R. M. Birn, and P. A. Bandettini.Resting-state fMRI confounds and cleanup. Neu-roimage, 80:349–359, 2013.
[19] J. H. Kim, R. Khan, J. K. Thompson, and D. Ress.Model of the transient neurovascular response based
on prompt arterial dilation. Journal of CerebralBlood Flow & Metabolism, 33(9):1429–1439, 2013.
[20] G. Pfurtscheller, A. Schwerdtfeger, C. Brunner,C. Aigner, D. Fink, J. Brito, M. P. Carmo, andA. Andrade. Distinction between neural and vas-cular BOLD oscillations and intertwined heart rateoscillations at 0.1 Hz in the resting state and duringmovement. PloS one, 12(1):e0168097, 2017.
[21] I. Makedonov, S. E. Black, and B. J. MacIntosh.BOLD fMRI in the white matter as a marker of ag-ing and small vessel disease. PloS one, 8(7):e67652,2013.
[22] M. Wang, J. Su, J. Zhang, and X. Du. A preliminarystudy on the amplitude of low frequency fluctuationsin CADASIL. Proceedings of the 25th InternationalSociety for Magnetic Resonance in Medicine confer-ence, pages 1–3, 2017. doi: 10.1111/jon.12374.3.
[23] C. Liu, C. Li, X. Yin, J. Yang, D. Zhou, L. Gui,and J. Wang. Abnormal intrinsic brain activity pat-terns in patients with subcortical ischemic vasculardementia. PloS one, 9(2):e87880, 2014.
[24] C. Li, C. Liu, X. Yin, J. Yang, L. Gui, L. Wei,and J. Wang. Frequency-dependent changes in theamplitude of low-frequency fluctuations in subcorti-cal ischemic vascular disease (SIVD): a resting-statefMRI study. Behavioural brain research, 274:205–210, 2014.
[25] R. Cheng, H. Qi, Y. Liu, S. Zhao, C. Li, C. Liu, andJ. Zheng. Abnormal amplitude of low-frequency fluc-tuations and functional connectivity of resting-statefunctional magnetic resonance imaging in patientswith leukoaraiosis. Brain and behavior, 7(6):e00714,2017.
[26] Z. Nedelska, L. Ni, R. Liu, Z. Yin, H. Zhao, J. Hort,F. Zhou, W. Wu, X. Zhang, M. Li, et al. Aberrantbrain activity in patients with mild cognitive impair-ment with lacunar infarction: A resting-state func-tional MRI study. Alzheimer’s & Dementia: TheJournal of the Alzheimer’s Association, 11(7):P63–P64, 2015.
[27] E. Yacoub, P. F. Van De Moortele, A. Shmuel, andK. Uurbil. Signal and noise characteristics of HahnSE and GE BOLD fMRI at 7 T in humans. Neu-roImage, 24(3):738–750, 2005.
[28] T. G. Issac, S. R. Chandra, R. Christopher, J. Ra-jeswaran, and M. Philip. Cerebral small vesseldisease clinical, neuropsychological, and radiologi-cal phenotypes, histopathological correlates, and de-scribed genotypes: A review. J Geriatrics, 2015:1–12, 2015.
[29] A. K. Harvey, K. T. Pattinson, J. C. Brooks, S. D.Mayhew, M. Jenkinson, and R. G. Wise. Brainstemfunctional magnetic resonance imaging: Disentan-gling signal from physiological noise. Journal of Mag-netic Resonance Imaging, 28(6):1337–1344, 2008.
[30] X. N. Zuo, A. Di Martino, C. Kelly, Z. E. Shehzad,D. G. Gee, D. F. Klein, F. X. Castellanos, B. B.Biswal, and M. P. Milham. The oscillating brain:Complex and reliable. NeuroImage, 49(2):1432–1445,2010.
[31] F. Zhou, S. Huang, Y. Zhuang, L. Gao, and H. Gong.Frequency-dependent changes in local intrinsic oscil-lations in chronic primary insomnia: A study of theamplitude of low-frequency fluctuations in the rest-ing state. NeuroImage: Clinical, 15:458–465, 2017.
11