investigation of portable or handheld … handheld... · investigation of portable or handheld...
TRANSCRIPT

INVESTIGATION OF PORTABLE ORHANDHELD DEVICES FOR DETECTING
CONTAMINANTS IN LPG
FINAL REPORT(Revision 2)
SwRI Project No. 08-10524PERC Docket No. 11296
Prepared for:
Propane Education and Research Council (PERC)1140 Connecticut Ave., NW, Suite 1075
Washington DC 20036
MARCH 2005

BLANK

This report must be reproduced in full,
unless SwRI approves a summary or
abridgement
INVESTIGATION OF PORTABLE ORHANDHELD DEVICES FOR DETECTING
CONTAMINANTS IN LPG
FINAL REPORT(Revision 2)
SwRI Project No. 08-10524PERC Docket No. 11296
Prepared for:
Propane Education and Research Council (PERC)1140 Connecticut Ave., NW, Suite 1075
Washington DC 20036
Prepared by:
Scott A. Hutzler, Research ScientistJames E. Johnson, Principal Engineer
Southwest Research Institute
6220 Culebra RoadSan Antonio, TX 78238
MARCH 2005
Approved:
Edwin C. Owens, DirectorFuels and Lubricants Technology DepartmentFuels and Lubricants Research Division

BLANK

SwRI Project No. 08-10524March 2005
Investigation of Portable or Hand-Held Devices Page ifor Detecting Contaminants in LPG
Table of Contents
Section Page Number
EXECUTIVE SUMMARY ............................................................................................................................ 1
1.0 BACKGROUND............................................................................................................................... 1
2.0 OBJECTIVES ................................................................................................................................... 1
3.0 PART I - LITERATURE REVIEW .................................................................................................. 2
3.1 Technical Approach and Summary of Findings............................................................................ 2
3.2 SENSOR CONCEPTS AND RECOMMENDATIONS............................................................... 4
3.3 SENSOR TECHNOLOGY - CONCLUDING REMARKS ....................................................... 11
4.0 PART II - INSTRUMENT EVALUATION ................................................................................... 13
4.1 Technical Approach .................................................................................................................... 13
4.2 Summary of Results .................................................................................................................... 14
4.3 Recommendations....................................................................................................................... 14
APPENDIX A .............................................................................................................................................. 15
5.0 LPG QUALITY............................................................................................................................... 16
5.1 LPG Composition ....................................................................................................................... 16
5.2 LPG Contaminants...................................................................................................................... 16
6.0 INTERVIEWS ................................................................................................................................ 18
7.0 LPG SENSOR SPECIFICATION................................................................................................... 19
7.1 Objective..................................................................................................................................... 19
7.2 Subsystem Definition.................................................................................................................. 20
7.2.1 Packaging ........................................................................................................................... 21
7.2.2 Power ................................................................................................................................. 21
7.2.3 Sample Handling and Preparation...................................................................................... 21
7.2.4 Sensor System .................................................................................................................... 21
7.2.5 Control System................................................................................................................... 22
7.2.6 Operator Interface .............................................................................................................. 22
7.2.7 Data Interface ..................................................................................................................... 22
7.3 Summary Characteristics ............................................................................................................ 22
8.0 SAMPLE CONDITIONING TECHNIQUES ................................................................................. 25
8.1 Molecular Sieves (Zeolite).......................................................................................................... 26
8.2 Activated Alumina ...................................................................................................................... 27
8.3 Activated Carbon ........................................................................................................................ 28
8.3.1 Molecular Sieves (Carbon)................................................................................................. 28
8.4 Silica Gel..................................................................................................................................... 29
SwRI Project No. 08-10524March 2005
Investigation of Portable or Hand-Held Devices Page iifor Detecting Contaminants in LPG
Filter/Separators................................................................................................................................... 29
8.6 Particulate Filters ........................................................................................................................ 31
8.7 Sample Conditioning - Application to Portable LPG Sensors .................................................... 31
9.0 LPG SAMPLING............................................................................................................................ 32
9.1 The Sampling Environment ........................................................................................................ 32
9.2 Common Methods in Use For Sampling..................................................................................... 33
9.3 Sampling Considerations for Portable Systems .......................................................................... 35
10.0 SENSOR TECHNOLOGIES...................................................................................................... 36
10.1 Catalytic Bead ........................................................................................................................ 38
10.2 Electrochemical Sensors......................................................................................................... 39
10.2.1 Interfering Gases ................................................................................................................ 40
10.2.2 Blocking Mechanisms ........................................................................................................ 41
10.2.3 Poisoning............................................................................................................................ 42
10.2.4 Pressure Effects .................................................................................................................. 42
10.2.5 Humidity ............................................................................................................................ 42
10.2.6 Sensor Life ......................................................................................................................... 43
10.2.7 Advantages/Disadvantages................................................................................................. 43
10.3 Metal Oxide Semiconductor (MOS)....................................................................................... 43
10.3.1 Advantages/Disadvantages................................................................................................. 44
10.4 Bulk Acoustic Wave (BAW) Sensors..................................................................................... 45
10.4.1 Advantages/Disadvantages................................................................................................. 46
10.5 Surface Acoustic Wave (SAW) Sensors................................................................................. 46
10.5.1 Advantages/Disadvantages................................................................................................. 47
10.6 Metal Oxide Field-Effect Transistor (MOSFET) ................................................................... 47
10.7 Conducting Organic Polymers (COP) .................................................................................... 48
10.7.1 Advantages/Disadvantages................................................................................................. 49
10.8 Chemoresistors ....................................................................................................................... 49
10.9 Spectroscopic.......................................................................................................................... 50
10.9.1 Spectroscopic Instrument Technologies............................................................................. 52
10.9.2 Mid-Infrared Spectroscopy................................................................................................. 53
10.9.3 Near-Infrared Spectroscopy ............................................................................................... 54
10.9.4 Laser Spectroscopy ............................................................................................................ 55
10.10 Dielectric Measurement.......................................................................................................... 57
10.11 Gas Chromatography.............................................................................................................. 58
10.11.1 Advantages/Disadvantages ............................................................................................ 58
10.12 Ionization Detectors................................................................................................................ 59
10.13 Gas Detection Tubes............................................................................................................... 62

SwRI Project No. 08-10524March 2005
Investigation of Portable or Hand-Held Devices Page iiifor Detecting Contaminants in LPG
10.13.1 Gas Sampling Methods .................................................................................................. 63
10.13.2 Reaction Principles ........................................................................................................ 64
10.13.3 Temperature Effects....................................................................................................... 65
10.13.4 Correcting Tube Results ................................................................................................ 65
10.13.5 Storage of Gas Detector Tubes ...................................................................................... 66
10.14 Coriolis Measurements ........................................................................................................... 66
10.15 Interface Detection ................................................................................................................. 67
10.15.1 Ultrasonic....................................................................................................................... 68
10.15.2 Radar.............................................................................................................................. 70
10.15.3 Capacitance.................................................................................................................... 71
10.15.4 Conductance................................................................................................................... 72
10.15.5 Field Effect .................................................................................................................... 72
10.16 Particle Counters..................................................................................................................... 73
10.16.1 Light-Scattering Particle Counters................................................................................. 74
10.16.2 Light-Blocking Particle Counters .................................................................................. 74
10.16.3 Advantages/Disadvantages ............................................................................................ 75
10.17 Summary Notes for Sensor Technologies .............................................................................. 75
10.17.1 Gas Monitoring Systems................................................................................................ 75
10.17.2 Chemical Array Sensors ................................................................................................ 76
10.17.3 Spectroscopic Sensors.................................................................................................... 76
10.17.4 Dielectric Measurement ................................................................................................. 77
10.17.5 Gas Chromatography ..................................................................................................... 77
10.17.6 Photoionization Detector (PID) ..................................................................................... 77
10.17.7 Flame Ionization Detector (FID).................................................................................... 78
10.17.8 Gas Detection Tubes ...................................................................................................... 78
10.17.9 Coriolis Measurement.................................................................................................... 78
10.17.10 Particle Counters............................................................................................................ 79
11.0 SENSOR TRADE-OFF STUDY ................................................................................................ 79
11.1 Weighting Factors................................................................................................................... 82
11.2 Trade-off Summary ................................................................................................................ 82
APPENDIX B............................................................................................................................................... 85
12.0 BACKGROUND ............................................................................................................................. 86
13.0 MATERIALS.............................................................................................................................. 87
14.0 INSTRUMENTATION .............................................................................................................. 89
14.1 Sampling System .................................................................................................................... 91
14.2 Purge Cycle ............................................................................................................................ 91
14.3 Chemical Sensors ................................................................................................................... 92

SwRI Project No. 08-10524March 2005
Investigation of Portable or Hand-Held Devices Page ivfor Detecting Contaminants in LPG
14.4 Signal Processing and Data Analysis...................................................................................... 92
14.5 Outlier Diagnostics ................................................................................................................. 93
14.5.1 Principal Component Analysis (PCA)................................................................................ 93
14.6 Algorithms.............................................................................................................................. 94
14.6.1 KNN................................................................................................................................... 94
14.6.2 K-Means............................................................................................................................. 95
14.6.3 Canonical Discriminant Analysis (CDA)........................................................................... 95
14.7 Sensor Selection ..................................................................................................................... 95
14.8 Sensor Conditioning ............................................................................................................... 95
14.9 Sampling Considerations ........................................................................................................ 96
14.9.1 Sample temperature............................................................................................................ 96
14.9.2 Relative Humidity .............................................................................................................. 96
14.9.3 Sampling Sequence ............................................................................................................ 96
14.9.4 Substrate Temperature........................................................................................................ 96
15.0 EXPERIMENTATION AND RESULTS ................................................................................... 97
15.1 Sample Preparation and Sampling Apparatus......................................................................... 97
15.1.1 Neat Compounds................................................................................................................ 98
15.1.2 Hydrocarbon Solutions....................................................................................................... 99
15.1.3 Gas Samples ..................................................................................................................... 100
15.1.4 Instrument Settings........................................................................................................... 101
15.1.5 Understanding the Results................................................................................................ 101
15.2 Experiment #1 - Neat Plasticizers......................................................................................... 102
15.3 Experiment #2 – Plasticizers Revisited ................................................................................ 110
15.4 Experiment #3 - Contaminant Comparison .......................................................................... 122
15.5 Experiment #4 - HC Solutions.............................................................................................. 130
15.6 Experiment #5 - HC Solutions with Dry Air Bubbler .......................................................... 134
15.7 Experiment #6 - HC Solutions and Differential Measurements ........................................... 138
15.8 Experiment #7 - Propane Trials ............................................................................................ 142
15.9 Experiment #8 - Propane Comparison.................................................................................. 146
16.0 REFERENCES ......................................................................................................................... 150
List of Tables
Table Page NumberTable 1. Sensor Trade-Off Table _________________________________________________________ 4
Table 2. GPA 2140-97 LPG Specifications ________________________________________________ 16
Table 3. Summary Table ______________________________________________________________ 23
Table 4. Comparison of MOS Sensors ____________________________________________________ 45
SwRI Project No. 08-10524March 2005
Investigation of Portable or Hand-Held Devices Page vfor Detecting Contaminants in LPG
Table 5. PID/FID Comparison __________________________________________________________ 61
Table 6. Sensor Trade-Off Table ________________________________________________________ 83
Table 7. Test Compounds______________________________________________________________ 87
Table 8. Propane Certificate of Analysis __________________________________________________ 89
Table 9. Cyranose 320 Sensor Specification _______________________________________________ 90
Table 10. Common Instrument Settings __________________________________________________ 101
Table 11. Experiment #1. Instrument Settings ____________________________________________ 103
Table 12. Experiment #1. Training Set __________________________________________________ 104
Table 13. Experiment #1. Interclass Mahalanobis Distance, All Classes ________________________ 106
Table 14. Experiment #1. Interclass Mahalanobis Distance, Classes B and E Removed ____________ 107
Table 15. Experiment #1. Interclass Mahalanobis Distance, Classes B and D Removed ____________ 108
Table 16. Experiment #1. Interclass Mahalanobis Distance, Classes D and E Removed ____________ 109
Table 17. Experiment #2. Instrument Settings ____________________________________________ 110
Table 18. Experiment #2. Training Set __________________________________________________ 112
Table 19. Experiment #2. Interclass Mahalanobis Distance, All Classes ________________________ 114
Table 20. Experiment #2. Training Set, Outliers Removed___________________________________ 115
Table 21. Experiment #2. Interclass Mahalanobis Distance, All Classes, Outliers Removed_________ 117
Table 22. Experiment #2. Training Set, Classes A, B, C, and E, Outliers Removed________________ 118
Table 23. Experiment #2. Interclass Mahalanobis Distance, Classes A, B, C, and E, Outliers Removed 119
Table 24. Experiment #2. Training Set, Classes A, C, D, and E, Outliers Removed _______________ 120
Table 25. Experiment #2. Interclass Mahalanobis Distance, Classes A, C, D, and E Outliers Removed 121
Table 26. Experiment #3. Instrument Settings ____________________________________________ 122
Table 27. Experiment #3. Training Set __________________________________________________ 124
Table 28. Experiment #3. Interclass Mahalanobis Distance, All Classes ________________________ 126
Table 29. Experiment #3. Training Set (Plasticizers, Hexadecane, Water), Outliers Removed._______ 127
Table 30. Experiment #1. Interclass Mahalanobis Distance (Plasticizers, Hexadecane, Water), Outliers
Removed __________________________________________________________________________ 129
Table 31. Experiment #4. Instrument Settings ____________________________________________ 130
Table 32. Experiment #4. Training Set __________________________________________________ 131
Table 33. Experiment #4. Interclass Mahalanobis Distance, All Classes ________________________ 133
Table 34. Experiment #5. Instrument Settings ____________________________________________ 134
Table 35. Experiment #5. Training Set __________________________________________________ 135
Table 36. Experiment #5. Interclass Mahalanobis Distance, All Classes ________________________ 137
Table 37. Experiment #6. Instrument Settings ____________________________________________ 138
Table 38. Experiment #6. Training Set __________________________________________________ 139
Table 39. Experiment #6. Interclass Mahalanobis Distance, All Classes ________________________ 141
Table 40. Experiment #7. Instrument Settings ____________________________________________ 142

SwRI Project No. 08-10524March 2005
Investigation of Portable or Hand-Held Devices Page vifor Detecting Contaminants in LPG
Table 41. Experiment #7. Training Set __________________________________________________ 143
Table 42. Experiment #7. Interclass Mahalanobis Distance, All Classes ________________________ 145
Table 43. Experiment #8. Instrument Settings ____________________________________________ 146
Table 44. Experiment #8. Training Set __________________________________________________ 147
Table 45. Experiment #8. Interclass Mahalanobis Distance, All Classes ________________________ 149
List of Figures
Figure Page NumberFigure 1. Compressed Breathing Air Analysis Kit ........................................................................................ 6
Figure 2. Basic Differential Measurment .................................................................................................... 10
Figure 3. High Pressure Purifier Housing and Element (2" diamater)......................................................... 11
Figure 4. Contaminant Distribution.............................................................................................................. 18
Figure 5. Configuration for a Sampling Container (from ASTM D1265 – 92)............................................ 33
Figure 6. Typical Visual Indicator Sampling System (from GPA Standard 2174-93) ................................ 34
Figure 7. Cylinder Sample Panel shown in three modes of operation......................................................... 35
Figure 8. Catalytic Bead Sensor .................................................................................................................. 38
Figure 9. Electrochemical Sensor ................................................................................................................ 40
Figure 10. Example of a Metal Oxide Semiconductor (MOS) Sensor ........................................................ 44
Figure 11. General Schematic for a Chemoresistor ..................................................................................... 50
Figure 12. AC Bridge Network for Dielectric Sample Cell.......................................................................... 58
Figure 13. Example of a Handheld PID Monitor Capable of ...................................................................... 59
Figure 14. Example Detctor Tube Specification for Ammonia from Sensidyne......................................... 62
Figure 15. Example of a Manual Detctor Tube Pump................................................................................. 63
Figure 16. Depth of Bottom Sludge as a Percent of Full Tank Cross Section............................................. 67
Figure 17. Interface Detection by Attentuation ........................................................................................... 69
Figure 18. Interface Detection by Reflection .............................................................................................. 70
Figure 19. Examples of Tank Radar Antennas ............................................................................................ 71
Figure 20. Guided Wave Radar ................................................................................................................... 71
Figure 21. Basic Capacitor .......................................................................................................................... 72
Figure 22. Field Effect Sensor..................................................................................................................... 73
Figure 23. Cyranose 320.............................................................................................................................. 89
Figure 24. Schematic of the Purge Cycle .................................................................................................... 91
Figure 25. Smellprint Containing 32 sensor Responses .............................................................................. 93
Figure 26. Sample Vial Holder.................................................................................................................... 97
Figure 27. Dry Air Purge............................................................................................................................. 98
Figure 28. Basic Sampling Technique......................................................................................................... 98
Figure 29. Sampling With a Dry Air Bubbler ............................................................................................. 99
SwRI Project No. 08-10524March 2005
Investigation of Portable or Hand-Held Devices Page viifor Detecting Contaminants in LPG
Figure 30. Sampling With a Dry Air Bubbler and Isooctane Purge .......................................................... 100
Figure 31. Sampling from a Gas Cylinder................................................................................................. 100
Figure 32. Experiment #1. PCA Plot, All Classes .................................................................................... 105
Figure 33. Experiment #1. Canonical Plot, All Classes............................................................................ 106
Figure 34. Experiment #1. Canonical Plot, Classes B and E Removed.................................................... 107
Figure 35. Experiment #1. Canonical Plot, Classes B and D Removed ................................................... 108
Figure 36. Experiment #1. Canonical Plot, Classes D and E Removed ................................................... 109
Figure 37. Experiment #2. PCA Plot, All Classes .................................................................................... 113
Figure 38. Experiment #2. Canonical Plot, All Classes............................................................................ 114
Figure 39. Experiment #2. PCA Plot, All Classes, Outliers Removed ..................................................... 116
Figure 40. Experiment #2. Canonical Plot, All Classes, Outliers Removed............................................. 117
Figure 41. Experiment #2. Canonical Plot, Classes A, B, C, and E, Outliers Removed .......................... 119
Figure 42. Experiment #2. Canonical Plot, Classes A, C, D, and E, Outliers Removed .......................... 121
Figure 43. Experiment #3. PCA Plot, All Classes .................................................................................... 125
Figure 44. Experiment #3. Canonical Plot, All Classes............................................................................ 126
Figure 45. Experiment #3. PCA Plot (Plasticizers, Hexadecane, Water), Outliers Removed .................. 128
Figure 46. Experiment #3. Canonical Plot (Plasticizers, Hexadecane, Water), Outliers Removed.......... 129
Figure 47. Experiment #4. PCA Plot, All Classes .................................................................................... 132
Figure 48. Experiment #4. Canonical Plot, All Classes............................................................................ 133
Figure 49. Experiment #5. PCA Plot, All Classes .................................................................................... 136
Figure 50. Experiment #5. Canonical Plot, All Classes............................................................................ 137
Figure 51. Experiment #6. PCA Plot, All Classes .................................................................................... 140
Figure 52. Experiment #6. Canonical Plot, All Classes............................................................................ 141
Figure 53. Experiment #7. PCA Plot, All Classes .................................................................................... 144
Figure 54. Experiment #7. Canonical Plot, All Classes............................................................................ 145
Figure 55. Experiment #8. PCA Plot, All Classes .................................................................................... 148
Figure 56. Experiment #8. Canonical Plot, All Classes............................................................................ 149
Abbreviations
Å Angstroms (10-10 m)
ASTM American Society for Testing and Materials
ATR Attenuated Total Reflectance
BAW Bulk Acoustic Wave
BEHPhth Bis(2-ethylhexyl) phthalate
BEHSeb Bis(2-ethylhexyl) sebacate
BenButPhth Benzyl butyl phthalate

SwRI Project No. 08-10524March 2005
Investigation of Portable or Hand-Held Devices Page viiifor Detecting Contaminants in LPG
ButylSeb Di-n-butyl sebacate
CDA Canonical Discriminant Analysis
CMS Carbon Molecular Sieves
COP Conducting Organic Polymer
EMF/RFI Electromagnetic Field/Radio Frequency Interference
EV Electron Volts
FID Flame Ionization Detector
FMCW Frequency-Modulated Continuous Wave
FT Fourier Transform
FTIR (FT-IR) Fourier Transform Infrared
GASFET Gallium Arsenide Field Effect Transistor
GC Gas Chromatography
GPA Gas Processors Association
GTD Gas Detection Tubes
HC Hydrocarbon
HITRAN High Resolution Transmission
IP Ionization Potential
KNN K-Nearest Neighbor
LEL Lower Explosive Limit
LP Liquefied Petroleum
LPG Liquefied Petroleum Gas
MIR Mid-Infrared
MOS Metal Oxide Semiconductor
MOSFET Metal-Oxide Semiconductor Field-Effect Transistor
OctPhth Di-n-octyl phthalate
PC Principal Component
PCA Principal Component Analysis
PERC Propane Education and Research Council
PID Photoionization Detector
PPM Parts Per Million
QCM Quartz Crystal Microbalance
QMB Quartz Microbalance
SAW Surface Acoustic Wave
SwRI Southwest Research Institute
SwRI Project No. 08-10524March 2005
Investigation of Portable or Hand-Held Devices Page ixfor Detecting Contaminants in LPG
TDR Time Domain Reflectometry
UV/VIS Ultraviolet/Visible
VOC Volatile Organic Compounds
Naming Conventions
Throughout this document the term LPG (Liquefied Petroleum Gas), will be used repeatedly. In
order to eliminate confusion, the term LPG will refer to those product grades composed primarily
of propane (e.g. HD-5). Where necessary, the actual state of the sample, i.e. gas or liquid, will be
clarified. Specific compounds, such as propane or methane and other hydrocarbons will be
referred to by name. Although butane is considered one of the four major LP-gases, its use is
primarily industrial. Our primary concern in this document is with LPG for domestic and
commercial use and those that are suitable for internal combustion engines, i.e. LPG-based.
Despite this convention, the findings in this report may also be relevant to butane.
Organization of the Report
The report is organized into the following subject areas:
Executive Summary
• Background (Section 1.0)
• Objectives (Section 2.0)
• Part I - Literature Review (Section 3.0)
• Part II - Instrument Evaluation (Section 4.0)
Appendix A (Literature Review) Sections
• LPG Quality (Section 5.0)
• Interviews (Section 6.0)
• LPG Sensor Specification (Section 7.0)
• Sample Conditioning Techniques (Section 8.0)
• LPG Sampling (Section 9.0)
• Sensor Technologies (Section 10.0)
• Sensor Trade-Off Study (Section 11.0)

SwRI Project No. 08-10524March 2005
Investigation of Portable or Hand-Held Devices Page xfor Detecting Contaminants in LPG
Appendix B (Instrument Evaluation) Sections
• Background (Section 12.0)
• Materials (Section 13.0)
• Instrumentation (Section 14.0)
• Experimentation and Results (Section 15.0)
Miscellaneous Sections
• References (Section 16.0)

SwRI Project No. 08-10524March 2005
Investigation of Portable or Hand-Held Devices Page 1for Detecting Contaminants in LPG
EXECUTIVE SUMMARY
1.0 BACKGROUND
The research discussed herein supports the Propane Education and Research Council (PERC)
Strategic Goals primarily in the principal component area of Industrial Productivity; although
spin-off ideas could very well support the New Application component of the PERC Strategic
Goals. In particular, Southwest Research Institute® (SwRI®) is addressing issues within the
PERC critical challenge area of fuel specifications. This program is investigating relevant
technologies needed to ascertain LPG fuel quality.
A simple-to-use device is needed to quickly determine the level of specific contaminants in LPG.
The LPG may harbor contaminants such as water, oily or waxy residues (from storage caverns,
compressors, pipe dopes, gaskets, hoses, heat transfer fluids), ammonia (potentially serious for
promoting copper and brass corrosion), and other corrosion agents that include fluorides,
chlorides, bromides, hydrogen sulfide, and sulfur. The impact of these contaminants on
residential or commercial appliances and equipment may be tolerable to a certain level, but
contaminants in LPG used for fueling vehicles can cause both performance and emission
problems. Our goal is to determine what technologies are viable for rapidly and easily
determining fuel quality, especially for field applications where it is important to sense for
contaminants that have migrated into the fuel.
2.0 OBJECTIVES
Proliferation of the LPG market for industrial use is strongly driven by life-cycle costing issues
(especially fuel prices and equipment that may be related to the fuel), whereas residential users
are concerned about availability (rural areas) and the need for long-life appliances and storage
tanks. For alternatively fueled vehicles and engines, proliferation of the LPG market is strongly
dependent upon an industry specification that clearly defines the required quality of the produced
fuel, especially as related to burning and emission characteristics when consumed in vehicles.
Standards such as GPA 2140 and ASTM D1835 (Standard Specification for Liquefied Petroleum
Gases) could be used as a starting point because they define the fuel properties at the time of
delivery in bulk. It is our goal to use these standards as an initial basis from which to investigate
technologies that would yield a fast response and inexpensive fuel-quality sensors that could
measure important components of the LPG.
SwRI Project No. 08-10524March 2005
Investigation of Portable or Hand-Held Devices Page 2for Detecting Contaminants in LPG
This research study consisted of two parts. For Part I, a literature study was undertaken to
explore technologies that could be employed for determining fuel quality and measuring
contaminant levels. For Part II of the study, we investigated a hand-held device (based on
advanced chemical array technology) for its application to LPG fuel quality.
The specific objectives for Part I of this study were as follows:
• To assess relevant LPG specifications to understand fundamental LPG fuel quality issues.
An anticipated result of the initial assessment will be a clear technical definition of what
is needed for a fuel-quality sensor.
• To identify or create sensor concepts that are responsive to a clear technical definition of
fuel-quality measurement needs.
• To integrate relevant LPG fuel-quality issues along with emerging and existing sensor
technologies, then develop a road map for actually developing sensor systems.
The specific objectives for Part II of this study were as follows:
• evaluate a handheld chemical sensor array that is currently on the market
• determine its sensitivity to several contaminants found in LPG
• provide recommendations for further use of the technology
3.0 PART I - LITERATURE REVIEW
3.1 Technical Approach and Summary of Findings
In this investigation, we utilized a comprehensive approach to understand the problem from as
many angles and perspectives as possible. To that end, we focused our investigations on the areas
summarized below. Refer to the indicated section in the appendices for a more detailed
discussion.
• LPG Quality (Section 5.0)
LPG specifications were examined in order to understand the nature of typical LPG
contaminants that might be encountered. Although the specifications were fairly limited,
they did provide composition information and general classification of contaminant
types.

SwRI Project No. 08-10524March 2005
Investigation of Portable or Hand-Held Devices Page 3for Detecting Contaminants in LPG
• Interviews (Section 6.0)
We conducted interviews with a couple of local LPG retailers to get their perspective of
the problem and determine if they would be open to using a device for determining LPG
fuel quality. Their response was positive and they would consider buying such an
instrument if it could reduce the potential for supplying contaminated fuel (resulting in
high cleanup costs).
• Sensor Specification (Section 7.0)
A draft sensor specification was generated to help guide future sensor developments.
This should be considered a working document and subject to modification as this
investigation continues.
• Sample Conditioning (Section 8.0)
A brief investigation of sample conditioning/filtration techniques for LPG was
conducted. These techniques are important because they provide a means to alter a
sample in a predictable way. The investigation identified several types of filtration
media, such as molecular sieves and activated carbon, which can be used to selectively
remove certain components of LPG. This could be important for removing interfering
species or for concentrating low concentration species.
• LPG Sampling (Section 9.0)
LPG sampling techniques are well documented in the literature. Our focus in this part of
the study was a discussion of the importance of collecting a representative sample. Since
contaminant species can exist in the liquid phase, gas phase, or both, collecting a
representative sample is critical. Equally as important is designing the sensor system to
facilitate the handling of the sample.
• Sensor Technologies (Section 10.0)
Sensor technologies were the primary focus of our investigation. It became apparent that
finding a truly handheld instrument for this application was unlikely, as they simply do
not exist. Therefore, we expanded our search to include "sensor technologies" that could
potentially be incorporated into a portable device. The range of our search included
sensors to detect specific chemical compounds (e.g. ammonia) to sensors for detecting
bulk contaminants (e.g. tank bottoms).
• Sensor Trade-Off Study (Section 11.0)
A sensor trade-off analysis was undertaken to identify those technologies that show
promise for incorporation into portable or handheld devices for detecting contaminants in
LPG. The technologies were assessed in terms of six major attributes: 1) low operation

SwRI Project No. 08-10524March 2005
Investigation of Portable or Hand-Held Devices Page 4for Detecting Contaminants in LPG
complexity, 2) portability, 3) high reliability, 4) detection limit, 5) good sensitivity, and
6) high specificity. When assigning ratings to each attribute, consideration was given to
the ultimate end user - the LPG retailer. While many of these technologies are certainly
applicable to LPG analysis, a suitable instrument package may not be currently available
or ready for direct employment at the retail level. In those cases, we considered only the
technology and its suitability for the intended purpose. The results of the trade-off
analysis are summarized in Table 1. It should be noted that a high score in the trade-off
study simply implies that the particular sensor or technology has desirable attributes
based on our understanding of the application and the criteria that we have defined. In all
cases, further investigation of specific technology is warranted to define their actual
application and use.
Table 1. Sensor Trade-Off Table
Attribute Color Legend: 1-3 (red), 4-7 (yellow), 8-10 (green)
Composite Score Legend: 43-236 (red), 237-353 (yellow), 354-430 (green)Desired Attributes Composite
Low Operational High Detection Good High ScoreComplexity Portability Reliability Limit Sensitivity Specificity sum XiGi
Weighting Factors [Xi] 6 8 6 10 5 8Sensing Technology [grade, Gi]Gas Detection Tubes 9 10 8 9 7 8 371Gas Chromatography 5 7 9 10 10 10 370Particle Counter (bulk solids) 8 5 9 9 9 10 357Ionization - PID 8 10 7 9 9 5 345Spectroscopic Sensors 8 7 8 6 7 8 311Gas Monitoring Sensors 7 9 3 6 9 7 293Dielectric Sensor 7 6 7 8 7 2 263Chemical Array Sensors 6 8 5 5 6 5 250Ionization - FID 2 3 6 9 9 3 231Coriolis Sensor 9 5 8 3 7 2 223
The composite score is based on the following percentage of the total range:
50%20% 30%
(green) (yellow) (red)
3.2 SENSOR CONCEPTS AND RECOMMENDATIONS
During this investigation, we compiled a number of possible contaminants that may end up in
LPG (Section 5.0). Given the varying chemical nature of the contaminants it is unreasonable to
expect a single sensor to be able to detect all of them. Then there is the added complication that
some contaminants exist in the gas phase, some in the liquid phase, and some in both. Some of

SwRI Project No. 08-10524March 2005
Investigation of Portable or Hand-Held Devices Page 5for Detecting Contaminants in LPG
the sensors investigated in this report (e.g. spectroscopic and dielectric) are capable of analyzing
both liquids and gases. The sensor cost must be weighed against the risk of delivering
contaminated fuel, the cost to cleanup a contaminated LPG tank, or the damage that the fuel
might cause to a customer's equipment.
Based on the trade-off study, we provide the following general recommendations for pursuing
LPG sensors.
Gas Chromatography (gas and liquid phase)
Gas chromatography might well be considered the "gold standard" because it is widely
applicable to the analysis of both liquids and gases. Although portable GCs are available
they still suffer from the shortcomings of their laboratory grade versions. System
maintenance and frequent calibration is generally required. The need for carrier gas, GC
columns, cost (~$10K+), and the required skill level of the operator make them a poor
candidate for use at the retail level.
Gas Detection Tubes (gas phase)
Gas detection tubes inexpensive (<$1,000 startup), easy to operate, and can provide the
selectivity, sensitivity, and low level detection capability that is needed for this
application. In addition, the tubes yield an approximate quantity of contaminant based on
the progression of the color change in the tube. Few other techniques can provide so
much information on such a wide variety of chemical compounds. Some method
development may be required since proper tube selection is critical. One concern is that
operator subjectivity may affect tube reading. This would primarily affect the
determination of quantity since the color change may lighten as it progresses down the
tube. This technique should at least be applicable to sulfides, mercaptans, ammonia, and
water. The only other concern is operating costs since the tubes may run between $5-10
each.
Gas detection tubes are normally used to sample batches of air for area monitoring.
Obviously, open-air sampling does not apply to LPG analysis. However, a system found
in the literature may be directly applicable to LPG. The system, shown in Figure 1,
consists of a regulator, a flow controller, and a tube holder. The purpose of this simple
system is to analyze cylinders of compressed air for toxic substances. We believe that a

SwRI Project No. 08-10524March 2005
Investigation of Portable or Hand-Held Devices Page 6for Detecting Contaminants in LPG
system of this type could be used in a similar manner for analyzing gas phase LPG
samples. If bulk contamination is all that is required, then this system may be used
directly. If quantification is desirable, then modifications would be needed to meter a
precise volume of sample through the tube.
To expand on this idea, some additional automation could be added to the system. For
example, a pump that delivers a specific volume of gas to the tube could be included
(normal handheld units already do this). Also, a manifold capable of holding a selected
series of gas tubes for different compounds may also prove useful. We envision this
sensor being used in a batch-mode where an LPG sample is withdrawn and brought to the
instrument. The instrument would be simple to operate, inexpensive, and provide batch
sampling for LPG received at the retail outlet.
Figure 1. Compressed Breathing Air Analysis Kit
Particle Counting (liquid phase)
Particle counting also ranked high as a sensing technique. This is the only sensor in this
study that is capable of detecting and quantifying solid particulate matter in a flowing
stream and is therefore intended to be used with liquid propane. They are not normally
intended to be portable but they are small enough that they could be incorporated into a

SwRI Project No. 08-10524March 2005
Investigation of Portable or Hand-Held Devices Page 7for Detecting Contaminants in LPG
portable system. Benchtop units for particle counting are available but they would need
to be modified for liquid propane. With the proper peripheral hardware, mainly a pump
and flow loop, a cylinder of liquid propane could be interfaced to the sensor for analysis.
The startup cost for a particle counting system may be too high for an LPG retailer (at
least $2,000). However, once installed they can run unattended and operator interaction
is minimal. The primary challenge is in determining what sizes and levels of solid
contaminants are problematic. With some minor maintenance and annual calibration, this
mature sensor technology should provide years of dependable service.
Spectroscopic Techniques (gas and liquid phase)
Spectroscopic techniques in general have potential to become reasonable LPG sensors.
Like many of the other sensors, cost is a concern. A portable, off-the-shelf near-infrared
system will start at around $2000 and that doesn’t include the peripheral hardware to
handle the sampling. There are many possible approaches for utilizing spectroscopic
sensors for LPG. Examples include checking for bulk contamination by continuously
monitoring the LPG in-flow or batch sampling to spot check LPG quality in storage
tanks. If ammonia were a real concern, then a diode laser-based system could surely be
designed to detect it in the LPG vapor phase though the cost of materials would be higher
($5000+). Spectroscopic techniques are used in a variety of ways in the refining and fuel
industry and the military has shown some interest in them for portable fuel
(diesel/aviation) quality analyzers.
Measuring for bulk contamination in liquid or gaseous propane is probably the most
realistic application for the short term. The sensor could be designed to "recognize" the
fingerprint of a normal LPG sample (e.g. HD-5 vs commercial propane). Any deviation
from that spectral fingerprint would cause an immediate response from the sensor. Its
sensitivity would be limited to gross changes in composition. In the future, arrays of
single-wavelength sensors may be available to detect trace quantities of multiple analytes
simultaneously. A tunable diode laser system could also be constructed to handle
perhaps 2-3 analytes per system.
SwRI Project No. 08-10524March 2005
Investigation of Portable or Hand-Held Devices Page 8for Detecting Contaminants in LPG
Interface Detection (liquid phase)
Of primary concern is free water in LPG. The specifications for LPG require that it be
sub-saturated, i.e. essentially no water. This is normally not a concern. Since propane
has low density and low viscosity, free water will tend to collect at the bottom of fuel
storage tanks. Some of the sensors that we investigated (e.g. those based on dielectric
measurements) would be able to detect this water if the sensor could be physically
inserted into the bottom of the tank where the water collects. Given the tanks currently in
service, this is likely to be a problem. Surfactants or other chemical compounds that are
partially soluble in LPG (e.g. methanol) can help to suspend water. Generally, with the
right choice of filtration system, free water can be easily removed from a flowing stream.
One possibility would be to include a dielectric-based sensor in the sump of a filter
housing. If a slug of water is encountered it would be filtered out and fall into the sump
where the sensor would detect it and trigger an alarm to stop dispensing. The sump
would need to be drained periodically to prevent false alarms from a slow build-up of
water. Like the particle counters, this technology should be applicable but it is not
intended to be portable.
Although we were unable to find a good example in the literature, it is conceivably
possible to create a non-invasive, non-contact sensor that can detect interfaces through
tank walls. The field-effect sensor is an example of this but it appears to have problems
with metal walls. Additional searching on this subject will undoubtedly reveal related
technologies that can identify liquid/liquid or liquid/solid interfaces in the same way that
a "stud" finder works for locating studs in walls. A report for PERC by The Adept Group
dated 2003 discusses the design and testing of a sonic liquid level gauge that apparently
uses sonic (ultrasonic?) pulses to detect the liquid/gas interface in stationary LPG tanks.
If sensitive enough, this device may be able to sense a liquid/liquid or liquid/solid
interface in the bottom of the tank.
Photoionization Detectors (gas phase)
In general, photoionization detectors are usually incorporated into larger systems to act as
the main detector. For example, PIDs are often used as GC detectors. When used in gas
monitoring systems, the sensor is usually diffusion-based. An LPG system based on a
PID would need to be designed and built. While it is very sensitive, its use in LPG may

SwRI Project No. 08-10524March 2005
Investigation of Portable or Hand-Held Devices Page 9for Detecting Contaminants in LPG
be limited. PIDs operate by ionizing the sample, which is then detected at an electrode.
The compounds that ionize are those whose ionization potential is lower than the energy
of the lamp being used. Propane has a large IP so it won't show a significant response
even with high-energy lamps. However, most of the organic contaminants and the
odorant have low IPs so they will all respond simultaneously and are not separable.
Hence the reason that a GC column is used to physically separate the mixture before
detection by a PID.
Although not necessarily analyte specific, one possible application for an ionization
detector could be a measurement of "bulk contamination." Relative to other petroleum
products, LPG is considerably pure hence the contaminants are generally low
concentration. A high-energy lamp would make most of the potential LPG
"contaminants" detectable while the response from propane would be negligible.
Compounds such as methanol, hydrogen sulfide, mercaptans, ammonia, and propene
would be detectable. Although limits are not yet defined for some of these substances, it
is arguable that the total additive response from all of these compounds for a given
sample size should not exceed some limit. For instance, total sulfur, including the
odorant, must be below 123 ppm for HD-5. Propene concentration may be as high as
5%. Although you wouldn't be able to identify the contaminant, this semi-quantitative
measurement might give an indication of overall contamination. A more realistic use of a
PID might be to verify propane and propene composition. Using one or several of the
sample conditioning techniques described in this report, nearly all contaminants and the
odorant could be selectively removed from the LPG leaving behind primarily propane
and propene. With the appropriate lamp, the propene concentration could be determined.
Needless to say, some experimentation to determine feasibility, some method
development, and construction of an instrument would be required.
Differential Measurements (gas or liquid phase)
Differential measurements may be applied to several of the sensing techniques described
in this report. The greatest challenge with this technique is that it would need to be
designed and built for a specific application. A typical differential measurement scheme
is shown in Figure 2. The incoming LPG (gas or liquid) is split into two streams. One
stream passes though without modification and is analyzed by the sensor (bottom leg).
The other stream (upper leg) is processed in some way and is then analyzed by an

SwRI Project No. 08-10524March 2005
Investigation of Portable or Hand-Held Devices Page 10for Detecting Contaminants in LPG
identical sensor. The two sensor outputs are compared and the resulting output is the
difference between the two sensors. There are other variations on this approach. In the
case of spectroscopic sensors, the light from a laser or source lamp may be split. Each
beam performs a separate analysis and is detected by a different detector and then
compared. Measurements like this also tend to include a reference path where no sample
is analyzed. This is often done to improve the signal to noise ratio.
SampleProcessing
Propane sensors output
Comparator
Figure 2. Basic Differential Measurment
This technique is mostly used to infer the quality of the fuel based on the known changes
that the processing causes in the sample. For example, if a particular conditioning
technique is known to remove water and the differential measurement shows the
processed sample to be different than the unprocessed sample you might infer that the
sample was contaminated with water. This technique might be used to create a
"standard" sample when one is not available. For instance, if the goal is to compare the
collected sample to a "pure" sample of LPG then the "pure" LPG can be generated. In
this case, you might want to pass the sample through several filters (silica gel for water
removal, activated carbon for organics, etc). With proper processing, the resulting
sample would be essentially free of contaminants. In conclusion, this technique may be
best suited for identifying bulk contamination.
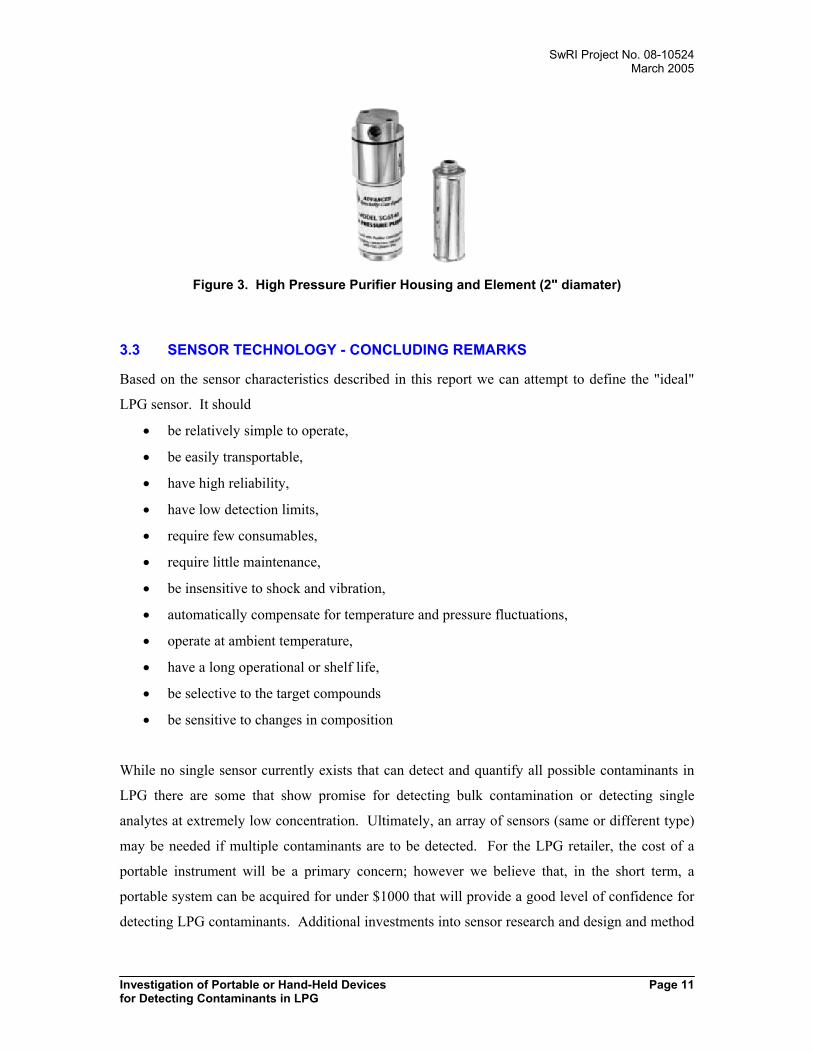
The sample processing section of the instrument does not need to be large. Small
filtration canisters are available which have swappable cartridges (Figure 3). For small
samples, these cartridges should be good for many runs. Depending on the filtration
media, the cartridges may even allow regeneration.
SwRI Project No. 08-10524March 2005
Investigation of Portable or Hand-Held Devices Page 11for Detecting Contaminants in LPG
Figure 3. High Pressure Purifier Housing and Element (2" diamater)
3.3 SENSOR TECHNOLOGY - CONCLUDING REMARKS
Based on the sensor characteristics described in this report we can attempt to define the "ideal"
LPG sensor. It should
• be relatively simple to operate,
• be easily transportable,
• have high reliability,
• have low detection limits,
• require few consumables,
• require little maintenance,
• be insensitive to shock and vibration,
• automatically compensate for temperature and pressure fluctuations,
• operate at ambient temperature,
• have a long operational or shelf life,
• be selective to the target compounds
• be sensitive to changes in composition
While no single sensor currently exists that can detect and quantify all possible contaminants in
LPG there are some that show promise for detecting bulk contamination or detecting single
analytes at extremely low concentration. Ultimately, an array of sensors (same or different type)
may be needed if multiple contaminants are to be detected. For the LPG retailer, the cost of a
portable instrument will be a primary concern; however we believe that, in the short term, a
portable system can be acquired for under $1000 that will provide a good level of confidence for
detecting LPG contaminants. Additional investments into sensor research and design and method

SwRI Project No. 08-10524March 2005
Investigation of Portable or Hand-Held Devices Page 12for Detecting Contaminants in LPG
development will likely be needed to commercialize many of the sensor technologies discussed in
this report and make them suitable for LPG.
While sensors are generally available with sufficient sensitivity to detect low concentrations of
relevant contaminants, the LPG industry should identify and specify what contaminants (and
what level) are the most detrimental. This information could form the basis of a custody transfer
procedure. Use of such a procedure will eventually drive all operations involved in the transport
of LPG towards better control of contaminant levels.
Regarding specific recommendations, we believe that the following are possible solutions that
merit consideration for further investigation and/or development:
• Investigation of a "Gas Tube Manifold" that utilizes several gas detection tubes
simultaneously - One of the concerns with gas detection tubes is interference from other
chemical species (e.g. mercaptans interfering with sulfide measurements). A sample
conditioning system in conjunction with the manifold (or any instrument for that matter)
might be used to eliminate specific interferents.
• Non-intrusive sensors for interface detection that operate through metal containers - This
capability would allow existing tanks to be retrofit without extensive modification. This type
of sensor could serve many industries besides LPG.
• Identification of specific sample conditioning/filtration systems to isolate specific
contaminants - Isolating a particular contaminant could be advantageous in two ways. First,
the isolated material would be more concentrated and thus easier to analyze. Alternatively,
the isolated contaminant is removed from the main sample reducing its effect on the
measurement of other components. This research could also benefit the LPG industry in
general by increasing the general knowledge of LPG filtration.
• The use of particle counting technology in LPG streams (liquid) - Variations on this
technology might be particularly useful in detecting solid contaminants or free water droplets
in real-time.
• Although not particularly affordable yet, tunable lasers are a class of sensor to keep in mind.
We found these very interesting because in some cases they can be tuned to a particular
frequency that is specific to a single chemical compound (e.g. ammonia). If detecting a
particular contaminant was deemed extremely critical, then this may be a viable option.

SwRI Project No. 08-10524March 2005
Investigation of Portable or Hand-Held Devices Page 13for Detecting Contaminants in LPG
To complement each of the above ideas, a better understanding of LPG contaminants and their
effect on specific systems seems warranted.
To conclude our summary of the sensor investigation, we would like to stress that fuel sensors
only constitute one aspect of a successful Fuel Quality Program. A report from PERC claims
that LPG is the only fuel without a filter and this appears to be accurate. To maintain a successful
fuel quality program, the problem must be attacked from several angles. Many of the
contaminants that are believed to be a problem could be efficiently removed with a proper
filtration system. The technology for that filtration system exists today. With a proper filtration
system in place, the sensors discussed in this report would be relegated to periodic spot checks for
product quality assurance.
4.0 PART II - INSTRUMENT EVALUATION
4.1 Technical Approach
The instrument that we investigated is known as the Cyranose 320 (Cyrano Sciences Inc). It
consists of 32 individual thin-film chemiresistors configured into an array. Each individual
detector of the sensor array is a composite material consisting of conductive carbon black blended
throughout a non-conducting polymer. When a composite is exposed to a vapor-phase analyte,
the polymer matrix absorbs the analyte, which causes a concomitant increase in resistance. When
the analyte is removed, the polymer de-gasses causing the film to shrink and return to normal.
The collective output of the array is used to identify an unknown analyte using standard data
analysis techniques.
The unit is trained by measuring vapor "fingerprints" representative of the samples you intend to
analyze. Future measurements are then compared to these patterns to identify (i.e. classify) the
vapor. The unique polymer composite sensors have been shown to respond to a wide range of
organic compounds. Such a device, which is sensitive to a variety of volatile organic compounds,
might be used to "fingerprint" LPG (that meets required specifications) and form a basis for
future comparison to similar fuels. The Cyranose 320 is not necessarily an analytical tool for
detecting and quantifying individual chemical compounds in a complex mixture. Rather, its
strength lies in its ability to fingerprint complex odors and vapors and classify them using pattern
recognition algorithms.

SwRI Project No. 08-10524March 2005
Investigation of Portable or Hand-Held Devices Page 14for Detecting Contaminants in LPG
4.2 Summary of Results
The focus of this experimentation was to investigate the sensitivity of the Cyranose 320 to a
variety of chemical compounds that may exist in LPG. Initially, we investigated pure compounds
such as plasticizers, alcohols, and hydrocarbons. The results were generally very good with the
instrument showing good separation between distinct compound classes. From there, we
attempted to detect low concentrations of contaminants in a hydrocarbon matrix to simulate LPG.
The results here were mixed. We found that compounds with high vapor pressures, such as
alcohol, could be easily detected in the headspace above the liquid hydrocarbon. However,
compounds such as plasticizers that have very low vapor pressures could not be reliably detected.
We conducted some limited testing with propane and found essentially identical results. We were
only able to see differences between propane samples that were grossly different (e.g. with and
without odorant). For further details, please see Section 12.0 in Appendix B.
4.3 Recommendations
Generally, we found the Cyranose 320 to be very sensitive and performed as advertised. Its
ability to distinguish chemical compounds with very similar structural features was outstanding.
Apparently, this ability lies in its large, 32-sensor array where each sensor is unique. Although
truly a handheld device, it might be somewhat difficult to implement at the retail level in its
current configuration. Furthermore, the Cyranose 320 is probably cost prohibitive (~$8000) for
most small retail outlets. Its major shortcomings are its inability to provide a quantitative analysis
and the potentially complicated calibration procedures. Calibration would be difficult because it
must be trained to recognize particular classes of samples that one expects to encounter in the
field. In addition, these calibrations would need to be updated periodically as the sensors age and
their responses change. The design of the instrument must also be taken into consideration. The
Cyranose 320 is not designed for high-pressure operation. The sample vapors must be near
atmospheric pressure and at ambient temperature. The primary application of the Cyranose 320
to LPG would be in detecting gross changes in composition, e.g. commercial propane vs. HD-5 or
lack of odorant. Batch sampling would be required and the instrument would be limited to the
analysis of vapor phase samples. As a result, compounds such as plasticizers that primarily exist
in the liquid phase may go undetected.

SwRI Project No. 08-10524March 2005
Investigation of Portable or Hand-Held Devices Page 15for Detecting Contaminants in LPG
APPENDIX ALiterature Review

SwRI Project No. 08-10524March 2005
Investigation of Portable or Hand-Held Devices Page 16for Detecting Contaminants in LPG
5.0 LPG QUALITY
5.1 LPG Composition
Compared to other combustible fuels, such as diesel and gasoline, LPG is a simple fuel in terms
of composition. Its primary component, propane (C3H8), is a colorless and odorless gas derived
from petroleum sources such as natural gas and crude oil. At atmospheric pressure and
temperature propane is a gas but it is easily liquefied under moderate pressures (e.g. 123.7 psia at
70ºF). LPG is sold as three different grades whose propane concentrations vary from around 50-
90%. LPG specifications are documented in two essentially equivalent standards: GPA Standard
2140 provided by the Gas Processors Association (GPA) and ASTM D 1835 (Table 2).
Table 2. GPA 2140-97 LPG Specifications
Component CommercialPropane
HD-5Propane
CommercialButane/Propane Mix
TestMethod(ASTM)
Composition Propane andpropylene
90% propane(min)
5% propylene(max)
butanes/ butyleneswith
propane/ propylenes
Butane+, liq vol 2.5% max 2.5% max --Pentane+, liq vol -- -- 2.0% max
D-2163
Moisture Content pass pass -- D-2713Residual Matter (mL) 0.05 mL 0.05 mL -- D-2158Total Sulfur ppm(incl. odorant) 185 123 140 D-2784
Cu Strip Corrosion,max No. 1 No. 1 No. 1 D-1838
Vapor Pressure100ºF, psig max38ºC, kPa, max
2081434
2081434
2081434
D-1267
5.2 LPG Contaminants
Because of its simple composition, one might assume that LPG fuel quality issues are rare and
remediation efforts are minimal. However, despite its simplicity users of LPG will encounter fuel
quality issues similar to that of liquid petroleum fuels. The general consensus is that the majority
of LPG leaving the point of production or import meets applicable commercial specifications.
For that matter, most LPG is believed to meet the more stringent HD-5 specification. This is
fortunate because although the commercial grade propane is generally acceptable for residential,
SwRI Project No. 08-10524March 2005
Investigation of Portable or Hand-Held Devices Page 17for Detecting Contaminants in LPG
agricultural, and industrial use, motor vehicles that operate on LPG are particularly susceptible to
contamination. New emission regulations for vehicles, forklifts, and industrial and agricultural
engines are requiring more sophisticated fuel systems that are more sensitive to contaminants.
One element of LPG usage that isn't well documented is exactly how far off-specification a fuel
can drift before it begins to create problems in end-use applications.
This places the LPG industry in a quandary - how to handle LPG for those applications that are
sensitive to fuel composition. Producing all LPG to the HD-5 specification may be overkill since
the majority of applications can use commercial grade propane. The alternative is to handle
multiple grades of LPG. This would likely place a burden on the supply chain, requiring separate
storage tanks and driving costs up.
Problems with LPG contamination begin from the moment the LPG leaves the supply point.
Throughout the vast LPG supply chain there are many places that LPG can pick up contamination
including pipelines, rail cars, ships, storage tanks, tanker trucks, and delivery vehicles. The
contamination at each point of transfer is probably very small. After many years of
accumulation, sludge consisting of heavy residuals and water-soluble materials can collect in tank
bottoms if left unchecked.
For the purpose of this document we will define "contamination" as any change in LPG
composition outside of the relevant specification. Therefore, besides obvious contaminants like
water, contamination also includes incorrect proportions of normal LPG components like
propylene. The LPG specifications say very little with regard to contaminants. Indeed, not
enough is known about specific LPG contaminants and their effects to place limits on them.
Most of these are true contaminants - compounds that were not part of the LPG as it was
produced or imported. The typical types of contaminants reportedly found in LPG samples
include
• ammonia,
• methanol,
• water,
• excessive sulfur (beyond what is intentionally added),
• fluorides,
• metal particles from fuel system components (Cu, Zn, Pb, Fe, etc),
• common dirt,
SwRI Project No. 08-10524March 2005
Investigation of Portable or Hand-Held Devices Page 18for Detecting Contaminants in LPG
• heavy hydrocarbons (lubricating oils),
• plasticizers (phthalates, adipates, sebacates) leached from hoses, and
• excessive ethane, butane ethylene, propylene, etc.
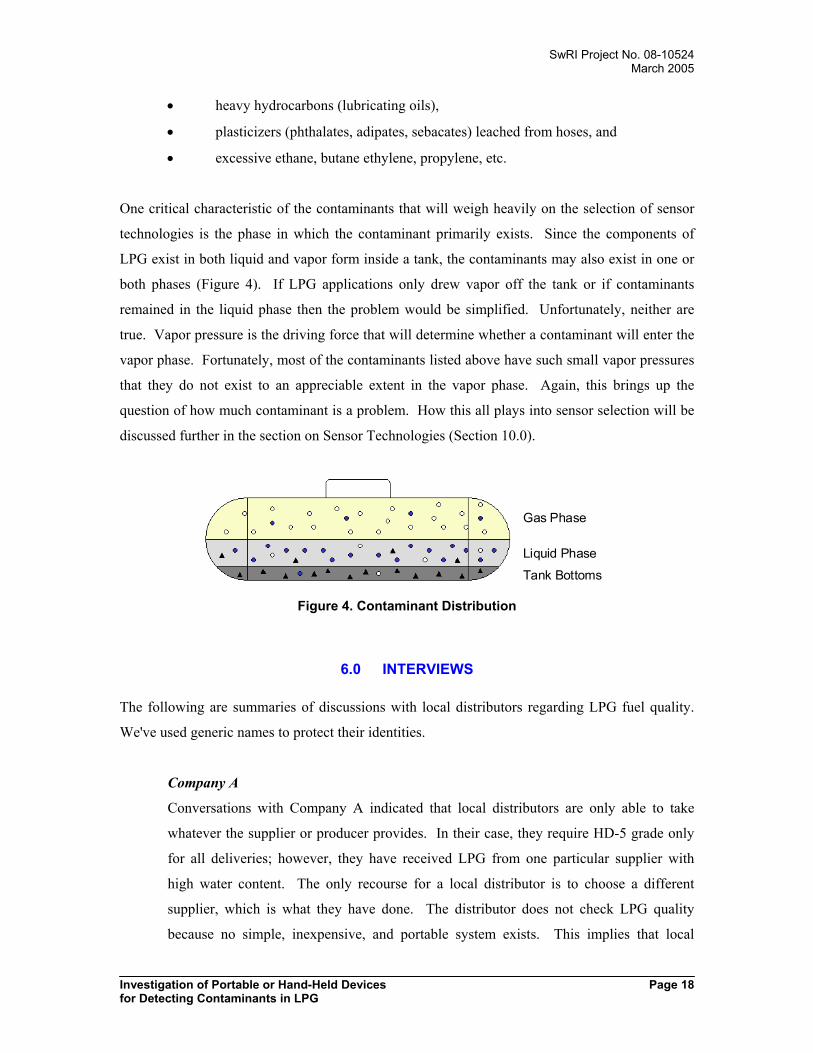
One critical characteristic of the contaminants that will weigh heavily on the selection of sensor
technologies is the phase in which the contaminant primarily exists. Since the components of
LPG exist in both liquid and vapor form inside a tank, the contaminants may also exist in one or
both phases (Figure 4). If LPG applications only drew vapor off the tank or if contaminants
remained in the liquid phase then the problem would be simplified. Unfortunately, neither are
true. Vapor pressure is the driving force that will determine whether a contaminant will enter the
vapor phase. Fortunately, most of the contaminants listed above have such small vapor pressures
that they do not exist to an appreciable extent in the vapor phase. Again, this brings up the
question of how much contaminant is a problem. How this all plays into sensor selection will be
discussed further in the section on Sensor Technologies (Section 10.0).
Gas Phase
Liquid Phase
Tank Bottoms
Figure 4. Contaminant Distribution
6.0 INTERVIEWS
The following are summaries of discussions with local distributors regarding LPG fuel quality.
We've used generic names to protect their identities.
Company A
Conversations with Company A indicated that local distributors are only able to take
whatever the supplier or producer provides. In their case, they require HD-5 grade only
for all deliveries; however, they have received LPG from one particular supplier with
high water content. The only recourse for a local distributor is to choose a different
supplier, which is what they have done. The distributor does not check LPG quality
because no simple, inexpensive, and portable system exists. This implies that local

SwRI Project No. 08-10524March 2005
Investigation of Portable or Hand-Held Devices Page 19for Detecting Contaminants in LPG
distributors could possibly impact LPG quality by only accepting bulk fuel that is
contaminant free.
Company B
Conversations with Company B confirm the bulk of the comments offered by Company
A in terms of quality of fuel purchased. Specifically, Company B purchases HD-5 grade
with no verification of fuel quality at the receiving terminal. In other words, their local
operations simply take what their suppliers deliver, although they smell the gas for any
obvious and easily detectable problems. Company B does routinely sniff containers that
they fill to insure that no leaks are present. This is accomplished with a small electronic
hand held device.
We inquired that if a simple inexpensive handheld device for fuel quality determination
were available, would they use such a device? They replied in the affirmative and would
be willing to pay several hundreds of dollars for such a unit. Company B said such a unit
would easily pay for itself if it prevented the loading of tanks with contaminated gas.
Many local companies load 25,000 gallons or more per day in domestic tanks. If a bad
load of fuel were delivered, the cleanup cost (pulling fuel out and inspection of tanks)
could be very significant.
7.0 LPG SENSOR SPECIFICATION
7.1 Objective
A sensor specification was generated for use as a guideline for developing a Design Specification
and/or a Performance Specification for selected LPG sensor technologies. Given that each
technology may have a unique goal (e.g. identifies a specific contaminant, measures a bulk
property, etc), the sensor characteristics defined herein should be considered for relevance when
designing a handheld or portable LPG instrument. Given current LPG quality requirements as
documented in such publications as GPA 2140-97 and ASTM D1835, the expected level of
performance should also be considered. The purpose of this specification is to document desired
sensor characteristics and provide a template for comparing selected LPG sensor technologies.
SwRI Project No. 08-10524March 2005
Investigation of Portable or Hand-Held Devices Page 20for Detecting Contaminants in LPG
This specification is a living document and is subject to modification as requirements and
technology change. Current work involving the identification of LPG contaminants and their
effect on fuel-system components will undoubtedly affect the focus of future sensor
developments. The sensor specification can found in the Appendix, Section Error! Reference
source not found..
7.2 Subsystem Definition
A valid approach for designing any complex system is to break it down into a collection of
subsystems each performing a specific function. Detailed requirements are then generated for
each subsystem and interface protocols are defined between each subsystem. When designed and
integrated properly, the combined cooperation of these subsystems should yield an instrument
that performs according to the performance requirements established for that application.
Tentatively, we have chosen to divide the LPG sensor system into the following requirement
areas:
(a) Packaging
(b) Power
(c) Sample Handling and Preparation
(d) Sensor System
(e) Control System
(f) Operator Interface
(g) Data Interface
Detailed requirements for most of these subsystems will be beyond the scope of this
investigation. For instance, subsystems (a), (b), (e), (f), and (g) are strongly dependent on the
needs of a particular sensor system and its peripheral hardware. In our investigations, we will
primarily focus on subsystems (c) Sample Handling and Preparation and (d) Sensor System for
sensor technologies with potential merit. These subsystems are inherently tied together because
particular sensor systems typically have unique requirements for sample introduction and
preparation.

SwRI Project No. 08-10524March 2005
Investigation of Portable or Hand-Held Devices Page 21for Detecting Contaminants in LPG
In this document, we will define the basic or overall characteristics that should be considered
while investigating selected LPG sensor technologies. Then where possible, detailed
characteristics for each subsystem will be identified. Requirements defined in this document
should be considered as minimum desired requirements.
7.2.1 Packaging
This requirement defines the external packaging of the instrument. Since the intended application
is a portable instrument, the instrument will be subjected to harsh environments. Therefore, the
packaging must accommodate the environment in which it is expected to operate, such as shock
and vibration, wet and potentially explosive environments, and atmospheric temperature and
pressure extremes. Depending on the intended area of usage, the area classification should be
considered and the relevant standards obeyed (e.g. NFPA, NEC).
7.2.2 Power
This requirement determines the means by which power can be supplied to drive the sensor. For
a given application, one should determine the expected area of usage and the types of power that
will be available (e.g. battery power, 12/24 VDC, 120 VAC). At least two options should be
provided and internal power regulation, if required, should also be defined. If battery operated,
then rechargeable batteries should be considered. Given the nature of the application,
consideration should be given to a design that is intrinsically safe and obeys relevant electrical
codes.
7.2.3 Sample Handling and Preparation
This requirement defines the hardware and procedures by which a collected LPG sample is
introduced to the sensor. LPG can exist in both a liquid or gaseous state and the means to present
a representative sample to the sensor is critical.
7.2.4 Sensor System
The sensor system provides the fundamental functionality of the instrument. This requirement
defines the characteristics of the sensor such as type, operational requirements, consumables,
power consumption, etc.

SwRI Project No. 08-10524March 2005
Investigation of Portable or Hand-Held Devices Page 22for Detecting Contaminants in LPG
7.2.5 Control System
This requirement defines the control system for the entire instrument. Some computer processing
is inevitable given the state of most advanced sensor technologies. The control system should
define the requirements for instrument control, data acquisition, data processing, and display.
The Control System is the core of the instrument and binds all of the functionality together to
create a working system.
7.2.6 Operator Interface
This requirement defines the interface by which the operator interacts with the sensor system.
Depending on the needs of a particular sensor and application, the interface may be as simple as
buttons and LED indicators or as sophisticated as a touch-screen display.
7.2.7 Data Interface
It is rather likely that data collected with the instrument will become part of an audit trail for
tracking fuel quality. As a result, the data will need to be well documented for permanent records
and password protected to prevent tampering with data or calibration files. This requirement
defines the hardware and software protocols (e.g. serial) for externally interfacing to the
instrument and extracting stored records. The Data Interface may also be used to update internal
software. It is recommended that non-proprietary or open data protocols are incorporated into the
unit.
7.3 Summary Characteristics
Table 3 provides a summary of subsystem characteristics recommended for consideration when
performing trade-off studies of relevant LPG sensor technologies. Some modification of the
requirements may be needed for a given application.

SwRI Project No. 08-10524March 2005
Investigation of Portable or Hand-Held Devices Page 23for Detecting Contaminants in LPG
Table 3. Summary Table
Requirement Type Characteristic Requirements
Ruggedness Designed to withstand moderateshock and vibration
Transportability
Can withstand airfreight cargopressuresX-ray hardened for securityinspection points
Operating Temperature-20°C (-4°F) to +40°C (104°F) min-40°C (-40°F) to +50°C (122°F)desired
Storage Temperature -20 to +70 °C desiredHumidity 0 to 95%, non-condensing
Area Classification reference current codes (NFPA,NEC, etc)
Chemical Compatibility Hydrocarbons/Water
Weather Conditions Sealed to withstand outdoorenvironments
Weight and Size
Portable by an individual or vehiclemountable
Should not interfere with normaloperations
Packaging
Hardware Commercial off-the-shelfcomponents where possible
Battery Power Rechargeable/replaceable batteriesBattery Life (NormalOperating Conditions) 3 hours
Vehicle Power 12/24 VDCFacility Power 100-240 VAC with universal adapter
Battery Backup Replaceable, internal battery to storeconfiguration, minimum 10-year life
Power
Battery Charging Internal or External
Working Pressure reference current ASME, DOT, etc.regulations
Burst Pressure 3X working pressure
Sample Temperature Maintain as needed for the specificapplication
Remote Sampling Allow sample to be collectedremotely and brought to instrument
Setup & Configuration Time Minimize
Automated Automate sample handling throughautomated controls where possible
Sample Handling andPreparation
Safety Reduce sample volumeEliminate ignition sources
Sensor System Reliability MTBF ≈ 1 year
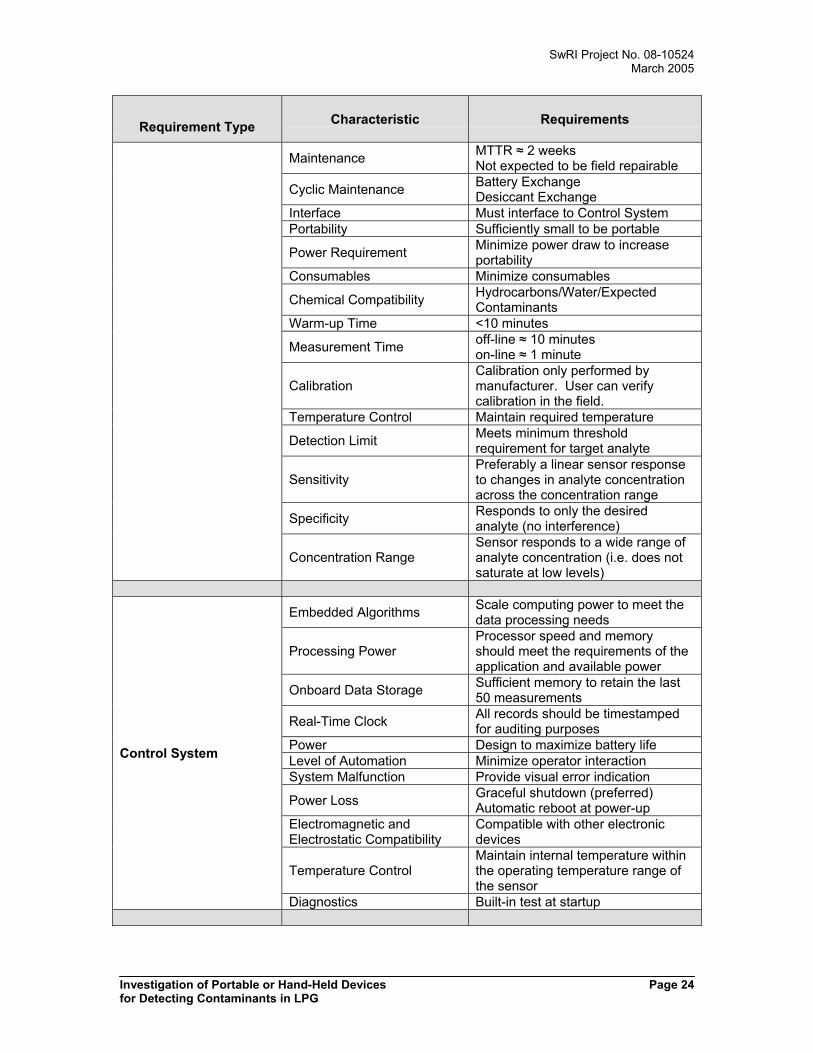
SwRI Project No. 08-10524March 2005
Investigation of Portable or Hand-Held Devices Page 24for Detecting Contaminants in LPG
Requirement Type Characteristic Requirements
Maintenance MTTR ≈ 2 weeksNot expected to be field repairable
Cyclic Maintenance Battery ExchangeDesiccant Exchange
Interface Must interface to Control SystemPortability Sufficiently small to be portable
Power Requirement Minimize power draw to increaseportability
Consumables Minimize consumables
Chemical Compatibility Hydrocarbons/Water/ExpectedContaminants
Warm-up Time <10 minutes
Measurement Time off-line ≈ 10 minuteson-line ≈ 1 minute
CalibrationCalibration only performed bymanufacturer. User can verifycalibration in the field.
Temperature Control Maintain required temperature
Detection Limit Meets minimum thresholdrequirement for target analyte
SensitivityPreferably a linear sensor responseto changes in analyte concentrationacross the concentration range
Specificity Responds to only the desiredanalyte (no interference)
Concentration RangeSensor responds to a wide range ofanalyte concentration (i.e. does notsaturate at low levels)
Embedded Algorithms Scale computing power to meet thedata processing needs
Processing PowerProcessor speed and memoryshould meet the requirements of theapplication and available power
Onboard Data Storage Sufficient memory to retain the last50 measurements
Real-Time Clock All records should be timestampedfor auditing purposes
Power Design to maximize battery lifeLevel of Automation Minimize operator interactionSystem Malfunction Provide visual error indication
Power Loss Graceful shutdown (preferred)Automatic reboot at power-up
Electromagnetic andElectrostatic Compatibility
Compatible with other electronicdevices
Temperature ControlMaintain internal temperature withinthe operating temperature range ofthe sensor
Control System
Diagnostics Built-in test at startup
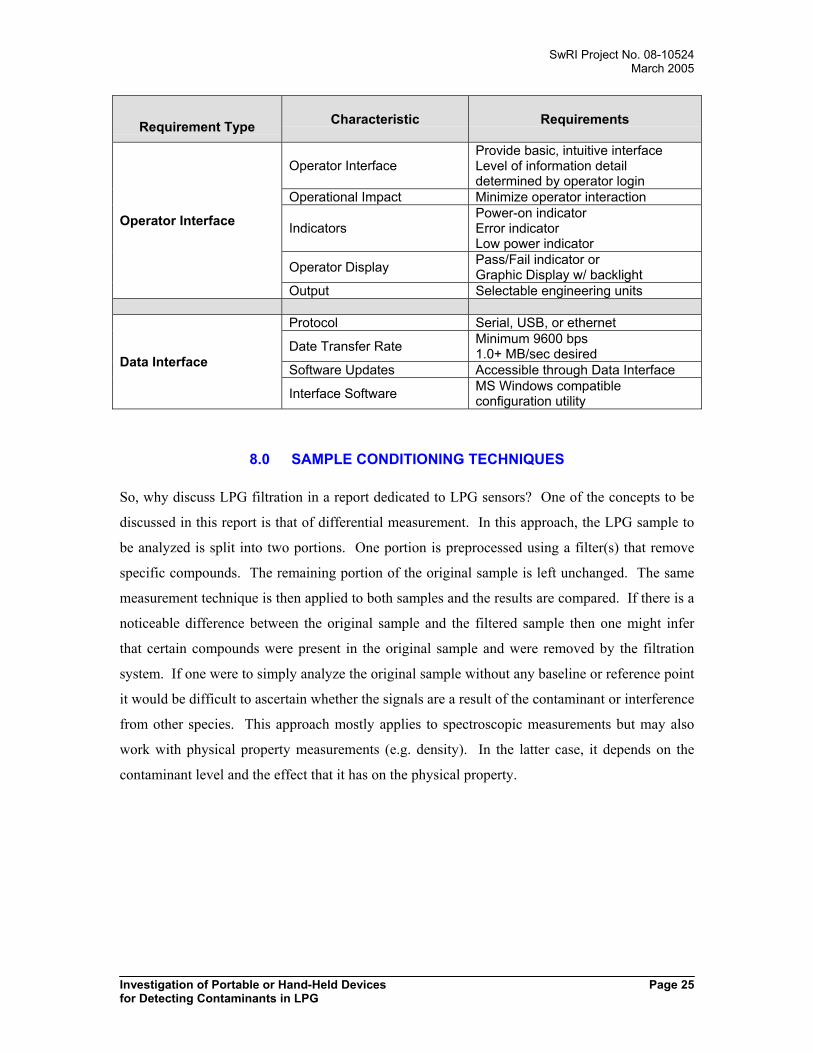
SwRI Project No. 08-10524March 2005
Investigation of Portable or Hand-Held Devices Page 25for Detecting Contaminants in LPG
Requirement Type Characteristic Requirements
Operator InterfaceProvide basic, intuitive interfaceLevel of information detaildetermined by operator login
Operational Impact Minimize operator interaction
IndicatorsPower-on indicatorError indicatorLow power indicator
Operator Display Pass/Fail indicator orGraphic Display w/ backlight
Operator Interface
Output Selectable engineering units
Protocol Serial, USB, or ethernet
Date Transfer Rate Minimum 9600 bps1.0+ MB/sec desired
Software Updates Accessible through Data InterfaceData Interface
Interface Software MS Windows compatibleconfiguration utility
8.0 SAMPLE CONDITIONING TECHNIQUES
So, why discuss LPG filtration in a report dedicated to LPG sensors? One of the concepts to be
discussed in this report is that of differential measurement. In this approach, the LPG sample to
be analyzed is split into two portions. One portion is preprocessed using a filter(s) that remove
specific compounds. The remaining portion of the original sample is left unchanged. The same
measurement technique is then applied to both samples and the results are compared. If there is a
noticeable difference between the original sample and the filtered sample then one might infer
that certain compounds were present in the original sample and were removed by the filtration
system. If one were to simply analyze the original sample without any baseline or reference point
it would be difficult to ascertain whether the signals are a result of the contaminant or interference
from other species. This approach mostly applies to spectroscopic measurements but may also
work with physical property measurements (e.g. density). In the latter case, it depends on the
contaminant level and the effect that it has on the physical property.

SwRI Project No. 08-10524March 2005
Investigation of Portable or Hand-Held Devices Page 26for Detecting Contaminants in LPG
The information contained in this section of the report is provided for completeness and reference
in future work. The discussions that follow will introduce some of the more common filtration
techniques, which include:
• Molecular Sieves (zeolite or carbon-based)
• Activated Alumina
• Activated Carbon
• Silica Gel
• Coalescent Filters
• Strippers
• Particulate Filters
8.1 Molecular Sieves (Zeolite)
Molecular sieves are adsorbents consisting of crystalline aluminosilicates (zeolites) and clay. The
main characteristic of zeolitic molecular sieves is their well-defined pore-size and uniform porous
structure. Zeolites are "activated" by heating to remove the water trapped within their cage-like
network.
Molecular separation by zeolite-type absorbents occur in two ways:
• Separation by size - only molecules with a diameter smaller than the zeolite pore size can
enter and be absorbed. Molecular diameter is measured in angstroms (Å) or 10-10 meters.
• Separation by polarity - zeolites have an affinity for highly polar compounds
Critical Diameter (Å) ExamplesH2O, CO2, CO, O2 2.8N2 3.0NH3, H2S 3.6methane 4.0ethane, methanol, ethanol 4.4propane, nC4-nC22 4.9propylene 5.0ethyl mercaptan, butenes 5.1
Increasing Polarity / AdsorptionH2ONH3alcohols (methanol), aldehydes,ketonesSO2H2S, mercaptansalkynesalkenesCO2alkanesmethaneCO

SwRI Project No. 08-10524March 2005
Investigation of Portable or Hand-Held Devices Page 27for Detecting Contaminants in LPG
The selectivity of a zeolite toward specific chemical adsorbates is affected by several parameters:
• zeolite type• pore diameter• adsorbate molecule's shape, chemical structure, critical diameter, polarity, and
polarizability.• adsorbate concentration or partial pressure• temperature
Critical diameter is an important factor that determines whether or not a molecule will fit through
the zeolites pore opening and into the crystalline lattice where it can interact with the active
surface. The only exception to this criterion may be at elevated temperatures where the elasticity
of the adsorbate (polarizability) or the slight mobility of the molecular sieve network may allow
larger molecules to "squeeze" through. Polarity is also a driving factor in adsorption - zeolites
have an affinity for strongly polar compounds.
Unlike alumina and silica, zeolites have a high adsorption capacity for relatively low
concentrations of adsorbate. This is important for LPG whose contaminants are generally in very
low concentrations. Furthermore, zeolites adsorption capacity is less affected by temperature
then other adsorbents.
Regeneration of the molecular sieves can be accomplished in several ways including thermal
regeneration, pressure swing desorption, or elution. Thermal regeneration is the most common
and involves heating the adsorbent bed to desorb the contaminant molecules. Pressure swing
desorption works by pulling a vacuum across the bed to accelerate the degassing process. Elution
displaces the adsorbed compounds with another liquid/gas that preferentially adsorbs in the sieve.
Common uses of zeolites in LPG treatment
include removal of H2S, H2O, and
mercaptans.
8.2 Activated Alumina
Alumina is commonly used in LPG drying
and is reportedly the most economical
desiccant given its range of application.
Chemisorption
Involves the formation of strongchemical bonds between the adsorbatemolecules and the surface locationsthat are chemically active.
Physisorption
Caused mainly by van der Waals forcesand electrostatic interactions betweenadsorbate molecules on the adsorbentsurface.

SwRI Project No. 08-10524March 2005
Investigation of Portable or Hand-Held Devices Page 28for Detecting Contaminants in LPG
Activated alumina is less expensive than silica gel or molecular sieves but has a lower capacity
for water. Alumina generally has a high affinity for polar compounds like water.
Adsorption, the reversible fixation of molecules to a surface, occurs in three ways with alumina:
• Chemisorption - forms the first layer at the alumina surface
• Physisorption - formation of subsequent layers through hydrogen bonding
• Capillary condensation - local condensation of "contaminant" molecules at temperatures
above the bulk fluid's dew point
Benefits of alumina include a high surface area, a high pore volume, and high mechanical
strength. Pore size distribution can sometimes be tailored for a specific application allowing
elimination of selective species. Factors that favor adsorption into the alumina include low
temperature, high partial pressure, and high condensation temperature.
When used on a large scale, alumina beds can be regenerated by desorption. Regeneration can be
accomplished by exposure to a hot inert gas at reduced pressure. Like other adsorbents, several
grades of alumina are offered. Each grade typically serves a specific purpose and can be
designed to selectively remove specific contaminants. Examples include drying of air or organic
liquids like LPG, CO2 removal from air, and selected removal of fluorinated hydrocarbons from
gases and liquids.
8.3 Activated Carbon
Combined with a high surface area and porous internal structure, activated carbon is commonly
used for the removal of organic chemicals from both liquids and gases. In industry they play a
significant role in the purification and recovery of chemicals. The amount of material removed
depends on the capacity of the activated carbon as well as the chemical affinity of the material for
the carbon. Their unique properties and low cost compared with that of competitive adsorbents
make them popular alternatives.
8.3.1 Molecular Sieves (Carbon)
Carbon molecular sieves (CMS) are a special class of activated carbons. The physical distinction
between activated carbons and carbon molecular sieves is not always clear. Generally, carbon

SwRI Project No. 08-10524March 2005
Investigation of Portable or Hand-Held Devices Page 29for Detecting Contaminants in LPG
molecular sieves will have most of their pores in the same molecular size range. Some activated
carbons may also have very small pores. The primary difference is in their method of separation.
Activated carbons separate molecules according to their adsorption equilibrium constants (i.e.
capacity) while carbon molecular sieves provide molecular separations based on the rate of
adsorption. The rate of adsorption consists of two important factors: the capacity of the sieve at
equilibrium, and the diffusivity, or rate of diffusion into the porous material. The extent of
molecular sieving can be defined as the ratio of the rate of adsorption of one molecule to another.
Carbon molecular sieves are non-crystalline or amorphous and are described as platelets of
carbon separated by interstitial spaces. The size of the spaces are influenced by several factors
including foreign atoms between the layers, side chains, and cross-linking. This is in contrast to
the inorganic oxide molecular sieves (zeolites) which have a well-ordered crystalline structure.
Although amorphous in nature, carbon molecular sieves have some advantages over zeolite
molecular sieves:
• High temperature stability (in some cases as high as 1500°C)
• Chemically compatible with acidic media.
• Low affinity for water.
• Easy to make relative to zeolites.
8.4 Silica Gel
Silica gel is a widely used desiccant. Common uses include natural gas dehydration and
hydrocarbon recovery units. Silica gel is easily regenerated by heating. Its capacity (and cost) is
higher than alumina but lower than molecular sieves.
8.5 Filter/Separators
Coalescer Elements
Coalescers are commonly used
throughout the petroleum industry to
filter solids and separate immiscible
liquids. The most common use for
coalescers is filtration and separation
of water from aviation and diesel.
Examples of Coalescent Filter Housings
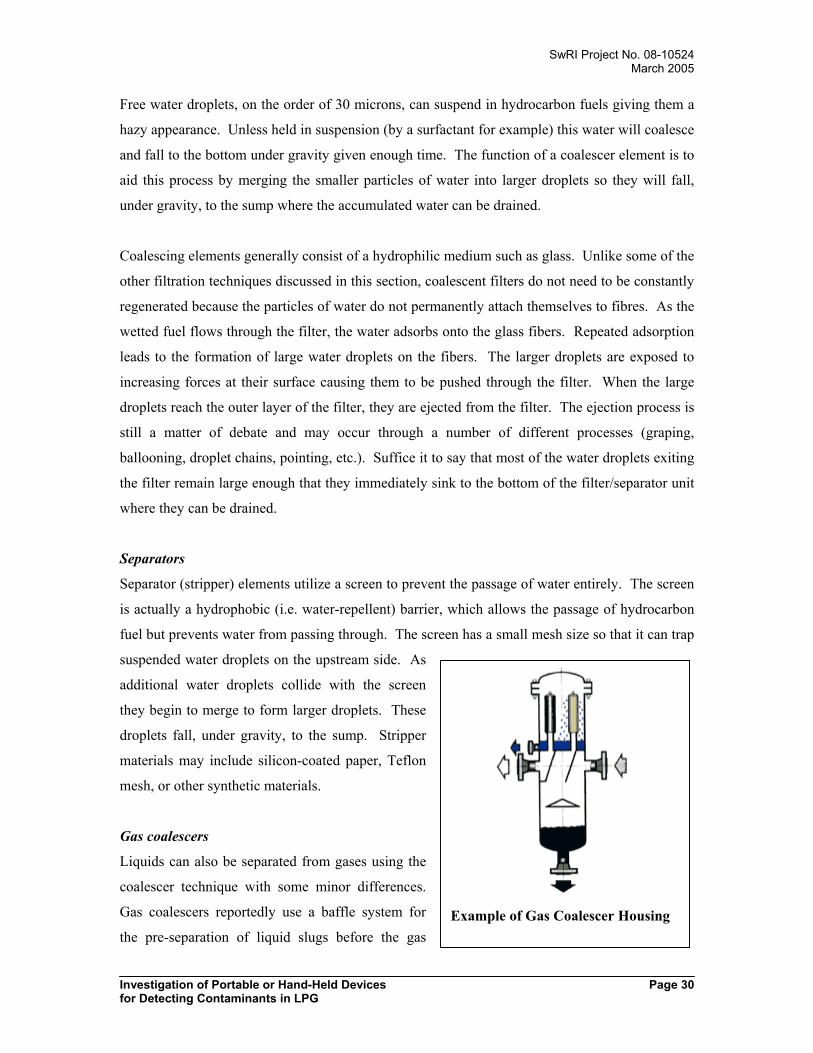
SwRI Project No. 08-10524March 2005
Investigation of Portable or Hand-Held Devices Page 30for Detecting Contaminants in LPG
Free water droplets, on the order of 30 microns, can suspend in hydrocarbon fuels giving them a
hazy appearance. Unless held in suspension (by a surfactant for example) this water will coalesce
and fall to the bottom under gravity given enough time. The function of a coalescer element is to
aid this process by merging the smaller particles of water into larger droplets so they will fall,
under gravity, to the sump where the accumulated water can be drained.
Coalescing elements generally consist of a hydrophilic medium such as glass. Unlike some of the
other filtration techniques discussed in this section, coalescent filters do not need to be constantly
regenerated because the particles of water do not permanently attach themselves to fibres. As the
wetted fuel flows through the filter, the water adsorbs onto the glass fibers. Repeated adsorption
leads to the formation of large water droplets on the fibers. The larger droplets are exposed to
increasing forces at their surface causing them to be pushed through the filter. When the large
droplets reach the outer layer of the filter, they are ejected from the filter. The ejection process is
still a matter of debate and may occur through a number of different processes (graping,
ballooning, droplet chains, pointing, etc.). Suffice it to say that most of the water droplets exiting
the filter remain large enough that they immediately sink to the bottom of the filter/separator unit
where they can be drained.
Separators
Separator (stripper) elements utilize a screen to prevent the passage of water entirely. The screen
is actually a hydrophobic (i.e. water-repellent) barrier, which allows the passage of hydrocarbon
fuel but prevents water from passing through. The screen has a small mesh size so that it can trap
suspended water droplets on the upstream side. As
additional water droplets collide with the screen
they begin to merge to form larger droplets. These
droplets fall, under gravity, to the sump. Stripper
materials may include silicon-coated paper, Teflon
mesh, or other synthetic materials.
Gas coalescers
Liquids can also be separated from gases using the
coalescer technique with some minor differences.
Gas coalescers reportedly use a baffle system for
the pre-separation of liquid slugs before the gasExample of Gas Coalescer Housing
SwRI Project No. 08-10524March 2005
Investigation of Portable or Hand-Held Devices Page 31for Detecting Contaminants in LPG
enters the coalescer. This improves the separation efficiency of the coalescer element and
increases its life by preventing a large differential pressure across the filter. The process whereby
water droplets fall out of a hydrocarbon fuel under gravity is strongly influenced by the viscosity
of the fuel. The lower the hydrocarbon viscosity, the more easily the water droplets can move
through the fuel. Since the viscosity of a gas is even lower than that of a liquid, gas coalescers
may operate without separators. The droplets formed by the coalescers settle under gravity
without the need for separators to remove carry-over droplets.
8.6 Particulate Filters
Particulate filters are used to remove solid debris from liquid hydrocarbon streams. Other than
basket strainers to remove large objects like nuts and bolts, the particulate filter is usually the first
line of defense in the filtration sequence. Although coalescer elements may also remove
particulate matter, they're not designed to handle large amount of particulate matter. Particulate
filters are generally constructed of cellulose or synthetic fibers and are rated according to the
micrometer (a.k.a. micron) size of the debris that they can efficiently remove. A common
practice is to use a sequence of particulate filters with decreasing micron ratings as you move
downstream. Each successive filter removes smaller and smaller particulates. This prevents tight
(i.e. small micron) filters from clogging too quickly when large particles are encountered.
8.7 Sample Conditioning - Application to Portable LPG Sensors
Selective filtration may play a significant role in the ability to analyze for certain compounds.
For instance, the ability to remove compounds that interfere with certain measurement techniques
or the ability to separate and gather other compounds may prove useful (e.g. detecting coalesced
water). As mentioned earlier, the use of differential measurement techniques will also rely on
filtration to create a reference sample void of contaminants. While some filtration media (e.g.
silica gel and zeolites) can be regenerated, there is no reason to require that to be done at the
instrument. Small filter canisters that use swappable cartridges can be used and if possible the
canisters can be regenerated elsewhere.
SwRI Project No. 08-10524March 2005
Investigation of Portable or Hand-Held Devices Page 32for Detecting Contaminants in LPG
9.0 LPG SAMPLING
9.1 The Sampling Environment
The local LPG retailer usually encounters the expense of servicing and support for their
customers who range from businesses that run fleets of LPG powered forklifts to the servicing of
the many storage tanks in rural America. Many of these expenses for service calls and
component replacement are related to off-specification and contaminated fuels. Local retailers
would have better bottom line fiscal control of their businesses and provide improved services if
they would verify the quality of LPG as a condition of acceptance. Therefore, an important
question is where (and by whom) should fuel be sampled and what measurements make sense?
When accepting shipment of LPG, the common practice for the local LPG retailer is to assume
that the shipment from the supplier is of specified quality and generally no confirmation of the
LPG quality is obtained. Unfortunately, the retailer has no knowledge of the processing history
of the LPG nor does the retailer have any history of the shipping route taken by the fuel. Since
there are numerous opportunities for the fuel to pick up contaminants during shipment, it is not
uncommon for fuel loads to contain water, ammonia, hydrogen sulfide, and plasticizers, to name
a few. In the context of obtaining sufficient information at the custody transfer point (shipper to
local retailer) needed for shipment acceptance, LPG quality determination by a relatively simple
and quick method is essential which also implies that a practical sampling method is required.
A second area where sampling is important is within a storage tank, especially those that have
been in use for several years. These tanks collect contaminants such as water and particulate
matter. Eventually, these lead to fouling of downstream regulators and burners. Early detection
of accumulated contaminates will allow for scheduling of tank reclamation or replacement in a
manner least disruptive to service.
If LPG quality and contaminant determination could be obtained by well-established non-
invasive measurement techniques, then the physical gathering of fuel samples for analysis would
not be necessary. Non-invasive techniques may become available, but in the immediate future
(five years), sampling will be necessary.
Accurate quality determination begins with obtaining an LPG sample that truly represents the
characteristics of the fuel. As suggested above, samples are required at the custody transfer point

SwRI Project No. 08-10524March 2005
Investigation of Portable or Hand-Held Devices Page 33for Detecting Contaminants in LPG
and within tanks. Also, tank samples may be extracted from the gas or liquid phase. Sampling of
tank bottoms can present challenges due to limited physical accessibility to the interior of the
tank. Once these samples are obtained, specific sensors or sensor arrays will be immersed into a
representative LPG sample. When considering the development of hand held or portable
instrumentation, the sampling system needs to be integrated with the sensor systems in such a
way to maintain overall simplicity and ease of operation.
In this section, sampling in various regions is discussed especially in the context of exploring
methodologies that are applicable to portable systems.
9.2 Common Methods in Use For Sampling
The issue of sampling LPG in containers other than laboratory testing apparatus is addressed in
ASTM D1265 – 92 entitled ”Standard Practice for Sampling Liquefied Petroleum (LP) Gases
(Manual Method).” For custody transfer operations, the samples must be in the liquid phase only.
Furthermore, if corrosive compounds or sulfur compounds are to be analyzed, the sample
containers and valves should be made of stainless steel. A typical sampling container is shown in
Figure 5. The sample bottle contains an outage tube (ullage) at the top. Ullage volume is needed
for allowance of thermal expansion. By following the procedures outlined in D1265, this
particular sample bottle will always provide 20% outage (ullage) and 80% liquid. The D1265
sampling method is manual and requires some minor training of personnel that acquire LPG
samples.
Figure 5. Configuration for a Sampling Container (from ASTM D1265 – 92)

SwRI Project No. 08-10524March 2005
Investigation of Portable or Hand-Held Devices Page 34for Detecting Contaminants in LPG
A liquid sampling method that can be automated is described in GPA Standard 2174-93 entitled
“Obtaining Liquid Hydrocarbon Samples for Analysis By Gas Chromatography.” This procedure
incorporates a floating piston cylinder arrangement with one typical configuration shown in
Figure 6 (other arrangements are discussed in the standard). One advantage of this system is that
the pressure of the samples can be regulated.
Figure 6. Typical Visual Indicator Sampling System (from GPA Standard 2174-93)
If it is necessary to obtain a sample and then physically move the sample to another location for
injection into portable analytical equipment, then a Closed Loop Cylinder Sample Panel such as
made by Sentry Equipment Corporation may be useful. A diagram of its operation is shown in
Figure 7. Note that this particular setup shows a filter at the supply valve. This filter may or may
not be necessary and is dependent on the particular sensor application. For instance, the filter
may be a simple particulate filter that prevents fouling of the instrument. This particular unit
mounts on an aluminum plate that is approximately 28 x 18 inches. A system built along the
same layout could be miniaturized (depending on the volume required) and incorporated into a
portable system or used as-is in conjunction with a sensor system.
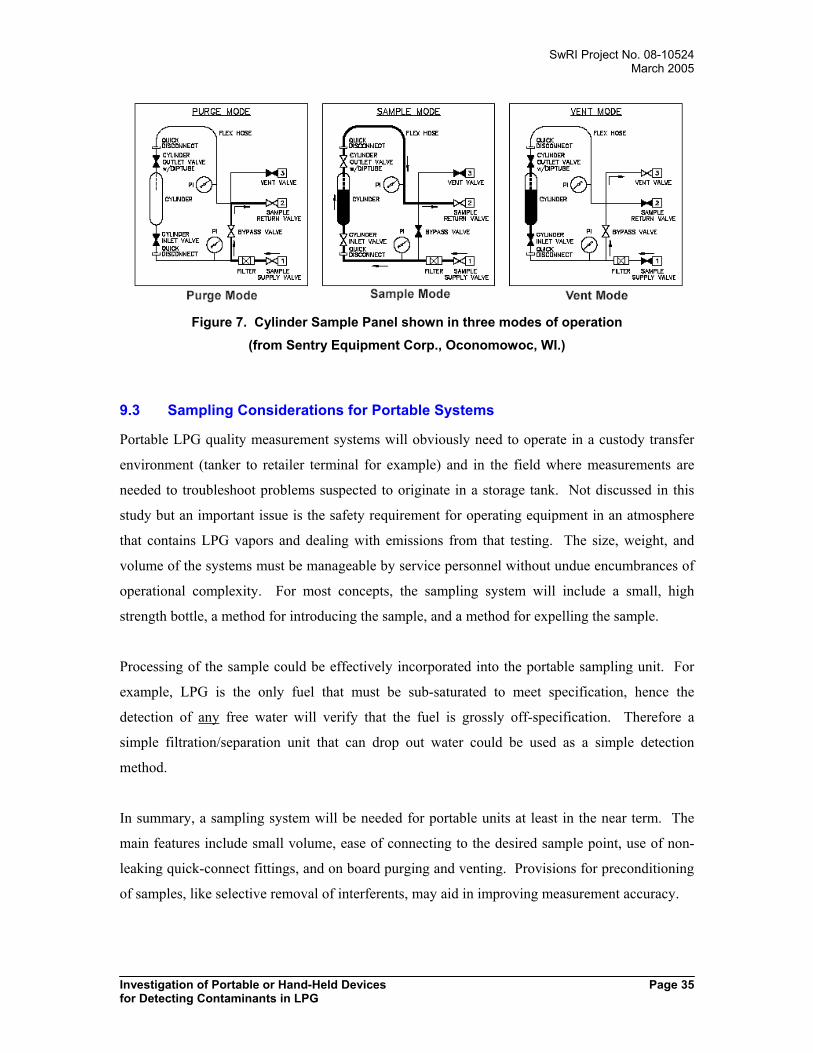
SwRI Project No. 08-10524March 2005
Investigation of Portable or Hand-Held Devices Page 35for Detecting Contaminants in LPG
Figure 7. Cylinder Sample Panel shown in three modes of operation(from Sentry Equipment Corp., Oconomowoc, WI.)
9.3 Sampling Considerations for Portable Systems
Portable LPG quality measurement systems will obviously need to operate in a custody transfer
environment (tanker to retailer terminal for example) and in the field where measurements are
needed to troubleshoot problems suspected to originate in a storage tank. Not discussed in this
study but an important issue is the safety requirement for operating equipment in an atmosphere
that contains LPG vapors and dealing with emissions from that testing. The size, weight, and
volume of the systems must be manageable by service personnel without undue encumbrances of
operational complexity. For most concepts, the sampling system will include a small, high
strength bottle, a method for introducing the sample, and a method for expelling the sample.
Processing of the sample could be effectively incorporated into the portable sampling unit. For
example, LPG is the only fuel that must be sub-saturated to meet specification, hence the
detection of any free water will verify that the fuel is grossly off-specification. Therefore a
simple filtration/separation unit that can drop out water could be used as a simple detection
method.
In summary, a sampling system will be needed for portable units at least in the near term. The
main features include small volume, ease of connecting to the desired sample point, use of non-
leaking quick-connect fittings, and on board purging and venting. Provisions for preconditioning
of samples, like selective removal of interferents, may aid in improving measurement accuracy.

SwRI Project No. 08-10524March 2005
Investigation of Portable or Hand-Held Devices Page 36for Detecting Contaminants in LPG
10.0 SENSOR TECHNOLOGIES
In this section we describe a variety of different sensing techniques that are relevant to both gas
and/or liquid phase substances. Advantages and disadvantages will be highlighted. Some sensors
are only useful in detecting bulk contamination while others can detect and quantify a single
compound in trace quantities. While all of these technologies could be used to analyze LPG, we
will show that they may not be well suited for the intended application or point of use.
Obviously, sensor complexity, selectivity, and sensitivity are normally directly proportional to
cost, and it appears that most of the sensor technologies will likely be outside the budget of small,
local-area retailers. Although, the decision to buy a particular instrument should be traded off
against the financial risk of a catastrophe (fouling of storage tanks) that may have been avoided
by use of the instrument. Therefore, a broad investigation of relevant sensor technologies will be
considered for comparison and completeness.
Once the sensor technologies have been discussed, a trade-off analysis will be performed. The
trade-off analysis will grade sensors on their ability to provide accurate LPG analysis based on
the sensor’s intended purpose. For example, whereas some sensors are designed to detect trace
level contaminants, others are designed to detect large changes in overall composition. In this
case, the latter would not be scored lower provided it performs well with respect to its intended
usage.
Because LPG is normally contained within a closed system, we can distinguish between two
different types of sensor/instrument applications: on-line and batch measurements. There are
other sampling/measurement variations but these carry the widest distinction. On-line
measurements would require the sensor to be permanently installed in a transfer line or in a
storage tank. In an on-line mode, the sensors are generally intended to run unattended and
provide a continuous output. This type of installation is counter to the purpose of this report
because the instrument would become a permanent fixture of the LPG system. For batch
measurements, an operator usually withdraws a representative sample from an LPG source and
transports it to the instrument. Though not as common, the instrument may also be temporarily
interfaced to the main LPG source and an analysis performed. Each mode of operation has
challenges that must be overcome. In the on-line mode, the sensor must be incorporated into the
LPG system such that it does not affect normal operations. Automated sampling and

SwRI Project No. 08-10524March 2005
Investigation of Portable or Hand-Held Devices Page 37for Detecting Contaminants in LPG
conditioning equipment may be needed to extract and prepare the sample before introducing it to
the instrument. Batch-mode sampling will also require peripheral equipment to allow samples to
be withdrawn from a large LPG source. A separate system may be needed to interface the
collection cylinder to the instrument.
Considering the manner in which LPG is handled, a truly “handheld” instrument presents
challenges for this application given the expected need for peripheral equipment to accommodate
sampling. A handheld instrument would need to be coupled directly to the LPG system; this is
feasible but may create some safety concerns (high pressure leaks, need for grounding and non-
sparking tools, etc.). Also, special ports or adapters may be required which makes this option
appear less viable. More likely, a representative LPG sample will need to be withdrawn from its
source for subsequent batch processing. The sample would be taken to a portable instrument,
perhaps mounted on a vehicle.
The types of sensors investigated in this study are shown below grouped into common sensor
families. However, it should be noted that some sensors might serve multiple purposes. For
example chemical array sensors and spectroscopic devices are sometimes used as gas monitoring
sensors but they may be used as analytical instruments too. This isn't normally true for the "gas
monitoring systems."
• Gas Monitoring Systems
• Catalytic Bead (Section 10.1)
• Electrochemical (Section 10.2)
• Metal Oxide Semiconductor (MOS) (Section 10.3)
• Chemical Array Sensors
• Bulk Acoustic Wave (BAW) (Section 10.4)
• Surface Acoustic Wave (SAW) (Section 10.5)
• Metal Oxide Field-Effect Transistor (MOSFET) (Section 10.6)
• Conducting Organic Polymers (COP) (Section 10.7)
• Chemoresistors (Section 10.8)
• Spectroscopic (Section 10.9)
• Mid-Infrared Spectroscopy (Section 10.9.2)
• Near-Infrared Spectroscopy (Section 10.9.3)
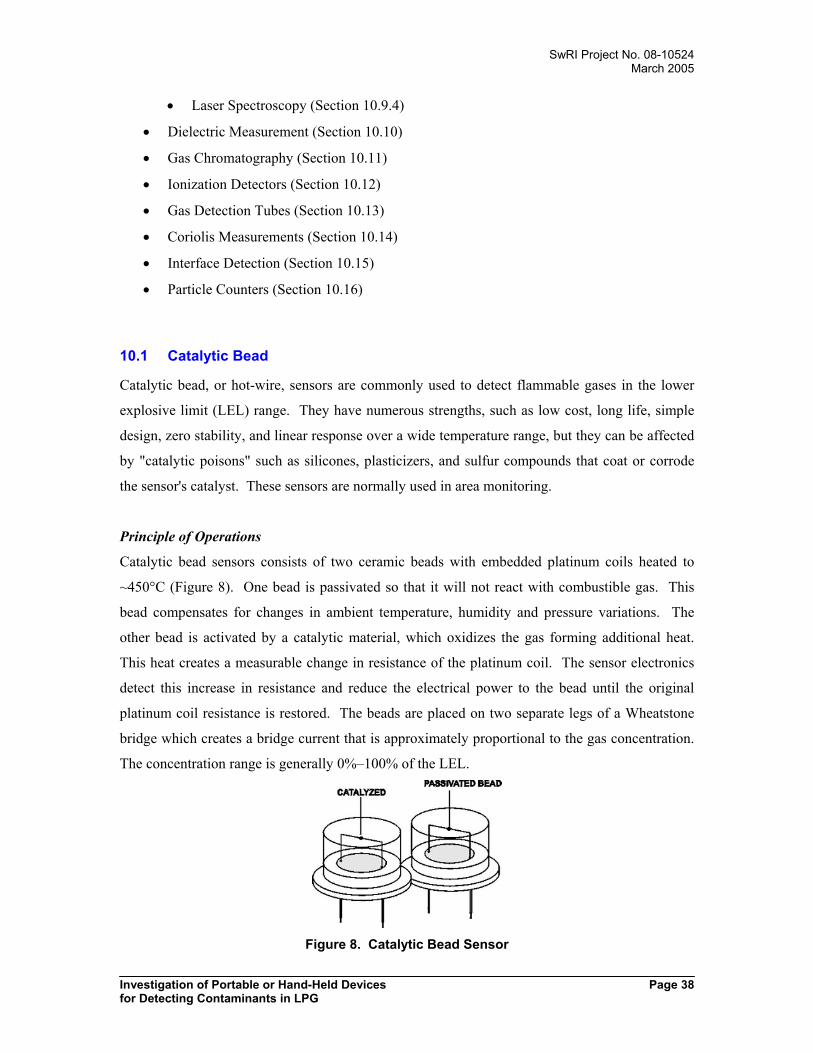
SwRI Project No. 08-10524March 2005
Investigation of Portable or Hand-Held Devices Page 38for Detecting Contaminants in LPG
• Laser Spectroscopy (Section 10.9.4)
• Dielectric Measurement (Section 10.10)
• Gas Chromatography (Section 10.11)
• Ionization Detectors (Section 10.12)
• Gas Detection Tubes (Section 10.13)
• Coriolis Measurements (Section 10.14)
• Interface Detection (Section 10.15)
• Particle Counters (Section 10.16)
10.1 Catalytic Bead
Catalytic bead, or hot-wire, sensors are commonly used to detect flammable gases in the lower
explosive limit (LEL) range. They have numerous strengths, such as low cost, long life, simple
design, zero stability, and linear response over a wide temperature range, but they can be affected
by "catalytic poisons" such as silicones, plasticizers, and sulfur compounds that coat or corrode
the sensor's catalyst. These sensors are normally used in area monitoring.
Principle of Operations
Catalytic bead sensors consists of two ceramic beads with embedded platinum coils heated to
~450°C (Figure 8). One bead is passivated so that it will not react with combustible gas. This
bead compensates for changes in ambient temperature, humidity and pressure variations. The
other bead is activated by a catalytic material, which oxidizes the gas forming additional heat.
This heat creates a measurable change in resistance of the platinum coil. The sensor electronics
detect this increase in resistance and reduce the electrical power to the bead until the original
platinum coil resistance is restored. The beads are placed on two separate legs of a Wheatstone
bridge which creates a bridge current that is approximately proportional to the gas concentration.
The concentration range is generally 0%–100% of the LEL.
Figure 8. Catalytic Bead Sensor

SwRI Project No. 08-10524March 2005
Investigation of Portable or Hand-Held Devices Page 39for Detecting Contaminants in LPG
Catalytic bead sensors operate above a threshold or voltage, which corresponds to the bead
temperature at which the presence of the catalyst and oxygen can first ignite the gas. As the
sensor ages, the catalyst is slowly used up on the bead causing the threshold voltage to gradually
increase and the sensor to become less sensitive. The platinum coil ages simultaneously causing
increased zero drift and noise. Ultimately, the sensor must be replaced.
These sensors are small, rugged, analyte specific, inexpensive, are relatively simple to maintain
and have a long life of 2 to 4 years. However, the potential for catalyst poisoning exists and the
sensor can be damaged (span loss) by repeated exposure to high concentrations of gases.
10.2 Electrochemical Sensors
Electrochemical sensors are excellent for detecting low parts-per-million concentrations of a
select gas and are generally the most popular for sensing toxic gases. These sensors are not used
for measuring combustible gases. The sensors contain an electrolyte that reacts with a specific
gas, producing an output signal that is proportional to the amount of gas present. Electrochemical
sensors exist for gases such as chlorine, carbon monoxide, hydrogen sulfide, and hydrogen, but
cannot be used to measure hydrocarbons.
Principle of Operation
Generally, an electrochemical sensor consists of a diffusion barrier, a sensing-electrode (also
called the working-electrode, measuring-electrode, or anode), a counter-electrode (also called the
cathode), and an electrolyte (Figure 9). The electrochemical cell typically consists of a casing
containing an electrolyte gel and electrodes. The top of the casing has a gas permeable
membrane and a gas capillary. The electrodes are constructed with a large surface area to
promote maximum sensitivity and longer life. In turn, this provides a larger signal and a quicker
response time.
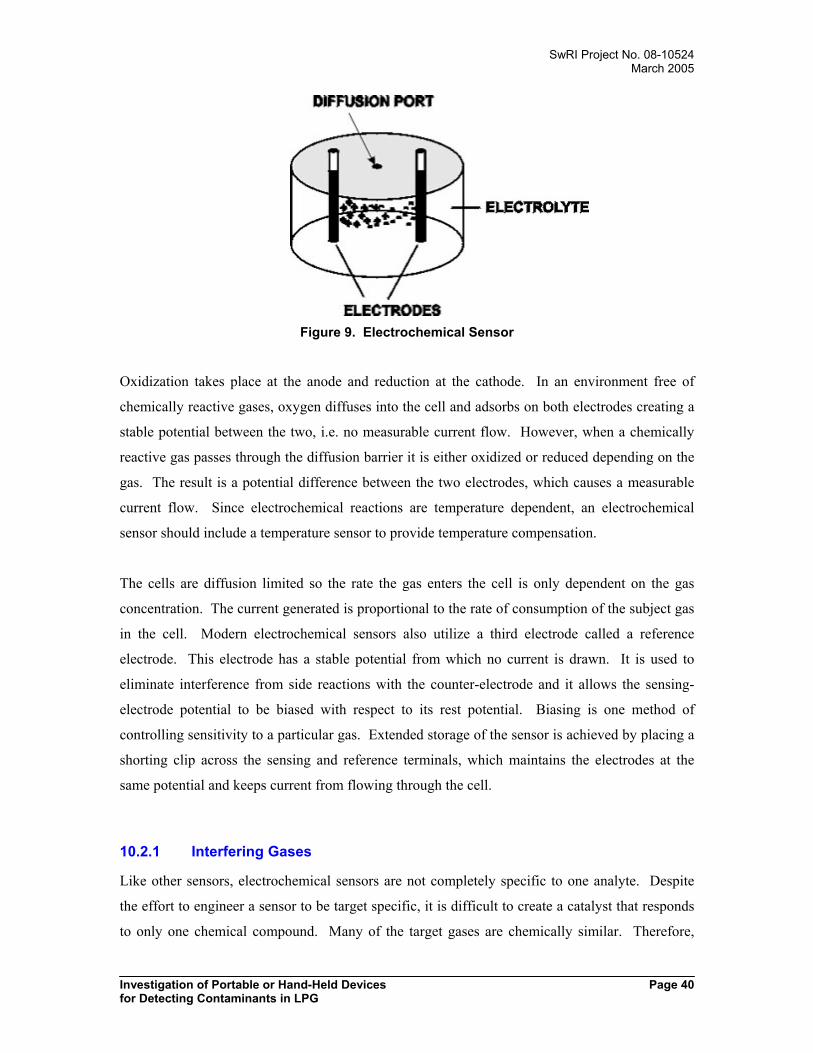
SwRI Project No. 08-10524March 2005
Investigation of Portable or Hand-Held Devices Page 40for Detecting Contaminants in LPG
Figure 9. Electrochemical Sensor
Oxidization takes place at the anode and reduction at the cathode. In an environment free of
chemically reactive gases, oxygen diffuses into the cell and adsorbs on both electrodes creating a
stable potential between the two, i.e. no measurable current flow. However, when a chemically
reactive gas passes through the diffusion barrier it is either oxidized or reduced depending on the
gas. The result is a potential difference between the two electrodes, which causes a measurable
current flow. Since electrochemical reactions are temperature dependent, an electrochemical
sensor should include a temperature sensor to provide temperature compensation.
The cells are diffusion limited so the rate the gas enters the cell is only dependent on the gas
concentration. The current generated is proportional to the rate of consumption of the subject gas
in the cell. Modern electrochemical sensors also utilize a third electrode called a reference
electrode. This electrode has a stable potential from which no current is drawn. It is used to
eliminate interference from side reactions with the counter-electrode and it allows the sensing-
electrode potential to be biased with respect to its rest potential. Biasing is one method of
controlling sensitivity to a particular gas. Extended storage of the sensor is achieved by placing a
shorting clip across the sensing and reference terminals, which maintains the electrodes at the
same potential and keeps current from flowing through the cell.
10.2.1 Interfering Gases
Like other sensors, electrochemical sensors are not completely specific to one analyte. Despite
the effort to engineer a sensor to be target specific, it is difficult to create a catalyst that responds
to only one chemical compound. Many of the target gases are chemically similar. Therefore,

SwRI Project No. 08-10524March 2005
Investigation of Portable or Hand-Held Devices Page 41for Detecting Contaminants in LPG
sensors are said to be "cross sensitive" meaning they can react with other chemical species
besides the intended target. Although filters may help to prevent certain species from entering the
cell, it may also slow the response of the cell to the target compound.
10.2.2 Blocking Mechanisms
When blocking occurs, the cell may function erratically or not respond at all. Unlike poisoning,
which usually renders the cell useless, once the blocking condition is removed the cell will likely
return to normal. Common blocking mechanisms are described below.
Electrolyte Freezing
As the temperature of the cell decreases, the chemical reactions that create the
measurable current begin to slow and consequently the output signal begins to decrease.
Generally, at temperatures near freezing (0°C) no current flow can be measured in the
cell. However, once the temperature returns to normal, the cell will "thaw" and being to
function properly again. The cell can be heated if freezing temperatures are expected.
Oxygen Depravation
Oxygen must be present in the cell to react with the target gas. If, for any reason, the
oxygen supplied to the counter-electrode is cut-off then the current cannot be sustained.
Sources of oxygen depravation are described below.
1. The sensor is located in an environment saturated with reactive gases. This limits the
amount of oxygen that can diffuse into the cell or the oxygen may simply get used up.
2. The sensor is located in a low-oxygen environment. If necessary, air may need to be
supplied to the sensor.
3. The cell's diffusion barrier or flame arrestor becomes clogged. This may prevent both
oxygen and target gas from entering the cell. The sensor may require routine cleaning.
4. Water or gas vapor condenses in the cell's diffusion barrier or flame arrestor. If the
sensor temperature is lower than the ambient temperature condensation can occur.
Heating or the use of dry air may be needed to prevent this problem.

SwRI Project No. 08-10524March 2005
Investigation of Portable or Hand-Held Devices Page 42for Detecting Contaminants in LPG
Oxidation/Reduction Reactions
Electrochemical sensors are normally designed to detect a specific target gas. Based on
the chemical makeup of the gas, it will either be oxidized or reduced in the cell.
However, if a reducible gas enters a cell designed to detect an oxidizable gas or vice
versa, the reverse reactions may mask the presence of the target species.
10.2.3 Poisoning
Poisoning is a common problem in chemical-based sensors. A poison is a chemical species that
blocks and/or degrades the sensor’s operation. After prolonged exposure to a poison, the sensor
usually becomes completely inoperable. Common sources of poisoning are described below.
Solvent Vapors
Depending on the design of the sensor, a high concentration of solvent vapor may attack
the sensor housing or filters. Solvents that are commonly problematic include alcohols,
ketones, phenols, pyridine, amines, and chlorinated solvents. Sensors that are routinely
exposed to large doses of these compounds may experience reduced lifetimes.
High Temperatures
Operation of the sensor at high temperatures (e.g. 40°C (104°F)) for long lengths of time
may degrade the electrolyte in the cell.
10.2.4 Pressure Effects
Like other diffusion-based chemical sensors, electrochemical sensors are designed to work at
atmospheric pressure ±10%. Sudden changes in pressure may produce high transient signals,
which may trigger false alarms.
10.2.5 Humidity
Electrochemical sensors are not affected directly by humidity but continuous operation at extreme
high or low humidity can change the water content of the electrolyte and affect the output of the
cell. Extreme humidity may cause the electrolyte to swell and the cell to leak. Excess water may
also cause the cell to freeze more easily. At low humidity, the cell may begin to dry out causing

SwRI Project No. 08-10524March 2005
Investigation of Portable or Hand-Held Devices Page 43for Detecting Contaminants in LPG
the acid concentration to increase and either crystallize out or attack the cell. A hot and dry
climate is the worst-case scenario for an electrochemical sensor.
10.2.6 Sensor Life
Even when not in use, electrochemical cells have a limited shelf life because they are constantly
"active." Typical life expectancy may be three years whether used or not. Storage in a
refrigerator and avoidance of low humidity, high temperature, and poisons is recommended.
Continuous exposure to a signal producing gas (target or otherwise) will shorten the life of the
cell because it destroys a small portion of the electrolyte. The onboard filters also have a finite
life and will only remove a fixed amount of gas before becoming inoperable.
10.2.7 Advantages/Disadvantages
Advantages of electrochemical gas sensors:
• Good selectivity - can be made sensitive to a specific gas
• Normally very accurate to ppm levels
• Resistant to poisons
• Very linear response
• Excellent repeatability
Disadvantages of electrochemical gas sensors:
• Narrow temperature range
• Limited shelf life
• Subject to potential interfering gases
• Sensitive to temperature and humidity conditions
• Sensitive to EMF/RFI
• Slow start-up if depolarized
• Electrolyte contains a strong acid - may be dangerous if leakage occurs.
10.3 Metal Oxide Semiconductor (MOS)
Solid-state sensors, typically based on a tin oxide semiconductor, respond to gases by changing
resistance. Semiconductor sensors are commonly used for measuring H2S and combustible
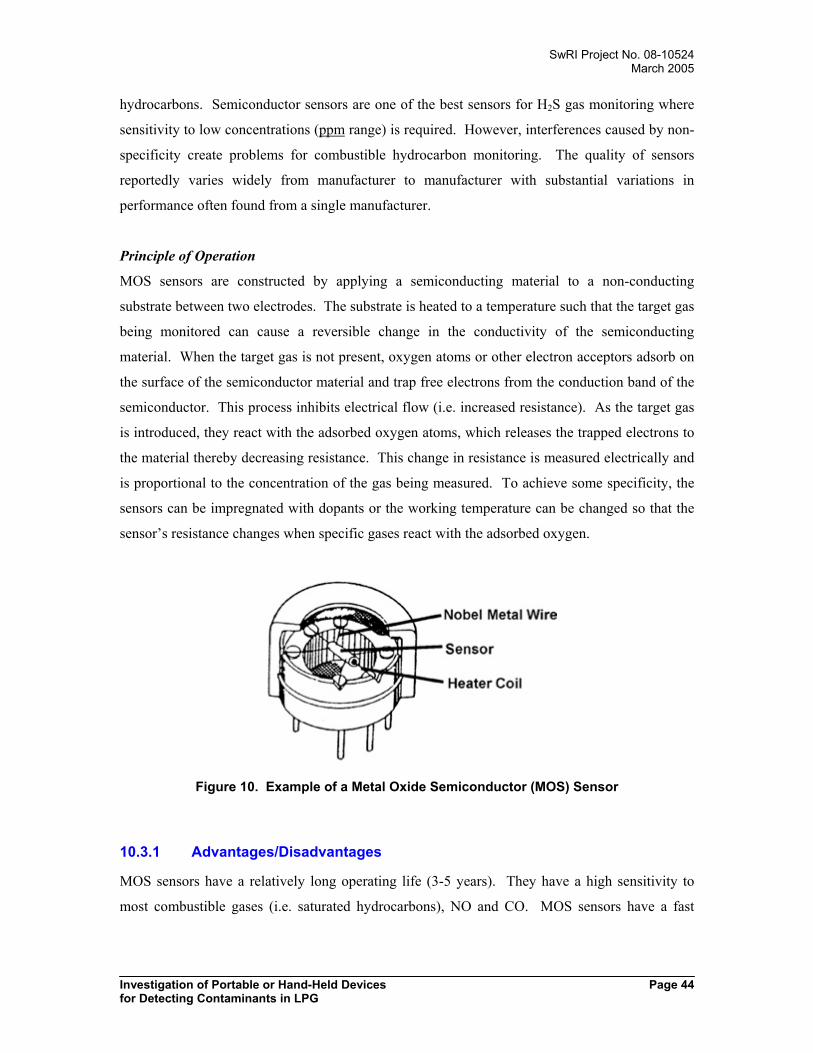
SwRI Project No. 08-10524March 2005
Investigation of Portable or Hand-Held Devices Page 44for Detecting Contaminants in LPG
hydrocarbons. Semiconductor sensors are one of the best sensors for H2S gas monitoring where
sensitivity to low concentrations (ppm range) is required. However, interferences caused by non-
specificity create problems for combustible hydrocarbon monitoring. The quality of sensors
reportedly varies widely from manufacturer to manufacturer with substantial variations in
performance often found from a single manufacturer.
Principle of Operation
MOS sensors are constructed by applying a semiconducting material to a non-conducting
substrate between two electrodes. The substrate is heated to a temperature such that the target gas
being monitored can cause a reversible change in the conductivity of the semiconducting
material. When the target gas is not present, oxygen atoms or other electron acceptors adsorb on
the surface of the semiconductor material and trap free electrons from the conduction band of the
semiconductor. This process inhibits electrical flow (i.e. increased resistance). As the target gas
is introduced, they react with the adsorbed oxygen atoms, which releases the trapped electrons to
the material thereby decreasing resistance. This change in resistance is measured electrically and
is proportional to the concentration of the gas being measured. To achieve some specificity, the
sensors can be impregnated with dopants or the working temperature can be changed so that the
sensor’s resistance changes when specific gases react with the adsorbed oxygen.
Figure 10. Example of a Metal Oxide Semiconductor (MOS) Sensor
10.3.1 Advantages/Disadvantages
MOS sensors have a relatively long operating life (3-5 years). They have a high sensitivity to
most combustible gases (i.e. saturated hydrocarbons), NO and CO. MOS sensors have a fast
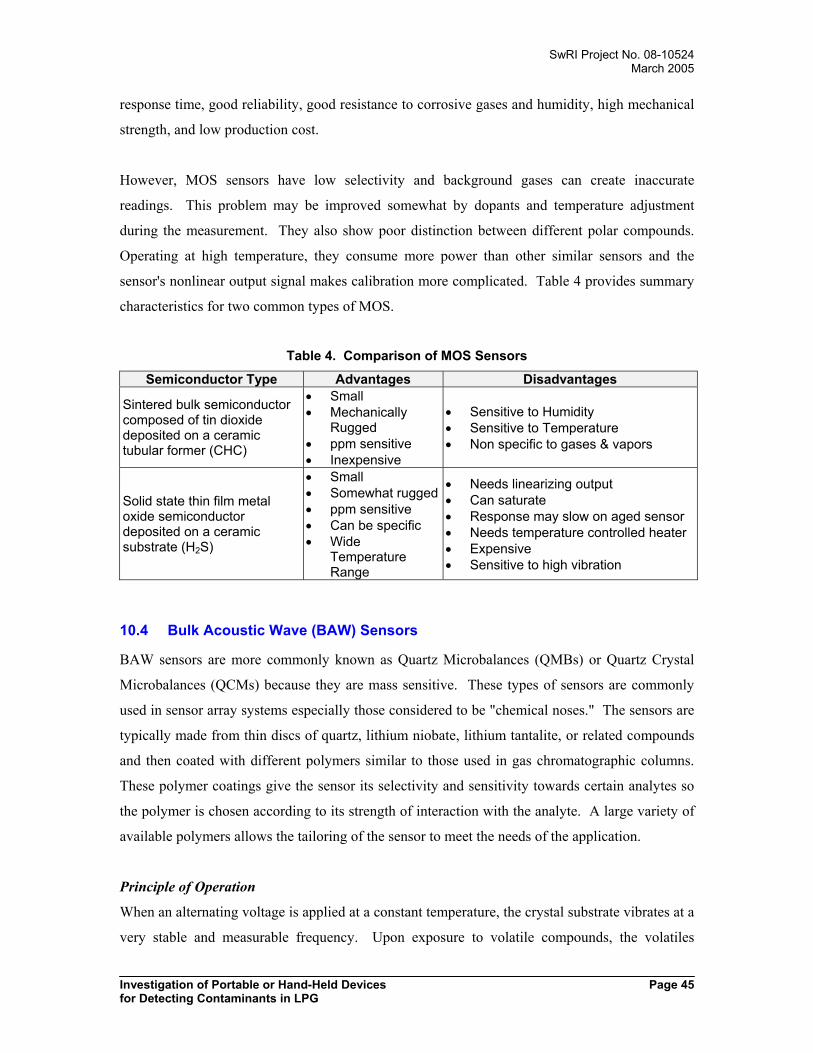
SwRI Project No. 08-10524March 2005
Investigation of Portable or Hand-Held Devices Page 45for Detecting Contaminants in LPG
response time, good reliability, good resistance to corrosive gases and humidity, high mechanical
strength, and low production cost.
However, MOS sensors have low selectivity and background gases can create inaccurate
readings. This problem may be improved somewhat by dopants and temperature adjustment
during the measurement. They also show poor distinction between different polar compounds.
Operating at high temperature, they consume more power than other similar sensors and the
sensor's nonlinear output signal makes calibration more complicated. Table 4 provides summary
characteristics for two common types of MOS.
Table 4. Comparison of MOS Sensors
Semiconductor Type Advantages Disadvantages
Sintered bulk semiconductorcomposed of tin dioxidedeposited on a ceramictubular former (CHC)
• Small• Mechanically
Rugged• ppm sensitive• Inexpensive
• Sensitive to Humidity• Sensitive to Temperature• Non specific to gases & vapors
Solid state thin film metaloxide semiconductordeposited on a ceramicsubstrate (H2S)
• Small• Somewhat rugged• ppm sensitive• Can be specific• Wide
TemperatureRange
• Needs linearizing output• Can saturate• Response may slow on aged sensor• Needs temperature controlled heater• Expensive• Sensitive to high vibration
10.4 Bulk Acoustic Wave (BAW) Sensors
BAW sensors are more commonly known as Quartz Microbalances (QMBs) or Quartz Crystal
Microbalances (QCMs) because they are mass sensitive. These types of sensors are commonly
used in sensor array systems especially those considered to be "chemical noses." The sensors are
typically made from thin discs of quartz, lithium niobate, lithium tantalite, or related compounds
and then coated with different polymers similar to those used in gas chromatographic columns.
These polymer coatings give the sensor its selectivity and sensitivity towards certain analytes so
the polymer is chosen according to its strength of interaction with the analyte. A large variety of
available polymers allows the tailoring of the sensor to meet the needs of the application.
Principle of Operation
When an alternating voltage is applied at a constant temperature, the crystal substrate vibrates at a
very stable and measurable frequency. Upon exposure to volatile compounds, the volatiles
SwRI Project No. 08-10524March 2005
Investigation of Portable or Hand-Held Devices Page 46for Detecting Contaminants in LPG
absorb into the polymer coating of the sensor, which causes a change in the mass of the sensor.
The change in mass creates a measurable change in the oscillation frequency of the sensor; the
frequency change is linear with the additional mass loading in the polymer matrix. QMB sensors
have found a niche in the electronic nose market because they produce stable responses and are
easily manufactured.
QMB sensors must be operated in a temperature controlled environment because the signal is
temperature dependent. If the temperature is too low, absorption/desorption is slowed. On the
other hand, high temperatures increase desorption causing a decrease in the amount of absorbed
molecules.
10.4.1 Advantages/Disadvantages
The operation principle restricts the use of QMB sensors to the detection of gaseous analytes
although they may have sensitivities as low as 10 ppm.
Advantages include:
• High stability of the signal
• Non destructive analysis
• Operation at room temperature
• Sensor reproducibility in production
• Resistant to moisture
Disadvantages include:
• Large size and high cost of a sensor
• QMBs require higher concentrations of sample gas relative to MOSFET or MOS sensors.
10.5 Surface Acoustic Wave (SAW) Sensors
SAW sensors are based on a similar principle as the QMB sensors described above - a change in
mass is registered as a frequency change. This device uses, as referred by the name, surface
acoustic waves, which have a frequency as high as 600 MHz.
SwRI Project No. 08-10524March 2005
Investigation of Portable or Hand-Held Devices Page 47for Detecting Contaminants in LPG
Principle of Operation
A SAW device consists of two transducers of thin metal electrodes on a polished piezoelectric
substrate. The spacing of the transducers determines the wavelength. An alternating current is
applied to one of the transducers causing the surface to expand and contract. This motion
generates surface waves, which propagate across the substrate and are received at the other
transducer. An uncoated SAW sensor may also be used as a reference signal to minimize noise
and temperature effects.
The wavelength/frequency of the surface wave is influenced by the physical properties of the
surface. The bare substrate between the transducers may be coated with a thin layer of polymer
or the transducer may be covered by a polymer layer. In some cases, the substrate itself can be
used as sensitive layer. Gas absorption changes the mass and/or the physical properties of the
sensitive layer, which disturbs the propagation of the surface waves. SAW sensors are not only
mass sensitive, they are also affected by changes in the dielectric constant and viscosity of the
polymer phase, temperature, and pressure.
10.5.1 Advantages/Disadvantages
SAW devices are coated with much thinner sensitive layers than QMB sensors. This reduces
analyte absorption because mass uptake takes place into the bulk of the polymer layer. However,
unlike QMB sensors, the SAW signal is dependent on a number of other factors, which can be
used to get additional information about the polymer/analyte absorption process.
10.6 Metal Oxide Field-Effect Transistor (MOSFET)
Gas sensitive devices based on field effect transistors are commonly GASFETs (Gallium
Arsenide Field Effect Transistors). In general, the MOSFET sensor consists of a thin, catalytic
metal layer on top of a metal-oxide-semiconductor field-effect transistor. The type of catalytic
metal (palladium for hydrogen or iridium/platinum for NH3, H2S, and ethanol) and the layer
thickness can be varied in order to create different types of MOSFET sensors. Typical devices all
share a common structure: a gate on top of an insulating layer (SiO2), a p-doped silicon channel
and an n-doped source and drain. The catalytic metal forms the gate electrode that is electrically
connected to the drain electrode and the source electrode is grounded. The whole structure is
heated with a resistive heater. The specific name of the sensor in the literature denotes the gate

SwRI Project No. 08-10524March 2005
Investigation of Portable or Hand-Held Devices Page 48for Detecting Contaminants in LPG
material and/or the set-up. Systems based on MOSFETs usually include multiple sensors where
each is made sensitive to different groups of chemical compounds.
Principle of Operation
In MOSFET sensors, molecules in the gas phase react at the catalytic surface. Intermediate
products and reaction products may polarize and adsorb onto the metal surface or onto the
insulator surface. Hydrogen, formed in the reaction at the surface, diffuses through the catalytic
metal and forms dipoles at the metal-insulator interface. The polarized species at the insulator
surface and polarized hydrogen at the metal-insulator interface remain in equilibrium with the
concentration in the gas phase. A dipole layer is formed which adds to the electric field between
the metal and semiconductor. This changes the voltage between the gate and the source electrode
and modulates the drain-source current through capacitive coupling to the channel.
Selectivity to different gases is achieved by changing the operating temperature (catalytic
dehydrogenation is temperature dependent), changing the metal on the catalytic surface, and
changing the thickness and morphology of the gate metal. Thus, MOSFET sensors can be made
sensitive to a broad range of hydrogen-containing or polar compounds. They are generally stable,
exhibit a relatively low sensitivity to moisture, and can be produced with high reproducibility.
10.7 Conducting Organic Polymers (COP)
Sensors based on changes in resistivity of polymer films to gas exposure have been studied
extensively. The most studied polymers are that of polypyrrole and polyaniline. In general, all
suitable polymers have a conjugated π–electron system along the polymer backbone. The choice
of the polymer is limited to conducting polymers or those which can be made conduct. Polymers
are made conductive by doping them with counter ions from an electrolyte solution by reducing
or oxidizing the polymer. The polymers are formally described as semiconductors because they
have a band gap in their electronic structure at room temperature. Conducting polymers are
fabricated by depositing a thin polymer film on a sensor structure consisting of a narrow electrode
gap. They are sensitive to polar compounds and the bulk absorption is normally reversible.
Principle of Operation
The conductivity of the polymer is measured at a constant current or voltage over a resistor. As
the target gases are absorbed into the polymer matrix, their interaction with the matrix causes a

SwRI Project No. 08-10524March 2005
Investigation of Portable or Hand-Held Devices Page 49for Detecting Contaminants in LPG
change in the conductivity of the polymer. Unfortunately, the response of the sensor is not
necessarily a linear function of the target gas concentration. Therefore, quantification is difficult.
As with other sensors of this nature, the responses are typically measured as the differential
resistance (R2-R1)/R1 where R1 is the baseline resistance in clean, dry air and R2 is the resistance
after exposure to the target gas.
10.7.1 Advantages/Disadvantages
The sensitivity and selectivity of a conducting polymer array can be altered extensively by
manipulating the chemistry of the polymer backbone, changing the selection of doping ions,
varying the polymer chain length, and changing the method of polymerization. COP sensors can
be used at ambient temperature unlike many of the gas monitoring sensors. However, they are
also sensitive to temperature changes. Their primary advantages are high sensitivity and small
size.
Their primary disadvantage is poor reproducibility of fabrication, which is dependent on polymer
coating of the substrate. Water vapor is a strong interferent, and the baseline may drift over time
as a result of conformation changes within the polymer after exposure to inappropriate
compounds.
10.8 Chemoresistors
Chemoresistors (or chemiresistors), consist of thin, typically polymeric, films deposited across
two electrical leads on an alumina or silicon substrate (Figure 11). When the film is exposed to a
gas phase analyte, the polymer matrix swells as it absorbs the analyte. The increase in volume
causes an increase in resistance because the conductive pathways through the material are
disrupted. When the gas is removed the polymer releases the analyte and returns to its original
size, restoring the conductive pathways. A sensor system usually consists of many individual
sensors each with a chemically unique polymer that responds to different types of chemicals
based on size, polarity, functionality, etc. As a result, the sensor array will respond differently to
different analyte gases, even those with similar chemical structures. The output of the sensor
system is a "fingerprint" or pattern consisting of each individual sensor output. In this
configuration, these sensors are not typically used for quantitative purposes. Instead, they are
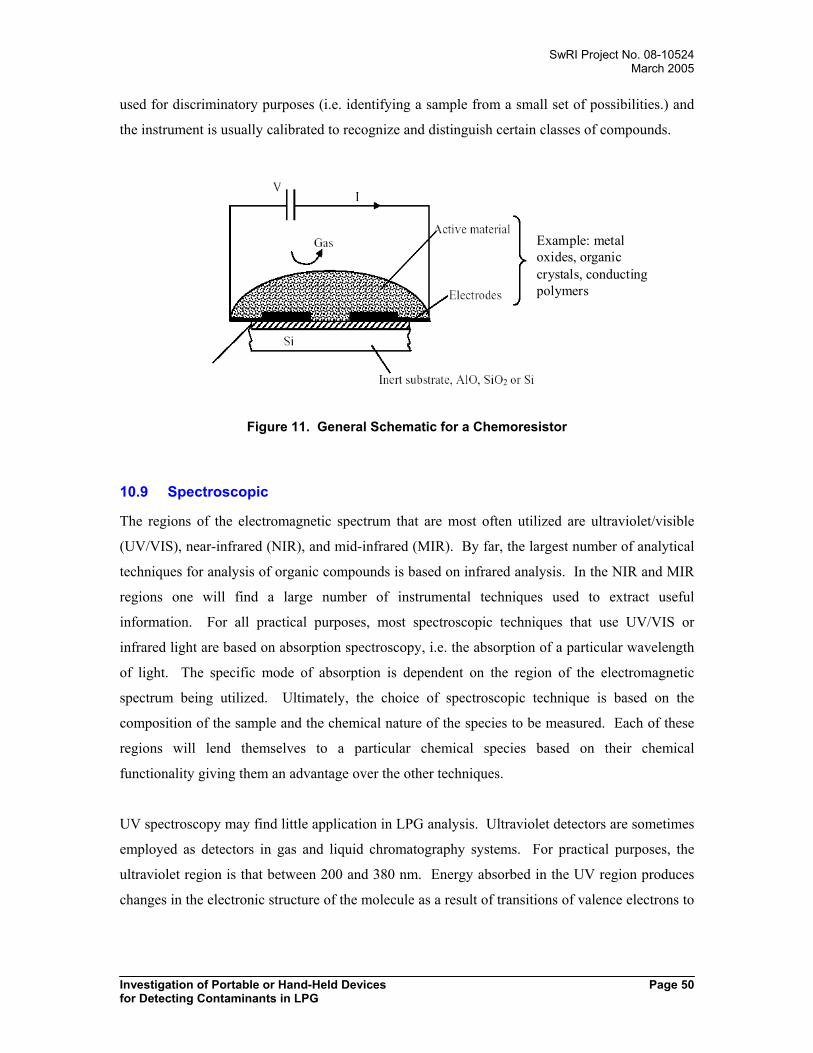
SwRI Project No. 08-10524March 2005
Investigation of Portable or Hand-Held Devices Page 50for Detecting Contaminants in LPG
used for discriminatory purposes (i.e. identifying a sample from a small set of possibilities.) and
the instrument is usually calibrated to recognize and distinguish certain classes of compounds.
Example: metaloxides, organiccrystals, conductingpolymers
Figure 11. General Schematic for a Chemoresistor
10.9 Spectroscopic
The regions of the electromagnetic spectrum that are most often utilized are ultraviolet/visible
(UV/VIS), near-infrared (NIR), and mid-infrared (MIR). By far, the largest number of analytical
techniques for analysis of organic compounds is based on infrared analysis. In the NIR and MIR
regions one will find a large number of instrumental techniques used to extract useful
information. For all practical purposes, most spectroscopic techniques that use UV/VIS or
infrared light are based on absorption spectroscopy, i.e. the absorption of a particular wavelength
of light. The specific mode of absorption is dependent on the region of the electromagnetic
spectrum being utilized. Ultimately, the choice of spectroscopic technique is based on the
composition of the sample and the chemical nature of the species to be measured. Each of these
regions will lend themselves to a particular chemical species based on their chemical
functionality giving them an advantage over the other techniques.
UV spectroscopy may find little application in LPG analysis. Ultraviolet detectors are sometimes
employed as detectors in gas and liquid chromatography systems. For practical purposes, the
ultraviolet region is that between 200 and 380 nm. Energy absorbed in the UV region produces
changes in the electronic structure of the molecule as a result of transitions of valence electrons to

SwRI Project No. 08-10524March 2005
Investigation of Portable or Hand-Held Devices Page 51for Detecting Contaminants in LPG
higher energy orbitals. This generally limits its usefulness to compounds containing conjugated
double bonds or those containing aromatic rings (such as benzene).
Outside of the laboratory, most spectroscopic techniques for gas monitoring are based on infrared
(both near and mid-band). Furthermore, the measurement is typically made from a remote or
standoff position. For instance, a common technique is to measure the vapors being emitted from
a smokestack for the purpose of environmental monitoring. This is done from a distant location
by using an infrared telescope or similar device, which never comes in direct contact with the gas.
The wavelength of light absorbed by the gas is measured and used to determine the composition
of the gas. Similar to catalytic sensors, small infrared devices can also be used for area
monitoring. Their advantage is that they are not subject to poisoning and interferences can be
eliminated through wavelength selection.
Infrared technology is well suited for process monitoring, quality assurance, or sample
identification. Mathematical correlations between infrared spectral data and bulk fuel properties
have already been shown to provide reasonable estimates. Indeed, many refineries utilize this
technology to track their processes. The correlations use calibration data based on classical
laboratory procedures (e.g. ASTM), and although the degrees of accuracy will vary, many of the
properties fall well within the reproducibility limits stated in the laboratory procedures. This
means that these technologies could generate results that correlate to the classical methods as well
as two independent laboratories running the same procedures on the same sample would correlate
with each other.
Advances in manufacturing and computing have created powerful analytical instruments capable
of both qualitative and quantitative analyses of multi-component samples in seconds. Currently,
versions of these instruments are available for benchtop, on-line, and semi-portable applications.
The future for these technologies will see additional miniaturization and increasing sensitivity.
As a result, powerful hand-held instruments will ultimately emerge for various applications.
Such an instrument for LPG analysis in the field could conceivably be developed now and
refinements made as the technology advances.
The following sections briefly describe the two most common forms of spectroscopy, near- and
mid-infrared and the advantages inherent to each one. A discussion of laser spectroscopy also
follows.

SwRI Project No. 08-10524March 2005
Investigation of Portable or Hand-Held Devices Page 52for Detecting Contaminants in LPG
10.9.1 Spectroscopic Instrument Technologies
In general, infrared instruments can be grouped into one of two broad categories: dispersive and
Fourier transform. A brief description of each is provided below.
Dispersive
Spectroscopic results are typically presented in the form of a two-dimensional plot of intensity at
each individual frequency. In order to do this, the instrument must separate the different
wavelengths of radiation either before or after passing through the sample. A dispersive
instrument accomplishes this through the use of a prism, grating, or filter. There are many forms
of each, and the design is usually tailored for a specific purpose, e.g., the wavelength range of
interest. Dispersive-type instruments are considered to be an older technology compared to
Fourier transform instruments. However, they still serve an important role in some applications
where ruggedness and size are a factor. For the near-term, hand-held and field-portable fuel
quality instruments will likely incorporate some form of a dispersive instrument.
Fourier Transform (FT)
Fourier transform instrumentation was originally developed to overcome some of the limitations
with dispersive instruments, e.g., scanning speed. In order to measure all of the infrared
frequencies simultaneously a device called an interferometer was developed. The interferometer
produces a signal called an interferogram in which every data point contains information about
every frequency emitted by the radiation source. This signal can be measured very quickly,
usually on the order of one second. The measured interferogram signal can not be interpreted
directly and must be decoded using a well-known mathematical technique called the Fourier
transformation. The result is a plot of the intensity at each individual frequency.
Fourier transform instruments are the preferred choice of instrumentation for research and testing
because of their speed, sensitivity, low noise levels, and internal wavelength calibration. For field
use, special precautions would need to be taken with FT instruments because they incorporate a
moving mirror that is vibration sensitive.
SwRI Project No. 08-10524March 2005
Investigation of Portable or Hand-Held Devices Page 53for Detecting Contaminants in LPG
10.9.2 Mid-Infrared Spectroscopy
Principle of Operation
The principle behind infrared spectroscopy is absorption of infrared radiation. Infrared radiation
is passed through the sample where some is absorbed and some passes through unchanged. The
resulting decrease in intensity at each wavelength is recorded and used to create an infrared
spectrum.
The most utilized portion of the mid-infrared region is between 4000-400 cm-1 (2.5 – 25 µm).
The infrared radiation in this region is absorbed causing vibrational and rotational changes to
organic molecules. The frequency of absorption is related to the functional groups that are
present in the molecule and the environment in which they exist. Functional group absorption
frequencies are well documented. An infrared spectrum represents a fingerprint of a sample with
absorption peaks corresponding to the fundamental vibrational frequencies between the atoms
that make up a chemical compound. The absorption peaks are usually sharp and well defined.
Therefore, infrared spectroscopy can be used qualitatively to identify different types of materials.
Practically every compound is a unique combination of atoms, so no two compounds produce the
exact same infrared spectrum. The same is true for complex mixtures of many compounds such
as fuels. In addition, the size of the absorption peaks in the spectrum is directly correlated to the
amount of material present. Therefore, with proper calibration, software algorithms can provide a
quantitative analysis for individual components or bulk properties.
Mid-Infrared Instrumentation
Most mid-infrared instruments are bulky, benchtop units designed for research and testing
purposes. Essentially, all new instruments are interferometer-based and commonly referred to as
FT-IR (Fourier Transform Infrared) spectrometers. In recent years, some companies have
developed smaller units that are considered semi-portable, but none would classify as hand-held.
While these instruments probably provide the most information about a material, the hardware
they employ will likely limit their usefulness to on-line fuel monitors for the time being. The
methods for introducing the sample to the instrument are limited and this presents a minor
disadvantage for mid-infrared spectroscopy. Techniques for sample introduction include the use
of fiber-optic probes, flow-through cells, and horizontal attenuated total reflectance (ATR) cells.

SwRI Project No. 08-10524March 2005
Investigation of Portable or Hand-Held Devices Page 54for Detecting Contaminants in LPG
Advantages/Disadvantages
Several of the disadvantages inherent to mid-infrared spectroscopy have already been noted. Its
bulkier equipment and limited modes of sample introduction restrict its use to applications that
are not hand-held. Because water absorption (humidity in the air) is a major problem for mid-
infrared spectroscopy, the instrument and optical path leading to the sample must be purged with
dry air or nitrogen. Furthermore, its strong dependence on the use of FT instrumentation requires
special precautions to be taken when handling the instrument; however, careful packaging of the
instrument can overcome these problems and make it just as usable as any other piece of
electronic equipment. Despite these disadvantages, mid-infrared spectra may provide the most
information about a sample. Sample preparation is normally not required. Its sharp peaks and
high signal to noise ratio provide a fingerprint of the chemical makeup of the sample. This
fingerprint contains responses from nearly every type of functional group present in the sample
and can be used for quantifying chemical and physical fuel properties. Complex mixtures are
more difficult to analyze because all of the responses from all of the sample constituents overlap.
10.9.3 Near-Infrared Spectroscopy
Principle of Operation
The principle behind near-infrared spectroscopy is the same as that for mid-infrared spectroscopy
– absorption of infrared radiation by a sample. The fundamental differences are the wavelength
region and the mechanics of absorption. The most utilized portion of the near-infrared region is
between 0.9 and 2.5 µm (10,000 - 4,000 cm-1). For organic molecules, near-infrared spectra are
the result of combination and overtone bands of the fundamental vibrational frequencies seen in
the mid-infrared region. Overtone bands appear at integer multiples (approximately) of the
fundamental vibrational frequencies, and each subsequent overtone is dramatically weaker in
intensity. The first overtone for a fundamental vibrational frequency in the mid-infrared region
appears at twice the wavenumber (or one half of the wavelength), the second overtone appears at
three times the wavenumber (or one third of the wavelength), etc. For this reason, near-infrared
spectra are typically comprised of first and second overtones of C-H, N-H, and O-H vibrational
modes. This makes near-infrared spectroscopy highly suitable for use with hydrocarbon fuels.
The relatively smooth features resulting from overlapping and collinear spectral responses make
the spectra nearly useless for qualitative spectral interpretation. However, with the increasing
power of desktop computers and emerging mathematical treatments, the correlation of chemical
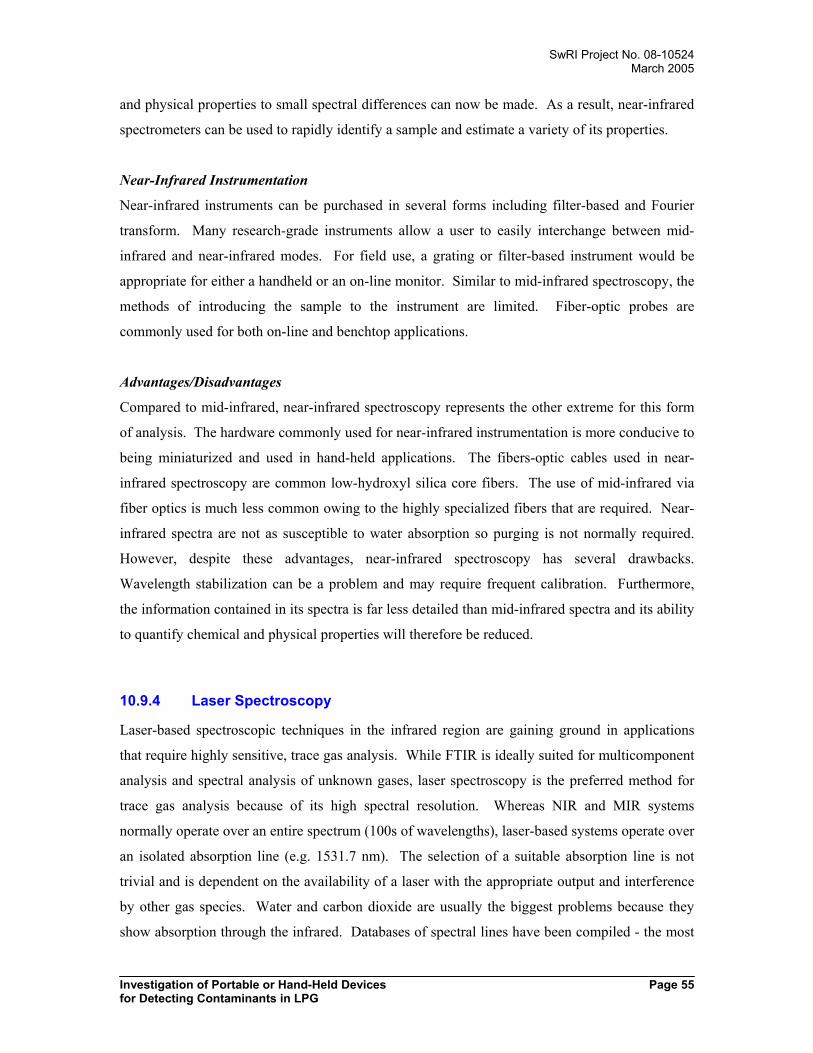
SwRI Project No. 08-10524March 2005
Investigation of Portable or Hand-Held Devices Page 55for Detecting Contaminants in LPG
and physical properties to small spectral differences can now be made. As a result, near-infrared
spectrometers can be used to rapidly identify a sample and estimate a variety of its properties.
Near-Infrared Instrumentation
Near-infrared instruments can be purchased in several forms including filter-based and Fourier
transform. Many research-grade instruments allow a user to easily interchange between mid-
infrared and near-infrared modes. For field use, a grating or filter-based instrument would be
appropriate for either a handheld or an on-line monitor. Similar to mid-infrared spectroscopy, the
methods of introducing the sample to the instrument are limited. Fiber-optic probes are
commonly used for both on-line and benchtop applications.
Advantages/Disadvantages
Compared to mid-infrared, near-infrared spectroscopy represents the other extreme for this form
of analysis. The hardware commonly used for near-infrared instrumentation is more conducive to
being miniaturized and used in hand-held applications. The fibers-optic cables used in near-
infrared spectroscopy are common low-hydroxyl silica core fibers. The use of mid-infrared via
fiber optics is much less common owing to the highly specialized fibers that are required. Near-
infrared spectra are not as susceptible to water absorption so purging is not normally required.
However, despite these advantages, near-infrared spectroscopy has several drawbacks.
Wavelength stabilization can be a problem and may require frequent calibration. Furthermore,
the information contained in its spectra is far less detailed than mid-infrared spectra and its ability
to quantify chemical and physical properties will therefore be reduced.
10.9.4 Laser Spectroscopy
Laser-based spectroscopic techniques in the infrared region are gaining ground in applications
that require highly sensitive, trace gas analysis. While FTIR is ideally suited for multicomponent
analysis and spectral analysis of unknown gases, laser spectroscopy is the preferred method for
trace gas analysis because of its high spectral resolution. Whereas NIR and MIR systems
normally operate over an entire spectrum (100s of wavelengths), laser-based systems operate over
an isolated absorption line (e.g. 1531.7 nm). The selection of a suitable absorption line is not
trivial and is dependent on the availability of a laser with the appropriate output and interference
by other gas species. Water and carbon dioxide are usually the biggest problems because they
show absorption through the infrared. Databases of spectral lines have been compiled - the most
SwRI Project No. 08-10524March 2005
Investigation of Portable or Hand-Held Devices Page 56for Detecting Contaminants in LPG
popular of which is HITRAN. HITRAN includes information on over one million spectral
absorption lines; however it's use is primarily limited to atmospheric gases such as CO, CO2,
H2O, NH3, etc. Of those listed in the HITRAN database, the only ones that appear applicable to
LPG analysis are ammonia and water. Indeed, several examples in the literature used laser-based
systems specifically for ammonia monitoring.
Laser Spectroscopy Instrumentation
A typical laser-based gas measurement system might consist of the following components:
• a diode laser (fixed wavelength or tunable)
• a multipass cell (fiber coupled to the laser)
• a laser driver
• a temperature controller
• a dual-beam detector (one detector for reference)
• a computer for data acquisition
A multipass cell increases the optical pathlength of the light allowing it to stay in contact with the
sample for a longer time thereby increasing it sensitivity.
Advantages/Disadvantages
Diode laser spectroscopy has many advantages over other multiple wavelength techniques. It
allows highly sensitive measurements often in the sub-ppm range. Because absorption at a single
wavelength is measured, it is highly specific. The latest advancements in tunable diode lasers
permit such a system to be highly portable. Like other gas sensors, a single sensor is typically
dedicated to a single analyte. However, if several analytes have absorptions that fall near one
another, a tunable laser may have enough range to measure them both.

SwRI Project No. 08-10524March 2005
Investigation of Portable or Hand-Held Devices Page 57for Detecting Contaminants in LPG
10.10 Dielectric Measurement
Gas and liquid densities can be inferred by measuring their dielectric constant. For example, gas
mixture density, ρmix, is related to the dielectric constant of the mixture through the Clausius-
Mossotti equation, or
ρmix = [(∑ xi Mwi)/ (∑ xI C-Mi)] • [(ε- 1)/ (ε+2)]
where
ε = dielectric constant
xi = mole fraction for each i component
Mwi = molecular weight of each i component
C-Mi = Clausius-Mossotti function of each i component
Knowledge of the component mole fractions and their associated Clausius-Mossotti functions are
required to calculate the density based on a dielectric measurement. For hydrocarbon gas
mixtures, MwI / C-MI is nearly constant which implies that gas density is directly proportional to
dielectric constant.
The density-dielectric relationship may be employed in several ways. In one embodiment of the
dielectric application, differential or comparative measurements of a base gas and the same base
gas with a contaminant, for example H2S, can be detected by dielectric changes. A sensitivity of
one part in 1000 (0.1%) is easily achieved and sensitivities of one part in 10,000 or more can be
achieved with more complex electronics. While this discussion is in the context of gas phase
samples, the same philosophy works well with liquids also.
The sensor system is generally composed of a coaxial capacitor that is filled with a gas or liquid
that is to be sampled (any type of liquid, like water, that provides an electrical short across the
plates of the capacitor, can be a problem and must be considered). Very small changes in
dielectric constant may be determined by configuring the sample cell into a single active arm AC
bridge network (Figure 12). Excitation (3 to 5 kHz depending upon cell design) and
demodulation of the bridge circuit is normally accomplished by an AC bridge amplifier.
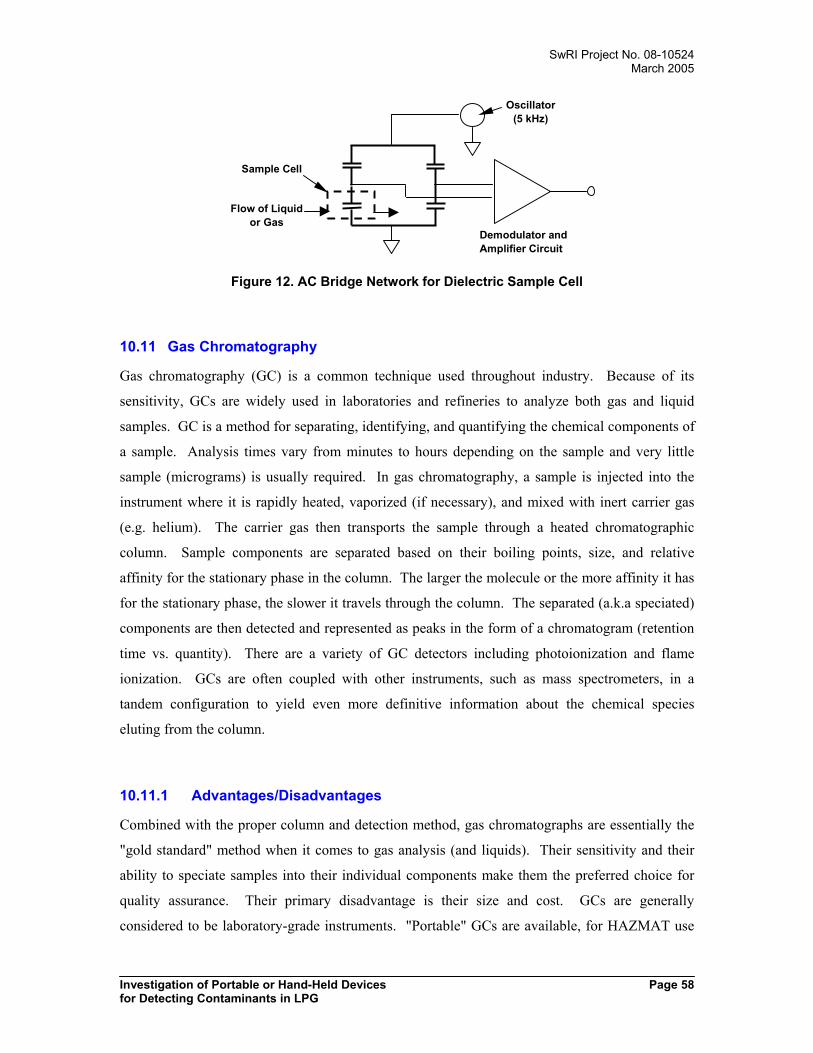
SwRI Project No. 08-10524March 2005
Investigation of Portable or Hand-Held Devices Page 58for Detecting Contaminants in LPG
Flow of Liquidor Gas
Sample Cell
Oscillator(5 kHz)
Demodulator andAmplifier Circuit
Figure 12. AC Bridge Network for Dielectric Sample Cell
10.11 Gas Chromatography
Gas chromatography (GC) is a common technique used throughout industry. Because of its
sensitivity, GCs are widely used in laboratories and refineries to analyze both gas and liquid
samples. GC is a method for separating, identifying, and quantifying the chemical components of
a sample. Analysis times vary from minutes to hours depending on the sample and very little
sample (micrograms) is usually required. In gas chromatography, a sample is injected into the
instrument where it is rapidly heated, vaporized (if necessary), and mixed with inert carrier gas
(e.g. helium). The carrier gas then transports the sample through a heated chromatographic
column. Sample components are separated based on their boiling points, size, and relative
affinity for the stationary phase in the column. The larger the molecule or the more affinity it has
for the stationary phase, the slower it travels through the column. The separated (a.k.a speciated)
components are then detected and represented as peaks in the form of a chromatogram (retention
time vs. quantity). There are a variety of GC detectors including photoionization and flame
ionization. GCs are often coupled with other instruments, such as mass spectrometers, in a
tandem configuration to yield even more definitive information about the chemical species
eluting from the column.
10.11.1 Advantages/Disadvantages
Combined with the proper column and detection method, gas chromatographs are essentially the
"gold standard" method when it comes to gas analysis (and liquids). Their sensitivity and their
ability to speciate samples into their individual components make them the preferred choice for
quality assurance. Their primary disadvantage is their size and cost. GCs are generally
considered to be laboratory-grade instruments. "Portable" GCs are available, for HAZMAT use
SwRI Project No. 08-10524March 2005
Investigation of Portable or Hand-Held Devices Page 59for Detecting Contaminants in LPG
for example. However, they are only portable in the sense that they have been ruggedized to
withstand outdoor use and run on battery power. Their size is still roughly proportional to a small
benchtop laboratory instrument. And portable or not, GCs still require carrier gas. In portable
versions, a smaller cylinder simply replaces the large laboratory cylinder.
10.12 Ionization Detectors
Photoionization Detectors (PIDs) and Flame Ionization Detectors (FIDs) are instruments that are
typically used to detect low concentrations of volatile organic compounds (VOC). Although both
are designed to provide ppm level measurements, their operating principles and strengths are
different. FIDs and PIDs are commonly used as detectors in gas chromatographs. Because of
their size and overall complexity, FIDs are generally limited to non-portable applications. PIDs
are generally smaller and simpler to use and are preferred in portable applications (Figure 13).
Instruments that utilize PIDs are commonly used in handheld devices to detect the presence of
explosive or toxic gases.
Figure 13. Example of a Handheld PID Monitor Capable ofDetecting VOCs in the Parts-Per-Billion Range
The reason for their wide spread use is that they can achieve selective and/or highly sensitive
detection of specific analytes. However, FIDs and PIDs selectivity is somewhat different. In
general, PIDs respond to functional groups while FIDs respond to chain length. For instance, a
FID will give a similar response to propane, acetone, and isopropanol because all are three carbon
compounds. PID sensitivity to these three compounds will vary as follows: acetone >
isopropanol >> propane. PIDs are particularly useful in the selective determination of aromatic
hydrocarbons or heteroatom containing species.

SwRI Project No. 08-10524March 2005
Investigation of Portable or Hand-Held Devices Page 60for Detecting Contaminants in LPG
Principle of Operation
PIDs use an ultraviolet light as a means of ionizing a gas phase analyte. The molecular ions that
are produced are collected by electrodes, which generate a measurable current. This current is
directly proportional to the analyte concentration. The general form for the photoionization
reaction is
R + hν → R+ + e-
The reason for the high selectivity is because the
only detectable molecules are those in which the
photon absorption is quantum mechanically
"allowed." If the energy of an incoming photon
is high enough then photoexcitation can occur to
the extent that an electron is ejected from its
molecular orbital and the molecule becomes
ionized. When the amount of ionization is
reproducible for a given compound, vapor
pressure, and light source then the current
collected at the PID's electrodes is also reproducible and is proportional to the analyte
concentration. Aromatic hydrocarbons or heteroatom containing compounds have ionization
potentials that are within the output range of commercially available UV lamps. Lamp energies
typically vary from 8.3 to 11.7 ev (electron volts) and wavelengths typically vary from 150 nm to
Increasing PID Sensitivity
aromatics
olefins, ketones, esters, amines,sulfur compounds
esters, aldehydes, alcohols, nC2+aliphatics, chlorinatedhydrocarbons
methane (no response)
Increasing FID Sensitivity
aromatics, long chain compounds
short-chain compounds (methane)
Cl, Br, I compounds
Examples of Ionization Potentials (ev)
CH3SSCH3 8.46CH3CH2SH 9.285CH3COCH3 9.69Elemental Sulfur ~9.5CH3CH=CH2 9.73CH3CH2CH2CH2OH 10.04NH3 10.2H2S 10.4CH3OH 10.84C3H8 11.1COS 11.17-NH2 11.4O2 12.063N2 15.576

SwRI Project No. 08-10524March 2005
Investigation of Portable or Hand-Held Devices Page 61for Detecting Contaminants in LPG
106 nm. Although most PIDs have only one lamp, lamps in the PID can be exchanged depending
on the required analyte selectivity. Common lamp energies include 9.8, 10.6, and 11.7 ev.
An example of selective analyte detection using a PID is the co-elution of benzene and
isopropanol from a gas chromatograph. Benzene and isopropanol have similar boiling points,
80.1°C and 82.5°C respectively, and the two compounds might elute close together in a gas
chromatogram. However, benzene's IP is 9.24 ev while that of isopropanol is 10.15 ev. Using a
low energy lamp (e.g. 9.8 ev), the isopropanol would give a very poor response in the PID thus
allowing for selective detection of the benzene.
FIDs achieve the same end result by means of a hydrogen-air flame to ionize the sample.
Ionization occurs during the combustion process as the VOCs enter the flame. The need for a
hydrogen cylinder and the apparatus to handle the combustion process make FIDs much more
complex than PIDs not to mention the potential safety hazard of an incendiary source in a
propane environment. Table 5 provides a comparison of features for PIDs and FIDs.
Table 5. PID/FID ComparisonParameter PID FID
Size small, portable larger, requires hydrogensource
Linearity Best at low concentration good linearity throughoutrange
Range 5 ppb to 10,000 ppm 1-50,000 ppm
Compounds Mostly volatile organic compounds.A few inorganics
Selectivity selectivity based on lampselection broad sensitivity
Reliability Reliable, long lamp life flame-out issueshydrogen cylinder replacement
Safety generally safe requires flame arrestorCost PID << FID
In general, detection and analysis by ionization methods may be acceptable in an environment
that is normally free of VOCs, hence its use as an area monitoring system. However, without the
benefit of a speciation technique like gas chromatography, quantification of complex mixtures
like LPG would be difficult to analyze because many of the compounds have similar IPs. Since
propane's IP is relatively high, it would be essentially invisible, even to a moderately high-energy
lamp. However, many of the potential contaminants found in LPG have IPs that are so close
together that they may not be separable. Even worse, ethyl mercaptan, the common LPG odorant
has a low IP.

SwRI Project No. 08-10524March 2005
Investigation of Portable or Hand-Held Devices Page 62for Detecting Contaminants in LPG
10.13 Gas Detection Tubes
Principle of Operation
Gas detector tubes are thin glass tubes that contain detection reagent(s) that are sensitive to
specific target compounds. The reagent(s) produce a distinct layer of color change when exposed
to the target compound. Calibration scales are printed on the tubes which indicate the
concentration of the substance being measured. To provide long-term stability (shelf life up to 3
years), the tubes are hermetically sealed to protect the reagents. Hundreds of variations of
detector tubes currently exist to measure a wide variety of chemical compounds. An example of
a detector tube specification sheet (sold by Sensidyne) for ammonia is shown in Figure 14. There
are actrually several tubes for ammonia depending on the concentration range. Some measure as
low as 1 ppm while others measure as high as 30%.
Figure 14. Example Detctor Tube Specification for Ammonia from Sensidyne
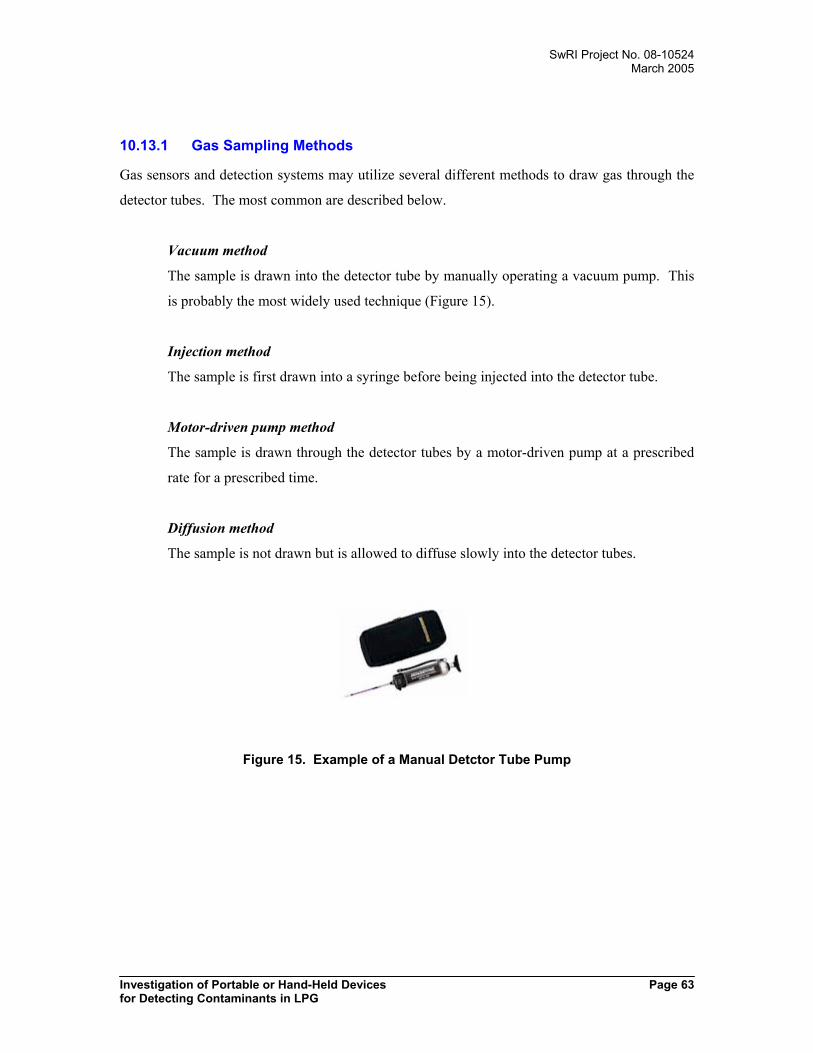
SwRI Project No. 08-10524March 2005
Investigation of Portable or Hand-Held Devices Page 63for Detecting Contaminants in LPG
10.13.1 Gas Sampling Methods
Gas sensors and detection systems may utilize several different methods to draw gas through the
detector tubes. The most common are described below.
Vacuum method
The sample is drawn into the detector tube by manually operating a vacuum pump. This
is probably the most widely used technique (Figure 15).
Injection method
The sample is first drawn into a syringe before being injected into the detector tube.
Motor-driven pump method
The sample is drawn through the detector tubes by a motor-driven pump at a prescribed
rate for a prescribed time.
Diffusion method
The sample is not drawn but is allowed to diffuse slowly into the detector tubes.
Figure 15. Example of a Manual Detctor Tube Pump

SwRI Project No. 08-10524March 2005
Investigation of Portable or Hand-Held Devices Page 64for Detecting Contaminants in LPG
10.13.2 Reaction Principles
Detector tubes generally react to chemical compounds in one of the following ways:
1. Sample reacts directly with a detecting reagent.
2. Sample reacts directly with several detecting reagents.
3. Sample reacts in a two-step reaction. The sample is first oxidized in a pretreatment
layer before reacting with the detecting reagent.
Substances that are chemically similar to the target compound may also react in the tube affecting
the results. These substances are called interferents and their effects may vary on the detector
tube type.
Interferences in direct reaction type detector tubes
1. The detector tube reagent(s) will also react with the interferents, giving a higher
indication. An example of such interferent is hydrogen sulfide in an ethyl mercaptan
detector tube. Common interferences and their effects are usually documented on the
specification sheet for the detector tube
2. If the detector tube contains a pH indicator then acids and bases will react as
interferents giving a higher indication.
Interferences in compound reaction type detector tubes
If a substance generated by the primary reaction(s) is the same as the target compound
then a higher indication will be given.
Interference in two-step reaction type detector tubes
If interferents consume the pretreatment oxidizer then its ability to oxidize the target
compound will be inhibited resulting in a lower indication.

SwRI Project No. 08-10524March 2005
Investigation of Portable or Hand-Held Devices Page 65for Detecting Contaminants in LPG
10.13.3 Temperature Effects
Most detector tubes are either based on chemical reactions or physical adsorption, both of which
can be greatly affected by tube temperature. These effects are described below.
Influences on reaction rate
Chemical reaction rates are generally proportional to temperature. Below 20°C (68°F),
reactions will slow down and the sample will not completely react in the manner desired.
Some of the sample will diffuse further into the tube and react there creating a long pale
color change giving a higher indication. Above 20°C (68°F), reactions will accelerate
causing the sample to completely react in a shorter distance than the normal. This gives a
shorter layer of color change resulting in a lower indication.
Influences on physical adsorption
Chemical adsorption is inversely proportional to temperature. Below the prescribed
temperature, some of the sample will physically adsorb onto the detector tube reagent that
has already reacted with previous sample. Thus the subsequent sample will never reach
fresh reagent and react in the normal manner giving a lower than expected indication. At
higher temperature, adsorption/desorption will cause the sample to diffuse further into the
tube giving a higher than expected indication.
10.13.4 Correcting Tube Results
Detector tubes are generally resistant to minor fluctuations in temperature, pressure, and
humidity. When conditions are outside of predetermined limits the detector tube specification
sheet will normally provide instructions for correcting the results. Cases that may involve the
need to correct the indicated measurement are as follows.
Correction for temperature
Detector tubes are generally designed to be used at ambient temperatures 0-40°C (32-
104°F) and are calibrated based on a tube temperature (not sample temperature) of 20°C
(68°F). However, some tubes are more sensitive to temperature than others and may give
erroneous results at temperatures other than 20°C. For these tubes, a chart is generally
provided to correct the readings.
SwRI Project No. 08-10524March 2005
Investigation of Portable or Hand-Held Devices Page 66for Detecting Contaminants in LPG
Correction for humidity
Most detector tubes are calibrated based on a specific relative humidity (e.g. 50%) and
their indications are not affected when the humidity is in the range of 0 to 99%.
Correction for atmospheric pressure
Since gas concentration is proportional to pressure, gas detector tubes are calibrated at
normal atmospheric pressure (760 mmHg). Their indications are not usually affected
within ±10% of this pressure. At pressures outside of this range, mathematical
corrections are applied to negate the effect.
10.13.5 Storage of Gas Detector Tubes
Detector tubes contain sensitive reagents and storage in a dark, cool (0-10°C (32-50°F)) place is
recommended.
10.14 Coriolis Measurements
The Coriolis principal states that if a particle inside a rotating body moves in a direction toward
or away from the center of rotation, the particle generates internal forces that act on the body.
Coriolis mass flow meters create a rotating motion by vibrating a tube or tubes carrying the fluid,
and the internal force that results is proportional to the mass flow rate.
In a Coriolis mass flow meter, an angular momentum is imparted to a tube conveying a fluid.
This angular momentum is delivered by harmonic vibration of the tube. As a result, forces
proportional to the product of fluid density and velocity act through the fluid and generate forces
on the tubing wall, producing a measurable effect. Also, mass measurement is inherently very
practical because one does not need to deal with temperature and pressure compensations. There
are several physical configurations of the tubes, for example U-shaped and omega-shaped. While
the details of their design are not particularly important at this point, the coriolis meter is unique
in several ways:
• It can directly measure the mass of a flowing stream.• It can measure the flowing density of the stream.• It can determine the volume of the stream.• It does not have rotating mechanical parts (although there is one vibrating component).

SwRI Project No. 08-10524March 2005
Investigation of Portable or Hand-Held Devices Page 67for Detecting Contaminants in LPG
In the context of using Coriolis meters for the LPG custody transfer operations, this meter can
provide accurate flow rate information and it can provide some indicator of changes in fuel
composition caused by mixture changes or introduction of contaminants. Unfortunately, one does
not obtain any readout from the instrument to indicate what specific component of the mixture
caused the density change. Density accuracy is better than ± 0.001 g/mL for most applications
with repeatability of the order ± 0.0005 g/mL. This implies that one needs a change of mass
composition in the liquid phase of the order ± 0.1% to be detected. This may be a borderline
situation for employing the coriolis meter as a device to detect LPG contaminants.
10.15 Interface Detection
Another possibility for the detection of bulk contamination in large storage tanks may be to detect
the interface between the liquid hydrocarbon and the tank bottoms. Since the tank bottoms are
primarily going to consist of water, water-soluble material, and sediments that have collected
over the years, a distinct interface should be detectable. However, detection of a small amount of
tank bottoms is extremely challenging. The depth of a heavy, liquid or insoluble material
representing one percent by volume of a three foot six inch diameter tank would be
approximately 1.4 inches (Figure 16). As seen in the figure, installation of depth measuring
equipment on either the inside or outside (especially with submerged tanks) requires special
consideration.
d
Dia
Depth at Center-Bottom of Cylindrical Tank vs % Full
0
0.5
1
1.5
2
2.5
3
3.5
0 1 2 3 4 5 6
Depth of liquid (inches)
% o
f Ful
l Cro
ss S
ectio
n
3.5' Dia Tank6' Dia Tank
Figure 16. Depth of Bottom Sludge as a Percent of Full Tank Cross Section

SwRI Project No. 08-10524March 2005
Investigation of Portable or Hand-Held Devices Page 68for Detecting Contaminants in LPG
To investigate interface detection, we initially looked at commercially available tank gauging
systems. There are many different types of sensor technologies utilized in tank gauging systems.
The sensors may be initially categorized as either contact or non-contact with respect to the
substance being measured. The term invasive or non-invasive may also be used. Oftentimes, the
literature will use these terms interchangeably: non-contact = non-invasive and contact =
invasive. By our definition, sensors that are invasive are those that must penetrate the tank wall
in order to get access to the substance to be measured. By that definition, nearly all tank-gauging
systems herein are invasive. Invasive sensors are installed through an existing port in the tank or
one that is specifically created. However, an invasive sensor is not necessarily in contact with the
substance to be measured. Based on our understanding of the problem and the intended target for
these sensors (i.e. the retailer), we believe that the best "interface sensor" would be one that is
non-invasive and non-contact. Our reasoning for this is that existing tanks are unlikely to have a
suitable port in which a sensor could be installed.
Common tank level gauging systems that are relevant to this discussion are based on a few basic
measurement types:
• Ultrasonic
• Radar
• Capacitance
• Conductance
In their standard configuration, most of these sensors will be of little use in detecting the
LPG/water interface, primarily due to the need for tank penetration of the sensor. However, in
some cases the technology may be modified to make sensors that are non-intrusive. Another
technology, which may show promise, is a field effect sensor. This sensor detects interfaces,
which create disruptions in the electric field around the sensor.
10.15.1 Ultrasonic
Ultrasonic and sonic level instruments use sound waves to determine fluid level. The frequency
range for ultrasonic methods is ~20 to 200 kHz and sonic types use a frequency of 10 kHz. In
practice, these sensors are mounted in the top of a tank above the maximum fill point of the
liquid. A piezoelectric crystal inside the transducer converts electrical pulses into sound energy

SwRI Project No. 08-10524March 2005
Investigation of Portable or Hand-Held Devices Page 69for Detecting Contaminants in LPG
that travels through the headspace of the tank in the form of a wave at a specific frequency and at
a known speed in the given medium (e.g. propane vapor or air). The sound waves are emitted in
bursts and received back at the transducer as echoes from the surface of the liquid. The
instrument measures the total time it takes for each sound pulse to traverse the gap between the
sensor and the liquid surface and return. This time is proportional to the distance from the
transducer to the surface and is used to determine the level of fluid in the tank. Alternatively, a
transmitter/receiver pair may be employed. Depending on a number of conditions, typical sensor
resolution accuracy will be on the order of ±10 mm.
Ultrasonic technology can also be used to detect the interface between immiscible liquids or the
presence of suspended solids. Two common techniques found in the literature are ultrasonic
attenuation (Figure 17) and reflection (Figure 18). Viscous liquids, emulsions, and liquids with
entrained solids usually have higher attenuation. If the attenuation difference between the liquids
is sufficient then the sensor gain can be adjusted to reflect off of the more attenuating liquid. The
primary disadvantage of this technique is that it is invasive and must be installed through the
sidewall of the tank.
Figure 17. Interface Detection by Attentuation

SwRI Project No. 08-10524March 2005
Investigation of Portable or Hand-Held Devices Page 70for Detecting Contaminants in LPG
Figure 18. Interface Detection by Reflection
10.15.2 Radar
Comparable to ultrasonic measurements, radar (or microwave) is also a common technique for
tank level gauging. Radar uses electromagnetic waves, typically in the microwave X-band (5-26
GHz) range. For continuous level measurement, there are two main types of non-contact
systems: frequency-modulated continuous wave (FMCW) and pulsed radar or pulsed time-of-
flight (similar to the ultrasonic technique). Both of these techniques require an antenna to be
mounted inside the top of the tank (Figure 19). A variety of antennas are used depending on the
application. Under normal circumstances the antenna will not come into contact with the liquid.
A third common technique, guided wave or Time Domain Reflectometry (TDR), requires direct
contact with the liquid. However, of the three radar techniques this one claims to be able to
detect interfaces between liquids with different dielectric constants. Recall that a low dielectric
material, like propane (dielectric constant = 1.6), is non-conductive. Water on the other hand is
conductive and has a much higher dielectric constant (80). Dielectric measurements are
commonly used to find oil/water interfaces. In the guided wave technique, extremely short
microwave pulses travel along a cable or rod that extends to the bottom of the tank (Figure 20).

SwRI Project No. 08-10524March 2005
Investigation of Portable or Hand-Held Devices Page 71for Detecting Contaminants in LPG
The radar waves reflect off the surface or interface of the liquid(s) and are detected back at the
sensor. The transit time of the signal is proportional to distance. In fact, tank-gauging systems
for low dielectric materials, such as liquid propane, often use guided wave sensors (or a horn and
stilling tube) to increase measurement accuracy. The radar measurement resolution should be
better than ultrasonic at ±5 mm.
Figure 19. Examples of Tank Radar Antennas
Figure 20. Guided Wave Radar
10.15.3 Capacitance
Sensors based on capacitance are commonly used for both point level and continuous
measurements. Electrical capacitance is the ability to store an electrical charge and exists
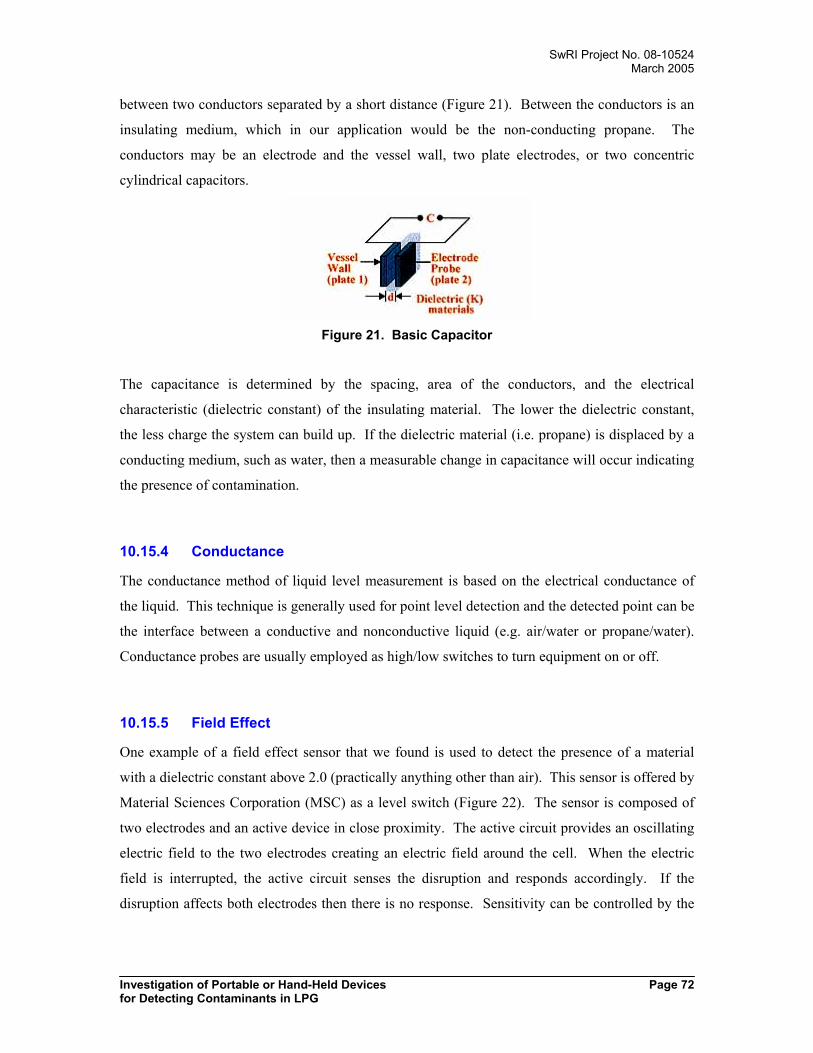
SwRI Project No. 08-10524March 2005
Investigation of Portable or Hand-Held Devices Page 72for Detecting Contaminants in LPG
between two conductors separated by a short distance (Figure 21). Between the conductors is an
insulating medium, which in our application would be the non-conducting propane. The
conductors may be an electrode and the vessel wall, two plate electrodes, or two concentric
cylindrical capacitors.
Figure 21. Basic Capacitor
The capacitance is determined by the spacing, area of the conductors, and the electrical
characteristic (dielectric constant) of the insulating material. The lower the dielectric constant,
the less charge the system can build up. If the dielectric material (i.e. propane) is displaced by a
conducting medium, such as water, then a measurable change in capacitance will occur indicating
the presence of contamination.
10.15.4 Conductance
The conductance method of liquid level measurement is based on the electrical conductance of
the liquid. This technique is generally used for point level detection and the detected point can be
the interface between a conductive and nonconductive liquid (e.g. air/water or propane/water).
Conductance probes are usually employed as high/low switches to turn equipment on or off.
10.15.5 Field Effect
One example of a field effect sensor that we found is used to detect the presence of a material
with a dielectric constant above 2.0 (practically anything other than air). This sensor is offered by
Material Sciences Corporation (MSC) as a level switch (Figure 22). The sensor is composed of
two electrodes and an active device in close proximity. The active circuit provides an oscillating
electric field to the two electrodes creating an electric field around the cell. When the electric
field is interrupted, the active circuit senses the disruption and responds accordingly. If the
disruption affects both electrodes then there is no response. Sensitivity can be controlled by the

SwRI Project No. 08-10524March 2005
Investigation of Portable or Hand-Held Devices Page 73for Detecting Contaminants in LPG
design of the electrodes, the gain, and the active circuit. Therefore, the cells can be designed to
meet an application's specific needs.
Figure 22. Field Effect Sensor
The major disadvantage of this particular sensor is that it must be attached to a substrate that is a
dielectric such as glass, plastic, or isolated (i.e. ungrounded) metal. This would obviously be a
problem for metal storage tanks. In the short time that we investigated this type of sensor, we
were unable to find a similar sensor that could get around this problem. However, a solution
most likely exists or could be engineered.
This sensor draws less than 16 µA of current in the inactive state. It also has a high signal-to-
noise ratio setting it apart from capacitive sensors and making it immune to low-level circuit
noise and environmental (radio frequency) noise. Field effect technology is inherently stable, and
should require minimal calibration, drift compensation, or digital filtering as other sensors
sometimes do.
10.16 Particle Counters
In the petroleum industry, a common application for particle counters is in the analysis of
hydraulic fluids - an estimated 80 percent of all hydraulic system failures are attributable to
particulate contamination in the fluid. In the pasts few years there has been a push (albeit a small
one) to augment/replace laboratory, filtration-based, particulate measurements for petroleum
products (diesel, aviation fuel, etc) with particle counting. This hasn't yet caught on because the
fuel specifications are still written in weight/volume requirements for particulate matter. Particle
counters return particle counts at various particle sizes and there isn't a clear conversion between
that and weight/volume. In addition, there isn't a good understanding (or agreement) on what
sizes of particles will be a problem. The same is true for LPG. Nevertheless, particle-counting

SwRI Project No. 08-10524March 2005
Investigation of Portable or Hand-Held Devices Page 74for Detecting Contaminants in LPG
technology is well established and is routinely used in an on-line fashion and may be applicable
to particulate matter in LPG.
We will consider two basic types of liquid-borne-particle sensors: light scattering and light
blocking. Light-scattering sensors detect smaller particles than light-blocking sensors and are
more effective at counting light-colored particles. However, light-scattering sensors are more
expensive because they must contain collection optics for the scattered light. The basic
components of any particle counter include a light source (typically a laser), a photodetector, and
a sample cell. A typical, commercially available, particle counter will likely use a solid-state
infrared laser diode as a light source. These lasers have a life expectancy approaching 30,000
hours. In addition, the output of solid state laser diodes is stable and does not require frequent
calibration.
Particle sizes are measured in nanometers and micrometers (microns). Typical light-blocking
particle counters measure particle sizes in the micron range (e.g. 10 micron) while the more
sensitive, light-scattering technique is employed to measure sub-micron (100 nm) particle sizes.
A typical, on-line particle counter for liquid applications requires that the flow be restricted to
approximately 100mL/min. Sampling times can be as short as 1 minute.
10.16.1 Light-Scattering Particle Counters
Light-scattering sensors operate by detecting the amount of light reflected, refracted, or diffracted
by a particle. As a liquid sample enters the sensor, it passes through the optical cell where the
laser light is most intense. Particles in the sample scatter the light into off-axis collection optics
that focus the light onto a photodetector. The photodetector converts the light pulses into
electrical pulses where the magnitude of each pulse is proportional to the amount of scattered
light and thus particle size. The particle counter then sorts and counts the pulses according to
particle size.
10.16.2 Light-Blocking Particle Counters
Light-blocking sensors are more efficient at detecting opaque and dark-colored particles because
they operate by detecting how much light is blocked rather than scattered. As the liquid sample
flows through the cell, particles in the sample momentarily block the light. The amount of light

SwRI Project No. 08-10524March 2005
Investigation of Portable or Hand-Held Devices Page 75for Detecting Contaminants in LPG
blocked is indicative of the particle size. As the particles pass through the light beam, a
photodetector detects the momentary decrease in light intensity and creates a corresponding
electrical pulse that is proportional to particle size. The pulses are counted and categorized by
size by the particle counter instrumentation.
10.16.3 Advantages/Disadvantages
In general, light-blocking sensors have many preferred features over light-scattering sensors:
• More effective at counting dark-colored particles
• Remain calibrated over a large range of flow rates
• Handle higher concentrations of particles (~20,000 counts/mL)
• Have a longer service life
• Simpler optical design
• Cost less
On the other hand, if light-colored or sub-micron particles are the target then light-scattering
sensors are preferential.
10.17 Summary Notes for Sensor Technologies
10.17.1 Gas Monitoring Systems
Notes on gas monitoring sensors:
• commonly used as area monitoring sensors but not in analytical applications
• sensors are usually very small and are used in handheld devices for portable personnelprotection
• some sensors are based on chemical reactions so they get used over time
• sensors have relatively short life span and finite shelf life
• detection limit is usually very high (ppm) and sensitivity is linear
• specificity is moderately good but interferents may co-respond with target analytes andthere is no way to tell them apart
SwRI Project No. 08-10524March 2005
Investigation of Portable or Hand-Held Devices Page 76for Detecting Contaminants in LPG
10.17.2 Chemical Array Sensors
Notes on chemical arrays:
• some chemical arrays are small and handheld/portable
• sensors rely heavily on mathematical (multivariate analysis) techniques to extract and
model the response of the system
• potentially frequent re-calibration as the sensors age
• on average, detection limits are high ppm to %level concentrations - often dependant on
volatility and vapor pressure of compounds
• could probably increase specificity with some sensor and method development
• off-the-shelf sensors use large arrays (e.g. 32 sensors) of chemically different sensors and
they rely on calibration techniques for identification
• chemical array are not generally good in quantitative applications, especially when
measuring complex mixtures
• most common application is in discriminatory analysis
10.17.3 Spectroscopic Sensors
Notes on spectroscopic measurements:
• Calibration and maintenance may be difficult – light sources tend to drift over time
nullifying the current calibration
• Diode lasers are more stable than lamps and have long operating lives
• Could be made portable or even handheld.
• If analyte specific detection and quantification is desired, then a dedicated sensor
operating at a fixed wavelength would probably be needed for each contaminant.
• Multiple analyte detection requires multiple single-wavelength sensors, a tunable laser, or
a complex model based on multiple wavelength (broadband) spectra.
• Detection of bulk contamination through fingerprinting is plausible.
• Detection limits for broadband spectra are generally lower (% range) owing to
interferences and less sensitive instrumentation.
• Diode lasers have much higher sensitivity and can achieve the ppm level sensitivity that
is needed for this application.
SwRI Project No. 08-10524March 2005
Investigation of Portable or Hand-Held Devices Page 77for Detecting Contaminants in LPG
10.17.4 Dielectric Measurement
Notes on dielectric measurements:
• Easy to use, simply fill chamber with gas or liquid
• Calibration with complex mixtures required
• Could be made portable but not likely handheld
• control circuit is simple but temperature control is required
• sensitive to changes in composition but must be calibrated for specific analytes
• Generally used for bulk contamination especially complex mixtures
10.17.5 Gas Chromatography
Notes on gas chromatography:
• generally considered to be the gold standard
• some method development may be required
• periodic calibration and frequent standardization required
• consumables - periodic column change and continuous use of carrier gas (hydrogen or
helium)
• handheld instrument not likely - portable systems exist but they're still large and bulky
• detection limit, sensitivity, and selectivity are very good
10.17.6 Photoionization Detector (PID)
Notes on PID:
• may be handheld - already exist as handheld gas monitoring sensors
• measurement is based on ionization potential (IP) which is sensitive and can be specific
to a variety of compounds depending on their IP
• detection limits are good - in the ppm range for most compounds
• propane should be invisible but most other contaminants will respond together, therefore
specificity in LPG is not good
• measurement of bulk contamination (i.e. compounds other than propane) without analyte
identification may be possible
SwRI Project No. 08-10524March 2005
Investigation of Portable or Hand-Held Devices Page 78for Detecting Contaminants in LPG
10.17.7 Flame Ionization Detector (FID)
Notes on FID:
• comparable to PID
• instrumentation is bulky - requires a burner and a source of combustible gas like
hydrogen
• not considered portable
• detection limits are as good as PID and more linear at high concentrations
• specificity is generally poorer than PID because measurement is mostly sensitive to chain
length
10.17.8 Gas Detection Tubes
Notes on gas detection tubes:
• very simple to operate - uses a manual or automatic pump to draw air through tube,
therefore technology should be dependable
• tube selection process may require some standardization - a series of tubes in a particular
order to specifically identify a contaminant
• good for bulk contamination or analyte specific detection
• detection limits are tube dependent and there are a variety of tubes to choose from
• tube concentrations vary from ppm to %level
• minor temperature and pressure effects
• tube selection is critical because some tubes respond to multiple analytes; however, the
interferents usually respond with a different color so the interference is known.
10.17.9 Coriolis Measurement
Notes on Coriolis measurements:
• minor setup• periodic calibration• Available off-the-shelf but very expensive• may be vehicle mounted but vibration may be a problem• generally very reliable with few moving parts• not good for speciation because it is not selective - only makes bulk measurements• high repeatability/reproducibility• should detect slugs of water but not minor changes in low concentration contaminants

SwRI Project No. 08-10524March 2005
Investigation of Portable or Hand-Held Devices Page 79for Detecting Contaminants in LPG
10.17.10 Particle Counters
Notes on particle counters:
• factory calibrated on an annual or semiannual basis
• the sensor is small (12 oz can size) but not generally used in a portable application
• may be truck mounted or at a fixed facility
• typically use laser diodes which are reliable and have a very long life
• can easily measure and quantify micron size particles
• can handle at least 16,000 counts/mL so it is sensitive yet difficult to saturate under
normal conditions
• linear output
• does not discriminate between solid materials
• intended for bulk particulate measurement
11.0 SENSOR TRADE-OFF STUDY
A sensor trade-off analysis was undertaken to identify those technologies that show promise for
incorporation into portable or handheld devices for detecting contaminants in LPG. The
technologies were assessed in terms of six major attributes: 1) low operation complexity, 2)
portability, 3) high reliability, 4) detection limit, 5) good sensitivity, and 6) high specificity.
When assigning ratings to each attribute, consideration was given to the ultimate end user - the
LPG retailer. While many of these technologies are certainly applicable to LPG analysis, a
suitable instrument package may not be currently available or ready for direct employment at the
retail level. In those cases, we considered only the technology and its suitability for the intended
purpose assuming that it could be designed into a suitable instrument package. The assigned
scale (or grade) for the attributes used in the trade-off study are described below. The rating
scales are set up to provide the highest number for the most desired characteristic.
SwRI Project No. 08-10524March 2005
Investigation of Portable or Hand-Held Devices Page 80for Detecting Contaminants in LPG
Low Operational Complexity
Operational complexity embodies the overall difficulty of using the sensor/instrument.
This parameter encompasses several aspects of the use of the system including setup,
calibration, and general handling.
The rating scale for this parameter is
1 difficult
10 easy
Portability
The focus of this entire effort was to investigate portable or handheld sensors for LPG
analysis. While many applicable sensor technologies exist, some are simply not portable.
Therefore, the portability parameter distinguishes a sensor's potential to be portable.
The rating scale assigned to this parameter is
1 Laboratory or other climate controlled facility
5 Vehicle-mounted or fixed site
10 Handheld
High Reliability
Our definition of reliability is the operational or shelf life of a sensor or instrument.
Some instruments have a finite life span. For instance, spectroscopic instruments that use
lamps deteriorate over time and the lamp must be replaced. Some chemical sensors
utilize catalysts that are also used up under normal operation. And finally, some sensors
have a finite shelf life. This parameter attempts to quantify that reliability characteristic
which is indicative of maintenance or upkeep that the retailer will face.
The rating scale assigned to this parameter is
1 <1 year operational or shelf life
5 2 year operational or shelf life
10 4+ year operational or shelf life

SwRI Project No. 08-10524March 2005
Investigation of Portable or Hand-Held Devices Page 81for Detecting Contaminants in LPG
Detection Limit
The detection limit is the threshold value above which a sensor can detect an analyte.
Obviously, most sensors are tuned to make them particularly sensitive to just a few
chemical compounds. For rating detection limit, we only considered a sensor's ability to
detect the chemical species for which it was designed.
The rating scale assigned to this parameter is
1 does not detect
5 detects, but at higher concentration (e.g. % range)
10 detects low concentration (e.g. ppm range)
Good Sensitivity
In many applications, just detecting a gas in not sufficient. A reproducible response
according to the concentration is usually desirable as well. The sensitivity parameter is a
measure of change in sensor response to changes in analyte concentration. With modern
electronics and signal processing, many shortcomings of a particular sensor can be
improved. Therefore, the ratings used here are directed as much as possible towards the
inherent characteristics of the sensing element.
The rating scale assigned to this parameter is
1 saturates at all concentrations (serious shortcoming)
5 nonlinear response or moderate output
10 linear response and inherent high output
High Specificity
In addition to being able to respond to low concentration analytes in a predictable
manner, specificity in detection is also a desirable characteristic. As we have seen, some
sensors are affected by interferents, which are co-detected along with the desired target
analyte.
The rating scale assigned to this parameter is
1 non-specific, multiple interferents
5 at least 1 major interferent
10 only detects desired analyte
SwRI Project No. 08-10524March 2005
Investigation of Portable or Hand-Held Devices Page 82for Detecting Contaminants in LPG
11.1 Weighting Factors
Each of the parameters is assigned a weight based on their perceived importance in the selection
process. The weights range from 1-10, with 10 being the most important. The following weights
were selected:
Low Operational Complexity 6
Portability 8
High Reliability 6
Detection Limit 10
Good Sensitivity 5
High Specificity 8
Relative to the other tests, we ranked "Low Operation Complexity" and "Good Sensitivity" lower.
We believe that once a sensor or instrument is identified, standard methods for sampling and
testing will be documented which will remove most of the complexity for the operator. With
respect to sensitivity, we believe that detecting the contaminants is more critical than providing a
predictable or linear response to changes in their concentration. In fact, detectability is the most
important attribute of a sensor.
11.2 Trade-off Summary
Based on the trade-off parameters and weighting criteria described above, a trade-off analysis was
performed for the LPG sensor candidates. Sensors that share similar characteristics, serve a
common purpose (e.g. gas monitoring sensors), or are based on variations of a particular
technology (e.g. spectroscopic) were grouped together. The results of the trade-off analysis are
summarized in Table 6. The sections that follow describe the factors that were considered in
rating the various sensors. The trade-off analysis was performed in MS Excel to facilitate sharing
of information. The composite score for a particular technology is simply the product of an
attribute's grade with its corresponding weighting factor summed across all attributes. Note that
the interface detection methods were not included in the trade-off analysis. Since these
measurements are more physical than chemical we'll discuss them separately in the
recommendations section.
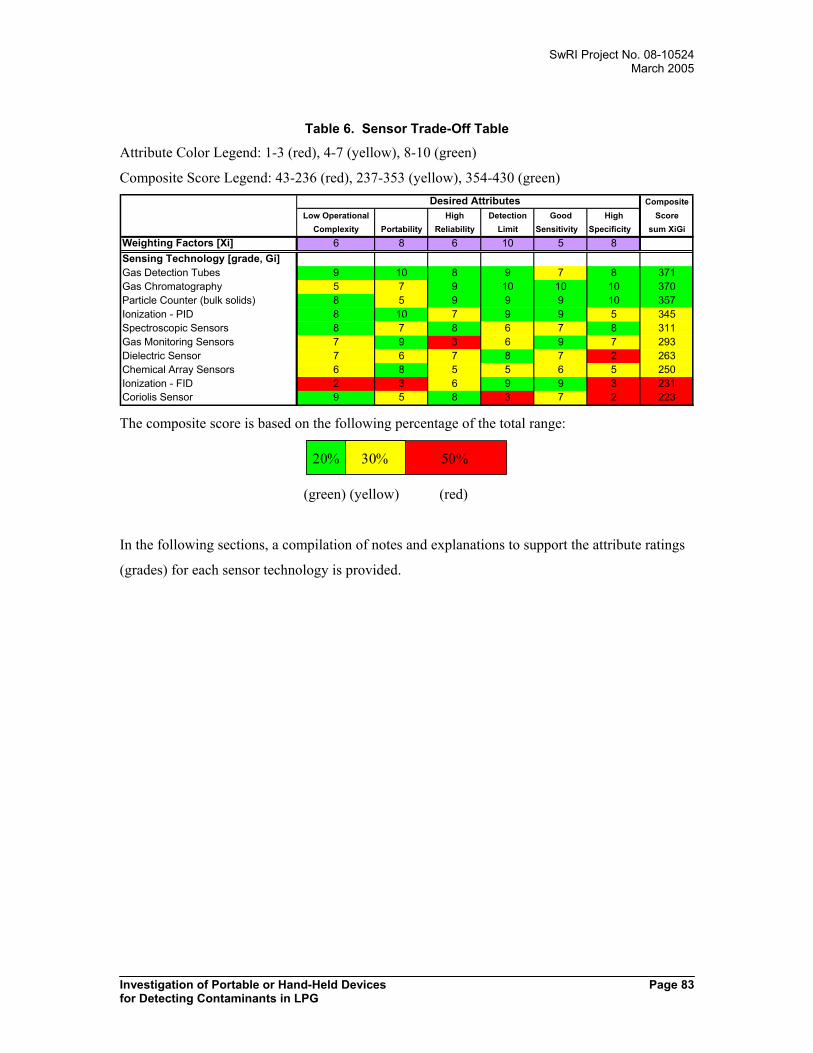
SwRI Project No. 08-10524March 2005
Investigation of Portable or Hand-Held Devices Page 83for Detecting Contaminants in LPG
Table 6. Sensor Trade-Off Table
Attribute Color Legend: 1-3 (red), 4-7 (yellow), 8-10 (green)
Composite Score Legend: 43-236 (red), 237-353 (yellow), 354-430 (green)Desired Attributes Composite
Low Operational High Detection Good High ScoreComplexity Portability Reliability Limit Sensitivity Specificity sum XiGi
Weighting Factors [Xi] 6 8 6 10 5 8Sensing Technology [grade, Gi]Gas Detection Tubes 9 10 8 9 7 8 371Gas Chromatography 5 7 9 10 10 10 370Particle Counter (bulk solids) 8 5 9 9 9 10 357Ionization - PID 8 10 7 9 9 5 345Spectroscopic Sensors 8 7 8 6 7 8 311Gas Monitoring Sensors 7 9 3 6 9 7 293Dielectric Sensor 7 6 7 8 7 2 263Chemical Array Sensors 6 8 5 5 6 5 250Ionization - FID 2 3 6 9 9 3 231Coriolis Sensor 9 5 8 3 7 2 223
The composite score is based on the following percentage of the total range:
50%20% 30%
(green) (yellow) (red)
In the following sections, a compilation of notes and explanations to support the attribute ratings
(grades) for each sensor technology is provided.

SwRI Project No. 08-10524March 2005
Investigation of Portable or Hand-Held Devices Page 84for Detecting Contaminants in LPG
BLANK

SwRI Project No. 08-10524March 2005
Investigation of Portable or Hand-Held Devices Page 85for Detecting Contaminants in LPG
APPENDIX BInstrument Evaluation
SwRI Project No. 08-10524March 2005
Investigation of Portable or Hand-Held Devices Page 86for Detecting Contaminants in LPG
12.0 Background
An electronic nose is an instrument that is capable of analyzing and recognizing gaseous samples
using chemical sensors and mathematical pattern recognition algorithms. This distinguishes it
from classical analytical instruments, like gas chromatography/mass spectrometry (GC/MS),
which can determine the amount and the chemical structure of the analytes. Electronic noses are
generally used to classify samples into a predetermined set of sample classes.
An electronic nose is normally supplied with several chemically different and non-specific
chemical gas sensors. A chemical gas sensor is a device that responds to the chemical
composition of the ambient gaseous phase. There are a variety of different "nose" sensors that
operate on different gas sensing principles (surface acoustic wave, conducting organic polymers,
etc.). The different functional principles lead to different types of sensors and some types of
sensors are more suitable for certain types of analytes in the gas phase. It is entirely feasible to
affect the response of the sensor to a specific analyte by changing its design during production or
changing the operation of the sensor. It is possible to construct highly specific sensors, which
respond only to a few kinds of molecules or even only to one target compound. These are not
normally used in electronic noses, because the samples often contain a complex mixture of many
different analytes in varying quantities.
The sensors in an electronic nose are said to be partially specific, i.e. each individual sensor
responds best to a certain group of analytes. The response of a particular sensor is always the
total response for all compounds that it is exposed to at that moment. Some compounds may
generate a strong response while others may not interact with the sensor at all adding little to the
signal. It is not possible to associate a part of the response to a specific compound, especially
because sometimes the response to one compound is influenced by the presence of another
compound. This is known as cross sensitivity, matrix effects, or interaction effects. Therefore,
the electronic nose is generally a limited number of non-specific sensors with overlapping, yet
varying, sensitivities, which responds to a large range of volatile compounds. The result is a
unique response pattern, or “fingerprint” for each sample that it encounters. The same sample
should ideally elicit the same fingerprint pattern on each exposure allowing for classification.
For example, if an electronic nose is supplied with 32 different sensors, a vapor sample provides
32 different responses, each containing different information. These 32 signals, represented as
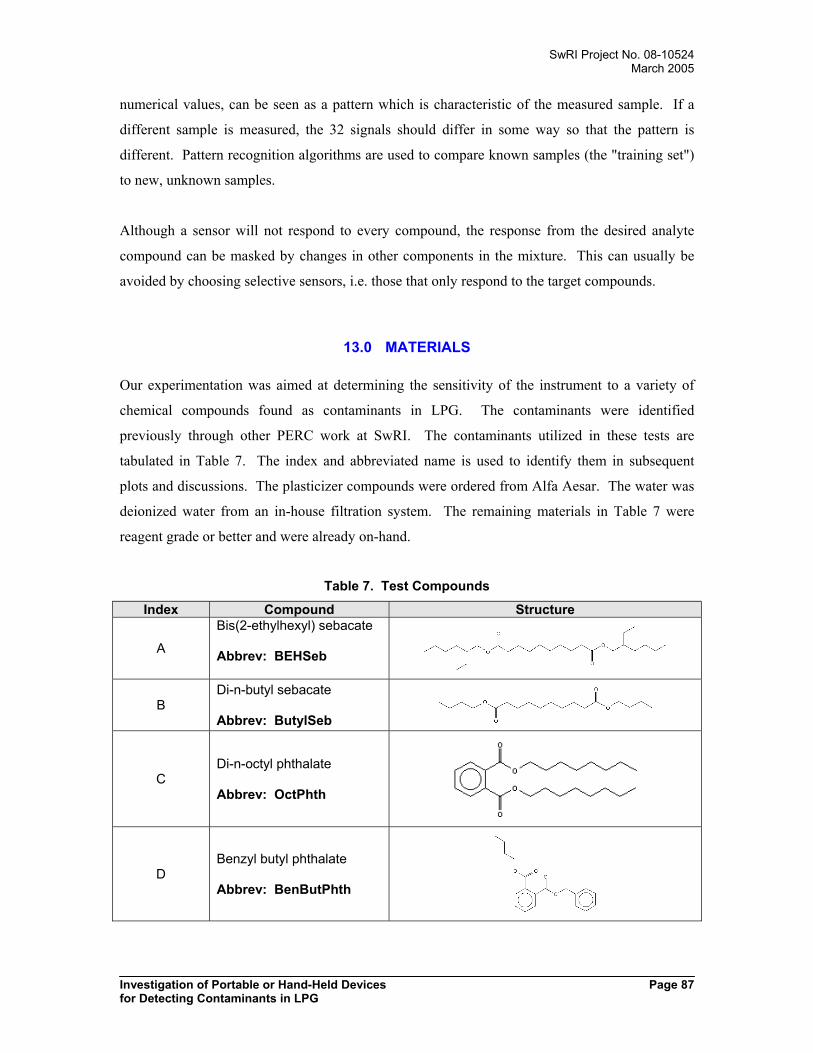
SwRI Project No. 08-10524March 2005
Investigation of Portable or Hand-Held Devices Page 87for Detecting Contaminants in LPG
numerical values, can be seen as a pattern which is characteristic of the measured sample. If a
different sample is measured, the 32 signals should differ in some way so that the pattern is
different. Pattern recognition algorithms are used to compare known samples (the "training set")
to new, unknown samples.
Although a sensor will not respond to every compound, the response from the desired analyte
compound can be masked by changes in other components in the mixture. This can usually be
avoided by choosing selective sensors, i.e. those that only respond to the target compounds.
13.0 MATERIALS
Our experimentation was aimed at determining the sensitivity of the instrument to a variety of
chemical compounds found as contaminants in LPG. The contaminants were identified
previously through other PERC work at SwRI. The contaminants utilized in these tests are
tabulated in Table 7. The index and abbreviated name is used to identify them in subsequent
plots and discussions. The plasticizer compounds were ordered from Alfa Aesar. The water was
deionized water from an in-house filtration system. The remaining materials in Table 7 were
reagent grade or better and were already on-hand.
Table 7. Test Compounds
Index Compound Structure
A
Bis(2-ethylhexyl) sebacate
Abbrev: BEHSeb
BDi-n-butyl sebacate
Abbrev: ButylSeb
CDi-n-octyl phthalate
Abbrev: OctPhth
DBenzyl butyl phthalate
Abbrev: BenButPhth
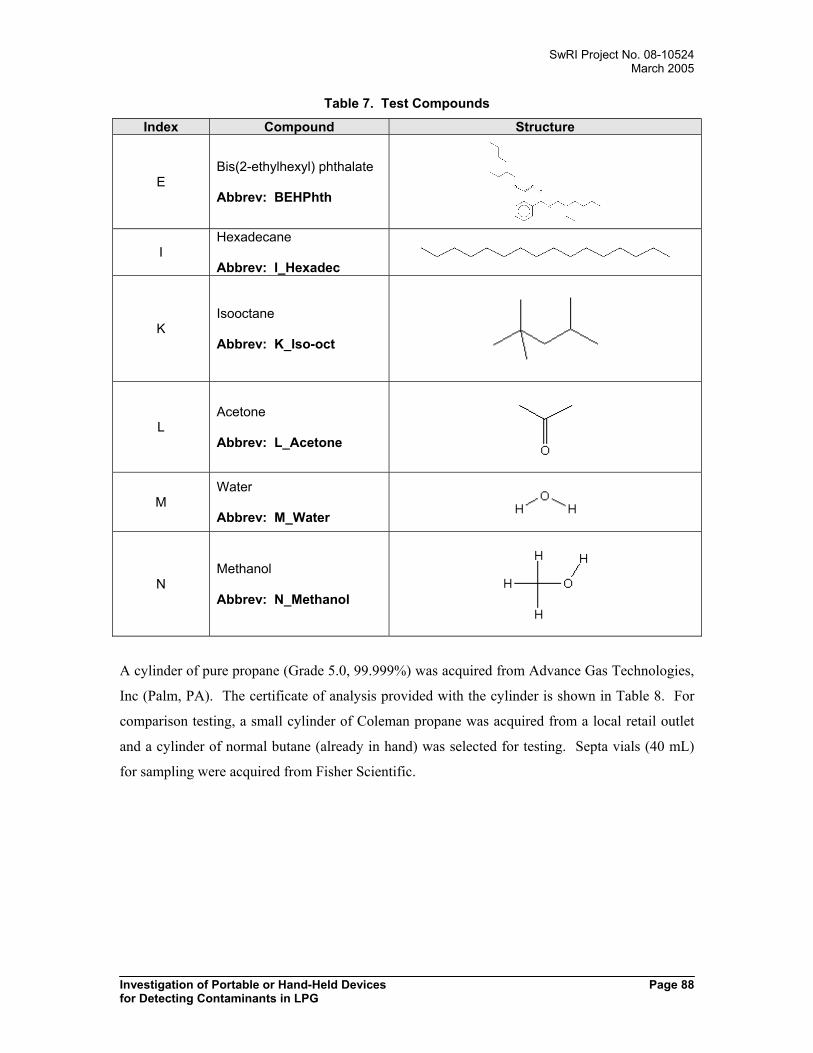
SwRI Project No. 08-10524March 2005
Investigation of Portable or Hand-Held Devices Page 88for Detecting Contaminants in LPG
Table 7. Test Compounds
Index Compound Structure
EBis(2-ethylhexyl) phthalate
Abbrev: BEHPhth
IHexadecane
Abbrev: I_Hexadec
KIsooctane
Abbrev: K_Iso-oct
LAcetone
Abbrev: L_Acetone
MWater
Abbrev: M_Water
NMethanol
Abbrev: N_Methanol
A cylinder of pure propane (Grade 5.0, 99.999%) was acquired from Advance Gas Technologies,
Inc (Palm, PA). The certificate of analysis provided with the cylinder is shown in Table 8. For
comparison testing, a small cylinder of Coleman propane was acquired from a local retail outlet
and a cylinder of normal butane (already in hand) was selected for testing. Septa vials (40 mL)
for sampling were acquired from Fisher Scientific.
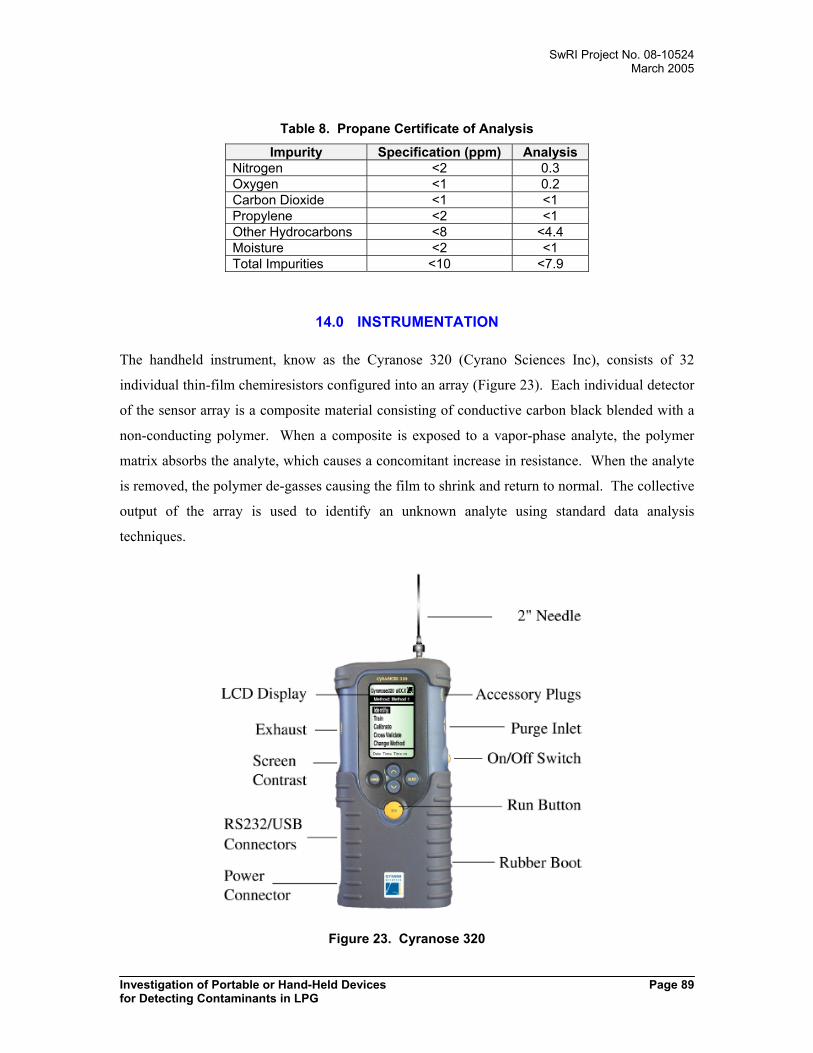
SwRI Project No. 08-10524March 2005
Investigation of Portable or Hand-Held Devices Page 89for Detecting Contaminants in LPG
Table 8. Propane Certificate of Analysis
Impurity Specification (ppm) AnalysisNitrogen <2 0.3Oxygen <1 0.2Carbon Dioxide <1 <1Propylene <2 <1Other Hydrocarbons <8 <4.4Moisture <2 <1Total Impurities <10 <7.9
14.0 INSTRUMENTATION
The handheld instrument, know as the Cyranose 320 (Cyrano Sciences Inc), consists of 32
individual thin-film chemiresistors configured into an array (Figure 23). Each individual detector
of the sensor array is a composite material consisting of conductive carbon black blended with a
non-conducting polymer. When a composite is exposed to a vapor-phase analyte, the polymer
matrix absorbs the analyte, which causes a concomitant increase in resistance. When the analyte
is removed, the polymer de-gasses causing the film to shrink and return to normal. The collective
output of the array is used to identify an unknown analyte using standard data analysis
techniques.
Figure 23. Cyranose 320

SwRI Project No. 08-10524March 2005
Investigation of Portable or Hand-Held Devices Page 90for Detecting Contaminants in LPG
The unit is trained by measuring vapor "fingerprints" representative of the samples that will be
analyzed later. Future measurements are then compared to these patterns to identify (i.e. classify)
the vapor. The unique polymer composite sensors have been shown to respond to a wide range of
organic compounds. Such a device, which is sensitive to a variety of volatile organic compounds,
might be used to "fingerprint" LPG (that meets required specifications) and form a basis for
future comparison samples of unknown quality. The Cyranose 320 sensor specification is shown
in Table 9.
Table 9. Cyranose 320 Sensor Specification
Parameter DescriptionWeight <32 ounces (0.91 kg)Dimensions 10 x 22 x 5 cmSensor Array Module 32 polymer carbon black compositesBattery Type NiMH battery packUniversal Power Adapter 110-240 V AC external power adapterBattery Life (Normal Operating Conditions) 3 hoursBattery Charging <3 hours with external adapterDisplay 320x200 graphic with LED backlight
Inlet ProbeOne 2” and one 4” needle interchangeablewith any standard female Luer Lock or slipadapter.
Keypad Scroll up/down, select, run and cancelWarm up time (at room temperature) < 5 minutesCommunication RS–232 @ 9600 to 57,600 bpsSampling Pump 50–180 cc/minute
Algorithms PCA, KNN, K-means, CDA(CanonicalDiscriminant Analysis)
Operating Temperature 0 to 40°C (32 to 104°F)Humidity 10 to 95%, non-condensingStorage Temperature -20 to 50°C (-4 to 122°F)
PC compatibility Minimum requirements Pentium II, 266 MHz,Windows 95, with CD ROM drive.
The general operation of the Cyranose 320 is described in the Users Manual as follows.
The Cyranose 320 consists of three functional components:
1. Sampling system
2. Chemical sensors
3. Signal processing and data manipulation

SwRI Project No. 08-10524March 2005
Investigation of Portable or Hand-Held Devices Page 91for Detecting Contaminants in LPG
These components are designed to work together to provide sophisticated measurement and data
processing capability while maintaining simplicity of operation.
The measurement is based on a change in resistance of each chemical sensor in the 32-sensor
array when exposed to a chemical vapor. This is a differential measurement with the sensor
response measured as (Rmax-Ro)/Ro, where Ro is the resistance during a baseline gas flow and Rmax
is the maximum resistance during exposure to the sample vapor.
14.1 Sampling System
The sampling system requires two independent sample paths. The sampling system provides
independent sample paths to allow for the differential sensor resistance measurements. Inside the
Cyranose 320 a valve and pump are used to pull the purge gas and sample vapors over the
sensors. The purge path supplies background air to the sensors for the Ro measurement, as well
as a means to purge the sensors of sample vapor after sampling. The sample path provides a
means for the sample vapors to reach the sensors that are kept at constant temperature inside the
Cyranose 320.
14.2 Purge Cycle
In the purge cycle (Figure 24), the valve is in the default position (open) and allows vapors from
the purge inlet on the side of the Cyranose 320 to be pulled across the sensor array. The vapor is
then emitted at the exhaust port on the opposite side of the Cyranose 320.
Figure 24. Schematic of the Purge Cycle
This cycle provides the baseline or Ro sensor measurement. An optional filter may be added to
the baseline flow to remove either background chemicals or moisture, which might interfere in
the analysis. This cycle is also used to refresh the sensors after the sampling cycle.
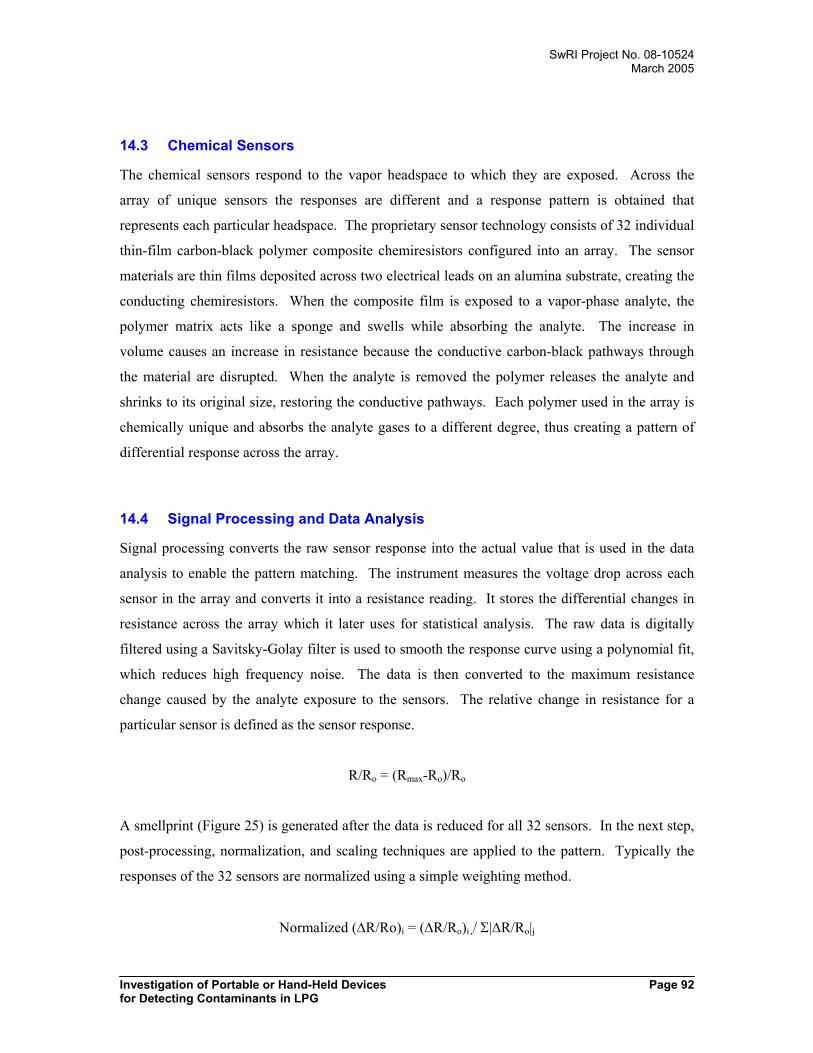
SwRI Project No. 08-10524March 2005
Investigation of Portable or Hand-Held Devices Page 92for Detecting Contaminants in LPG
14.3 Chemical Sensors
The chemical sensors respond to the vapor headspace to which they are exposed. Across the
array of unique sensors the responses are different and a response pattern is obtained that
represents each particular headspace. The proprietary sensor technology consists of 32 individual
thin-film carbon-black polymer composite chemiresistors configured into an array. The sensor
materials are thin films deposited across two electrical leads on an alumina substrate, creating the
conducting chemiresistors. When the composite film is exposed to a vapor-phase analyte, the
polymer matrix acts like a sponge and swells while absorbing the analyte. The increase in
volume causes an increase in resistance because the conductive carbon-black pathways through
the material are disrupted. When the analyte is removed the polymer releases the analyte and
shrinks to its original size, restoring the conductive pathways. Each polymer used in the array is
chemically unique and absorbs the analyte gases to a different degree, thus creating a pattern of
differential response across the array.
14.4 Signal Processing and Data Analysis
Signal processing converts the raw sensor response into the actual value that is used in the data
analysis to enable the pattern matching. The instrument measures the voltage drop across each
sensor in the array and converts it into a resistance reading. It stores the differential changes in
resistance across the array which it later uses for statistical analysis. The raw data is digitally
filtered using a Savitsky-Golay filter is used to smooth the response curve using a polynomial fit,
which reduces high frequency noise. The data is then converted to the maximum resistance
change caused by the analyte exposure to the sensors. The relative change in resistance for a
particular sensor is defined as the sensor response.
R/Ro = (Rmax-Ro)/Ro
A smellprint (Figure 25) is generated after the data is reduced for all 32 sensors. In the next step,
post-processing, normalization, and scaling techniques are applied to the pattern. Typically the
responses of the 32 sensors are normalized using a simple weighting method.
Normalized (∆R/Ro)i = (∆R/Ro)i / Σ|∆R/Ro|j

SwRI Project No. 08-10524March 2005
Investigation of Portable or Hand-Held Devices Page 93for Detecting Contaminants in LPG
The normalized data is usually auto-scaled to remove the effects of response size on the
smellprint pattern. Once preprocessing and post-processing is complete, one of several on-board
pattern recognition algorithms is applied: K-Nearest Neighbor (KNN), K-means, or Canonical
Discriminant Analysis.
Figure 25. Smellprint Containing 32 sensor Responses
14.5 Outlier Diagnostics
Currently, principal component analysis (PCA) is used for visual outlier diagnostic. PCA plots
are used to find the data points that lie far away from the centroid of a particular class.
14.5.1 Principal Component Analysis (PCA)
The Principal Component Analysis (PCA) is a model-based and unsupervised method and is
widely used for a variety of data types to extract the main relations in the data matrix containing
sensor responses. The aim of the Principal Component Analysis is the optimum (in terms of data
set variance) description of a given data set in a dimension smaller than the number of sensors, N,
which span a vector space of N dimensions.
PCA data is depicted graphically and attempts to describe the majority of the variation in the data
set. Therefore, the data set is plotted in a minimal new set of axes, which represents a maximum
amount of variation. The coordinate axes of the newly defined space are formed by linear
combination of the original axes and need to be uncorrelated or orthogonal (eigenvector analysis).

SwRI Project No. 08-10524March 2005
Investigation of Portable or Hand-Held Devices Page 94for Detecting Contaminants in LPG
One axis, or base vector, represents one virtual quality independent of all others and is called the
principal component (PC). The first axis is chosen in a way that it represents the direction along
the largest variance in the data set, the second axis shows the second largest variance, and so on.
Two plots are often used to represent PCA data: a plot of PCA scores and a plot of PCA loadings.
The plots may be two or three-dimensional depending on the number PCA factors chosen to
model the data set. For the scores plot, the distance between points (samples) corresponds
directly to their overall likeliness. The Mahalanobis Distance gives a numeric value for the
likeliness of the samples and can be specified for samples or sample groups.
The loadings plot shows the contribution of individual features (i.e. sensor response) to the
calculation of the PCs. By evaluating the loadings plot redundant features not contributing to the
evaluation can be chosen for removal. Features placed close to the origin (0,0) of the loadings
plot have little influence; features close to each other, under the same angle, or mirrored across
the center carry may carry redundant information.
14.6 Algorithms
Pattern recognition algorithms are powerful tools used to deal with large sets of data such as that
collected from the Cyranose 320. The Cyranose 320 uses PCA for outlier diagnosis and three
supervised algorithms for building a model and predicting the unknowns. These three supervised
algorithms are K-nearest neighbor (KNN), K-means and Canonical Discriminant Analysis
(CDA). Normally, CDA requires a matrix such that the number of rows is equal or greater than
the number of the columns. Therefore, the number of exposures of each sample should be equal
or greater than the number of sensors used in the electronic nose. However, the number of
exposures in the training set or class may be smaller than the number of sensors (e.g. 32). For
CDA, the first step is to employ a data compression technique, such as PCA, to the 32
dimensional sensor response data and use a subset of significant principal component scores as
inputs in the CDA. This guarantees a square matrix and avoids overfitting the model.
14.6.1 KNN
The k-nearest neighbor technique classifies an unknown sample according to the majority of its k
nearest neighbors. The nearest neighbor is that which is the shortest distance away in the model

SwRI Project No. 08-10524March 2005
Investigation of Portable or Hand-Held Devices Page 95for Detecting Contaminants in LPG
space. For the calculation of the distance, the most common metrics are Euclidean distance and
Mahalanobis distance. The sample with k = 1 is the closest neighbor in the training set of data.
14.6.2 K-Means
This is a prediction algorithm in which an unknown is assigned to a class on the basis of the
Euclidean distance between the class centroid and the sample in sensor space.
14.6.3 Canonical Discriminant Analysis (CDA)
In Canonical Discriminant Analysis, an unknown sample is assigned to a class. A canonical
model maximizes the distance between the different classes and minimizes the distance between
the training samples in one class. The selection criterion is the class with the shortest
Mahalanobis distance between its centroid and the sample in canonical space.
14.7 Sensor Selection
Sensor selection is often a difficult and time-consuming process and requires intimate knowledge
of the sensor array material and its compatibility with the sample vapor. In this case, the sensor
array is proprietary, so all 32 of the sensors will be used. Some of the sensors (namely 5, 6, 23,
and 31) are known to be sensitive to water vapor and those may be removed to prevent
adulteration of the analysis. However, in tests that require the detection of water, those sensors
will need to be used.
14.8 Sensor Conditioning
The Cyranose 320 (and other chemical noses) are sometimes affected by the "first sniff" issue.
As the C320 sits idle its sensors constantly interact with the environment and are in
thermodynamic equilibrium with the water in the ambient air. When the pump is turned on, water
begins to desorb from the sensors, which may affect the response of the sensor. Several measures
can be taken to help overcome the first-sniff issue:
• Purge the chamber for six minutes at startup or when the instrument has been idle for 30
minutes or more

SwRI Project No. 08-10524March 2005
Investigation of Portable or Hand-Held Devices Page 96for Detecting Contaminants in LPG
• Condition the instrument before collecting training set data. This involves sniffing at
least one sample of any three compound classes in the training set. When running real
samples, make several runs to verify repeatability.
• If the application permits, use a fresh drying tube on a daily basis to remove water from
the ambient air.
14.9 Sampling Considerations
14.9.1 Sample temperature
The temperature of the sample will have a significant effect on the chemical composition and
concentration of the headspace. The composition change and the big concentration change of the
headspace will cause the smellprint to change. Therefore, for measurement repeatability it is
critical to control the sample temperature.
14.9.2 Relative Humidity
The sensors are designed and selected for the identification of organic vapors, but like other
sensors, they will respond to water vapor. The concentration of water found in many samples and
in the ambient environment is often orders of magnitude higher than many of the key sample
constituents. For samples that are relatively dry the use of a drying filter in the baseline purge
flow path should be used to give more consistent results.
14.9.3 Sampling Sequence
To capture the maximum variability within each of the defined sample classes, training
measurements should be taken in random order. This ensures that the sensor array does not give
a fixed output based on the order of exposure of certain compounds.
14.9.4 Substrate Temperature
Measurement sensitivity is affected by temperature - lower temperatures give a stronger sensor
response. Optimally, the training set and subsequent sample runs should be taken at the same
substrate temperature. The substrate temperature should be set above ambient conditions but
should not exceed 42°C. A lower substrate temperature will generally give a longer battery life.
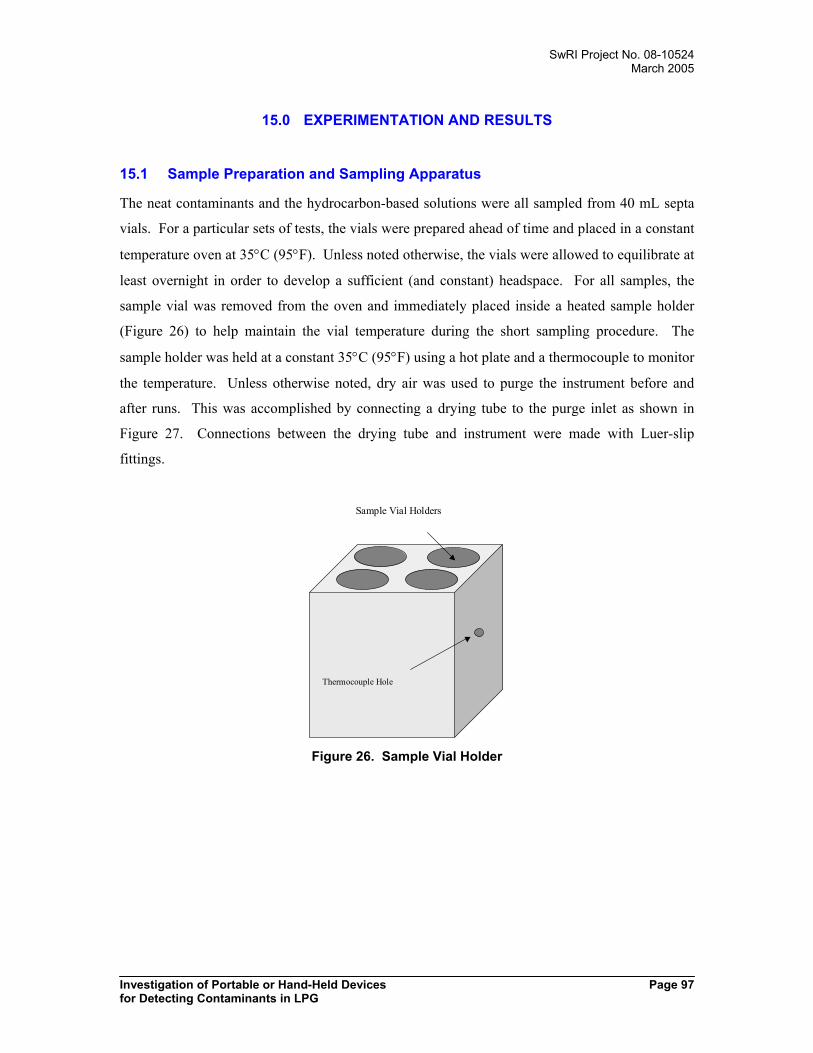
SwRI Project No. 08-10524March 2005
Investigation of Portable or Hand-Held Devices Page 97for Detecting Contaminants in LPG
15.0 EXPERIMENTATION AND RESULTS
15.1 Sample Preparation and Sampling Apparatus
The neat contaminants and the hydrocarbon-based solutions were all sampled from 40 mL septa
vials. For a particular sets of tests, the vials were prepared ahead of time and placed in a constant
temperature oven at 35°C (95°F). Unless noted otherwise, the vials were allowed to equilibrate at
least overnight in order to develop a sufficient (and constant) headspace. For all samples, the
sample vial was removed from the oven and immediately placed inside a heated sample holder
(Figure 26) to help maintain the vial temperature during the short sampling procedure. The
sample holder was held at a constant 35°C (95°F) using a hot plate and a thermocouple to monitor
the temperature. Unless otherwise noted, dry air was used to purge the instrument before and
after runs. This was accomplished by connecting a drying tube to the purge inlet as shown in
Figure 27. Connections between the drying tube and instrument were made with Luer-slip
fittings.
Sample Vial Holders
Thermocouple Hole
Figure 26. Sample Vial Holder

SwRI Project No. 08-10524March 2005
Investigation of Portable or Hand-Held Devices Page 98for Detecting Contaminants in LPG
Cyranose 320
Drying Agent
Humid Air
Purge Inlet
Figure 27. Dry Air Purge
15.1.1 Neat Compounds
When testing the neat compounds, the vials were sampled according to Figure 28. In this
configuration, only a short sample draw period (approximately 25 seconds at low pump speed) is
permissible because a vacuum quickly develops as the headspace vapor is removed. Each vial
contained 1 mL of the sample to be tested.
Cyranose 320
Sample
Headspace
Needle
Septa Cap
Figure 28. Basic Sampling Technique
SwRI Project No. 08-10524March 2005
Investigation of Portable or Hand-Held Devices Page 99for Detecting Contaminants in LPG
15.1.2 Hydrocarbon Solutions
In later experiments, a dry air bubbler, as shown in Figure 29, was used to help regenerate the
headspace as sample vapor was removed. This was used with the hydrocarbon-based solutions so
that a longer sample draw time could be used. The hydrocarbon solutions, regardless of the
sample compound, were prepared as 0.5% solutions in 0.45µm filtered isooctane. Generally, a
0.5% stock solution was prepared and then 5 mL of the solution was placed in the vials. A
minimum of five vials per sample compound was required in order to generate the training matrix
for the Cyranose 320.
Cyranose 320Drying Agent
Humid Air
Dry Air
Figure 29. Sampling With a Dry Air Bubbler
Some differential experiments were also carried out wherein isooctane was used as the purge gas
rather than dry air. The setup for this configuration is shown in Figure 30. The isooctane vial
used a dry air bubbler to keep its headspace constant.

SwRI Project No. 08-10524March 2005
Investigation of Portable or Hand-Held Devices Page 100for Detecting Contaminants in LPG
Drying Agent
Humid Air
Dry Air
Isooctane
Cyranose 320Drying Agent
Humid Air
Dry Air
Purge Inlet
Sample
Figure 30. Sampling With a Dry Air Bubbler and Isooctane Purge
15.1.3 Gas Samples
Although the Cyranose 320 is designed to handle vapor phase samples, it is not designed to
handle high-pressure systems. In order to measure gas samples, the best approach was to use the
onboard pump to pull the gas sample off of a low-pressure gas stream (Figure 31). Using a
needle valve for tight control, the sample gas contained in the sample cylinder was passed
through a low-pressure gas regulator and exhausted into a fume hood. The needle of the
Cyranose 320 was used to puncture the exhaust hose and draw in sample gas as it flowed by.
Sample Cylinder
NeedleValve
Low PressureRegulator
Exhaust
Cyranose 320
Flow
Figure 31. Sampling from a Gas Cylinder

SwRI Project No. 08-10524March 2005
Investigation of Portable or Hand-Held Devices Page 101for Detecting Contaminants in LPG
15.1.4 Instrument Settings
The Cyranose 320 instrument settings that were common to all experiments are tabulated in Table
10. These are based on the manufacturer's recommended settings. The Cyranose 320 is primarily
designed to sample gases at ambient temperatures. However, some of the compounds have low
vapor pressure so heating is required to help generate sufficient headspace gas to properly sample
them. The manufacturer strongly recommends against exposing the Cyranose 320 to high
temperature vapors because the vapors may immediately condense in the cooler pathways inside
the instrument and contaminate future samplings. The instrument utilizes a substrate heater to
prevent this from happening. To minimize risk, we chose to heat the sample vials to 35°C (95°F).
Therefore, the substrate temperature was set to 42°C (107.6°F) or seven degrees higher than the
sample temperature as recommended by the manufacturer (the maximum substrate temperature is
50°C (122°F).
Table 10. Common Instrument Settings
Parameter SettingDigital Filtering OnSubstrate Heater On (42°C)Training Repeat Count 1Identifying Repeat Count 1Algorithm CanonicalPreprocessing Auto-scalingNormalization Normalization 1Identification Quality Medium
15.1.5 Understanding the Results
The following sections contain a series of figures and tables that visually describe the results of
the testing. These plots are best viewed in color. The tables and figures are as follows:
• Table - Training Set
• Figure - PCA Plot
• Figure - Canonical Plot
• Table - Interclass Mahalanobis Distance
Training Set
The training set table lists each compound class and each exposure (measurement). For each
exposure, a distance measure is given which relates how close that sample is to all of the other
exposures in its class. The higher the number, the further away the sample is from the class

SwRI Project No. 08-10524March 2005
Investigation of Portable or Hand-Held Devices Page 102for Detecting Contaminants in LPG
center. From this we assume that the sample is different in some way. This information can be
used to find gross outliers - samples that are statistically different from those in its class. The
manufacturer recommends that samples with s distance of 5 or greater be removed or rerun.
PCA Plot
Once a minimum of five samples have been run for a particular class of compound, a principle
component analysis can be performed and the scores (see discussion on PCA) plotted. The PCA
plot is a scores plot and helps to visual how the samples lie together in the sample space. It can
provide a visual indication of outliers or overlap of classes.
Canonical Plot
The canonical plot generally gives similar results to the PCA plot. Once a training set has been
compiled and a model has been built with the data, the results of the model are presented as a
canonical plot, which takes into the account the weighting given to the different samples by the
modeling process. Again, this is just a way to visual the data. Generally, if the data is linearly
separable (i.e. you can draw a line between the classes) then the instrument can easily distinguish
between the different compound classes.
Interclass Mahalanobis Distance
Another output from the modeling process measures how close the compound classes lie relative
to each other. This table gives an indication of how robust a model will be. As a general rule of
thumb suggested by the manufacturer, two classes whose interclass Mahalanobis distance is ≥5
should be distinguishable. Distances less than five indicate that the classes lie relatively close to
one another and should probably be combined into a "superclass," a class containing both
compounds.
The following sections describe the results of the preliminary series of test performed on the
Cyranose 320.
15.2 Experiment #1 - Neat Plasticizers
Five samples each of plasticizer compounds BEHSeb (A), ButylSeb (B), OctPhth (C),
BenButPhth (D), and BEHPhth (E) were prepared and analyzed according to the procedures for
neat compounds described above with the exception that the samples were only allowed to
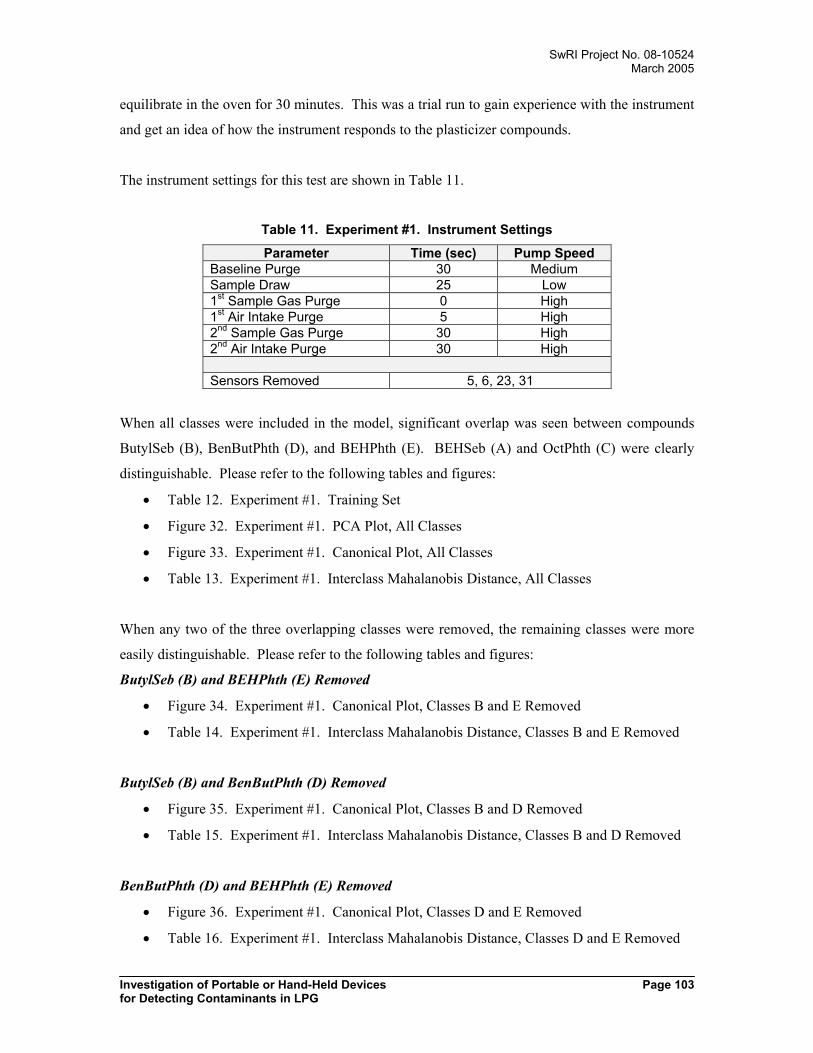
SwRI Project No. 08-10524March 2005
Investigation of Portable or Hand-Held Devices Page 103for Detecting Contaminants in LPG
equilibrate in the oven for 30 minutes. This was a trial run to gain experience with the instrument
and get an idea of how the instrument responds to the plasticizer compounds.
The instrument settings for this test are shown in Table 11.
Table 11. Experiment #1. Instrument Settings
Parameter Time (sec) Pump SpeedBaseline Purge 30 MediumSample Draw 25 Low1st Sample Gas Purge 0 High1st Air Intake Purge 5 High2nd Sample Gas Purge 30 High2nd Air Intake Purge 30 High
Sensors Removed 5, 6, 23, 31
When all classes were included in the model, significant overlap was seen between compounds
ButylSeb (B), BenButPhth (D), and BEHPhth (E). BEHSeb (A) and OctPhth (C) were clearly
distinguishable. Please refer to the following tables and figures:
• Table 12. Experiment #1. Training Set
• Figure 32. Experiment #1. PCA Plot, All Classes
• Figure 33. Experiment #1. Canonical Plot, All Classes
• Table 13. Experiment #1. Interclass Mahalanobis Distance, All Classes
When any two of the three overlapping classes were removed, the remaining classes were more
easily distinguishable. Please refer to the following tables and figures:
ButylSeb (B) and BEHPhth (E) Removed
• Figure 34. Experiment #1. Canonical Plot, Classes B and E Removed
• Table 14. Experiment #1. Interclass Mahalanobis Distance, Classes B and E Removed
ButylSeb (B) and BenButPhth (D) Removed
• Figure 35. Experiment #1. Canonical Plot, Classes B and D Removed
• Table 15. Experiment #1. Interclass Mahalanobis Distance, Classes B and D Removed
BenButPhth (D) and BEHPhth (E) Removed
• Figure 36. Experiment #1. Canonical Plot, Classes D and E Removed
• Table 16. Experiment #1. Interclass Mahalanobis Distance, Classes D and E Removed

SwRI Project No. 08-10524March 2005
Investigation of Portable or Hand-Held Devices Page 104for Detecting Contaminants in LPG
Table 12. Experiment #1. Training Set
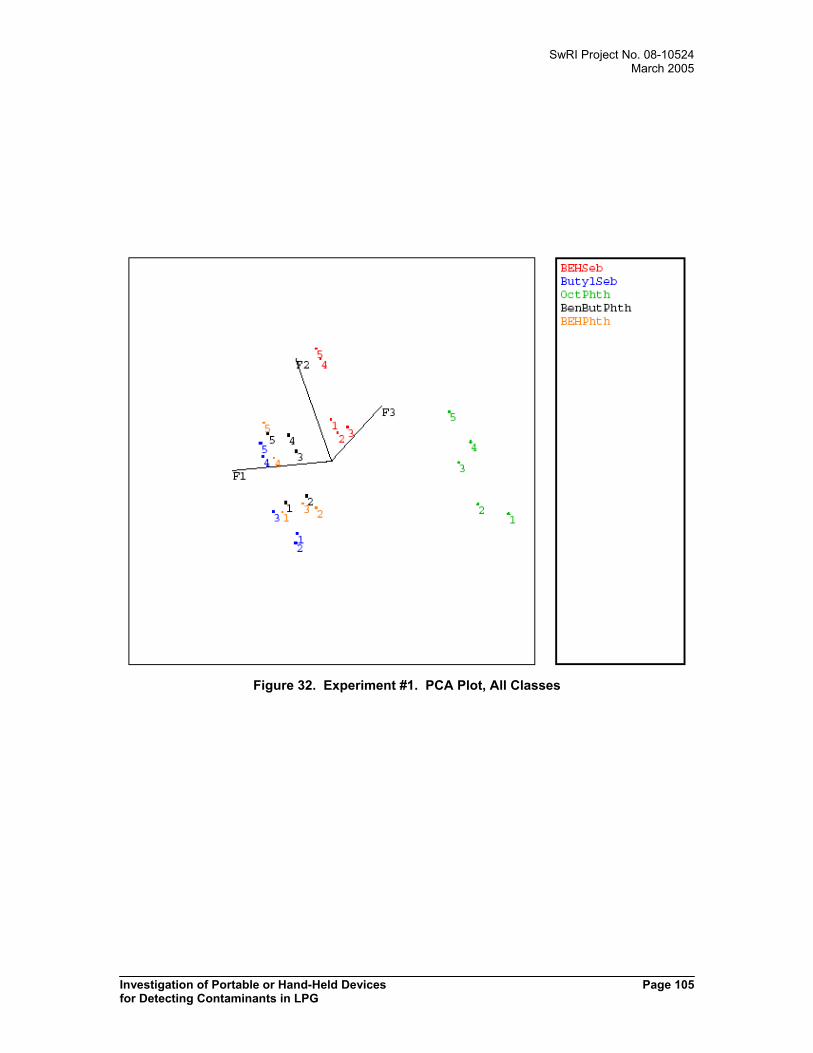
SwRI Project No. 08-10524March 2005
Investigation of Portable or Hand-Held Devices Page 105for Detecting Contaminants in LPG
Figure 32. Experiment #1. PCA Plot, All Classes

SwRI Project No. 08-10524March 2005
Investigation of Portable or Hand-Held Devices Page 106for Detecting Contaminants in LPG
Figure 33. Experiment #1. Canonical Plot, All Classes
Table 13. Experiment #1. Interclass Mahalanobis Distance, All Classes
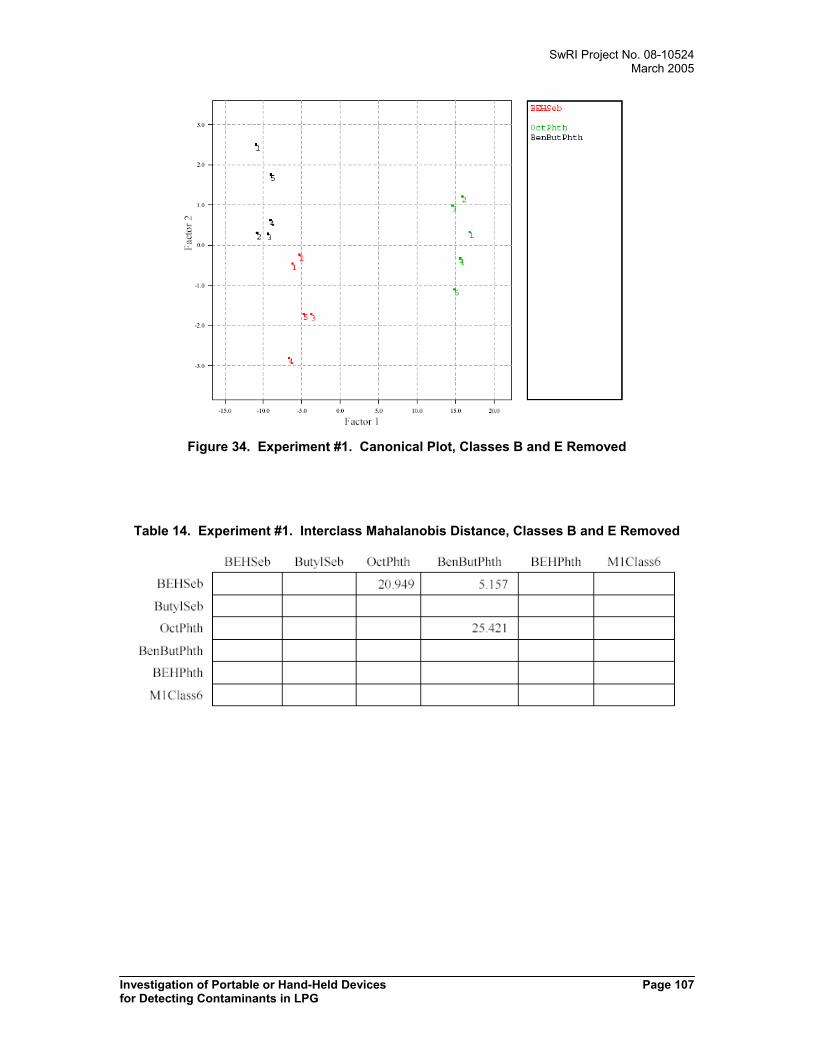
SwRI Project No. 08-10524March 2005
Investigation of Portable or Hand-Held Devices Page 107for Detecting Contaminants in LPG
Figure 34. Experiment #1. Canonical Plot, Classes B and E Removed
Table 14. Experiment #1. Interclass Mahalanobis Distance, Classes B and E Removed
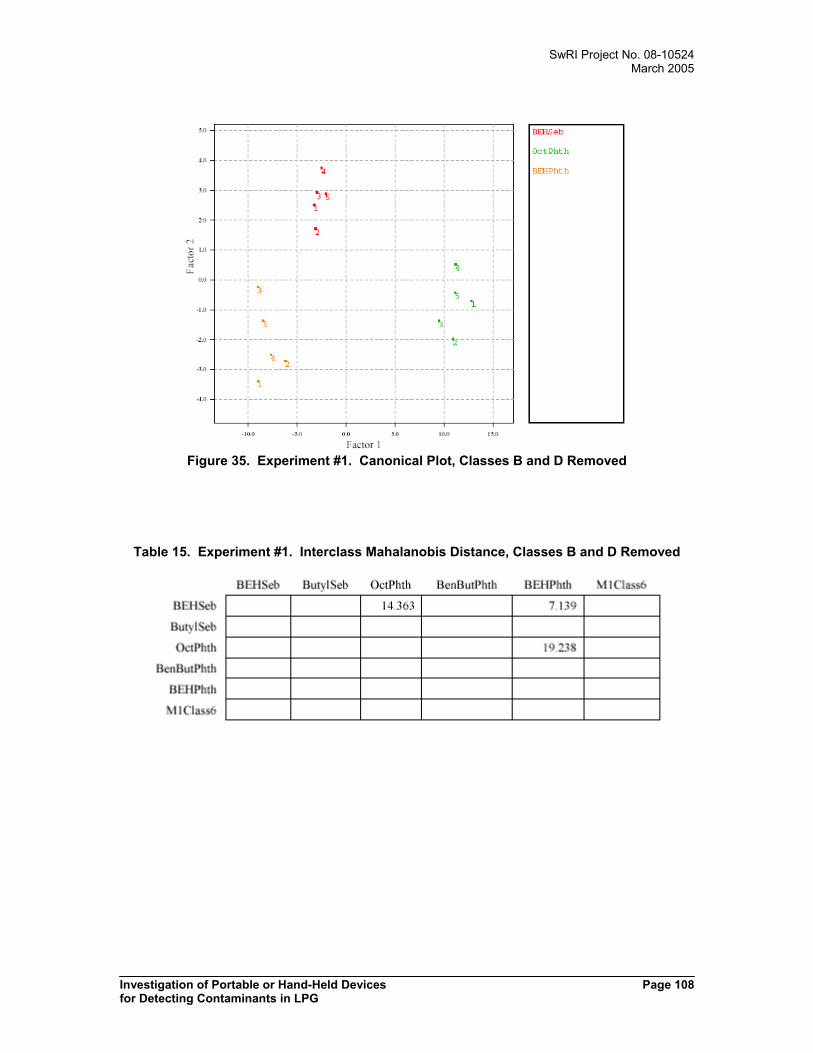
SwRI Project No. 08-10524March 2005
Investigation of Portable or Hand-Held Devices Page 108for Detecting Contaminants in LPG
Figure 35. Experiment #1. Canonical Plot, Classes B and D Removed
Table 15. Experiment #1. Interclass Mahalanobis Distance, Classes B and D Removed

SwRI Project No. 08-10524March 2005
Investigation of Portable or Hand-Held Devices Page 109for Detecting Contaminants in LPG
Figure 36. Experiment #1. Canonical Plot, Classes D and E Removed
Table 16. Experiment #1. Interclass Mahalanobis Distance, Classes D and E Removed
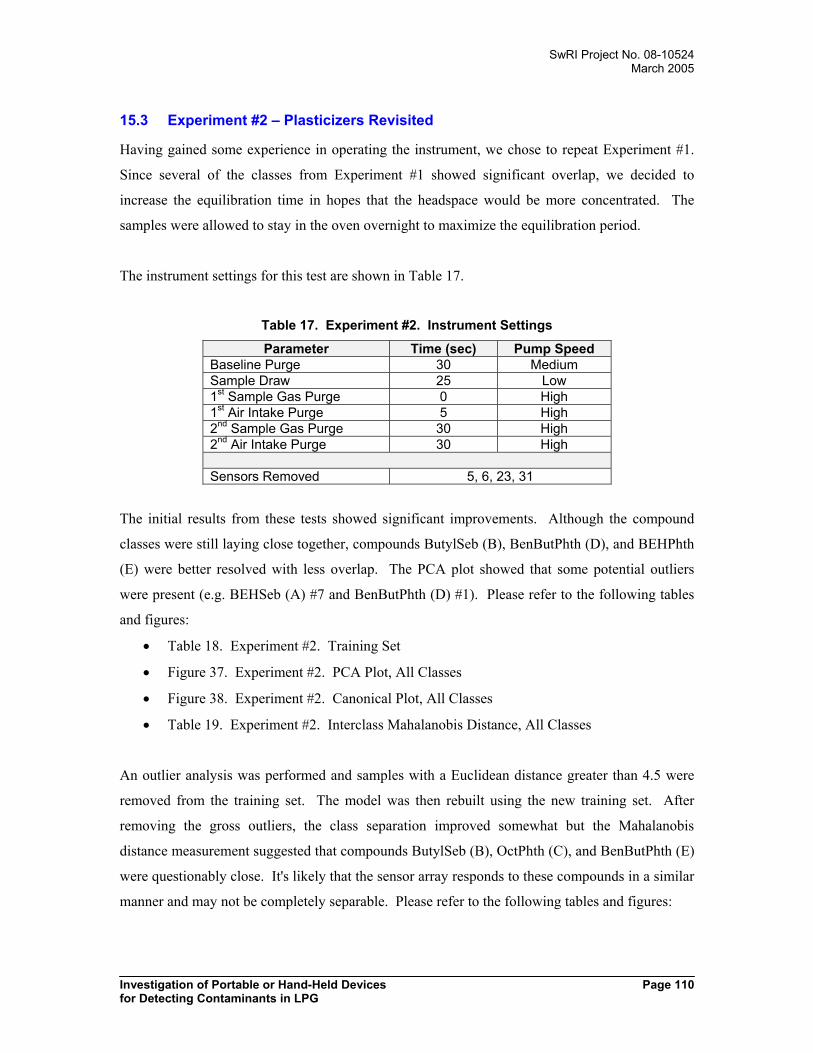
SwRI Project No. 08-10524March 2005
Investigation of Portable or Hand-Held Devices Page 110for Detecting Contaminants in LPG
15.3 Experiment #2 – Plasticizers Revisited
Having gained some experience in operating the instrument, we chose to repeat Experiment #1.
Since several of the classes from Experiment #1 showed significant overlap, we decided to
increase the equilibration time in hopes that the headspace would be more concentrated. The
samples were allowed to stay in the oven overnight to maximize the equilibration period.
The instrument settings for this test are shown in Table 17.
Table 17. Experiment #2. Instrument Settings
Parameter Time (sec) Pump SpeedBaseline Purge 30 MediumSample Draw 25 Low1st Sample Gas Purge 0 High1st Air Intake Purge 5 High2nd Sample Gas Purge 30 High2nd Air Intake Purge 30 High
Sensors Removed 5, 6, 23, 31
The initial results from these tests showed significant improvements. Although the compound
classes were still laying close together, compounds ButylSeb (B), BenButPhth (D), and BEHPhth
(E) were better resolved with less overlap. The PCA plot showed that some potential outliers
were present (e.g. BEHSeb (A) #7 and BenButPhth (D) #1). Please refer to the following tables
and figures:
• Table 18. Experiment #2. Training Set
• Figure 37. Experiment #2. PCA Plot, All Classes
• Figure 38. Experiment #2. Canonical Plot, All Classes
• Table 19. Experiment #2. Interclass Mahalanobis Distance, All Classes
An outlier analysis was performed and samples with a Euclidean distance greater than 4.5 were
removed from the training set. The model was then rebuilt using the new training set. After
removing the gross outliers, the class separation improved somewhat but the Mahalanobis
distance measurement suggested that compounds ButylSeb (B), OctPhth (C), and BenButPhth (E)
were questionably close. It's likely that the sensor array responds to these compounds in a similar
manner and may not be completely separable. Please refer to the following tables and figures:
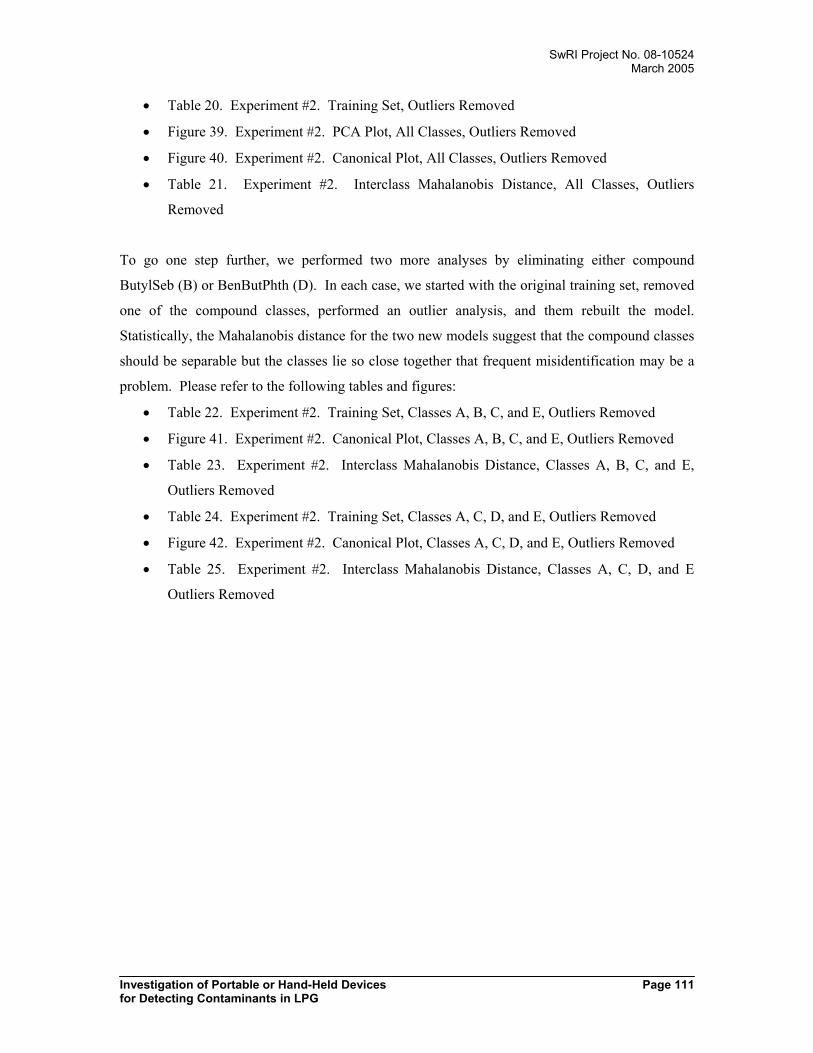
SwRI Project No. 08-10524March 2005
Investigation of Portable or Hand-Held Devices Page 111for Detecting Contaminants in LPG
• Table 20. Experiment #2. Training Set, Outliers Removed
• Figure 39. Experiment #2. PCA Plot, All Classes, Outliers Removed
• Figure 40. Experiment #2. Canonical Plot, All Classes, Outliers Removed
• Table 21. Experiment #2. Interclass Mahalanobis Distance, All Classes, Outliers
Removed
To go one step further, we performed two more analyses by eliminating either compound
ButylSeb (B) or BenButPhth (D). In each case, we started with the original training set, removed
one of the compound classes, performed an outlier analysis, and them rebuilt the model.
Statistically, the Mahalanobis distance for the two new models suggest that the compound classes
should be separable but the classes lie so close together that frequent misidentification may be a
problem. Please refer to the following tables and figures:
• Table 22. Experiment #2. Training Set, Classes A, B, C, and E, Outliers Removed
• Figure 41. Experiment #2. Canonical Plot, Classes A, B, C, and E, Outliers Removed
• Table 23. Experiment #2. Interclass Mahalanobis Distance, Classes A, B, C, and E,
Outliers Removed
• Table 24. Experiment #2. Training Set, Classes A, C, D, and E, Outliers Removed
• Figure 42. Experiment #2. Canonical Plot, Classes A, C, D, and E, Outliers Removed
• Table 25. Experiment #2. Interclass Mahalanobis Distance, Classes A, C, D, and E
Outliers Removed
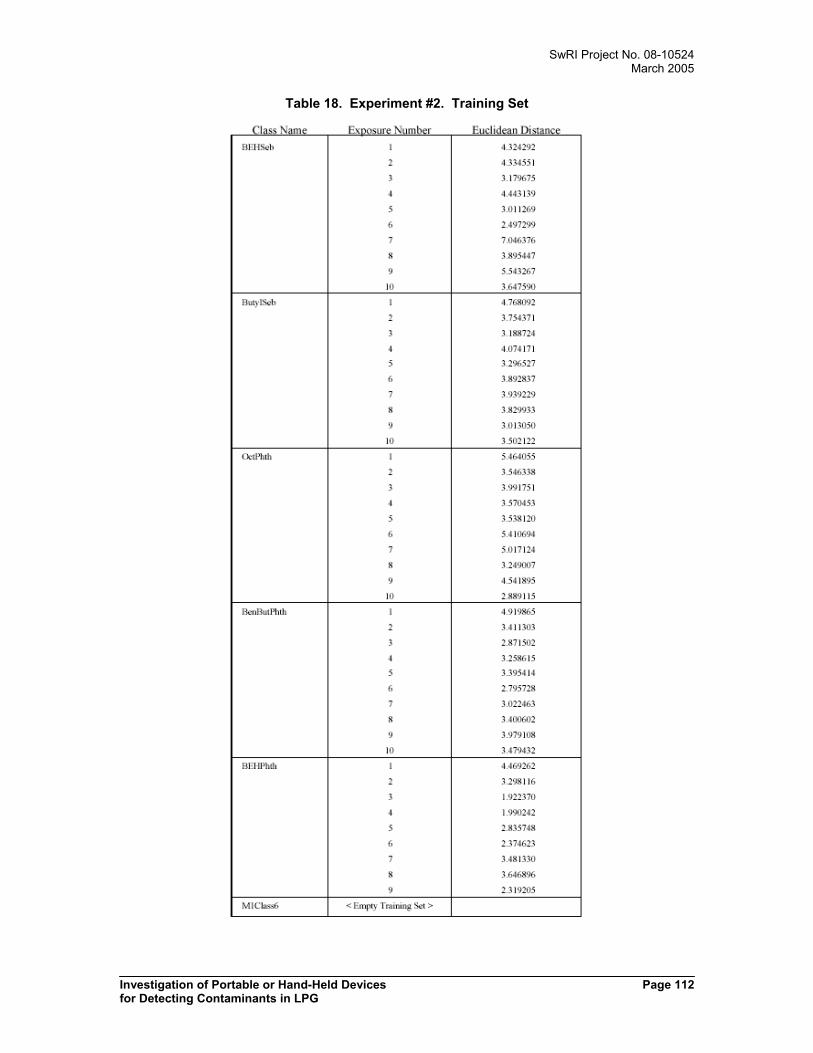
SwRI Project No. 08-10524March 2005
Investigation of Portable or Hand-Held Devices Page 112for Detecting Contaminants in LPG
Table 18. Experiment #2. Training Set

SwRI Project No. 08-10524March 2005
Investigation of Portable or Hand-Held Devices Page 113for Detecting Contaminants in LPG
Figure 37. Experiment #2. PCA Plot, All Classes

SwRI Project No. 08-10524March 2005
Investigation of Portable or Hand-Held Devices Page 114for Detecting Contaminants in LPG
Figure 38. Experiment #2. Canonical Plot, All Classes
Table 19. Experiment #2. Interclass Mahalanobis Distance, All Classes
SwRI Project No. 08-10524March 2005
Investigation of Portable or Hand-Held Devices Page 115for Detecting Contaminants in LPG
Table 20. Experiment #2. Training Set, Outliers Removed
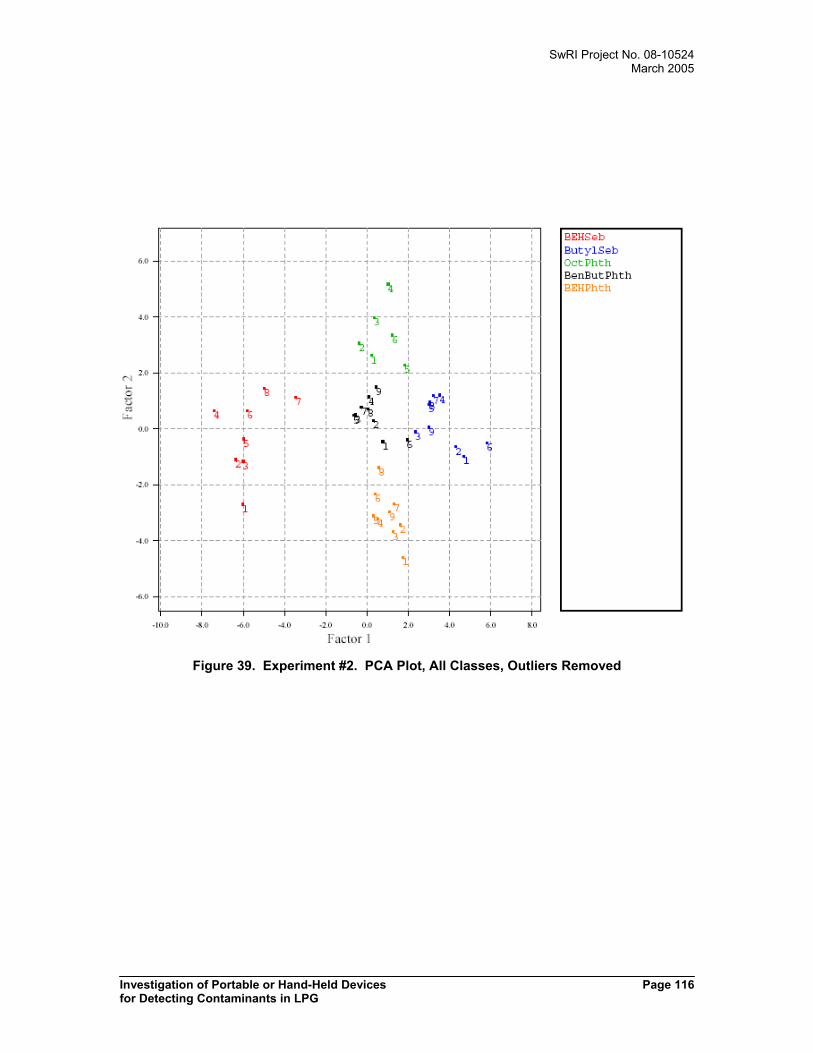
SwRI Project No. 08-10524March 2005
Investigation of Portable or Hand-Held Devices Page 116for Detecting Contaminants in LPG
Figure 39. Experiment #2. PCA Plot, All Classes, Outliers Removed

SwRI Project No. 08-10524March 2005
Investigation of Portable or Hand-Held Devices Page 117for Detecting Contaminants in LPG
Figure 40. Experiment #2. Canonical Plot, All Classes, Outliers Removed
Table 21. Experiment #2. Interclass Mahalanobis Distance, All Classes, Outliers Removed
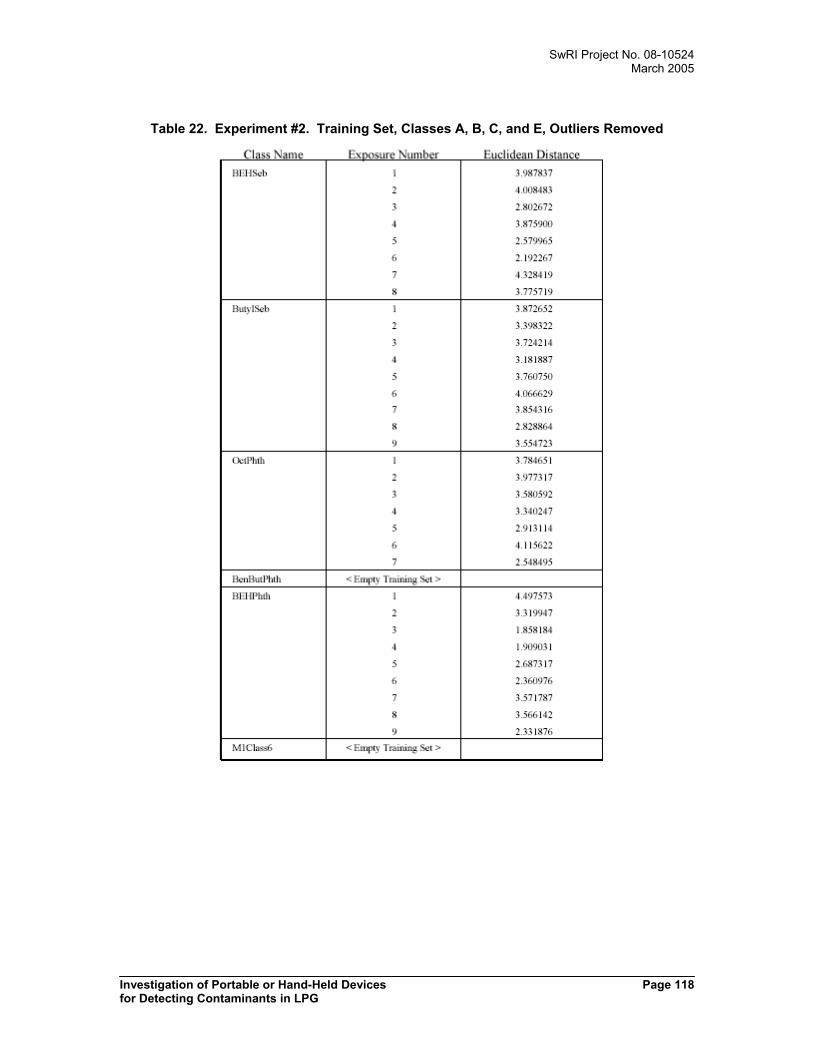
SwRI Project No. 08-10524March 2005
Investigation of Portable or Hand-Held Devices Page 118for Detecting Contaminants in LPG
Table 22. Experiment #2. Training Set, Classes A, B, C, and E, Outliers Removed

SwRI Project No. 08-10524March 2005
Investigation of Portable or Hand-Held Devices Page 119for Detecting Contaminants in LPG
Figure 41. Experiment #2. Canonical Plot, Classes A, B, C, and E, Outliers Removed
Table 23. Experiment #2. Interclass Mahalanobis Distance, Classes A, B, C, and E,Outliers Removed
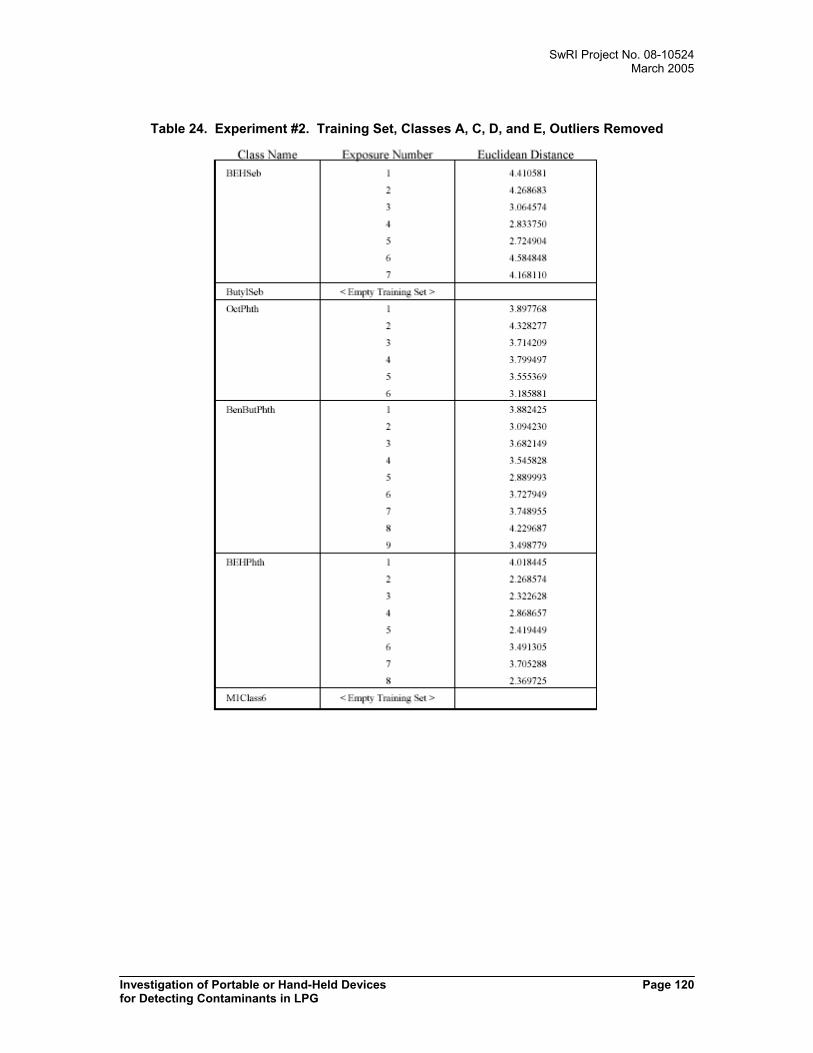
SwRI Project No. 08-10524March 2005
Investigation of Portable or Hand-Held Devices Page 120for Detecting Contaminants in LPG
Table 24. Experiment #2. Training Set, Classes A, C, D, and E, Outliers Removed

SwRI Project No. 08-10524March 2005
Investigation of Portable or Hand-Held Devices Page 121for Detecting Contaminants in LPG
Figure 42. Experiment #2. Canonical Plot, Classes A, C, D, and E, Outliers Removed
Table 25. Experiment #2. Interclass Mahalanobis Distance, Classes A, C, D, and E OutliersRemoved

SwRI Project No. 08-10524March 2005
Investigation of Portable or Hand-Held Devices Page 122for Detecting Contaminants in LPG
15.4 Experiment #3 - Contaminant Comparison
To expand the capability of our model, we added several additional compounds. Specifically,
hexadecane, isooctane, acetone, water, and methanol were added. Each of these compounds are
potential contaminants in LPG. Hexadecane was chosen to represent a “heavy” hydrocarbon and
is the heaviest hydrocarbon that could be worked with practically (heavier hydrocarbons are
solids at ambient temperature). Isooctane is a lighter, branched hydrocarbon. To form the
“plasticizer” class, each of the five plasticizer compounds were utlilized. So the ten plasticizer
samples consisted of compounds A, A, B, C, D, E, A, A, B, C. Finally, the experiment was run in
two parts, six samples one day and four the next.
The instrument settings for this test are shown in Table 26.
Table 26. Experiment #3. Instrument Settings
Parameter Time (sec) Pump SpeedBaseline Purge 40 MediumSample Draw 25 Low1st Sample Gas Purge 0 High1st Air Intake Purge 0 High2nd Sample Gas Purge 90 High2nd Air Intake Purge 90 High
Sensors Removed None
Ten samples of each compound were analyzed, an outlier analysis performed, and a model built.
The PCA and canonical plots gave a clear indication that vapor pressure plays a significant role in
the ability of the instrument to detect certain compounds. Isooctane (K), acetone (L), and
methanol (N) were well separated and these are the most volatile compounds in the training set.
The plasticizer (Pl), hexadecane (I), and water (M) samples were grouped fairly tightly and their
ability to be distinguished is questionable. Please refer to the following tables and figures:
• Table 27. Experiment #3. Training Set
• Figure 43. Experiment #3. PCA Plot, All Classes
• Figure 44. Experiment #3. Canonical Plot, All Classes
• Table 28. Experiment #3. Interclass Mahalanobis Distance, All Classes

SwRI Project No. 08-10524March 2005
Investigation of Portable or Hand-Held Devices Page 123for Detecting Contaminants in LPG
To determine if the plasticizers (Pl), hexadecane (I), and water (M) classes could be better
resolved, a new model consisting of just those classes was built. With outliers removed, the
model indicates that these classes could be sufficiently separated to create a robust model. Please
refer to the following tables and figures:
• Table 29. Experiment #3. Training Set (Plasticizers, Hexadecane, Water), Outliers
Removed.
• Figure 45. Experiment #3. PCA Plot (Plasticizers, Hexadecane, Water), Outliers
Removed
• Figure 46. Experiment #3. Canonical Plot (Plasticizers, Hexadecane, Water), Outliers
Removed
From the plots, the only apparent manifestation resulting from the samples being run over two
days is a small clustering in the water samples (Figure 45). Since this is not evident in the other
compound classes, it is probable that this clustering is a result of ambient humidity differences
from one day to the next. Although the instrument purge uses a drying tube to dry the purge air,
the instrument is very sensitive and may be responsive to very small changes in ambient
humidity.
This experiment also provides a good example of an approach known as tiered-modeling. This
technique relies on a series of models each with finer grain than the last. For example, given an
unknown sample, its smellprint is first classified according to a high level model. This model
may consist of many classes that overlap or whose classes consist of several types of compounds
that have been joined to create a “superclass,” like our plasticizer class in this experiment. Once
the smellprint is associated with a certain group of classes it is then subjected to a lower level
model consisting of just those classes. The smellprint is continually reclassified until at some
point the sample can be identified as belonging to a single class. In this experiment, a sample
classified as a plasticizer, hexadecane, or water sample in our first model might be a further
verified by applying the second model containing just those classes. If that classification were to
identify the sample as a plasticizer then a model from our previous experiment might be used to
determine which specific plasticizer it is. Overall, the tiered modeling approach allows
continuous refinement of the sample classification until the sample is uniqieuly identified.

SwRI Project No. 08-10524March 2005
Investigation of Portable or Hand-Held Devices Page 124for Detecting Contaminants in LPG
Table 27. Experiment #3. Training Set

SwRI Project No. 08-10524March 2005
Investigation of Portable or Hand-Held Devices Page 125for Detecting Contaminants in LPG
Figure 43. Experiment #3. PCA Plot, All Classes

SwRI Project No. 08-10524March 2005
Investigation of Portable or Hand-Held Devices Page 126for Detecting Contaminants in LPG
Figure 44. Experiment #3. Canonical Plot, All Classes
Table 28. Experiment #3. Interclass Mahalanobis Distance, All Classes
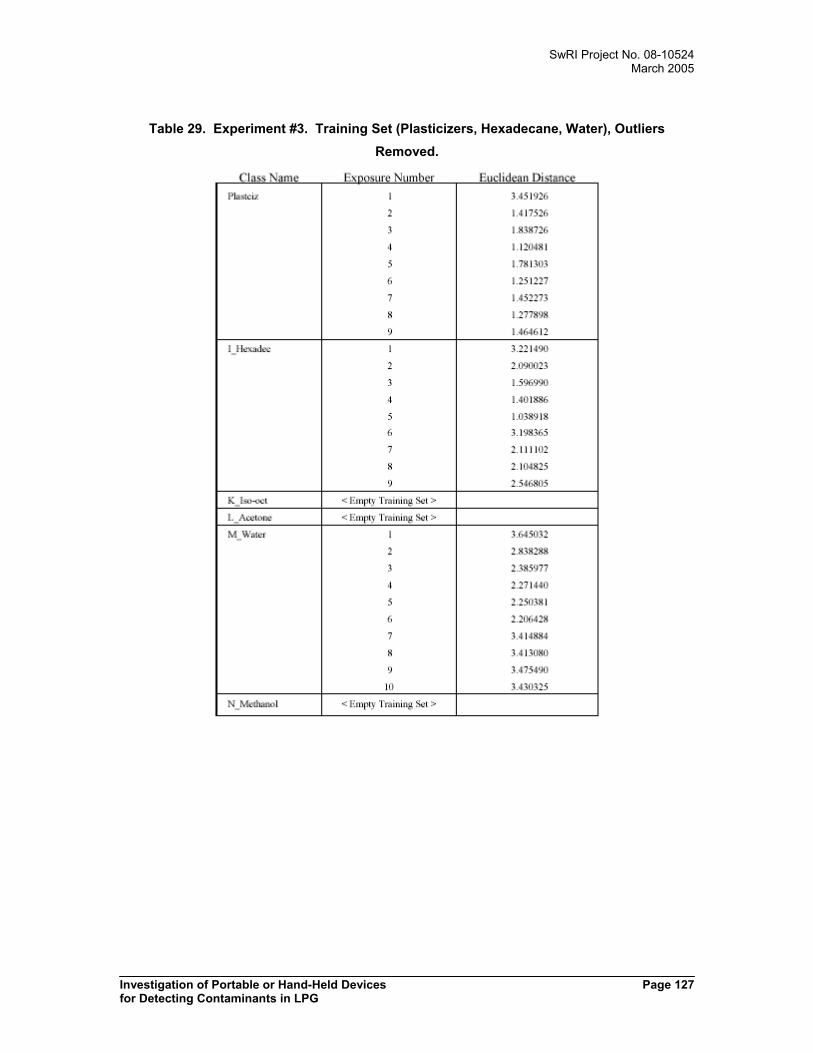
SwRI Project No. 08-10524March 2005
Investigation of Portable or Hand-Held Devices Page 127for Detecting Contaminants in LPG
Table 29. Experiment #3. Training Set (Plasticizers, Hexadecane, Water), OutliersRemoved.
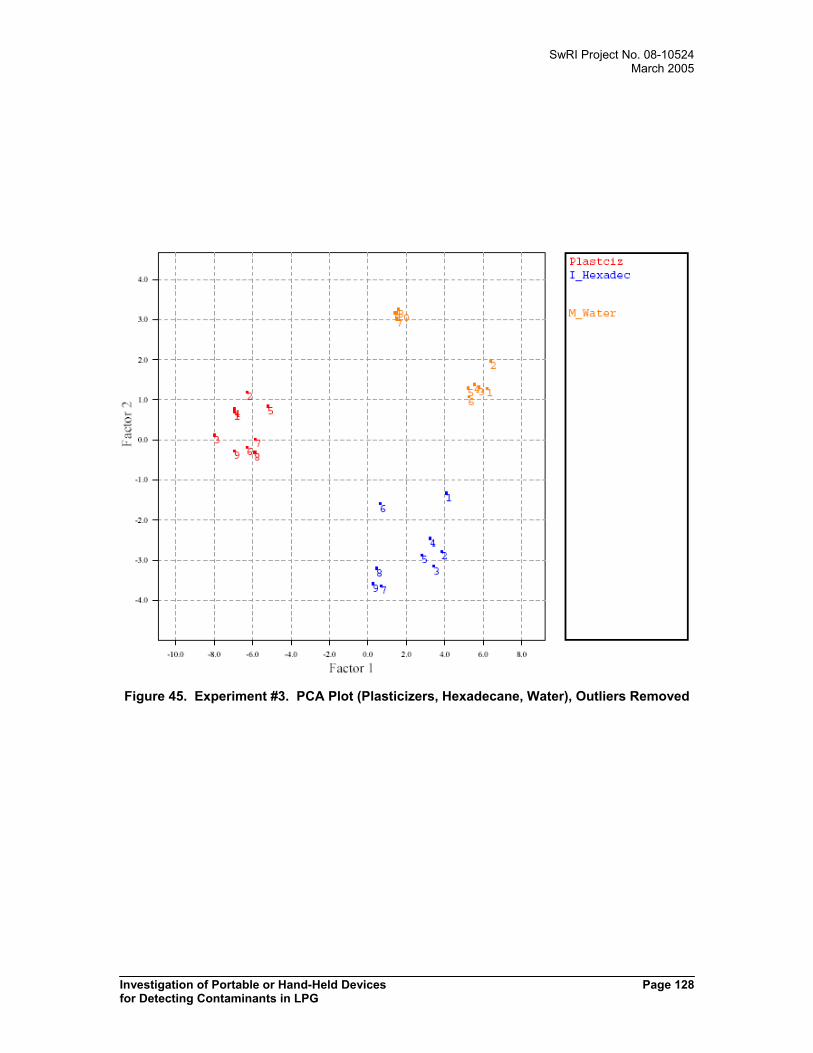
SwRI Project No. 08-10524March 2005
Investigation of Portable or Hand-Held Devices Page 128for Detecting Contaminants in LPG
Figure 45. Experiment #3. PCA Plot (Plasticizers, Hexadecane, Water), Outliers Removed
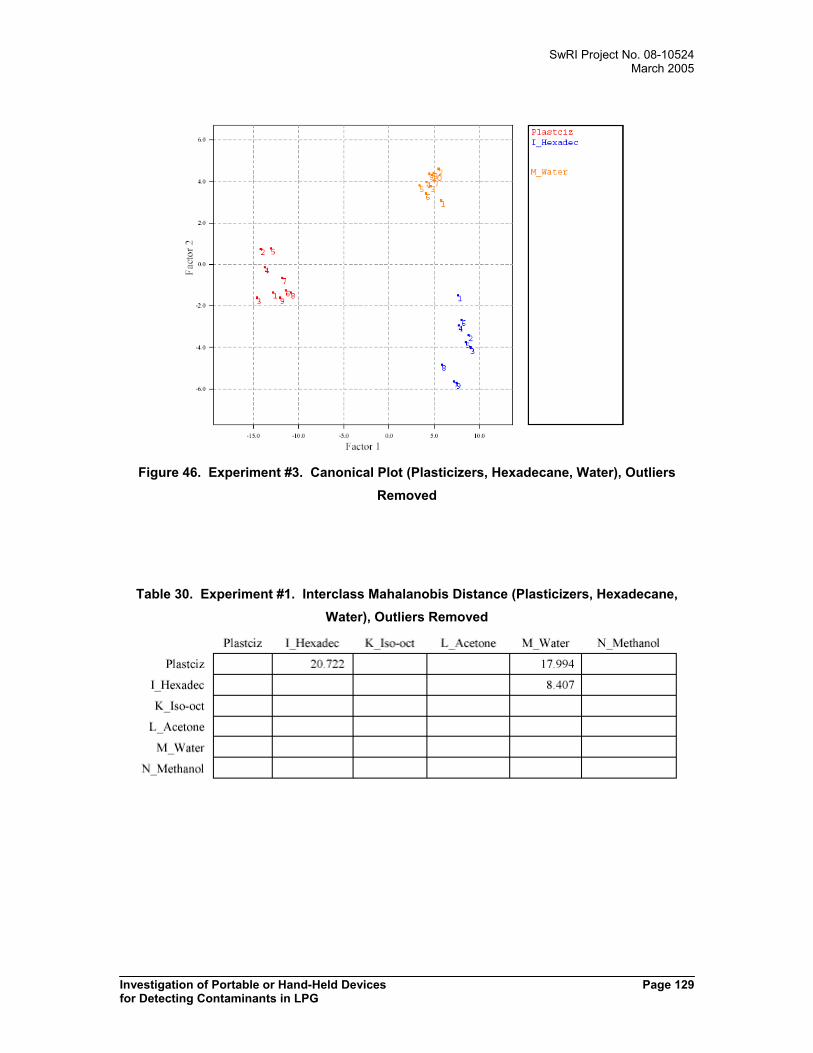
SwRI Project No. 08-10524March 2005
Investigation of Portable or Hand-Held Devices Page 129for Detecting Contaminants in LPG
Figure 46. Experiment #3. Canonical Plot (Plasticizers, Hexadecane, Water), OutliersRemoved
Table 30. Experiment #1. Interclass Mahalanobis Distance (Plasticizers, Hexadecane,Water), Outliers Removed

SwRI Project No. 08-10524March 2005
Investigation of Portable or Hand-Held Devices Page 130for Detecting Contaminants in LPG
15.5 Experiment #4 - HC Solutions
Our next series of tests were aimed at determining whether a single, low concentration
contaminant could be detected in a hydrocarbon matrix. We chose isooctane as the hydrocarbon
because it is relatively volatile and would generate a headspace easily but not so volatile that
evaporation would cause the sample composition to change. These tests were conceived of to
mimic what we will see in LPG but are easier to work with at ambient temperature and pressure.
The compounds chosen for this study were BEHSeb (A), BEHPhth (E), and methanol (N). Six
vials of each solution (0.5% in isooctane) were prepared as described above and the smellprints
were collected in the same manner as previous experiments. The solutions are identified in the
tables and plots as isooctane (Iso), BEHSeb (IsoA), BEHPhth (IsoE), and methanol (IsoN).
The instrument settings for this test are shown in Table 31.
Table 31. Experiment #4. Instrument Settings
Parameter Time (sec) Pump SpeedBaseline Purge 30 MediumSample Draw 25 Low1st Sample Gas Purge 0 High1st Air Intake Purge 0 High2nd Sample Gas Purge 90 High2nd Air Intake Purge 90 High
Sensors Removed None
The results from these tests were generally poor and reinforced the fact that compound volatility
is a critical factor in determining whether a compound will be detected or not. Only methanol
(N), the most volatile compound used in these tests was differentiated by the instrument. This
happened because the headspace for that sample was enriched with methanol due to its volatility.
In the other samples, the plasticizers have so little volatility that they remain in the liquid phase.
The vapor phase of the plasticizer samples could not be distinguished from the reference
isooctane (Iso) sample. No additional analysis was performed on these samples. Please refer to
the following tables and figures:
• Table 32. Experiment #4. Training Set
• Figure 47. Experiment #4. PCA Plot, All Classes
• Figure 48. Experiment #4. Canonical Plot, All Classes
• Table 33. Experiment #4. Interclass Mahalanobis Distance, All Classes

SwRI Project No. 08-10524March 2005
Investigation of Portable or Hand-Held Devices Page 131for Detecting Contaminants in LPG
Table 32. Experiment #4. Training Set

SwRI Project No. 08-10524March 2005
Investigation of Portable or Hand-Held Devices Page 132for Detecting Contaminants in LPG
Figure 47. Experiment #4. PCA Plot, All Classes

SwRI Project No. 08-10524March 2005
Investigation of Portable or Hand-Held Devices Page 133for Detecting Contaminants in LPG
Figure 48. Experiment #4. Canonical Plot, All Classes
Table 33. Experiment #4. Interclass Mahalanobis Distance, All Classes

SwRI Project No. 08-10524March 2005
Investigation of Portable or Hand-Held Devices Page 134for Detecting Contaminants in LPG
15.6 Experiment #5 - HC Solutions with Dry Air Bubbler
After the failure of the previous experiment to detect the plasticizers in the isooctane solutions,
we opted to repeat the experiment using an air bubbler to help enrich the headspace gases and
allow longer sample draw times.
The instrument settings for this test are shown in Table 34.
Table 34. Experiment #5. Instrument Settings
Parameter Time (sec) Pump SpeedBaseline Purge 30 MediumSample Draw 60 Medium1st Sample Gas Purge 0 High1st Air Intake Purge 0 High2nd Sample Gas Purge 70 High2nd Air Intake Purge 70 High
Sensors Removed None
The results of these tests were essentially identical to the previous ones. Although the bubbler
appeared to have some effect (the spread of the samples increased), the plasticizer (IsoA and
IsoE) samples are still indistinguishable from the isooctane (Iso) reference. No further analysis
was performed on these samples. Please refer to the following tables and figures:
• Table 35. Experiment #5. Training Set
• Figure 49. Experiment #5. PCA Plot, All Classes
• Figure 50. Experiment #5. Canonical Plot, All Classes
• Table 36. Experiment #5. Interclass Mahalanobis Distance, All Classes

SwRI Project No. 08-10524March 2005
Investigation of Portable or Hand-Held Devices Page 135for Detecting Contaminants in LPG
Table 35. Experiment #5. Training Set

SwRI Project No. 08-10524March 2005
Investigation of Portable or Hand-Held Devices Page 136for Detecting Contaminants in LPG
Figure 49. Experiment #5. PCA Plot, All Classes

SwRI Project No. 08-10524March 2005
Investigation of Portable or Hand-Held Devices Page 137for Detecting Contaminants in LPG
Figure 50. Experiment #5. Canonical Plot, All Classes
Table 36. Experiment #5. Interclass Mahalanobis Distance, All Classes
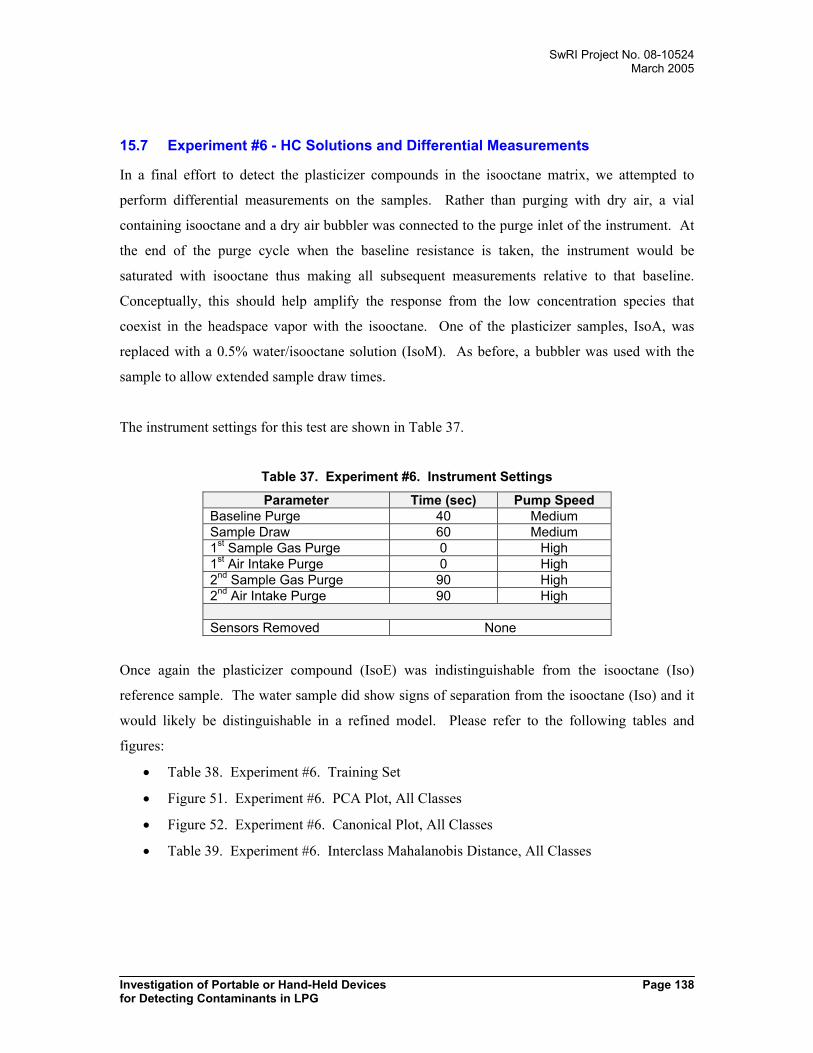
SwRI Project No. 08-10524March 2005
Investigation of Portable or Hand-Held Devices Page 138for Detecting Contaminants in LPG
15.7 Experiment #6 - HC Solutions and Differential Measurements
In a final effort to detect the plasticizer compounds in the isooctane matrix, we attempted to
perform differential measurements on the samples. Rather than purging with dry air, a vial
containing isooctane and a dry air bubbler was connected to the purge inlet of the instrument. At
the end of the purge cycle when the baseline resistance is taken, the instrument would be
saturated with isooctane thus making all subsequent measurements relative to that baseline.
Conceptually, this should help amplify the response from the low concentration species that
coexist in the headspace vapor with the isooctane. One of the plasticizer samples, IsoA, was
replaced with a 0.5% water/isooctane solution (IsoM). As before, a bubbler was used with the
sample to allow extended sample draw times.
The instrument settings for this test are shown in Table 37.
Table 37. Experiment #6. Instrument Settings
Parameter Time (sec) Pump SpeedBaseline Purge 40 MediumSample Draw 60 Medium1st Sample Gas Purge 0 High1st Air Intake Purge 0 High2nd Sample Gas Purge 90 High2nd Air Intake Purge 90 High
Sensors Removed None
Once again the plasticizer compound (IsoE) was indistinguishable from the isooctane (Iso)
reference sample. The water sample did show signs of separation from the isooctane (Iso) and it
would likely be distinguishable in a refined model. Please refer to the following tables and
figures:
• Table 38. Experiment #6. Training Set
• Figure 51. Experiment #6. PCA Plot, All Classes
• Figure 52. Experiment #6. Canonical Plot, All Classes
• Table 39. Experiment #6. Interclass Mahalanobis Distance, All Classes

SwRI Project No. 08-10524March 2005
Investigation of Portable or Hand-Held Devices Page 139for Detecting Contaminants in LPG
Table 38. Experiment #6. Training Set

SwRI Project No. 08-10524March 2005
Investigation of Portable or Hand-Held Devices Page 140for Detecting Contaminants in LPG
Figure 51. Experiment #6. PCA Plot, All Classes

SwRI Project No. 08-10524March 2005
Investigation of Portable or Hand-Held Devices Page 141for Detecting Contaminants in LPG
Figure 52. Experiment #6. Canonical Plot, All Classes
Table 39. Experiment #6. Interclass Mahalanobis Distance, All Classes

SwRI Project No. 08-10524March 2005
Investigation of Portable or Hand-Held Devices Page 142for Detecting Contaminants in LPG
15.8 Experiment #7 - Propane Trials
Having met with some failure in detecting low concentration, low volatility compounds in a
hydrocarbon matrix, we shifted our focus for the propane samples to something more suited to the
instruments purpose. One possible application for this instrument with respect to LPG is in
determination of gross contamination or changes in composition. To test this concept and work
the bugs out of our apparatus, we began by doing a simple comparison between two distinctly
different products: pure research grade propane and Coleman propane. Although we were unable
to verify the exact composition of the Coleman propane, we know its composition is uniquely
different because of the obvious presence of the odorant.
The instrument settings for this test are shown in Table 40.
Table 40. Experiment #7. Instrument Settings
Parameter Time (sec) Pump SpeedBaseline Purge 30 MediumSample Draw 25 Low1st Sample Gas Purge 0 High1st Air Intake Purge 5 High2nd Sample Gas Purge 40 High2nd Air Intake Purge 40 High
Sensors Removed None
Besides the obvious fact that the instrument was able to distinguish the two samples, an important
observation was that the samples appeared to vary in a systematic way. We determined that this
resulted from the cooling of the gas cylinders during the test. This reduced the pressure and
therefore concentration of the gas from the cylinder. Please refer to the following tables and
figures:
• Table 41. Experiment #7. Training Set
• Figure 53. Experiment #7. PCA Plot, All Classes
• Figure 54. Experiment #7. Canonical Plot, All Classes
• Table 42. Experiment #7. Interclass Mahalanobis Distance, All Classes
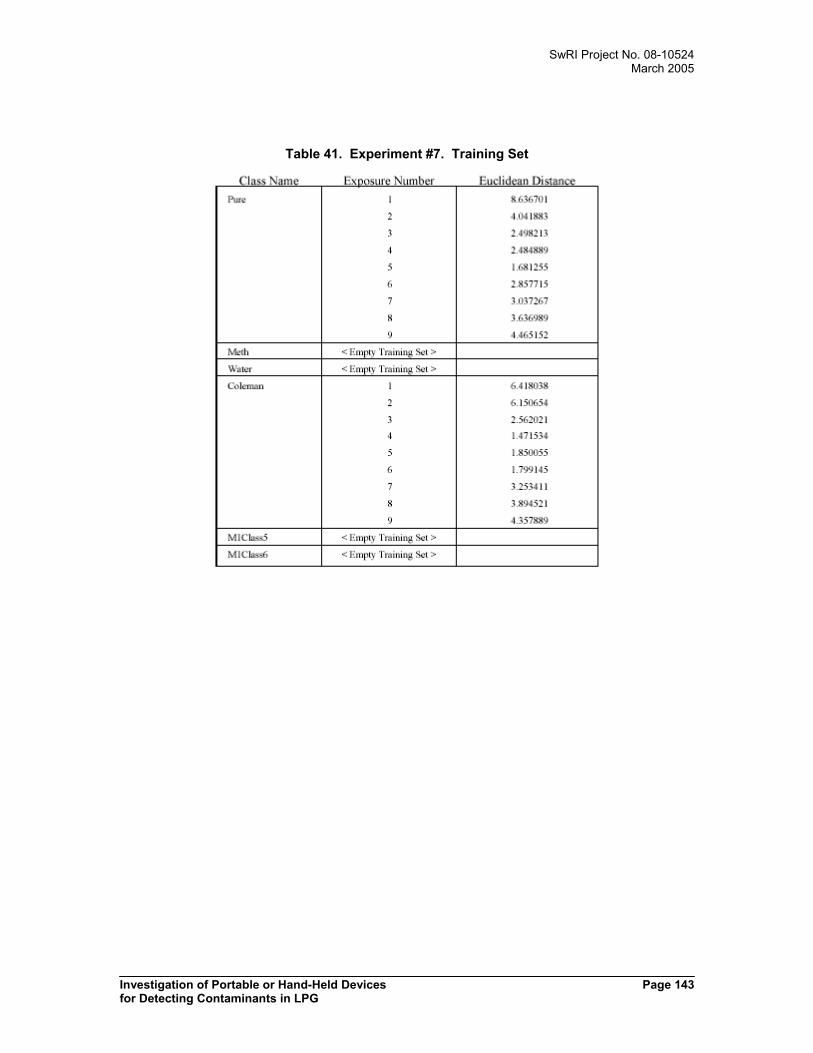
SwRI Project No. 08-10524March 2005
Investigation of Portable or Hand-Held Devices Page 143for Detecting Contaminants in LPG
Table 41. Experiment #7. Training Set

SwRI Project No. 08-10524March 2005
Investigation of Portable or Hand-Held Devices Page 144for Detecting Contaminants in LPG
Figure 53. Experiment #7. PCA Plot, All Classes

SwRI Project No. 08-10524March 2005
Investigation of Portable or Hand-Held Devices Page 145for Detecting Contaminants in LPG
Figure 54. Experiment #7. Canonical Plot, All Classes
Table 42. Experiment #7. Interclass Mahalanobis Distance, All Classes
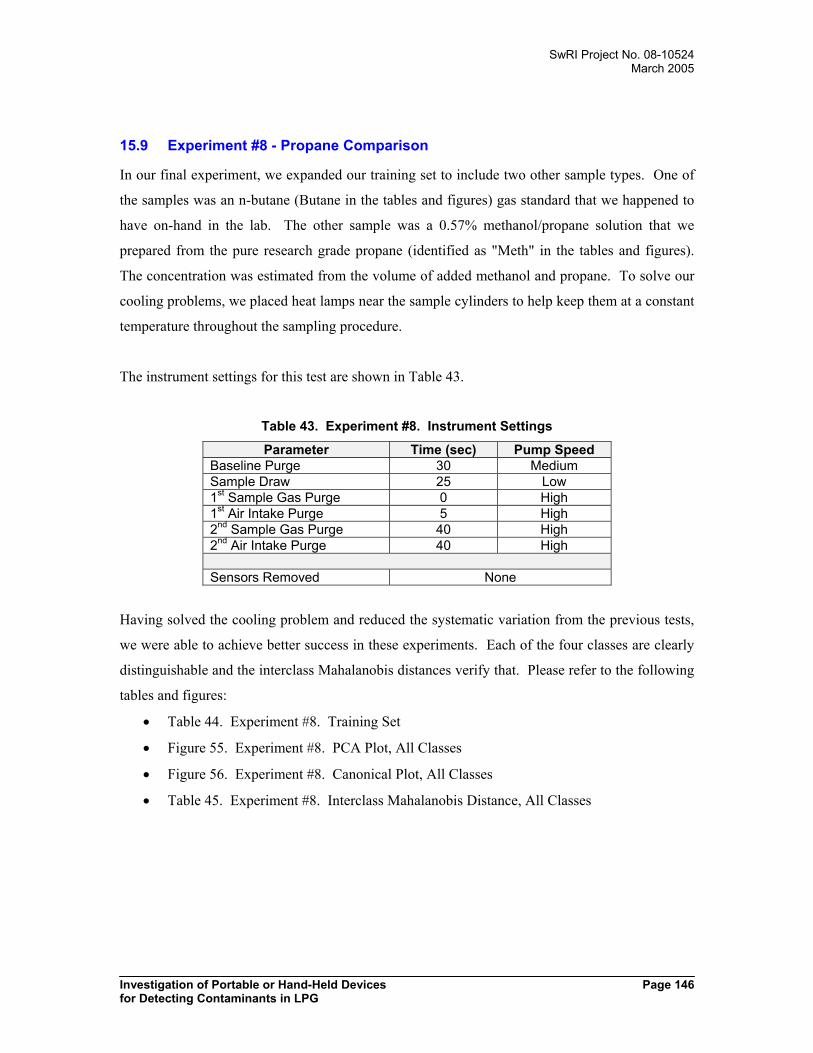
SwRI Project No. 08-10524March 2005
Investigation of Portable or Hand-Held Devices Page 146for Detecting Contaminants in LPG
15.9 Experiment #8 - Propane Comparison
In our final experiment, we expanded our training set to include two other sample types. One of
the samples was an n-butane (Butane in the tables and figures) gas standard that we happened to
have on-hand in the lab. The other sample was a 0.57% methanol/propane solution that we
prepared from the pure research grade propane (identified as "Meth" in the tables and figures).
The concentration was estimated from the volume of added methanol and propane. To solve our
cooling problems, we placed heat lamps near the sample cylinders to help keep them at a constant
temperature throughout the sampling procedure.
The instrument settings for this test are shown in Table 43.
Table 43. Experiment #8. Instrument Settings
Parameter Time (sec) Pump SpeedBaseline Purge 30 MediumSample Draw 25 Low1st Sample Gas Purge 0 High1st Air Intake Purge 5 High2nd Sample Gas Purge 40 High2nd Air Intake Purge 40 High
Sensors Removed None
Having solved the cooling problem and reduced the systematic variation from the previous tests,
we were able to achieve better success in these experiments. Each of the four classes are clearly
distinguishable and the interclass Mahalanobis distances verify that. Please refer to the following
tables and figures:
• Table 44. Experiment #8. Training Set
• Figure 55. Experiment #8. PCA Plot, All Classes
• Figure 56. Experiment #8. Canonical Plot, All Classes
• Table 45. Experiment #8. Interclass Mahalanobis Distance, All Classes

SwRI Project No. 08-10524March 2005
Investigation of Portable or Hand-Held Devices Page 147for Detecting Contaminants in LPG
Table 44. Experiment #8. Training Set

SwRI Project No. 08-10524March 2005
Investigation of Portable or Hand-Held Devices Page 148for Detecting Contaminants in LPG
Figure 55. Experiment #8. PCA Plot, All Classes

SwRI Project No. 08-10524March 2005
Investigation of Portable or Hand-Held Devices Page 149for Detecting Contaminants in LPG
Figure 56. Experiment #8. Canonical Plot, All Classes
Table 45. Experiment #8. Interclass Mahalanobis Distance, All Classes
SwRI Project No. 08-10524March 2005
Investigation of Portable or Hand-Held Devices Page 150for Detecting Contaminants in LPG
16.0 REFERENCES
Manuals
"The Cyranose 320 Electronic Nose," User's Manual. 4th Ed., rev D., 2001.
"The Practical Guide to the Cyranose 320," rev C, 2001.
LPG Contaminants
• GPA 2140-97, Liquefied Petroleum Gas Specifications and Test Methods.
• ASTM D1835, Standard Specification For Liquefied Petroleum Gases.
• Propane Education and Research Council (PERC) (www.propanecouncil.org).
• Monthly Progress Report No. 7, “Investigation of LPG Fuel System Technologies and
Fuel Composition Effects on Emissions,” PERC No. 10951, SwRI Project 03-07065,
March 2004.
Filtration
• "Activated Alumina & Molecular Sieves." Axens. www.axens.net.
• "Purifiers." Advanced Specialty Gas Equipment. www.asge-online.com.
• "Siliporite." Atofina. www.atofina.com.au.
• Mieville, R. L. and Robinson, K. K. "Carbon Molecular Sieves and Other Porous
Carbons," Mega-Carbon Company, Synthesis and Applications.
Sampling
• "Gas/LPG Samplers." Sentry Equipment Corporation. www.sentry-equip.com.
• ASTM D1265, Standard Practice for Sampling Liquefied Petroleum (LP) Gases (Manual
Method).
• ASTM D3700, Standard Practice for Obtaining LPG Samples Using a Floating Piston
Cylinder.
• GPA 2140-97, Liquefied Petroleum Gas Specifications and Test Methods.
• Wilkins, C. M. "Accurate LPG analysis begins with sampling procedures, equipment,"
Oil and Gas Journal, 1990, 33-36.

SwRI Project No. 08-10524March 2005
Investigation of Portable or Hand-Held Devices Page 151for Detecting Contaminants in LPG
Gas Monitoring (electrochemical, catalytic, MOS, and ionization)
• "Gas Sensor Technology." Sierra Monitor Corporation. www.sierramonitor.com.
• "On chemical gas sensors." AppliedSensor. www.appliedsensor.com.
• "Portable Instrument Selection Guide." Mine Safety Appliances, Co. www.msanet.com.
• "Sensor Technologies/Field Service Life." Enmet Corporation. www.enmet.com.
• "Sensor Technology." Delphian Corporation. www.delphian.com.
• Application and Technical notes. RAE Systems. www.raesystems.com.
• Application Notes. Custom Sensor Solutions, Inc. www.customsensorsolutions.com/
apnotes.htm.
Chemical Arrays
• Doleman, B. J., Lonergan, M. C., Selevin, E. J., Vais, T. P., and Lewis, N. S.
“Quantitative Study of the Resolving Power of Arrays of Carbon Black – Polymer
Composites in Various Vapor-Sensing Tasks,” Anal. Chem., 70, 1998, 4177.
• Gardner, J. W. and Bartlett P. N. Electronic Noses: Principles and Applications, 1999.
• Van Deventer, D. “Discrimination of Retained Solvent Levels in Printed Food Packaging
Using Electronic Nose Systems,” MS Thesis, Virginia Polytechnic Institute and State
University.
Spectroscopy
• Application and Technical notes. RAE Systems. www.raesystems.com.
• Chavez-Pirson, A. "The Basics of Fiber Bragg Gratings," Sensors Magazine, 2004.
• Claps, R., Englich, F. V., Leleux, D. P., Richter, D., Tittel, F. K., and Curl, R. F.
“Ammonia detection by use of near-infrared diode-laser-based overtone spectroscopy,”
Appl. Opt., Vol 40, No. 24, 2001.
• Feher, M, Martin, P. A., Rohrbacher, A., Soliva, A. M., and Maier, J. P. “Inexpensive
near-infrared diode-laser-based detection system for ammonia,” Appl. Opt., Vol 32, No.
12, 1993.
• Feher, M. and Martin, P. A. “Tunable diode laser monitoring of atmospheric trace gas
constituents,” Spectrochim. Acta Part A 51 (1995) 1579.
• Frish, M. B., White, M. A., and Allen, M. G. “Handheld laser-based sensor for remote
detection of toxic and hazardous gases,” SPI Paper No. 4199-05, 2000.

SwRI Project No. 08-10524March 2005
Investigation of Portable or Hand-Held Devices Page 152for Detecting Contaminants in LPG
• Hecht, J. "Ever Vigilant, optical sensors already monitor much of our daily lives," Laser
Focus World, 2004.
• Kinkade, Brian. "Bringing Nondispersive IR Spectroscopic Gas Sensors to the Mass
Market". Sensors Magazine, August 2000.
• Linnerud, I., Kaspersen, P., and Jaeger, T. “Gas Monitoring in the process industry using
diode laser spectroscopy,” Appl. Phys. B, Vol 67, 297, 1998.
• Nikkari, J. J., Di lorio, J. M., and Thomson, M. J. “In situ combustion measurements of
CO, H2O, and temperature with a 1.58µm diode laser and two-tone frequency
modulation,” Appl. Opt., Vol 41, No. 3, 2002.
• Rest, A. J., Warren, R., and Murray, S. C. “Near-Infrared Study of the Light Liquid
Alkanes,” Appl. Spectrosc. 50 (4), 517 (1996).
• Silverstein, R. M., Bassler, G. C., and Morrill, T. C. Spectrometric Identification of
Organic Compounds, 5th edition, 1991.
• Skoog, D. A. and Leary, J. J. Principles of Instrumental Analysis, 4th edition, 1992
• Stepanov, E. V., Zyrianov, P. V., Khusnutdinov, A. N., Kouznetsov, A. I., and
Ponuroskii, Y. Y. “Multicomponent gas analyzer based on tunable diode lasers,” Proc.
SPIE, Vol 2835, 271.
• Werle, P. “A review of recent advances in semiconductor laser based gas monitors,”
Spectrochim. Acta Part A 54 (1998) 197.
Dielectrics
• Johnson, J. E., Magott, R. J., and Wood, C. M. "Development of a Prototype Energy
Meter," Gas Research Institute, 1984.
Gas Chromatography
• Skoog, D. A. and Leary, J. J. Principles of Instrumental Analysis, 4th edition, 1992
Gas Detection Tubes
• "Sensidyne Gas Detector Tube Handbook." Sensidyne, Inc. www.sensidyne.com.
• Product Guide Line. GASTEC Corporation. www.gastec.co.jp.
Coriolis Effect
• Mass Flow Products. Actaris Neptune. www.neptuneflowmeter.com.
SwRI Project No. 08-10524March 2005
Investigation of Portable or Hand-Held Devices Page 153for Detecting Contaminants in LPG
• Reizner, J. R. "Exposing Coriolis Mass Flowmeter's 'Dirty Little Secret'," CEP
Magazine, 2004.
• The Technology. Rheonik. www.rheonik.com.
Tank Gauging Systems
• Level Measurement and Control. Solartron Mobrey. www.solartronmobrey.com.
• Meyer, J. "Sonic Liquid Level Gauge Development & Demonstration Project," The
ADEPT Group, PERC Docket No. 10314.
• Radar Technology. Saab Rosemount. www.saabradar.com.
• Ultrasonic Distance and Level Measures. SSI Technologies. www.ssitechnologies.com.
• Vass, Gabor. "The Principles of Level Measurement". Sensors Magazine, October 2000.
Field Effect Sensors
• Field Effect Technology Description. Material Sciences Corporation. www.msc-
emd.com.
Particle Counting
• Technical Papers, Application Notes, Articles. Pacific Scientific Instruments.
www.particle.com.