investigation of techniques for energy-efficient new …€¦ · · 2017-10-094 may 2013 3.958.1...
TRANSCRIPT

Investigation of techniques for
energy-efficient new-build
data centres
Report Delft, May 2013
Author(s): CE Delft: Ab de Buck
Maarten Afman
Marit van Lieshout
Mansystems: Dirk Harryvan

2 May 2013 3.958.1 - Investigation of techniques for energy-efficient new-build data centres
Publication Data
Bibliographical data:
CE Delft: Ab de Buck, Maarten Afman, Marit van Lieshout
Mansystems: Dirk Harryvan
Investigation of techniques for energy-efficient new-build data centres
Delft, CE Delft, May 2013
Publication code: 13.3958.37
CE publications are available from www.cedelft.eu
Commissioned by: NL Agency (Agentschap NL).
Further information on this study can be obtained from the contact person, Ab de Buck.
© copyright, CE Delft, Delft
CE Delft
Committed to the Environment
CE Delft is an independent research and consultancy organisation specialised in
developing structural and innovative solutions to environmental problems.
CE Delft’s solutions are characterised in being politically feasible, technologically
sound, economically prudent and socially equitable.
3 May 2013 3.958.1 - Investigation of techniques for energy-efficient new-build data centres
Contents
Preface 5
Summary 7
1 Introduction 11 1.1 Background and objective 11 1.2 Objective 11 1.3 Scope 12 1.4 Definition of energy efficiency: 13 1.5 Structure of the report 13
2 Results of desk study 15 2.1 Introduction 15 2.2 Brief outline of documents 16 2.3 Temperature and humidity regulation within data centres 23 2.4 Efficient air transport 25 2.5 Efficient discharge of heat 27 2.6 Energy efficiency in electricity supply (UPS) 30 2.7 Energy efficiency in humidification 32 2.8 Limitation of heat-influx from outside 33
3 Variants for energy-efficient cooling 35 3.1 Variants considered 35 3.2 References 40
4 Model analysis of cooling variants 43 4.1 Introduction 43 4.2 Approach 43 4.3 Insights from suppliers and data centre operators 45 4.4 Calculation model of techniques 45 4.5 Results of model calculations 50
5 Evaluation of energy-efficient cooling techniques 57 5.1 General principles 57 5.2 Operation within ASHRAE-recommended temperature range 58 5.3 Free cooling 59 5.4 Efficient air transport within the data centre 62
6 Evaluation of other aspects of energy-efficient operation 63 6.1 Electricity supply (UPS) 63 6.2 Humidity control 65 6.3 Limitation of heat-influx 66 6.4 Other energy use: lighting, offices, etc. 69

4 May 2013 3.958.1 - Investigation of techniques for energy-efficient new-build data centres
7 Conclusions 71
References 77
Annex A Steering group and consultancy group 83
Annex B Questionnaire for suppliers of energy-efficient techniques 85
Annex C Questionnaire validation of investments and energy efficiency 87
Annex D Key results for Dutch guideline for local governments (in Dutch) 89
5 May 2013 3.958.1 - Investigation of techniques for energy-efficient new-build data centres
Preface
Data centres are a fast growing and increasingly important sector of the Dutch
economy. Parallel with the economic importance, also the energy use of the
sector is growing fast, and the sector contributes substantially to the Dutch
total consumption of electricity.
In recent years diverse technical options have been developed, that provide
opportunities for large increases in the energy efficiency. Within the
framework of environmental permits local authorities ask data centres to
implement such measures. In this context there is a need for an objective
overview of options that limit energy use, and that are economically and
technically feasible. The purpose of this report to provide such an overview for
new-build data centres.
In preparing this study, a range of suppliers of energy-efficient techniques was
willing to share detailed information on the performance of energy-efficient
techniques. Also diverse operators of data centres were willing to compare
modelled results with their experiences. It is only due to this cooperation that
we have been able to prepare this report. Especially, we would like to thank
the following companies: APC, Atos, Boersema Installatie Adviseurs,
DataCenter Infra Solutions, Equinix, Holland Ventilatie Groep, Jaeggi, Kyoto
Cooling, Nebiprofa, Optigroen, Piller, RecAir, Recool, Rotterdam Internet
Exchange, Stulz, TCN Data Hotels, Tenzon, The Datacenter Group and Ziggo.
Also the consultancies EnergyGo and KWA delivered valuable data. In addition
we would like to thank the members of the Expert Advisory Group for their
open and constructive contributions. Last but not least, the steering group,
guided by NL Agency’s Frank Hartkamp, has helped the project team with
valuable discussions and made contacts within a broad network possible.
We hope this report can serve as a means for both data centres and
government authorities in assessing effective and feasible options for a new
generation of energy-efficient data centres.
CE Delft
Mansystems

6 May 2013 3.958.1 - Investigation of techniques for energy-efficient new-build data centres

7 May 2013 3.958.1 - Investigation of techniques for energy-efficient new-build data centres
Summary
In today’s society, immense volumes of electronic data need to be stored and
the data centre industry that has emerged to cater for this need consumes
a vast amount of energy: at present 1.6 TWh. A substantial fraction of this
energy is used for cooling applications (typically 23%) and for the supply of
electricity (typically 7%). The use for other equipment such as offices and
lighting is generally small (typically < 1%).
This report assesses the potential impacts of (combinations of) various
measures to improve energy efficiency in this sector. In recent years a range
of energy-efficient technologies have been developed for both cooling and
power supply and this study evaluates combinations of these for three typical
data centres: small (0.25 MW), medium (3 MW) and large (8 MW). The research
is based on an extensive literature study, interviews with suppliers, model
calculations and validation among data centre operators.
Combinations of techniques (variants) Based on the literature research, five combinations of energy-efficient cooling
techniques were distinguished (Table 1). In general, these techniques are
based on maximum utilization of the cold available in the outside air, thus to
avoid the use of electricity for compression cooling. The variants are based on
the energy-efficient techniques currently available from suppliers and have all
been implemented in recently built centres. They comprise such techniques as
air filters, fans, dry coolers, wet coolers, hybrid coolers, heat exchangers and
cooling units.
Table 1 Variants for energy-efficient new-build data centres
General concept Variant
1 Open cooling systems 1a Supported by adiabatic cooling
1b Supported by phase change heat/cold storage
2 Closed cooling systems, air/air 2a Supported by adiabatic cooling
2b Supported by compression cooling
3 Closed cooling systems, air/fluid 3 Supported by hybrid cooling
With a view to energy-efficient operation, these variants all share the
following characteristics:
maximum use of free cooling (‘natural’ sources of cold);
full separation of warm and cold air streams;
variable-speed drives on fans, and pressure control wherever possible;
temperature and humidity ranges in line with the ASHREA US industrial
standard (max. temperature: 27˚C).
Supplier data, model calculations and validation Suppliers of these technologies were contacted for specific data on
investments and energy performance. Model calculations were then carried
out to calculate typical values for investments, energy performance and
pay-back time for the three ‘typical’ data centres distinguished.
Thereafter, the results were checked with data centre operators applying the
specific techniques concerned. Given the uncertainties in the data,
a sensitivity analysis was carried out, and the pay-back times presented reflect
the results of that analysis.

8 May 2013 3.958.1 - Investigation of techniques for energy-efficient new-build data centres
The main results are summarized in Figure 1 and Table 2 below.
In Figure 1 energy performance is measured as Energy Usage Effectiveness
(EUE), the ratio between the total amount of energy supplied to a data centre
and the amount actually used for the computing equipment. It thus provides a
measure of the amount of energy used for cooling and other ancillary systems.
The method used for calculating the EUE is comparable to the SMK standard
and excludes transformers.
Figure 1 Performance of energy-efficient variants for new-build data centres measured as EUE
The figure shows that while the reference cases have a EUE below 1.3, the
various energy-efficient variants can score well below 1.2. The differences
between the variants are relatively small.
The pay-back times are presented in Table 2. For all three sizes of data centre
Variant 2a is profitable. This is due to the relatively limited investments
involved, since in this variant no compression cooling is applied. The economic
performance of Variant 3b may be similar to the reference, depending on the
specific investments required. This is also the case for Variant 2b in a large
data centre.
Table 2 Pay-back times for energy-efficient cooling variants (per year)
Cooling variants Small (0.25 MW) Medium (3 MW) Large (8 MW)
Variant 1a > 10 >= 0 > 10
Variant 1b > 10
Variant 2a < 0 < 0 < 0
Variant 2b > 10 > 10 >= 0*
Variant 3b >= 0* >= 0*
* Results for these variants vary under sensitivity analysis testing.
0.95
1
1.05
1.1
1.15
1.2
1.25
1.3
Small data centre (0.25 MW)
Medium data centre (3 MW)
Large data centre (8 MW)

9 May 2013 3.958.1 - Investigation of techniques for energy-efficient new-build data centres
Furthermore, in the model analysis not all technological details and cost
advantages or disadvantages are included. Three examples of design aspects
that were not quantified are data centre raised floor, costs of electricity
cabling and mains voltage transformers and costs for separated hot/cold
alleys. In design choices for the efficient cooling technology employed, actual
additional installation costs may be limited.
Conclusions The results show that a high degree of energy efficiency can be achieved,
with various combinations of techniques available to this end. A crucial factor
in all variants is substantial use of ‘free cooling’. As the energy used for
cooling purposes reaches even lower levels, that used for power supply
becomes increasingly important, and in this respect modular construction is
then a pivotal factor. To give an indication for the modular building: for a
2 MW data centre of which the power supply must be N+1 redundant: modular
build should be in increments of 250 kVA or less.
For maximum energy efficiency the following measures should be
implemented:
data centre temperatures an humidities, as per ASHREA recommended
values, temperatures max. 27˚C;
continuous monitoring of energy use per system and function;
maximum use of ‘free cooling’, typically > 98%;
cooling air inlet on a cool part of the building (e.g. not on a dark roof);
fully segregated cold and warm aisles;
modular building of the uninterruptible power supply (UPS) systems;
use of a UPS that provides high energy efficiencies across a broad range.

10 May 2013 3.958.1 - Investigation of techniques for energy-efficient new-build data centres

11 May 2013 3.958.1 - Investigation of techniques for energy-efficient new-build data centres
1 Introduction
1.1 Background and objective
As the need in society for storage of electronic data is rapidly growing,
the data centre sector shows a fast grow in the Dutch economy. Because data
centres are usually large consumers of electricity the total use by the sector is
substantial. According to a recent study of CE Delft for Hivos this amounts to
around 1.6 TWh, or 1,5% of the total consumption of electricity in the
Netherlands (CE Delft, 2012). The members of the trade organization
Nederland ICT have a combined energy consumption of 15.6 PJ/year, and
projections for a business-as-usual (BAU) scenario indicate a growth in the
energy consumption to 39 PJ/year in 2030 (ICT Office, 2012).
A substantial part of the energy use of data centres is not used for the
IT equipment itself, but for the cooling and electricity supply, these aspects
can account for up to 50% of the total energy use of a data centre. For these
aspects measures in recent years diverse measures have been developed that
can substantially reduce the energy use. In the framework of environmental
legislation local government authorities can oblige data centres to implement
energy efficiency measures, under the condition that measures have a
pay-back time smaller than five years. In this context local government
authorities and data centres are looking for an actual and objective overview
of possible energy-efficient techniques or combination of techniques.
This report gives presents this overview. It is directed at possible energy-
efficient techniques for new-build data centres, and focusses on measures for
cooling and electricity supply. Parallel a study is being conducted focussing at
existing data centres. The study is conducted on behalf of NL Agency, an
agency of the Ministry of Economic Affairs. It has been guided by a steering
group with representatives of NL Agency, the Ministries of Economic Affairs
and Infrastructure and Environment, the environmental offices of Amsterdam-
Noordzeekanaalgebied and Rotterdam-Rijnmond and the sector organisation
Nederland-ICT. During the process (intermediate) results have been exchanged
with a counseling group of data centres. Annex A gives an overview of
participants of steering and counseling group.
The study is based on an exhaustive research of available national and
international literature, interviews with suppliers of energy-efficient
techniques, model calculations and validation of results with users of data
centres. The results of the study will serve as basis for the preparation of a
guide to the competent local authorities in assessing plans to build new data
centres and server rooms. Key points from this study relevant for this guide
are summarized in Annex D (in Dutch).
1.2 Objective
The objective of this study is to investigate the best available techniques for
energy efficiency for new-build data centres.
The study answers the following questions:
What possible energy saving techniques can be applied?
What combinations of techniques are possible?
What are the costs and energy use of these combinations of techniques?
To what extent are these combinations of techniques technically and
economically feasible?

12 May 2013 3.958.1 - Investigation of techniques for energy-efficient new-build data centres
1.3 Scope
Energy use for cooling and electricity supply Conventionally, approximately 70% of the energy supply of a data centre is
used for the ICT. The other parts of the energy supply is mainly used for
cooling (23% in this case) and the electricity supply, or UPS (Uninterupted
Power Supply) (7% in this case). The last two subjects are part of this study,
the energy use by the ICT itself is not part of this study. Within the subject of
cooling, also the energy use for humidification and the aspect of limiting
heat-influx from outside is included.
Furthermore, a minor part of the energy use in a data centre is for other
applications, such as the use of energy for lighting, office equipment and the
climate control of offices. This energy use is also excluded from this study.
Figure 2 gives an overview of the major energy flows in a data centre.
Figure 2 Overview of major energy flows in a data centre
Investments and energy use of energy-efficient technique-combinations A critical factor in this study are data on investments and energy use of
energy-efficient techniques. These are the basis for model calculations on
typical investments and energy use of technique-combinations (‘variants’ in
the terminology of the report). These data are based on information received
from a large number of suppliers of energy-efficient techniques, mainly
located in the Netherlands. Afterwards suppliers and users have been asked to
check the data used in the model calculations. Apart from these suppliers no
other suppliers have been approached.
Calculation of pay-back times This report gives pay-back times of several energy-efficient combinations of
techniques. These pay-back times are based on a 1st order calculation from
investments and energy costs. Other cost factors (for instance for other
related operational costs or savings) are not taken into account in the
calculation. This is in accordance with the standard calculation method of
pay-back times in the Dutch environmental protection law.
Electricity supply
Cooling installations
Datafloor63%
ICT-devices
7% fans
23% cool-
ing
100%Electric
energy
7% UPS losses
100%Thermal energy
70% Heat
discharge data floor
Electricity demand
Heat flux

13 May 2013 3.958.1 - Investigation of techniques for energy-efficient new-build data centres
1.4 Definition of energy efficiency:
Energy efficiency is a key word in this report. In the data centre world two
terms are being used to address this aspect: the Power Usage Efficiency (PUE)
and Energy Usage Efficiency (EUE). Currently both EUE and EUE are defined in
the same way:
the total yearly averaged energy use of a data centre
EUE = PUE =
the yearly average energy used by the ICT equipment
The certification scheme ‘Milieukeur Klimaatbeheersing bij datacenters’
(SMK, 2012) gives a standard for measuring the EUE. The model analysis
conducted in this study (Chapter 4) is comparable to this definition.
As a difference, the energy use for ‘other’ equipment such as offices and
lighting is not included.
Sometimes data centres report incorrect values for EUE values, for instance
when the reported value is calculated on the basis of energy numbers over a
shorter period of time, or when the energy use of significant energy consuming
equipment is subtracted.
1.5 Structure of the report
The first part of this report (Chapter 2) presents a concise overview of
available information in literature on energy-efficient techniques for data
centres. Based on these findings logical combinations of techniques (variants)
for energy-efficient cooling are defined (Chapter 3). In the next step
(Chapter 4) these variants are quantitatively evaluated. This evaluation is
based on costs and energy performance of specified energy-efficient
techniques, as provided by suppliers of these techniques and validated by
users of data centres. These data have been put into a technical-economical
model, resulting in specific data for investments, energy performance and
pay-back times of variants. Chapter 5 evaluates the most important findings
for energy-efficient cooling. In Chapter 6 the findings for other aspects are
discussed. The main conclusions are presented in Chapter 7.

14 May 2013 3.958.1 - Investigation of techniques for energy-efficient new-build data centres

15 May 2013 3.958.1 - Investigation of techniques for energy-efficient new-build data centres
2 Results of desk study
2.1 Introduction
This chapter provides an overview of the literature sources with relevance for
new-build data centres, viz. government white papers, information brochures
and studies commissioned by governments, technical reports, and product
information from suppliers and others. At the core of the desk study
undertaken are several recent reports by Dutch government agencies,
supplemented by information from foreign reports and supplier information.
Section 2.2 summarizes the main content of the respective documents, while
Section 2.3 presents our main findings for each individual class of techniques
considered.
In the present study the following literature sources were investigated:
Dutch government agencies Sustainable cooling of data centres (in Dutch: Duurzaam koelen van
datacenters) (NL Agency, 2012).
Energy saving in data centres (Energiebesparing in datahotels)
(ECN, 2008).
List of measures from the Dutch Multi-YearAgreement for the ICT sector
(MJA-3) (Maatregelenlijst voor de MJA-3 van de ICT sector).
Cloud computing: grey or green (Cloud computing: Grijs of Groen)
(TNO, 2012).
Energy advice for Amsterdam: from insulation to city heating
(9 Energie-adviezen aan Amsterdam, bundeling van ECN-notities van
isolatie tot stadsverwarming door F.A.T.M. Ligthart) (ECN, 2004).
European Union The Code of Conduct for Data Centres - participant guidelines.
The Code of Conduct for UPS systems.
Industry associations The Green Grid white papers.
Dutch Code of Practice NPR 5313 (NEN Praktijkrichtlijn 5313,under
development).
ASHRAE, The American society for Heating, Refrigerating and
Air-conditioning Engineers.
Product information from suppliers APC whitepapers on power supply and cooling.
ADC whitepapers.
TE Connectivity.
Kyoto Cooling.
GE Digital Energy.
Eaton.
Solartech.
16 May 2013 3.958.1 - Investigation of techniques for energy-efficient new-build data centres
Academia Lawrence Berkley National Laboratory (LBNL).
Specific sources: Moehle 2011, Ashrae Transactions 2012, ASU, 2012.
Free University of Amsterdam: Online library of Green ICT Practices.
Other Energy efficiency measures in existing data centres (EnergyGo, ongoing
research for GreenIT Amsterdam).
Certificatieschema Milieukeur klimaatbeheersing bij data centres
(SMK, 2012).
Memo Witte daken, toepassing bij datacentra (Arcadis, 2012).
BREEAM Data centres.
Proceedings of Symposium ICT 4EE, Brussels, 2011.
2.2 Brief outline of documents
In the following subsections the scope of the literature sources investigated
are briefly outlined.
2.2.1 Reports by Dutch government agencies
Sustainable cooling of data centres (NL Agency, 2012) This report provides qualitative information on different types of energy-
efficient cooling of data centres. The underlying sources are not explicitly
specified, but are probably mainly interviews with data centre managers and
information provided by cooling system suppliers.
Ten recently developed technical concepts are described, for most of which a
concrete example is given of a data centre where it is already implemented.
Effects on energy use are presented as typical values for EUE.
Energy saving in data centres (ECN, 2008) This report for the Municipality of Amsterdam investigates potential
techniques for new and existing data centres, and the effects of these
techniques on EUE. The study is based on scientific reports and information
from the Green Grid. The descriptions of the techniques vary widely in degree
of elaboration.
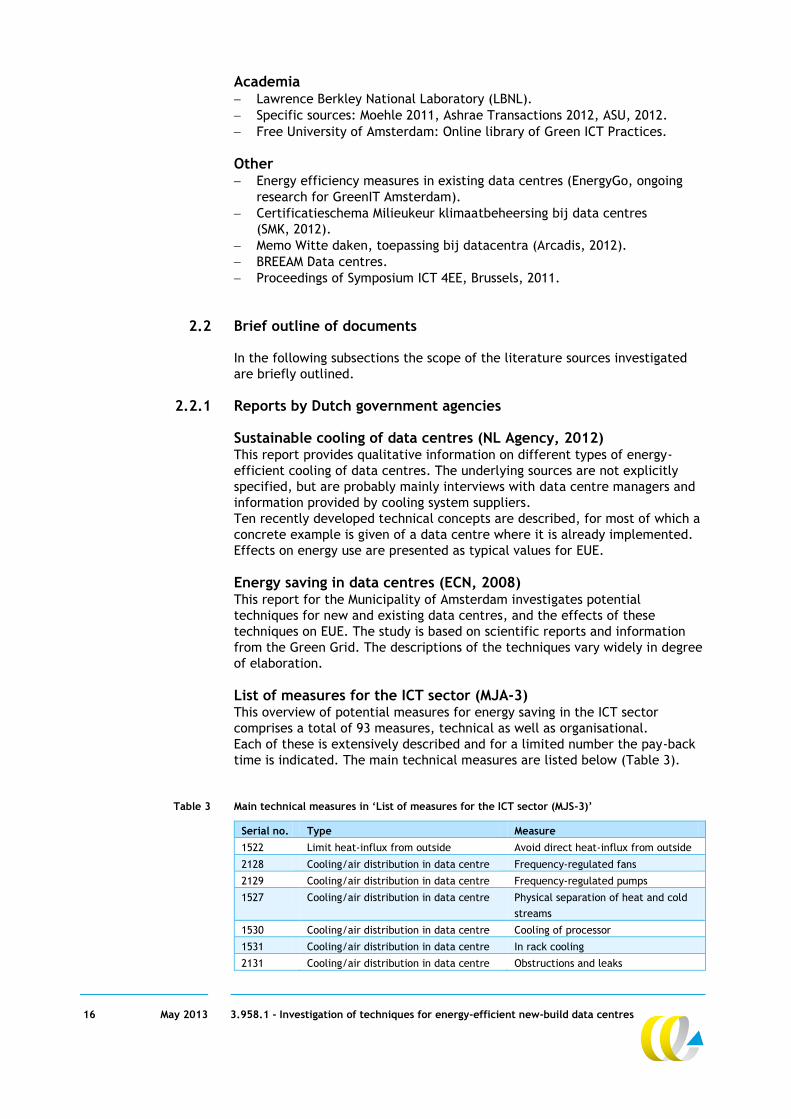
List of measures for the ICT sector (MJA-3) This overview of potential measures for energy saving in the ICT sector
comprises a total of 93 measures, technical as well as organisational.
Each of these is extensively described and for a limited number the pay-back
time is indicated. The main technical measures are listed below (Table 3).
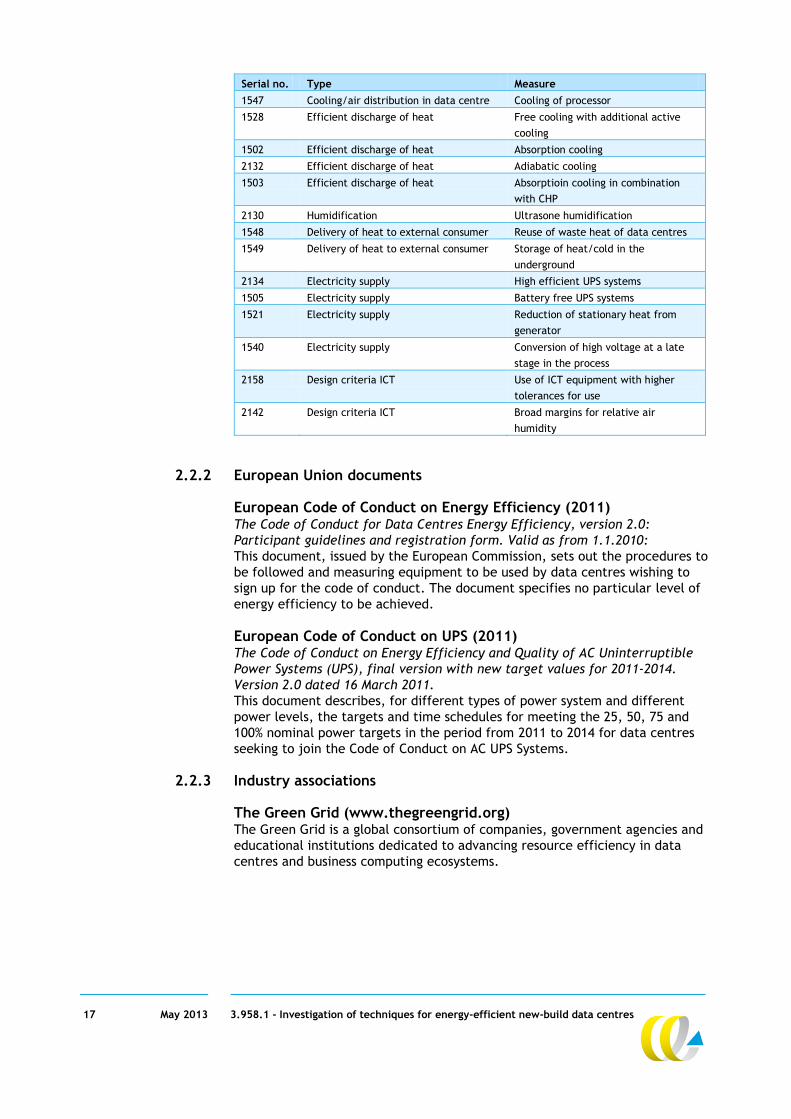
Table 3 Main technical measures in ‘List of measures for the ICT sector (MJS-3)’
Serial no. Type Measure
1522 Limit heat-influx from outside Avoid direct heat-influx from outside
2128 Cooling/air distribution in data centre Frequency-regulated fans
2129 Cooling/air distribution in data centre Frequency-regulated pumps
1527 Cooling/air distribution in data centre Physical separation of heat and cold
streams
1530 Cooling/air distribution in data centre Cooling of processor
1531 Cooling/air distribution in data centre In rack cooling
2131 Cooling/air distribution in data centre Obstructions and leaks
17 May 2013 3.958.1 - Investigation of techniques for energy-efficient new-build data centres
Serial no. Type Measure
1547 Cooling/air distribution in data centre Cooling of processor
1528 Efficient discharge of heat Free cooling with additional active
cooling
1502 Efficient discharge of heat Absorption cooling
2132 Efficient discharge of heat Adiabatic cooling
1503 Efficient discharge of heat Absorptioin cooling in combination
with CHP
2130 Humidification Ultrasone humidification
1548 Delivery of heat to external consumer Reuse of waste heat of data centres
1549 Delivery of heat to external consumer Storage of heat/cold in the
underground
2134 Electricity supply High efficient UPS systems
1505 Electricity supply Battery free UPS systems
1521 Electricity supply Reduction of stationary heat from
generator
1540 Electricity supply Conversion of high voltage at a late
stage in the process
2158 Design criteria ICT Use of ICT equipment with higher
tolerances for use
2142 Design criteria ICT Broad margins for relative air
humidity
2.2.2 European Union documents
European Code of Conduct on Energy Efficiency (2011) The Code of Conduct for Data Centres Energy Efficiency, version 2.0:
Participant guidelines and registration form. Valid as from 1.1.2010:
This document, issued by the European Commission, sets out the procedures to
be followed and measuring equipment to be used by data centres wishing to
sign up for the code of conduct. The document specifies no particular level of
energy efficiency to be achieved.
European Code of Conduct on UPS (2011) The Code of Conduct on Energy Efficiency and Quality of AC Uninterruptible
Power Systems (UPS), final version with new target values for 2011-2014.
Version 2.0 dated 16 March 2011.
This document describes, for different types of power system and different
power levels, the targets and time schedules for meeting the 25, 50, 75 and
100% nominal power targets in the period from 2011 to 2014 for data centres
seeking to join the Code of Conduct on AC UPS Systems.
2.2.3 Industry associations
The Green Grid (www.thegreengrid.org) The Green Grid is a global consortium of companies, government agencies and
educational institutions dedicated to advancing resource efficiency in data
centres and business computing ecosystems.

18 May 2013 3.958.1 - Investigation of techniques for energy-efficient new-build data centres
Relevant reports 1. Breaking New Ground on Data Centre Efficiency, Feb 2012.
Case study of measures taken to improve efficiency of an existing data
centre. Particular emphasis on temperature set points and free cooling.
2. Case study: The ROI of cooling system energy efficiency upgrades, 2011.
Case study of measures taken to improve the efficiency of an existing data
centre. Particular emphasis on variable-speed drive efficiency.
3. Fundamentals of data centre power and cooling efficiency zones, 2009.
Analysis of various efficiency gains, including temperature setpoints and
air flow patterns, efficiency of drive motors and electrical installations,
etc.
4. White Paper 30, Qualitative analysis of cooling architectures for data
centres, 2011. An analysis of the efficiency of various cooling
architectures.
5. White Paper 29: ERE, a metric for measuring the benefit of reuse energy
from a data centre.
Dutch Code of Practice NPR 5313 (under development) Dutch Code of Practice NPR 5313, 3-3 Computer Rooms and Data Centre
Requirements and Classification of Energy Efficiency (under development)
This part of the cited code of practice is concerned mainly with explaining the
abbreviations and terms used to describe the energy efficiency of a given data
centre. It is proposed to categorize data centres according to five energy
efficiency classes: A to E, based on the achieved EUE and referred to as
‘observation levels’, as follows:
A: EUE <= 1.1, observation level 3 (outstanding)
B: EUE <= 1.25, observation level 2 (excellent)
C: EUE <= 1.5, observation level 2 (good)
D: EUE <= 2, observation level 1 (average)
E: EUE > 2, observation level 1 (can be greatly improved)
Note: In this classification, efficiency is not affected by data centre
availability.
The document does not describe specific techniques for improving energy
efficiency.
Dutch Code of Practice NPR 5313, 3-1, Computer Rooms and Data centres
Requirements and Classification of Availability (under development)
In the context of determining so-called classes of availability, the Dutch
Standards Committee 381 888 has studied several existing standards, thereby
opting for the BICSI classes F1 to F4, which are well defined and immediately
applicable for characterizing existing data centres. As in NPR5313, 3-3 (see
above), no techniques are discussed. Furthermore, energy efficiency is beyond
the scope of this part of the code of practice.
Rich Miller: Data centre energy efficiency guide (2011) This source contains several case studies for reuse of data centre. heat.
http://www.data centreknowledge.com/archives/2011/03/04/data-center-
energy-efficiency-guide/
Ziggo press release (2011) This source considers the use of phase-change materials for the purpose of
cold storage. www.ziggo.com/nl/pers/persberichten/60,450/bouw-nieuwe-
generatie-data centres/
19 May 2013 3.958.1 - Investigation of techniques for energy-efficient new-build data centres
2.2.4 Information from suppliers
APC whitepapers APC is part of the Schneider Electric company. The APC ‘whitepapers’ describe
various aspects of energy efficiency in data centres. Although the papers are
undated, it can be assumed that most of them (up to no. 137) were published
before 2009. The source has a good reputation for accuracy and the
whitepapers are regularly reviewed.
Power best practices WP 28, WP 29, WP 92, WP 127, WP 128, WP 129, WP 157.
WP 127 shows that the most efficient AC systems (2012) in ‘eco-mode’ are
0.99% more efficient than the most efficient DC systems. If the ‘eco-mode’
is not applied, the DC system is 1.05% more efficient. A 1% improvement in
power system efficiency translates to about 0.13% of the total data centre
energy use.
WP 128 applies only to the USA according to the authors.
WP 129 applies only to existing data centres.
WP 157 describes the risks of ‘eco-mode’ for UPS systems
Cooling best practices WP 49, WP 68,WP 130, WP 132, WP 134, WP 135, WP 137, WP 139.
WP 49 is about correcting faulty installation of cooling equipment.
WP 130 describes the differences between rack, row and room cooling
systems.
WP 132 is about economizer modes on cooling systems.
WP 134 advocates concentrating high-density racks in specialised
high-density pods with their own cooling system. The most efficient way to
organise such pods is by way of hot aisle containment or rack air
containment.
WP 135 is about air containment.
WP 68 provides insight into the cooling of wire closets. It provides charts of
temperature vs. IT equipment load figures, showing the critical values for
conduction, passive ventilation, fan-assisted ventilation and dedicated
cooling.1
WP 137, published in the ASHRAE Journal (October 2008), advocates the
complete separation of cold and hot aisles in the form of row-based
cooling as a standard practice in ‘new’ data centres.
WP 139 uses computational fluid dynamics (CFD) to illustrate that row
coolers are on their own sufficient for cooling an entire data centre and
that cooling based solely on row coolers has lower costs and higher
efficiency and permits elimination of raised floors.
1 This explains:
why larger closets require less cooling (higher conduction capacity);
why wire closet temperature rises with increasing thermal resistance of walls, ceiling
and floor (assuming the closet surroundings are cooler, see next point) and thus the need
for ventilation/air conditioning;
why rising outside temperature of closet walls (e.g. due to sun exposure) increases
closet temperature and thus the need for ventilation/air conditioning.

20 May 2013 3.958.1 - Investigation of techniques for energy-efficient new-build data centres
Energy efficiency WP 66, WP 92, WP 114, WP 126, WP 154, WP 158, WP 161.
WP 92 compares static and dynamic UPS systems. The former appear to be
significantly more efficient at loading values of up to 60%.
WP 154 explains how EUE should be measured and how loading may effect
it. Measures to decrease it are not discussed.
WP 161 describes how energy costs and CO2 emissions should be allocated
to IT users.
WP 158 shows that overhead cabling decreases leakage of cold air and thus
reduces energy use compared to other cabling modes.
WP 66, WP 114 and WP 126 are outdated.
TE Connectivity, formerly ADC Krone TE is a commercial company that plays an important role in the power, data
and signal connectivity of industry as a whole. Their expertise includes data
centre infrastructure, with two relevant publications on this issue:
1. Designing an Optimised Data Centre, 2007
Amongst other things, this whitepaper describes cabling strategies to
achieve maximum airflow in the data centre.
2. TrueNet® Data Centres, The complete Data Centre solution, 2007
This is a brochure describing the various ‘uptime’ TIER-level requirements
in relation to cabling infrastructure.
Emerson Emerson is a diversified global manufacturing and technology company
providing a broad range of products for data centre infrastructure, including
power and cooling equipment. Their product documentation provides valuable
insight into modern techniques. The source has a good reputation for accuracy
and their whitepapers are regularly reviewed.
1. White paper: Evaluating the Opportunity for DC Power in the Data Centre,
2010.
Paper showing the need to limit powerline length by placing 48VDC
conversion close to the point of use.
2. White paper: Recycling Ratios: The Next Step for Data Centre
Sustainability, 2011.
Examination of the recyclability of infrastructure elements like batteries
and airconditioning equipment.
3. White paper: Energy-efficient Cooling Solutions for Data Centres.
Report on the economization modes on all Liebert-branded cooling
equipment and their effectiveness.
4. Data Centre Users’ Group Special Report: Energy efficiency and capacity
concerns increase, fall 2012.
This report provides a good overview of the size distribution of members’
data centres and their primary concerns. The study underlines that
electrical power is the primary operational constraint and therefore the
parameter of choice for determining data centre load percentages.
Stulz, 2008 White paper: Data Centre Cooling Best Practice (2008)
Multiple recommendations on airflow management in data centres, including
recommendation for pressure-controlled ventilation.
Kyoto Cooling Product information from the supplier of the Kyoto Wheel, a type of rotary
heat exchanger used for cooling, including PPT-presentations on its operation
and descriptions of 24 locations where it is installed. www.kyotocooling.com

21 May 2013 3.958.1 - Investigation of techniques for energy-efficient new-build data centres
Solartech, 2012 Product information on the Energiedak® technology, a means of cooling air
using the roof as a heat exchanger. www.energiedak.nl
2.2.5 Academia
Lawrence Berkley National Laboratory (LBNL): Technical Best Practices checklist A comprehensive list of possible best practices for data centre efficiency.
http://hightech.lbl.gov/dctraining/about.html
Nicholas Moehle: Advanced control for data centre cooling A research proposal for superior control algorithms for data centre cooling,
including heightened awareness of the physical state of the data centres,
(particularly airflow and pressure).
http://www.stanford.edu/class/ee392n/lecture/jun11/nm.pdf
David Moss: ASHRAE Transactions, Jan. 2012. Under-floor pressure control: a superior method of controlling data centre cooling. Academic discussion, including test results in a live data centre for pressure-
controlled ventilation.
Anna Haywood, Jon Sherbeck, Patrick Phelan, Georgios Varsamopoulos, Sandeep K.S. Gupta (2012) Thermodynamic feasibility of harvesting data centre waste heat to drive an
absorption chiller.
http://impact.asu.edu/publication/Haywood2012-feasibility.pdf
T. Takakura, S Kitadeb, E Gotob (2000). Cooling effect of greenery cover over a building Elsevier Energy and Buildings, Volume 31, Issue 1, Jan. 2000, p. 1–6
Peer-reviewed scientific article presenting the cooling effect of various kinds
of greenery cover(bare concrete, soil layer, soil layer with turf and soil layer
with ivy), investigated by both experimental construction and computer
simulation. To calculate the cooling effect, temperature profiles, including air
temperature under the roof, were measured along with other environmental
parameters.
Free University of Amsterdam: Online library of Green ICT Practices, on-going In the context of a collaborative project between the Free University of
Amsterdam (Software and Services Research Group) and SURFNet, the former
is developing an online library of ‘Green ICT Practices’, which currently has
258 entries elicited from both industrial practice and academic publications.
2.2.6 Other sources
EnergyGo, 2012 Niels Sijpheer, Marcel Elswijk and Bart Roossien, presentation of intermediate
results of a study on energy efficiency improvements in existing data centres
within the Amsterdam region. This study is part of the City of Amsterdam’s
GreenIT programme.

22 May 2013 3.958.1 - Investigation of techniques for energy-efficient new-build data centres
SMK, 2012 Certificatieschema Milieukeur klimaatbeheersing bij data centres.
Certification scheme for data centre climate control published by a Dutch
NGO. Part of this certification scheme is a definition of the EUE. In the
definition the EUEtotaal is the ratio between the energy use for the climate
system (electricity and gas), UPS systems and other (offices and lighting),
and the energy use for the ICT/server racks.
ICT4EE, 2010 Proceedings of second High Level Event on ICT for Energy Efficiency, Brussels,
2010.
The focus of this ICT 4EESymposium, organised by the European Commission's
Information Society and Media Directorate-General, was on the enabling of
energy efficiency through ICT, and as such the proceedings are of little
relevance to the present study. The ICT4EE Forum, announced at this event,
is active but has no activities relevant to the present study.
University of Twente A paper on the use of cold water storage to bridge warm weather periods.
http://www.utwente.nl/fb/vastgoed/archief/nieuwsarchief/symposiumkoude
cirkel.doc
ASHRAE, 2011 White paper on Thermal Guidelines for Data Processing Environments –
Expanded Data Centre Classes and Usage Guidance, ASHRAE Technical
Committee, 2011.
ASHRAE stands for the American Society for Heating, Refrigerating and
Air-conditioning Engineers.
Arcadis, 2012 Witte daken; toepassing bij datacentra, Luc Cartigny, Arcadis Divisie
Gebouwen Maastricht, 27 September 2012.
Short literature study confirming that white roofs improve the capacity of data
centres to convey excess heat to the outside due to a lower roof temperature.
Optigroen, 2012 Assessment of information on ‘green roofs’ on Optigroen website
(www.optigroen.nl) and by Rob Steltenpöhl, technical adviser at Optigroen.
CRRC, 2012 Information assessed at www.coolroofs.org by the Cool Roof Rating Council,
created in 1998 to develop accurate and credible methods for evaluating and
labelling the solar reflectance and thermal emittance (radiative properties) of
roofing products and disseminate the information to all interested parties.
BREEAM, 2012 BREEAM-NL Data centres, keurmerk voor duurzame vastgoedobjecten.
Beoordelingsrichtlijn Nieuwbouw-Data centres, version 1.0, February 2012.
BREEAM is an international benchmark for the sustainability of buildings,
judging the design and realisation of a new building on the following
categories: Building and construction management, Health & Comfort, Energy,
Transport, Water, Materials, Waste, Landuse & Ecology, and Pollution.
In each category points are awarded for preventing negative environmental
effects. The more points, the higher the rating.

23 May 2013 3.958.1 - Investigation of techniques for energy-efficient new-build data centres
2.3 Temperature and humidity regulation within data centres
In this paragraph we discuss the regulation of temperature and humidity within
data centres. The temperature and humidity settings selected by operators
play a crucial role in controlling the data centre environment and therefore
overall energy consumption.
ASHRAE recommendations Recommended temperature and humidity settings are provided in an ASHRAE
publication on electronic equipment2. The values are shown in Figure 3 and in
Figure 143. For the classes A1 to A4, a dry-bulb temperature of 18–27˚C is
recommended . The recommended humidity range is, in a temperature
independent representation, a dew point between 5.5 and 15˚C.
Maximum allowable values are broader, as shown in Figure 3.
Figure 3 ASHREA guidelines for temperature and humidity
Source: ASHRAE, 2011.
2 American Society of Heating, Refrigerating and Air-Conditioning Engineers, 2011: ASHRAE TC
9.9 2011 Thermal Guidelines for Data Processing Environments – Expanded Data Center
Classes and Usage Guidance.
3 Suppliers of electronic equipment indicate for a product supplied the according
ASHREA-class.

24 May 2013 3.958.1 - Investigation of techniques for energy-efficient new-build data centres
Figure 4 ASHRAE-recommended and allowable envelope, presented as a psychometric chart
Flexible temperature operation Green Grid White Paper 50 (Data centre efficiency and IT equipment reliability
at wider operating temperature and humidity ranges, October 2012) treats the
subject of data centre internal environment control.
In many data centres, temperature set points are generally static over the
course of the year. White Paper 50 discusses the implications of a variable
setpoint, chosen at values lying within the ASHRAE-allowed range for type A1
equipment. Choosing a value within the allowable envelope greatly extends
the period of full free cooling. A particular peculiarity of the Dutch climate is
that relative humidity at these high temperature extremes is invariably low,
making adiabatic cooling very effective in this range.
While running at 29˚C or even higher may fall within manufacturer-allowable
values and allow for free cooling, the adaptive fans inside the IT equipment
will spin faster, leading to higher IT equipment energy consumption.
As a result, overall energy use would be much higher than running the same
data centre well within the ‘ASHRAE-recommended’ range.
The solution proposed is to keep well within the allowable envelope and allow
the data centre setpoint to fluctuate, following the general trend of the
outdoor temperature. This means that the setpoint may drop to as low as 15˚C
during the winter but be allowed to reach 32˚C on hot summer afternoons.
Interestingly, the EUE of a data centre running this kind of flexible regime
would not be as low as would be obtained with a fixed high setpoint of, say,
25˚C. Total energy consumption, would be the lowest obtainable, however!
It is important to note that this form of operation is currently untried and
raises the complexity for both operator and regulator because of the
fluctuations in setpoints. The promise of improved operation and energy
efficiency is a strong argument in favour of this method, though.

25 May 2013 3.958.1 - Investigation of techniques for energy-efficient new-build data centres
2.4 Efficient air transport
Most ICT equipment requires air at a temperature within the limits defined by
the ASHRAE temperature envelope for cooling. However, this temperature is
only required at the air inlet.
This topic is discussed in multiple sources, but the GreenGrid Whitepaper 39,
(Case study: the ROI of Cooling System Energy Efficiency Upgrades) provides a
prime example. According to this paper, three types of measures should be
taken:
air separation (hot and cold aisles);
frequency control of fans/natural air movement;
prevention of high air speeds and long distances in air transport.
Air separation (hot and cold aisles) Data centre cooling systems will operate more efficiently when the hot and
cold air streams remain fully separated (see also the calculations in APC
Whitepaper 130, Choosing Between Room, Row and Rack-based Cooling for
Data Centres) (Figure 5 and Figure 6). According to a study conducted by
EnergyGo (EnergyGo, 2012) on existing data centres, typical investments for
creation of hot and cold aisles are in the range of < € 1,500/kW.
Figure 5 Example of separation of hot and cold air streams in a data centre. In this example cold air is
blown in and hot air discharged from the sides of the alleys

26 May 2013 3.958.1 - Investigation of techniques for energy-efficient new-build data centres
Figure 6 Example of full separation of cold and heat air streams in data centre. The photo shows a cold
alley, with influx of cold air via the bottom
Frequency control of fans/natural air movement In cases where a traditional Computer Room Air Handling (CRAH) system is
based on static speed fans, the need for variable-speed fans is apparent.
This is currently the standard in modern installations (Moehle, 2011; Stulz,
2008). With these variable-speed drives, the lower the fan (air) speeds, the
more efficient these fans become.
This mechanism is illustrated in Figure 7, which plots the relationship between
the fan speed and power usage for CRAH fans. At 60% speed the 7.6 kW
nominal power engine only uses 1.4 kW. The cooling capacity at nominal
power is 105 kW, while at 60% of fan speed the cooling capacity is 60 kW.
The related performance coefficient (COP) improves from 13.8 to 43.
Figure 7 Relationship between CRAH fan speed and power usage

27 May 2013 3.958.1 - Investigation of techniques for energy-efficient new-build data centres
A reduction of airspeeds has a substantial effect on required fan power:
as a general rule, a reduction of airspeed by a factor 2 results in a reduction of
required power by a factor 8 (EnergyGo, 2012). This can be further improved
by combining the above insights: the amount of cooling air needs to be
regulated to match demand exactly, and airspeeds should remain low and
distances short. Part of this can be achieved by means of full aisle
containment (i.e. completely separated hot and cold aisles) using pressure
sensors. The temperature of the cold air and its volume are then separated
quantities that can be independently controlled (ASHRAE Transactions, 2012).
2.5 Efficient discharge of heat
2.5.1 Compression and free cooling Efficient heat discharge is key to high energy efficiency. To obtain a
sufficiently low EUE, naturally cold sources for air or water need to form the
pivotal element of the heat discharge system. As an illustration, an ECN study
of 2008 reports the effects of different cooling systems, with and without
‘free cooling’ (cold from a natural source) on the overall EUE (ECN, 2008).
Figure 8 Technical concepts and corresponding effects on EUE 4
Source: ECN, 2008.
There are many different devices and technologies available for cooling data
centres. However, each comprises the following elements:
Heat transport: fans and/or pumps moving fluid (such as air or water) to
transfer heat energy from the data centre to the outdoor environment.
Heat exchange: coils or vents that transfer heat energy from one heat
stream to the next. In all cases, there is a final heat exchanger to the
outdoor environment or heat harvesting stream.
Source of cold: this can be a natural source, but also cold from a
compressor system.
4 SPF (seasonal performance factor) is a measure of the energetic performance of the cooling
system.

28 May 2013 3.958.1 - Investigation of techniques for energy-efficient new-build data centres
2.5.2 Technical options There will always be a range of solutions providing the optimum cooling
system. For the system to be energy-efficient, the cold from the cold medium
must derive as far as possible from a natural source. In the data centre world,
cooling using cold from a natural source is called ‘free cooling’.
Energy-efficient cooling systems can be divided into several categories, in all
of which free cooling plays a key role.
1. Open cooling systems: data centre air supplemented directly with filtered
outside air
In open cooling systems, the cold outside air is directly vented to the data
centre through a microfilter without any intermediate heat transfer
medium.
2. Closed cooling system: indirect free cooling with an outside air/inside air
heat exchanger
In these variants, the cooling is indirect, i.e. there is heat exchange
between different air streams. This can be done using a rotating ‘heat
wheel’ heat exchanger, or using cross-flow or counter-current air/air heat
exchangers. The ‘Kyoto Wheel’ is one example of a heat wheel, and
according to the product information this provides energy savings of 85%
compared with conventional design, or 400 k€/MW IT-load/year.
This results in EUEcooling-levels of 1.05-1.15 (Kyotocooling, 2012).
According to the EnergyGo study on existing data centres, typical
investments for adding ‘free cooling with outside air’ are in the range of
< € 1,600/kW, yielding typical energy savings in the range of € 430/yr/kW.
3. Closed cooling system: indirect free cooling with fluid-based thermal
transport.
In this variant, a fluid cold transport medium is used to transfer cold
from the outside to air-handling units that are placed close to the IT
equipment/heat loads. The warm air in the computer room is vented along
a heat exchanger where ‘cold’ air is made using a chilled water stream.
The warmed-up water then goes to a cold water plant where the heat is
vented off to the air. Traditionally, compression cooling technology was
used to make the chilled water in a cold water plant. According to the
EnergyGo study, typical investments for adding ‘indirect free cooling’ are
in the range of < € 1,000/kW and typical energy savings in the range of
€ 430/yr/kW.
If a data centre is able to use groundwater as a source of cold water,
the cold can be derived solely from a heat exchanger. Alternatively,
instead of cold water storage tanks or other means, cold storage in phase
change materials (PCMs) may be used to bridge those periods in which fully
economized mode (full free cooling) are unfeasible.
4. Heat/cold storage.
Another option is underground heat storage. In the Netherlands, ground
conditions are favourable for such storage. In this approach, the data
centre can draw groundwater for economized cooling and store the
resulting warm water underground. In order to maintain the energy
balance for underground water reservoirs, the warm water can be pumped
up by third parties for use in low-temperature heating systems, or if
necessary by the data centre operator during cold spells for cooling.
Equinix AM3 in Amsterdam is an example of such an installation
(Agentschap NL, 2011). Techniques like these do not generally improve
data centre efficiency as expressed in PUE (or EUE). Free cooling, for
instance, is mostly incompatible with heat recovery. To assess efficiency
for these installations, the energy use of all affected parties must be
added and compared with a reference situation. Since the entire concept
of ‘delivering heat to the neighbourhood’ depends on having a
neighbourhood with both a need for heating and the ability to use the

29 May 2013 3.958.1 - Investigation of techniques for energy-efficient new-build data centres
temperature range provided by the data centre, this technique is almost
exclusively used in new-build data centres where location selection can
take possible customers for waste heat in account.
5. Heat delivery to a neighbourhood.
The waste heat of a data centre is in most cases so called ‘low-quality
heat’, meaning that the temperatures are lower than are generally useful
for use by third parties.
However, there are possible exceptions that do allow the waste heat to be
used for heating or even cooling purposes (ASU, 2012). The Dutch
university hospital VUMC employs such a system, for example, although it
should be noted that this data centre’s energy use is small compared to
the total energy use of the hospital (VU, 2012).
For a typical case of heat delivery to a neighbour, the EnergyGo study
indicates that investments are < 1,000 €/kWict, with annual savings of
580 €/kWict. This results in a reduction of 3 tonne CO2/kWict/year.
2.5.3 Experience in existing data centres Table 4 shows the main technical concepts, data centres and EUEs reported in
the document ‘Sustainable cooling of data centres’ (Agentschap NL, 2011).
It should be noted that in this study the methods used for calculating PUEs are
not specified and the values are therefore tentative.
Table 4 Energy-efficient heat removal concepts reported in 'Sustainable cooling of data centres’
Concept Technology name Data centre Reported PUE5
(indicative values)
Direct free cooling with
filtered outside air
DataCenterCooling;
Air@work
Smart DC, Rotterdam;
ColoCenter, Zoetermeer;
eQuest Helmond
< 1.15 (‘mostly’)
(Smart DC)
Indirect free cooling with
an outside/inside air heat
exchanger
Kyoto Wheel Rotterdam Internet
Exchange (R-IX)
1.19 (‘snapshot value’)
Indirect free cooling with
an outside/inside air heat
exchanger, supported
with evaporative assist
The Datacenter
Group
The Datacenter Group,
Amsterdam and Delft
1.16 (existing)
1.13 (Delft)
Heat-cold storage Equinix AM3, Amsterdam 1.1-1.2 (‘typically
possible’)
Hybrid direct/indirect
free cooling with an
outside/inside air heat
exchanger, supported
with evaporative assist
Menerga system EvoSwitch, Haarlem 1.05 (PUE cooling only,
theoretical);
< 1.2 (EvoSwitch)
Indirect free cooling with
fluid-based thermal
transport
Jaeggi, Rital
(hybrid wet/dry
cooler)
Humidity control Dry to cool: energy-
efficient drying of air
Van Dam Group, Rijssen/
Rosmalen
Natural cold source
Lake source cooling Examples of projects:
Eesermeer, Nieuwe
Meer, Oudekerkerplas
5 The reported PUE/EUE values are not substantiated and it is sometimes unclear what aspects
are incorporated.

30 May 2013 3.958.1 - Investigation of techniques for energy-efficient new-build data centres
Compression-less cooling Some of the data centres mentioned above have eliminated the compression
cooling machine by reverting to evaporative assist technology with good
results to date. The cited study (Agentschap NL, 2012) reports a number of
data centre cooling technologies that work compression-less.
2.6 Energy efficiency in electricity supply (UPS)
Much of the material presented in this section is based on the whitepapers
published by APC and Emerson, information sources with a good reputation for
accuracy and viewed, reviewed and quoted by a very wide readership all over
the globe.
Power distribution within data centres comprises three major components:
UPS, distribution system (bus-bar and/or wire) and IT power supplies, the first
two of which form part of the present study.
UPS, Uninterrupted Power Supply A UPS system combines electronics for power quality control with a source of
stored energy to override any period of grid failure. In addition, many data
centres are equipped with a diesel generator to overcome longer periods of
grid failure, when the amount of energy stored would be insufficient.
There are two basic kinds of UPS layout: static (Figure 9) and rotary
(Figure 10). A rotary UPS is coupled to the motor/generator and generally
combines a flywheel. A static UPS is not attached to the generator system and
may consist of battery storage (with either double or delta power conversion
electronics) or flywheel energy storage.
Figure 9 Examples of static UPS systems

31 May 2013 3.958.1 - Investigation of techniques for energy-efficient new-build data centres
Figure 10 A rotary UPS (engine-coupled)
Figure 11 Types of UPS systems
Source: APC (WP 92).
APC White Paper 127 ‘A Quantitative Comparison of High Efficiency AC vs. DC
Power Distribution for Data Centres’ provides useful graphs and numbers on
the efficiency of typical modern static UPS systems: efficiency at 50% load:
96.3%, in eco-mode efficiency at 50% load = 98.5%, this is best in class,
DC UPS: efficiency at 50% load = 96.5%, this is best in class.
APC White Paper 92 ‘Comparison of Static and Rotary UPS’ provides a typical
efficiency curve of a rotary (dynamic) UPS system, from which it can be
concluded that an average rotary UPS at 50% load has an efficiency of
approximately 93%. At much higher utilization rates, the rotary UPS is more
efficient then a modern double conversion UPS. Depending on the system,
this crossover may occur at 65% load or higher with the optimal efficiency of
the rotary system at 100% load beating even the eco-mode in the static UPS.

32 May 2013 3.958.1 - Investigation of techniques for energy-efficient new-build data centres
Combining typical efficiency (at 50% or lower load) with the fact that the
modularity of a static UPS is smaller, the static UPS is the method of choice for
all but the largest data centre builds. Also, note that 50% load is typically too
high for the higher redundancy levels. At 2N redundancy the load is often 35%.
In this case the average rotary UPS is 90% efficient according to APC, and the
static UPS is 95% efficient.
In all cases, the efficiency of UPS systems starts to drop significantly below
25% load. The static UPS systems perform notably better at lower load.
Eco-mode ‘Eco-mode’ is an operational mode that reflects operation in bypass mode,
where the double conversion (AC->DC->AC) is bypassed. This greatly saves on
conversion losses. Most modern static battery UPSs are equipped with this
mode. For a typical case of replacement of an existing low-efficient UPS
system with a 50% more energy-efficient UPS system, the EnergyGo study
indicates that investments amount to approximately 1,500 €/kWict, with
energy savings larger than 50 €/kWict/year and a reduction of CO2 emissions by
0.3 tonne/kWict/year.
Distribution wiring Distribution wiring has a linear load to loss ratio, with 99% efficiency at 100%
load and 99.5% efficiency at 50% load. Since many data centres operate with
redundant power distribution and below full load, typical loads on both UPS
and wiring are below 50% during normal operation.
2.7 Energy efficiency in humidification
Over the past few years, humidity control conditions have been relaxed in line
with the aforementioned ASHRAE publication on the recommended
environmental conditions for Class A1 electronic equipment6.
Even at these conditions, introduction and/or removal of moisture from the
data centre will sometimes be needed. Traditionally steam generators have
been used for moisture introduction and the cooling system for moisture
removal.
Humidification can be more efficiently accomplished, however, through
evaporation of small water droplets in the airstream. These droplets can be
created by high-pressure spray systems or ultrasonic humidifiers.
The evaporation process will, as an added bonus, cool the air, but this effect
on overall data centre efficiency is in general too small to be noticeable.
Drying (moisture removal) is an energy-intensive operation because the latent
heat stored in water vapour is released upon condensation and adds to the
overall heat load of a data centre. In general, moisture deficiency as well as
overabundance are a result of moisture migrating from the surrounding
environment. The most efficient form of humidity control is therefore bound
up with insulation of the data centre.
6 American Society of Heating, Refrigerating and Air-Conditioning Engineers, 2011: ASHRAE TC
9.9 2011 Thermal Guidelines for Data Processing Environments – Expanded Data Center
Classes and Usage Guidance.

33 May 2013 3.958.1 - Investigation of techniques for energy-efficient new-build data centres
As described in APC WP 58, intelligent ventilation might prove to be a useful
component of humidity control. Introduction of fresh air in greater quantities
under favourable conditions and minimal quantities under adverse conditions
provides an easy way to improve overall data centre efficiency.
2.8 Limitation of heat-influx from outside
Obviously, heat that has not entered the building does not need to be removed
by a cooling installation. Therefore it is important to avoid heat-influx as far
as possible.
Two types of heat-influx from the outside environment can be distinguished:
1. Directly, through (walls and) roof.
2. Increased air intake temperature due to elevated roof temperature.
Reduction of heat-influx from the outside environment therefore merits due
attention, generally by one of three methods:
increased reflectance of sunlight;
green roofs and shading;
increased insulation.
These aspects are further discussed in Section 6.3.

34 May 2013 3.958.1 - Investigation of techniques for energy-efficient new-build data centres

35 May 2013 3.958.1 - Investigation of techniques for energy-efficient new-build data centres
3 Variants for energy-efficient cooling
Based on the results of the literature study in the preceding chapter, in this
chapter a number of energy-efficient variants are presented for three typical
data centre size classes. In addition to the energy-efficient variants,
a reference design for each DC size class has also been composed, reflecting
state-of-the-art conventional data centre design. The energy efficiency and
financial performance of the variants are compared with the references.
3.1 Variants considered
We discern four groups of energy efficient cooling variants.
3.1.1 Variant 1: Open cooling systems: supplemented directly with filtered outside air In open cooling systems, the cold outside air is directly vented to the data
centre through a microfilter without any intermediate heat transfer medium.
This results in the lowest air speeds and makes optimum use of natural
convection. It also allows a large share of free cooling.
The disadvantages are that moisture control is difficult and that there is a
direct impact on fire extinguishing systems. Also, if the outside air is polluted,
cooling may be impacted. These variants are therefore not necessarily usable
for the higher-TIER classifications.
There are two subvariants:
1a: Supported partially with adiabatic cooling or other evaporative assisted
techniques.
1b: Supported partially with phase change cooling/heat storage (PCM).
A key aspect of these designs is that the hot air section is on the outside
walls/roof, limiting the impact of hot roofs.
Figure 12 Schematic depiction of heat flows in the direct cooling variants
Microfilter
'Warm' air vented outside
Outside air inlet
Assistive cooling:1a: adiabatic
ITIT
1b: Phase change cold storage
'Cold' air to cold aisle

36 May 2013 3.958.1 - Investigation of techniques for energy-efficient new-build data centres
Examples of Subvariant 1a include: Smart DC Rotterdam and ColoCenter
Zoetermeer (Agentschap NL, 2011).
Variants 1a:
Open cooling system, supplemented directly with filtered outside air,
supported partially with evaporative assist/adiabatic. This system is a total
cooling solution including:
air treatment with air filters;
air transport with direct application of air to cold alleys
fans are frequency regulated; low-speed ventilation concept; fan speed
can be reduced to 15% of rated rpm;
adiabatic cooling system as additional cooling system for hot periods,
OR the system includes a full backup compression cooling system that can
also be partially utilized (latter part not in cost figures).
In one variant, the system is a complete cooling solution, includes the cost of
compartmented alleys.
Variants 1b:
Generally the same as 1a, but expanded with PCM cold storage as an extra
assurance for bridging unexceptionally hot and humid days.
This variant includes:
air treatment with air filters;
air transport with direct application of air to cold alleys;
fans are frequency regulated; low-speed ventilation concept; fan speed
can be reduced to 40% of rated rpm;
adiabatic cooling system as additional cooling system for hot periods, AND
phase change cold storage material that can bridge the hottest periods.
3.1.2 Variant 2: Closed cooling systems: indirect free cooling with an outside air/inside air heat exchanger In these variants the cooling is indirect, i.e. there is heat exchange between
different air streams. This can be achieved using a rotating ‘heat wheel’ heat
exchanger, or using cross-flow or counter-current air/air heat exchangers.
The advantage is that there is no intermediate heat transfer medium (fluid)
and thus no leaks or other complexities. The disadvantage is that the air
speeds through the air-air heat exchangers are comparatively high and thus
involve energy losses.
There are two subvariants:
2a: Air/air heat exchange, supported partially with adiabatic cooling or
other evaporative techniques on the outside (see Figure 13).
2b: Air/air heat exchanger, supported partially with compression cooling in
the inside air section (see Figure 14).
Examples include The Datacenter Group in Amsterdam and Delft
(Subvariant 1a) and Rotterdam Internet Exchange in Rotterdam (Subvariant 2b)
(Agentschap NL, 2011).
37 May 2013 3.958.1 - Investigation of techniques for energy-efficient new-build data centres
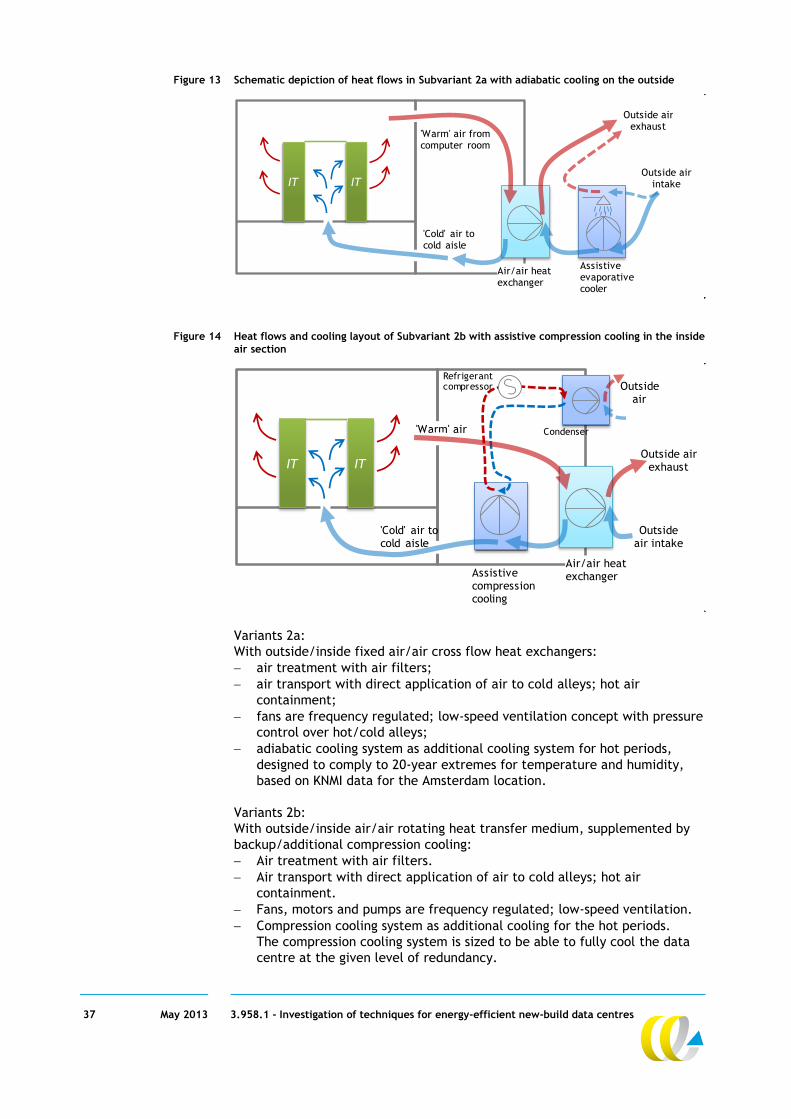
Figure 13 Schematic depiction of heat flows in Subvariant 2a with adiabatic cooling on the outside
Figure 14 Heat flows and cooling layout of Subvariant 2b with assistive compression cooling in the inside
air section
Variants 2a:
With outside/inside fixed air/air cross flow heat exchangers:
air treatment with air filters;
air transport with direct application of air to cold alleys; hot air
containment;
fans are frequency regulated; low-speed ventilation concept with pressure
control over hot/cold alleys;
adiabatic cooling system as additional cooling system for hot periods,
designed to comply to 20-year extremes for temperature and humidity,
based on KNMI data for the Amsterdam location.
Variants 2b:
With outside/inside air/air rotating heat transfer medium, supplemented by
backup/additional compression cooling:
Air treatment with air filters.
Air transport with direct application of air to cold alleys; hot air
containment.
Fans, motors and pumps are frequency regulated; low-speed ventilation.
Compression cooling system as additional cooling for the hot periods.
The compression cooling system is sized to be able to fully cool the data
centre at the given level of redundancy.
'Warm' air from computer room
'Cold' air to cold aisle
Outside air exhaust
Air/air heat exchanger
Assistive evaporative cooler
Outside air intakeITIT
'Warm' air
'Cold' air to cold aisle
Assistive compression cooling
Air/air heat exchanger
ITITOutside air
exhaust
Outside air intake
Refrigerant compressor Outside
air
Condenser

38 May 2013 3.958.1 - Investigation of techniques for energy-efficient new-build data centres
3.1.3 Variant 3: Closed cooling systems; indirect free cooling with fluid-based thermal transport In this variant, illustrated in Figure 15, a fluid cold transport medium is used
to transfer cold from the outside to air handling units installed close to the
IT equipment/heat loads. The warm air in the computer room is vented along
a heat exchanger where ‘cold’ air is made using a chilled water stream.
The warmed up water then goes to a cold water plant where the heat is
vented to the air.
Various sources of cold can be used to make the chilled water: a wet cooler,
a hybrid dry cooler or a natural source of cold (deep lake or groundwater).
The cooling lay-out is depicted schematically in Figure 15 for the case of the
hybrid dry cooler.
All these options are highly efficient provided large shares of free cooling are
used. Additional cooling, using a compression cooling unit, for example, can be
limited to several dozen hours a year.
In this study the option with a hybrid cooling tower has been investigated in
further detail. This variant is very well comparable to the reference, only the
free cooling system is different. The compression cooling system acts as
additional cooling system for the hot periods. In the variant fans, motors and
pumps are frequency regulated.
Figure 15 Heat flows and cooling layout of Variant 3
3.1.4 Variant 4: Making use of waste heat The above variants are focused exclusively on the most energy-efficient
cooling systems, making maximum use of free cooling. However, these are
essentially systems designed to throw away the heat energy as efficiently as
possible. We now consider several variants in which this heat is usefully
recovered so that primary heating energy is saved.
In these designs the main aim is to capture as much useful heat as possible and
then cool the remainder as efficiently as possible. The captured heat can be
supplied to other users; if no such users are available nearby, these variants
will not be feasible.
There are two subvariants:
4a: Direct or indirect use of warm air.
4b: Cooling with a heat/cold storage buffer, using a heat pump to create
sufficient heat and cold quality.
'Warm' water
'Cold' water
'Warm' air
Computer room air handling unit
Outside air exhaust
Outside air intake
ITIT
'Cold' air to cold aisle
Hybrid dry cooler
(Assistive compression
cooling)

39 May 2013 3.958.1 - Investigation of techniques for energy-efficient new-build data centres
The first Subvariant, 4a, can be either a closed or an open system; the closed
system is depicted in Figure 16.
The second Subvariant, 4b, is a closed cooling system using cold from a
heat/cold storage buffer. This variant is depicted in Figure 17. For small
environments this can be a couple of water tanks, while for larger variants this
will generally be two underground water bodies containing the hot and cold
water. A heat pump is used to increase the quality of the heat.
Two examples of Subvariant 4b are already operational in the Netherlands:
With permanent heat recovery (University of Groningen);
With partial heat recovery and free cooling the rest of the year
(e.g. Equinix AMS3 and Triodos). In wintertime the data centre operates
using free cooling and the utility building (where there is a demand for
heat) is heated using the heat/cold storage buffer. In summertime,
the heat/cold storage is regenerated using the data centre heat.
Figure 16 Heat flows and cooling layout of Subvariant 4a for an open system. When heat demand is low,
heat is vented to atmosphere
Figure 17 Heat flows of Subvariant 4b. In wintertime the data centre is cooled with free cooling via the
atmosphere and the cold reservoir is regenerated
The feasibility of the last three Subvariants, 3c, 4a and 4b, depends very much
on the surroundings. Both the geological situation (for hot/cold storage) and
the existence of substantial heat demand are requirements.
'Warm' air
Data centre
External customer
Data centre
External customer
Cold reservoir
Warm reservoir
Free cooling

40 May 2013 3.958.1 - Investigation of techniques for energy-efficient new-build data centres
3.2 References
The performance of the variants is compared to three references, representing
a typical small, medium-sized and large data centre. For small data centres:
0.25 MW, for medium-sized centres (0.5-5 MW): 3 MW, and for large centres
(> 5 MW): 8 MW. These references are based on the state-of-the-art of
recently built centres and in all cases use free cooling supported by
compression cooling. The reference cooling variants include a total cooling
concept consisting of chiller plants with a compression cooling system, heat is
given of by dry cooling towers.
Figure 18 Dry cooler
Cold is transported with a water/glycol mixture and delivery of cold to cooling
alleys via air handling units. All the references have the following measures in
place:
separation of warm and cold air streams;
variable-speed drives on fans, with pressure control wherever possible;
temperature and humidity ranges as per ASHRAE, tending towards the
warmer range (up to 27˚C);
all designs suitable for modular build;
diesel generators electrically heated (1 kW per 50kVA).
The main energy consuming devices are:
computer room air conditioning unit: fans, compressor (reference I);
air handling units: fans (reference 2, 3);
chiller plants: compressors (reference 2, 3);
cooling towers: fans;
water pumps.

41 May 2013 3.958.1 - Investigation of techniques for energy-efficient new-build data centres
The key data for the references are shown in Table 5.
Table 5 Typical data for references
Class Class I (0.1–0.5 MW) Class II (0.5-5 MW) Class III (> 5 MW)
User specifications
Electric power
(maximum ICT load,
at the UPS, at the
required level of
redundancy), in MW
0.25 3 8
Floor area available
for IT, in m2 (white
space)
300 2,000 4,000
TIER level 1 2 3
Redundancy N+1 N+1 (E and C) 2N; 90% max(E)
N+1 (C)
Degree of loading 70% 70% 50%
Technical specifications:
Discharge of heat Compression cooling
system, dry cooler
(2 channel), either
free or active cooling
Dry cooler, free
cooling gradually
possible
Dry cooler, free
cooling gradually
possible
% of the year free
cooling
70% 90% 95%
UPS Static Static Dynamic
References
Reference 1: Small data centre (250 kW)
Figure 19 Reference 1: Small data centre (250 kW)
In this reference the cooling is based on direct expansion downflow units
(split units), with water-cooled condensers and a dual-channel heat exchanger
for free cooling. The degree of free cooling is 70% of the year, corresponding
with those hours in the year when the temperature is below 15˚C (at De Bilt,
the Netherlands).
heatexchanger /
evaporator (2 channels)
condensor
IT
(Humidifyer)
Fan
dry coolingtower
compressor
water pump
Computer room A/C unit (CRAC)
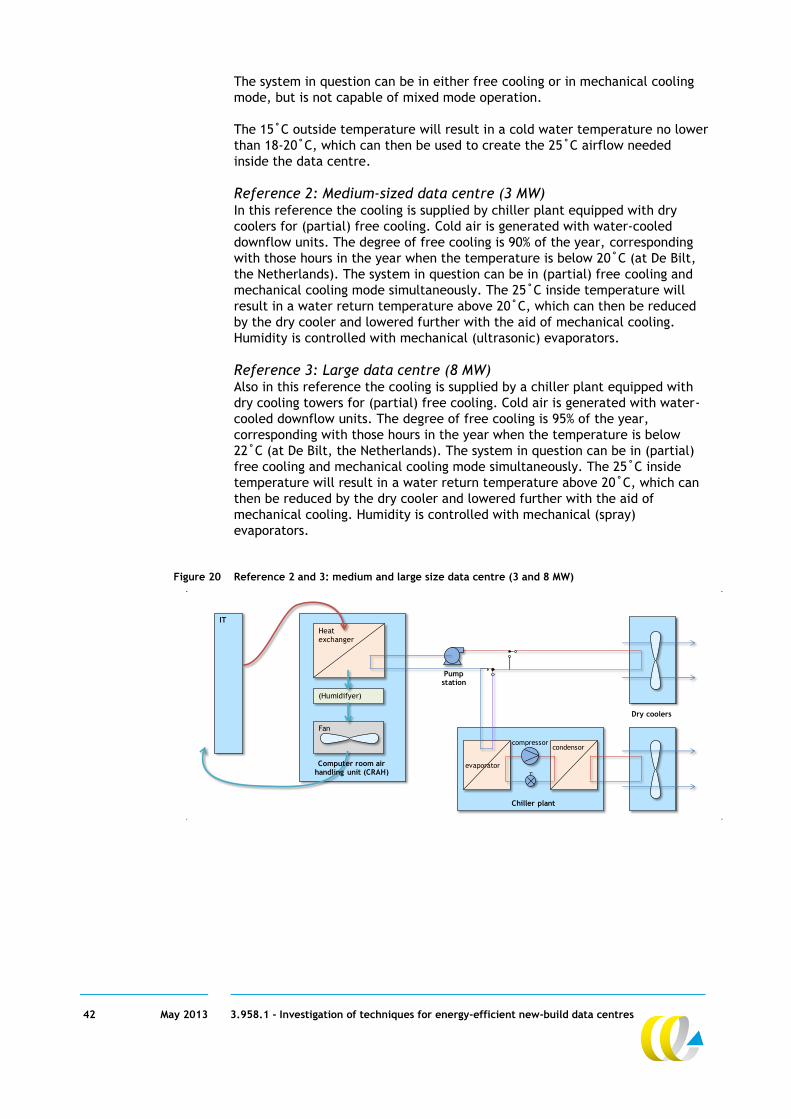
42 May 2013 3.958.1 - Investigation of techniques for energy-efficient new-build data centres
The system in question can be in either free cooling or in mechanical cooling
mode, but is not capable of mixed mode operation.
The 15˚C outside temperature will result in a cold water temperature no lower
than 18-20˚C, which can then be used to create the 25˚C airflow needed
inside the data centre.
Reference 2: Medium-sized data centre (3 MW) In this reference the cooling is supplied by chiller plant equipped with dry
coolers for (partial) free cooling. Cold air is generated with water-cooled
downflow units. The degree of free cooling is 90% of the year, corresponding
with those hours in the year when the temperature is below 20˚C (at De Bilt,
the Netherlands). The system in question can be in (partial) free cooling and
mechanical cooling mode simultaneously. The 25˚C inside temperature will
result in a water return temperature above 20˚C, which can then be reduced
by the dry cooler and lowered further with the aid of mechanical cooling.
Humidity is controlled with mechanical (ultrasonic) evaporators.
Reference 3: Large data centre (8 MW) Also in this reference the cooling is supplied by a chiller plant equipped with
dry cooling towers for (partial) free cooling. Cold air is generated with water-
cooled downflow units. The degree of free cooling is 95% of the year,
corresponding with those hours in the year when the temperature is below
22˚C (at De Bilt, the Netherlands). The system in question can be in (partial)
free cooling and mechanical cooling mode simultaneously. The 25˚C inside
temperature will result in a water return temperature above 20˚C, which can
then be reduced by the dry cooler and lowered further with the aid of
mechanical cooling. Humidity is controlled with mechanical (spray)
evaporators.
Figure 20 Reference 2 and 3: medium and large size data centre (3 and 8 MW)
evaporator
Heatexchanger
condensor
IT
(Humidifyer)
Fan
compressor
Pump station
Computer room air handling unit (CRAH)
Chiller plant
Dry coolers

43 May 2013 3.958.1 - Investigation of techniques for energy-efficient new-build data centres
4 Model analysis of cooling variants
4.1 Introduction
Of the possible cooling variants described in the previous chapter, five were
evaluated quantitatively: 1a, 1b, 2a, 2b, 3. The main focus of this evaluation
was on investments and impact on energy consumption for three size classes of
data centres. The quantitative evaluation of energy performance included
such aspects as energy used for the cooling system and energy lost in power
conversion. The results were compared with those for the reference designs,
one for each data centre size class.
4.2 Approach
For this assessment the following approach was adopted:
1. As a first step, a selection of suppliers of technologies and solutions were
contacted to provide relevant data. The suppliers providing information
are listed in Table 6.
Table 6 Suppliers providing data on energy efficiency
Aspect Supplier
Air ventilation within data centre DataCenter Infra Solutions, Holland Ventilatie
Groep, APC, Stulz, Low Speed Ventilation
Datacentres
Efficient heat discharge from data centre DataCenter Infra Solutions; Ziggo (Tenzon);
Kyoto Cooling; RecAir; Jaeggi; APC; Stulz
Humidity control Recool
Efficient power supply (UPS) Piller, APC
Limiting heat-influx Nebiprofa, Optigroen
The suppliers were approached by means of a questionnaire followed by a
telephone interview. A wealth of information was received for the cooling
variants 1a, 1b, 2a, 2b and 3. In some cases certain data from the EnergyGo
study could also be used. From the interviews with the suppliers new insights
emerged. Where relevant, these insights will be detailed later in this report
(Section 4.3).
1. Based on the interviews, the specific data provided by suppliers were
adjusted to match the three classes in the model.
2. Using the model, the total investments and energy use of each of the
variants as well as the references were calculated. This was carried out for
two loading factors (average and maximum). Further information on the
model is provided in Section 4.4.

44 May 2013 3.958.1 - Investigation of techniques for energy-efficient new-build data centres
3. Validation of calculation model results was carried out by sending the
results to suppliers as well as data centre operators, asking for feedback.
For each variant and reference, appropriate operators were approached.
Results were also checked by data centres participating in the expert
advisory group (‘klankbordgroep’). Certain data centres were unwilling to
validate data, mainly because of time constraints and concerns regarding
confidentiality. However, five data centres did respond. In general,
the response showed that experiences at data centres were in line with
the modelled results reported, with centres indicating that calculated
values for investments in cooling matched their own experience within
a range of 10%. For the UPS larger differences were reported. However,
these did not impact on the modelling results, as the model used largely
the same UPS configurations for both the reference and variants.
4. Depending on the information received in the validation step, the
calculation model was adjusted accordingly. This ‘tweaked’ model yielded
the data on investments and energy use reported below. Based on the
differences in investments and energy use between the variants and the
references, the pay-back times of the variants were calculated.
These modelling results are reported in Section 4.5.
The steps are illustrated in Figure 21.
Figure 21 Approach for quantitative evaluation of variants
Data from suppliers of specific energy-efficient techniques
(costs of equipment, specific energy use)
Draft results of model-calculations:
Investments and energy use of each variant and reference
Validation of model-results
at suppliers
Results of model-calculations. For each variant:
- Investments
- Energy-use (EUE)
- Pay-back time vs. reference
Adjustment of data towards specified
classes (0.25, 3 and 8 MW)
If needed: adjustment of input-data in
model
Validation of model-results
at users of datacentres/
sounding-board group
Model calculations for each variant and
references (3 classes, 2 loadingfactors)
45 May 2013 3.958.1 - Investigation of techniques for energy-efficient new-build data centres
4.3 Insights from suppliers and data centre operators
Cooling For the five cooling variants the suppliers were asked to detail their solutions
in terms of energy performance and purchase costs. From the material
provided, subsequent discussions and the information offered by data centre
operators a number of key conclusions and surprising results emerge.
In this section these are described.
Key insights for cooling systems:
a number of excellent energy-efficient cooling options exist, both
compressor-less and with assistive compressor cooling;
a number of suppliers are able to supply both efficient and non-efficient
products;
direct air/air heat exchange configurations are cheap to purchase and very
energy-efficient.
Power supply (UPS) The design variants considered in this study employ both static and dynamic
UPS systems. In both cases high-efficiency models are today available.
Specific information was received from two of the main suppliers: Piller, APC.
Our calculation model uses efficiencies typical for state-of-the-art equipment.
These are further outlined in Section 6.1.3. In Section 4.4.5 we report the
loading factors used in the model. We have not calculated with ‘eco-mode
operation’ but with real ‘double conversion’ efficiency values at the load
values used in the study, according to the discussion in Section 6.1.3.
4.4 Calculation model of techniques
To evaluate the energetic performance of the energy-efficient data centre
variants compared with the references, a modelling approach was adopted,
with performance and efficiency being modelled under different degrees of
data centre loading using the technical parameters of the respective
references and variants. The latter are related to the installation cost of the
variants and references.
4.4.1 Modelling energetic aspects of data centre efficiency Aggregate data centre energetic performance depends on the following
factors:
loading of fans and air handling units: energetic efficiency generally
improves strongly as loading declines;
loading of pumps and certain motors: energetic efficiency is generally
constant, with power uptake responding linearly to load;
power supply systems: energetic efficiency decreases with lower loading
(different efficiency curves for different systems).
To calculate overall data centre energy efficiency, the performance
coefficients were varied per unit depending on loading. To establish the
loadings of individual units in the model, the total data centre loading was
used.

46 May 2013 3.958.1 - Investigation of techniques for energy-efficient new-build data centres
EUE Energy efficiency was calculated as an annual average EUE incorporating both
cooling and power supply systems. The energy use by ‘other’ equipment
(offices, lighting) was not included7, 8. This is illustrated in Figure 22.
In the model, the EUE is the total energy use for UPS system, climate system
and ICT divided by the energy use for the ICT, (A1 + A29 - D)/ B.
Figure 22 Calculation of the EUE. In the model the EUE is calculated as (A1 + A2 – D)/ B
As already mentioned, suppliers were contacted to provide the technical
details required and the results validated with both suppliers and operators.
Aspects not included in the model The following aspects were not included in the model:
any data centre power use unrelated to ICT or temperature control
systems, e.g. power for lighting, powering office spaces, smoke detection
systems, other control systems on generator/UPS output, etc.;
water use;
diesel fuel use for aggregate.
Inclusion of the energy use by these other energy consumers would result in
slightly higher EUEs. Assuming that the share of ‘other equipment’ in the total
energy consumption is less than 1%, the effect on the EUE will be less than
0.02.
Two scenarios for loading degree The data centre variants were evaluated for two scenarios of loading degrees:
average and maximum.
Average loading: This represents a realistically high degree of data centre
loading: 70% of power draw for class I and II and 50% for class III.
Taking into account the redundancies in the different classes, this results
in a loading of the UPS system 47, 56 and 22%, respectively for class I, II
and III. Note that for size class III (8 MW), the TIER-3 classification requires
a sizing of the UPS so that at 100% power drawn there is still 10% headroom
to draw extra power. This means that with this size class, UPSs are
generally at a somewhat lower loading than for size classes I and II.
For the cooling the resulting loading degree is 58% for class I and II, and
42% for class III.
7 In comparison, the definition by Stichting Milieukeur (SMK, 2012) includes the energy use for
‘other equipment’ in the calculation of the EUE.
8 The same applies for the use of diesel for the aggregate.
9 Minus the energy-use for the diesel.
Transformer
Diesel
generator
Switch
gearUPS-systemPower delivery
Climate
systemChillers, fans, etc.
ICT/
Server racks
Other (lighting,
offices, etc.)
C1
B
A2
A1
D
Electr. heating

47 May 2013 3.958.1 - Investigation of techniques for energy-efficient new-build data centres
Maximum loading: This represents 100% power draw of nominal rated UPS
output (at given redundancy levels).
This results in a loading degree of the UPS system of 67, 80 and 44% for
respectively class I, II and III.
For the cooling system the loading degree is 83% in all classes.
The degrees are summarized in Table 7.
Table 7 Loading degrees for scenario of average and maximum loading
Size class of Data centre
I (250 kW) II (3 MW) III (8 MW)
UPS (electricity supply)
Reduncancy N+1 N+1 2N
Maximum load 0.67 0.80 0.44
Average load 0.47 0.56 0.22
Cooling
Reduncancy N+1 N+1 N+1
Maximum load 0.83 0.83 0.83
Average load 0.58 0.58 0.42
4.4.2 Investment costs The model includes the installation costs of the heat removal/cooling systems
and the power supply (UPS) systems. The model covers all key costs that differ
between the references and the energy-efficient variants.
For the references, the investments costs covered include the cost of UPS
systems, air handling units, chiller plants (compression cooling system),
cooling towers, water pumps and piping.
For the energy-efficient variants, we asked the suppliers to supply complete
cost estimates covering the equivalent cooling function. In many cases they
responded with complete overviews of costs. Sometimes the data provided by
suppliers even included an assessment of the relative return on investment
vis-à-vis a reference lay-out.
Not incorporated in the calculations are investments cost components that will
be shared in all cases (variants and references). These include such cost
components as the data centre building, mains/medium-voltage transformer,
power delivery units, electrical cabling and wiring, fire extinguishing systems
and so on. These costs are not anticipated to differ significantly between the
references and energy-efficient variants10.
The cost figures employed are based on supplier figures that were cross-
checked with both data centre operators and the expert advisory group.
Where new information was received from operators or experts, this was used
to update the cost-figure input to the model. The procedure adopted was that
if two or more data sources contradicted, the average was input to the model.
10 In the absence of a back-up compression cooling system, a number of electrical components
can be sized smaller. These include the transformer and power delivery system, and in the
case of rotary UPS, also the UPS. This can entail a cost advantage for the compression-free
variants. We have not quantified these aspects, so in this study identical electrical layouts
are assumed.

48 May 2013 3.958.1 - Investigation of techniques for energy-efficient new-build data centres
Two cost components are of particular note:
The cost of creating separate hot and cold aisles. These costs are not
included in any of the designs. However, one cooling variant (1a) is a ‘total
solution’ in which these costs are already included. To account for this,
in this variant, a cost figure of 160 €/rack was subtracted from the overall
installation cost of this variant.
The cost of a raised floor configuration. In all the energy-efficient cooling
variants (1a-b, 2a-b) the cooling solution has no need for a raised floor,
which can therefore in theory be omitted. However, as there may be other
reasons for installing a raised floor (equipment access, cabling, etc.),
we introduced no cost deductions for raised floors (typically € 80-100 per
square metre) in any of the variants.
Some of the cooling variants already incorporate costs for components (such as
closed compartments for hot/cold aisles) that would be required in other
variants. In these cases, the supplier figures were adjusted accordingly.
4.4.3 Power supply system Within each size class, the same power supply system is used in all the variants
as well as the reference. For size classes I and II the designs use a static UPS,
while for the largest of the size classes, III, a dynamic UPS is used.
Parameters for the power draw in the configurations, the lay-out of the power
supply system and the modularity are indicated in Table 8.
Table 8 Parameters of power supply systems, including modularity and installation costs
Class I Class II Class III
Used for References
and variants
References
and variants
References
and variants
For IT output level at required
redundancy level
kW 250 3,000 8,000
Dynamic UPS also drives air
handling units, additional power
requirement
kW 1,338
Total required apparent power kVA 310 3,750 11,700
Unit size (modularity) kVA 200 300 1,600
Type of UPS Static Static Dynamic
Number of units non-redundant 2 13 8
Number of units redundant 1 4 9
Total number of units 3 17 17
Total non-redundant capacity kVa 600 5,100 27,000
Cost price of all units
(excl. diesel generators)
€ 165,000 1,296,000 9,193,000
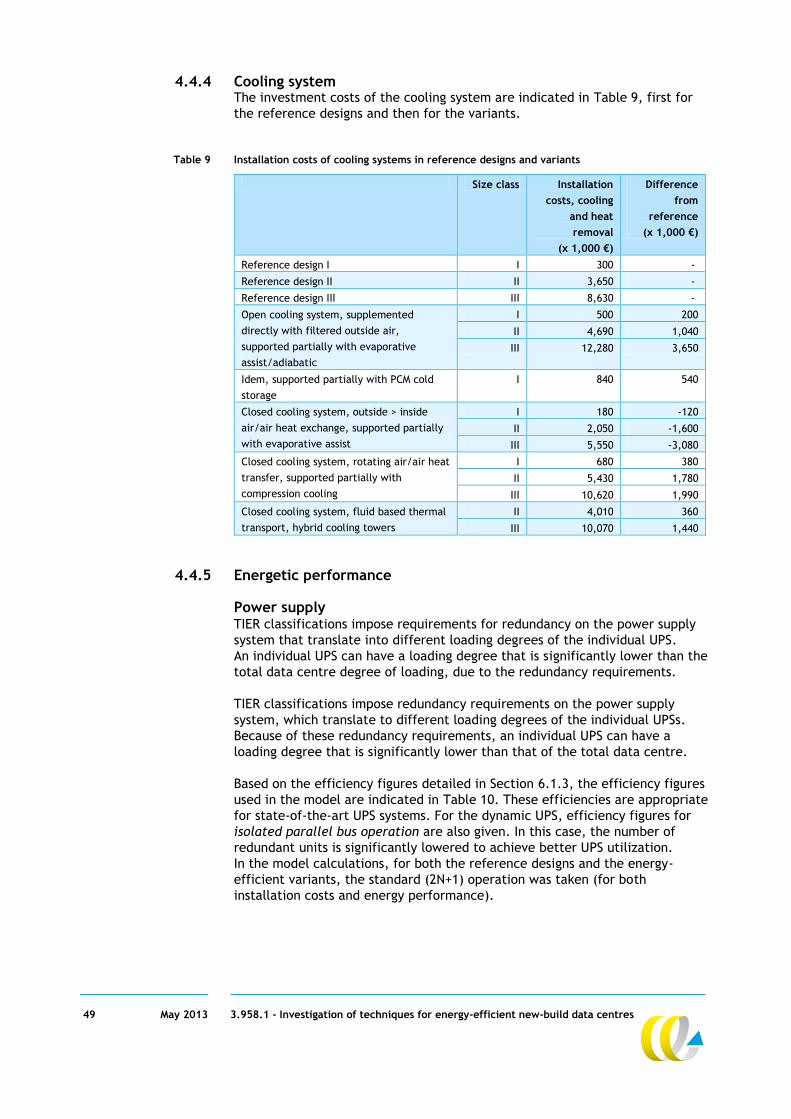
49 May 2013 3.958.1 - Investigation of techniques for energy-efficient new-build data centres
4.4.4 Cooling system The investment costs of the cooling system are indicated in Table 9, first for
the reference designs and then for the variants.
Table 9 Installation costs of cooling systems in reference designs and variants
Size class Installation
costs, cooling
and heat
removal
(x 1,000 €)
Difference
from
reference
(x 1,000 €)
Reference design I I 300 -
Reference design II II 3,650 -
Reference design III III 8,630 -
Open cooling system, supplemented
directly with filtered outside air,
supported partially with evaporative
assist/adiabatic
I 500 200
II 4,690 1,040
III 12,280 3,650
Idem, supported partially with PCM cold
storage
I 840 540
Closed cooling system, outside > inside
air/air heat exchange, supported partially
with evaporative assist
I 180 -120
II 2,050 -1,600
III 5,550 -3,080
Closed cooling system, rotating air/air heat
transfer, supported partially with
compression cooling
I 680 380
II 5,430 1,780
III 10,620 1,990
Closed cooling system, fluid based thermal
transport, hybrid cooling towers
II 4,010 360
III 10,070 1,440
4.4.5 Energetic performance
Power supply TIER classifications impose requirements for redundancy on the power supply
system that translate into different loading degrees of the individual UPS.
An individual UPS can have a loading degree that is significantly lower than the
total data centre degree of loading, due to the redundancy requirements.
TIER classifications impose redundancy requirements on the power supply
system, which translate to different loading degrees of the individual UPSs.
Because of these redundancy requirements, an individual UPS can have a
loading degree that is significantly lower than that of the total data centre.
Based on the efficiency figures detailed in Section 6.1.3, the efficiency figures
used in the model are indicated in Table 10. These efficiencies are appropriate
for state-of-the-art UPS systems. For the dynamic UPS, efficiency figures for
isolated parallel bus operation are also given. In this case, the number of
redundant units is significantly lowered to achieve better UPS utilization.
In the model calculations, for both the reference designs and the energy-
efficient variants, the standard (2N+1) operation was taken (for both
installation costs and energy performance).

50 May 2013 3.958.1 - Investigation of techniques for energy-efficient new-build data centres
Table 10 Efficiency parameters of UPS systems
Size class Class I Class II Class III
Average Loading degree IT 70% 70% 50% 50%
Redundancy power supply
(and nominal max.)
N+1, N=2 N+1, N=4 2N+1, N=8
max=90%
N+2, N=8
Isolated
parallel bus,
2N equiv.
Used for References,
variants
References,
variants
References,
variants
Variants
Loading degree of
UPS systems at
redundancy
Assumed 47% 56% 22% 40%
Maximum 67% 80% 44% 80%
Efficiency figures
Static
UPS
Unit
size
KVA 200 400
Assumed
loading
degree
94.4% 94.5%
Maximum
loading
degree
94.6% 94.6%
Dynamic
UPS
Unit
size
KVA 1,600
Assumed
loading
degree
88.3% 91%
Maximum
loading
degree
93.0% 95%
Degrees of loading of fans and pumps The model permits assessment of the energetic performance of the different
components at various loading degrees. In the model the following
assumptions were used:
the energy consumption of compressors and CW pumps varies linearly with
loading degree;
the energy consumption of air transport (fans) varies quadratically with
loading degree (the theoretic efficiency responds to the third power of the
load, but the quadratic model is more in accordance with what is observed
in practice).
For total cooling concepts where air transport is dominant, not all power
consumption conforms to quadratic decrease with declining load, with some
fraction of energy consumption (10-20% across the variants) either fixed or
varying linearly with load.
4.5 Results of model calculations
4.5.1 Investments Table 11 shows the investments (in M€) for the variants, for the three size
classes of data centres studied. The investments for the largest class are
relatively high, due to the assumed high TIER class of this type of data centre.
This results in high degree of redundancy for cooling equipment and electricity
supply, and thus higher investment costs. Variant 2a has relatively low
investments because of the abundance of compression cooling.

51 May 2013 3.958.1 - Investigation of techniques for energy-efficient new-build data centres
Table 11 Investments for variants and references
Data centre size class
0.25 MW 3 MW 8 MW
Reference 1 0.47
Reference 2 4.9
Reference 3 17.8
Variant 1a 0.67 6.0 21.5
Variant 1b 1.0
Variant 2a 0.35 3.3 14.7
Variant 2b 0.84 6.7 19.8
Variant 3 5.3 19.3
4.5.2 Energy efficiency Table 12 and Table 13 show the energy efficiency of the variants relative to
the references for scenarios of average and maximum loading. The efficiencies
are expressed as EUE.
Table 12 Energy efficiency of variants at average loading degree, expressed as EUE
Average load Data centre size class
Class I Class II Class III
Reference 1 1.25
Reference 2 1.21
Reference 3 1.25
Variant 1a 1.09 1.09 1.16
Variant 1b 1.11
Variant 2a 1.11 1.11 1.17
Variant 2b 1.12 1.11 1.17
Variant 3 1.13 1.19
Table 13 Energy efficiency of variants at maximum loading degree, expressed as EUE
Max. load Data centre size class
Class I Class II Class III
Reference 1 1.28
Reference 2 1.24
Reference 3 1.25
Variant 1a 1.10 1.09 1.11
Variant 1b 1.12
Variant 2a 1.13 1.13 1.15
Variant 2b 1.13 1.13 1.15
Variant 3 1.15 1.17
The results for average and maximum loading degree are comparable, with a
slightly lower EUE for the average case. This is due to the relatively lower
energy use of fans (as discussed in Section 5.4).
In all variants, and for each of the three size classes, the EUE is in a range
between 1.1 and 1.2. For the variants without compression cooling (1a, 1b and
2b) the EUE is slightly lower than for the variants with assisted compression
cooling (2b and 3). These differences are small, however. This is discussed
further in Section 5.3.

52 May 2013 3.958.1 - Investigation of techniques for energy-efficient new-build data centres
It may be noted, furthermore, that the energy use increases with data centre
size class. This is due to increased energy use for the electricity supply (UPS).
In the model the higher classes have a higher TIER level, which imposes
greater redundancy on the electricity supply. As a consequence the UPS
has a lower loading degree, resulting in a lower energy efficiency
(see Section 6.1.3).
4.5.3 Pay-back times
Calculation The pay-back times of the variants have been calculated relative to the
reference data centres. This was done using data on investments and annual
energy costs, using the following formula:
In the calculations an electricity price of 10 €ct/kWhe was assumed for the
small data centre (0.25 MW) and 7 €ct/kWhe for the middle-class (3 MW) and
large (8 MW) data centres.
The results show that pay-back times can be very long. This is due to the fact
that the investment costs are in most cases substantially greater than the
annual energy costs. In addition, the savings in annual energy costs are
relatively small since differences in EUEs between variants and references are
relatively small. For example: in the case of a EUE in the reference of 1.2 and
1.15 in the variant, the difference in total energy costs is only 4%. Also, the
energy prices are relatively low, especially for the two higher classes
(7 €ct/kWhe).
Sensitivity analysis While pay-back times can vary widely, it should be noted that uncertainty
ranges must be taken into account for both investments and energy use.
Both are based on data for techniques used in variants and references.
In practice these will vary depending on the data centre configuration in a
specific case. For this reason calculations have been carried out with a margin
of uncertainty of +/- 10% for both the variants and the references.
The combined effect is a +/- 20% variation for the difference in costs between
variant and reference. This variation reflects the uncertainties in investments
and energy use11.
Specific design aspects Furthermore, in a model analysis such as the one performed for this research,
it is not possible to include all technological details of all energy-efficient
options. Therefore, certain specific cost advantages or disadvantages of
variants vis-à-vis the references are not included (see also Section 4.4.2).
11 In the validation among suppliers and users of data centres the differences between proposed
EUE values and investment costs and responses were at most 10%.

53 May 2013 3.958.1 - Investigation of techniques for energy-efficient new-build data centres
We will give three examples of design aspects that were not quantified
because they are too specific.
Data centre raised floor. The model calculations are done without the
costs of raised floor, which is a necessary ingredient in cooling systems
with a liquid heat transfer step. In direct or indirect air/air cooling
variants, the raised floor is not required. In practice, data centres of these
layouts are observed which do have and which do not have the raised floor
configuration. We have not subtracted the cost of the raised floor in these
cases, as the raised floor may be desired for other reasons (e.g. cabling).
Typical amounts for this cost point are € 30,000/200,000/400,000 for the
three data centre size classes.
Compressor-free cooling variants (1a, 1b, 2a) impose lower power draw.
This could mean a saving on cost of electricity cabling, mains voltage
transformers, or in case of dynamic UPS also UPS systems. This is very
specific to actual data centre layout, but it could be up to 15%.
Costs of providing for separated hot/cold alleys. One supplier of Variant 1a
technology has a solution that already includes this cost component.
Because this cost component is not included in the other variants nor in
the references, in this case an adjustment was made to the cost figures:
the installation costs of this variant were reduced (with 163 €/rack, or
€ 20,000/130,000/260,000 for the three data centre size classes).
When deciding on data centre cooling technologies, detailed profitability
analysis of an energy-efficient design must be performed on a location specific
basis, involving the suppliers of energy-efficient technologies in the design.
The suppliers can in many cases give information which will enable very good
energy efficiency to be combined with low installation costs.
From the information received from the suppliers, it is expected that by
making actual design choices that are optimal for the efficient cooling
technology employed, actual additional installation costs may be limited to
only a couple of percentage points in the overall costs. Therefore, optimally
integrating technologies in the data centre design, the differences between
options can become small.
Detailed results Table 14 summarizes the calculated results. This table shows:
Energy prices used in the model, € 0.10/kWhe for class I, and € 0.07/ kWhe
for class II and III.
Investment costs:
Investments (in € 1,000) for both references and variants are shown, with a
specification for UPS and cooling systems, and the resulting total costs.
For the variants the extra costs relative to the reference are indicated.
It should be noted that in several cases (Variant 2a) extra costs are
negative, due to the fact that investment costs for the variant are lower
than for the reference.
Energy costs:
The yearly energy costs (in € 1,000) are given for both references and
variants. The costs are specified for the scenarios of average and maximum
loading, as described in Section 4.4.1.
For the variants the savings in energy costs relative to the reference are
indicated. In all cases the energy costs of the variants are lower than for
the reference. However, in most cases the savings in energy costs, are
relatively small compared to the extra investment costs.

54 May 2013 3.958.1 - Investigation of techniques for energy-efficient new-build data centres
Pay-back times:
From the investments and energy costs, simple pay-back times (in year)
are calculated, respectively for a scenario of average and maximum
loading.
In many cases the calculated pay-back times are very large, >> 10 years.
This is due to the large amount of extra investment costs vs. the savings in
yearly energy costs. For Variant 2a, the calculated pay-back time is 0,
indicating that compared to the reference, this variant is profitable from
the start of the operation of activities. This is due to the fact that both
investment costs and yearly energy costs of this variant are lower than for
the reference.
Sensitivity analysis:
The last column shows the results of the sensitivity analysis for the
calculated pay-back times.
The results show that also the uncertainties of the calculated pay-back
times are in many cases very large, >> 10 years. The presented results are
based on a variation of investments of both references and variants with
+/- 10%. This reflects the strong dependence of the calculated pay-back
times on investment costs.
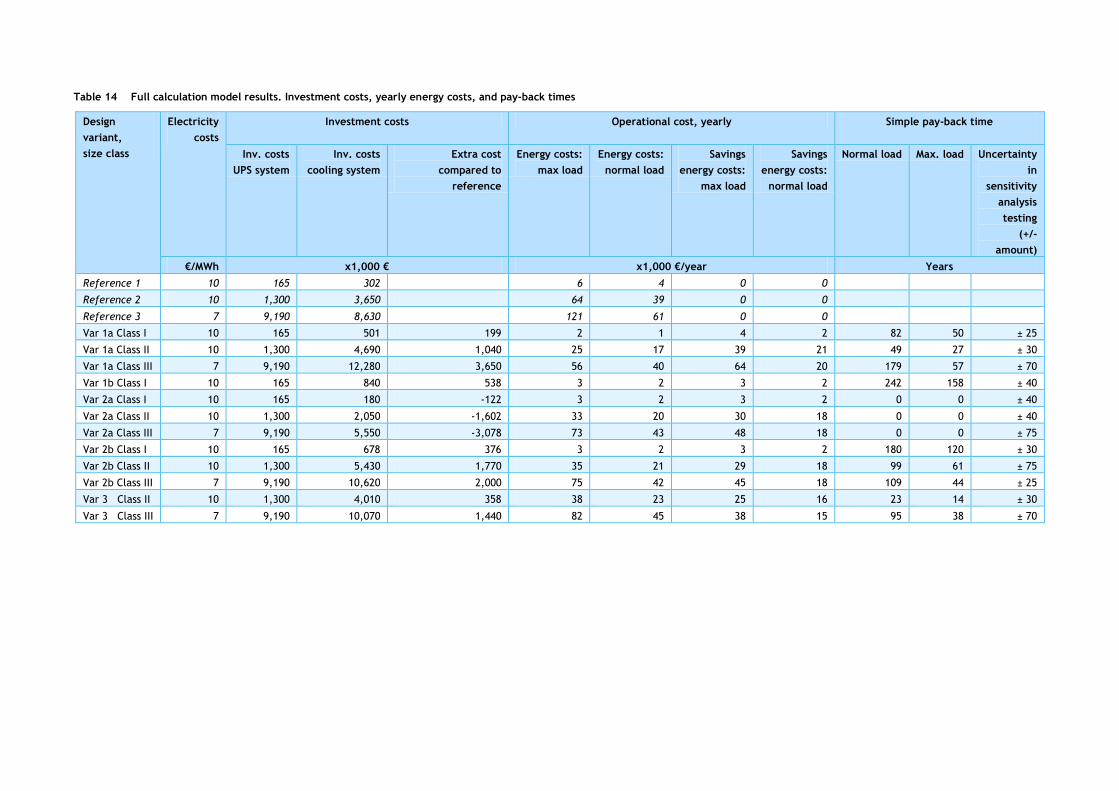
55 May 2013 3.958.1 - Investigation of techniques for energy-efficient new-build data centres
Table 14 Full calculation model results. Investment costs, yearly energy costs, and pay-back times
Design
variant,
size class
Electricity
costs
Investment costs Operational cost, yearly Simple pay-back time
Inv. costs
UPS system
Inv. costs
cooling system
Extra cost
compared to
reference
Energy costs:
max load
Energy costs:
normal load
Savings
energy costs:
max load
Savings
energy costs:
normal load
Normal load Max. load Uncertainty
in
sensitivity
analysis
testing
(+/-
amount)
€/MWh x1,000 € x1,000 €/year Years
Reference 1 10 165 302 6 4 0 0
Reference 2 10 1,300 3,650 64 39 0 0
Reference 3 7 9,190 8,630 121 61 0 0
Var 1a Class I 10 165 501 199 2 1 4 2 82 50 ± 25
Var 1a Class II 10 1,300 4,690 1,040 25 17 39 21 49 27 ± 30
Var 1a Class III 7 9,190 12,280 3,650 56 40 64 20 179 57 ± 70
Var 1b Class I 10 165 840 538 3 2 3 2 242 158 ± 40
Var 2a Class I 10 165 180 -122 3 2 3 2 0 0 ± 40
Var 2a Class II 10 1,300 2,050 -1,602 33 20 30 18 0 0 ± 40
Var 2a Class III 7 9,190 5,550 -3,078 73 43 48 18 0 0 ± 75
Var 2b Class I 10 165 678 376 3 2 3 2 180 120 ± 30
Var 2b Class II 10 1,300 5,430 1,770 35 21 29 18 99 61 ± 75
Var 2b Class III 7 9,190 10,620 2,000 75 42 45 18 109 44 ± 25
Var 3 Class II 10 1,300 4,010 358 38 23 25 16 23 14 ± 30
Var 3 Class III 7 9,190 10,070 1,440 82 45 38 15 95 38 ± 70

56 May 2013 3.958.1 - Investigation of techniques for energy-efficient new-build data centres
Aggregated results Taking into account the results of the sensitivity analysis, the aggregated
results are presented in Table 15 and Table 16. These show respectively the
results for a scenario of average and maximum loading.
This presentation of results in classes of pay-back times represents the
uncertainties in the model calculations.
Table 15 Aggregate results for pay-back times, for average loading (years)
Average load Data centre size class
Class I Class II Class III
Reference 1 -
Reference 2 -
Reference 3 -
Variant 1a > 10 > 5 ** > 10
Variant 1b > 10
Variant 2a < 0 < 0 < 0
Variant 2b > 10 > 10 >= 0 *
Variant 3 >= 0 * >= 0 *
* Results for these variants vary under sensitivity analysis testing.
** These variants can become < 10 under sensitivity analysis testing.
Table 16 Aggregate results for pay-back times, for maximum loading (years)
Max. load Data centre size class
Class I Class II Class III
Reference 1 -
Reference 2 -
Reference 3 -
Variant 1a > 10 > =10 > 10
Variant 1b > 10
Variant 2a < 0 < 0 < 0
Variant 2b > 10 > 10 >= 0 *
Variant 3 >= 0 * >= 0 *
* Results for these variants vary under sensitivity analysis testing.
** These variants can become < 10 under sensitivity analysis testing.
For all size classes, Variant 2a has a pay-back time of 0, meaning that it is
profitable, compared to the reference. This is due to the fact that in this
variant both investments and energy use are lower than in the reference
cases.
Within the uncertainty margins, Variants 1a (middle class), 2b (large class)
and 3 (middle and large class) may also have a pay-back time of less than
five years.

57 May 2013 3.958.1 - Investigation of techniques for energy-efficient new-build data centres
5 Evaluation of energy-efficient cooling techniques
5.1 General principles
This study has shown that with proper application of modern techniques highly
efficient data centres can be built and run. Achievement of this result in
practice, however, is highly contingent on observance of two basic operating
principles and a single guiding principle.
Operating principle 1: Utilize the entire ASHRAE allowed temperature and
humidity ranges
Every one of the techniques discussed above for cooling, direct and indirect air
cooling and free cooling operation of chiller plants can only be efficient as
long as the period available for free cooling use is close to 100%. To satisfy this
requirement, full use of the allowed temperature range is needed.
As discussed earlier, to prevent excessive energy use by IT equipment the
period of time at the highest temperatures should be minimized.
Operating principle 2: Right sizing and modular building
Every effort should be made to avoid very low utilization percentages in
critical components of the data centre facility infrastructure. In cooling
equipment, moderate underutilization leads to efficiency gains, a direct result
of the use of variable-speed drives. Care should be taken, however, to prevent
utilization percentages below the minimum drive speed of these components.
For UPS systems high utilization is to be preferred, and the data centre build
should accommodate for the possibility of modular energy infrastructure
components.
Guiding principle: Minimize total energy use
Minimizing total energy use would seem to be an open door when discussing
efficient data centres, but a danger lurks in the use of a single value, like EUE
or EUE , for characterizing data centre efficiency. Minimizing the data centre’s
energy use does not necessarily equal the pursuit of the lowest possible EUE
value.
Operating an energy-efficient data centre requires intimate knowledge of the
infrastructure and the skill to interpret the data obtained from meters located
at significant points in that infrastructure. In addition, the operational
boundaries of the equipment should be leading in determining the
environmental boundaries maintained inside the centre. Knowing these
boundaries, it is up to the data centre’s operator to find the most efficient
operating parameters within them. Contractual agreements with data centre
users stipulating temperature and humidity setpoints can severely hinder
efficient operation stipulating actual values in contracts is not only an obstacle
in current operation, it is also a handicap in maintaining or increasing current
efficiency, as operational boundaries for ICT equipment might change for
future generations of ICT products.
Whereas the model results show really good energy efficiencies for all
variants, true efficient performance has much to do with operational aspects:
choices made during day-to-day operation. Data centres operators that show
excellent understanding of the issues involved and take care in these matters
can achieve the high energy efficiencies in this study.

58 May 2013 3.958.1 - Investigation of techniques for energy-efficient new-build data centres
However, operation of data centres at low temperatures, high air speeds, low
utilization of UPS systems, mixing of heat/cold air due to insufficient
segregation of hot/cold air streams are issues that may cause worse EUE’s than
observed in this study, also for the most energy-efficient variants.
5.2 Operation within ASHRAE-recommended temperature range
The temperature and humidity settings chosen by operators play a crucial role
in controlling the data centre environment and therefore overall energy
consumption.
Traditionally (pre-2010) these settings where around 20˚C (measured in front
of the IT racks) combined with a humidity centred at 50% RH with a fairly
narrow margin of 10%. Maintaining these low temperatures requires substantial
cooling and results in a high energy use.12
According to the ASHRAE recommendations, temperatures should be in the
range of 18-27˚C and within a certain humidity range. These values are shown
in Figure 23. Operating a data centre within these limits creates considerably
greater scope for using ‘free cooling’ and more energy-efficient operation.
12 Several factors are cited as reasons for maintaining low temperatures:
1. Raising the temperature inside the cold corridor results in high temperatures in
the hot corridors. Based on a delta T over the IT equipment of 12°C, the high point in
the recommended range of 27°C results in a hot aisle temperature of 39°C. Prolonged
exposure to these temperatures is considered unpleasant.
2. Reliability of ICT equipment. In theory, higher temperatures can increase the risk of
equipment failure; in practice, however, the increase in component temperatures
is small and is, furthermore, largely compensated by the fans inside modern ICT
equipment, which increase (and decrease) the airflow to maintain critical
component temperatures at a fixed level. Modern ICT equipment carries a
manufacturer’s warranty that remains valid for cold aisle temperatures of up to
35°C.
3. Energy use of ICT equipment at higher temperatures. Given variable fan speeds,
the energy consumption of the ICT equipment (and subsequently data centre heat
load) will in fact rise at elevated temperatures. The difference in energy use can be
as great as 20%.
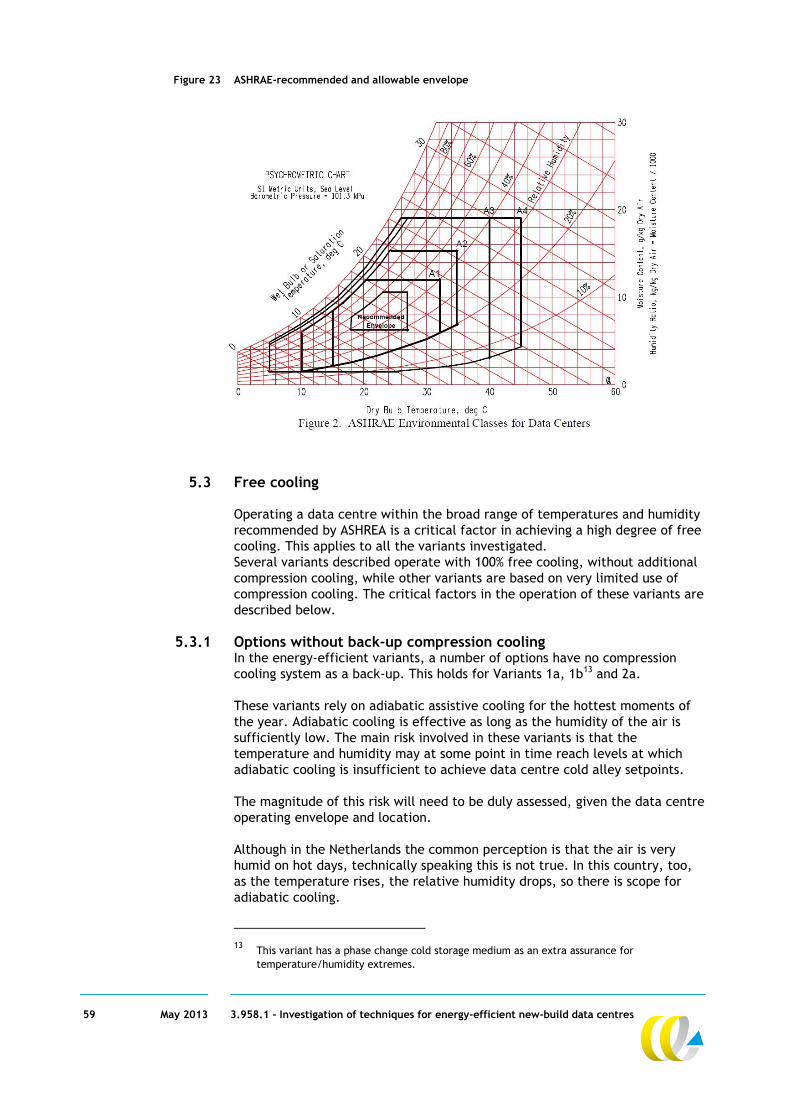
59 May 2013 3.958.1 - Investigation of techniques for energy-efficient new-build data centres
Figure 23 ASHRAE-recommended and allowable envelope
5.3 Free cooling
Operating a data centre within the broad range of temperatures and humidity
recommended by ASHREA is a critical factor in achieving a high degree of free
cooling. This applies to all the variants investigated.
Several variants described operate with 100% free cooling, without additional
compression cooling, while other variants are based on very limited use of
compression cooling. The critical factors in the operation of these variants are
described below.
5.3.1 Options without back-up compression cooling In the energy-efficient variants, a number of options have no compression
cooling system as a back-up. This holds for Variants 1a, 1b13 and 2a.
These variants rely on adiabatic assistive cooling for the hottest moments of
the year. Adiabatic cooling is effective as long as the humidity of the air is
sufficiently low. The main risk involved in these variants is that the
temperature and humidity may at some point in time reach levels at which
adiabatic cooling is insufficient to achieve data centre cold alley setpoints.
The magnitude of this risk will need to be duly assessed, given the data centre
operating envelope and location.
Although in the Netherlands the common perception is that the air is very
humid on hot days, technically speaking this is not true. In this country, too,
as the temperature rises, the relative humidity drops, so there is scope for
adiabatic cooling.
13 This variant has a phase change cold storage medium as an extra assurance for
temperature/humidity extremes.
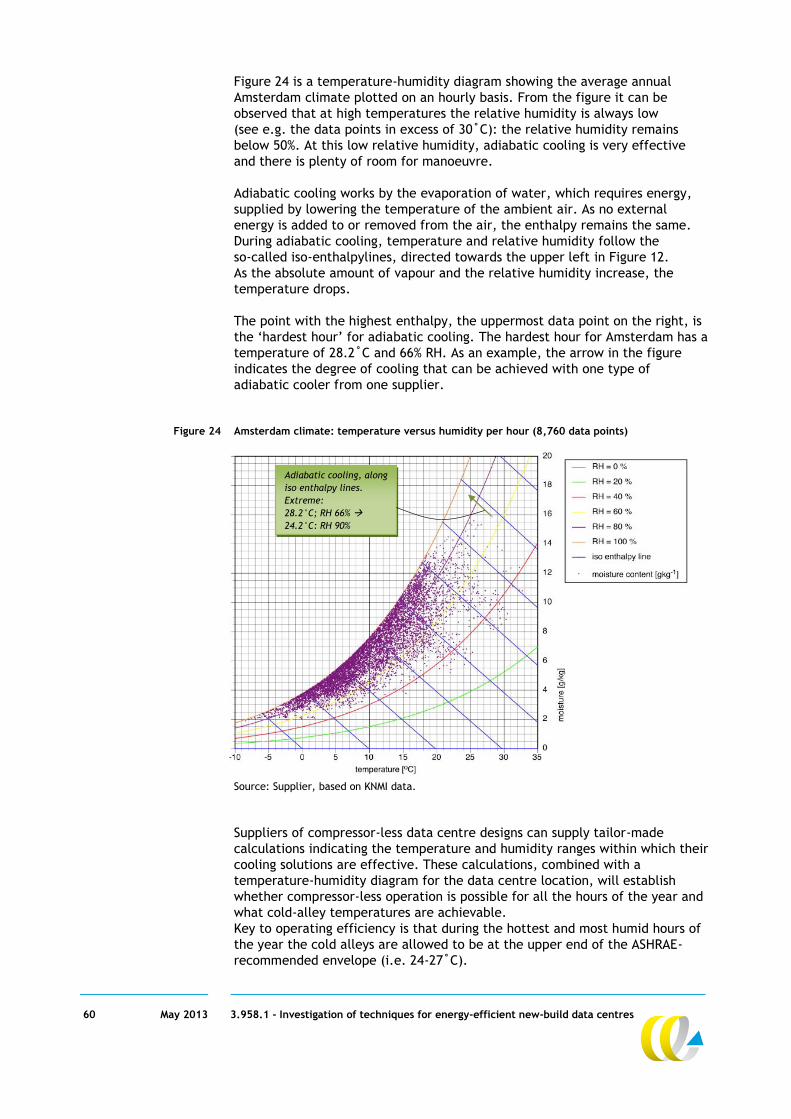
60 May 2013 3.958.1 - Investigation of techniques for energy-efficient new-build data centres
Figure 24 is a temperature-humidity diagram showing the average annual
Amsterdam climate plotted on an hourly basis. From the figure it can be
observed that at high temperatures the relative humidity is always low
(see e.g. the data points in excess of 30˚C): the relative humidity remains
below 50%. At this low relative humidity, adiabatic cooling is very effective
and there is plenty of room for manoeuvre.
Adiabatic cooling works by the evaporation of water, which requires energy,
supplied by lowering the temperature of the ambient air. As no external
energy is added to or removed from the air, the enthalpy remains the same.
During adiabatic cooling, temperature and relative humidity follow the
so-called iso-enthalpylines, directed towards the upper left in Figure 12.
As the absolute amount of vapour and the relative humidity increase, the
temperature drops.
The point with the highest enthalpy, the uppermost data point on the right, is
the ‘hardest hour’ for adiabatic cooling. The hardest hour for Amsterdam has a
temperature of 28.2˚C and 66% RH. As an example, the arrow in the figure
indicates the degree of cooling that can be achieved with one type of
adiabatic cooler from one supplier.
Figure 24 Amsterdam climate: temperature versus humidity per hour (8,760 data points)
Source: Supplier, based on KNMI data.
Suppliers of compressor-less data centre designs can supply tailor-made
calculations indicating the temperature and humidity ranges within which their
cooling solutions are effective. These calculations, combined with a
temperature-humidity diagram for the data centre location, will establish
whether compressor-less operation is possible for all the hours of the year and
what cold-alley temperatures are achievable.
Key to operating efficiency is that during the hottest and most humid hours of
the year the cold alleys are allowed to be at the upper end of the ASHRAE-
recommended envelope (i.e. 24-27˚C).
Adiabatic cooling, along
iso enthalpy lines.
Extreme:
28.2°C; RH 66%
24.2°C; RH 90%

61 May 2013 3.958.1 - Investigation of techniques for energy-efficient new-build data centres
Suppliers indicate that the nearer the location is to the North Sea coast or the
great lakes, the higher the relative humidity on hot days typically is relative to
more inland locations. Adiabatic-only variants are never a problem in the
eastern parts of the Netherlands, whereas in the western part the 10-year
extremes from the KNMI may show temperature and humidity extremes
requiring careful design choices and sizing of components. At a particular
location, the heat exchanger contact areas need to be dimensioned bigger to
be able to deal with temperature extremes compared to the case in the
eastern part of the country.
It is up to the customer and the supplier to negotiate a system tailor-made to
the particular location and cooling demand.
For this study, we asked suppliers to design systems that are able to function
in the Amsterdam location, where on hot days the temperature may approach
the upper range of the ASHRAE-recommended envelope (27˚C). The suppliers
contacted performed calculations for these parameters. One supplier
responded with a number of detailed design options, one suitable for the
eastern part, one for the western part of the Netherlands.
While (compressor-less) adiabatic cooling can be expected to be an effective
route at more inland European locations as well, this needs to be researched
for individual sites. Generally, the following rule of thumb holds: the higher
the temperature, the lower the relative humidity becomes, as the air can
contain more moisture in kg/m3. This leaves scope for adiabatic cooling.
5.3.2 Options with compression cooling Several variants, including 2b and 3, feature a compression cooling system as a
‘bridge’ for hotter moments. In these variants the compression cooling system
serves as a reassurance to customers that the temperature can be controlled
to any level, regardless of outside air temperature, including traditional
operating ranges such as 20˚C. Furthermore, variants with a liquid heat
transfer medium require assistive cooling earlier than open cooling variants or
indirect air/air heat exchanger variants.
The variants equipped with assistive/back-up compression cooling can be
operated in a very energy-efficient manner, though, if the number of hours of
operation of the compression cooling system is kept very low. If the
temperature in the cold alleys may rise to the higher end of the ASHRAE-
recommended envelope of 27˚C, the use of compression cooling systems can
be kept low, e.g. less than 100 per year for all Dutch locations.
A disadvantage of compression cooling layouts is installation cost. A full
backup cooling system needs to be installed with cabling, piping and
maintenance costs.
Variants equipped with compression cooling systems may have external chiller
plants and cooling towers and use a fluid heat transfer medium (water/glycol).
This adds up to a doubling of heat exchange steps compared with indirect
air/air cooling. The double heat exchange step means that, if the free cooling
needs to be achieved using the fluid system, the amount of free cooling in the
year is lower compared with alternatives.
ICT equipment energy use A disadvantage of being in the upper part of the ASHRAE operating envelope is
that the power consumption of the ICT equipment itself increases.
It is therefore not recommended to operate a data centre year-round at e.g.
24-27˚C; to economize on compressor use this should be done only on the
hottest hours of hot days. See also Section 5.1.

62 May 2013 3.958.1 - Investigation of techniques for energy-efficient new-build data centres
5.4 Efficient air transport within the data centre
Air separation (hot and cold aisles) Data centre cooling systems will operate more efficiently and longer in
economized mode when the hot and cold air streams remain fully separated
(see also the calculations in APC Whitepaper 130, Choosing Between Room,
Row and Rack-based Cooling for Data Centres).According to the EnergyGo
study on existing data centres, typical investments for creation of hot and cold
aisles are in the range of < € 1,500/kW.
Frequency control of fans/natural air movement In cases where a traditional Computer Room Air Handling (CRAH) system is
based on static speed fans, the need for variable-speed fans is apparent.
This is currently the standard in modern installations (Moehle, 2011;
Stulz, 2008). With these variable-speed drives, the lower the fan (air) speeds,
the more efficient these fans become.
This mechanism is illustrated in Figure 25, which plots the relationship
between the fan speed and power usage for CRAH fans. At 60% speed the
7.6 kW nominal power engine only uses 1.4 kW. The cooling capacity at
nominal power is 105 kW, while at 60% of fan speed the cooling capacity is
60 kW. The related performance coefficient (COP) improves from 13.8 to 43.
Figure 25 Relationship between CRAH fan speed and power usage
A reduction of airspeeds has a substantial effect on required fan power:
as a general rule, a reduction of airspeed by a factor 2 results in a reduction of
required power by a factor 8 (EnergyGo, Energy savings in existing data
centres). This can be further improved by combining the above insights:
the amount of cooling air needs to be regulated to match demand exactly,
and airspeeds should remain low and distances short. Part of this can be
achieved by means of full aisle containment (i.e. completely separated hot
and cold aisles) using pressure sensors. The temperature of the cold air and its
volume are then separated quantities that can be independently controlled
(ASHRAE Transactions, 2012).

63 May 2013 3.958.1 - Investigation of techniques for energy-efficient new-build data centres
6 Evaluation of other aspects of energy-efficient operation
6.1 Electricity supply (UPS)
A data centre’s energy supply system can be a substantial source of energy
loss. The main element of this system that determines the energetic
performance is the Uninterruptable Power Supply (UPS).
6.1.1 Components of power distribution systems The power distribution system of a data centre has three major components:
the UPS, the distribution system (bus-bar and/or wire) and the IT power
supply. The IT power supply falls outside the scope of this study.
UPS (Uninterruptible Power Supply) A UPS combines electronics for power quality control with a source of stored
energy to override any period of grid failure. In addition, many data centres
are equipped with a diesel generator to overcome longer periods of grid
failure, when the amount of energy stored would be insufficient.
Distribution wiring Distribution wiring has a linear load-to-loss ratio; efficiency at 100% load =
99%, efficiency at 50% load = 99.5%. Since many data centres operate with
redundant power distribution and below full load, typical loads on both UPS
and wiring are below 50% during normal operation.
Power supply in ICT equipment Although beyond the scope of the present study, it is interesting to note that
the power supplies in IT equipment have improved dramatically in recent last
years and now typically have approximately 93% efficiency at 50% load. Again,
these efficiencies drop under low load conditions, which are not uncommon in
modern IT systems, which therefore have oversized, redundant power
supplies.
6.1.2 Static and dynamic UPS systems There are two basic kinds of UPS layout: static and rotary (Section 2.6).
A rotary UPS is coupled to the motor/generator and generally combines
a flywheel. A static UPS is not attached to the generator system and may
consist of battery storage (with either double or delta power conversion
electronics) or flywheel energy storage.
6.1.3 Energy efficiency and loading factors Both types of UPS systems are a source of considerable losses when
significantly underutilized. Table 17 and Table 18 show typical efficiency
values for both static and rotary UPS at different loading degrees.
From these tables it can be seen that the conversion efficiency is strongly
dependent on the load factor, the share of rated UPS power output that is
actually drawn. Especially with dynamic UPS systems, when the load declines
to below 50%, the energy efficiency suffers.

64 May 2013 3.958.1 - Investigation of techniques for energy-efficient new-build data centres
Table 17 Typical data for static UPS efficiency (as used in the model), based on supplier information
Loading degree 125 kVA 200 kVA 300 kVA 400 kVA
25% 90.6% 92.6% 92.5% 94.2%
50% 93.7% 94.4% 94.4% 94.5%
75% 94.6% 94.6% 94.6% 94.6%
100% 94.7% 94.8% 94.8% 95.2%
Table 18 Typical data for dynamic UPS efficiency (as used in the model), based on supplier information
Loading degree 625 kVA 800 kVA 1,100 kVA 1,670 kVA 2,000 kVA 2,500 kVA
25% 82.1% 85.0% 86.6% 87.1% 87.6% 90.5%
50% 90.3% 91.8% 92.8% 93.0% 92.8% 94.5%
75% 93.0% 93.8% 94.5% 94.8% 94.3% 96.0%
100% 94.4% 94.6% 95.1% 95.7% 95.0% 96.4%
The effect of loading factors is further illustrated in Figure 26, which shows
the typical efficiency of a static UPS system.
Figure 26 Efficiency of UPS systems as a function of loading degree
Efficiencies are clearly low at low load levels. This situation is most acute in
high TIER level data centres where UPS systems are employed in a 2N
configuration with a limited maximum loading, even in a failure situation.
In these situations the maximum normal operation would lead to a 45% load on
any UPS, with loads below 25% very common in practice.
Static UPS systems – eco-mode A static UPS typically offers ‘eco-mode operation’. In this mode the double
conversion is bypassed, giving very high efficiency (about 99.5%).
According to the information provided by data centre operators, however,
this mode has practical limitations, and is not therefore used.
65 May 2013 3.958.1 - Investigation of techniques for energy-efficient new-build data centres
6.1.4 Achieving high efficiencies in UPS: the importance of modular building The efficiency of a UPS improves substantially with higher unit loading, which
can be increased by a higher overall loading degree, diminishing the number of
redundant units. However, the data centre loading degree and the redundancy
requirements imposed by the TIER classification have consequences for the
efficiency figures with which the static and dynamic UPS systems are
operated.
The unit loading degree can also be improved by matching the number of
operational units to the data centre’s overall filling degree, by adopting a
modular building design. In practice, such modular building is crucial for
achieving high-efficiency UPS systems, allowing equipment to function at good
utilization rates using individual UPS units.
Modern static UPS systems are often composed of modules representing 20 to
25% of the maximum capacity of the complete system. Care should however be
taken in employing the modular functionality of the systems. Since the power
distribution system that delivers the electrical power from the UPS to the data
centre floor is designed with a series of breakers that are designed for full-
load operations, the less than fully configured UPS system must be able to
deliver enough amperage in a short-circuit condition to be able to trip these
critical breakers.
For dynamic UPS systems a different solution is needed, because these systems
cannot be of modular build. The modularity in these cases must be provided by
the number of active units that supply power to the internal data centre grid.
Fortunately, dynamic UPS systems can be configured in a set-up known as
‘isolated parallel’. In this set-up true load-sharing and 2N-like redundancy is
obtained with less then 2N UPS systems.
6.2 Humidity control
Humidification can be a relevant source of energy use in a data centre.
The amount of humidification needed depends strongly on the ranges of
humidity accepted at the centre.
Over the past few years humidity control conditions have been relaxed in line
with publication of ASHRAE’s recommended environmental conditions for
Class A1 electronic equipment14.
The recommended humidity range is now 30 to 60% RH at 24˚C, or a in an
alternative, temperature-independent representation, a dew point between
5.5 and 15˚C. The range of recommended and maximum allowable values is
shown in Figure 3.
Humidification is a substantial design aspect and source of energy/water use
for open cooling configurations (Variants 1a and 1b). This is because in
wintertime the cold outside air contains less moisture.
All open cooling configurations have systems in place to recirculate as much
inside air as possible, limiting the amount of dry outside air that is let in to the
data centre. In the case of open cooling systems, the energy requirement of
humidification is incorporated in the energy figures supplied by the suppliers.
14 American Society of Heating, Refrigerating and Air-Conditioning Engineers, 2011: ASHRAE TC
9.9 2011 Thermal Guidelines for Data Processing Environments – Expanded Data Center
Classes and Usage Guidance.
66 May 2013 3.958.1 - Investigation of techniques for energy-efficient new-build data centres
In none of the closed cooling systems is humidification a substantial source of
data centre energy use. Although steam humidification is more energy-
intensive than mechanical (ultrafine spray) humidification, average annual
energy use is still very low because energy-efficient closed configurations
require very little humidification, given that no moisture is removed from the
data centre (no condensation air-handling units)
The most common method used for increasing humidity levels is to introduce
steam into the airflow. Steam generation is very energy-intensive, however,
and for this reason mechanical humidifiers, spray and ultrasonic, have been
introduced. At first glance, mechanical humidification appears to be almost
energy-free, but large-scale systems need rigorous water treatment, reverse
osmosis filter and UV irradiation to prevent the possibility of legionella
contamination. Drying (moisture removal) is an energy-intensive operation
because the latent heat stored in water vapour is released upon condensation
and adds to the data centre’s overall heat load.
Steam humidification can be simple and energy-effective on condition that
steam generation is kept to a minimum. This can be achieved by adopting
broad humidity ranges and flexible temperature settings inside the data
centre.
6.3 Limitation of heat-influx
6.3.1 Increasing reflectance of sunlight To assess the effect of direct influx we here assume a roof temperature of
70˚C and an inside temperature of 28˚C. At a roof insulation degree of
Rc=3.5 m2K/W (the standard under Dutch building regulations since April 2012)
heat-influx will be 11.5 W/m2. This heat is additional to the heat produced by
the IT equipment.
A cool roof needs not be white. The two basic characteristics that determine
the ‘coolness’ of a roof are solar reflectance (SR) and thermal emittance (TE).
Both properties are rated on a scale from 0 to 1, where 1 is the most reflective
or emissive (CRRC, 2012). A wide variety of colours is therefore available that
still maintain a high solar reflectance (www.coolroof.org).
If a roof reflects the sun’s heat and emits absorbed radiation back into the
atmosphere, it stays cooler and reduces the amount of heat transferred to the
building below, keeping the building at a cooler and more constant
temperature. According to a short literature study by Arcadis this can be
realised by painting the roof with a reflective white paint (Arcadis, 2012).
The main findings of the cited literature are as follows:
White roofs can reflect up to 85% of the sunlight falling on them and as a
result have lower average and lower peak temperatures.
Actual measured rooftop temperature values reported over different
periods in the year showed that during summer months the average
temperature remained 8˚C below the average temperature of dark roofs.
The maximum temperature of a dark roof exceeded 55˚C and the
maximum temperature of the white roof remained below 33˚C
(on a roof in June).

67 May 2013 3.958.1 - Investigation of techniques for energy-efficient new-build data centres
The effect of the white paint decreases over time due to pollution of the
roof (up to 20% decrease in effect per year).
In the first year the effect on the roof temperature is significant.
The effect in the longer term is disputed.
Roof temperature can thus be significantly lowered. A decrease in peak roof
temperature from 70 to 40˚C will reduce the additional heat load on the data
centre floor beneath that roof from 11.5 W/m2 to 3.3 W/m2.
However, the most important effect is the lowering of the temperature at the
air inlet of the coolers positioned on the roof. As mentioned above, on a sunny
day in June the temperature of a black roof exceeded 55˚C,while the
neighbouring white roof remained below 33˚C. This means that the air at the
air inlet on the black roof may have become too hot for use for free cooling
(even with evaporation assist), while the air at an air inlet on the white roof
would still be cool enough.
This information has been confirmed by experience with painting a data centre
roof with a reflecting paint, which resulted in a lower temperature at the air
inlet of the chillers 2 metres above the roof. The white paint led to an 8˚C
lower air temperature (Bonke, 2013). At this data centre this meant that
existing peak capacity was suddenly more than sufficient.
The additional costs of reflective roofing are 9-10 €/m2 for similar-quality
roofing. Placement of the material takes no longer; on the contrary, some
types of reflective roofing are even less laborious than conventional black
roofing. Besides reducing peak temperatures, reflective roofing has the
additional advantage that of reducing temperature differences over time.
This increases the life expectancy of the roofing material (IKO, 2013),
although it is not specified by how much longer.
6.3.2 Green roofs If the case of a so-called ‘green roof’, the vegetation is applied on top of a
regular roof. Today there are various different types of vegetation roofs on the
Dutch market. In the simplest category we can distinct two types:
economical roofs that can be applied on roofs that can bear 100 kg/m2
static weight;
light-weight roofs that that can be applied on roofs that can bear 50 kg/m2
static weight.
Some suppliers offer even lighter constructions, but there is then a risk of the
vegetation requiring additional irrigation during longer dry periods
(Optigroen, 2012).
These roofs have a water retention value of around 20 l/m2. Because of the
evaporation of water by the plants, temperatures on the roof remain under
30˚C in the temperate Dutch climate (Optigroen , 2013)15. Although this figure
derives from tests elsewhere and has not yet been scientifically confirmed for
the Dutch situation, it is consistent with experiments carried out in Japan
under far more severe circumstances (Takakura et al., 2000).
15 This value is from the practice of ‘roof vegetation gardeners’ (in Dutch: ‘Groendak
hoveniers’). The precise values and the dependence on type of roof is currently being studied
at the University of Wageningen as part of a project entitled: ‘Begroeide daken classificatie
implementatie technische eigenschappen’, Weblink: http://www.innovatie-
alliantie.nl/projectenbank/raak-project/981.html. In Germany there is also a very large-scale
research programme underway at the Frauernhofen Institute to investigate the effect of
vegetated roofs on indoor temperatures and dew points of the construction below.

68 May 2013 3.958.1 - Investigation of techniques for energy-efficient new-build data centres
This means that in the case of a green roof with water retention and an
insulation value of Rc =3.5 m2K/W there is no direct heat-influx and no
significant temperature increase of the air inlet. This means that free cooling
is possible during the whole year.
Another possibility is to combine a lighter type of green roof with solar panels:
the so-called Solar Greenroof. This combination brings out the best of both
types of system: solar panels work better on an cool roof, and roof vegetation
retains more water due to the shading provided by the solar panels
(optigroen.nl).
Financial aspects The financial aspects are determined by the ratio between costs and benefits.
The benefits of a green roof are high if the air intake of the free cooling
system is on the roof, for in that case a year-round roof temperature of below
30˚C is guaranteed, allowing for 100% free air cooling.
To quantify this benefit requires calculation of the cost of the additional
cooling system that would otherwise be required during periods when the roof
temperature is too high – for example, when the outside temperature exceeds
25˚C (158 hours per year in the Netherlands).
In the case of a flat roof surface of over 300 m2 the additional cost is around
25 €/m2for the economic roof and 30 €/m2 for the light-weight roof
(optigroen.nl). In addition, roof maintenance costs of 1.50-2.00 €/m2 per year
should be factored in, for:
cleaning the rainwater drain (should be done with normal types of roofs,
too);
removing weeds;
adding (specially coated) fertilizer.
The following aspects should be taken into account when assessing these costs:
the green roof has the advantage that it protects the roofing material
against UV radiation and temperature swings, extending the lifetime to
double the life expectancy without roof vegetation;
the water retention capacity16 may be of interest both to meet eventual
water retention requirements and because some city councils offer
subsidies in support of green roofs;
to prevent leaks, checking the rainwater drains should be done on a
regular basis on roofs with or without vegetation.
6.3.3 Insulation Insulation helps retain heat. Given the very considerable heat excess in data
centres, the amount of heat that needs to be removed from the building will
rise with the degree of insulation. At the same time, too little insulation brings
the risk of condensation inside the centre. When the temperature difference
between the inside walls and the ambient air temperature is large, only very
dry air will not condensate.
16 Water retention capacity is the delay in rainwater drainage after heavy showers.
Roof gardeners express this capacity as the ‘drainage coefficient’, the ratio between the
amount of rainwater drained within 15 minutes of an extreme shower (27 l/hour) and the
amount of water retained within the green roof. This value is 0.5 for the economic roof and
0.65 for the light-weight roof. The latter cannot retain as much water, since the sediment
layer is much less thick. The Dutch water authorities (Waterschappen) use different
parameters, however, and a study is therefore currently underway to align these different
ways of expressing water retention capacities.

69 May 2013 3.958.1 - Investigation of techniques for energy-efficient new-build data centres
In 1995 the minimum standard for roof insulation was set at Rc = 2.5 m2K/W.
In April 2012 this value was raised to 3.5 m2K/W and it is expected to raise to
5 m2K/W in 2015.
Roof insulation decreases the effect of direct heat-influx. For example,
the heat-influx at a roof temperature of 70˚C is 11.5 W/m2 at Rc = 3.5 m2K/W
and 8.55 W/m2 at Rc = 5 m2K/W. With a roof temperature of 40˚C the heat-
influx becomes 3.3W/m2 and 2.3 W/m2, respectively.
This does not prevent a temperature increase of the air intake due to elevated
roof temperature, however, and is therefore much less effective than the
other two measures.
6.4 Other energy use: lighting, offices, etc.
Apart from the main elements of energy consumption discussed above, data
centres will usually also consume minor quantities of energy for other
purposes, more or less typical for offices. Among other things these will
includes office lighting, heating and cooling as well as office equipment
(computers, copiers, etc.). According to a study by ECN (2008), the total
energy consumption of these sources can amount to 2% of total data centre
energy consumption.
For these applications a broad range of energy-efficient techniques exist.
These are listed in the NL Agency database ‘Energiebesparing en Winst’
http://www.infomil.nl/onderwerpen/duurzame/energie/energiebesparing
(sector ‘offices’). This database describes the main measures available,
including technical feasibility and typical pay-back times. The database is
intended for use by local governments in the context of environmental
inspections and permitting procedures.
These techniques are not further described in the present report.

70 May 2013 3.958.1 - Investigation of techniques for energy-efficient new-build data centres

71 May 2013 3.958.1 - Investigation of techniques for energy-efficient new-build data centres
7 Conclusions
General conclusions 1. The results of this study show that in new-build data centres a high level of
energy efficiency can be achieved, with EUEs lower than 1.2. Different
combinations of techniques are available for achieving these efficiencies.
A crucial factor in all variants is that a large amount of ‘free cooling’ is
used. As energy use for cooling purposes falls to low levels, energy use for
electricity supply becomes increasingly important. For this aspect a
modular building design is a crucial factor.
2. These high levels of energy efficiency can be achieved by implementing
the following measures:
data centre temperature levels according to the ASHRAE-recommended
maximum value of 27˚C;
maximum use of ‘free cooling’, typically > 98%;
cooling air inlet on a cool location of the building (i.e. not on a dark
roof);
segregated aisles within the building;
modular building of the data centre;
use of a UPS that allows for high energy efficiencies over a broad
range.
Cooling variants for energy-efficient data centres 3. Based on literature research, five combinations of energy-efficient cooling
techniques have been distinguished (Table 19). In general, these
techniques are based on making maximum use of the cold available in the
outside air, thereby avoiding the use of electricity for compression cooling.
Apart from these options, other options might also be possible.
Table 19 Variants for energy-efficient new-build data centres
General concept Variant
1 Open cooling systems 1a Supported by adiabatic cooling
1b Supported by phase change heat/cold storage
2 Closed cooling systems, air/air 2a Supported by adiabatic cooling
2b Supported by compression cooling
3 Closed cooling systems, air/fluid 3 Supported by hybrid cooling
4. In addition to these routes, which improve the energy efficiency of the
data centre itself, it is also possible to supply excess heat to external
consumers. This can be realised by direct use of warm air, or via a
heat/cold storage buffer.

72 May 2013 3.958.1 - Investigation of techniques for energy-efficient new-build data centres
5. With the various variants high levels of energy efficiency can be achieved,
with EUEs in a range between 1.1 and 1.15, as shown in Figure 27. For all
classes and with all variants EUEs remain well below 1.2. The results shown
apply for ‘average’ data centre loading. In the case of ‘maximum’ loading
the figures are comparable, with slightly higher EUEs. The differences
between the variants are relatively small. In comparison, the energy
efficiency of references are about 1.25.The references are based on
recently built data centres, with 70, 90 and 95% free cooling for the small,
medium and large data centre, respectively. The difference between the
variants and the references means that the non-IT energy consumption in
the variants is almost 50% lower than in the reference cases. The method
used for calculating the EUE is comparable to the SMK standard and
excludes the transformers.
Figure 27 Performance of energy-efficient variants for new-build data centres
6. The pay-back times of the variants (compared with the references) are
shown in Table 20. In all cases Variant 2a is profitable. This is due to the
relatively limited investments of this variant, which employs no
compression cooling. The economic performance of Variant 3b can be
similar to the reference, depending on the investments required for a
specific situation. This is also the case for Variant 2b in a large data
centre.
0.95
1
1.05
1.1
1.15
1.2
1.25
1.3
Small data centre (0.25 MW)
Medium data centre (3 MW)
Large data centre (8 MW)

73 May 2013 3.958.1 - Investigation of techniques for energy-efficient new-build data centres
Table 20 Pay-back times for energy-efficient cooling variants
Average load Data centre size class
Class I Class II Class III
Reference 1 -
Reference 2 -
Reference 3 -
Variant 1a > 10 >= 5 * > 10
Variant 1b > 10
Variant 2a < 0 < 0 < 0
Variant 2b > 10 > 10 >= 0 *
Variant 3 >= 0 * >= 0 *
* Results for these variants vary under sensitivity analysis testing.
It should be noted that in the model analysis not all technological details are
included. Examples are data centre raised floor, costs of electricity cabling
and mains voltage transformers lower and costs for separated hot/cold alleys.
By including these aspects in design choices actual additional installation costs
may be limited.
Temperature and humidity regulation: ASHRAE-recommended values 7. Operating a data centre within a broad range of temperatures and
humidity is a critical factor in achieving a high degree of free cooling.
This applies to all the variants investigated. The standard for applicable
temperatures and humidities was published in 2011 by ASHRAE (American
Society of Heating, Refrigerating and Air Conditioning Engineers).
According to this standard, temperatures should preferably lie between
18 and 27˚C, although the permissible range is even substantially larger.
The recommended and permissible values are shown in Figure 28.
Operating a data centre within the recommended limits considerably
enlarges the scope for use of ‘free cooling’ and energy-efficient operation.
Figure 28 ASHRAE-recommended and allowable envelope

74 May 2013 3.958.1 - Investigation of techniques for energy-efficient new-build data centres
Variants without back-up compression cooling 8. Several variants studied (1a, 1b, 2b) rely on adiabatic assistive cooling for
the hottest moments in the year and are not supported by compression
cooling. The main risk involved in these variants is that the temperature
and humidity will at some point in time be such that adiabatic cooling is
insufficient for achieving cold alley setpoints. Suppliers of data centre
designs that work compressor-less can supply tailor-made calculations
indicating the temperature and humidity ranges within which their
solutions are effective in data centre cooling. This, combined with a
temperature-humidity diagram for the specific location of the data centre,
will establish whether compressor-less operation is possible for all of the
hours of the year.
Variants with back-up compression cooling 9. The variants equipped with assistive/back-up compression cooling can also
be operated in a very energy-efficient manner, though, if the number of
hours of operation of the compression cooling system is kept very low.
If the temperature at which the cold alleys are allowed to move to the
higher part of the ASHRAE-recommended operating envelope of 27˚C,
then the need for compression cooling can be kept low. A typical value is
100 hours per year for all Dutch locations.
Efficient air transport within data centre 10. In addition to a large degree of ‘free cooling’, efficient air transport within
the data centre is another important factor in energy-efficient cooling.
The two main factors are:
Full air separation between hot and cold aisles
The cooling system of a data centre can operate more efficiently and
longer with ‘free cooling’ when hot and cold air streams in the data
centre remain fully separated.
Use of variable-speed fans
Variable-speed fans are currently the standard in modern installations.
With these fans, the lower the fan (air) speeds, the more efficient
these fans become. This mechanism is illustrated in Figure 29, showing
a typical relationship between fan power and speed.
Figure 29 Relationship between CRAH fan speed and power usage
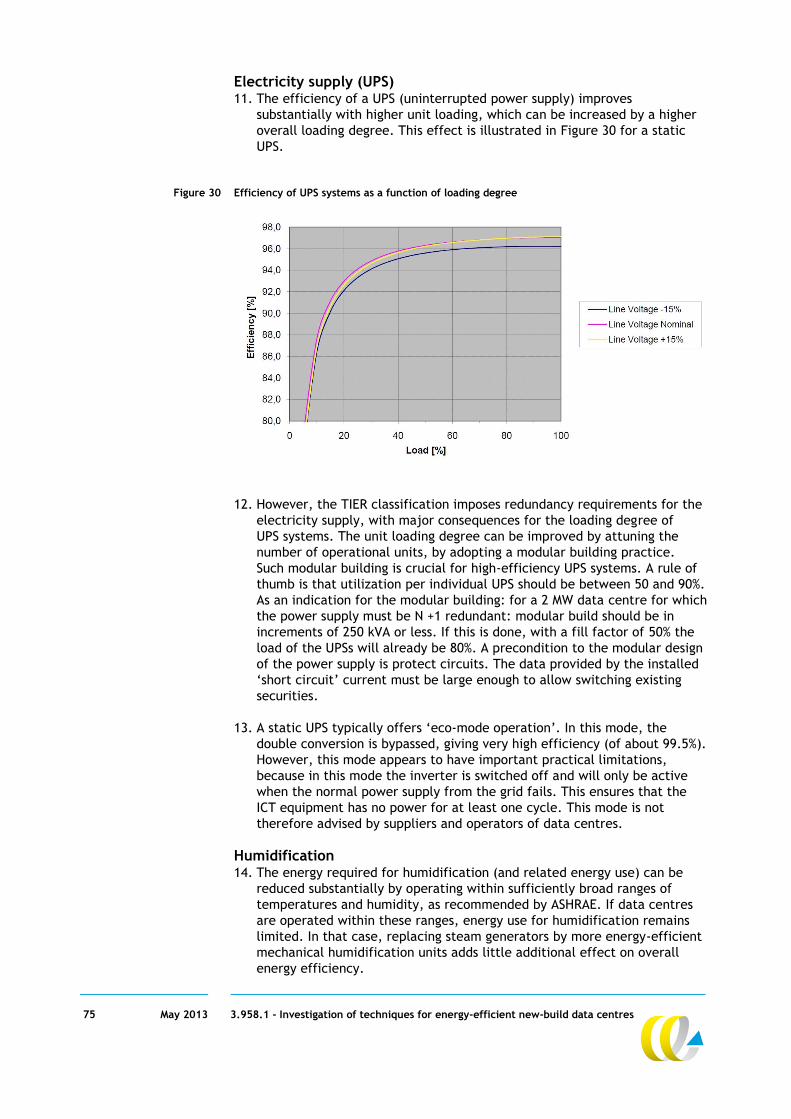
75 May 2013 3.958.1 - Investigation of techniques for energy-efficient new-build data centres
Electricity supply (UPS) 11. The efficiency of a UPS (uninterrupted power supply) improves
substantially with higher unit loading, which can be increased by a higher
overall loading degree. This effect is illustrated in Figure 30 for a static
UPS.
Figure 30 Efficiency of UPS systems as a function of loading degree
12. However, the TIER classification imposes redundancy requirements for the
electricity supply, with major consequences for the loading degree of
UPS systems. The unit loading degree can be improved by attuning the
number of operational units, by adopting a modular building practice.
Such modular building is crucial for high-efficiency UPS systems. A rule of
thumb is that utilization per individual UPS should be between 50 and 90%.
As an indication for the modular building: for a 2 MW data centre for which
the power supply must be N +1 redundant: modular build should be in
increments of 250 kVA or less. If this is done, with a fill factor of 50% the
load of the UPSs will already be 80%. A precondition to the modular design
of the power supply is protect circuits. The data provided by the installed
‘short circuit’ current must be large enough to allow switching existing
securities.
13. A static UPS typically offers ‘eco-mode operation’. In this mode, the
double conversion is bypassed, giving very high efficiency (of about 99.5%).
However, this mode appears to have important practical limitations,
because in this mode the inverter is switched off and will only be active
when the normal power supply from the grid fails. This ensures that the
ICT equipment has no power for at least one cycle. This mode is not
therefore advised by suppliers and operators of data centres.
Humidification 14. The energy required for humidification (and related energy use) can be
reduced substantially by operating within sufficiently broad ranges of
temperatures and humidity, as recommended by ASHRAE. If data centres
are operated within these ranges, energy use for humidification remains
limited. In that case, replacing steam generators by more energy-efficient
mechanical humidification units adds little additional effect on overall
energy efficiency.

76 May 2013 3.958.1 - Investigation of techniques for energy-efficient new-build data centres
Limiting heat-influx from outside 15. To secure a maximum amount of free cooling, the cooling air inlet should
be located at a cool location on the data centre building. As an example,
on a sunny summer day the temperature of a black roof can exceed 55˚C,
which means the air at the roof air inlet will become too hot for use for
free cooling (even with evaporation assist). Options for maintaining low
temperatures on roofs of data centres include:
Painting the roof with a reflective paint. This results in a lower
temperature at the air inlet. At one data centre a temperature
decrease of 8˚C was reported.
‘Green roofs’. A vegetated roof guarantees a year-round roof
temperature below 30˚C, substantially increasing the scope for
100% free air cooling.

77 May 2013 3.958.1 - Investigation of techniques for energy-efficient new-build data centres
References
ADC KRONE, 2007a
Designing an Optimised Data Centre
Berlin (Germany)/Cheltenham (UK) : ADC KRONE, 2007
ADC KRONE, 2007b
TrueNet® Data Centres, The complete Data Centre solution
Cheltenham (UK)/Johannesburg (South Africa)/Berlin (Germany) : ADC KRONE,
2007
Agentschap NL, 2011
Duurzaam koelen van datacenters
Utrecht : Agentschap NL, 2011
APC Whitepapers
APC whitepapers on various subjects
www.apc.com/prod_docs/results.cfm?DocType=White%20Paper&Query_Type=10
Last visit: December 20, 2012
Arcadis 2012
Witte daken; toepassing bij datacentra door Luc Cartigny
Arcadis Divisie Gebouwen Maastricht, 27 september 2012
ASHRAE, 2011
Thermal Guidelines for Data Processing Environments – Expanded Data centre
Classes and Usage Guidance
Whitepaper by ASHRAE Technical Committee (TC) 9.9
N.E. Atlanta (Georgia) : American society for Heating, Refrigerating and
Air-Conditioning Engineers (ASHRAE), 2011
ASHRAE Transactions, 2012
David Moss
Under-Floor Pressure Control: A Superior Method of Controlling Data Center
Cooling
www.highbeam.com/Search?searchTerm=author%3a%22Moss%2c+David%22&orderBy
=Date+DESC
ASU, 2012
Anna Haywood, Jon Sherbeck, Patrick Phelan, Georgios Varsamopoulos,
Sandeep K.S. Gupta
Thermodynamic feasibility of harvesting data centre waste heat to drive an
absorption chiller
In : Energy Conversion and Management 58 (2012) 26-34
http://impact.asu.edu/publication/Haywood2012-feasibility.pdf
BREEAM-NL, 2012
BREEAM-NL Data centres, keurmerk voor duurzame vastgoedobjecten
Beoordelingsrichtlijn Nieuwbouw-Data centres, versie 1.0, februari 2012
Rotterdam : BREEAM-NL, 2012
CE Delft, 2012
L.M.L. (Lonneke) Wielders, M.R. (Maarten) Afman
Zakelijke groenestroomproducten
Delft : CE Delft, 2012
78 May 2013 3.958.1 - Investigation of techniques for energy-efficient new-build data centres
CRRC, 2012
Cool Roof Rating Council (CRRC)
Information available via website: www.coolroofs.org
Last visit: December 20, 2012
DCK, 2011
Rich Miller
Data Center Energy Efficiency Guide
www.datacenterknowledge.com/archives/category/energyefficiencyguide/page/2
DLV PLANT, 2011
J.H. Gielen
Haalbaarheid benutting restwarmte in de paddenstoelenteelt
Horst : DLV Plant, 2011
www.agentschapnl.nl/sites/default/files/bijlagen/Haalbaarheid_benutting_restwa
rmte_in_de_paddenstoelenteelt_januari_2011.pdf
EC, 2008
European Commission, Code of conduct on Data Centres Energy Efficiency,
version 1.0., Brussels, 2008
http://ec.europa.eu/information_society/activities/sustainable_growth/docs/dat
acenter_code-conduct.pdf
EC, 2011
Joint Research Centre European Commission, The code of conduct on Energy
Efficiency and Quality of AC uninterruptible Power systems (UPS) by the
European Commission, final version with new target values for 2011-2014
Version 2.0 dated 16 March 2011
http://iet.jrc.ec.europa.eu/energyefficiency/ict-codes-conduct/ac-
uninterruptible-power-systems
ECN, 2004
F.A.T.M. Ligthart
9 Energie-adviezen aan Amsterdam: bundeling van ECN-notities van isolatie tot
stadsverwarming
Petten : ECN, 2004
ECN, 2008
Niels Sijpheer
Energiebesparing in datahotels - Meer met minder
Petten : ECN, 2008
Emerson Network Power, 2010
Mark Murrill, B.J. Sonnenberg
Evaluating the Opportunity for DC Power in the Data Center
Warrenville (Illinois) : Emerson Network Power, 2010
Emerson Network Power, 2011
Recycling Ratios: The Next Step for Data Center Sustainability
Warrenville (Illinois) : Emerson Network Power, 2011
Emerson Network Power, 2012
Data centre Users’ Group Special Report - Energy efficiency and capacity
concerns increase
Columbus (Ohio) : Emerson Network Power, 2012

79 May 2013 3.958.1 - Investigation of techniques for energy-efficient new-build data centres
Emerson Network Power, S.A., 2007
Energy-efficient Cooling Solutions for Data Centers - Introducing an Emerson
Network Power tool for evaluating cooling system total cost of ownership
Columbus (Ohio) : Emerson Network Power, S.A., 2007
EnergyGo, 2012
PowerPoint presentation: ‘Op weg naar energie efficiënte datacenters
Tussenresultaten’, draft results (not yet published) by Niels Sijpheer,
Marcel Elswijk and Bart Roossien of EnergyGo
Alkmaar : EnergyGo, 2012
EnergyGo, 2013 (on-going)
Energie-efficiency maatregelen in bestaande data centers
Alkmaar : EnergyGo, 2013 (on-going)
Green Grid,
White papers published on the website
www.thegreengrid.org
Last visit: December 20, 2012
ICT Office, 2012
Routekaart ICT 2030
www.agentschapnl.nl/sites/default/files/Routekaart_ICT_2030.pdf
Infomil, 2012
Maatregelenlijst voor de MJA-3 van de ICT sector
Website geraadpleegd in December 2012
www.infomil.nl/onderwerpen/duurzame/energie/special-
kids/nieuws/energiebesparing-ict
JRC, 2009
Code of conduct for data centres Energy Efficiency version 2.0, participant
guidelines and registration form by the European Commission
Valid as from 1.1.2010
Brussels : European Commission, Joint Research Centre (JRC), 2009
Kyoto Cooling
Product information from the supplier of the Kyoto Wheel. This includes
PPT-presentations of the Kyoto Wheel and descriptions of 24 locations where
the Kyoto Wheel is in operation
www.kyotocooling.com
Last visit: December 20, 2012
LBNL, S.A.
Technical Best Practices checklist - A comprehensive list of possible best
practices for data centre efficiency
Lawrence Berkley National Laboratory
http://hightech.lbl.gov/dctraining/about.html
Moehle, 2011
Nicholas Moehle
Advanced control for data centre cooling
www.stanford.edu/class/ee392n/lecture/jun11/nm.pdf
NEN Praktijkrichtlijn 5313, in ontwikkeling
NEN, Draft version Praktijkrichtlijn 5313
Delft : NEN, 2013
80 May 2013 3.958.1 - Investigation of techniques for energy-efficient new-build data centres
Optigroen, 2012
www.optigroen.nl
Last visit: December 20, 2012
Optigroen, 2013
Presentation by Rob Steltenpöhl, technical advisor at Optigroen
Information on green roofs and emails on ongoing research at the University of
Wageningen and Fraunhofer Institute in Germany (University of Wageningen in
the project called: ‘Begroeide daken classificatie implementatie technische
eigenschappen’
www.innovatie-alliantie.nl/projectenbank/raak-project/981.html
Packo NV
Leaflet, Bespaar met de Packo warmteterugwinning
Zedelgem (Belgium) : Packo Inox NV
SMK, 2012
Certificatieschema Milieukeur klimaatbeheersing bij data centers
Den Haag : SMK, 2012
www.smk.nl/nl/s434/SMK/Certificatieschema-s/Milieukeur/c373-A-t-m-E/p511-
Datacenters-klimaatbeheersing-Milieukeur
Solartech, 2012
www.energiedak.nl
Product information on the technology: Energiedak® and project information
on cooling of data centres (glass fibre hubs)
Last visit: December 20, 2012
Stulz, 2008
Benjamin Petschke
White paper: Data Centre Cooling Best Practice
Hamburg : Stulz, 2008
Takakura et al., 2000
T. Takakura, S. Kitadeb, E. Gotob
Cooling effect of greenery cover over a building
In : Energy and Buildings, Volume 31, Issue 1, January 2000, Pages 1–6
TNO, 2012
Bram Spitzer, Daniël Worm, Freek Bomhof, Mark Bastiaans
Cloud computing: Grijs of Groen? over energie-efficiëntie en duurzaamheid
van Infrastructure as a Service
Delft : TNO, 2012
University Twente, 2012
Minisymposium Koudecirkel (On the use of cold water storage to bridge warm
weather periods)
www.utwente.nl/fb/vastgoed/archief/nieuwsarchief/symposiumkoudecirkel.doc
VU, 2012
Duurzame warmte- en koudeopslaginstallatie OZW gebouw geoptimaliseerd
Amsterdam : Vrije Universiteit Amsterdam (VU), 2012
www.vu.nl/nl/over-de-vu/vu-campusontwikkeling/actueel/nieuwsberichten-
2012/duurzame-warmte.asp
81 May 2013 3.958.1 - Investigation of techniques for energy-efficient new-build data centres
Ziggo, 2011
Press release
www.ziggo.com/nl/pers/persberichten/60,450/bouw-nieuwe-generatie-data
centres/
4EE,2010
Proceedings Symposium ICT 4EE
Brussels, 2010
http://ec.europa.eu/information_society/activities/sustainable_growth/ict4ee_fo
rum/index_en.htm
Personal communication Bonke, 2013
Personal communication with Jan Bonke facility manager at Eurofiber about
the effect of white painting the roof of the datacentre he was responsible for
when he was the Gateway Manager at Level 3 Communications in Amsterdam
IKO, 2013
Personal communication with Frans van den Broek and Bert Bergé
(R&D engineer) of IKO Bedrijven Benelux about costs and benefits from white
roof coating

82 May 2013 3.958.1 - Investigation of techniques for energy-efficient new-build data centres

83 May 2013 3.958.1 - Investigation of techniques for energy-efficient new-build data centres
Annex A Steering group and consultancy group
A.1 Participants of the steering group
Cynthia Bosman, Ministerie van Economische Zaken
Bouke Bussemaker, Ministerie van Economische Zaken
Frank Hartkamp, Agentschap NL
Janus Liebregts, DCMR Milieudienst Rijnmond
Jeroen van der Tang, Nederland ICT
Patrick Teunissen, Omgevingsdienst Noordzeekanaalgebied
Eva Thompson, Ministerie van Infrastructuur en Milieu
A.2 Participants expert advisory group energy-efficient data centre cooling
Martien Bakker, Vancis
Arno van Gennip, Colt
Rice van Gompel, Interxion
Gerwalt Harmsen, UPC
Frank Hartkamp, Agentschap NL
Kees de Klein, Atos
Kees Loer, TCN
Joost Nuse, CapGemini
Fons Pennartz, KWA Bedrijfsadviseurs
Ronald van Veen, KPN
Bert Zijderhand, Verizon Terremark

84 May 2013 3.958.1 - Investigation of techniques for energy-efficient new-build data centres

85 May 2013 3.958.1 - Investigation of techniques for energy-efficient new-build data centres
Annex B Questionnaire for suppliers of energy-efficient techniques
Vragenlijst Leveranciers energie-efficiënte technieken datacenters
Koelinstallaties Gesproken met: ………………………. Bedrijf:………………… Datum:…………………………
Omschrijving systeem: werkingsprincipe/categorie
Onderwerp Antwoord
Omschrijving systeem: werkingsprincipe/categorie
Typerende Investeringskosten per benodigd koelvermogen
- Wat zijn de investeringskosten in euro/MW koelcapaciteit bij een
koelinstallatie
Let op: duidelijk vragen naar welke MW stroom: afgevoerde warmte
bijvoorbeeld
-
- Is deze onafhankelijk van koelvermogen of zijn er bepaalde klassen te
onderscheiden
-
Typerend energiegebruik per koelvermogen
- bijv. kWh/MW koelcapaciteit/jaar bij een koelinstallatie? -
- Hoe hangt dit af van de belastingen: bij 50%, 70% van de belasting? -
- Hoe hangt dit af van de omvang van het geïnstalleerde koel-vermogen?
Zijn daar klassen in te onderscheiden?
-
Levensduur
- Wat is de typische levensduur? (afwijking van NEN norm 2767)
Modulair bouwen, cascaderegeling
- Hoe kun je modulair bouwen met deze techniek? -
- Is de techniek geschikt voor een cascaderegeling, zo ja, hoe dan, wat
zijn de gevolgen voor de efficiëntie?
-
Wat zijn andere operationele kosten:
- Watergebruik -
- Arbeid voor onderhoud en bediening -
- Overige operationele zaken: bijv. blusgas, legionellabestrijding,
wieren/algen, etc.
-
Randvoorwaarden:
- Wat zijn de voorwaarden om de techniek toe te passen? -
- Wanneer kan het niet? -
Neveneffecten: wat zijn gevolgen van toepassen voor andere aspecten
datacenterontwerp?
- Hoeveel dagen per jaar is de koelmethode niet voldoende -
- Hoe gericht kun je koude brengen naar bepaalde plaatsen in DC, bijv.
als er podkoeling nodig is
-
- Welke technieken zijn onverenigbaar met deze koelmethode?
Of verlagen de performance?
-
- Welke technieken verbeteren de totale prestaties van het DC in
combinatie met deze koeltechniek?
-
- Overige? -
Hoeveel installaties van dit type al operationeel?
Welke datacenters kunnen we hierover benaderen?

86 May 2013 3.958.1 - Investigation of techniques for energy-efficient new-build data centres
Stroomvoorziening Gesproken met: ………………………. Bedrijf:………………… Datum:…………………………
Omschrijving systeem werkingsprincipe/categorie
Typerende Investeringskosten per benodigd IT uitgangsvermogen Bijv. Euro/MWe uitgangsvermogen.
Is deze onafhankelijk van uitgangsvermogen of zijn er bepaalde klassen te
onderscheiden?
Typerende omzettingsefficiëntie? Als percentage bijv. 97%
Hoe hangt dit af van de belastingen: bij 25, 50, 75 en 100% van de
belasting?
Hoe hangt dit af van de omvang van het geïnstalleerde UPS-vermogen?
Zijn daar klassen in te onderscheiden?
Modulair bouwen, cascaderegeling Hoe kun je modulair bouwen met deze techniek?
Is de techniek geschikt voor een cascaderegeling, zo ja, hoe dan, wat zijn
de gevolgen voor de efficiëntie?
Wat zijn andere operationele kosten: Arbeid voor onderhoud en bediening
Overige operationele zaken: bijv. blusgas, vervangen batterijen,
smeerolie, etc.
Randvoorwaarden: Wat zijn de voorwaarden om de techniek toe te passen?
Wanneer kan het niet?
Neveneffecten : Wat zijn gevolgen van toepassen voor andere aspecten datacenterontwerp? Hoe gericht kun je apparatuur aansluiten? In de zin van sommige apparaten
op het UPS en andere niet.
Kun je ook sommige apparaten een grotere redundantie geven?
Welke technieken zijn onverenigbaar met deze stroomvoorziening?
Of verlagen de performance?
Welke technieken verbeteren de totale prestaties van het DC in combinatie
met deze stroomvoorziening?
Overige?
Hoeveel installaties van dit type al operationeel?
Welke datacenters kunnen we hierover benaderen?

87 May 2013 3.958.1 - Investigation of techniques for energy-efficient new-build data centres
Annex C Questionnaire validation of investments and energy efficiency
Vragenlijst energie-efficiënte technieken in datacenters
Techniek-combinatie: Deze vragenlijst is opgesteld in het kader van het project ‘energie-efficiënte
technieken voor nieuwe datacenters’ van Agentschap NL, in samenwerking met
onder andere Nederland ICT. Dit project wordt uitgevoerd door Mansystems en
CE Delft, en brengt energie-efficiënte technieken voor nieuw te bouwen
datacenters in kaart.
Eén van de techniekcombinaties die in dit project in kaart is gebracht is [……].
Hiervoor hebben wij gegevens verzameld ten aanzien van investeringen en
energiegebruik. Met deze vragenlijst vragen wij u om aan te geven in hoeverre
deze ramingen overeenstemmen met de ervaringen van uw bedrijf.
Respons zal in geanonimiseerde vorm, dus zonder vermelding van bedrijfs-
naam, worden verwerkt.
Datum: …………
Bedrijf: ………… Contactpersoon: …………
Telefoon: ………… E-mail: …………
Wilt u de ingevulde vragenlijst terugsturen aan: …………
In het onderzoek brengen we investeringen en energiegebruik in kaart van het
koelsysteem en de stroomverzorging van drie typerende grootteklassen
datacenters. De parameters zijn:
Klasse
Maximaal
opgesteld
vermogen17
in kW
Vloer-
oppervlak
IT (m2)
TIER-
klasse
UPS Koeling
‘Klein’ 250 300 1 Statisch,
200 kVA
UPSen
N+1, N=2
N.v.t.
‘Middel’ 3.000 2.000 2 Statisch,
400 kVA
UPS,
N+1, N=4
Totaalkoelconcept voorzien van indirecte koeling.
Het systeem is minimaal N+1 redundant uitgevoerd
qua dimensionering (aantallen luchtbehandelings-
kasten; ventilatoren pompen en regelingen) en
voorzien van back-up compressie cooling.
‘Groot’ 8.000 4.000 3 Rotary,
1.600 kVA
N+2, N=8
(2N
equiv.)
Idem
17 Nominale output UPS-systeem.
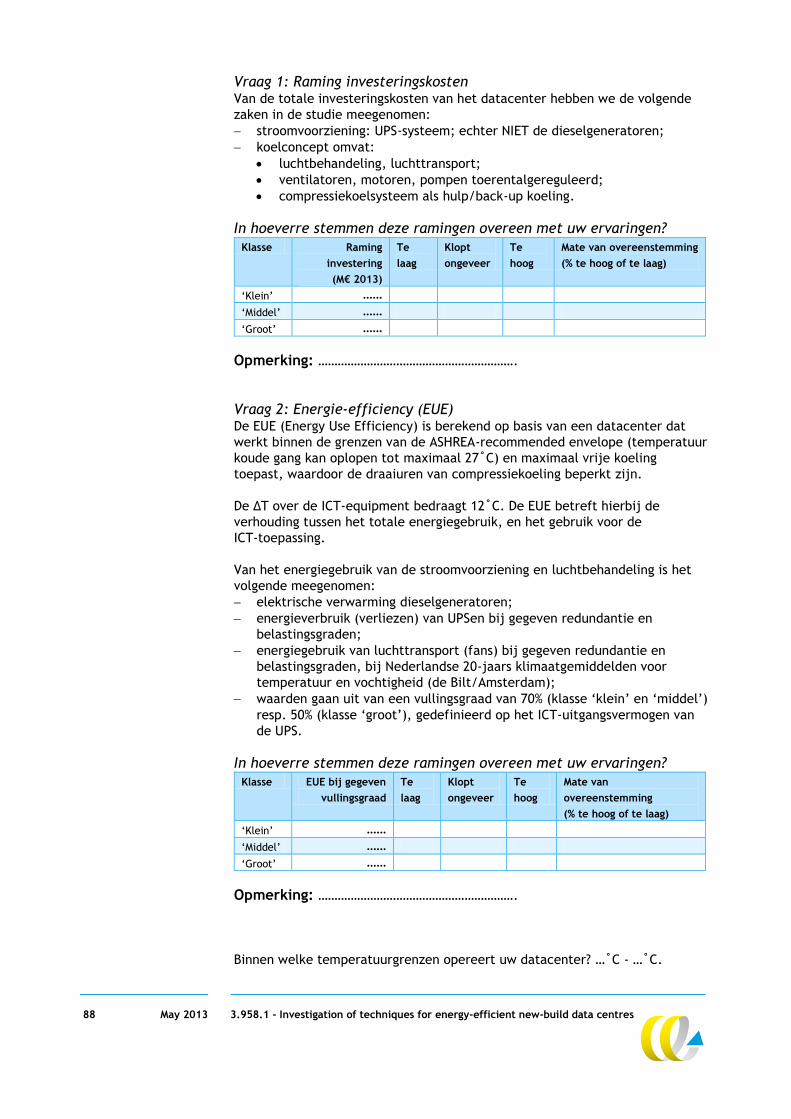
88 May 2013 3.958.1 - Investigation of techniques for energy-efficient new-build data centres
Vraag 1: Raming investeringskosten Van de totale investeringskosten van het datacenter hebben we de volgende
zaken in de studie meegenomen:
stroomvoorziening: UPS-systeem; echter NIET de dieselgeneratoren;
koelconcept omvat:
luchtbehandeling, luchttransport;
ventilatoren, motoren, pompen toerentalgereguleerd;
compressiekoelsysteem als hulp/back-up koeling.
In hoeverre stemmen deze ramingen overeen met uw ervaringen?
Klasse Raming
investering
(M€ 2013)
Te
laag
Klopt
ongeveer
Te
hoog
Mate van overeenstemming
(% te hoog of te laag)
‘Klein’ ……
‘Middel’ ……
‘Groot’ ……
Opmerking: …………………………………………………….
Vraag 2: Energie-efficiency (EUE) De EUE (Energy Use Efficiency) is berekend op basis van een datacenter dat
werkt binnen de grenzen van de ASHREA-recommended envelope (temperatuur
koude gang kan oplopen tot maximaal 27˚C) en maximaal vrije koeling
toepast, waardoor de draaiuren van compressiekoeling beperkt zijn.
De ∆T over de ICT-equipment bedraagt 12˚C. De EUE betreft hierbij de
verhouding tussen het totale energiegebruik, en het gebruik voor de
ICT-toepassing.
Van het energiegebruik van de stroomvoorziening en luchtbehandeling is het
volgende meegenomen:
elektrische verwarming dieselgeneratoren;
energieverbruik (verliezen) van UPSen bij gegeven redundantie en
belastingsgraden;
energiegebruik van luchttransport (fans) bij gegeven redundantie en
belastingsgraden, bij Nederlandse 20-jaars klimaatgemiddelden voor
temperatuur en vochtigheid (de Bilt/Amsterdam);
waarden gaan uit van een vullingsgraad van 70% (klasse ‘klein’ en ‘middel’)
resp. 50% (klasse ‘groot’), gedefinieerd op het ICT-uitgangsvermogen van
de UPS.
In hoeverre stemmen deze ramingen overeen met uw ervaringen?
Klasse EUE bij gegeven
vullingsgraad
Te
laag
Klopt
ongeveer
Te
hoog
Mate van
overeenstemming
(% te hoog of te laag)
‘Klein’ ……
‘Middel’ ……
‘Groot’ ……
Opmerking: …………………………………………………….
Binnen welke temperatuurgrenzen opereert uw datacenter? …˚C - …˚C.

89 May 2013 3.958.1 - Investigation of techniques for energy-efficient new-build data centres
Annex D Key results for Dutch guideline for local governments (in Dutch)
Er zijn veel alternatieven voorhanden om zeer energie-efficiënte datacenters
te bouwen. Dat is de hoofdconclusie van dit rapport, dat verschillende
combinaties van technieken onderzoekt om energie-efficiëntie in datacenters
te verbeteren.
Datacenters hebben een substantieel energiegebruik: nu ongeveer op
1,6 TWhe ofwel 1,5% van het Nederlandse nationale elektriciteitsverbruik.
Binnen de datacenters wordt een groot deel van het energiegebruik gebruikt
door de ICT-applicaties. Typerend ligt dit op ca. 70%. Daarnaast zijn koeling en
de ononderbroken stroomvoorziening aanzienlijke gebruikers van elektriciteit,
in de orde van resp. 23 en 7%. Energiegebruik voor andere toepassingen (zoals
voor verlichting en kantoorinrichting) is beperkt (ordegrootte 1%).
Er bestaan diverse energie-efficiënte technieken waarmee het energiegebruik
van koeling en stroomvoorziening kan worden gereduceerd. Dit onderzoek
geeft een overzicht van die technieken. Het is daarbij gericht op nieuwbouw
van datacenters.
Onderzoek Het onderzoek is uitgevoerd door een combinatie van een uitgebreide
literatuurstudie, interviews met leveranciers van energie-efficiënte technieken
en een model-analyses. Resultaten zijn daarna gevalideerd bij leveranciers en
gebruikers van datacenters.
Het onderzoek richt zich op drie typerende grootteklassen datacenters: klein
(0,25 MW), medium (3 MW) en groot (8 MW). Voor deze typen zijn varianten
uitgewerkt, dit zijn combinaties van energie-efficiënte technieken voor
koeling en stroomvoorziening. Voor de varianten hebben leveranciers
specifieke gegevens over investeringskosten en energieprestaties gegeven,
welke de basis vormen voor de modelberekeningen. Op deze basis zijn
typerende waarden voor investeringskosten, energieprestaties en terug-
verdientijden bepaald.
Modelresultaten zijn bij verschillende benuttingsgraden van het datacenter
berekend en aan gebruikers uit de praktijk voorgelegd ter validatie.
Informatie uit de validatie is gebruikt om de modelberekeningen aan te
passen.
Combinaties van energiezuinige koeltechnieken Het onderzoek leert dat er verschillende varianten mogelijk zijn om energie-
zuinige koeling in datacenters te realiseren. Deze varianten bestaan uit
combinaties van technieken, zoals luchtfilters, ventilatoren, droge koelers,
natte koelers, hybride droge koelers, warmtewisselaars en koelmachines.
Van een achttal opgestelde koelvarianten zijn vijf varianten verder
kwantitatief onderzocht.

90 May 2013 3.958.1 - Investigation of techniques for energy-efficient new-build data centres
Voor al de varianten geldt dat ze in één of meer recent gebouwde datacenters
in Nederland worden toegepast:
1a: Open koelsystemen ondersteund door adiabatische koeling.
1b: Open koelsystemen ondersteund door adiabatische koeling, én een
faseovergang koudeopslagmiddel.
2a: Gesloten koelsystemen met lucht-lucht warmtewisselaars, ondersteund
door adiabatische koeling.
2b: Gesloten koelsystemen met lucht-lucht warmtewisselaars, ondersteund
door compressiekoeling.
3: Gesloten koelsystemen via vloeistof warmteafvoer met hybride droge
koelers, ondersteund met compressiekoeling.
Deze varianten hebben de volgende gemeenschappelijke kenmerken:
Temperatuur en vochtigheid binnen het datacenter zijn voldoende ruim,
de volledige ruimte binnen de door ASHRAE aangeraden grenzen mag
worden gebruikt. Dit betekent dat de temperatuur aan de ingang van de
ICT zo nodig mag oplopen tot 27˚C.
Maximaal gebruik van vrije koeling (‘natuurlijke’ bronnen van koude).
Volledige scheiding van warme en koude luchtstromen.
Toerentalgeregelde ventilatoren met luchtdrukregeling over de ICT.
Zo laag mogelijke luchtsnelheden.
Modelberekeningen Met een model zijn voor de vijf varianten investeringskosten en jaarlijks
energiegebruik berekend. Er is hierbij een onderscheid gemaakt naar drie
grootteklasses van datacenters, een klein datacenter (0,25 MW), een
middelgroot (3 MW) en een groot datacenter (8 MW). De berekeningen zijn
uitgevoerd voor twee situaties van belading van het datacenter: ‘gemiddelde’
en ‘maximale’ belading. De beladingsgraad is een graadmeter voor het % van
het opgestelde vermogen voor stroomvoorziening en koeling dat daadwerkelijk
wordt benut.
Voor de drie grootteklasses zijn ook referenties opgesteld. Deze referenties
zijn gebaseerd op recent gebouwde state-of-the-art datacenters, met een
meer conventioneel koelsysteem.
Op basis van verschillen in kosten tussen varianten en referenties, is berekend
welke terugverdientijd de varianten hebben ten opzichte van de referentie.
Voor de terugverdientijden is een gevoeligheidsanalyse uitgevoerd. In deze
analyse is op basis van de onzekerheden in investeringsramingen berekend in
hoeverre resultaten veranderen als investeringen variëren.
Energiegebruik Uit de modelberekeningen volgt dat met de verschillende varianten een hoge
graad van energie-efficiency is te realiseren.
Een graadmeter hiervoor is de EUE, dit is de verhouding tussen het totale
energiegebruik in een datacenter en het energiegebruik voor de ICT-systemen
zelf18. Voor alle grootteklassen zijn EUE’s haalbaar ruim beneden 1,2.
Dit betekent dat het totale energiegebruik voor koeling en stroomvoorziening
lager ligt dan 20% van het totale energiegebruik voor de ICT-toepassingen zelf.
De berekende EUE’s zijn weergegeven in Figuur 1. De verschillen tussen de
varianten zijn relatief klein.
18 In het onderzoek is in de EUE niet het energiegebruik voor ‘overige toepassingen (verlichting,
kantoortoepassingen, etc.) meegenomen. Deze hebben doorgaans een beperkt
energiegebruik, en het effect op de EUE is verwaarloosbaar.
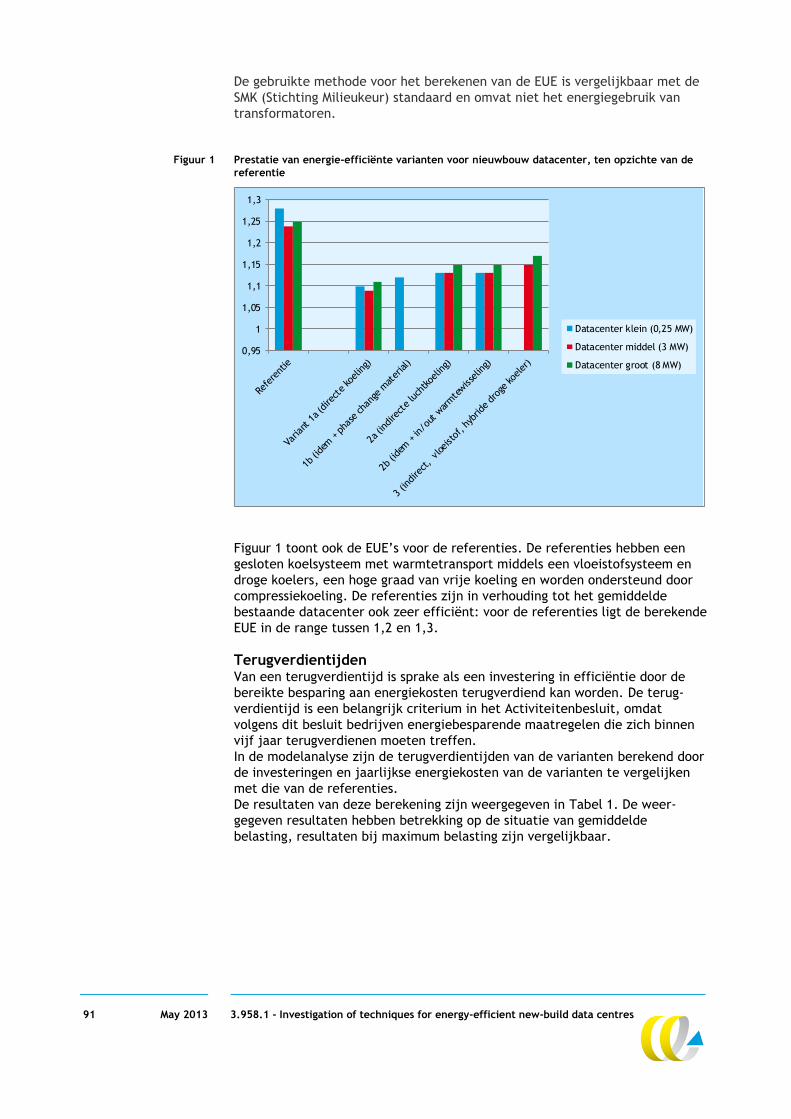
91 May 2013 3.958.1 - Investigation of techniques for energy-efficient new-build data centres
De gebruikte methode voor het berekenen van de EUE is vergelijkbaar met de
SMK (Stichting Milieukeur) standaard en omvat niet het energiegebruik van
transformatoren.
Figuur 1 Prestatie van energie-efficiënte varianten voor nieuwbouw datacenter, ten opzichte van de
referentie
Figuur 1 toont ook de EUE’s voor de referenties. De referenties hebben een
gesloten koelsysteem met warmtetransport middels een vloeistofsysteem en
droge koelers, een hoge graad van vrije koeling en worden ondersteund door
compressiekoeling. De referenties zijn in verhouding tot het gemiddelde
bestaande datacenter ook zeer efficiënt: voor de referenties ligt de berekende
EUE in de range tussen 1,2 en 1,3.
Terugverdientijden Van een terugverdientijd is sprake als een investering in efficiëntie door de
bereikte besparing aan energiekosten terugverdiend kan worden. De terug-
verdientijd is een belangrijk criterium in het Activiteitenbesluit, omdat
volgens dit besluit bedrijven energiebesparende maatregelen die zich binnen
vijf jaar terugverdienen moeten treffen.
In de modelanalyse zijn de terugverdientijden van de varianten berekend door
de investeringen en jaarlijkse energiekosten van de varianten te vergelijken
met die van de referenties.
De resultaten van deze berekening zijn weergegeven in Tabel 1. De weer-
gegeven resultaten hebben betrekking op de situatie van gemiddelde
belasting, resultaten bij maximum belasting zijn vergelijkbaar.
0,95
1
1,05
1,1
1,15
1,2
1,25
1,3
Datacenter klein (0,25 MW)
Datacenter middel (3 MW)
Datacenter groot (8 MW)

92 May 2013 3.958.1 - Investigation of techniques for energy-efficient new-build data centres
Tabel 1 Berekende terugverdientijden (in jaren) (scenario gemiddelde belading)
Grootteklasse datacenter
Klasse I Klasse II Klasse III
Referentie 1 -
Referentie 2 -
Referentie 3 -
Variant 1a > 10 >= 5 * > 10
Variant 1b > 10
Variant 2a < 0 < 0 < 0
Variant 2b > 10 > 10 >= 0 *
Variant 3 >= 0 * >= 0 *
* Resultaten voor deze varianten verschillen bij gevoeligheidsanalysetests.
** Deze varianten kunnen < 10 scoren bij gevoeligheidsanalysetests.
In veel gevallen zijn de terugverdientijden hoog. Dit komt doordat de omvang
van investeringen vaak een ordegrootte groter is dan de jaarlijkse besparingen
op energiekosten door toepassing van een energiezuiniger variant. Dit is in
Tabel 1 weergegeven met > 10 jaar. Hierbij speelt ook dat de referenties al
een hoge energie-efficiëntie kennen.
Bij de variant ‘indirecte lucht/lucht koeling met adiabatische ondersteuning
(Variant 2a)’ zijn de investeringskosten beperkter dan in de referenties.
Dit leidt tot een terugverdientijd van 0 jaar: in vergelijking tot de referentie is
de variant vanaf het begin rendabel. Dit komt doordat voor deze variant zowel
de investeringskosten als de kosten voor energiegebruik lager zijn dan bij de
referentie. De lage investeringskosten hangen er mee samen dat in deze
variant geen compressiekoeling wordt toegepast, waardoor kosten voor
compressiekoeling ontbreken.
Uit de modelberekeningen blijkt dat onder bepaalde condities soms ook
andere varianten redelijk geringe terugverdientijden hebben. Dit kan echter
van geval tot geval verschillen, en hangt af van de kosten en investeringen die
in een investeringsbeslissing worden meegenomen, en daarnaast van niet
gekwantificeerde overige operationele verschillen in kosten.
In dit verband is ook van belang dat in de modelanalyse niet alle technische
details zijn opgenomen. Voorbeelden zijn datacenter verhoogde vloer,
bekabeling en transformatoren en gescheiden warme/koude gangen.
Door deze aspecten in ontwerpkeuzes mee te nemen worden extra
installatiekosten beperkt.
Koeling De resultaten tonen aan dat met energie-efficiënte koelmethoden een hoge
graad van energie-efficiëntie kan worden bereikt. Hiervoor zijn verschillende
combinaties van technieken beschikbaar.
Cruciaal in alle varianten is dat een grote hoeveelheid ‘vrije koeling’ wordt
toegepast.
Verschillende varianten zijn gebaseerd op adiabatische ondersteunende
koeling, en worden niet ondersteund door compressie koeling.
Voor compressieloze systemen kan worden berekend binnen welke
temperatuur en vochtigheid de systemen effectief zijn. Samen met een
locatie-specifiek temperatuurvochtigheid diagram kan dan worden vastgesteld
of dit voldoende koeling levert voor alle uren in het jaar. Ook varianten met
back-up compressiekoeling kunnen een hoge graad van energie-efficiëntie
leveren, mits het aantal bedrijfsuren van de compressie koelsysteem zeer laag
wordt gehouden.

93 May 2013 3.958.1 - Investigation of techniques for energy-efficient new-build data centres
Met voldoende ruime temperatuurranges, conform de aanbevelingen van
ASHRAE, geldt dat voor alle Nederlandse locaties minder dan 100 uur per jaar
compressiekoeling nodig is.
Stroomvoorziening (UPS) Met het verlagen van het energiegebruik van de koeling worden de conversie-
verliezen van de stroomvoorziening relatief belangrijker. Voor de omzettings-
efficiëntie van de UPS (Uninterruptable Power Supply) is de beladingsgraad
een belangrijke factor. De energieprestaties van een UPS dalen namelijk sterk
bij een lage beladingsgraad. Een vuistregel is dat een individueel UPS minstens
voor 50% moet worden benut om een redelijke efficiëntie te bereiken. Om een
hoge beladingsgraad te realiseren is het zaak dat het UPS-systeem modulair
wordt gebouwd, dan kunnen de eenheden bijgeplaatst worden als de toename
van het aantal ICT-systemen daar om vraagt.
Mogelijke maatregelen Voor het realiseren van een hoge graad van energie-efficiency in een
datacenter zijn de volgende maatregelen van belang:
Algemeen Het realiseren van een lage EUE voor nieuwbouw datacenters.
Met alle onderzochte energie-efficiënte koelvarianten en de efficiënte
UPS-systemen kan een EUE van minder dan 1,2 worden gehaald.
Verbeterde bedrijfsvoering Het aanhouden van voldoende ruime grenzen voor temperatuur en
vochtigheid.
De ASHREA (American Society of Heating, Refrigerating and Air-
Conditioning Engineers) geeft standaarden die grenzen omvat onder meer
t.a.v. de toelaatbare temperatuur en luchtvochtigheid voor in bedrijf
zijnde klasse A1 elektronische apparatuur, waaronder de typische
datacenter ICT vaak valt. De temperatuur wordt gemeten bij de
luchtingang van de apparaten. Als het datacenter zich houdt aan de
maximum aangeraden grenzen volgens ASHRAE, dan moet de temperatuur
binnen de koude gangen tussen de 18-27˚C blijven. Dit is nog ruim binnen
de maximum toelaatbare bedrijfstemperaturen voor klasse A1
elektronische apparatuur.
De compressieloze en adiabatisch ondersteunde varianten werken het
beste als het hele regelbereik van de ASHRAE aanbeveling wordt benut. Dit
betekent dat tijdens warme en vochtige buiten condities de bovengrens
van het aanbevolen bereik worden aangehouden, maar ook dat tijdens
periodes met lage buitentemperatuur de setpoints meer naar de
ondergrens worden gebracht. Bij deze wisselingen dient niet de maximale
verandersnelheid die door ASHRAE wordt vermeld te worden overschreden.
Continue monitoring van energiegebruik per systeem en functie.
Door op continue basis het energiegebruik per systeem of toepassing
(ICT-apparatuur klanten, koeling, bevochtiging, stroomvoorziening, overige
energiegebruikers, ..) te meten ontstaat niet alleen inzicht in bijvoorbeeld
de EUE, maar door gedetailleerde gegevens vast te leggen, maar ontstaat
ook een basis om de prestaties te verbeteren. Gegevens kunnen al dan niet
geanonimiseerd onderling tussen datacenteraanbieders uitgewisseld
worden om van elkaar te leren.
Bij de nieuwbouw van een datacenter kunnen de monitoringsystemen
aangeschaft en ingeregeld worden.

94 May 2013 3.958.1 - Investigation of techniques for energy-efficient new-build data centres
Koeling en afvoer van warme lucht Het realiseren van een hoog aandeel ‘vrije koeling’.
Uit het onderzoek volgt dat het met de Nederlandse klimaat-
omstandigheden mogelijk is om in tenminste 98% van de tijd gebruik te
maken van vrije koeling. Compressiekoeling is hooguit 100 uur per jaar
nodig. Dit geldt voor alle locaties in Nederland.
Het gebruik maken van een techniek-combinatie die het mogelijk maakt
om een hoog aandeel vrije koeling te gebruiken.
Volledig gescheiden ‘koude’ en ‘warme’ gangen.
Het koelsysteem van een datacenter werkt efficiënter als voorkomen
wordt dat warme en koude luchtstromen mengen. Daarom dienen warme
en koude luchtstromen in het datacenter volledig gescheiden zijn, en niet
gebruikte openingen in racks voorzien van blindplaten.
Toepassing van toerentalgeregelde ventilatoren en pompen.
Toerentalgeregelde ventilatoren zijn op dit moment leverbaar door alle
leveranciers en in de efficiënte koelvarianten worden deze standaard
gebruikt. Voor luchttransport geldt dat naarmate de koelbehoefte
afneemt, dat het elektrisch vermogen dat door de ventilatoren opgenomen
wordt met de tweede macht kan afnemen als gebruik gemaakt wordt van
toerentalregeling. Dit komt omdat naarmate de luchtsnelheid lager is,
ventilatoren efficiënter werken. Voor vloeistofpompen volgt het energie-
gebruik meer lineair met de belasting.
Toevoer van koellucht op een koele locatie van het gebouw.
Externe warmtewisselaars en toevoersystemen van koellucht dienen bij
voorkeur gelokaliseerd te zijn op een koele locatie. Dit maakt het mogelijk
om langer in het jaar gebruik te maken van vrije koeling. Opties zijn om de
luchttoevoer te plaatsen op een schaduwlocatie. Als de koeling op het dak
is gelokaliseerd verdient het aanbeveling dat dit een reflecterende kleur
heeft. Een vegetatiedak is een andere optie. Een ongunstige keuze
(bijvoorbeeld een dakkoeler die op een zwart dak is geplaatst) kan
betekenen dat het aantal uren dat de vrije koeling faalt significant hoger is
(bijvoorbeeld verdubbelt).
Electriciteitsvoorziening (UPS) Modulaire bouw van het UPS-systeem (afzonderlijke UPS-eenheid per
ICT-eenheid van het datacenter). De efficiëntie van een UPS verbetert sterk als de belastinggraad hoger is. Door de hoeveelheid geïnstalleerde UPS systemen precies af te stemmen op de stroomvraag en de redundantievereisten, kan de beladingsgraad per UPS-eenheid geoptimaliseerd worden. Een vuistregel is dat als men altijd voor benutting tussen de 50 en 90% per individuele UPS moet zitten. Als indicatie: bij een 2 MW datacenter, waarbij de stroomvoorziening N+1 redundant moet zijn, dan dient men bijvoorbeeld modulair te bouwen in stapgrootten van 250 kVA of kleiner. Doet men dit, dan kan men bij een vullingsgraad van 50% ervoor zorgen dat de belasting van de UPSen toch al 80% is. Een randvoorwaarde in de modulaire opbouw van de stroom-voorziening is beveiliging van de circuits. De door de geïnstalleerde apparatuur te leveren ‘kortsluit stroom’ moet groot genoeg zijn om de aanwezige beveiligingen te laten afschakelen.
Keuze voor een type UPS dat bij een breed scala van mogelijke belasting-
graden een hoog rendement heeft.