investigation of the crystallinity and ... abstract investigation of the crystallinity and...
TRANSCRIPT

I
INVESTIGATION OF THE CRYSTALLINITY AND ORIENTATION OF POLYPROPYLENE WITH RESPECT TO
TEMPERATURE CHANGES USING FT-IR, XRD, AND RAMAN TECHNIQUES
A THESIS SUBMITTED TO THE DEPARTMENT OF CHEMISTRY AND THE INSTITUTE OF ENGINEERING AND
SCIENCES OF BILKENT UNIVERSITY IN PARTIAL FULFILLMENT OF THE REQUIREMENTS FOR THE DEGREE
OF MASTER OF SCIENCE
BY
HARUN NEZİH TÜRKÇÜ
AUGUST 2004

II
I certify that I have read this thesis and that in my opinion it is fully adequate, in
scope and in quality, as a thesis degree of Master in Science.
.….…………………………………….
Prof. Dr. Şefik Süzer (Principal Advisor)
I certify that I have read this thesis and that in my opinion it is fully adequate, in
scope and in quality, as a thesis degree of Master in Science.
……………….………………………….
Prof. Dr. Atilla Erçelebi
I certify that I have read this thesis and that in my opinion it is fully adequate, in
scope and in quality, as a thesis degree of Master in Science.
…………………………………………….
Asst. Prof. Dr. Dönüş Tuncel
Approved for the institute of Engineering and Sciences
…………….……………………………….
Prof. Dr. Mehmet Baray
Director of Institute of Engineering and Science

III
ABSTRACT
INVESTIGATION OF THE CRYSTALLINITY AND ORIENTATION OF
POLYPROPYLENE WITH RESPECT TO TEMPERATURE CHANGES
USING FT-IR, XRD, AND RAMAN TECHNIQUES
HARUN NEZİH TÜRKÇÜ
M.S. in Chemistry
Supervisor: Prof.Dr. Şefik Süzer
August 2004
Having good mechanical and barrier properties, polypropylene films are widely used
in food-packing industry. The relation of crystallinity and orientation of
polypropylene with these properties are well known. Temperature increase has an
important effect on the crystallinity and orientation of polypropylene. The purpose of
this study is to understand better crystallinity and orientation changes of the cast and
bi-axially oriented polypropylene films with respect to temperature effect. These
changes were investigated using especially in-situ FT-IR and dichroism as well as
XRD and Raman spectroscopy.
For this purpose, an in-situ variable temperature set-up is developed and adapted for
FT-IR studies. Accordingly, the changes in the peaks related to the amorphous and
crystalline contents of the films as well as the peaks reflecting the orientation of the
films were investigated over the temperature range from 120-170oC. Temperature
cycle was also applied. Moreover, the films were investigated after application of
additional stress at 120oC for various durations.
The crystallinity and orientation of the films are affected significantly when the films
were analyzed at higher temperature (>150oC). The crystallinity content of the film

IV
recovers after returning back to room temperature whereas orientational loss are
permenant.
Keywords: Polypropylene, FT-IR, Dichroism, XRD, Raman Spectroscopy,
Phase Transition, and Temperature Effect

V
ÖZET
FT-IR, XRD, RAMAN TEKNİKLERİNİ KULLANARAK SICAKLIK
DEĞİŞİKLİĞİNE BAĞLI OLARAK POLİPROPİLEN FİLMLERİNDE
KRİSTALLİNİTE VE YÖNLENMENİN İNCELENMESİ
HARUN NEZİH TÜRKÇÜ
Kimya Bölümü Yüksek Lisans Tezi
Tez Yönetcisi: Prof.Dr. Şefik Süzer
Ağustos 2004
İyi mekanik ve bariyer özelliklerine sahip olan polipropilen endüstride geniş
birşekilde kullanılmaktadır. Polipropilenin kristallinitesinin ve yönlenmesinin bu
özellikleri ile ilişkili olduğu bilinmektedir. Polipropilen filmini ısıtmanın kristalinitisi
ve yönlenmesi üzerine önemli bir etkisi vardır. Bu çalışmanın amacı sıcaklığa bağlı
olarak kalıp ve çift yönde çekilmiş polipropilen filmlerinde ki kristallinite ve
yönlenme değişikliklerini daha iyi anlamaktır. Bu değişiklikler özellikle yerinde (in-
situ) FT-IR , dikroizm ve XRD, Raman spektrokopi kullanılarak incelenmiştir.
Bu amacın doğrultusunda, değişik sıcaklıklara ulaşabilen yerinde (in-situ) düzenek
geliştirilip FT-IR’e adapte edildi. Böylece, 120-170oC aralığında ki sıcaklıklarda
amorf ve kristalin kısımlarına karşılık gelen piklerde olan değişmeler ve yönlenme
hakkında bilgi veren piklerdeki değişmeler incelenmiştir. Ayrıca aynı filmler tekrar
ısıtılarak bir devir yapılmıştır. Bundan başka, çeşitli sürelerde 120oC’de ilave stress
uygulanan filmlerde incelenmiştir.

VI
Yüksek sıcaklıklarda filmler ısıtılırken (>150oC) filmlerin kristallinitesi ve
yönlenmesi önemli ölçüde değişmektedir. Oda sıcaklığına geri dönüldüğünde,
filmlerin kristallinitesi eski haline geri dönerken yönlenme kaybı sabit olarak
kalmaktadır.
Anahtar Kelimeler: Polipropilen, FT-IR, Dikroizm, XRD, Raman
Spektroskopisi, Faz Geçişi, ve Isı Etkisi

VII
ACKNOWLEDGEMENT
I would like to express my sincere gratitude to Prof. Şefik Süzer for his supervision
throughout my studies.
I am very grateful to our group members Dr. Gülay Ertaş, Ferdi Karadaş, Ercan
Avcı, U. Korcan Demirok for their help.
I would like to express my deepest gratitude to my mother, father, sisters and cousins
for their love, encouragement and support.
I would like to thank to my friends Ahmet Erkam, Emre Yazıcıoğlu, Mustafa
Genişel, E.bekir Şen, Murat Başerdem, Ahmet Bolluk, Serkan Doğay from METU,
Cem Kuşçu, Yavuz Öztürk, Sefahettin Tongay, A. Faik Demirörs, Anıl Ağıral,
Ayhan Yurtsever, Serdar Durdağı, Ozan Karaltı, İshak Uysal, Olga Samarskaya,
Banu Altıntaş, Işık R. Türkmen, Mehtap Küyükoğlu, Nesibe Cındır from Bilkent for
their friendship.

VIII
TABLE of CONTENTS
1. INTRODUCTION..........................................................................................1 1.1. Polypropylene and Its Properties.....................................................................1 1.1.1. Polypropylene........................................................................................1 1.1.2. Types of Polypropylene.........................................................................3 1.1.3. Advantages of Polypropylene................................................................5 1.1.4. Disadvantages of Polypropylene............................................................5 1.1.5. Application Fields..................................................................................6 1.1.6. Crystallinity............................................................................................6
1.1.6.1. α and β Crystalline Forms..............................................................7
1.1.7. Preparation of PP Films.......................................................................9 1.1.7.a. Cast Film (CPP).............................................................................9 1.1.7.b. Biaxially Oriented Film(BOPP)....................................................9
1.2.Tools for Studying Properties of Polypropylene.........................................10
1.2.1. Infrared Spectroscopy..........................................................................11
1.2.1.a. Infrared Spectrum and Bands of Polypropylene.........................11
1.2.1.b. Infrared Dichroism......................................................................13 1.2.2. Raman Spectroscopy............................................................................15 1.2.3. XRD.....................................................................................................16 1.3. Effect of Temperature on the Crystallinity and Orientation ........................18 1.4. Shifts in IR bands..........................................................................................21 1.5. Permeability of Polypropylene.....................................................................22

IX
1.6. Aim of the Present Study..............................................................................23 2.EXPERIMENTAL...........................................................................................24 2.1. Materials........................................................................................................24 2.2. Tools..............................................................................................................24 2.2.1. Temperature Controller and Its Calibration.........................................25
2.2.2. In-situ FT-IR…………….…………………………………………...25 2.2.3. XRD.....................................................................................................26 2.2.4. Raman Spectrophotometer……………………………………….…..27 2.3. Procedure…………………………………….……………………………..28 3. RESULTS&DISCUSSION……...…………………………………………29 3.1. Crystallinity Studies………………………………………………………..29 3.2. Orientation Studies…………………………………………………………37 3.3. Heat Cycle………………………………………………………………….39 3.4. Shifts in IR Bands………………………………………………………….41 3.5. Direction of Stretching Analysis by FT-IR….……………………………..46 3.6. XRD Studies……………………………………………………………….50 3.6.1. Temperature Effect…………………………………………………...50 3.6.2. Direction of Stretching ………...…....…………..……………………52 3.6.3. Phase Transitions…………………..…………………………………55 3.7. Raman Studies……………………………………………………………..57 3.7.1. General Investigation of CPP and BOPP films………………………57 3.7.2. Effect of Temperature…………………..……………………………59

X
3.7.3.Directional Stretching Analysis..…….……………………………….59 3.7.4. Depth Analysis……………………………………………………….62 4. CONCLUSION..……..……………………………………………………...63 5. REFERENCES……..………………………………………………...……...65

XI
LIST OF FIGURES
1) Wide angle X-ray scattering patterns of isotactic, syndiotactic and atactic
PP…………………………………………………………………………….7
2) Monoclinic form……………………………………………………………...8
3) Hexagonal form……………………………………………………………...8
4) The representation of stretching of polypropylene………………………….10
5) Infrared absorption spectrum of a 20µm unoriented polypropylene film
(CPP)………………………………………………………………………...12
6) Schematic representation of polarizer in FTIR……………………………...14
7) Infrared spectra of BOPP with using 0o and 90o polarizers…………………15
8) Raman Spectrum of Polypropylene Film……………………………………16
9) Typical XRD pattern of polypropylene..........................................................18
10) Temperature dependence of infrared bands, cross, filled circle, unfilled circle
refer to 900, 973 and 1220 cm-1 respectively..................................................19
11) Temperature dependence of regularity bands.................................................20
12) Representation of relation between gas permeability and orientation………22
13) Experimental set up………………………………………………………….26
14) The representation of scattered light from sample on confocal hole………..27
15) The representation of heat profile…………………………………………...28
16) Effect of increasing temperature on the bands of polypropylene…………...30
17) Intensity plot of CPP films for 973cm-1 band during heating-cooling
process………………………………………………………………………31
18) Intensity plot of CPP films for 998cm-1 band during heating-cooling
process………………………………………………………………………32
19) This plot shows that 973cm-1/998cm-1 ratio in heating-cooling process of CPP
films…………………………………………………………………………33
20) The effect of increasing temperature on the bands of BOPP film in FT-IR...35
21) This plot shows that 973cm-1/998cm-1 ratio in heating-cooling process of
BOPP films with using 0o polarizer…………………………………………36

XII
22) This plot shows that 973cm-1/998cm-1 ratio in heating-cooling process of
BOPP films with using 90o polarizer………………………………………..37
23) Dichroism for 973 cm-1 band in heating-cooling process of BOPP…………38
24) Dichroism for 998 cm-1 band in heating-cooling process of BOPP films ….39
25) Amorphous/crystallinity ratio of BOPP film during the cycle process....…..40
26) Dichroic ratio of 973cm-1 band in BOPP film during the cycle process…….41
27) The representation of shift at 973 cm-1 band with increasing temperature….43
28) The representation of shift at 973 cm-1 band………………………………..43
29) Deconvolution of 973cm-1 into 972 and 974cm-1 for room temperature……44
30) Deconvolution of 973cm-1 into 972 and 974cm-1 for 150oC………………..44
31) Deconvolution of 973cm-1 into 972cm-1 and 974cm-1 for after returning to
room temp…………………………………………………………………...45
32) Raman Spectra of CPP film after heated to shown temperature and
cooled………………………………………………………………………..46
33) FT-IR spectra of BOPP film along machine direction after heated at 120oC in
different waiting times………………………………………………………47
34) FT-IR spectra of BOPP film along transverse direction after heated at 120oC
in different waiting times……………………………………………………47
35) Polarized-FT-IR spectra of BOPP film along machine direction after heated
at 120oC in 20 minutes………………………………………………………48
36) Polarized-FT-IR spectra of BOPP film along transverse direction after heated
at 120oC in 20 minutes………………………………………………………49
37) XRD pattern of CPP films. a at room temperature, b, c, d, e were heated to
60, 100, 130, 1400C respectively and then cooled to room temperature……50
38) XRD pattern of BOPP films. a at room temperature, b, c, d, e were heated to
60, 100, 130,140oC respectively and then cooled to room temperature…….51
39) The representation of heating to 150oC on BOPP film……………………..51
40) XRD pattern of machine direction of BOPP films heated at 120oC………..53
41) XRD pattern of transverse direction of BOPP films heated at 120oC………53

XIII
42) XRD pattern of BOPP films stretched in machine direction after heated to
150oC and cooled……………………………………………………………54
43) XRD pattern of BOPP films stretched in transverse direction after heated to
150oC and cooled……………………………………………………………55
44) The representation of phase transition with increasing temperature………..56
45) The Raman spectra of BOPP film…………………………………………...57
46) The Raman spectra of CPP film.…………………………………………….58
47) The Raman spectra of CPP films at room temperature, after heated to 140,
150, 160oC and cooled to room temperature………………………………...60
48) The Raman spectra of BOPP film in transverse direction…………………..61
49) The Raman spectra of BOPP film in machine direction…………………….61
50) The Raman spectra of BOPP film with different width of hole…………….62

1
1. INTRODUCTION 1.1. Polypropylene and Its Properties 1.1.1. Polypropylene
Paul Hogan and his fellow research chemist Robert Bank, in 1951, invented crystalline
polypropylene. In 1954, it was synthesized by G. Natta who discovered a new
polymerization mechanism, in which a transition metal compound bears a metal-carbon
bond able to carry out a repeated insertion of olefin units. By this way, the random
structural arrangement of non-crystallizable polymers could be transformed into
structures having high chemical and geometrical regularity. Many types of catalysts
were improved to get polypropylene. Nowadays, metallocenes are widely used as
catalysts, because these catalysts provide enhanced control over the molecular make up
of polypropylene and grades with extremely high isotacticity [1].
Polypropylene, a thermoplastic material, is produced by polymerizing propylene
molecules into long polymer molecules, as exhibited in scheme.1. It is linear
hydrocarbon chain containing no unsaturation [2].
Scheme.1: Structure of polypropylene.

2
Polypropylene, density of which is 0.905g/cm3, is the lightest polymer. It is the
semicrystalline polymer including both crystalline and amorphous phases. Its crystalline
melting point, depending on the grade and the frequency/heat rate, is between 160-
170oC. Due to its lower thermal conductivity, it can be used in insulation applications
such as food packaging. As other plastics, polypropylene has considerably higher
thermal expansion coefficient than metals. It thus leads to internal stresses and stress
concentrations. The mechanical properties of polypropylene depend strongly on the
molecular weight. Decreasing molecular weight leads to a reduction in tensile strength,
stiffness, and hardness of polypropylene. This effect of molecular weight on
polypropylene is contrary to most plastics. Moreover, it is an excellent electrical
insulator, as can be expected from a non-polar hydrocarbon. Due to this property, it is
used in insulating power cable, particularly for telephone wires. Polypropylene granules
are white and translucent. However, the last appearance of the material changes from
hard and colored to flexible and transparent depending on processing. When required,
transparency can be improved by moulds or dies [3, 4].
Density 0,905 g/cm3 Melting Point 160-170oC Maximum Continous Use Temperature
100oC
Tensile Strength 33Mpa Temperature of Deflection under load (18MPa)
55oC
Temperature of Deflection under load (0.45MPa)
85oC
Thermal Expansion Coefficient
1,35x10⁻⁴
Volume Resistivity (Ωcm) 1017
Table.1: Basic Properties of Polypropylene

3
As a non-polar hydrocarbon, it has extraordinary chemical resistance to organic and
inorganic reagents. Indeed, there is not any solvent to dissolve polypropylene at room
temperature. In addition, it is not affected by most concentrated acids and bases.
However, it is vulnerable to oxidizing agents such as pure fuming nitric acid and
sulphuric acids. Polypropylene is accepted as a non-toxic and non-carcinogenic material.
Also, it does not have a nutrient medium for microorganism attacking [3].
1.1.2. Types of Polypropylene
According to the steric arrangement of methyl groups attached to CH group in the chain,
the character of polypropylene is different. In scheme.2, the structure where methyl
groups are substituted randomly on the polymer chain is the atactic form in which
polypropylene is an amorphous material and its strength is low.
CH2 CH
CH3
CH2 CH CH2
CH3
CH
CH3
CH2 CH
CH3
Scheme.2: Atactic-polypropylene
If a methyl group is bonded to CH group in one side and the other one is bonded to CH
group in opposite direction like in scheme.3, this polypropylene is known as
syndiotactic.

4
CH2 CH CH2 CH CH2
CH3
CH CH2 CH
CH3
CH3CH3
Scheme.3: Syndiotactic-polypropylene
If all methyl groups attached to chain are on the same side, as indicated in scheme.4, this
polypropylene is named as isotactic. In addition, isotacticity word means the measure of
the percentage of side methyl groups on only one side. For industrial use, isotacticity of
polypropylene varies between 85% and 95%.
CH2 CH
CH3
CH2 CH CH2
CH3
CH
CH3
CH2 CH
CH3
Scheme.4: Isotactic-polypropylene
TYPE PROPERTY Isotactic-Polypropylene Its melting point varies between 160-
170oC. It is strong and hard with excellent resistance to stress, cracking, and chemical reaction. It has high crystalline content.
Syndiotactic-Polypropylene Its melting point varies between 125-130oC. It is softer than isotactic polypropylene, and also is tough and clear. It is stable to gamma radiation. It has lower crystalline content according to isotactic polypropylene.
Atactic-Polypropylene Its melting point is above 0 oC. It is really soft polymer and has little strength. It has almost only amorphous content.
Table.2: Basic Properties of Isotactic, Syndiotactic, and Atactic Polypropylene

5
In table.2, basic properties of atactic, syndiotactic, and isotactic polypropylene are
illustrated. However, only isotactic polypropylene among them has the proper properties
needed for a good and useful plastic material due to its greater stiffness, hardness, tensile
strength and modulus [3].
1.1.3. Advantages of Polypropylene
Especially, compared to polyethylene, it has higher stiffness at lower density and
resistance to higher temperatures. In addition, good chemical resistance, environmental
stress cracking resistance, good hardness, contact transparency, ease of machinig and
cheapness can be said as other positive sides of polypropylene [3].
1.1.4. Disadvantages of Polypropylene
Compared to other thermoplastics, higher mould shrinkage, lower impact strength and
higher thermal expansion are disadvantages of polypropylene. Moreover, it has poor UV
resistance in the presence of certain metals. The tertiary carbon atom in the chain gives a
possibility for oxidation so that polypropylene has low stability compared to
polyethylene. Other shortcomings of polypropylene are poor flammability, difficult
solvent and adhesive bonding, and troubles in frictional applications [3,5].

6
1.1.5. Application Fields
Polypropylene has been one of the most important plastics for the last four decades.
After polyethylene and polyvinylchloride, it is third largest plastic consumed.
Polypropylene is used in video cassettes, luggage, toys, radiator expansion tanks,
bumper covers, wheel covers, battery cases, artificial sport surfaces, monofilaments for
rope and cordage, packaging sacks, staple fibres, coarse fibres, filament yarns,
microwave oven cabinet, refrigerator parts, margarine tubs, disposable food trays, blister
packaging, hot wire reservoirs, heat exchangers, pressure pipes etc [1,2,6,7].
1.1.6. Crystallinity
An amount of crystalline and amorphous phases in polymer depends on structural and
stereochemical characteristics of chains and how are performed the fabrication such as
extrusion, thermal history or molding. Thermal history of polymers is a significant point
for the degree of crystallinity of them. Whereas rapid quenching gives high crystalline
product, annealing and slow cooling causes low crystalline product. High crystallinity
leads to increase in hardness, strength, wear resistance. Low crystallinity causes good
processibility, better transparency. The linearity of the molecular chains in
polypropylene provides them packing ability in an ordered crystal structure. Branching
in the chain causes decreasing regularity of the structure. The tacticity of the chain
governs the degree of crystallinity of polypropylene. High tacticity means that the
presence of long and uninterrupted sequences. The greater tacticity means that the
greater crystallinity.
The stereochemistry of the polypropylene chain strongly affects the crystallinity. Fig.1
shows that wide angle XRD patterns of isotactic, syndiotactic and atactic polypropylene.

7
Whereas polypropylene chain for isotactic and syndiotactic give crystalline reflections,
there is a very broad scattering observed in atactic polypropylene [1, 2].
Fig.1: Wide angle X-ray scattering patterns of isotactic, syndiotactic and atactic PP.
1.1.6.1. α and β crystalline forms
In the crystalline state, isotactic-polypropylene can be found in several different forms.
These forms denote different crystallographic symmetries. All of the different crystalline
forms are constituted from chains in a 31 helical conformation with a common repeat
distance (approximately 6.5Ao), but differentiate in unit cell symmetry, structural
disorder and inter-chain packaging. The α-form is superior to other forms. It is arranged
on a monoclinic unit cell, which is illustrated in fig.2.

8
Figure.2: Monoclinic form. Figure.3: Hexagonal form.
In monoclinic form, all the axes are different lengths. Two of them, the A and C axes,
meet at 90°,but the third one does not. For monoclinic form of polypropylene, unit cell
parameters are assigned as a=6.6Ao b=20.8Ao c=6.5Ao [1, 8].
β crystalline form, which is rare compared to α-form, is stacked on hexagonal unit cell
as shown in fig.3. Numerous unit cell structures of β-form were reported and there is
controversial debate about assigning unit cell parameters in literature [9-11]. The
simplest satisfactory model for β-form is smaller trigonal or hexagonal unit cell with
a=b=11.03Ao and c=6.49Ao. The formation of β crystallinity leads to a unit cell structure
with lower density, lower melting point, metastability compared to the α-form. These
display a lower degree of order in the crystalline state of the β-form with respect to that
of the α-form [1].

9
1.1.7. Preparation of PP Films
1.1.7a. Cast Film (CPP)
In cast film producing processes, extruding of polypropylene through a die onto chill roll
or water quench techniques is used. The film thickness is controlled by the gap between
the die slips or by the rotational speed of the chill roll. Unorientation and softness are
basic properties of cast film [6].
1.1.7b. Biaxially Oriented Film (BOPP)
As illustrated in figure.4, the film itself is stretched in one or two directions with a
tentering frame, a device that keeps the edges in clamps that move outward to stretch the
sheet in the cross-machine direction. In production of biaxially oriented film, extruded
sheet is drawn firstly in machine direction and then in the transverse direction. Draw
ratios of 4 X 7 and 6 X 10 are common.
Stretching the film under controlled temperatures can improve certain properties of
polypropylene. By the biaxial stretching of film, deformation resistance of film
increases. Table.3 states that after stretching, material has a considerably greater tensile
strength and lower elongation at break in the stretching directions [3].

10
Figure.4: The representation of stretching of polypropylene.
Property Cast Film Biaxially Oriented
Tensile Strength - Machine
Direction (MPa)
39 180
Tensile Strength - Transverse
Direction (MPa)
22 152
Elongation at break – machine
direction (%)
425 80
Elongation at break –
transverse direction (%)
300 65
Table.3: Comparison of Cast and Biaxially oriented films

11
1.2. Tools for Studying Properties of Polypropylene
1.2.1. Infrared Spectroscopy
Infrared spectroscopy relies on an alteration in the permanent dipole moment of the
chemical bond with vibrational normal mode in order to produce absorption. Infrared
spectroscopy, rapid and sensitive with sampling techniques that are easy to use, is one of
the most commonly used spectroscopic methods. A list of application areas of IR in
polymers can be roughly said as measuring the concentration of end groups, determining
the reaction order and chemical processes, investigating the structural changes produced
by chemical reactions, characterizing copolymers, measuring stereoregularity,
conformation, and branching, characterizing polymer blends, measuring morphological
units in polymers, and investigating crystallinity and orientation etc. For various studies
in polypropylene, IR spectroscopy is already highly recommended for determining the
orientation of polypropylene films [12-15].
1.2.1a. Infrared Spectrum and Bands of Polypropylene
The mid-infrared spectrum of isotactic polypropylene has been studied extensively
during last five decades. Many types of vibrations, such as C-C chain stretching, CH3
rocking, CH2 rocking occur at the mid-infrared spectrum of polypropylene. Typical
infrared spectrum of polypropylene film and the assignment of bands are as shown
below.

12
1 4 0 0 1 3 0 0 1 2 0 0 1 1 0 0 1 0 0 0 9 0 0 8 0 0
0 , 0
0 , 5
1 , 0
1 , 5
2 , 0
2 , 5
3 , 0
w a v e n u m b e r ( c m - 1 )
ab
s
Figure.5: Infrared absorption spectrum of a 20µm unoriented polypropylene film (CPP).
Frequency Phase Angle Assignment 809 cm-1 Crystalline ⊥ CH2 rocking, C-C chain stretching, C-CH stretching
841 cm-1 Crystalline | | CH2 rocking ,C-CH3 stretching
899 cm-1 Crystalline ⊥ CH3 rocking, CH2 rocking, CH bending
941 cm-1 Crystalline ⊥ CH3 rocking, C-C chain stretching
973 cm-1 Amorphous | | CH3 rocking, C-C chain stretching
998 cm-1 Crystalline | | CH3 rocking, CH2 wagging, CH bending
1045 cm-1 Crystalline | | C-CH3 stretching, C-C chain stretching, CH bending
1104 cm-1 Crystalline ⊥ C-C chain stretching, CH3 rocking , CH2 wagging
1168 cm-1 Crystalline | | C-C chain stretching, CH3 rocking, CH bending
1220 cm-1 Crystalline ⊥ CH2 twisting, CH bending, C-C chain stretching
1256 cm-1 Crystalline&
amorphous
| | CH bending, CH2 twisting, CH3 rocking
1377 cm-1 Crystalline&
amorphous ⊥ CH3 symmetric bending, CH2 wagging
Table.4: Assignment for absorption bands of polypropylene.
13
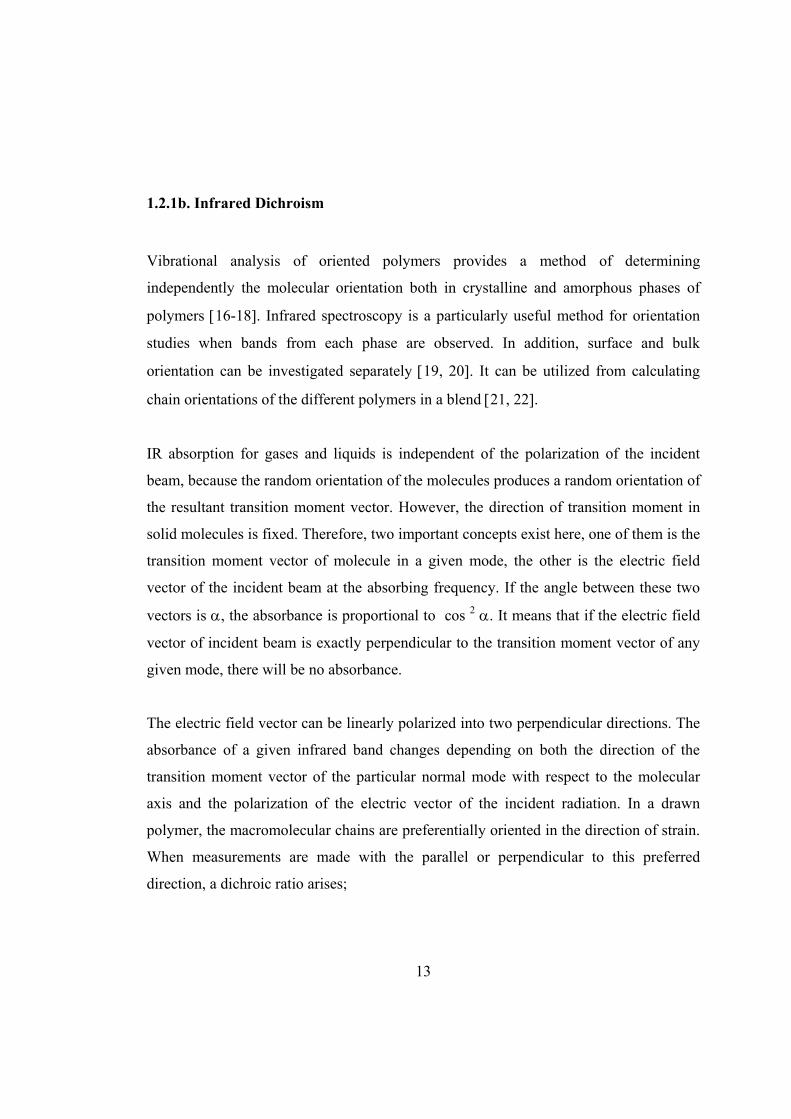
1.2.1b. Infrared Dichroism
Vibrational analysis of oriented polymers provides a method of determining
independently the molecular orientation both in crystalline and amorphous phases of
polymers [16-18]. Infrared spectroscopy is a particularly useful method for orientation
studies when bands from each phase are observed. In addition, surface and bulk
orientation can be investigated separately [19, 20]. It can be utilized from calculating
chain orientations of the different polymers in a blend [21, 22].
IR absorption for gases and liquids is independent of the polarization of the incident
beam, because the random orientation of the molecules produces a random orientation of
the resultant transition moment vector. However, the direction of transition moment in
solid molecules is fixed. Therefore, two important concepts exist here, one of them is the
transition moment vector of molecule in a given mode, the other is the electric field
vector of the incident beam at the absorbing frequency. If the angle between these two
vectors is α, the absorbance is proportional to cos 2 α. It means that if the electric field
vector of incident beam is exactly perpendicular to the transition moment vector of any
given mode, there will be no absorbance.
The electric field vector can be linearly polarized into two perpendicular directions. The
absorbance of a given infrared band changes depending on both the direction of the
transition moment vector of the particular normal mode with respect to the molecular
axis and the polarization of the electric vector of the incident radiation. In a drawn
polymer, the macromolecular chains are preferentially oriented in the direction of strain.
When measurements are made with the parallel or perpendicular to this preferred
direction, a dichroic ratio arises;

14
Dichroic Ratio: A0 / A90
A0 is the absorbance for the linearly polarized light parallel to the chain axis , A90 is the
absorbance for the linearly polarized light perpendicular to the chain axis. This ratio can
change from zero to infinity. For an unoriented polymer, no dichroism occurs and also
the ratio is equal to 1 [23].
A schematic description of using of polarizer is given in figure.6 and figure.7 depicts the
infrared absorption spectra of polypropylene recorded with two different polarizers. The
dichroism sensitive bands are denoted by *.
Detector IR Beam
Unpolarized
Polarizer Sample
Figure.6: Schematic representation of polarizer in FTIR

15
1 4 0 0 1 3 0 0 1 2 0 0 1 1 0 0 1 0 0 0 9 0 0 8 0 0
0 0
9 0 0
w a v e n u m b e r (c m -1 )
*
*
* *
*
*
*
* * *
ab
s.
Figure.7: Infrared spectra of BOPP with using 0o and 90o polarizers.
1.2.2. Raman Spectroscopy
Raman spectroscopy, which is a complementary technique to infrared spectroscopy, also
measures the vibrational energy levels. It is based upon a change in the induced dipole
moment or polarization to produce Raman scattering. When a beam of light strikes a
molecule, it can be either absorbed or scattered. Most of the photons are scattered
elastically, and this is termed as Rayleigh scattering. A few of the photons (1 in 108) are
scattered inelastically, and this is named as Raman scattering. These Raman scattered
photons, having different frequencies, constitute the Raman spectrum of the molecule.
Due to the high sensitivity of the Raman effect for certain non-polar groups like C-C
bonds, Raman spectroscopy is used for analysis of chemical composition and structure

16
of polymers. Moreover, it can be utilized for determining of the configuration, tacticity
and conformation of polymer chains [12, 24].
1 4 0 0 1 3 0 0 1 2 0 0 1 1 0 0 1 0 0 0 9 0 0 8 0 0
1 5 0 0 0
2 0 0 0 0
2 5 0 0 0
inte
ns
ity
w a v e n u m b e r ( c m - 1 )
Figure.8: Raman Spectrum of Polypropylene Film.
1.2.3. XRD
The atomic planes of a crystal cause an incident beam of X-rays to interfere with one
another as they leave the crystal. The phenomenon is called X-ray diffraction. XRD is
used to identify crystalline phases and orientation. In addition, it can be exploited to
determine atomic arrengement and structural properties. For measuring the thickness of
thin films and multi-layers, XRD is useful method. Since many plastic polymers are crystalline or semicrystalline, they can be identified and
studied by X-ray diffraction methods. In fact, the percent crystallinity in a polymer can
be determined due to the fact that it has variable crystallinity degree. Polymers, for
instance polypropylene, have generally polymorphic forms, for which α, β, γ and
mesomorphic forms can be stated. Since phase transformations among them can be

17
existed with increasing temperature or changing other parameters, these transformations
can be determined using XRD [1, 25, 26].
The corresponding unit cells for observed lines and typical XRD pattern of
polypropylene, including α and β phases, are illustrated in table.3 and figure.8
respectively [27-33].
2θ Unit Cell Crystalline form
14.0 o (110) α
16.0 o (300) β
17.0 o (040) α
18.5 o (130) α
21.2 o (301) β
21.5 o (111) α
Table.5: XRD peaks of polypropylene and corresponding unit cells.

18
Figure.9: Typical XRD pattern of polypropylene.
1.3. Effect of Temperature on the Crystallinity and Orientation
A heat treatement may lead to changes in structure and morphology of the material on
different scales, such as macromolecular chain, lamellea structure and bulk [34]. Heating
of polypropylene has a strong influence on its crystallinity and orientation. Infrared
spectroscopy has been oftenly used to understand this relation. The infrared spectrum of
i-PP has a number of bands depending on the conformations of the individual chains.
These bands, 1330, 1303, 1220, 1167, 1100, 998, 940, 900, 841, and 808 cm-1, are
called regularity bands. In addition, all of them are crystalline bands. Hendra et al. [35]
observed that considerable changes occur in high crystalline polypropylene at about
130-135oC. Hendra scaled the peak absorbance as a function of temperature for several
1 0 1 2 1 4 1 6 1 8 2 0 2 2 2 42 Θ
intensity
1 1 0
3 0 0
0 4 0
1 3 03 0 11 1 1α
α
αα
β
β

19
infrared regularity bands. In the figure.10, 900 and 1220 cm-1 (crystalline bands), 973
cm-1 (amorphous band), are compared according to increasing tempearture. The
absorption of regularity bands, 900 and 1220 cm-1, decreases much more rapidly beyond
130o C. However, there is still a linear decrease of absorbance at 973 cm-1, non-
regularity band, beyond 130o C. Similar decreases in absorbance of 841 and 1167cm-1
were observed by Lamberti [36]. Yan et al. [37] stated that there is a great decrese in
the intensity of 841, 998 and 1220 cm-1 bands at above 170.5oC.
Figure.10: Temperature dependence of infrared bands, cross, filled circle, unfilled circle
refer to 900, 973 and 1220 cm-1 respectively.
Later, Yan et al. [38] tried to elucidate this change at 135oC using almost all regularity
bands. In figure.11, with increasing the temperature, firstly, the intensity of 940 cm-1

20
bands decreases much more rapidly, then the 1220, 1167, 1303, 1330, 841, 998, 900,
808, and 1100 cm-1. The intensity of 973 cm-1 does not change appreciably. They stated
that the longer helix length of isotactic sequence leads to faster intensity decrease of the
correspondent band.
Figure.11: Temperature dependence of regularity bands: (1) 940 cm-1, (2) 1220 cm-1, (3)
1167 cm-1, (4) 1303 cm-1, (5) 1330 cm-1, (6) 841 cm-1, (7) 998 cm-1, (8) 900 cm-1, (9)
808 cm-1, (10) 1100 cm-1, (11) 973 cm-1.
Zhu et al. [39] also tried to show that there is a relationship between heating and
orientation. Based on polarization infrared spectroscopy, they performed in-situ
measurement of orientation change of of macromolecular chains in uniaxially stretched
i-PP upon heating. In their study, during heating, dicroic ratio of 1220 cm-1 (crystalline
band) and 2725 cm-1 (amorphous band) decreased to approximately 1, it means that
orientation disappeared.

21
1.4. Shifts in IR bands
Painter et al. [40] observed that differences in frequencies of i-PP having different
degrees of crystallinity. They assigned 973 cm-1 band as the superposition of two close
peaks, one of them is located at 972 cm-1 (crystalline) and the other is located at 974 cm-1
(amorphous). In that study, 973 cm-1 band was observed at 974 cm-1 for polypropylene
which was prepared by quenching into ice-water producing smectic phase. However,
this band was detected at 973 cm-1 for polypropylene prepared by annealing which gives
monoclinic form. In addition to this study, 975 cm-1 in amorphous phase of the
quenched sample shifted to 972 cm-1 in the ordered phase of the annealed sample.
1.5. Permeability of Polypropylene
Whereas polypropylene is impermeable to water and other liquids, gases penetrate
through it. Mechanical and barrier properties of polypropylene are continuously tried to
make better, since it plays a crucial role in packaging industry. At this stage, its
crystallinity and orientation are paid attention, due to the fact that there is a strong
relation between gas permeability and crystallinity/orientation. Vries indicated, in
figure.12, increasing of molecular orientation of amorphous phase in polypropylene
leads to decreasing of gas permeability [41].

22
0 , 0 0 , 1 0 , 2 0 , 3 0 , 4 0 , 50 , 0
0 , 5
1 , 0
1 , 5
2 , 0
2 , 5
3 , 0
3 , 5
4 , 0
4 , 5
5 , 0
5 , 5
P O2x
101
6 mo
l /
Pa
.s.m
f a m ( u n i t le s s )
Figure.12: Representation of relation between gas permeability and orientation.
In addition, humidity and oxygen permeability of CPP (unoriented) and BOPP (oriented)
were measured by Polinas A.C. In table.6 and 7, humidity and oxygen permeability of
BOPP is low compared to humidity.
Humidity
Permeability
(gr/m2 per day)
1.measurement 2.measurement Average
CPP (unoriented) 9.82 9.84 9.83
BOPP (oriented) 3.66 3.56 3.61
Table.6: Humidity permeability of CPP and BOPP films.

23
Oxygen
Permeability
(gr/m2 per day)
1.measurement 2.measurement Average
CPP (unoriented) 2825 2937 2881
BOPP (oriented) 1235 1126 1181
Table.7: Oxygen permeability of CPP and BOPP films.
1.6. Aim of the Present Study
In the present study, we have set at three aims. Firstly, we try to understand better
crystallinity & orientation changes in polypropylene, because oxygen permeability and
shelf-life are important issue related to crystallinity and orientation of polypropylene
films.
Secondly, we determined phase transition (from β form to α form) in CPP film using
both XRD and FT-IR with increasing the temperature. Our purpose was to determine
this phase transition using FT-IR, which is a more practical and common instrument.
Thirdly, since infrared spectroscopy is one of the most frequently used spectroscopic
technique; our objective is to apply IR as both fast and practical method on measuring
crystallinity-amorphous content, detecting phase transitions and orientation changes.
24
2. EXPRIMENTAL 2.1. Materials The polymers, which were used in our experiments, were received from Polinas A.Ş.
These polimers were prepared as thin film. Those used polymers in this work are
listed below.
a) CPP (cast polypropylene) has 28µm thickness.
b) BOPP (biaxially oriented polypropylene) has 28µm thickness. It was drawn
five times along machine direction and then ten times along transverse
direction.
c) β-CPP (cast polypropylene) has β-crystallinity. It has a higher thickness
compared to polypropylene films having no β-form.
d) β-MPP (mono oriented polypropylene) has β-crystallinity. Its thickness is
higher relative to polypropylene films having no β-form.
We reduced the thickness of polypropylene films having β-form to be able to record
their infrared spectra. We did not make additional process on films such as
purification.
2.2 Tools We mainly utilized FT-IR and Raman spectrometer, X-Ray Diffraction and
equipments related with heating. Table.8 indicates tools and their models in our
experiments.

25
Tool Model
Thermocouple J-Type
Heater/Controller Harrick 1600
FTIR Spectrometer Bomem 102 MB
X-Ray Diffractometer Rigaku Miniflex diffractometer high
power Cu-Kα source operating at
30kV/15mA
Raman Spectrometer Jobin Yvon Labram 5/203 IM
Table.8: Type of instruments and tools.
2.2.1. Temperature Controller and Its Calibration
Our digital temperature controller and its accompanying thermocouple provide
temperature regulation over an extensive temperature range (for J type
thermocouples from -73 to 760oC). Since temperature used in this study was not
higher than 175oC, indium was selected for calibration of the temperature controller
because melting point of indium is 156.6oC. Our measurement value was determined
as 156.2±0.5 which was satisfactory for our purpose. To heat the sample, 40% of
output voltage is generally used. To reach above 170oC, this output voltage was
increased to 50%.
2.2.2. In-situ FT-IR Spectrometer In-situ FT-IR analysis is widely used in this study. When measuring the orientation
using polarized-FT-IR, we often performed experiments in-situ. In-situ technique
means that heating the sample and recording the spectrum occur simultaneously. It
gives us an important knowledge about the changes during heating. A schematic

26
Heater& Temp. controller
Thermo- couple
Sample holder
source
representation of our system for in situ analysis of polymers is presented in fig 13.
The FT-IR spectra of all polypropylene films were recorded in the range of 4000-
400cm-1 with 4cm-1 resolution and 128 scans. For recording small shifts in the bands
to follow phase transitions, the spectrum of film was recorded with 2cm-1 resolution
and 64 scans.
Fig.13: Experimental set up
2.2.3. XRD X-ray diffraction patterns were recorded using Rigaku Miniflex diffractometer with
high power Cu-Kα source operating at 30kV/15mA. Polypropylene films were

27
placed on a glass lamella. XRD patterns of these films were collected with a scan
rate of 10 degree/min in the range of 10-40o. Duplicate measurements were done to
ensure reproducibility.
2.2.4. Raman Spectrometer We used Raman spectrometer with 632.81nm as excitation wavelength supplied by
an internal He-Ne 20mW laser. Before recording Raman spectrum of a sample, the
instrument must be calibrated. Without the laser light, the position of peak must be
positioned to zero should be exactly at zero and the intensity of this peak must be
maximized. Firstly, 10x objective is used to focus the light. Raman spectra of CPP
and BOPP films are collected with 100x objective, 1100µm hole, 200µm slit interval,
and 600 grooves/mm grating. The range of 200-1600cm-1 is scanned 10 times and
duration of each scan is 10 seconds. To record spectra in machine and transverse
directions of films, sample holder can be rotated by 90o. The width of confocal hole
can be reduced from 1100µm to 200µm for extracting information about depth
profile. As depicted in figure.14, with increasing the confocal hole, the deeper of
sample can be focused. Also, the higher intensity can be obtained from the wider
confocal hole, because most of the scattered light is in focus.
Figure.14: The representation of scattered light from sample on confocal hole.

28
2.3. Procedure In a typical experiment, we followed the pathway described below.
• Alignment of source and background are recorded.
• The polypropylene film is placed on top of a silicon wafer in the sample
holder and its close contact with the wafer is ensured by the screws if studied
above 150oC. Below 150oC, silicon wafer is not needed.
• For orientation measurements, polarizer is put in front of sample.
• Heater/temperature controller and thermocouples are connected to the sample
holder properly.
• At room temperature and during heating, infrared spectrum of the sample is
recorded. Once the desired temperature is reached, spectra are recorded for 3
hours in 30 minutes intervals for the crystallization experiments, for one hour
in 20 minutes time intervals in the orientation experiments. A schematic
representation of the temperature profile is depicted in fig 15.
Figure.15: The representation of heat profile.
ROOM TEMP
ROOM
TEMP. / oC
TIME(0-3hours)
DESIRED TEMP.

29
3. RESULTS AND DISCUSSION 3.1. Crystallinity Studies
Changes in crystallinity as a function of temperature were investigated by
interpreting the alterations in the infrared bands of polypropylene. A set of spectra at
various temperatures as a spectroscopic fingerprint of the crystallinity is depicted in
fig.16. When temperature increases, the intensity of 809, 841, 899, 998, 1045, 1220,
1168, and 1256 cm-1 bands, belonging to crystallinity phase, weaken and then
disappear. However, 973 and 1153 cm-1 bands, belonging to amorphous phase,
remain unchanged. 1377 cm-1 band, having partially amorphous character, does not
change significantly. This is the indication that crystallinity decreases with increasing
temperature similar to previous studies[37, 38]. We have paid attention to what
happens after polypropylene films were cooled to room temperature. Furthermore,
the crystallinity bands reappear after cooling to room temperature is completed. Yan
et al. [42] reported that a similar crystallization occurred in both cooling to room
temperature at a rate of 20o C/min for non-isothermal crystallization and cooling to
120oC for isothermal crystallization.
We selected the 973cm-1 (amorphous) and 998cm-1 (crystalline) bands to follow the
crystallinity changes in detail. Interpretation of fig.17 and 18 is a good way to
understand the crystallinity behavior of polypropylene with respect to temperature.
As shown in fig.17, there is no significant change in absorbance of 973 cm-1 band
during heating-cooling process. Although there are small fluctuations for heating to
168, 170, and 172oC, they do not lead to significant changes on the intensity of this
band. The reason for 973 cm-1 band which has almost same intensity during this
process is due to its amorphous character. During waiting at 177oC, there is a great

30
decrease in intensity of this band, because of the destruction of helical sequences of
polypropylene. However, fig.18 depicts that 998 cm-1 band does not behave like 973
1 4 0 0 1 3 0 0 1 2 0 0 1 0 0 0 9 0 0 8 0 0w a v e n u m b e r ( c m - 1 )
r o o m t e m p
b a c k t or o o m t e m p
i n c r e a s i n g
t e m p e r a t u r e
ab
s.
Figure.16: Effect of increasing temperature on the bands of polypropylene.
cm-1 band at all. Especially, as temperature increases initially, there is a significant
decrease in the absorbance of 998 cm-1 band. For 168, 170, 172oC, area of this band
decreases to 1.4, 0.7, and 0.25 respectively. Due to the fact that 998 cm-1 is a typical
crystalline band, this band loses its intensity with increasing temperature. During the
waiting period, there is an increase in the absorbance of this band. After returning
back to room temperature, there is a sharp increase in the absorbance except 177oC.
Due to the destruction of helix at 177oC, the band cannot reach its initial value.

31
-0,5
0,0
0,5
1,0
1,5
2,0
2,5
3,0
3,5
4,0
room temp.
0 30 60 90 120 150 180
1680C
1700C
1720C
1770C
room temp .
temperatures shown at below are constant in this region
time(minute)
inte
nsity
(ar
ea)
Figure.17: Intensity plot of CPP films for 973cm-1 band during heating-cooling
process.
Fig.19 gives the ratio of the intensity, as determined from the areas of the peaks, of
973 cm-1 to 998 cm-1 during heating-cooling process of CPP film. It can be easily
observed that amorphous/crystallinity ratio increases initially from room temperature
to 168, 170, 172 and 177oC, but the ratio steadily decreases during the waiting period
for 168, 170, and 172oC. The ratio at 172oC is higher than ratio at 170oC, and the
ratio at 170oC is higher than at 168oC. After returning back to the room temperature,
amorphous/crystallinity ratio drops back to approximately the initial value.

32
0,0
0,5
1,0
1,5
2,0
2,5
3,0
3,5
4,0
0 30 60 90 120 150 180
1680C
1720C
1700C
1770C
room temp.
room temp
temperatures shown at below are constant in this region
time (minute)
inte
nsity
(ar
ea)
Figure.18: Intensity plot of CPP films for 998cm-1 band during heating-cooling process.
It can also be observed from fig.19 that intensity ratio of 973 cm-1 to 998 cm-1 bands
at 177oC is constant for about sixty minutes. Therefore, it can be said that the
amorphous/crystallinity ratio can be controlled to some extent. However, as shown in
figure.19, the ratio of 973/998 decreases after the end of first hour and cannot return
its initial value which is an indication that polypropylene starts decompose at and
above this temperature.

33
0
2
4
6
8
10
12
14
16
18
20
0 30 60 90 120 150 180
1770C
1720C
1700C
1680C
973/
998
time(minute)
room temp.
room temp.
temperatures shown at below are constant in this region in
tens
ity ra
tio
Figure.19: This plot shows that 973cm-1/998cm-1 ratio in heating-cooling process of
CPP films.
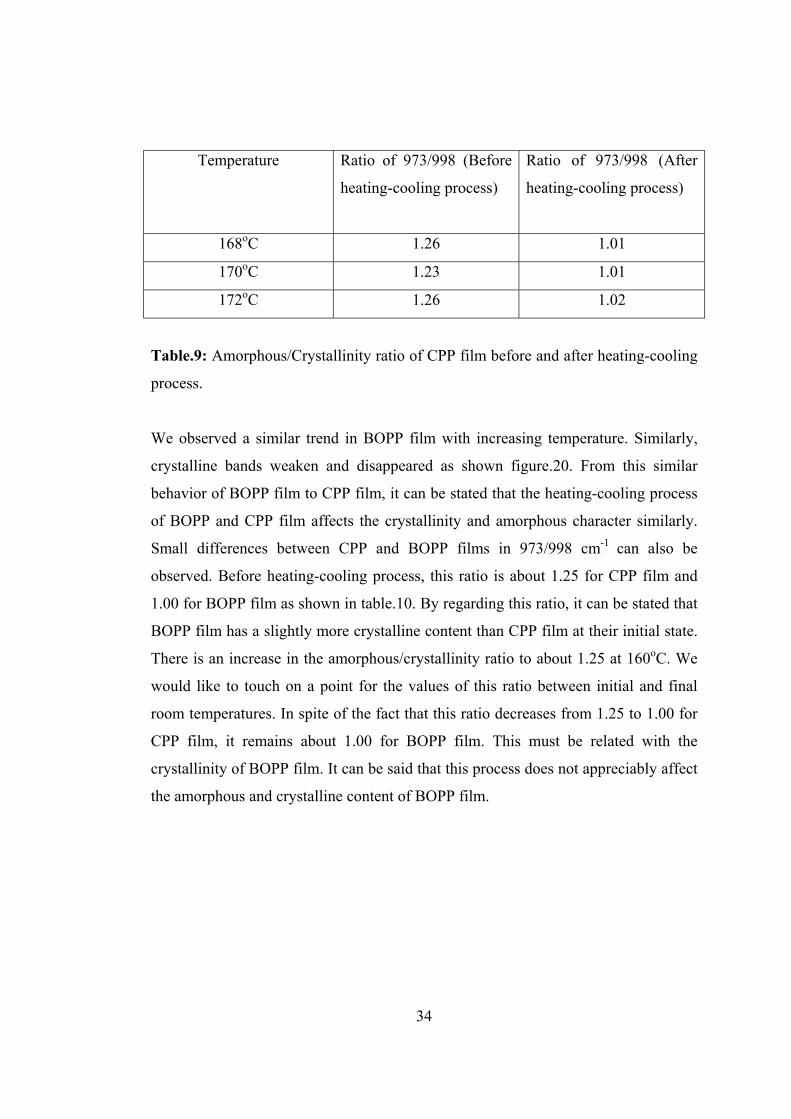
We observed that heating-cooling process leads to a slight increase of the
crystallinity in CPP film. As listed in table.9, 973/998 ratio decreases slightly from
about 1.25 to about 1.00 after the process completed. Waiting for three hours at 168,
170, 172oC results nearly same amorphous/crystallinity ratio.
34
Temperature Ratio of 973/998 (Before
heating-cooling process)
Ratio of 973/998 (After
heating-cooling process)
168oC 1.26 1.01
170oC 1.23 1.01
172oC 1.26 1.02
Table.9: Amorphous/Crystallinity ratio of CPP film before and after heating-cooling
process.
We observed a similar trend in BOPP film with increasing temperature. Similarly,
crystalline bands weaken and disappeared as shown figure.20. From this similar
behavior of BOPP film to CPP film, it can be stated that the heating-cooling process
of BOPP and CPP film affects the crystallinity and amorphous character similarly.
Small differences between CPP and BOPP films in 973/998 cm-1 can also be
observed. Before heating-cooling process, this ratio is about 1.25 for CPP film and
1.00 for BOPP film as shown in table.10. By regarding this ratio, it can be stated that
BOPP film has a slightly more crystalline content than CPP film at their initial state.
There is an increase in the amorphous/crystallinity ratio to about 1.25 at 160oC. We
would like to touch on a point for the values of this ratio between initial and final
room temperatures. In spite of the fact that this ratio decreases from 1.25 to 1.00 for
CPP film, it remains about 1.00 for BOPP film. This must be related with the
crystallinity of BOPP film. It can be said that this process does not appreciably affect
the amorphous and crystalline content of BOPP film.

35
1 3 0 0 1 2 0 0 1 0 0 0 9 0 0 8 0 0
ab
s.
w a v e n u m b e r (c m -1)
in
cre
asi
ng
tem
pe
ratu
re
ro o m te m p e ra tu re
a fte r c o o lin gto ro o m te m p .
Figure.20: The effect of increasing temperature on the bands of BOPP film in FT-
IR.
1.Measurement 2.Measurement 3.Measurement 4.Measurement
Before
heating-
cooling
process
1.01 1.02 1.00 1.02
At about
160oC
1.28 1.27 1.26 1.24
After
heating-
cooling
process
1.00 1.03 1.02 1.02
Table.10: 973/998 ratio in BOPP film with respect to temperature changes.

36
Figure.21 and figure.22 show that changes in crystallinity of BOPP films. The initial
increase of the temperature leads to an increase in amorphous/crystallinity ratio,
which is generally greater for higher temperatures. During waiting period, a gradual
decrease in this ratio is observed which return to initial values after returning back to
the room temperature. All of these lead us to conclude that the crystallinity behavior
of BOPP and CPP film is similar.
0,5
1,0
1,5
2,0
2,5
3,0
3,5
4,0
4,5
0 20 40 60
1750C
1700C
1600C
1550C 1650C
973/
998
time(min)
room temperature room temperature
temperatures shown at beloware constant in this region
inte
nsity
ratio
Figure.21: This plot shows that 973cm-1/998cm-1 ratio in heating-cooling process of BOPP films with using 0o polarizer.

37
0,8
0,9
1,0
1,1
1,2
1,3
1,4
1,5
1,6
1,7
1,8
1,9
2,0
155 160 165 170 175
0 20 40 60
room temproom temp
time (min)
973/
998
temperatures shown at boxare constant in this region
inte
nsity
ratio
Figure.22: This plot shows that 973cm-1/998cm-1 ratio in heating-cooling process of BOPP films with using 90o polarizer. 3.2. Orientation Studies We investigated the changes in the orientation of the films with temperature by
recording dichroic ratio of 973 and 998 cm-1 bands. Fig.23 and 24 give information
about dichroism for 973 and 998 cm-1 bands during heating-cooling process. As
shown in fig.23, the dichroic ratio is approximately 1.7 at room temperature. This
ratio is slightly higher for 155oC , but for 160, 165 ,170, and 175oC dichroic ratio is
lower. It can be easily inferred that dichroism does not change appreciably during
waiting period for these temperatures. After returning back to the room temperature,
dichroic ratio of 973 cm-1 band cannot return to its initial value. As indicated in

38
fig.24, dichroic ratio of 998 cm-1 band at 155oC is higher than that of 998 cm-1 band
at room temperature. Dichroic ratios at 160, 165 , 170, and 175oC are lower than that
at room temperature.
0,2
0,4
0,6
0,8
1,0
1,2
1,4
1,6
1,8
2,0
2,2
2,4
0 20 40 60
155oC
160oC
170oC
165oC
175oC
room temperature
room temperature
time(min)
dich
roic
ra
tio
are constant in this regiontemperature shown at below
Figure.23: Dichroism for 973 cm-1 band in heating-cooling process of BOPP.

39
0,2
0,4
0,6
0,8
1,0
1,2
1,4
1,6
1,8
2,0
2,2
2,4
1550C
1600C
1650C
1700C
1750C
0 20 40 60
dich
roic
ratio
time(min)
room temperature
temperature shown at below are constant in this region
roomtemperature
Figure.24: Dichroism for 998 cm-1 band in heating-cooling process of BOPP films
3.3. Heat Cycle
The cycle of the heating-cooling process was performed to investigate additional
changes. In the process, BOPP film was heated to 165oC and kept at this temperature
during one hour and this process is repeated one more time. As shown in fig.25, there
is a great similarity between first and second heating processes. After second heating
to 165oC, amorphous/crystallinity ratio increases to nearly same value as first
heating. At 165oC, 973/998 ratio fluctuates in the interval 1.7-1.85 for both first and
second heating with 90o polarizer. This value with 0o polarizer is about 1.35-1.45.
Moreover, amorphous/crystallinity ratio at room temperature is the same for the first

40
0,9
1,0
1,1
1,2
1,3
1,4
1,5
1,6
1,7
1,8
1,9
1650C1650C
0.980.980.97
1.111.101.13
room
tem
p
room
tem
p
room
tem
p
with 900 polarizer
with 00 polarizer
amorphous/crystallinity ratio
0 20 40 60 0 20 40 60
973/
998
inte
nsity
rat
io
time(min.)
and the second cooling to room temperature. This ratio is 0.97 at room temperature,
and 0.98 at after first and second cooling to room temperature with using 0o
polarizer. With using 90o polarizer, this ratio is approximately 1.1 for room
temperatures.
Figure.25: Amorphous/crystallinity ratio of BOPP film during the cycle process.
Fig.26 exhibits that dichroic ratio value does not change after first reaching to 165oC.
Orientation decreases after heating to 165oC, and it does not change by cycle process.
From these results, we can say multiple heating does not cause additional orientation
and crystallinity changes.

41
1 ,0 0
1 ,2 5
1 ,5 0
1 ,7 5
2 ,0 0
1 6 5 0 C1 6 5 0 C
d ic h r o ic r a t io f o r 9 7 3 c m - 1 b a n d
r o o m t e m p .r o o m t e m p .
r o o m t e m p .
0 2 0 4 0 6 00 2 0 4 0 6 0
dic
hro
ic r
ati
o
t im e ( m in . )
Figure.26: Dichroic ratio of 973cm-1 band in BOPP film during the cycle process.
3.4. Shifts in IR Bands We have also investigated the positions of the bands to follow the crystallinity and
orientation changes. By increasing the temperature, a shift in the 973cm-1 band is
observed in CPP films, while there is no change in the 998 cm-1 band. Moreover, we
did not observe shift at both 973 and 998cm-1 of BOPP films with respect to
temperature changes.
Experiment CPP BOPP
I) Room temperature
973.48 973.10
I) After heated to 600C and cooled to room temp.
973.48 973.12
II) Room temperature
973.46 972.85
II) After heated to 1000C and cooled to room temp.
973.21 972.92
III) Room temperature
973.49 973.00
III) After heated to 1300C and cooled to room temp.
973.08 973.07
Table.11: This table shows the effect of temperature increase on 973cm-1band.

42
Experiment CPP BOPP
I) Room temperature
997.67 997.69
I) After heated to 600C and cooled to room temp.
997.69 997.76
II) Room temperature
997.74 997.68
II) After heated to 1000C and cooled to room temp.
997.71 997.71
III) Room temperature
997.68 997.54
III) After heated to 1300C and cooled to room temp.
997.75 997.74
Table.12: This table shows the effect of temperature increase on 998cm-1 band.
As exhibited in table 11, the difference is approximately 0.4-0.5 cm-1 between CPP
and BOPP for the 973 cm-1 band. After heating to 60oC and cooling to room
temperature, this difference still remains. At 100oC, this difference decreases to 0.3
cm-1 but disappears at 130oC. Table 12 displays that there is no difference at 998
cm–1 band between CPP and BOPP. This band is observed at about 997.6 - 997.7 cm-
1 for these two samples.
To investigate shift at 973 cm-1 band in CPP film in detail, the film was heated to
110, 120, 130, 140 and 150oC, as indicated in fig. 27. The center of this band is
observed at 973.50 cm-1 for room temperature. At 150oC, its center shifts to 972.80
cm-1. The shifting of the band is proportional to increasing temperature. At 110 oC,
its center is approximately seen at 973.10 cm-1.

43
9 6 6 9 6 8 9 7 0 9 7 2 9 7 4 9 7 6 9 7 8 9 8 0
ab
s.
w a v e n u m b e r ( c m -1 )
2 5 0 C1 1 0 0 C1 2 0 0 C1 3 0 0 C1 4 0 0 C1 5 0 0 C
Figure.27: The representation of shift at 973 cm-1 band with increasing temperature.
After cooling back to room temperature, this band returns to its initial position. As
shown in fig.28 for heating to150oC and cooling, its center was detected at 973.1
cm-1, it means that there is still shift. For lower temperatures, the center of this band
is closer to 973.5 cm-1.
Figure.28: The representation of shift at 973 cm-1 band.
9 6 6 9 6 8 9 7 0 9 7 2 9 7 4 9 7 6 9 7 8 9 8 0
ab
s.
w a v e n u m b e r ( c m - 1 )
2 5 0 C1 1 0 0 C1 2 0 0 C1 3 0 0 C1 4 0 0 C1 5 0 0 C

44
These shifts might be related to changes in crystallinity of the film. Remembering
that 973 cm-1 band is the superposition of two close peaks, 972 cm-1 (crystalline) and
974 cm-1 (amorphous) [40], we deconvoluted 973 cm-1 band into 972 and 974 cm-1
bands. As illustrated in fig.29 , at room temperature, intensity of these bands are
nearly same. At 150oC, in fig.30 , whereas the intensity of 972 cm-1 increases, that of
974 cm-1 decreases. It is consistent with the shifting of the center of this band from
973.5 cm-1 to 972.8 cm-1.
9 6 3 9 6 6 9 6 9 9 7 2 9 7 5 9 7 8 9 8 1 9 8 4
e x p e r i m e n t a ld e c o n v o l u t e d
w a v e n u m b e r ( c m - 1 )
ab
s.
Figure.29: Deconvolution of 973cm-1 into 972 and 974cm-1 for room temperature.
9 6 3 9 6 6 9 6 9 9 7 2 9 7 5 9 7 8 9 8 1 9 8 4
e x p e r i m e n t a l
d e c o n v o l u t e d
w a v e n u m b e r ( c m - 1 )
ab
s.
Figure.30: Deconvolution of 973cm-1 into 972 and 974cm-1 for 150oC.

45
After heating-cooling process is completed, the difference in the intensities of these
bands slightly increases as depicted in fig.31. As a result, it can be stated that heating
leads to decreasing of 974 cm-1 and increasing of 972 cm-1 bands.
9 6 3 9 6 6 9 6 9 9 7 2 9 7 5 9 7 8 9 8 1 9 8 4
d e c o n v o l u t e d
e x p e r i m e n t a l
w a v e n u m b e r ( c m - 1 )
ab
s.
Figure.31: Deconvolution of 973cm-1 into 972cm-1 and 974cm-1 for after returning
to room temp.
Remembering that the amorphous/crystallinity ratio decreases from 1.25 to 1.00 for
CPP film after heating-cooling process is completed, we would like to state that there
may be a relation between this ratio and the shift of this amorphous band on the side
of 972 cm-1 band (crystalline). The increase in the crystallinity character is illustrated
two ways.
We tried to observe this shift by using Raman spectroscopy as shown in fig.32. At
room temperature, the center of this band is observed at 978.45cm-1 as listed in
table.13. After CPP film was heated to 110, 120, 130, 140 and 150oC, the center of
this band is close to this value. Although some fluctuations about this value are
recorded, we could not determine a consistent change in this band by using Raman.

46
9 9 0 9 8 5 9 8 0 9 7 5 9 7 0
rela
tive
inte
nsi
ty
w a v e n u m b e r (c m -1)
2 5 o C
1 1 0 o C
1 2 0 o C
1 3 0 o C
1 4 0 o C
1 5 0 o C
Figure.32: Raman Spectra of CPP film after heated to shown temperature and
cooled.
Center
Before heating-cooling. 978.45
After heated to 110oC and cooled. 978.32
After heated to 120oC and cooled. 978.33
After heated to 130oC and cooled. 978.60
After heated to 140oC and cooled. 978.20
After heated to 150oC and cooled. 978.44
Table.13: The center of investigated band with respect to heating to different
temperature.
3.5. Direction of Stretching Analysis by FT-IR
We investigated the stretching directions of BOPP film which is heated at 120oC in
oven during 5, 10, 15, 20 minutes. This process is performed for measuring the
amount of shrinkage of the film along machine and transverse direction. Industrially,

47
shrinkage of the film exceeding over %2 is not desired. By using FT-IR, it was
studied whether two different stretching directions are affected differently from this
process or not. Infrared spectra of these directions are almost same as illustrated in
fig.33 and 34. Moreover, there is no difference for 5, 10, 15, and 20 minutes waiting
at 120oC in both machine and transverse directions.
1 2 0 0 1 1 5 0 1 1 0 0 1 0 5 0 1 0 0 0 9 5 0 9 0 0 8 5 0 8 0 0
ab
s.
w a v e n u m b e r ( c m - 1 )
5 m i n
1 0 m i n
1 5 m i n
2 0 m i n
M a c h i n e D i r e c t i o n
Figure.33: FT-IR spectra of BOPP film along machine direction after heated at
120oC in different waiting times.
1 2 0 0 1 1 5 0 1 1 0 0 1 0 5 0 1 0 0 0 9 5 0 9 0 0 8 5 0 8 0 0
ab
s.
w a v e n u m b e r ( c m - 1 )
T r a n s v e r s e D i r e c t i o n
2 0 m in
1 5 m in
1 0 m in
5 m i n
Figure.34: FT-IR spectra of BOPP film along transverse direction after heated at
120oC in different waiting times.

48
By using polarized FT-IR, machine and transverse directions can be identified. In
machine direction, polymer absorbs generally light from 0o polarizer more than 90o
polarizer as given in figure.34. 841, 973, 998, 1045, and 1167cm-1 has higher
intensity with 0o compared to 90o polarizer. 809, 900, and 941cm-1 has higher
intensity with 90o polarizer. However, in transverse direction, polymer absorbs
widely light from 90o polarizer more than 0o polarizer as illustrated in figure.36.
Whereas 841, 973, 998, 1045, and 1167cm-1 absorbs more with 90o polarizer, 809,
900, and 941cm-1 absorbs more with 0o polarizer.
1 2 0 0 1 1 5 0 1 1 0 0 1 0 5 0 1 0 0 0 9 5 0 9 0 0 8 5 0 8 0 0
ab
s.
w a v e n u m b e r (c m -1)
M a c h in e D ire c tio n
w ith 9 0 o
p o la r iz e r
w ith 0 o
p o la r iz e r
Figure.35: Polarized-FT-IR spectra of BOPP film along machine direction after
heated at 120oC in 20 minutes.
We investigated the dichroic ratio of 973 and 998 cm-1 bands for machine and
transverse direction of BOPP film which was heated at 120oC in the duration of 5,
10, 15, and 20 minutes. However, although there is a slight decreasing in machine
direction for dichroic ratio of 973 cm-1, we did not see significant effect of time on
dichroic ratio as given in table.14 and table.15. In transverse direction, dichroic ratio
is lower than 1, since it absorbs light more with 90o.

49
1 2 0 0 1 1 5 0 1 1 0 0 1 0 5 0 1 0 0 0 9 5 0 9 0 0 8 5 0 8 0 0
ab
s.
w a v e n u m b e r ( c m -1 )
T r a n s v e r s e D ir e c t io n
w i th 0 p
p o la r iz e r
w i th 9 0 p
p o la r iz e r
Figure.36: Polarized-FT-IR spectra of BOPP film along transverse direction after
heated at 120oC in 20 minutes.
Machine Direction 973cm-1 998cm-1
5min. 1.86 2.08
10min. 1.83 2.30
15min. 1.75 2.18
20min. 1.56 1.91
Table.14: Dichroic ratio values of 973 and 998 cm-1 bands along machine direction.
Transverse Direction 973cm-1 998cm-1
5min. 0.53 0.39
10min. 0.58 0.50
15min. 0.58 0.46
20min. 0.57 0.47
Table.15: Dichroic ratio values of 973 and 998 cm-1 bands along transverse
direction.

50
3.6. XRD Studies
3.6.1. Temperature effect
Temperature effect on polypropylene can be mostly easily followed by XRD. Zhu et
al. [39] determined that while temperature is higher than 100oC, the crystallinity of
uni-axially stretched isotactic polypropylene increases by using wide-angle X-ray
diffraction. We also detected a significant increase in crystallinity in CPP film with
heating. As in fig.37, new strong lines are observed at 14, 17, and 18.5o at about 130-
140oC.
14 16 18 25 26 27
a
b
c
d
e
inte
nsi
ty (
a.u
.)
2 Θ (deg ree )
Figure.37: XRD pattern of CPP films. a at room temperature, b, c, d, e were heated
to 60, 100, 130, 1400C respectively and then cooled to room temperature.
X-ray diffraction patterns of CPP and BOPP film are affected differently with respect
to heating. Heating effect on BOPP is low compared to CPP film. As indicated in
fig.38, heating of BOPP film to 60, 100, 130, 140oC does not induce appreciable
changes in the XRD patterns. However, peak (130) has considereable higher

51
intensity at 150oC compared to room temperature as given fig.39. This peak is
located at 18.5o belonging to α-phase. The intensity of peak (110) at 14.0o increases
slightly with heating.
14 16 18 25 26 27
a
b
c
d
e
inte
nsity
(a
.u.)
2Θ (degree)
Figure.38: XRD pattern of BOPP films. a at room temperature, b, c, d, e were heated to 60, 100, 130,140oC respectively and then cooled to room temperature.
14 16 18 25 26 27
2Θ (degree)
room temperature
after 1500C heated and cooled to room temperature*
inte
nsity
(a.
u.)
*110
130
Figure.39: The representation of heating to 150oC on BOPP film.

52
When temperature increases, the sharpness and intensity of these peaks increases.
The peaks of CPP film at 140oC are located at same angle like the location of peaks
of BOPP film. In BOPP film the peak at 17.0o has higher intensity and in CPP film
the peaks at 14.0o has higher intensity relative to other peaks. At room temperature,
there are great differences between X-ray diffraction patterns of CPP and BOPP
films mostly due to the fact that BOPP films have higher crystallinity content than
CPP films. Moreover, stretching may have contribute to diffraction pattern of BOPP
film having more and stronger peaks.
3.6.2. Direction of Stretching
We also carried out studies on whether there is a difference between stretching
directions or not by using XRD. In this study, films prepared for measuring the
amount of shrinkage were also used. Fig.40 and 41 demonstrate XRD patterns of
assigned machine and transverse directions of BOPP film at room temperature.
There is no difference in the XRD patterns between stretching directions and
unassigned BOPP film. In addition, heating time has no any contribution on X-ray
diffraction pattern. No difference between machine and transverse directions could
be detected.

53
1 4 1 6 1 8 2 5 2 6 2 72 θ ( d e g r e e )
a l o n g m a c h i n e d i r e c t i o n
2 0 m in
1 5 m in
1 0 m in
5 m in
in
ten
sit
y
(
a.u
.)
Figure.40: XRD pattern of machine direction of BOPP films heated at 120oC
1 4 1 6 1 8 2 5 2 6 2 72 Θ (d e g re e )
a lo n g tra n s v e rs e d ire c t io n
2 0 m in
1 5 m in
1 0 m in
5 m in
inte
nsi
ty
(a.u
.)
Figure.41: XRD pattern of transverse direction of BOPP films heated at 120oC.

54
We heated the BOPP films, stretching directions of which are assigned, to 150oC to
see whether any difference between them arises. Heating to 150oC effects samely the
stretching directions of these BOPP films. As denoted in fig.42 and 43, we observed
peak (130) at 18.5o. We also detected the arising of the same peak with heating to
150oC for BOPP film in which stretching directions are unassigned. Moreover, we
could not see a difference among 5, 10, 15, and 20 minutes waited films after heating
to 150oC. These films have same peaks which have nearly same intensity.
1 4 1 6 1 8 2 5 2 6 2 7
5 m in
1 0 m in
1 5 m in
2 0 m in
2 θ (d e g re e )
inte
nsi
ty
(a.u
.)
a lo n g m a c h in e d ire c tio n
Figure.42: XRD pattern of BOPP films stretched in machine direction after heated to
150oC and cooled.

55
14 16 18 25 26 27
5m in
10min
15min
20min
along transverse direction
2θ (degree)
inte
nsity
(a.
u.)
Figure.43: XRD pattern of BOPP films stretched in transverse direction after heated
to 150oC and cooled.
3.6.3. Phase Transition
Since some polypropylene films have varying degrees of different phase (α and β),
we followed the phase transition with temperature using X-ray diffraction. To
investigate the change between these two phases, (300) reflection of β-crystalline
phase at 16.0o and (040) reflection of α-phase at 17.0o are paid attention. As shown
in figure.44, after CPP film was heated to 140-150oC and cooled to room
temperature,whereas β-phase content decreases sharply, α-phase content increases.
Due to the significant differences of unit cells of α and β phases, the transition from
β-phase to α-phase is supposed to require a melt/recrystallization step. It was
proposed that the temperature should be lowered to below critical temperature, which
is in the range of 100-110oC, to occur recrystallization of β-phase to α-phase. The

56
proposed mechanism is considered that after cooling below critical temperature, the
formation of α-form nuclei within β-spherulite occurs [1]. For this reason, these
proposed views are consistent with our study in that heating at 140-150oC and
cooling back to room temperature is adequate to see this transition in our sample
having different phases.
15,5 16,0 16,5 17,0 17,5
ROOM TEMP.
1400C
1500C
inte
nsity
(a.u
.)
2Θ (degree)
α -phase
β−phase
300
040
Figure.44: The representation of phase transition with increasing temperature.

57
3.7. Raman Studies 3.7.1. General Investigation of CPP and BOPP Films Since strong Raman scattering arises from nonpolar molecular groups, the vibrations
of the carbon chains, such as C-C stretching modes, are very active.
Since Raman source is highly polarized, it can be utilized for orientation studies, we
investigated the orientation of films by changing direction of the sample holder. We
investigated the Raman spectra of CPP and BOPP films. Due to the fact that BOPP
film is higly oriented, the changes in the spectra of this film occurs very drastically
by rotating sample holder with 90o. There are larger enhancements in the intensity of
809, 973, 1168 and 1256 cm-1 bands after the position of sample is changed to its
perpendicular direction as illustrated in fig.45.
1200 1100 1000 900 800
inte
nsity
(a.
u.)
*
*
*
*
wavenumber (cm-1)
the position of the sample is changed by 90
0
Figure.45: The Raman spectra of BOPP film.

58
A small change exists in the CPP film by rotating relative to the BOPP film, due
most probably to their stress induced crystallinity differences. As shown in figure.46,
there is a small change in 809, 841 and 973cm-1 bands.
1 2 0 0 1 1 0 0 1 0 0 0 9 0 0 8 0 0
inte
nsi
ty(a
.u.)
w a v e n u m b e r (c m -1)
T he po s itio n
o f s a m p le is
cha nge d by 9 0 o
Figure.46: The Raman spectra of CPP film.
The ratio of 809/841 and 973/998 demonstrate that changes in BOPP film is
considerably greater than that in CPP film by rotation as listed in table.16.
Film Type 809/841 973/998
CPP 0.90 1.10
CPP rotating by 90o 1.16 2.67
BOPP 1.19 1.36
BOPP rotating by 90o 3.54 7.10
Table.16: 809/841 and 973/998 ratio of CPP and BOPP films before and after
rotating.

59
3.7.2. Effect of Temperature
Hendra et al. [43] detected the peak broadening and disappearing of regularity bands
at the interval of 185-210oC. Pyrz et al. [44] determined a quantitative relation
between Raman scattering intensity and the crystallinity of polypropylene which is in
melt and solid state by considering 808, 830 and 840 cm-1. In our studies, after CPP
films were heated to 140, 150, and 160oC and then cooled to room temperature, their
Raman spectra was recorded. However, we did not observe significant changes on
their Raman spectra due to Raman spectrum could not be recorded as in-situ As
shown in figure.47, at room temperature, intensity of 1167 and 1153 cm-1 bands are
nearly equal. There is an increase in the intensity of 1167 cm-1 band compared to
1153 cm-1 after heating to 140 and 150oC and cooling back to room temperature.
However, the intensity of 1167 cm-1 is nearly same as the intensity of 1153 cm-1 for
the same heat treatment. Similar fluctuations in other bands can be seen.
3.7.3. Direction of Stretching Analysis
Machine and transverse direction of BOPP films have different Raman spectra. As
illustrated in figure.48, in transverse direction, the intensity of 1167 cm-1 has higher
than that of 1153 cm-1 and the intensity of 998 cm-1 is significantly lower than that
of 973 cm-1.

60
1500 1400 1300 1200 1100 1000 900 800
inte
nsity
(a.u
.)
wavenumber (cm-1)
AFTER HEATING
TO 160oC AND
COOLED
ROOM TEMP.
AFTER HEATING
TO 150oC AND
COOLED
AFTER HEATING
TO 140oC AND
COOLED
Figure.47: The Raman spectra of CPP films at room temperature, after heated to
140, 150, 160oC and cooled to room temperature.
In machine direction, the intensity of has 1153 cm-1 higher than that of 1167 cm-1 and
intensities of 973 and 998 cm-1 are nearly equal in fig.49. After assigned the
stretching direction of these films, they were heated in 5, 10, 15, and 20 minutes at
120oC. However, we could state that the increasing waiting duration at 120oC has no
effect on both Raman spectra of machine and transverse directions.

61
1 2 0 0 1 1 5 0 1 1 0 0 1 0 5 0 1 0 0 0 9 5 0
inte
nsi
ty(a
.u.)
w a v e n u m b e r (c m -1)
5 m in
1 0 m in
1 5 m in
2 0 m in
T ra n s v e rs e D ire c tio n
Figure.48: The Raman spectra of BOPP film in transverse direction
1 2 0 0 1 1 5 0 1 1 0 0 1 0 5 0 1 0 0 0 9 5 0
inte
ns
ity
(a.u
.)
w a v e n u m b e r ( c m -1 )
5 m in
1 0 m in
1 5 m in
2 0 m in
M a c h in e D ir e c t io n
Figure.49: The Raman spectra of BOPP film in machine direction.

62
3.7.4. Depth Analysis
We have tried to obtain a depth profile of polypropylene films by changing the width
of hole of the source. Our aim is to determine whether there is a difference between
bulk and surface of the films or not. Figure.50 illustrates Raman spectra of BOPP
film for the width of the hole 1100, 600, and 200 µm. FWHM is about 2µm for the
widht of confocal hole at 200 µm and about 5µm for 1100µm when using 100x
objective. Although there is a slight increase in the separation between 1153 and
1167 cm-1 bands when decreasing the width of hole, we were not able to establish
that there is a significant difference in the Raman spectrum of BOPP film with
respect to varying the width of the hole.
1200 1150 1100 1050 1000 950
inte
nsity
(a.u
.)
wavenumber (cm-1)
1100µm
600µm
200µm
Figure.50: The Raman spectra of BOPP film with different width of hole.

63
4. CONCLUSION We have tried to reevaluate the information obtainable using IR and Raman
Spectroscopic and X-Ray Diffraction techniques for the analysis of industrially
produced two polypropylene films (BOPP and CPP). The main emphasis was
focused on changes of their crystallinity content and orientation as a function of
temperature increase and/or heat exposure. This focus was dictated mainly by the
fact that the amorphous/crystallinity content and orientation induced properties are
crucial for the shelf-life and oxygen permeability of these films which are mainly
employed for food packaging and other related areas. Moreover, we had specifically
sought to apply the IR technique over the others due to its widespread availability
and ease of use in industrial environment.
In order to follow changes as a function of temperature faithfully we developed an
in-situ IR technique. Unfortunately, such in-situ technique was not adaptable to our
Raman and XRD systems for which we could record data only at room temperature.
From these studies, we can now conclude that temperature effects significantly the
crystallinity and orientation of the polypropylene films. With increasing temperature,
the content of crystallinity decreases and loss of orientation takes place. After
returning back to room temperature, crystallinity increases back to its initial value,
but orientational loss stays permanent. The cycle of heating-cooling process does not
lead to any additional changes.
XRD studies indicate that CPP film is more sensitive to temperature changes than
BOPP. After CPP film is heated to 130-140oC, the sharp crystalline peaks appear.
Phase transition can also be detected using X-ray diffraction from β to α at 140-
150oC. However, we could not detect this phase transition using FT-IR. This is

64
explained by the fact that while XRD measures the long-range or intermolecular
order, but IR measures the short range or intramolecular order [12].
Using FT-IR we have determined a shift in the 973 cm-1 band of the CPP films
having mostly the α-crystalline phase. With increasing temperature, a shift occurs
from 973,5 cm-1 to 972,8 cm-1 which could be related with changes in
crystallinity/amorphous content. Using Raman spectroscopy we could not see this
shift with increasing temperature.
Although we could not detect that any difference when the films were subjected to
additional stresses at 120oC along the machine and the transverse directions of
polypropylene films using X-ray diffraction and FT-IR, difference in these directions
can be observed using Raman spectroscopy due to its higher sensitivity on
polarization.
As a final conclusion of work, we can state that although XRD is extremely sensitive
to detect and study phase transitions, IR and Raman are insensitive. However, the
amorphous/crystallinity content of films and changes in the orientation of biaxially
orientated PP films can be followed using both IR and Raman techniques. Use of in-
situ IR spectroscopy for investigation of the effect of temperature and/or heat
exposure is a particularly attractive and easy-to use method.

65
5. REFERENCES
1) Edward P. Moore, Jr., Polypropylene Handbook, Hanser/Gardner
Publications, Inc., Cincinnati,1996.
2) Opschoor A., Conformations of Polyethylene and Polypropylene, Rotterdam
University Press, 1966.
3) Devesh Tripathi, Practical Guide to Polypropylene, Rapra Technology Ltd.,
Shawbury, Shrewsbury, Shropshire, SY4 4NR, UK, 2002.
4) Billmeyer F.W., Textbook of Polymer, Second edition, John Wiley&Sons,
Tokyo, 1971.
5) Hornsby P.R., Premphet K., Journal of Applied Polymer Science, Vol.70,
587-597, (1998)
6) Galanti A.V., Mantell C.L., Polypropylene Fibers and Films, Plenum Press,
New York, 1965.
7) Karian H. G., Handbook of Polypropylene and Polypropylene Composites,
Second Edition, Revised and Expanded, Marcel Dekker Inc., 2003.
8) Turner-Jones A., Aizlewood J.M., Beckett D.R., Macromolecular Chem.,75,
1964, 134.
9) Addink E.J., Beintema J., Polymorphism of Crystalline Polypropylene,
Polymer, 2, 1961, 385

66
10) Meille S.V., Ferro D.R., Bruckner S., Lovinger A., Padden F., Structure of
Beta-Isotactic Polypropylene, Macromolecules, 27, 1994, 2615
11) Turner A., Jones A., Cobbold A.J., Polym. Lett. , 6, 1968,539.
12) Koenig J. L., Spectroscopy of Polymers, ACS Professional Reference Book,
Washington DC, 1992.
13) Mallapragada S.K, Narasimhan B., Infrared Spectroscopy in Analysis of
Polymer Crystallinity, Editor Meyers RA, John Wiley&Sons Ltd., Chichester,
2000, pp.7644-7658.
14) J. Radhakrishnan, A. Kaito, Structure formation during the isothermal
crystallization of oriented amorphous poly(ethylene terephthalate) films,
Polymer, 42, 2001, 3859-3866
15) Cunnigham A., Ward I.M., Willis H.A., Zichy V., An infra-red spectroscopic
study of molecular orientation and conformational changes in poly(ethylene
terephthalate), Polymer, November 1974, Vol.15, 749-756.
16) Kissin Y.V., Journal of Polymer Science: Polymer Physics Edition, Vol.21,
2085-2096, 1983.
17) Yamada K., Kamezawa M., Takayanagi M., Journal of Applied Polymer
Science, 26, (1985), 1605.
18) Mirabella F.M., Journal of Polymer Science, Part.B, Polym. Phys. Ed., 25,
591, (1987).

67
19) Mirabella F.M., Surface Orientation of Polypropylene. 2. Determination of
Uniaxially and Biaxially Oriented Films Using Internal Reflection
Spectroscopy, Journal of Polymer Science: Polymer Physics Edition, Vol.22,
1293-1304, 1984.
20) Sung C.S.P., A Modified Technique for Measurement of Orientation from
Polymer Surfaces by Attenuated Total Reflection Infrared Dichroism,
Macromolecules, 1981, 14, 591-594.
21) Lefebvre D., Jasse B., Monnerie L., Fourier transform infra-red study of
uniaxially oriented poly(2,6-dimethyl 1,4-phenyl oxide)-atactic polystyrene
blends, Polymer, 1981, Vol.22, December, 1616-1620.
22) Sung N.H., Lee H.Y., Yuan P., Sung C.S.P., Surface Structure, Topology,
and Liquid Wetting Behavior in Oriented Polymers, Polymer Engineering
and Science, June 1989, Vol.29, No.12, 791-800,
23) Jasse B., Koenig J.L., Orientational Measurements in Polymers Using
Vibrational Spectroscopy, J. Macromol. Sci. Rev. Macromol. Chem., C17
(1), 1979, 62-63.
24) Sundell T., Fagerholm H., Crozier H., Isotacticity determination of
polypropylene using FT-Raman spectroscopy, Polymer, Vol.37, Number 15,
1996, 3227-3231.
25) Kakudo M., Kasai N., Kondansha Ltd., Elsevier Publishing Company, X-Ray
Diffraction by Polymers, 1972.
26) Guiner A., X-Ray Diffraction, W.H. Freeman and Company, 1963.

68
27) Ferrage E., Martin F., Boudet A., Petit S., Fourty G., Jouffret F., Micoud P.,
Pareseval P., Salvi S., Bourgerette C., Ferret J., Burrato S., Fortune J.P., Talc
as Nucleating Agent of Polypropylene, Journal of Material Science, 37,
2002, 1561-1573
28) Borada J., WAXS Investigations of Mass-Coloured Polypropylene Fibres,
Fibres & Textiles in Eastern Europe, Vol.11, No.5, (44), 2003.
29) Hermans P.H., Weidinger A., On the Determination of the Crystalline
Fraction of Isotactic Polypropylene from X-Ray Diffraction,
Makromolekulare Chem., 50, 98-115, 1961.
30) Crystallinity of isotactic polypropylene films annealed from the quenched
state, Journal of Material Science, 27, (1992), 4350-4354.
31) H.B. Chen, J. Karger-Kocsis, J.S. Wu, J. Varga, Fracture toughness of α-
and β-phase polypropylene homopolymers and random- and block-
copolymers, Polymer, 43, 2002, 6505-6514.
32) H. Sobue, Y. Tabata, Measurements of X-ray Diffraction of Biaxially
Oriented Specimens of Isotactic Polypropylene, Vol.2, Issue No.4, 62-65,
1959.
33) Nogales A., Hsiao B., Somani R.H., Srinivas S., Tsou A.H., Balta-Calleja
F.J., Ezquerra T.A., Shear-induced crystallization of isotactic polypropylene
with different molecular weight distributions: in situ small- and wide-angle
X-ray scattering studies, Polymer, 42, 2001,5247-5256.
34) Poussin L., Bertin Y.A., Parisot J., Brassy C., Polymer, 39, 1998, 4261-4265.

69
35) Hendra P.J., Hanna L.A., Maddams W., Willis H.A., Zichy V., Cudby
M.E.A., Vibrational Spectroscopic Study of Structural Changes in Isotactic
Polypropylene below the Melting Point, Polymer, 29, 1988, 1843-1847.
36) Lamberti G., Brucato V., Real-Time Orientation and Crystallinity
Measurements during the Isotactic Polypropylene Film-Casting Process,
Journal of Polymer Science: Part.B: Polymer Physics, Vol. 41, 998-1008,
2003.
37) Zhu X., Li Y., Yan D., Zhu P., Lu Q., Influence of the order of polymer melt
on the crystallization behaviour: I. Double melting endotherms of isotactic
polypropylene, Colloid Polymer Science, Short Communication, 279, 292-
296, 2001
38) Yan D., Fang Y., Zhu X., A Possible Explanation to the Structure Change of
Isotactic Polypropylene occurring at about 135oC, Polymer, 42, 2001, 8595-
8598.
39) Zhu X., Yan D., Fang Y., Chen L., On-Line FT-IR Spectroscopic Study of
the Disorientation, of Uniaxially Stretched Isotactic Polypropylene Upon
Heating, Applied Spectroscopy, 57/1, 2003, 104-106.
40) Painter P.C., Watzek M., Koenig J.L., Fourier Transform Infra-red Study of
Polypropylene, Polymer, 18, 1977, 1169-1172.
41) A. J. de Vries, Structure and Properties of Uni- and Biaxially Oriented
Polypropylene Films: Part2 Mechanical and Other End-use Properties,
Pure&Appl.Chem., 54(3), 1981, pp.647-676.

70
42) Xinyuan Zhu, Deyue Yan, Yapeng Fang, In situ FTIR Spectroscopic Study
of the Conformational Change of Isotactic Polypropylene during the
Crystallization Process, Journal of Physical Chemistry B., 2001, 105, 12461-
12463.
43) A. Brookes, J. M. Dyke, P. J. Hendra and S. Meehan, The FT-Raman
spectroscopic study of polymers at temperatures in excess of 200°C,
Spectrochimica Acta Part A: Molecular and Biomolecular Spectroscopy,
Volume 53, Issue 13, November 1997, Pages 2313-2321.
44) A.S. Nielsen, D.N. Batchelder, R. Pyrz, Estimation of crystalinity of isotactic
polypropylene using Raman spectroscopy, Polymer, 43, 2002, 2671-2676.