investigation of the solid electrolyte ... - elib.dlr.de a toxa 148p wagner.pdf · the different...
TRANSCRIPT

1
Investigation of the Solid Electrolyte Interphase
Formation in Lithium-Ion Batteries with Electrochemical
Impedance Spectroscopy
Miriam Steinhauer1, Sebastian Risse2, Norbert Wagner1, K. Andreas Friedrich1,3
1 German Aerospace Center (DLR), Institute of Technical Thermodynamics, Pfaffenwaldring 38-40,
70569 Stuttgart, Germany
2 Institute for Soft Matter and Functional Materials, Helmholtz-Zentrum Berlin, Hahn-Meitner Platz
1, 14109 Berlin, Germany
3 Institute for Thermodynamics and Thermal Engineering, University of Stuttgart, Pfaffenwaldring 6,
70550 Stuttgart, Germany
Highlights
- Electrochemical impedance spectra measured during the first and second lithiation.
- SEI formation was studied at elevated and lower temperatures.
- Arrhenius behavior calculated from the measured impedance spectra
Abstract
To optimize lithium-ion batteries it is important to understand the formation of the solid electrolyte
interphase (SEI) occurring at the graphitic anode during the first cycles. In this study we measured
electrochemical impedance spectra at equidistant voltage intervals during first and second lithiation
(charging process). The distribution of relaxation times (DRT) was calculated from the measured
impedance spectra. Based on the DRT calculations an equivalent circuit was set up to evaluate the
different impedance contributions. In addition to measurements at room temperature we also studied
SEI behavior at elevated and lowered temperatures. Above 55 °C we monitored an unwanted
thermally induced electrolyte decomposition. Below -10 °C an incomplete SEI formation was
observed resulting in an increased impedance during the second lithiation. The activation energies of
the different processes were calculated assuming Arrhenius behavior.
2
1 Introduction
Lithium-ion batteries (LIB) gained increased importance as storage technology for energy storage e. g.
in consumer electronics, automotive engineering, mobility technologies and as cache facilities for the
growing share of renewable energies in electricity supply. Despite their already wide range of
application, research is still needed to extend their lifespan, increase safety and boost capacity
retention. A central element in this context is the SEI layer forming on the graphitic anode during the
first cycles as it, on the one hand, passivates the anode and prevents delamination while leading to
continuous capacity fading on the other hand. Numerous studies were carried out to investigate the
SEI’s structure and composition mainly by means of Fourier transform infrared spectroscopy (FT-IR),
X-ray photoelectron spectroscopy (XPS), Raman spectroscopy and Atomic force microscopy (AFM)1 2 3 4 5 6 7 8. The remaining challenge is to measure SEI-formation in situ with a non-destructive, non-
intrusive method and without the need for adapted cell geometry. For these purposes electrochemical
impedance spectroscopy (EIS) is an ideal method which starts to be applied to investigate the SEI 9 10 11 12 including its behavior at low and elevated temperatures 13 14 15. At room temperature Zhang et al.
report a reversible increase of the SEI resistance below 0.07 V vs. Li/Li+ that they attribute to the
expansion and extraction of the graphite volume9. Schranzhofer et al. describe a time-dependent
increase in SEI resistance at a constant potential10. At low temperatures Zhang et al. report a dominant
influence of the charge transfer resistance13. Wang et al. describe that a SEI formed at 65 °C is porous
and less able to suppress co-intercalation of solvent molecules than a SEI formed at 25 °C which leads
to an increased internal resistance and poor cycling stability12.
In this work we used EIS to study SEI formation and we calculated the distribution of relaxation times
from the measured spectra to gain more insight into the number of processes involved. Measurements
were performed in a 2- and 3-electrode set-up to distinguish between the SEI formed on the graphite
electrode and the SEI formed on the lithium counter electrode.
3
2 Experimental
2.1 Cell Preparation
Anodes were prepared by the Münster Electrochemical Energy Technology research institute (MEET).
They were prepared from a slurry of 90 wt.-% synthetic graphite (SLP30, Imerys Graphite and
Carbon), 5 wt.-% conductive carbon black additive (Imerys Graphite and Carbon, Super C65) and 5
wt.-% poly(vinylidene fluoride) (PvdF) Kynar® Flex 761, Arkema Inc.) dispersed in anhydrous high-
purity N-methyl pyrrolidone (NMP, 99 %, Acros-Organics). Then the electrode paste was cast on a 25
μm copper foil (Carl Schlenk AG®). The paste was applied with the doctor-blade technique. The
doctor-blade gap was 100 μm. Details of electrode preparation are given in16. Before usage the anodes
were dried at 120 °C and pressure < 0.01 mbar overnight.
A 1.5 mm thick lithium foil (99.9 %, Sigma Aldrich) was used as counter electrode. The
electrochemical tests in the 2-electrode set-up were performed in Swagelok® type cells configured for
electrodes with a maximum diameter of 12 mm and were assembled in a glovebox under argon
atmosphere with oxygen and water contents less than 1 ppm. A 20 μm thick trilayer separator
consisting of a polyethylene inner layer surrounded by two polypropylene outer layers (Cellgard®
2320) was used for separation. For the three-electrode set-up, an EL-Cell system (EL-Cell GmbH®,
Hamburg, Germany) with a lithium ring reference electrode was used. The electrodes here were
separated by three glass fiber separators, and an additional trilayer separator such as that used in the
Swagelok® cells. The electrolyte used was a mixture of ethylene carbonate (EC, anhydrous, 99 %,
Sigma Aldrich) and diethyl carbonate (DEC, anhydrous, ≥ 99 %, Sigma Aldrich) in a ratio of 3:7 v/v
with 1 M of lithium hexafluorophosphate (LiPF6, battery grade, ≥ 99.99 % trace metal basis, Sigma
Aldrich).
2.2 Electrochemical Impedance Spectroscopy and Cyclic Voltammetry
Electrochemical impedance spectra and cycling performance was investigated with a Zahner IM6
electrochemical workstation with the corresponding Thales battery software (Thales 3.02, Zahner-
elektrik). Cells were tested inside a climate chamber (Weiss & Vötsch, WK 340) kept at a constant
temperature of 23 °C. Batteries were cycled with a constant specific current of 372 mA gactive material-1
which corresponds to a 1C-rate. The voltage range was 1.5 V˗0.02 V. EIS measurements were carried
out potentiostatically in equidistant voltage intervals of 0.1 V during the first two cycles. A relaxation
time of 5 minutes was allowed before starting every EIS measurement. The frequency range was 1

4
MHz to 10 mHz with an excitation voltage of 5 mV. The lower limit of 10 mHz was chosen to also
resolve relatively slow relaxation processes.
The influence of elevated temperatures on the formation of the SEI layer was examined at 35 °C,
45 °C and 55 °C. Low-temperature behavior was studied at -20 °C, -10 °C, 0 °C and 10 °C. In this
case, voltage intervals were chosen to be 0.5 V. At each test temperature the batteries were stored for
1 h in the climate chamber to ensure a homogenous temperature distribution within the cell.
Cyclic voltammetry was performed between the cut-off voltages 1.5 V and 0.02 V (vs. Li/Li+) at a
scan rate of 1 mV s-1. In the first cycle, the voltage range between open circuit voltage (OCV) and
1.5 V was approached with a constant current of 18.6 mA gactive material-1 (C/20). A relaxation time of
1 h was added before starting cycling.
2.3. Distribution of Relaxation Times
The method of the distribution of relaxation times (DRT) allows a separation of electrochemical
processes with different time constants which can be calculated from measured impedance data. Thus
it allows a clearer look on the measured spectra and helps to resolve processes which might not be
detected otherwise. The numerical scheme follows a Levenberg-Marquardt algorithm. This is based on
the fact that impedance functions obeying the Kramers-Kronig relations (KK) can be represented as a
number of infinitesimal differential RC-elements (1). The underlying theory is discussed in detail in
various references such as17 18 19.
1 (1)
Given the relaxation time distribution γ(τ) is defined as:
(2)
This classical approach has the drawback that data pre-processing is required to remove the high-
frequency region influenced by the cable’s inductance and the low-frequency region representing the
diffusion limitation. To better meet the requirements of the battery impedance spectrum the general
approach of eq. (1) was expanded with an inductance L, mirroring the imaginary part of the impedance
at high frequencies, a capacity contributing to the impedance spectrum at low frequency and a
Warburg element representing the ion diffusion. Thus the measured impedance data were fitted to the
following equation:

5
1
√1
1 (3)
In its discretized form the distribution integral can be expressed by a matrix multiplication and thus
becoming a system of linear equations and adopting the form y=Ax (4):
11
⋯1
1⋮ ⋱ ⋮1
1⋯
11
∙
∙1
⋯1
⋮ ⋱ ⋮
1⋯
1
∙
(4)
Details of the used numerical routine are described in 20.
Due to the duration time and drifts in the system unwanted artifacts especially at lower frequencies
might occur. To ensure that the measured impedance data match the KK-relation, they were
transformed with the Z-HIT function of the Zahner Software Thales which calculates the impedance
data Z(f) from the phase data φ(ω) after the following approximation21:
ln| | . 2
lnln
(5)

6
3 Resultsanddiscussion
3.1. Electrochemical impedance spectroscopy at room temperature
To monitor the formation of the SEI impedance spectra were recorded during the first and second
cycle. Fig. 1 a) and b) show the impedance spectra recorded during the first and second lithiation
measured in a two-electrode set-up. The overall resistance in the voltage region 1.5 V to 0.1 V vs.
Li/Li+ decreases significantly, whereas the resistance at the lower cut-off voltage of 0.02 V vs. Li/Li+
stays at a relatively constant level. Detailed information about the electrochemical processes can be
obtained by fitting the measured data with an electrochemical equivalent circuit (EEC). Therefor it is
necessary to know the number of underlying processes. For that purpose the distribution of relaxation
times (DRT) was calculated out of the measured data. The results for the first and second lithiation are
given in Fig. 1 c) and d), respectively.
Fig. 1: a) Impedance spectra recorded during the first and b) second lithiation of a graphite anode. Symbols represent measured data; the solid line represents the fit. c) and d) Distribution of relaxation times as calculated from the measured impedance data during the first and second lithiation respectively
7
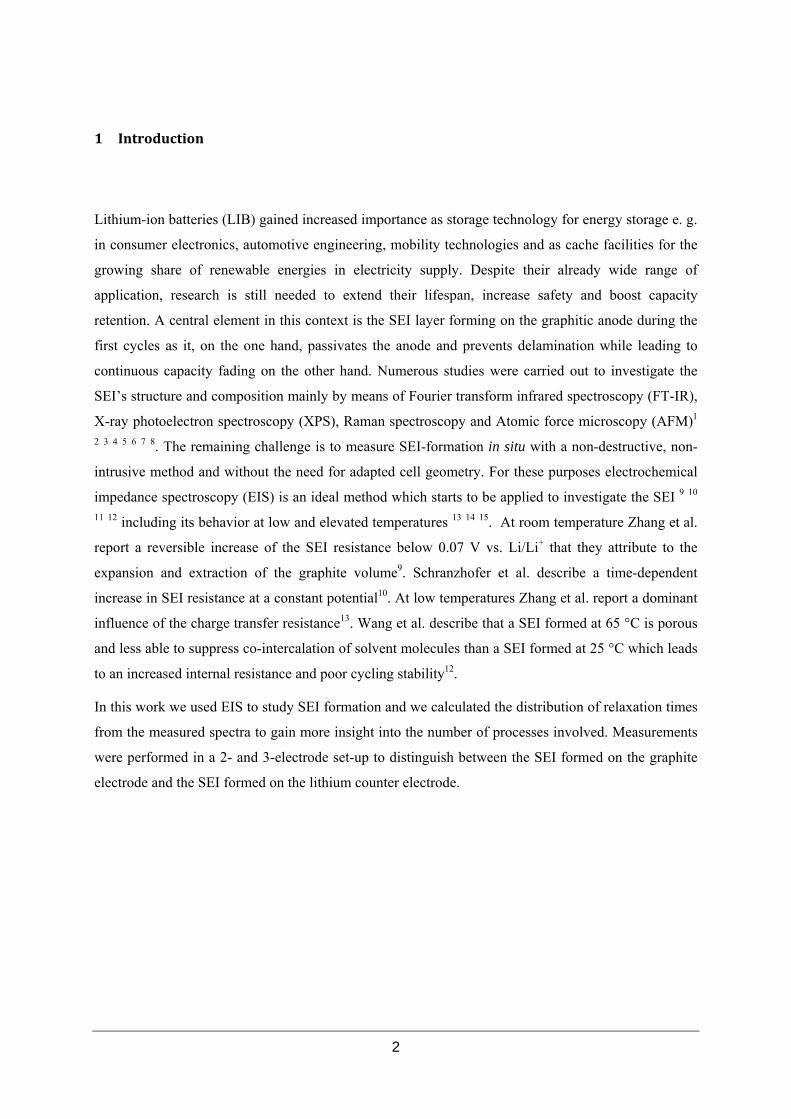
DRT shows that three processes take place with corresponding relaxation times of 10-3 s, 10-2.5 s and
102 s which is in good agreement with the literature 22. Based on these findings an EEC was set-up that
consisted of an inductance, an ohmic resistance, a series of three parallel connections of resistance and
constant phase elements, a Warburg diffusion element (WDE) and a capacity. Fig. 2 a) shows the
equivalent circuit and an exemplary impedance spectrum; Fig. 2 b) shows a scheme of the used half
cell indicating where the different processes take place.
Fig. 2: a) Impedance spectrum with relevant frequency points. The different electrochemical processes are separated and the affiliated impedance elements and frequency regions are shown. (b) Scheme of the used half-cell. The blue parallel circuit represents current conductance behavior at the transition between electrode and current collector. The red parallel connection stands for the influence of the SEI. The green parallel circuit represents the anode’s charge transfer. The orange impedance elements stand for the diffusion and intercalation of lithium ions. Additionally, the ohmic resistance and a conductor are shown. a) Celgard® Trilayer separator image courtesy of Celgard, LLC.
The inductance (L) describes the impedance behavior at high frequencies caused by cables and the
housing and only contributes to the imaginary part. The ohmic resistance (R0) can directly be obtained
from the impedance spectrum and equals the zero crossing at high frequencies. The first parallel
circuit (Rcc||CPEcc) represents the current conductance behavior between the electrode and current
collector. The second parallel circuit (RSEI||CPESEI) stands for the influence of the SEI layer on the
anode side which impacts the impedance in the middle frequency region from 1 kHz to 10 Hz. The
third parallel circuit (Rct,a||CPEct,a) represents the charge transfer at the anode and influences the
impedance in the lower-frequency region of 10 Hz to the mHz region. WDE and the capacity Cint stand
for the diffusion and intercalation of lithium ions in the low frequency region (mHz). The measured
impedance data were fitted with this EEC using Thales. In Thales, a complex linear least square
method is implemented. This method optimizes the EEC to obtain a minimum deviation between the
EEC’s transfer function and the measured data. Thales varies the parameters from user-defined initial
values until the weighted total deviation is minimized23. To obtain sufficient initial values, the
frequencies derived from the distribution of relaxation times were chosen as starting points. Kramers-
Kronig calculations showed that there the spectrum has a nonlinear behavior at frequencies lower than
100 mHz. For the fit therefore only the frequency range up to 100 mHz was taken into account. Hahn

8
et al. performed impedance measurements in symmetrical cells, consisting of two lithium electrodes,
and reported that the growth of the SEI layer on the lithium electrodes has a significant influence on
the SEI resistance and can therefore not be neglected24. Measurements in a two-electrode set-up thus
have the disadvantage that only conclusions about the total influence of SEI layers forming on both
electrodes can be made. To investigate the influence of the SEI layer on the graphite separately we
made additional measurements in a 3-electrode cell. Fig. 3 a) and b) show the impedance spectra
recorded during the first and second lithiation of a graphite anode in a 3-electrode set-up. In Fig. 3 c)
and d) a comparison of the SEI resistance RSEI during the first and second lithiation in a 2-electrode
set-up (black) and 3-electrode set-up (grey) is given.
Fig. 3 Measured (symbol) and fitted (line) impedance spectra recorded during the first a) and second b) lithiation in a 3-electrode set-up. c) and d) Comparison of RSEI obtained from the fit of the measurement in a 2-electrode set-up (black) and 3-electrode set-up (grey) during the first and second lithiation, respectively. e) Cyclic voltammogram between 1.5 V and 0.02 V vs. Li/Li+ of a graphite anode with lithium counter electrode.
Fig. 3 c) shows that RSEI during the first lithiation in both cases has maximum in the voltage region
between 0.8 V and 0.3 V vs. Li/Li+. This maximum is even more pronounced in the 3-electrode
measurement. The cyclic voltammogram in Fig. 3 e) shows that in this region the formation of the SEI
takes place. Literature reports that the SEI formation leads to two peaks in the cyclic voltammogram,
one at approx. 0.8 V vs. Li/Li+ originating from the formation of Li2CO3 and the other one between 0.8
V and 0.5 V vs. Li/Li+ induced by the formation of different alkyl carbonates (ROCO2Li)25. During the
second lithiation no similar peak is observable, indicating that SEI formation has been completed.
9
Here RSEI in the 2-electrode set-up stays fairly constant in the voltage region between 1.5 V and 0.2 V
vs. Li/Li+ and rises distinctly below 0.2 V vs. Li/Li+. The 3-electrode set-up shows a different behavior
where the resistance decreases until approximately 0.8 V vs. Li/Li+ and stays rather constant below 0.8
V vs. Li/Li+. This behavior might be explained by changes in the SEI conductivity as reported in26.
The resistance behavior of both measurements during the second lithiation shows that the maximum at
the lower cut-off is not related to changes at the graphite anode as proposed by Zhang et al.9. The
decrease of the overall SEI resistance is mainly caused by the facilitated desolvation of Li+-ions by the
formed SEI layer27 28 and the facilitated charge transfer through the newly formed SEI.
3.4. Temperature-dependent behavior
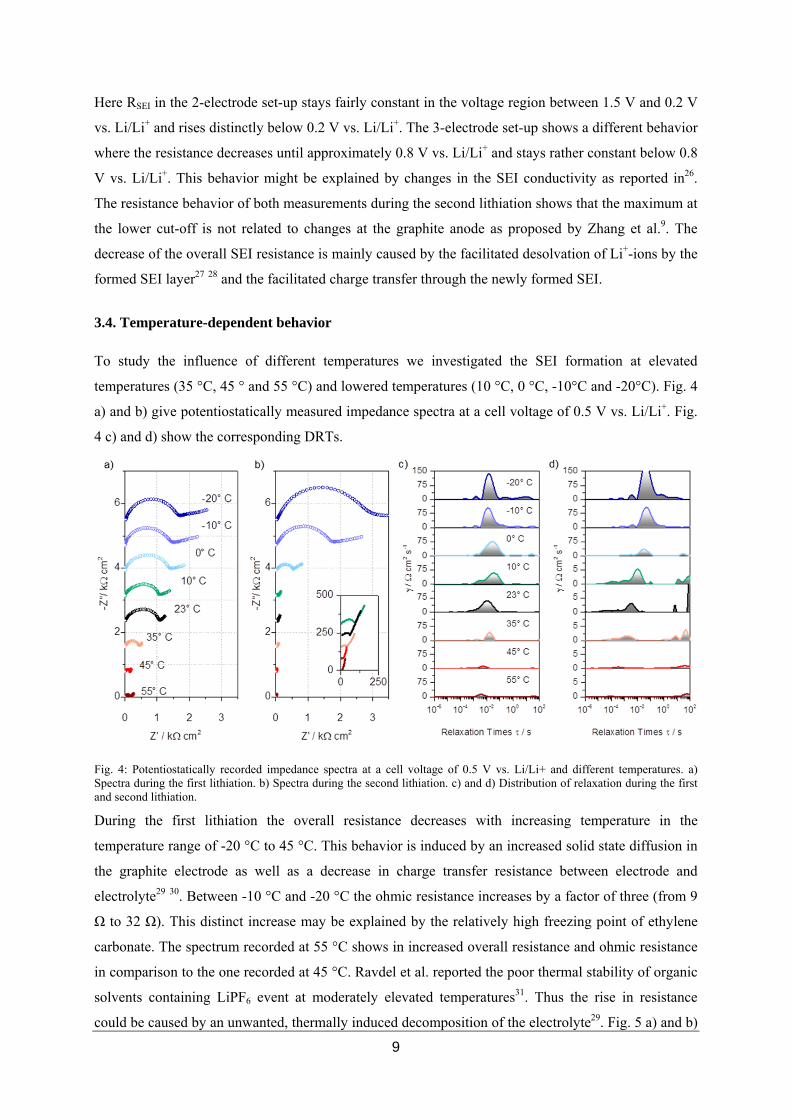
To study the influence of different temperatures we investigated the SEI formation at elevated
temperatures (35 °C, 45 ° and 55 °C) and lowered temperatures (10 °C, 0 °C, -10°C and -20°C). Fig. 4
a) and b) give potentiostatically measured impedance spectra at a cell voltage of 0.5 V vs. Li/Li+. Fig.
4 c) and d) show the corresponding DRTs.
Fig. 4: Potentiostatically recorded impedance spectra at a cell voltage of 0.5 V vs. Li/Li+ and different temperatures. a) Spectra during the first lithiation. b) Spectra during the second lithiation. c) and d) Distribution of relaxation during the first and second lithiation.
During the first lithiation the overall resistance decreases with increasing temperature in the
temperature range of -20 °C to 45 °C. This behavior is induced by an increased solid state diffusion in
the graphite electrode as well as a decrease in charge transfer resistance between electrode and
electrolyte29 30. Between -10 °C and -20 °C the ohmic resistance increases by a factor of three (from 9
Ω to 32 Ω). This distinct increase may be explained by the relatively high freezing point of ethylene
carbonate. The spectrum recorded at 55 °C shows in increased overall resistance and ohmic resistance
in comparison to the one recorded at 45 °C. Ravdel et al. reported the poor thermal stability of organic
solvents containing LiPF6 event at moderately elevated temperatures31. Thus the rise in resistance
could be caused by an unwanted, thermally induced decomposition of the electrolyte29. Fig. 5 a) and b)
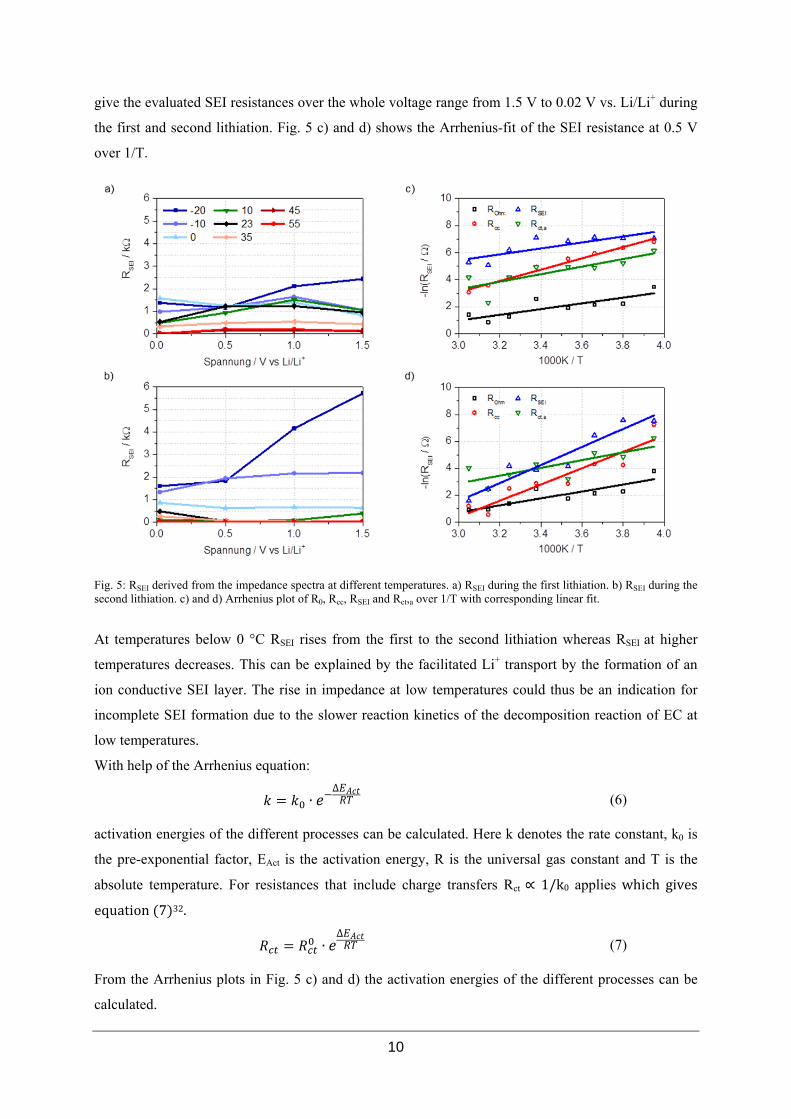
10
give the evaluated SEI resistances over the whole voltage range from 1.5 V to 0.02 V vs. Li/Li+ during
the first and second lithiation. Fig. 5 c) and d) shows the Arrhenius-fit of the SEI resistance at 0.5 V
over 1/T.
Fig. 5: RSEI derived from the impedance spectra at different temperatures. a) RSEI during the first lithiation. b) RSEI during the second lithiation. c) and d) Arrhenius plot of R0, Rcc, RSEI and Rct,a over 1/T with corresponding linear fit.
At temperatures below 0 °C RSEI rises from the first to the second lithiation whereas RSEI at higher
temperatures decreases. This can be explained by the facilitated Li+ transport by the formation of an
ion conductive SEI layer. The rise in impedance at low temperatures could thus be an indication for
incomplete SEI formation due to the slower reaction kinetics of the decomposition reaction of EC at
low temperatures.
With help of the Arrhenius equation:
∙∆
(6)
activation energies of the different processes can be calculated. Here k denotes the rate constant, k0 is
the pre-exponential factor, EAct is the activation energy, R is the universal gas constant and T is the
absolute temperature. For resistances that include charge transfers Rct ∝ 1/k0 applies which gives
equation 7 32.
∙∆
(7)
From the Arrhenius plots in Fig. 5 c) and d) the activation energies of the different processes can be
calculated.

11
Table 1: Activiation energies calculated from the Arrhenius fits in Fig. 5 c) and d)
Process Cycle 1 Cycle 2
EAct/J mol-1 EAct/eV atom-1 EAct/J mol-1 EAct/eV atom-1
R0 17603.5 0.18 21586.8 0.22
Rcc 34594.9 0.36 50232.9 0.52
RSEI 18291.8 0.19 23817.4 0.25
Rct,a 23202.8 0.24 55504.0 0.58
During the first cycle the SEI resistance is the dominant process and shows a strong temperature
dependency. In the second cycle RSEI is the dominant process below 20 °C whereas the charge transfer
at the anode side is the dominant process above 20 °C. The activation energy for the SEI resistance is
0.19 eV per atom and in the second cycle it is 0.25 eV per atom. For the reduction reaction of ethylene
carbonate literature reports values of 24.9 kcal mole-1 which equals 1.08 eV per atom33. For the Li+-ion
transport in lithium diethylcarbonate, one of the proposed SEI components, activation energies of 64-
84 kJ mole-1 (0.66-0.87 eV per atom) were calculated from impedance spectra34. Zaban et al.
calculated the activation energy for the Li+ transport in the SEI formed in several different electrolytes
and report values between 0.3 and 0.83 eV per atom35. For the activation energy for the desolvation of
Li+ ions in EC:DMC electrolytes with LiPF6 as conductive salt was reported to between 64 and 72 kJ
mol-1 (0.66 – 0.75 eV per atom)36. The RSEI is rather small as compared to these values which might be
caused by a different SEI composition since the activation energies are strongly dependent on the
electrolyte mixture and composition of the SEI. The smallest influence has the ohmic resistance R0.
The Li+ ion conductivity in LiPF6 in EC/DEC systems in polypropylene separators was determined as
0.11 eV atom-1 37. Thus the Li+ conduction contributes significantly to the ohmic resistance.

12
4 Conclusions
During the first lithiation measurements in 2- and 3-electrode set-ups showed a maximum in SEI
resistance in the voltage region between 0.8 and 0.3 V vs. Li/Li+. This maximum is not present during
the second lithiation which is mainly due to the formation of a Li+ conducting SEI layer which
facilitates the desolvation of Li+ ions. The diminution of the SEI resistance points to a complete
formation of the SEI during the first lithiation. Temperature-dependent measurements show that
between -20 °C and 45 °C the overall resistance decreases with increased temperature. This can be
explained by the temperature-dependency of electrolyte and SEI conductivity and charge transfers. At
55 °C the overall resistance is increased as compared to the measurement at 45 °C which indicates an
unwanted, thermally induced resistance. Between 0 °C and 45 °C the SEI resistance decreases from
the first to the second cycle. Below 0 °C SEI resistance increases from first to second lithiation which
shows an incomplete SEI formation. Arrhenius calculations of the SEI formation gave values between
0.19 and 0.25 eV atom-1. These values lie below the activation energy of the EC reduction and rather
in the range of the activation energy for the solid stat Li+ ion diffusion.

13
5 Acknowledgements
We thank the Federal Ministry of Education and Research (BMBF) for funding this work. This work
is part of the project “Li-EcoSafe – Entwicklung kostengünstiger und sicherer Lithium-Ionen-
Batterien” (FKZ: 03X4636B). We also thank Mr. Tobias Placke from the Münster Electrochemical
Energy Technology research institute for supplying the graphite anodes used in this work.
14
6Literature
[1] E. Peled, D.B. Tow, A. Merson, A. Gladkich, L. Burstein, D. Golodnitsky, Composition , depth
profiles and lateral distribution of materials in the SEI built on HOPG-TOF SIMS and XPS studies, J. Power Sources. 98 (2001) 52–57.
[2] V. Eshkenazi, E. Peled, L. Burstein, D. Golodnitsky, XPS analysis of the SEI formed on carbonaceous materials, Solid State Ionics. 170 (2004) 83–91.
[3] H. Bryngelsson, M. Stjerndahl, T. Gustafsson, K. Edström, How dynamic is the SEI?, J. Power Sources. 174 (2007) 970–975.
[4] S. Leroy, F. Blanchard, R. Dedryvère, H. Martinez, B. Carré, D. Lemordant, et al., Surface film formation on a graphite electrode in Li-ion batteries: AFM and XPS study, Surf. Interface Anal. 37 (2005) 773–781.
[5] R.I.R. Blyth, H. Buqa, F.P. Netzer, M.G. Ramsey, J.O. Besenhard, P. Golob, et al., XPS studies of graphite electrode materials for lithium ion batteries, Appl. Surf. Sci. 167 (2000) 99–106.
[6] A. Xiao, L. Yang, B.L. Lucht, S.-H. Kang, D.P. Abraham, Examining the Solid Electrolyte Interphase on Binder-Free Graphite Electrodes, J. Electrochem. Soc. 156 (2009) A318.
[7] K.A. Hirasawa, T. Sato, H. Asahina, S. Yamaguchi, S. Mori, In Situ Electrochemical Atomic Force Microscope Study on Graphite Electrodes, J. Electrochem. Soc. 144 (1997) L81–L84.
[8] S. Pérez-Villar, P. Lanz, H. Schneider, P. Novák, Characterization of a model solid electrolyte interphase/carbon interface by combined in situ Raman/Fourier transform infrared microscopy, Electrochim. Acta. 106 (2013) 506–515.
[9] S.S. Zhang, K. Xu, T.R. Jow, EIS study on the formation of solid electrolyte interface in Li-ion battery, Electrochim. Acta. 51 (2006) 1636–1640.
[10] H. Schranzhofer, J. Bugajski, H.J. Santner, C. Korepp, K.-C. Möller, J.O. Besenhard, et al., Electrochemical impedance spectroscopy study of the SEI formation on graphite and metal electrodes, J. Power Sources. 153 (2006) 391–395.
[11] M. Umeda, K. Dokko, Y. Fujita, M. Mohamedi, I. Uchida, J.R. Selman, Electrochemical impedance study of Li-ion insertion into mesocarbon microbead single particle electrode: Part I. Graphitized carbon, Electrochim. Acta. 47 (2001) 885–890.
[12] C. Wang, A.J. Appleby, F.E. Little, Electrochemical impedance study of initial lithium ion intercalation into graphite powders, Electrochim. Acta. 46 (2001) 1793–1813.
[13] S.S. Zhang, K. Xu, T.R. Jow, Electrochemical impedance study on the low temperature of Li-ion batteries, Electrochim. Acta. 49 (2004) 1057–1061.

15
[14] K. Edström, A. M. Andersson, A. Bishop, L. Fransson, J. Lindgren, a. Hussénius, Carbon
electrode morphology and thermal stability of the passivation layer, J. Power Sources. 97-98 (2001) 87–91.
[15] A.M. Andersson, K. Edström, Chemical Composition and Morphology of the Elevated Temperature SEI on Graphite, J. Electrochem. Soc. 148 (2001) A1100. doi:10.1149/1.1397771.
[16] M. Placke, T., Siozios, V., Schmitz, R, Lux S. F., Bieker, P, Colle, C. Meyer H.-W., Passerini, S., Winter, Influence of graphite surface modifications on the ratio of basal plane to “non-basal plane” surface area and on the anode performance in lithium ion batteries, J. Power Sources. 200 (2012) 83–91.
[17] M. Voigts, A. Kru, H. Schichlein, A.C. Mu, Deconvolution of electrochemical impedance spectra for the identification of electrode reaction mechanisms in solid oxide fuel cells, J. Appl. Electrochem. 32 (2002) 875–882.
[18] J.P. Schmidt, P. Berg, M. Schönleber, A. Weber, E. Ivers-Tiffée, The distribution of relaxation times as basis for generalized time-domain models for Li-ion batteries, J. Power Sources. 221 (2013) 70–77.
[19] J. Illig, M. Ender, a. Weber, E. Ivers-Tiffée, Modeling graphite anodes with serial and transmission line models, J. Power Sources. 282 (2015) 335–347.
[20] Sebastian Risse, unpublished results.
[21] SIM Manual Zahner® (09/2013), p. 16. Available at: http://www.zahner.de/pdf/SIM.pdf (accessed: 14.07.15).
[22] J. Illig, J.P. Schmidt, M. Weiss, A. Weber, E. Ivers-Tiffée, Understanding the impedance spectrum of 18650 LiFePO4-cells, J. Power Sources. 239 (2013) 670–679. doi:10.1016/j.jpowsour.2012.12.020.
[23] SIM Manual Zahner® (09/2013), p. 60. Available at: http://www.zahner.de/pdf/SIM.pdf (accessed: 28.09.16).
[24] N. Schweikert, H. Hahn, S. Indris, Cycling behaviour of Li/Li4Ti5O12 cells studied by electrochemical impedance spectroscopy., Phys. Chem. Chem. Phys. 13 (2011) 6234–6240. doi:10.1039/c0cp01889a.
[25] S. Xu, Q. Zhuang, J. Wang, Y. Xu, Y. Zhu, New Insight into Vinylethylene Carbonate as a Film Forming Additive to Ethylene Carbonate-Based Electrolytes for Lithium- Ion Batteries, Int. J. Electrochem. Sci. c (2013) 8058–8076.
[26] G. M. Veith, M. Doucet, J. K. Baldwin, R. L. Sacci, T. M. Fears, Y. Wang, J. F. Browning, J. Phys. Chem. C 2015, 119, 20339–20349.
[27] K. Xu, A. von Wald Cresce, Li+-solvation/desolvation dictates interphasial processes on graphitic anode in Li ion cells, J. Mater. Res. 27 (2012) 2327–2341. doi:10.1557/jmr.2012.104.
[28] K. Xu, A. Von Cresce, U. Lee, Differentiating contributions to “ion transfer” barrier from interphasial resistance and Li+ desolvation at electrolyte/graphite interface, Langmuir. 26 (2010) 11538–11543. doi:10.1021/la1009994.

16
[29] M.C. Smart, B. V Ratnakumar, S. Surampudi, Electrolytes for Low-Temperature Lithium Batteries Based on Ternary Mixtures of Aliphatic Carbonates, J. Electrochem. Soc. 146 (1999) 486–492.
[30] C.-K. Huang, J.S. Sakamoto, J. Wolfenstine, S. Surampudi, The Limits of Low-Temperature Performance of Li-Ion Cells, J. Electrochem. Soc. 147 (2000) 2893. doi:10.1149/1.1393622.
[31] B. Ravdel, K.. Abraham, R. Gitzendanner, J. DiCarlo, B. Lucht, C. Campion, Thermal stability of lithium-ion battery electrolytes, J. Power Sources. 119-121 (2003) 805–810. doi:10.1016/S0378-7753(03)00257-X.
[32] M.E. Orazem, B. Tribollet, Electrochemical Impedance Spectroscopy, 2008. doi:10.1002/9780470381588.
[33] S.J. An, J. Li, C. Daniel, D. Mohanty, S. Nagpure, D.L. Wood, The state of understanding of the lithium-
ion-battery graphite solid electrolyte interphase (SEI) and its relationship to formation cycling, Carbon N. Y. 105
(2016) 52–76. doi:10.1016/j.carbon.2016.04.008.
[34] O. Borodin, G.R. V Zhuang, P.N. Ross, K. Xu, Molecular Dynamics Simulations and Experimental Study
of Lithium Ion Transport in Dilithium Ethylene Dicarbonate, J. Phys. Chem. C. 117 (2013) 7433–7444. doi:Doi
10.1021/Jp4000494.
[35] A. Zaban, E. Zinigrad, D. Aurbach, Impedance Spectroscopy of Li Electrodes. 4. A General Simple Model
of the Li−Solution Interphase in Polar Aprotic Systems, J. Phys. Chem. 100 (1996) 3089–3101.
doi:10.1021/jp9514279.
[36] K. Xu, A. Von Cresce, U. Lee, Differentiating contributions to “ion transfer” barrier from interphasial
resistance and Li+ desolvation at electrolyte/graphite interface, Langmuir. 26 (2010) 11538–11543.
doi:10.1021/la1009994.
[37] J.Y. Song, Y.Y. Wang, C.C. Wan, Conductivity Study of Porous Plasticized Polymer Electrolytes Based on
Poly(vinylidene fluoride) A Comparison with Polypropylene Separators, J. Electrochem. Soc. 147 (2000) 3219.
doi:10.1149/1.1393886.