investigation of the structure of cellulose in licl/dmac solution and its gelation behavior by...
TRANSCRIPT

Investigation of the Structure of Cellulose in
LiCl/DMAc Solution and Its Gelation Behavior by
Small-Angle X-Ray Scattering Measurements
Daisuke Ishii,1 Daisuke Tatsumi,*1 Takayoshi Matsumoto,1 Kazuki Murata,2 Hisao Hayashi,2 Hiroshi Yoshitani3
1Division of Forest and Biomaterials Science, Graduate School of Agriculture, Kyoto University,Kitashirakawa Oiwake- cho, Sakyo-ku, Kyoto 606-8502, JapanE-mail: [email protected]
2Faculty of Science and Technology, Ryukoku University, 1-5 Yokotani, Oe-cho, Seta, Otsu 520-2194, Japan3Minase Research Laboratories, Sekisui Chemical Co. Ltd., 2-1 Hyakuyama Shimamoto-cho,Mishima-gun, Osaka 618-8589, Japan
Received: December 2, 2005; Revised: February 14, 2006; Accepted: February 14, 2006; DOI: 10.1002/mabi.200500231
Keywords: cellulose; gels; LiCl/DMAc; molecular properties; small-angle X-ray scattering (SAXS); solutions
Introduction
Lithium chloride/N,N-dimethylacetamide (LiCl/DMAc) is
one of the most efficient solvent system for cellulose.[1–3] It
dissolves cellulose with high molecular weight (>106)
molecularly at the ambient temperature without noticeable
degradation.[4] In order to develop cellulose materials to the
ones having novel functionality and superior performance,
some attempts concerning this solvent have been made. For
example, it has been reported that the slow coagulation of
cellulose from the LiCl/DMAc solution causes the formation
of characteristic supramolecular structure or the exhibition of
the optical anisotropy.[5,6] However, the mechanisms of these
phenomena have not been clarified yet. The clarification of
suchmechanisms requires the understanding of themolecular
properties and the dissolved state of cellulose in LiCl/DMAc
solution. The molecular properties of cellulose in LiCl/
DMAc solutionhave beenextensively investigated byvarious
research groups.[2,4,7–12] These studies were performed using
static and/or dynamic light scattering,[2,4,7–10] rheologi-
cal,[4,7–9] size-exclusion liquid chromatography,[10,11]
and NMR[12] measurements. These methods give us the
information on the molecular weight[2,4,7–11] and its distri-
bution,[10,11] the dimension of cellulose molecular
chain,[2,4,7–11] and the interaction between cellulose and
solvent molecules.[12] However, the relation between the
dissolved state and the structure formation mechanism
of cellulose molecules has not been investigated yet.
Summary: Cellulose gels were prepared from cellulose inlithium chloride/N,N-dimethylacetamide (LiCl/DMAc) sol-ution. When the cellulose concentration in the solution isabove the one at which cellulose molecules overlap,cellulose gels were formed. While the gel prepared by theaddition of water was turbid, the one prepared by the ionexchange was colorless, transparent, and optically aniso-tropic. In order to explain this gelation behavior of cellulose,small-angle X-ray scattering (SAXS) measurements of thecellulose solutions and the gels were performed. The SAXSprofiles of the cellulose solutions and the gels suggested thatthe large-scale fluctuation of the molecular chain density inthe solution can be the origin of the molecular aggregatesformed in the gel. Furthermore, the differences in thestructure of the gels at the macroscopic and the molecularlevel were discussed in terms of the phase separation and themolecular association. Polarized optical photograph of the cellulose gels.
Macromol. Biosci. 2006, 6, 293–300 � 2006 WILEY-VCH Verlag GmbH & Co. KGaA, Weinheim
Full Paper DOI: 10.1002/mabi.200500231 293

Small-angle X-ray scattering (SAXS) measurements are
expected to give the information on the structure of cellulose
in both themolecularly dispersed and aggregated states.[13] In
this paper, the structure of cellulose in LiCl/DMAc solution
and the gels prepared from the solution are investigated by
SAXSmeasurements. Furthermore, on the basis of the results
of the SAXS measurements, the relation between the
structure of cellulose in dissolved and gelled states is
discussed.
Experimental Part
Materials
Cellulose solution in LiCl/DMAc was prepared following theprocedure already described elsewhere.[4] Softwood dissol-ving pulp (Nippon Paper Co. Ltd., Mw ¼ 3.8� 105)[6] wasemployed for the preparation of the solution. The solutionswith the cellulose concentration of 1, 3, 5, and 8 wt.-% weresupplied for the SAXS measurements. On the other hand, thesolutions with the cellulose concentration of less than 1 wt.-%were used for the preparation of cellulose gels.
Two different methods for the coagulation of cellulose wereemployed.One is the deionization of the cellulose/LiCl/DMAcsolution with ion exchange resins. In this method, the cellulosesolutions were poured onto the pretreated ion exchange resins(Biorad, AG-501 X8) and allowed to stand. The pretreatmentof the resins were performed by the overnight sorption indistilled water or 1 M NH4Cl (aq) and by the subsequentexchange of water or NH4Cl (aq) solution to DMAc. Gelationof the system was examined by inversing the sample tube.Hereafter in this paper, the cellulose gel prepared by thismethod is referred to as ‘‘deionized gel’’ for simplicity. Theother method employed was the dropping of distilled water tothe cellulose/LiCl/DMAc solution (‘‘water-coagulated gel’’).These cellulose gels were supplied for the experiments in theas-prepared state.
SAXS Measurements
SAXS measurements were performed using Rigaku RINT2500 NANO-VIEWER at Ryukoku University. A 2.7-kW(45 kV, 60 mA) CuKa irradiation was focused and mono-chromatized (l¼ 0.1542 nm) simultaneously using OSMICConfocal MaxFlux1 multilayer mirror. Then the incidentbeam was collimated by two pinholes (0.5 and 0.3 mm f) andone guard slit. Samples were packed within laboratory-madestainless cell with 51.4 mm-thick Kapton windows and placedon an open-air holder.[14] Optical paths except around thesample holder were evacuated in order to avoid overlapping ofair scattering. The distance between the sample cell and thedetector was set to 0.89 m. The q space determined by the first-and second-orderBraggpeaks of lead stearate (d¼ 5.1 and2.55nm) ranged from 0.16 to 2.1 nm�1, corresponding to the real-space length scales from 3.0 to 40 nm. The intensity of thescattered X-ray was detected using one-dimensional position-sensitive proportional counter equipped with 2 048 channelswith the distances between channels of 35 mm (Dq¼ 0.0016
nm�1). Although the detector aperture had a height of ca. 1 cm,the effect of smearing on the scattering profile was notrecognized. Samples were irradiated for 250 000 s, accumulat-ing 500 slices of 500-s data acquisition. Fluctuation of theirradiated beam intensity during the acquisition was correctedusing the scattered intensity from HDPE measured before andafter the measurements of cellulose samples. Acquired intensitydata were corrected for the transmittance, and then thecontribution from the solvent was subtracted. As for the gelsamples, ionic strength in the liquid phase is supposed to bedifferent from that in the solution due to the ion exchange.Considering this effect, the liquid soaked out of the gels wascollected, and the scattered intensity from the liquidwasused forthe correction of scattered intensity from the gels.
Results
Aggregation Behavior of Cellulose
It is recognized that the dissolution state of cellulose in
LiCl/DMAc is affected by both the cellulose concentration
and ionic strength in the solution.[15] This in turn suggests
that the aggregation behavior of cellulose from the dis-
solved state is also affected by these factors. Therefore, we
attempted to control the aggregation behavior of cellulose
from the LiCl/DMAc solution by varying the polymer
concentration in the solution, c. When c is lower than
0.2 wt.-%, precipitation of cellulose occurred. On the other
hand, the gelation of cellulose was observed when c is
higher than 0.3 wt.-%.
The gelation behavior of cellulose was also affected by
the gelationmethods. The addition of water to the cellulose/
LiCl/DMAc solution instantly generated a cellulose gel. On
the other hand, the gelation of cellulose by the addition of
ion exchange resins proceeded quite slowly; typically it
took more than several weeks for the complete gelation.
Appearances of the gels were also different: While the
water-coagulated gel contained the slight turbidity, the
deionized gel was colorless and transparent.
The above-mentioned structural features were also
recognized by the polarized optical microscopy. Figure 1
shows the polarized optical photographs of the cellulose
gels. In the water-coagulated gel, a fibrous texture was
observed [Figure 1(a)]. No such texturewas observed in the
deionized gel. Therefore, it is likely that this fibrous
morphology makes the appearance of the water-coagulated
gel turbid. However, as shown in Figure 1(c), the bire-
fringence was also observed in the deionized gel. Further-
more, as shown by Figure 1(b) and (c), this optically
anisotropic region evolves along with the gelation. These
results show that the gelation of cellulose accompanies the
formation of the oriented structure at any spatial scale.
SAXS Profiles of Cellulose Solutions and Gels
In order to investigate the relation of the gelation behavior
and the obtained gel structure of cellulose to the structure of
294 D. Ishii, D. Tatsumi, T. Matsumoto, K. Murata, H. Hayashi, H. Yoshitani
Macromol. Biosci. 2006, 6, 293–300 www.mbs-journal.de � 2006 WILEY-VCH Verlag GmbH & Co. KGaA, Weinheim

cellulose dissolved in LiCl/DMAc, SAXS measurements
were performed.
First, we investigated the structure of cellulose in the
solution with various cellulose concentrations. Figure 2
shows the SAXS profiles of 1 wt.-% cellulose in LiCl/
DMAc solution. As shown in more detail in the later
section, the profile was analyzed by fitting two Lorenzian
[Ornstein-Zernike (OZ)] functions.
SAXS measurements were also performed for the
cellulose gels to investigate the aggregation state of
cellulose molecular chains. Figure 3 shows the SAXS
profiles (logI(q) vs. logq) of the cellulose gels prepared
from 1 wt.-% cellulose/LiCl/DMAc solution. In these
profiles, plots at q> 1.34 nm�1 are linearly approximated.
This shows that the system in these length scales has a
complex structure that is characterized by the fractal
dimension. Namely,
IðqÞ � q�Dm ; 1 � Dm � 3 formass fractals ð1Þ
and
IðqÞ � q�ð6�DsÞ; 1 � Ds < 3 for surface fractals:½16�
ð2Þ
Dm and Ds in Equation (1) and (2) represent the fractal
dimensions of the mass and the surface, respectively. The
fractal dimensions estimated from the profiles are shown in
Figure3. In the large-q region,while thedeionized gel has the
mass fractal dimension, the water-coagulated one has a
surface fractal dimension. This shows that the water-
coagulated gel has a more densely packed structure than
the deionized one. In addition to the large-q region, another
fractal regime is found in the small-q region in the profile of
water-coagulated gel. In contrast, the deionized one does not
have such a fractal dimension in the small-q region.
Therefore, it is supposed that thewater-coagulated gel forms
larger aggregation structure than the deionized one.[17]
Differences in the structure of the gels are found more
significantly in the Kratky plot (Figure 4, q2I(q) vs. q). No
significant peaks are found in the Kratky plot of the
deionized cellulose gel, as in that of the dissolved cellulose.
On the other hand, that of the water-coagulated cellulose
shows a peak at q¼ 0.285 nm�1. These profiles suggest that
the structure of cellulose in the LiCl/DMAc solution is
preserved in the deionized gel, whereas that in the water-
coagulated gel is considerably different from that in the
Figure 1. Polarized optical photographs of the cellulose gels:(a) the water-coagulated gel; (b) the deionzed gel at the startup ofthe gelation; (c) the deionized gel after 5 d passed since the startupof the gelation. The particles at the bottom of the sample tubeobserved in (b) and (c) are the ion exchange resins. Anisotropicphase evolves at the surface of the resins.
Figure 2. SAXS profile of 1 wt.-% cellulose in LiCl/DMAcsolution.
Investigation of the Structure of Cellulose in LiCl/DMAc Solution and Its Gelation Behavior . . . 295
Macromol. Biosci. 2006, 6, 293–300 www.mbs-journal.de � 2006 WILEY-VCH Verlag GmbH & Co. KGaA, Weinheim

LiCl/DMAc solution. Details on the structure of these gels
are discussed in the following section (‘‘Structure of the
Cellulose Gels’’).
Discussion
Relation Between the Macroscopic AggregationBehavior and the Molecular Properties of Cellulose
Concentration dependence of the aggregation behavior of
cellulose can bewell explained by themolecular property of
cellulose in LiCl/DMAc. It has been already shown that
the cellulose molecules in LiCl/DMAc overlap when the
cellulose concentration is above ca. 0.3 wt.-%.[4] When the
polymer coils overlap, they have the ability to associate
each other and form a gel structure. On the other hand, when
the polymer coils are dispersed without overlapping, only
the intramolecular aggregation of molecular chains occurs
and then the collapsed molecules precipitate. Therefore, it
can be said that the overlapping of the cellulose molecular
chains is necessary for the gelation of cellulose.As shown in
the following discussion, the heterogeneity in the solution
made by the overlapping of cellulose molecules is
preserved in the cellulose gels.
Structure of Cellulose in LiCl/DMAc Solutions
Information on the structure of cellulose in the dissolved
state was obtainted from the SAXS profiles in the following
way. It is generally recognized that the spatial scale of
heterogeneity in polymer solution is described by the OZ
equation:[18]
IðqÞ ¼ Ið0Þ=ð1þ q2x2Þ ð3Þ
where x is the correlation length and I(0) is the scattered
intensity at q¼ 0. From Equation (3) we have
IðqÞ�1 ¼ 1=Ið0Þ�1 þ ½x2=Ið0Þ�q2 ð4Þ
Equation (4) shows that the plot of I(q)�1 against q2
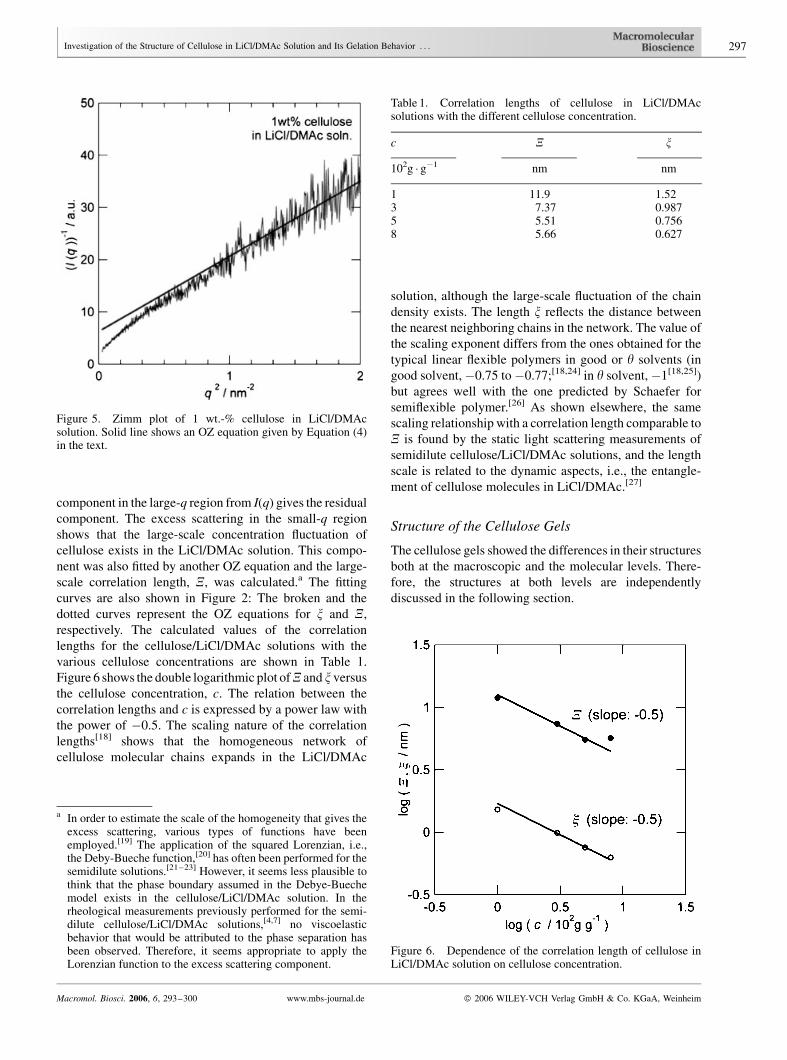
(Zimm plot) gives the value of x. Figure 5 shows the Zimm
plot of the 1 wt.-% cellulose solution. Plots in the q range
above 1 nm�1 are fitted by OZ equation. Subtraction of OZ
Figure 3. SAXS profile of cellulose gels: (a) deionized gel;(b) water-coagulated gel. Solid curves on the plots represent thefitted curves given by Equation (5) in (a) and Equation (6) in(b) (tentative value of Rg¼ 25.8 nm is assigned) in the text. Thedetails on the fitting methods are described in the Discussionsection.
Figure 4. Kratky plots of cellulose in LiCl/DMAc solution andgels.
296 D. Ishii, D. Tatsumi, T. Matsumoto, K. Murata, H. Hayashi, H. Yoshitani
Macromol. Biosci. 2006, 6, 293–300 www.mbs-journal.de � 2006 WILEY-VCH Verlag GmbH & Co. KGaA, Weinheim
component in the large-q region from I(q) gives the residual
component. The excess scattering in the small-q region
shows that the large-scale concentration fluctuation of
cellulose exists in the LiCl/DMAc solution. This compo-
nent was also fitted by another OZ equation and the large-
scale correlation length, X, was calculated.a The fitting
curves are also shown in Figure 2: The broken and the
dotted curves represent the OZ equations for x and X,respectively. The calculated values of the correlation
lengths for the cellulose/LiCl/DMAc solutions with the
various cellulose concentrations are shown in Table 1.
Figure 6 shows the double logarithmic plot ofX and xversusthe cellulose concentration, c. The relation between the
correlation lengths and c is expressed by a power law with
the power of �0.5. The scaling nature of the correlation
lengths[18] shows that the homogeneous network of
cellulose molecular chains expands in the LiCl/DMAc
solution, although the large-scale fluctuation of the chain
density exists. The length x reflects the distance between
the nearest neighboring chains in the network. The value of
the scaling exponent differs from the ones obtained for the
typical linear flexible polymers in good or y solvents (in
good solvent,�0.75 to�0.77;[18,24] in y solvent,�1[18,25])
but agrees well with the one predicted by Schaefer for
semiflexible polymer.[26] As shown elsewhere, the same
scaling relationship with a correlation length comparable to
X is found by the static light scattering measurements of
semidilute cellulose/LiCl/DMAc solutions, and the length
scale is related to the dynamic aspects, i.e., the entangle-
ment of cellulose molecules in LiCl/DMAc.[27]
Structure of the Cellulose Gels
The cellulose gels showed the differences in their structures
both at the macroscopic and the molecular levels. There-
fore, the structures at both levels are independently
discussed in the following section.
Table 1. Correlation lengths of cellulose in LiCl/DMAcsolutions with the different cellulose concentration.
c X x
102g � g�1 nm nm
1 11.9 1.523 7.37 0.9875 5.51 0.7568 5.66 0.627
a In order to estimate the scale of the homogeneity that gives theexcess scattering, various types of functions have beenemployed.[19] The application of the squared Lorenzian, i.e.,the Deby-Bueche function,[20] has often been performed for thesemidilute solutions.[21–23] However, it seems less plausible tothink that the phase boundary assumed in the Debye-Buechemodel exists in the cellulose/LiCl/DMAc solution. In therheological measurements previously performed for the semi-dilute cellulose/LiCl/DMAc solutions,[4,7] no viscoelasticbehavior that would be attributed to the phase separation hasbeen observed. Therefore, it seems appropriate to apply theLorenzian function to the excess scattering component.
Figure 5. Zimm plot of 1 wt.-% cellulose in LiCl/DMAcsolution. Solid line shows an OZ equation given by Equation (4)in the text.
Figure 6. Dependence of the correlation length of cellulose inLiCl/DMAc solution on cellulose concentration.
Investigation of the Structure of Cellulose in LiCl/DMAc Solution and Its Gelation Behavior . . . 297
Macromol. Biosci. 2006, 6, 293–300 www.mbs-journal.de � 2006 WILEY-VCH Verlag GmbH & Co. KGaA, Weinheim

We first discuss the differences in the structure at the
macroscopic level. Turbidity of the water-coagulated
cellulose gel suggests that the submicron-order hetero-
geneity exists in it. In contrast, it was expected that there
exists no submicron-order heterogeneity in the deionized
gel because of its colorless and transparent nature. How-
ever, as the deionized gel shows optical birefringence under
the crossed polarizer, suggesting the existence of an ordered
structure in the length scale below 300 nm. Although the
details on the formation mechanism of the submicron-order
structure in the water-coagulated gel are unknown at
present, it is speculated that the phase separation is induced
by the addition of water to the LiCl/DMAc solution.
Takeshita et al. pointed out that the competition of the phase
separation and the association of the molecular chains
(crystallite formation) is the key factor that affects the
submicron-order heterogeneity in poly(vinyl alcohol)
gel.[28] In their study, when the phase separation precedes
the crystallite formation, turbid gel is formed. On the other
hand, when the crystallite formation precedes the phase
separation, transparent gel is obtained. This explanation
seems to be valid for our results. Namely, in the case of the
formation of the deionized gel, it is supposed that the
molecular association precedes the phase separation. On
the other hand, in the case of the water-coagulated gel, the
phase separation may precede the molecular association.
The densely packed structure of the molecular aggregate in
the water-coagulated gel may be due to the condensation of
cellulose that is expected to occur in the process of the phase
separation.
We then focus on the structure at themolecular level. The
SAXS profiles, in particular the Kratky plots (Figure 4),
showed that the structures of the deionized and the water-
coagulated gels are considerably different. Therefore, the
characterization of the structure of these gels is made in
different ways.
As for the deionized gel, it was suggested from the
Kratky plot that the structure of cellulose in the deionize gel
is rather similar to that in the dissolved state. Considering
this, it is supposed that the structure of the deionized
cellulose gel consisted of the homogeneous network of the
cellulose molecular chains connected at the junction zones.
This kind of model has been applied for the analysis of the
gel structure of syndiotactic polystyrene swollen by
chloroform.[29] In the mentioned study, the characteristic
length scales were calculated using the following equation
originally derived for the structural analysis of the star-
shaped polymer:[30]
IðqÞ ¼ Ið0Þ exp � 1
3q2R2
g
� �
þ KGðDm � 1Þ sin½ðDm � 1Þ tan�1ðqxÞ�qxð1þ q2x2ÞðDm�1Þ=2
ð5Þ
Here, G(x) is the Gamma function of the variable x and K is
the constant. The radius Rg represents the radius of gyration
of the star-shaped polymer cluster that has the junction zone
as the core and the independent chains radiating from the
core. The correlation length x, reflects the average inter-
chain distance in the cluster. The fractal dimension, Dm,
reflects the aggregation state of cellulose molecules in the
cluster. Using Equation (5) and the value of Dm estimated
fromFigure 3(a)with Equation (1), the characteristic length
scaleswere calculated. The fitted curve for the calculation is
also shown in Figure 3(a). The result is shown in Table 2. It
is found that the value of Rg is almost the same as that of Xin the dissolved state as shown in Table 1. This suggests that
the structure of the deionized cellulose gel originates
from the large-scale fluctuation of the cellulose chain
density in the solution. Therefore, it is supposed that the
association of cellulose chains in the solution occurs at the
region where the chain density is high.
Next, the structure of the water-coagulated gel is
investigated. As the surface fractal dimension was calcu-
lated from the SAXS profiles, it is supposed that the
cellulose molecular chains in the water-coagulated gel is
packed more densely than in the deionized one. The peak
observed in the Kratky plot reflects the size of the
‘‘particle’’ formed by the aggregation of the cellulose
molecular chains. Surface and mass fractal dimensions, Ds
andDm, estimated from the large- and small-q regions in the
double logarithmic plot reflects the surface roughness and
the aggregation state of the particles mentioned above,
respectively. In order to describe the above-mentioned
structural model, the approach proposed by Beaucage was
Table 2. Characteristic length scales and fractal dimensions of cellulose gels.
Deionized Water-coagulated
Rg x Dm Rg Rs Dm Ds
nm nm nm nm
11.9 2.87 >15 (Beaucage)38.5 (p(r))
2.16 3.51 (Kratky)5 (p(r))
1.81 2.79
298 D. Ishii, D. Tatsumi, T. Matsumoto, K. Murata, H. Hayashi, H. Yoshitani
Macromol. Biosci. 2006, 6, 293–300 www.mbs-journal.de � 2006 WILEY-VCH Verlag GmbH & Co. KGaA, Weinheim
employed.[31] In his approach, the scattering function of
the mass fractal aggregate of rough surface particles is
expressed by
IðqÞ ¼ G exp �R2g
3q2
!þ B exp �R2
sub
3q2
� �1
q�
� �P
þ Gs exp �R2s
3q2
� �þ Bs
1
q�s
� �Ps
ð6Þ
where P and Ps are equal to Dm and 6-Ds, respectively. The
length Rg and Rs represent the radius of gyration of overall
aggregate and the particle comprising the aggregate,
respectively. The radius Rsub defines the upper cutoff
of the mass fractal regime and is generally equal to Rs. The
G,B,Gs, andBs are the constants. The quantity q* is defined
by
q� ¼ q=½erfðqkRg=61=2Þ�3 ð7Þ
where erf(x) is the error function of the variable x. The value
assigned to k, the empirical constant introduced by
Beaucage, was 1.06.[31] In the actual calculation, the
reciprocal of the value of q at the peak in theKratky plot was
assigned toRs [1/(0.285 nm�1)¼ 3.51 nm]. The dimensions
Dm andDs were calculated from the slopes in the small- and
large-q regions in Figure 3(b), respectively.[17] Using these
values, Rg was estimated as an adjustable parameter. The
good fit was obtained when the Rg was more than 15 nm, as
shown in Figure 3(b) by a solid curve. However, the
determination of the exact value of Rg was not attained, due
to the limitation of q range available. Therefore, in order to
evaluate the size of aggregate more precisely, distance
distribution function, p(r), was estimated by the equation
pðrÞ ¼ 1
2p2
ð10
qrIðqÞ sinðqrÞdq ð8Þ
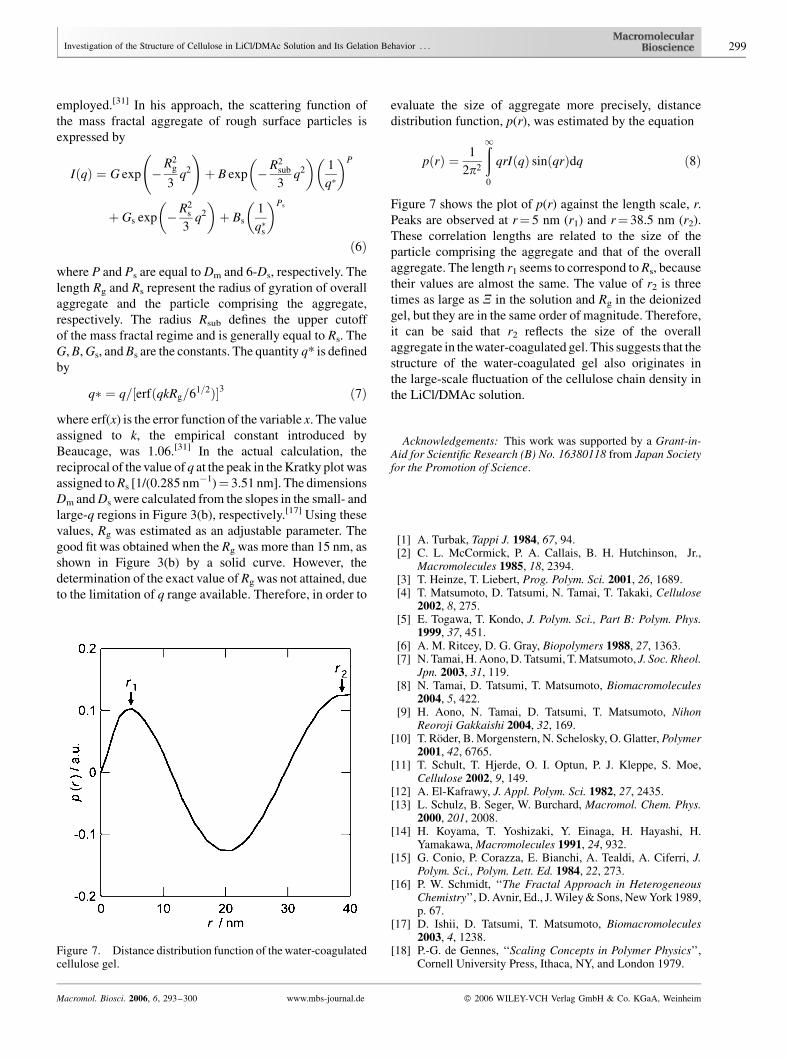
Figure 7 shows the plot of p(r) against the length scale, r.
Peaks are observed at r¼ 5 nm (r1) and r¼ 38.5 nm (r2).
These correlation lengths are related to the size of the
particle comprising the aggregate and that of the overall
aggregate. The length r1 seems to correspond toRs, because
their values are almost the same. The value of r2 is three
times as large as X in the solution and Rg in the deionized
gel, but they are in the same order of magnitude. Therefore,
it can be said that r2 reflects the size of the overall
aggregate in thewater-coagulated gel. This suggests that the
structure of the water-coagulated gel also originates in
the large-scale fluctuation of the cellulose chain density in
the LiCl/DMAc solution.
Acknowledgements: This work was supported by a Grant-in-Aid for Scientific Research (B) No. 16380118 from Japan Societyfor the Promotion of Science.
[1] A. Turbak, Tappi J. 1984, 67, 94.[2] C. L. McCormick, P. A. Callais, B. H. Hutchinson, Jr.,
Macromolecules 1985, 18, 2394.[3] T. Heinze, T. Liebert, Prog. Polym. Sci. 2001, 26, 1689.[4] T. Matsumoto, D. Tatsumi, N. Tamai, T. Takaki, Cellulose
2002, 8, 275.[5] E. Togawa, T. Kondo, J. Polym. Sci., Part B: Polym. Phys.
1999, 37, 451.[6] A. M. Ritcey, D. G. Gray, Biopolymers 1988, 27, 1363.[7] N. Tamai, H.Aono,D. Tatsumi, T.Matsumoto, J. Soc. Rheol.
Jpn. 2003, 31, 119.[8] N. Tamai, D. Tatsumi, T. Matsumoto, Biomacromolecules
2004, 5, 422.[9] H. Aono, N. Tamai, D. Tatsumi, T. Matsumoto, Nihon
Reoroji Gakkaishi 2004, 32, 169.[10] T. Roder, B. Morgenstern, N. Schelosky, O. Glatter, Polymer
2001, 42, 6765.[11] T. Schult, T. Hjerde, O. I. Optun, P. J. Kleppe, S. Moe,
Cellulose 2002, 9, 149.[12] A. El-Kafrawy, J. Appl. Polym. Sci. 1982, 27, 2435.[13] L. Schulz, B. Seger, W. Burchard, Macromol. Chem. Phys.
2000, 201, 2008.[14] H. Koyama, T. Yoshizaki, Y. Einaga, H. Hayashi, H.
Yamakawa,Macromolecules 1991, 24, 932.[15] G. Conio, P. Corazza, E. Bianchi, A. Tealdi, A. Ciferri, J.
Polym. Sci., Polym. Lett. Ed. 1984, 22, 273.[16] P. W. Schmidt, ‘‘The Fractal Approach in Heterogeneous
Chemistry’’, D. Avnir, Ed., J.Wiley&Sons, NewYork 1989,p. 67.
[17] D. Ishii, D. Tatsumi, T. Matsumoto, Biomacromolecules2003, 4, 1238.
[18] P.-G. de Gennes, ‘‘Scaling Concepts in Polymer Physics’’,Cornell University Press, Ithaca, NY, and London 1979.
Figure 7. Distance distribution function of thewater-coagulatedcellulose gel.
Investigation of the Structure of Cellulose in LiCl/DMAc Solution and Its Gelation Behavior . . . 299
Macromol. Biosci. 2006, 6, 293–300 www.mbs-journal.de � 2006 WILEY-VCH Verlag GmbH & Co. KGaA, Weinheim

[19] M. Shibayama, Macromol. Chem. Phys. 1998, 199, 1.[20] P. Debye, A. M. Bueche, J. Appl. Phys. 1949, 20, 518.[21] J. T. Koberstein, C. Picot, H. Benoit, Polymer 1985, 26, 673.[22] O. Kube, E. Wendt, J. Springer, Polymer 1987, 28, 1635.[23] I. Pezron, M. Djabourov, J. Leblond, Polymer 1991, 32,
3201.[24] F. Hamada, S. Kinugasa, H. Hayashi, A. Nakajima,
Macromolecules 1985, 18, 2290.[25] S. Kinugasa, H. Hayashi, F. Hamada, A. Nakajima,
Macromolecules 1986, 19, 2832.
[26] D. W. Schaefer, Polymer 1984, 25, 387.[27] H. Aono, D. Tatsumi, T. Matsumoto, J. Polym. Sci., Part B:
Polym. Phys. (submitted).[28] H. Takeshita, T. Kanaya, K. Nishida, K. Kaji, Macromole-
cules 1999, 32, 7815.[29] M. Kobayashi, T. Yoshioka, M. Imai, Y. Itoh, Macromole-
cules 1995, 28, 7376.[30] W. D. Dozier, J. S. Huang, L. J. Fetters, Macromolecules
1991, 24, 2810.[31] G. Beaucage, J. Appl. Crystallogr. 1996, 29, 134.
300 D. Ishii, D. Tatsumi, T. Matsumoto, K. Murata, H. Hayashi, H. Yoshitani
Macromol. Biosci. 2006, 6, 293–300 www.mbs-journal.de � 2006 WILEY-VCH Verlag GmbH & Co. KGaA, Weinheim