investigation • recursive toothpick patterns -...
TRANSCRIPT

Investigation • Recursive Toothpick Patterns
Name Period Date
You will need:
Discovering Algebra Investigation Worksheets LESSON 3.1 1
©2009 Key Curriculum Press
You will need: a box of toothpicks
In this investigation you will learn to create and apply recursive sequences by modeling them with puzzle pieces made from toothpicks.
Step 1 Make Figures 1–3 of the pattern using as few toothpicks as possible. How many toothpicks does it take to reproduce each figure? How many toothpicks lie on the perimeter of each figure?
Step 2 Make Figures 4–6 from toothpicks by adding triangles in a row. Record the results in the table.
Number of toothpicks Perimeter
Figure 1
Figure 2
Figure 3
Figure 4
Figure 5
Figure 6
Figure 10
Figure 25
Investigation • Recursive Toothpick Patterns
Name Period Date
Consider this pattern of triangles.
Figure 1 Figure 2 Figure 3

Step 3 What is the rule for finding the number of toothpicks in each figure? What is the rule for finding the perimeter? Use your calculator to create recursive routines for these rules. Check that these routines generate the numbers in your table.
Step 4 Now make Figure 10 from toothpicks. Count the number of toothpicks and find the perimeter. Does your calculator routine give the same answers? Find the number of toothpicks and the perimeter for Figure 25. Add those results to the table.
Next you’ll see what sequences you can generate with a new pattern.
Step 5 Design a pattern using a row of squares, instead of triangles, with your toothpicks. Repeat Steps 1–4 and answer all the questions with the new design. Record the results in the table.
Number of toothpicks Perimeter
Figure 1
Figure 2
Figure 3
Figure 4
Figure 5
Figure 6
Figure 10
Figure 25
Investigation • Recursive Toothpick Patterns (continued)
2 LESSON 3.1 Discovering Algebra Investigation Worksheets
©2009 Key Curriculum Press

Investigation • Recursive Toothpick Patterns (continued)
Discovering Algebra Investigation Worksheets LESSON 3.1 3
©2009 Key Curriculum Press
Step 6 Choose a unit of measurement and explain how to calculate the area of a square made from toothpicks. How does your choice of unit affect calculations for the areas of each figure?
Now you’ll create your own puzzle piece from toothpicks. Add identical pieces in one direction to make the succeeding figures of your design.
Step 7 Draw Figures 1–3 on your paper. Write recursive routines to generate number sequences for the number of toothpicks, perimeter, and area of each of six figures. Record these numbers in the table. Find the values for a figure made of ten puzzle pieces.
Number of toothpicks Perimeter Area
Figure 1
Figure 2
Figure 3
Figure 4
Figure 5
Figure 6
Figure 10
Step 8 Write three questions about your pattern that require recursive sequences to answer. For example: What is the perimeter if the area is 20? Test your questions on your classmates.
Investigation • On the Road Again
Name Period Date
Discovering Algebra Investigation Worksheets LESSON 3.2 1
©2009 Key Curriculum Press
You will need: the On the Road Again Table and On the Road Again Grid worksheets
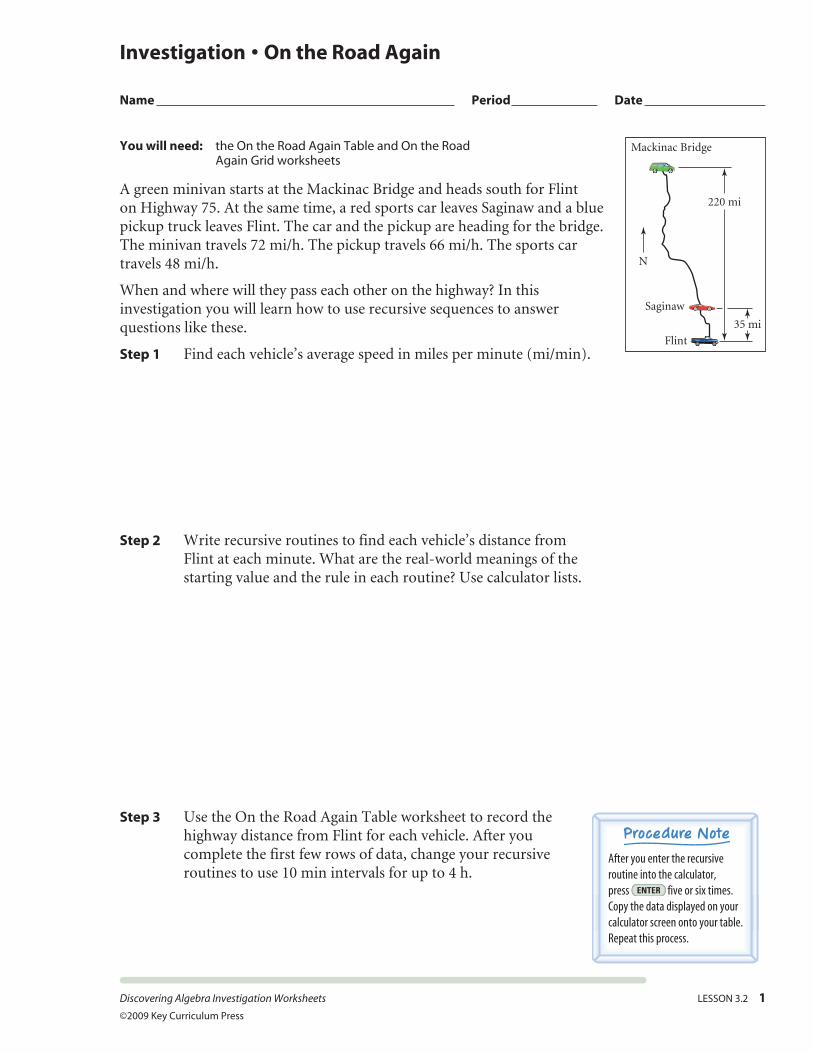
A green minivan starts at the Mackinac Bridge and heads south for Flint on Highway 75. At the same time, a red sports car leaves Saginaw and a blue pickup truck leaves Flint. The car and the pickup are heading for the bridge. The minivan travels 72 mi/h. The pickup travels 66 mi/h. The sports car travels 48 mi/h.
When and where will they pass each other on the highway? In this investigation you will learn how to use recursive sequences to answer questions like these.
Step 1 Find each vehicle’s average speed in miles per minute (mi/min).
Step 2 Write recursive routines to find each vehicle’s distance from Flint at each minute. What are the real-world meanings of the starting value and the rule in each routine? Use calculator lists.
Step 3 Use the On the Road Again Table worksheet to record the highway distance from Flint for each vehicle. After you complete the first few rows of data, change your recursive routines to use 10 min intervals for up to 4 h.
Mackinac Bridge
Saginaw
N
Flint
220 mi
35 mi
After you enter the recursive routine into the calculator, press
Key Curriculum MathButton Variation #4by Precision Graphics
GRAPH ENTER five or six times. Copy the data displayed on your calculator screen onto your table. Repeat this process.

Step 4 Define variables and plot the information from the table onto the On the Road Again Grid worksheet. Using a different color for each vehicle, plot its (time, distance) coordinates.
Step 5 On the graph, do the points for each vehicle seem to fall on a line? Does it make sense to connect each vehicle’s points in a line? If so, draw the line. If not, explain why not.
Use your graph and table to find the answers for Steps 6–10.
Step 6 Where does the starting value for each routine appear on the graph? How does the recursive rule for each routine affect the points plotted?
Step 7 Which line represents the minivan? How can you tell?
Step 8 Where are the vehicles when the minivan meets the first one headed north?
Step 9 How can you tell by looking at the graph whether the pickup or the sports car is traveling faster? When and where does the pickup pass the sports car?
2 LESSON 3.2 Discovering Algebra Investigation Worksheets ©2009 Key Curriculum Press
Investigation • On the Road Again (continued)

Discovering Algebra Investigation Worksheets LESSON 3.2 3
©2009 Key Curriculum Press
Step 10 Which vehicle arrives at its destination first? How many minutes pass before the second and third vehicles arrive at their destinations? How can you tell by looking at the graph?
Step 11 What assumptions about the vehicles are you making when you answer the questions in the previous steps?
Step 12 Consider how to model this situation more realistically. What if the vehicles are traveling at different speeds? What if one driver stops to get gas or a bite to eat? What if the vehicles’ speeds are not constant? Discuss how these questions affect the recursive routines, tables of data, and their graphs.
Investigation • On the Road Again (continued)

Discovering Algebra Investigation Worksheets LESSON 3.3 1
©2009 Key Curriculum Press
You will need: a 4-meter measuring tape or four metersticks per group, a motion sensor, a stopwatch or watch that shows seconds
Imagine that you have a 4-meter measuring tape positioned on the floor. A motion sensor measures your distance from the tape’s 0-mark as you walk, and it graphs the information. On the calculator graphs shown here, the horizontal axis shows time from 0 to 6 seconds and the vertical axis shows distance from 0 to 4 meters.
a.
M
S
M
S
M
S
Step 1 Write a set of walking instructions for each graph. Tell where the walk begins, how fast the person walks, and whether the person walks toward or away from the motion sensor located at the 0-mark.
Step 2 Graph a 6-second walk based on each set of walking instructions or data.
a. Start at the 2.5-meter mark and stand still.
x
y
Time (sec)
Dis
tan
ce (
m)
Investigation • Walk the Line
Name Period Date
b. c.

b. Start at the 3-meter mark and walk toward the sensor at a constant rate of 0.4 meter per second.
x
y
Time (sec)
Dis
tan
ce (
m)
c. Time (s) 0 1 2 3 4 5 6
Distance (m) 0.8 1.0 1.2 1.4 1.6 1.8 2.0
x
y
Time (sec)
Dis
tan
ce (
m)
Step 3 Write a recursive routine for the table in Step 2c.
For the next part of the investigation, you will need a graphing calculator and a motion sensor. Your group will need a space about 4 meters long and 1.5 meters wide (13 feet by 5 feet). Tape to the floor a 4-meter measuring tape or four metersticks end-to-end. Assign these tasks among your group members: walker, motion-sensor holder, coach, and timer.
Step 4 Your group will try to create the graph shown in Step 1, graph a. Remember that you wrote walking directions for this graph. Use your motion sensor to record the walker’s motion. [ See Calculator Note 3B: Collecting Distance Data Using the EasyData App for help using the motion sensor. ] After each walk, discuss what you could have done to better replicate the graph. Repeat the walk until you have a good match for graph a.
Step 5 Rotate jobs, and repeat Step 4 to model graphs b and c from Step 1 and the three descriptions from Step 2.
Investigation • Walk the Line (continued)
2 LESSON 3.3 Discovering Algebra Investigation Worksheets ©2009 Key Curriculum Press
You will need: a 4-meter measuring tape or four metersticks per group, a stopwatch or watch that shows seconds
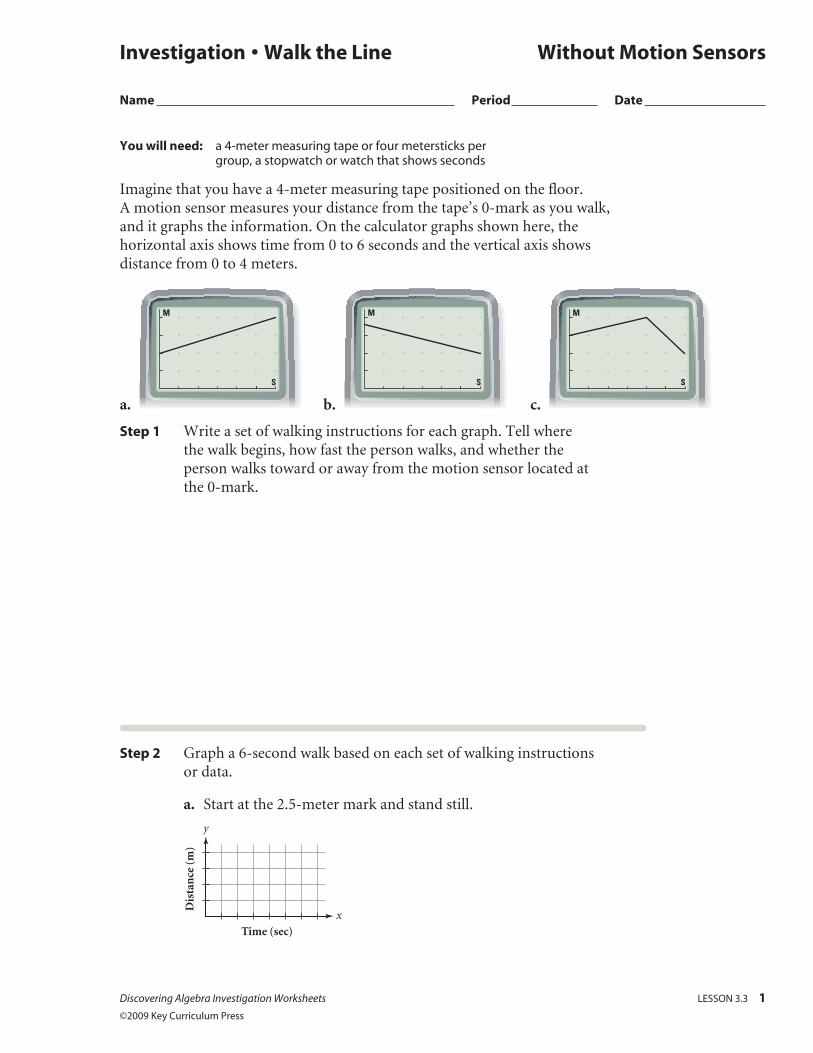
Imagine that you have a 4-meter measuring tape positioned on the floor. A motion sensor measures your distance from the tape’s 0-mark as you walk, and it graphs the information. On the calculator graphs shown here, the horizontal axis shows time from 0 to 6 seconds and the vertical axis shows distance from 0 to 4 meters.
a.
Step 1 Write a set of walking instructions for each graph. Tell where the walk begins, how fast the person walks, and whether the person walks toward or away from the motion sensor located at the 0-mark.
Step 2 Graph a 6-second walk based on each set of walking instructions or data.
a. Start at the 2.5-meter mark and stand still.
x
y
Time (sec)
Dis
tan
ce (
m)
Investigation • Walk the Line Without Motion Sensors
Name Period Date
Discovering Algebra Investigation Worksheets LESSON 3.3 1
©2009 Key Curriculum Press
M
S
M
S
M
S
b. c.

2 LESSON 3.3 Discovering Algebra Investigation Worksheets ©2009 Key Curriculum Press
b. Start at the 3-meter mark and walk toward the sensor at a constant rate of 0.4 meter per second.
x
y
Time (sec)
Dis
tan
ce (
m)
c. Time (s) 0 1 2 3 4 5 6
Distance (m) 0.8 1.0 1.2 1.4 1.6 1.8 2.0
x
y
Time (sec)
Dis
tan
ce (
m)
Step 3 Write a recursive routine for the table in Step 2c.
For the next part of the investigation, you will need the measuring tape and stopwatch or watch. Your group will need a space about 4 meters long and 1.5 meters wide (13 feet by 5 feet). Tape to the floor the measuring tape (or four metersticks end-to-end). Assign these tasks among your group members: walker, recorder, coach, and timer.
Step 4 Your group will try to create the graph shown in Step 1, graph a. Remember that you wrote walking directions for this graph. At a signal from the timer, the walker begins walking from one end of the marked distance toward the other. The timer announces the time at one-second intervals, and the recorder records the walker’s distance from the beginning point at each second, while the coach gives suggestions to the walker about walking speed. Graph your (time, distance) data. List ideas about what you could have done to better replicate the graph.
x
y
Time (sec)
Dis
tan
ce (
m)
Investigation • Walk the Line (continued) Without Motion Sensors

Discovering Algebra Investigation Worksheets LESSON 3.3 3
©2009 Key Curriculum Press
Step 5 Rotate jobs, and repeat Step 4 to model graphs b and c from Step 1 and the three descriptions from Step 2.
x
y
Time (sec)
Dis
tan
ce (
m)
x
y
Time (sec)
Dis
tan
ce (
m)
x
y
Time (sec)
Dis
tan
ce (
m)
x
y
Time (sec)
Dis
tan
ce (
m)
Investigation • Walk the Line (continued) Without Motion Sensors

Manisha starts her exercise routine by jogging to the gym. Her trainer says this activity burns 215 calories. Her workout at the gym is to pedal a stationary bike. This activity burns 3.8 calories per minute.
First you’ll model this scenario with your calculator.
Step 1 Use calculator lists to write a recursive routine to find the total number of calories Manisha has burned after each minute she pedals the bike. Include the 215 calories she burned on her jog to the gym.
Step 2 Complete the table using your recursive routine.
Step 3 After 20 minutes of pedaling, how many calories has Manisha burned? How long did it take her to burn 443 total calories?
Next you’ll learn to write an equation that gives the same values as the calculator routines.
Step 4 Write an expression to find the total calories Manisha has burned after 20 minutes of pedaling. Check that your expression equals the value in the table.
Step 5 Write and evaluate an expression to find the total calories Manisha has burned after pedaling 38 minutes. What are the advantages of this expression over a recursive routine?
Investigation • Working Out with Equations
Name Period Date
Discovering Algebra Investigation Worksheets LESSON 3.4 1
©2009 Key Curriculum Press
Manisha’s Workout
Pedaling time (min)
x
Total calories burned
y
0 215
1
2
20
30
45
60

Step 6 Let x represent the pedaling time in minutes, and let y represent the total number of calories Manisha burns. Write an equation relating time to total calories burned.
Step 7 Check that your equation produces the corresponding values in the table.
Now you’ll explore the connections between the linear equation and its graph.
Step 8 Plot the points from your table on your calculator. Then enter your equation into the Y5 menu. Graph your equation to check that it passes through the points. Give two reasons why drawing a line through the points realistically models this situation. [ See Calculator Note 1J: Equations to review how to plot points and graph an equation. ]
Step 9 Substitute 538 for y in your equation to find the elapsed time required for Manisha to burn a total of 538 calories. Explain your solution process. Check your result.
Step 10 How do the starting value and the rule of your recursive routine show up in your equation? How do the starting value and the rule of your recursive routine show up in your graph? When is the starting value of the recursive routine also the value where the graph crosses the y-axis?
Investigation • Working Out with Equations (continued)
2 LESSON 3.4 Discovering Algebra Investigation Worksheets ©2009 Key Curriculum Press

In this investigation you’ll use the relationship between temperature and wind chill to explore the concept of rate of change and its connections to tables, scatter plots, recursive routines, equations, and graphs.
The data in the table represent the approximate wind chill temperatures in degrees Fahrenheit for a wind speed of 20 mi/h. Use this data set to complete each task.
Step 1 Define the input and output variables for this relationship.
Step 2 Plot the points on your calculator and describe the viewing window you used.
Step 3 Write a recursive routine that gives the pairs of values listed in the table.
Step 4 Complete the third and fourth columns of the table by recording the changes between consecutive input and output values. Then find the rate of change.
Input OutputChange in
input valuesChange in
output valuesRate of change
25 228.540
0 221.980 5 6.56 16.56 ______ 15
5
1 220.668 1 1.312
2 219.356 1.312 11.312 _______ 11
5
5 215.420 3
15 22.300 13.12 113.12 _______ 110
5
35 23.940
Investigation • Wind Chill
Name Period Date
Discovering Algebra Investigation Worksheets LESSON 3.5 1
©2009 Key Curriculum Press
Temperature (ºF)
Wind chill (ºF)
25 228.540
0 221.980
1 220.668
2 219.356
5 215.420
15 22.300
35 23.940
[Data sets: TMPWS, WINDCH]

Step 5 Use your routine to write a linear equation in intercept form that relates wind chill to temperature. Note that the starting value, 228.540, is not the y-intercept. How does the rule of the routine appear in your equation?
Step 6 Graph the equation on the same set of axes as your scatter plot. Use the calculator table to check that your equation is correct. Does it make sense to draw a line through the points? Where does the y-intercept show up in your equation?
Step 7 What do you notice about the values for rate of change listed in your table? How does the rate of change show up in your equation? In your graph?
Step 8 Explain how to use the rate of change to find the actual temperature if the weather report indicates a wind chill of 9.5° with 20 mi/h winds.
Investigation • Wind Chill (continued)
2 LESSON 3.5 Discovering Algebra Investigation Worksheets ©2009 Key Curriculum Press

You will need: pennies, three paper cups
Here is a visual model of the equation 2x 1 3 5 7. A cup represents the variable x and pennies represent numbers. Assume that each cup has the same number of pennies in it and that the containers themselves are weightless.
Step 1 How many pennies must be in each cup if the left side of the scale balances with the right side? Explain how you got your answer.
Your answer to Step 1 is the solution to the equation 2x 1 3 5 7. It’s the number that can replace x to make the statement true. In Steps 2 and 3, you’ll use pictures and equations to show stages that lead to the solution.
Step 2 Redraw the picture above, but with three pennies removed from each side of the scale. Write the equation that your picture represents.
Investigation • Balancing Pennies
Name Period Date
Discovering Algebra Investigation Worksheets LESSON 3.6 1
©2009 Key Curriculum Press
x x +1 +1 +1 +1 +1 +1 +1
+1 +1 +1
=

Step 3 Redraw the picture, this one showing half of what was on each side of the scale in Step 2. There should be just one cup on the left side of the scale and the correct number of pennies on the right side needed to balance it. Write the equation that this picture represents. This is the solution to the original equation.
Now your group will create a pennies-and-cups equation for another group to solve.
Step 4 Divide the pennies into two equal piles on a blank piece of paper. If you have one left over, put it aside. Draw a large equal sign (or form one with two pencils) and place the penny stacks on opposite sides of it.
Step 5 From the pile on one side of your equal sign, make three identical stacks, leaving at least a few pennies out of the stacks. Hide each stack under a paper cup. You should now have three cups and some pennies on one side of your equal sign.
Step 6 On the other side you should have a pile of pennies. On both sides of the equal sign you have the same number of pennies, but on one side some of the pennies are hidden under cups. You can think of the two sides of the equal sign as being the two sides of a balance scale. Draw a picture of your equation. Write an equation for this setup, using x to represent the number of pennies hidden under one cup.
Investigation • Balancing Pennies (continued)
2 LESSON 3.6 Discovering Algebra Investigation Worksheets ©2009 Key Curriculum Press

Investigation • Balancing Pennies (continued)
Discovering Algebra Investigation Worksheets LESSON 3.6 3
©2009 Key Curriculum Press
Step 7 Move to another group’s setup. Look at their arrangement of pennies and cups, and write an equation for it. Solve the equation; that is, find how many pennies are under one cup without looking. When you’re sure you know how many pennies are under each cup, you can look to check your answer.
Step 8 Write a brief description of how you solved the equation.