investing in early public works
TRANSCRIPT

0
Investing in Early Public Works:
Financial Returns in English and Welsh Turnpikes 1820-1845
Dan Bogart1
Department of Economics, UC Irvine
Current Draft: September 2016
Abstract
Private and local investors provided much of the capital to improve England’s infrastructure
during its industrialization. Their capital was pooled in thousands of small trusts and joint stock
companies. This paper investigates the rate of return paid to investors. It focuses on turnpike
road trusts—arguably the most precarious infrastructure authorities. It draws on parliamentary
reports which provide comprehensive data on many aspects of financing in the early nineteenth
century. The analysis shows that turnpikes paid investors a similar return to the yield on
government bonds, but lower than railways and canals. Financial returns varied at the individual
trust level with most paying 4.5 to 5 percent, and some paying zero interest. The ‘financial
losers’ however were not the majority and many bondholders were able to recoup losses over the
medium term. Investors appear to have understood the risks based on evidence that contracted
interest rates were higher for newer trusts and those with higher debt.
JEL Codes: K23, N43, N73
Key Words: Turnpike Roads, Infrastructure, Finance, British Industrial Revolution
1 Helpful comments were provided by participants in seminars at UC Irvine, Northwestern, Stanford, and University
of Paris 1 on an earlier version of this paper, Profiting from Public Works. Thanks go to Jean Laurent Rosenthal,
Alejandro Komai, Anne Conchon, and Arnaud Passalaequa for comments. Also special thanks goes to Alan
Rosevear and Max Satchelll for help in creating turnpike datasets and for collaboration. All mistakes are my own.

1
Infrastructure investment is one of the important drivers of economic growth and development.
But the gains from infrastructure investment are often contested, especially if the private sector is
the main source of funding. Historically the rich account for most private investment in
infrastructure, and if the returns are low there can be redistribution to the rest of the society.
However, if private investors earn large financial returns then infrastructure can contribute to
greater income for the rich, especially if investors are local and already benefit from increased
property values. The financial risks are also relevant for determining the terms of infrastructure
investment. With high risks investors will generally demand a higher expected return at the
outset. Success will generate higher rewards, even if failure is more likely.
This paper examines the financial returns to investing in turnpike road trusts in England
and Wales in the early nineteenth century. A historical study of turnpike trusts is revealing for
several reasons. First, the English and Welsh economy made substantial investments in transport
infrastructure as it industrialized. Railways were the largest as a percentage of capital formation,
but there were also significant investments from 1750 to 1830 in canals, roads, docks, and water
supply.2 Turnpike trusts are illustrative of the first wave of investment. Second, turnpike trusts
mainly relied on bonds to finance investment, and as trusts they were restricted from earning
profits. They make for an interesting comparison with joint stock companies, which came to
dominate infrastructure in the nineteenth century. Third, local individuals, especially landowners
and merchants, held most of the turnpike bonds. Governments provided little capital, except for a
brief period in the 1820s. Thus turnpike trusts provide insights on infrastructure networks
primarily financed by local and private investors. Fourth, there is excellent data on the finances
of all turnpike trusts in England and Wales starting in 1820. Financial surveys were conducted by
2 Feinstein (1988, p. 444) gives estimates of gross capital formation in railways and other transport and
communications by decade. Railways accounted for 28% of all gross capital formation in the 1840s. In the 1790s
other transport and communications accounted for 20% of all gross capital formation.

2
parliamentary committees and provide a rare snapshot into the revenues, expenses, and liabilities
for a population of infrastructure providers. Often scholars in this area are forced to work with
potentially selected samples of company records.
The rich data sources summarize the interest payments made to all turnpike bondholders
in 1820, 1829, 1834, 1838, 1842, and 1845. The reports also include information on payments
and debt at the individual trust-level, and are fully digitized for 1820 and 1838. The aggregate
figures show that interest payments as a percentage of turnpike debt were around 4 percent
between 1820 and 1845. Unpaid interest was substantial in these years, but even when it is
included in the debt, interest payments are still 3.3 percent of liabilities. By comparison, the yield
on 3 percent Consols was 3.4 percent over the same period.
I also make estimates of total capital invested in turnpikes and its rate of return from
1820. The value of total turnpike capital was between 10 and 15 million £ in current prices,
making it less than canals but still sizeable. The aggregate return measured as net turnpike
revenues divided by total capital value averaged just over 3 percent from the 1820s to the 1840s.
The similarity with bondholder returns suggests that most of the financial surplus went to
bondholders. The estimates also imply that in the aggregate investing in turnpikes yielded a
competitive financial return.
The preceding conclusion applies to the average investor, but outcomes varied at the
individual turnpike trust and investor level. The data show that 16 percent of trusts paid no
interest in 1820, yielding a zero percent return to bondholders. At the other end of the spectrum
60 percent of turnpike trusts paid a return above 4.5 percent. The distribution was similar in
1838. Notably though many trusts making zero interest payments in 1820 were paying the
average interest by 1838.

3
The analysis of individual trusts shows there was clearly some risk in holding individual
turnpike bonds. Investors possibly understood these risks and demanded a higher contracted rate
at the outset of lending or when renegotiating. I test this claim by studying how proxies for risk
affected the contracted rate across all trusts in 1838. Sources show that three quarters of trusts
had contracted rates of 5 percent, the maximum allowed by usury law, but some were 4 or 4.5
percent. One hypothesis is that investors demanded the higher contracted rate for newer trusts
and trusts with more debt in 1820 because they were perceived as riskier. The evidence is
consistent with this view and shows that newer trusts and those with higher debt in 1820 were
more likely to pay the maximum contracted rate. The rate of return in 1820 has no effect on the
contracted rate by 1838, suggesting that investors did not necessarily perceive poor financial
performance in a single year as indicative of greater long-term risk.
As a final exercise, I make comparisons between investing in a portfolio of turnpikes,
canals, railways, or farmlands in the period from 1820 to 1850. For railways I draw on Arnold
and McCartney (2005) who estimate the returns on capital employed for the top five and next 10
railway companies. For canals I use Arnold and McCartney (2011) and Ward (1974) who
provide returns and dividend rates for two samples of companies. Returns on farmland are taken
from Clark’s (1998) data on charity records. I also extend the comparison to the British stock
market from 1825 to 1870 using the returns in Acheson et. al. (2009). In each case, I calculate
the Sharpe Ratio, which measures the returns per unit of risk in a portfolio. The Sharpe Ratio for
the turnpike portfolio was higher than the farmland portfolio, but less than the canal, railway, and
the stock market portfolios. Thus on purely financial terms assets in the new transportation and
industrial economy performed better than turnpikes.

4
The findings contribute to studies measuring the historical returns to investing in
infrastructure in developed economies.3 They show that turnpike trusts in England and Wales
yielded a competitive return to investors in the first half of the nineteenth century. This
conclusion is at odds with the view that most trusts did not meet their interest obligations or were
insolvent (see Albert 1972 and Webster 2016). The evidence shows that trusts were able to
generate competitive returns in the aggregate because they borrowed at rates above government
bonds, and enough trusts paid this high rate to offset those not paying interest. The findings also
suggest that turnpikes contributed to higher incomes for the rich in England and Wales. Previous
studies suggest that turnpike trusts increased local property income by 10 to 20 percent. 4
As
most investors were local landowners and merchants, the financial returns were often an addition
to the increased property values which came from turnpike trusts.
This paper also makes a contribution by showing the relative returns to investing in
different assets in the early nineteenth century. Canal shares had the highest returns and highest
risks; turnpike bonds had more moderate risks and returns; railway shares were the best of all,
yielding high returns with reasonably low risks. Overall the infrastructure sector generated
substantial rates of return, and larger than the economy as a whole which grew at 2 percent per
year between 1820 and 1850.5
Finally, this paper contributes to the contemporary literature on infrastructure finance.
The private sector plays a large role in infrastructure financing today, as it did in the past. But
3 For the literature on Britain, see Albert (1972), Pawson (1977), Buchanan (1986), Webster (2015) who study
turnpike trusts, Ward (1974), Trew (2010), and Arnold and McCartney (2011) who study canals, Jackson (1983)
who studies docks, Casson (2009), Mitchell, Chambers, and Crafts (2011) and Arnold and McCartney (2005, 2011)
who study railways, and Goldsmith and Carter (2016) who study water supply. For the United States and Canada see
Carlos and Lewis (1995) and White (2011) for railroads, Klein (1990) and Klein and Majewski (1992) for turnpikes,
for canals see Majewski (2000). For a comparison on Britain and the US see Bogart and Majewski (2011). For a
long-run perspective on Europe see the introduction in Cassis, De Luca, and Florio (2016). 4 The economic returns from turnpikes are discussed by Albert (1972), Guldi (2012), Ward (1974), Klein (1990),
and Majewski (2000). For econometric evidence on how trusts affected property values see Bogart (2009). 5 I use as my estimate of GDP growth the figures from Broadberry et. Al. (2015).

5
today international agencies and central governments usually provide ‘minimum income
guarantees’ to insure investors against default or large losses. Infrastructure policy also shuns
competition due to concerns it will discourage investment. Despite these assurances the
contemporary infrastructure sector is not always profitable. In the early 2000s, private returns to
infrastructure concessions were modest and often below the cost of capital (Sirtaine et. Al. 2005,
Estache and Pinglo 2005, Rothballer and Kaserer 2012). This paper provides a historical case
where the infrastructure sector yielded competitive returns over a significant time span.
The paper is organized as follows. Section I provides background on turnpike trusts.
Section II reviews the data sources. Sections III, IV, and V report the returns on investing in the
turnpike sector, and across individual turnpike trusts. Section VI examines how risk factors
affected the contracted rate. Section VII compares returns for turnpikes with canals, railways,
and land. Section VIII concludes.
I.
Private financing was prominent in England’s transport investment from an early stage.
Parliament granted trusts and joint stock companies the powers to construct or improve transport
infrastructure through acts of parliament. On the basis of these acts, capital was raised through
bonds and stocks. Local individuals, like landowners, commercial interests, and urban savers,
provided the capital with few financial guarantees from the central government in London. By
the early nineteenth century, infrastructure trusts and joint stock companies numbered in the
thousands. Most relied on the users in a single town or city to earn revenues.
Turnpike trusts are a prime example of the more general pattern.6 Turnpike acts transferred
authority over a road to a body of trustees for 21 years. It was typical for the trustees’ authority
to be renewed by subsequent acts, and thus for trusts to be long-lived. Trustees had to meet
6 For an overview of turnpike trusts see Albert (1972) and Pawson (1977).

6
property and income qualifications. Notably the requirements to be trustees were often lighter on
landowners, making them the most common social group. Trustees had the right to levy tolls and
they had a right to the labor of the residents in parishes near the road. It was called statute labor
in England and corvee labor elsewhere. Turnpike trusts were also authorized to issue bonds
secured on the toll income (the bonds are explained more below). Finally, most turnpike acts
forbade the creation of tradeable shares and collection of profits. The revenues were to be
devoted to manual labor, materials, officers’ salaries, interest, and repayment of the principal on
the debt. Surplus balances were to be held by the treasurer and applied to future expenses.
Turnpike trusts spread widely through the network from the 1690s to the 1830s. The 1750s
and 1760s were the two decades with the largest numbers formed. Trusts managed all the major
roads leading into London and between major cities and towns. They also managed the major
roads between industrial towns and their hinterland, as well the market towns in rural areas. By
the 1830s around 1000 trusts managed 20,000 miles or 20 percent of the total network. A map of
the turnpike road network, the coalfields, and the largest towns in 1830 is shown in figure 1. The
extraordinarily dense network is evident.
A prominent feature of turnpike trusts was their reliance on debt financing. 7
There were
two types of debt. The first were bonds secured on the tolls (so-called mortgaged debt). The
second were unsecured bonds (so-called called floating debt). The mortgage bonds were by far
the largest. They had no set maturity date and the trustees could repay the principal in full at any
time.8 Each bond for a trust was generally treated equal, and so there were no first or second
claims on the revenues. The exception was that if any individual bondholder did not receive their
7 See Albert (1972, pp. 93-97) for a discussion of turnpike debts.
8 There is a caveat here. The bonds would expire when the trust was distinguished. The expiration date would have
been a problem as most trusts operated under a temporary 21-year authority, but Parliament regularly renewed
turnpike charters in order not to create defaults.

7
scheduled interest payment within six months they could foreclose on the tolls and become the
first claimant on the revenues. The interest rates on the mortgage debt could not exceed 5 percent
because of usury laws, and most ranged between 4 and 5 percent as will be shown below.
The overwhelming proportion of investors in turnpike bonds came from areas near the
road. As an illustration, Buchanan’s (1985) detailed study of the Bath turnpike trust shows that
many investors were resident in Bath with a minority having neighboring Bristol or London
addresses. Buchanan also shows that many investors were merchants, tradesman, and ‘small
urban savers’ (p. 235). Webster’s (2015, p. 67) analysis of 41 mortgage ledgers provides more
general evidence on investor identities. Webster found that 42 percent of investors can be
classified as landowners, 31 percent as commercial interests, and 27 percent as savers. Banks or
other financial institutions contributed little.
There was a change in the level and character of trust borrowing starting around 1820. At
this time, engineers like John Macadam and Thomas Telford developed new methods for making
roads using crushed stones of different sizes in the road bed. Their methods were more expensive
than traditional approaches used by turnpike trusts, and required a new wave of borrowing to be
implemented. In the 1820s and 1830s total turnpike debt in England and Wales increased by
approximately 75 percent from £4.4 million to £7.3 million as the new road making methods
were implemented. 9
Most of the lending in the 1820s came from local individuals, but for the first time in
England a significant portion also came from the central government. The Public Works Loan
Board (PWLB) was founded in 1817 by an act of parliament.10
The PWLB’s official aim was to
provide financial stimulus to useful schemes. Local authorities like turnpike trusts had to apply
9 According to Guldi (2012, pp. 29-72), the civil engineers were partly successful because of earlier experiences
with military roads in Scotland, and the building of the London Holyhead road in the late 1810s. 10
See Webster (2015, pp. 59-91) for an analysis of PWLB and its relation to turnpikes.

8
for a loan, and if accepted the PWLB often insisted on the right of first payment. In most cases,
the PWLB charged 5 percent interest, the maximum allowed by usury laws. The PWLB lent
£401,000 to 107 trusts in England and Wales between 1817 and 1832. Most of the loans were
granted in the years 1817, 1818, and 1826. PWLB loans look small compared to the £6.8 million
in turnpike debt by 1829, but it did make a significant contribution to turnpike capital in the
important decade of the 1820s (Webster 2015, p. 68).
After accounting for the PWLB, the typical investor in turnpike bonds was a local
landowner, merchant, or manufacturer. They had an economic interest in financing the trust
because good roads increased their property or asset values. In fact, there is evidence local
property income rose by 15-20 percent near turnpikes (Bogart 2009). However, these local
investors also had a financial interest in the trust through the returns on their turnpike bonds.
They could instead invest in land or government bonds, and let others bear the risk of turnpike
bonds. An interesting question thus arises: how well did turnpike investors do in terms of
returns?
There is anecdotal evidence in the literature suggesting that some turnpike investors earned
good returns, and were paid an interest rate that was larger than the local market rate. As one
illustration, a farmer in northern England commented on a turnpike in his area stating that “the
[toll] would continue indefinitely. This is because those who have loaned money for the repair of
the road are not keen to be repaid as long as they enjoy 5 percent interest, an unusually high
figure for this area…”11
Albert (1972) is one of the few studies on the financial performance of turnpikes before the
arrival of railways. Albert lists interest rates for a sample of 100 trusts between 1730 and 1830
(pp. 247-261). Figure 2 plots the average interest rate in the sample along with a 90 percent
11
Quoted in Berg and Berg (2001) p. 240.

9
confidence interval for the average. It also reports the yield on 3 percent consols.12
The interest
rate on turnpike bonds was typically higher than consols. From 1730 to 1830, the average
interest rate for turnpike bonds was 4.66 percent and the average yield on consols was 3.9
percent.
The Charity records provide additional information on rates of return for 114 turnpike
bonds between 1752 and 1844 (see Clark 1998 for details on charities). The average rate of
return in this sample was 4.74 percent. While the face value of the bonds is not stated, it is likely
that many were valued at £25, 50, 100, or units divisible by 25. In the Charity sample, 68 percent
of the turnpike bonds were purchased at prices exactly divisible by £25. The average ratio
between the price and nearest number exactly divisible by 25 is 1.009, and is statistically
indistinguishable from 1.
The picture which emerges is that turnpike trusts paid high interest rates. However, there
are two problems in drawing this conclusion. First, it is not clear if the interest rates reported in
Albert and the Charity records are contracted rates, or the effective rates paid to investors. The
two may differ if trusts missed interest payments. Second, the two samples may not be
representative of all trusts. If they are biased to trusts paying interest, then the effective rate of
interest across the population of trusts might be less. This point has been made by Webster
(2015, p. 75) who found that 50 percent of all turnpike trusts in 1834 were not meeting their full
interest payments. In the same study, Webster examined the returns at the end of the turnpike
system between 1850 and 1883. In this period, railways took a significant portion of the traffic
from turnpike trusts, making many financially unviable. Parliament dictated that trusts wind
12
Yields are taken from Global Financial Data which draws on Neal (1990).

10
down their affairs and come to agreements with their creditors. Webster estimates that investors
received 39 percent of what they were entitled in the end.
While turnpike bonds ultimately lost value, it is not clear that they were a poor financial
investment from the point of view of investors in the early nineteenth century. To clarify matters,
we need to measure the financial returns to all turnpike trusts, and compare them with a yardstick
security like the 3 percent consol. The following section discusses the data sources for this task.
II.
Parliament began making serious inquiries into the finances of turnpike trusts in the early
nineteenth century. They were driven by the aim of improving roads and to investigate whether
trusts were being mismanaged.13
The first parliamentary committee in 1821 required the officers
of each turnpike trust to provide a financial summary and information on operations.14
In total
1020 trusts from England and Wales submitted returns on annual revenues and expenses
averaged over the years 1818, 1819, and 1820. They also reported the balances held by the
treasurer, interest due, and the amount of debt in 1820. The 1821 Report also includes ‘notes’ for
each trust sometimes describing how long interest was in arrears, the size of legal expenses, and
road improvements. 15
More detailed financial reports were made in 1829 and annually from 1834.16
In the post-
1821 reports, separate tabulations are made for interest payments, principal payments, purchases
of land, and improvements. Also from 1829 revenues minus operating costs can be calculated for
all trusts. Operating costs are defined as total expenses minus interest payments, debt repaid, and
13
See Albert (1972) for a discussion of Parliament’s investigations of turnpike trusts in the early 1800s. 14
‘Select Committee to consider the Acts now in Force Regarding Turnpike Roads and Highways,’ published its
report in the British Parliamentary Papers in 1821 15
A summary of the 1821 report is in Marshall’s (1835) Analysis and Compendium of all the Returns Made to
Parliament. The full report is available in BPP (1821 IV). 16
A summary of the reports up to 1838 is given in BPP (1840 XXVII).

11
investment expenditures. For the 1818-20 data some assumptions are needed to calculate
operating costs. The main issue is that interest payments are not reported separately. Fortunately,
data on the value of debt, interest due, and the reported notes can be combined to estimate
interest payments. The details for the calculation are given in section V.
All the financial reports have one major limitation: no figures are given for the value of
road capital either before the trust was formed or after due to its investments. There are some
estimates in the literature derived from Ginarlis and Pollard’s (1985) series on annual investment
in turnpike roads from 1750 to 1810. For example, Harris (2000) uses these figures to estimate
the values all turnpike capital in 1810 at £15.9 million in 1810. However, the Ginarlis and
Pollard’s series includes maintenance expenditures, and thus over-states capital spending. One
indication is that estimated turnpike capital exceeds reported figures on total capital raised for
canals.17
Webster (2016, p. 64) improves on Ginarlis and Pollard and estimates that turnpike
capital increased by £2.8 million between 1817 and 1826. But Webster does not give an estimate
of total turnpike capital c.1820 or after, which is necessary to estimate the rate of return. Below I
provide a new estimate for turnpike road capital in 1820, 1829, and several years after.
III.
Panel A of Table 1 shows the payments to turnpike bondholders at various dates in the
1820s, 30s, and 40s. They are based on summary figures for total interest payments and total
debt among all turnpike trusts in England and Wales. The interest paid varies from 3.44 percent
to 4.09. Averaging across all seven years gives an average interest paid of 3.92 percent.
Arguably the stock of unpaid interest (or interest due) should be included in debt because missed
interest was rarely written off trusts’ books. In panel B interest due is added to the debt. The
17
Ward (1974, p. 73) estimates £12.4 million in capital was raised for canal projects between 1755 and 1815.
English’s (1827) list of joint stock canals in 1825 reports capital totaling £12.2 million. An anonymous writer in the
Quarterly Review in 1825 also lists joint stock canals and puts the capital figure at £13.2 million.

12
average interest paid across the seven years is now 3.37 percent. For comparison, the average
yield on consols between 1818 and 1850 was 3.44 percent, and is similar to the 3.37 return.
The year 1829 is the only one where interest paid on turnpike bonds was quite low. This is
notable because large investments were made in the 1820s, following the innovations of
Macadam and Telford. In the short-run investing brought some losses to turnpike bondholders.
Over the medium-term it seems to have paid as returns increased in the 1830s and remained high
in the early 1840s.
The return on turnpike bonds started to fall again in 1848. At this point, railways began to
seriously scoop the traffic of turnpike trusts. Over the next few decades, interest payments would
continue to fall. Does this imply that turnpike bonds originated in the 1820s were a bad
investment? A plausible estimate of the internal rate of return suggests the answer no. Suppose
that an investor lent £100 to a turnpike trust in 1820 and received the average return of 3.92
percent until the year 1860 when a renegotiation with the trust forced them to accept a repayment
of £39. The internal rate of return for such an asset is 3.3 percent, essentially equal to the yield
on consols.18
The overall conclusion is that the investor who purchased a diversified portfolio of
turnpike bonds at face value would have received a similar return as investing in government
bonds.
IV.
The rate of return on turnpike capital provides an alternative measure of the financial
returns. As stated earlier, it is first necessary to estimate the value of turnpike capital in 1820 and
then at other dates in the 1820s, 1830s and 1840s. Turnpike capital in 1820 is equal to average
18 The internal rate of return r solves the following equation: 100 = ∑
3.92
(1+𝑟)𝑡 +39
𝑡=0
39
(1+𝑟)40. The 39 pound repayment
in 40 years is based on Webster’s estimate that turnpike bondholders were repaid 39 percent of their value when
trusts wound down their operations between 1850 and 1883.
13
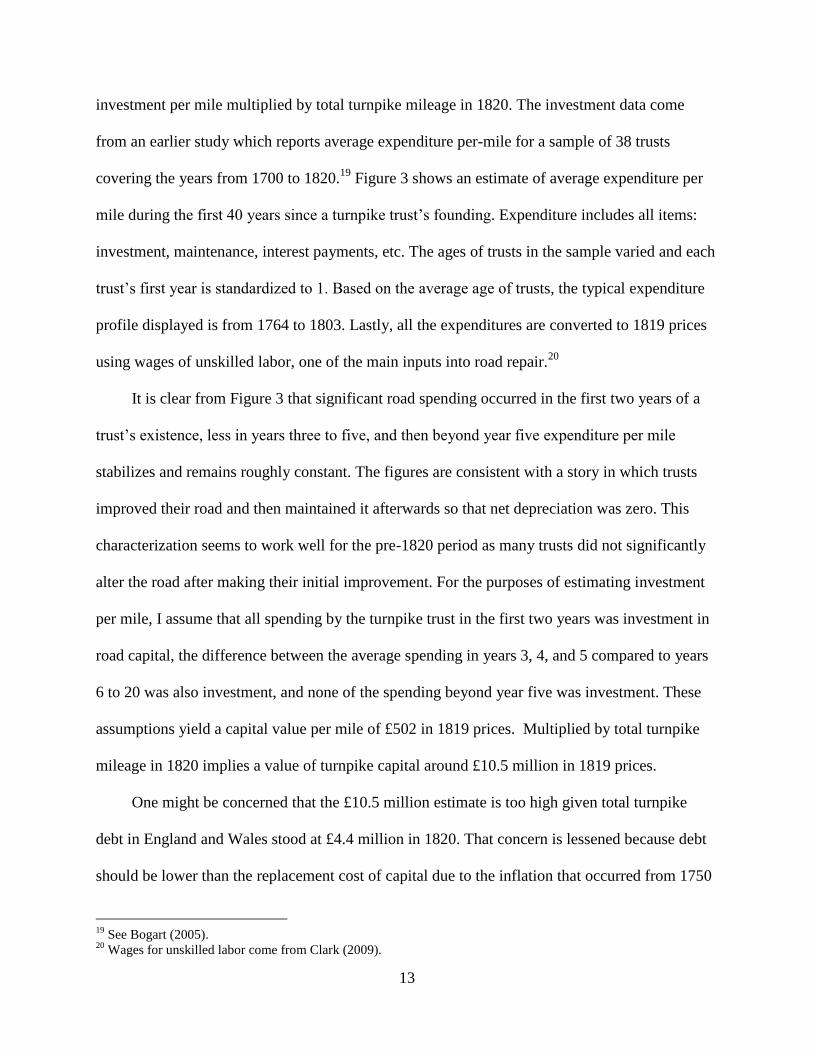
investment per mile multiplied by total turnpike mileage in 1820. The investment data come
from an earlier study which reports average expenditure per-mile for a sample of 38 trusts
covering the years from 1700 to 1820.19
Figure 3 shows an estimate of average expenditure per
mile during the first 40 years since a turnpike trust’s founding. Expenditure includes all items:
investment, maintenance, interest payments, etc. The ages of trusts in the sample varied and each
trust’s first year is standardized to 1. Based on the average age of trusts, the typical expenditure
profile displayed is from 1764 to 1803. Lastly, all the expenditures are converted to 1819 prices
using wages of unskilled labor, one of the main inputs into road repair.20
It is clear from Figure 3 that significant road spending occurred in the first two years of a
trust’s existence, less in years three to five, and then beyond year five expenditure per mile
stabilizes and remains roughly constant. The figures are consistent with a story in which trusts
improved their road and then maintained it afterwards so that net depreciation was zero. This
characterization seems to work well for the pre-1820 period as many trusts did not significantly
alter the road after making their initial improvement. For the purposes of estimating investment
per mile, I assume that all spending by the turnpike trust in the first two years was investment in
road capital, the difference between the average spending in years 3, 4, and 5 compared to years
6 to 20 was also investment, and none of the spending beyond year five was investment. These
assumptions yield a capital value per mile of £502 in 1819 prices. Multiplied by total turnpike
mileage in 1820 implies a value of turnpike capital around £10.5 million in 1819 prices.
One might be concerned that the £10.5 million estimate is too high given total turnpike
debt in England and Wales stood at £4.4 million in 1820. That concern is lessened because debt
should be lower than the replacement cost of capital due to the inflation that occurred from 1750
19
See Bogart (2005). 20
Wages for unskilled labor come from Clark (2009).
14
to 1815. For argument’s sake suppose that all turnpike borrowing went to finance investment.
Also assume that all debt in 1820 was incurred in the 1750s and 1760s when the vast majority of
trusts were formed. In this plausible situation, £4.4 million in debt would amount to a capital of
£8.8 million in 1819 at replacement cost because unskilled wages in 1820 were around twice
their level in 1750 (see Clark 2009). Notice that £8.8 million is similar to my 1820 capital
estimate of £10.5 million. It also makes sense if one incorporates some retirement of debt
between 1750 and 1820, and some investment financed through toll income.
Two more steps are needed to estimate the capital stock in 1829, 1834, 1838, 1842, and
1845. First in each subsequent year I adjust the value of the previous year’s capital stock to
reflect the current replacement cost of the capital. The capital cost inflator is based on building
laborers’ wages, which rose at an average annual rate of 0.3% between 1820 and 1845. Second,
an estimate of investment is added. From 1829 onwards I use the figure for “improvements” and
“land purchased” in the parliamentary reports, which clearly reflect investments. From 1820 to
1829, where such data are lacking, I assume investment is equal to the increase in debt from
1820 to 1829, which is £2.1 million. Finally note that no depreciation in capital is assumed,
which is justified because turnpike trusts spent regular sums on maintenance.
The capital stock estimates are reported in table 2 along with the inputs into the calculation
like the replacement cost inflator and investment. To arrive at the estimate of turnpike capital,
the previous period’s capital stock value is multiplied by the replacement cost inflator and then
investment is added. It is clear there was significant investment in the road network in the 1820s
and 1830s. The value of turnpike capital grows from £10.5 million in 1820 to £16.5 million by
1845. Thus, I find sizeable increases in turnpike capital in the 1820s and 30s, again in the wake

15
of Macadam and Telford’s innovations. Note also the similarity with Webster’s estimate of a
£2.7 million investment in the period from 1817-26, which further supports the estimates.
The next step is to construct an estimate of turnpike revenues minus operating costs, or so-
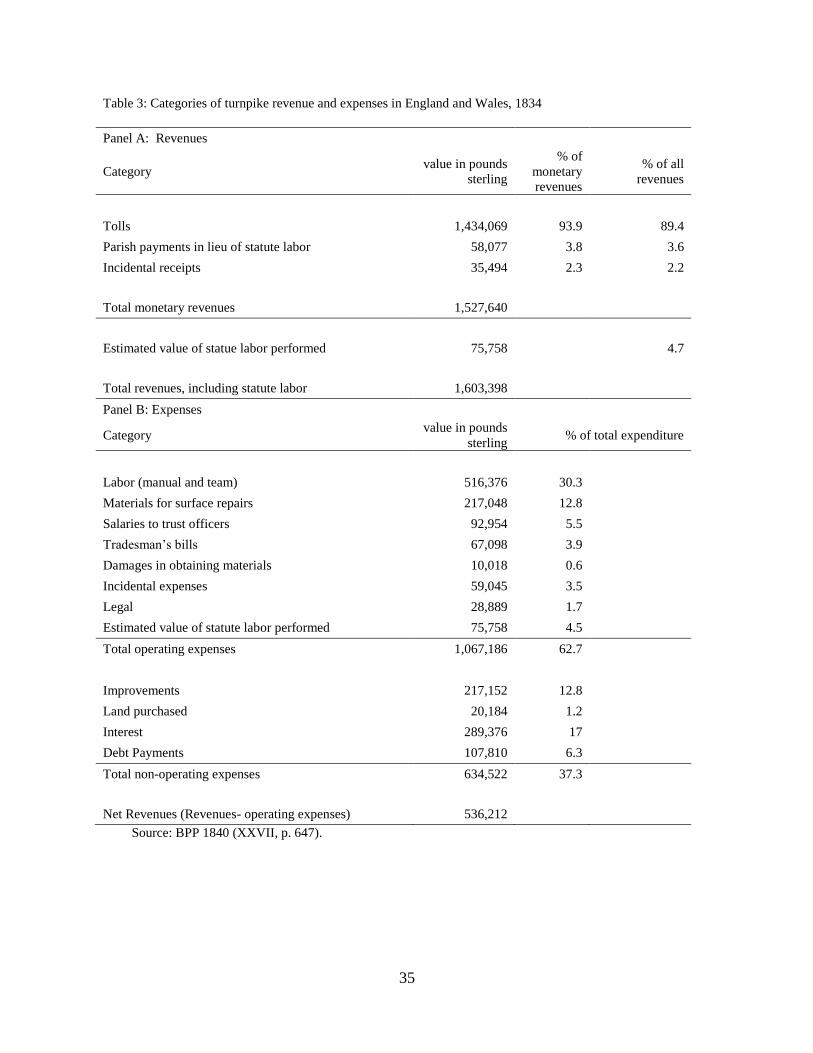
called net revenues. As an illustration, the revenues in 1834 are shown in panel A of table 3.
Tolls are the main source of monetary revenues. Parish payments for statute labor are a distant
second. An estimate was also made for the value of statute labor performed, which represented
around 5 percent of monetary revenues. I use the figure for all revenues, including the value of
statute labor, in the net revenue calculation. Operating expenses are listed in panel B and
generally cover labor, materials, and administration. They represent 62 percent of total
expenditures. Non-operating expenses include investments, debts paid, and interest paid. The
final figure at the bottom of table 3 is the net revenue. Similar calculations are made for other
years. The only difference is that in 1820 investment and debt payments are assumed to be equal
to interest paid in 1820, which is similar to the situation in 1829 and 1834.
Combining all this data yields new estimates of the rate of return on turnpike capital shown
in table 4. The rate of return is estimated by the percentage of net revenues in total capital. It
ranges between 1.61 and 3.83 percent, with an average of 3.06 percent. One immediate
implication is that the rate of return on capital is similar to the estimate for the return to
bondholders if unpaid interest is added to the trusts’ debt. Thus there is little evidence for some
form of quasi-profit. If there were profits, then the rate of return should have been higher than
the return to bondholders.
The general conclusion thus far is that financial returns in the turnpike sector were
broadly competitive. Turnpike bondholders received a return that was similar to holders of long-
term government debt. The returns to turnpike capital are lower but still respectable. The

16
perception in the literature that turnpike trusts did not pay good returns to investors is not borne
out in the aggregate. But there is a different side to the story when considering the returns to
individual turnpike trusts. Payments on individual turnpike bonds were variable, and even zero
for some trusts. The following section examines the distribution of bondholder returns across
turnpike trusts in 1820 and 1838.
V.
Estimating the returns to individual turnpike bondholders in 1820 requires some
assumptions due to incomplete information. As noted above, the 1821 Report gives the value of
debt and interest due averaged over the years 1818 to 1820. I combine these two in estimating
interest payments. If there is no interest due from the trust, then the return on turnpike bonds is
assumed to be 4.75 percent. In Albert’s sample described above, the average contracted interest
rate between 1816 and 1825 is very close to 4.75 percent. If there is interest due, then it is likely
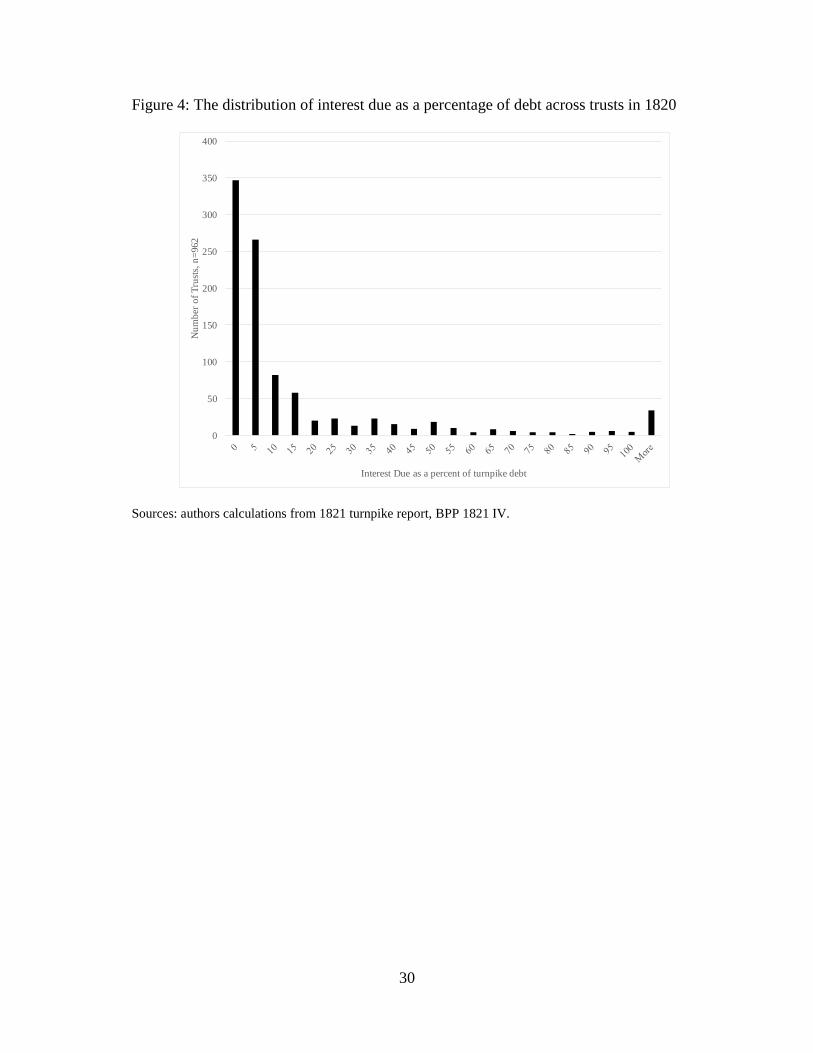
that interest payments in 1820 were less than 4.75. Figure 4 shows the distribution of interest due
as a percentage of debt across 962 trusts with information reported. 615 of the 962 trusts had
some interest in arrears. Most had interest due equal to less than 10 percent of the value of their
debt, but a few had an interest due equal to more than 50 percent of their debt. The notes column
of the 1821 Report specifies that interest payments were not made in the three previous years for
119 of 615 trusts with interest due. Here I assume the interest payment in 1820 was zero. For the
remaining 496 trusts with interest due, I estimate the interest missing using two scenarios. First,
the total interest due was accumulated evenly in every year since 1809. Second, the total interest
due was accumulated evenly in every year since 1799. Essentially in scenario 1 missed interest is
the total interest due divided by 11 since interest could have been missed in any of the eleven

17
years from 1809 to 1820. Finally, I subtract the estimate of missed interest as a percentage of
debt from 4.75 percent to get the estimated return for the remaining 496 trusts.
A summary is reported in table 5. Under scenario 1 the un-weighted average return is
3.48 percent and under scenario 2 the un-weighted average return is 3.70 percent. The averages
are similar if returns are weighted by mileage (see the second scenario 2 in table 5). Also of
interest is the standard deviation and coefficient of variation. The latter is between 0.46 and 0.53,
and in the moderate range.
Figure 5 shows the full distribution of bondholder returns in 1820. Most trusts were at the
two extremes: 0 and more than 4.5 percent. Under scenario 2, 60 percent of trusts (579 out of
962) have interest payments of more than 4.5 percent, while 15 percent of trusts (144 of 962)
have no interest payments. In terms of total turnpike debt, the 15 percent of trusts making no
interest payments accounted for 14 percent of the debt, and the 60 percent of trusts paying more
than 4.5 percent accounted for 64 percent of the debt. The implication is that more than half of
turnpike bondholders earned a premium over government bonds in 1820, but a minority (around
15 percent) earned no return.
A natural follow up question is whether the trusts paying no interest in 1820 were facing
foreclosures by investors. The evidence suggests they were not. In the 1821 Report, there are
only two mentioned cases of foreclosure: (1) the Aldermaston and Basingstoke Second District
trust in Hampshire and (2) the Stockport and Marple trust in Cheshire.21
The rarity of
foreclosures indicates that bondholders bore downside risks. If the trust could not pay, there was
little investors could do but wait until the trust’s finances improved.
21
The evidence comes from the ‘observations’ column in the 1821 report. Although it is possible that some
foreclosures were not noted in the observations, it is unlikely that it was prevalent. Explaining the absence of
foreclosure is beyond the scope of this essay, but it is worth pointing out that it could be rationalized by the high
legal costs, or investors may have believed that by not foreclosing they would ultimately collect more interest
payments in the long-term. See Albert (1972, p. 97) for a brief discussion of foreclosure costs.
18
How were returns different at the beginning of the railway era? Fortunately, it is
straightforward to answer this question because the parliamentary reports give the interest
payments and debt for each trust from 1834 onwards. I focus on 1838 as there is a broader range
of information on trusts in that year. The unweighted mean return was 4.26 percent with a
standard deviation of 2.80, implying a 0.65 coefficient of variation. The full distribution of
returns across trusts in 1838 is shown in figure 5. The data again reveal a range. 12 percent of the
1071 trusts were making zero interest payments in 1838, while 55 percent of trusts were paying
more than 4.5 percent.22
Also in the latter group 28 percent of trusts were paying more than 5
percent, which exceeds the usury cap. It is likely these trusts were repaying interest that was
missed in some previous years.
Figure 6 also shows the contracted rate of interest stated in the 1840 report. Nearly 75
percent of trusts had a contracted rate of 5 percent, and 24 percent had a contract rate of 4 or 4.5
percent. But only 41 percent of trusts paid 5 percent or more in 1838, and 69 percent paid 4
percent or more. Thus while many trust paid less than the contracted rate, enough of them did to
give turnpike bondholders a competitive return ex post.
The 1838 data suggest there was a recovery in financial performance for many trusts
during the 1830s compared to the 1820s. Part of this recovery was felt by trusts who were
previously ‘financial losers.’ To illustrate, I matched trusts in the 1821 and 1840 Reports based
on trust name and county. For the moment, I focus on the 144 trusts in 1820 not making any
interest payments. I was able to match 133, but five of these did not have information on interest
payments.23
Thus I am able to analyze interest payments for 128 trusts in the sub-group that were
not making interest payments in 1820. There were 34 trusts or 26.5 percent of the sub-group still
22
The 12 percent of trusts paying zero interest represented 9.5 percent of total debt and the 55 percent of trusts
paying more than 4.5 percent represent 53 percent of total debt. 23
See BPP 1840 (XXVII) for the 1840 Report.

19
paying zero interest in 1838. But 76 trusts or just under 60 percent of the sub-group were paying
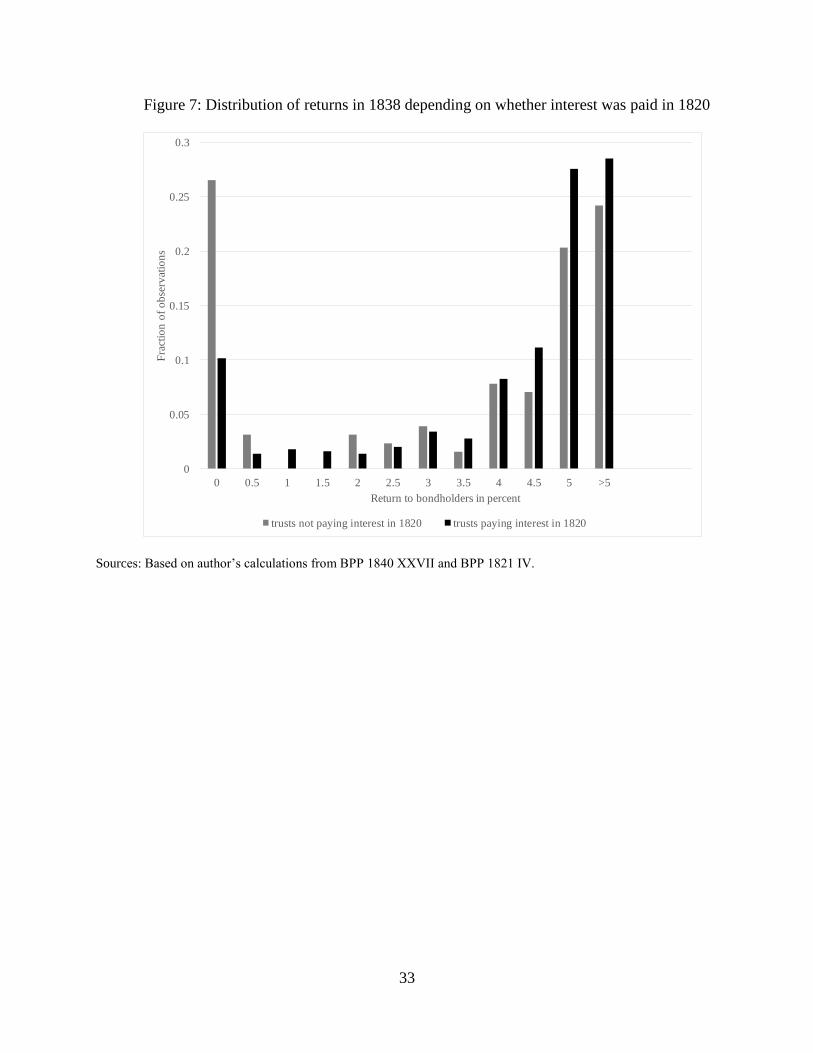
4 percent or more. Figure 7 shows the distribution of interest payments as a percentage of debt
in 1838. The financially distressed trusts of 1820 are still more distressed compared to others in
1838, but a large number of trusts recovered financially by 1838. Thus, the losses incurred by
some bondholders in 1820 were not permanent.
VI.
Thus far the focus has been on the ex post return to investing in turnpikes. It is still an
open question whether investors understood the risks they faced ex ante. Presumably in the
1820s and 1830s investors had information about the financial performance of turnpike trusts,
especially considering that the 1821 Report made them public. It is possible that investors
demanded a higher contracted interest rate if the trust was newly established or if its financial
performance in 1820 was worse. In order to test these theories, I analyze the relationship
between the contracted rate in the 1840 report and the year a trust was founded. I also analyze
the effect of trusts’ returns and debt per mile in 1820. Trusts in the 1840 Report are matched to
trusts in 1821 Report based on trust name and county. Of the 960 trusts with debt reported in
1821, 778 were successful matched in the 1840 Report.24
The mean return was 3.66 percent and
the mean debt per mile in £100 was 3.32. 25
As shown earlier most trusts had a contracted rate of
5 percent and a minority had either 4 or 4.5. The binary nature of contracted rates (5 percent or
less) suggests that a binary choice model is appropriate. Therefore, I create a variable equal to
24
Special thanks go to Alan Rosevear for matching trust across parliamentary reports. 25
The mean contracted interest rate for trusts whose first act was before 1820 and were not matched to the 1821
report is nearly identical to the mean for the contracted rate of all trusts, suggesting the attrition in matching does not
lead to a biased sample.

20
one if the contracted rate is 5 percent and 0 otherwise, and estimate a logit model identifying the
effects of certain variables on the probability of a 5 percent rate.26
Table 6 reports the estimates. In column (1) the results show that younger trusts paid a
higher contracted rate. The marginal effects imply that adding a decade to the trust’s founding
act—one third of a standard variation—increased the probability by 0.027. Thus there is some
evidence that investors regarded newer trusts as riskier than older trusts. In column (2) an
indicator for trusts paying zero interest in 1820 and the rate of return in 1820 are included.
Neither variables are significantly related to the contracted rate. The suggestion is that investors
did not regard poor performance in 1820 as indicative of greater risk over the next two decades.
Column (3) adds debt per mile. The results show that greater debt was associated with the higher
contracted rate. The marginal effects imply that increasing the debt per mile by £100—one fifth
of a standard deviation—increased the probability by 0.03. Thus there is evidence that greater
trust indebtedness raised perceived risks. Finally, in column (4) dummy variables for each trust’s
county are included to control for unobserved heterogeneity at the county-level. The previous
results are unchanged, suggesting the conclusions are fairly robust.
VII.
The final section of this paper compares the return on turnpike bonds with a broader range
of securities available to the early 19th
century investor, including land, canals, railways, and
banks. In order to make comparisons I calculate the Sharpe ratio for a portfolio of each type of
investment. The Sharpe ratio is the average return in the portfolio 𝑟𝑝𝑜𝑟𝑡𝑓𝑜𝑙𝑖𝑜 minus the risk free
return 𝑟𝑟𝑖𝑠𝑘 𝑓𝑟𝑒𝑒 divided by the standard deviation of the portfolio 𝜎2, or 𝑟𝑝𝑜𝑟𝑡𝑓𝑜𝑙𝑖𝑜−𝑟𝑟𝑖𝑠𝑘 𝑓𝑟𝑒𝑒
𝜎2. A
26
An alternative is to study a multinomial logit model where the base outcome is 4 percent, and the alternative
outcomes are 4.5 and 5 percent. The results are similar.

21
higher Sharpe ratio generally implies a superior portfolio because it offers more return per unit of
risk (see Sharpe 1994 for more details).
The portfolio of turnpike bonds includes the population of trusts in 1820 and 1838 analyzed
in the previous section. The portfolio for farmland is based on rates of return on properties held
by charities reported by Clark (1998). The Charity records contain the returns for 82 properties
between 1818 and 1845. Note they exclude housing which is a separate category. The mean
return in the farmland portfolio is 3.61 percent and the standard deviation is 1.36 percent.
The railway portfolio is drawn from Arnold and McCartney (2005), who use accounting
statements to measure rates of return on capital employed (ROCE) for the top 5 railway
companies from 1838 and the top 10 companies from 1854. The ROCE uses the historical cost of
capital rather than the replacement value of capital. The distinction is not as significant for
railways because they were built in a low inflation environment. Arnold and McCartney’s (2005)
estimates show a highly variable ROCE for the top 5 British railways. Their estimates will be
discussed momentarily.
Canals are difficult to analyze because there are no sources describing the entire
population. The most detailed analysis is by Arnold and McCartney (2011), who estimate
financial performance for five canal companies from 1770 to 1850. They find an average rate of
return on capital (net earnings divided by debt plus equity) of 10.2 percent and average dividend
rate of 23.9 percent in the early 1820s (p. 228). Based on these figures it would appear that canal
investors did very well. However, there is a potential problem in extrapolating from Arnold and
McCartney’s sample to the canal sector as a whole because it is possible that their 5 canal
companies had better financial performance than the average company.

22
Ward’s list of canal dividends in 1825 provides another estimate (1974, pp. 177-178) and
reports the dividend rate for nearly all canals. The unweighted average dividend rate in Ward’s
sample is 9.7 percent and the standard deviation is 15.73. It is clear that on average canal
investors received a much larger return than turnpike investors in 1825. This conclusion is not
surprisingly because as Arnold and McCartney point out, some canals were viewed as veritable
gold mines before railways. However, the return on canals shares were more variable, which
diminished their utility to investors.
Finally, I consider a portfolio of securities on the British stock market. Acheson et. al.
(2009) report the average and standard deviation for a portfolio of 681 securities between 1825
and 1870. Railways feature prominently in the index, following by banks, mines, and insurance
companies. Railways were the most capital intensive, and so Acheson et. al. report portfolio
returns including and excluding railways. The unweighted average return including railways is
10.16 percent with a standard deviation of 9.7. The portfolio excluding railways is lower but
broadly similar.
Table 7 summaries the returns for each portfolio, and reports the Sharpe ratio in the last
column. In all cases, the risk free asset is the consol with a return of 3.44 percent. The two
turnpike portfolios in 1820 and 1838 had higher Sharpe ratios than the farmland portfolio. Thus
landowners who diversified into turnpikes earned a higher return per unit of risk. But turnpikes
yielded less returns per unit of risk than canals. Thus it was arguably worth it to take the risk of
investing in canals over turnpikes.
The Sharpe ratio for the top five railways is reported in four years. The Sharpe ratio was
lower than turnpikes in 1838 but higher in the other three by a significant amount. The
conclusion is similar for a portfolio consisting of the next ten railways. Thus after their initial

23
developmental phase in the 1830s the top 15 railways offered an entirely new level of returns
compared to turnpikes and even canals.
Finally, the stock market portfolio had a higher Sharpe ratio than turnpikes, irrespective of
whether railways are included. The mid-nineteenth century was a prosperous time for investors
in a whole range of securities including banks, mines, insurance companies, and others.
Overall it appears that turnpike bonds were a transition asset for investors. They offered a
better return than land which was the dominant investment in Britain before the industrial age.
But turnpike bonds were eventually superseded by the new investments of the mid-nineteenth
century, like railways, banks, and insurance companies.
VIII.
Much of the infrastructure in England and Wales was financed by local individuals during
early industrialization. Parliament gave turnpike trusts and other statutory authorities’ rights to
improve or construct roads, rivers, canals, bridges, and dock works. Along with these rights
came the opportunity to profit from public works. But there was also a potential to suffer
financial losses, as has been the case in many modern infrastructure settings. This paper
estimates financial returns in the turnpike sector. The return to turnpike bondholders was 3 to 4
percent depending on the year and whether unpaid interest was included. At the trust-level
returns to bondholders varied. Around 15 percent of trusts were not making any interest
payments by 1820. However, many investors being paid zero interest in 1820 were receiving
interest of 4 percent or more by 1838. Overall it is clear that investors in early public works, like
turnpikes, could earn a reasonable financial return. Many also earned an economic return through
higher property values. Turnpike bonds, like canal shares, contributed to the growing wealth of
England’s elite in the early nineteenth century.

24
Official Sources
Report from the Select Committee appointed to consider the acts now in force regarding turnpike
roads and highways in England and Wales, British Parliamentary Papers 1821 IV, p. 343.
Appendix to the report of the commissioners for inquiring into the state of the roads in England
and Wales, British Parliamentary Papers 1840 XXVII, p. 15.
Turnpike trusts. An abstract of the general statements of the income and expenditure of the
several turnpike trusts in England and Wales, from 1st January 1842 to 31st December 1842,
inclusive, British Parliamentary Papers 1844 XLII, p. 343.
Turnpike trusts. An abstract of the general statements of the income and expenditure of the
several turnpike trusts in England and Wales, from 1st January 1846 to 31st December 1846,
inclusive. British Parliamentary Papers 1847-48 LI, p. 359.
Turnpike trusts. An abstract of the general statements of the income and expenditure of the
several turnpike trusts in England and Wales, from 1st January 1848 to 31st December 1848,
inclusive. British Parliamentary Papers 1851 XLVIII, p. 398.
References
Albert, William, The Turnpike Road System in England, 1663-1840 (Cambridge, U.K., 1972).
Anon., “The present state of England . . . by Joseph Lowe,” Quarterly Review 32 (1825): 160–
97.
Arnold, A.J. and McCartney S, “Veritable gold mines before the arrival of railway competition’:
but did dividends signal rates of return in the English canal industry,” Economic History Review
64 (2011): 214–236.
Arnold, A.J. and McCartney S, “Rates of Return, concentration levels and strategic change:
British railways from 1830 to 1912,” Journal of Transport History 26 (2005): 41–60.
Berg, Peter and Torsten Berg, R.R. Angerstein’s Illustrated Travel Diary, 1753-1755: Industry in
England and Wales from a Swedish Perspective. (London, U.K., 2001).
Bogart, Dan, “Did Turnpike Trusts Increase Transportation Investment in Eighteenth-Century
England?” Journal of Economic History 65 (2005): 439-468.
Bogart, Dan. (2009). “Turnpike Trusts and Property Income: New Evidence on the effects of
Transport Improvements and Legislation in Eighteenth Century England,” The Economic History
Review 62, pp. 128-152.
Bogart, D. and John Majewski, “Two Roads to the Transportation Revolution: Early
Corporations in the U.K. and the United State,” in Costa, Dora and Naomi Lamoreaux (eds.)

25
Understanding Long-Run Economic Growth: Geography, Institutions, and the Knowledge
Economy (Chicago, 2011).
Broadberry, Stephen, Bruce M. S. Campbell, Alexander Klein, Mark Overton, Bas van Leeuwen.
British economic growth, 1270–1870. Cambridge University Press, 2015.
Buchanan, B. J., “The Evolution of the English Turnpike Trusts: Lessons from a Case Study,”
Economic History Review 39 (1986): 223–243.
Carlos, Ann and Frank D. Lewis, The Creative Financing of an Unprofitable Enterprise: The
Grand Trunk Railway of Canada, 1853-1881, Explorations in Economic History, 32 (1995): 273-
301.
Cassis, Youssef, Giuseppe De Luca, and Massimo Florio, eds. Infrastructure finance in Europe:
insights into the history of water, transport, and telecommunications. Oxford University Press,
2016.
Casson, Mark, The World's First Railway System: Enterprise, Competition, and Regulation on
the Railway Network in Victorian Britain (Oxford, 2009).
Clark, Greg, “The Charity Commissioners as a Source in English Economic History,” Research
in Economic History, 18 (1998): 1-52.
Clark, Gregory, "The Macroeconomic Aggregates for England, 1209-2008," Working Paper 919,
University of California, Davis, Department of Economics (2009).
English, H., A complete view of the joint stock companies formed during the years 1824 and
1825 (1827).
Estache, Antonio, and Maria Elena Pinglo. "Are returns to private infrastructure in developing
countriesconsistent with risks since the Asian crisis?." World Bank Policy Research Working
Paper 3373 (2004).
Feinstein, C., “Transport and Communications,” in Feinstein, Charles and Pollard, Sidney (eds.),
Studies in Capital Formation in the United Kingdom (Oxford, 1988).
Ginarlis, John and Pollard, Sidney, "Roads and Waterways: 1750-1850," in Feinstein, Charles
and Pollard, Sidney (eds.), Studies in Capital Formation in the United Kingdom (Oxford, 1988).
Goldsmith, Hugh and Dan Carter, “The Finance of Local Public Goods at the Onset of
Industrialization: Water in London 1582 to 1904,” in Cassis, Youssef, Giuseppe De Luca, and
Massimo Florio (eds.) Infrastructure finance in Europe: insights into the history of water,
transport, and telecommunications (Oxford, 2016).
Guldi, Joanna. Roads to power: Britain invents the infrastructure state. Cambridge, MA: Harvard
University Press, 2012.

26
Harris, Ron, Industrializing English Law: Entrepreneurship and Business Organization, 1720–
1844 (Cambridge, 2000).
Klein, Daniel B., "The Voluntary Provision of Public Goods? The Turnpike Companies of Early
America," Economic Inquiry 28 (1990): 788-812.
Klein, Daniel B, and John Majewski, "Economy, Community, and Law: The Turnpike
Movement in New York, 1797-1845," Law & Society Review 26 (1992): 469-512.
Majewski, John. A house dividing: Economic development in Pennsylvania and Virginia before
the Civil War. Cambridge University Press, 2000.
Marshall, J., Analysis and Compendium of all the Returns Made to Parliament (London, 1835).
Mitchell, Brian, David Chambers, and Nick Crafts, “How Good was the Profitability of British
Railways, 1870-1912? “ Economic History Review 64 (2011): 798-831.
Pawson, Eric, Transport and Economy: The Turnpike Roads of Eighteenth Century Britain (New
York, 1977).
Rothballer, Christoph, and Christoph Kaserer. "The risk profile of infrastructure investments:
Challenging conventional wisdom." Journal of Structured Finance 18.2 (2012): 95.
Sharpe, William F. "The sharpe ratio." The journal of portfolio management 21.1 (1994): 49-58.
Sirtaine, Sophie, et al. "How profitable are private infrastructure concessions in Latin America?:
Empirical evidence and regulatory implications." The Quarterly Review of Economics and
Finance 45.2 (2005): 380-402.
Trew, A.W., “Infrastructure Finance and Industrial Take-Off in England', Journal of Money,
Credit and Banking,” 42 (2010): 985-1010.
Ward, J. R., The finance of canal building in eighteenth-century England (Oxford, 1974).
Webster, Ian. The Public Works Loan Board 1817-76 and the financing of public infrastructure.
Doctoral, Sheffield Hallam University (2015).
White, Richard, Railroaded: The Transcontinentals and the Making of Modern America (New
York, 2011).

27
Figure 1: A map of the English and Welsh turnpike network in 1830
Sources: Map produced by the transport, urbanization, and economic development in Britain, 1670-1911
project. See http://www.campop.geog.cam.ac.uk/research/projects/transport/

28
Figure 2: Average interest rate in Albert’s sample and the yield on 3% Consols.
Sources: Albert (1972), p. 247-261.
0
1
2
3
4
5
6
7
17
30
17
33
17
36
17
39
17
42
17
45
17
48
17
51
17
54
17
57
17
60
17
63
17
66
17
69
17
72
17
75
17
78
17
81
17
84
17
87
17
90
17
93
17
96
17
99
18
02
18
05
18
08
18
11
18
14
18
17
18
20
18
23
18
26
18
29
Inte
rest
Rat
e o
r Yi
eld
Turnpike Bonds average lower bound turnpike upper bound turnpike 3% Consols

29
Figure 3: Road Expenditure per mile for a sample of turnpike trusts
Sources: The data on road expenditure come from Bogart (2005).
0
50
100
150
200
250
300
350
Ro
ad E
xoen
diu
tre
per
mie
in
18
19
co
nst
ant
pri
ces
Years since trust is founded
Lower Bound 90% C.I. Mean Road Expenditure per-mile Upper Bound 90% C.I.
30
Figure 4: The distribution of interest due as a percentage of debt across trusts in 1820
Sources: authors calculations from 1821 turnpike report, BPP 1821 IV.
0
50
100
150
200
250
300
350
400
Nu
mb
er o
f T
rust
s, n
=962
Interest Due as a percent of turnpike debt

31
Figure 5: Distribution of returns to bondholders in 1820
Sources: Author’s calculations based 1821 report BPP 1821 IV.
0
0.1
0.2
0.3
0.4
0.5
0.6
0.7
0 0.5 1 1.5 2 2.5 3 3.5 4 4.5 4.75
Fra
cnti
on
of
Ob
serv
atio
ns,
, n
=965
Interest payment to turnpike bondholders 1820
scenario 1: arrears since 1809 scenario 2: arrears since 1799

32
Figure 6: Distribution of returns to bondholders and contracted rates in 1838
Sources: see text.
0
0.1
0.2
0.3
0.4
0.5
0.6
0.7
0.8
0 0.5 1 1.5 2 2.5 3 3.5 4 4.5 5 More
Fra
ctin
of
ob
serv
atio
ns
Rate of interest
rate of interest paid 1838 contracted rate of interest
33
Figure 7: Distribution of returns in 1838 depending on whether interest was paid in 1820
Sources: Based on author’s calculations from BPP 1840 XXVII and BPP 1821 IV.
0
0.05
0.1
0.15
0.2
0.25
0.3
0 0.5 1 1.5 2 2.5 3 3.5 4 4.5 5 >5
Fra
ctio
n o
f o
bse
rvat
ion
s
Return to bondholders in percent
trusts not paying interest in 1820 trusts paying interest in 1820

34
Table 1: Payments to Turnpike Bondholders in British pounds
Panel A: Excluding interest
due
1820 1829 1834 1838 1842 1845 1848
Total Mortgage and Floating
Debt 4,402,466 6,882,356 7,342,210 7,463,027 7,238,705 6,964,960 6,685,954
Interest paid 173,660 236,619 289,376 301,462 295,934 282,439 264,321
Interest paid as percent of
debt 3.94 3.44 3.94 4.04 4.09 4.06 3.95
Panel B: Including interest
due
1820 1829 1834 1838 1842 1845 1848
Total Mortgage, Floating
Debt, and interest due 5,008,154 7,703,942 8,344,465 8,586,650 8,572,193 8,374,765 8,214,407
Interest paid 173,660 236,619 289,376 301,462 295,934 282,439 264,321
Interest paid as percent of
debt 3.47 3.07 3.47 3.51 3.45 3.37 3.22
Sources: Data for 1820 come from Marshall (1835, p. 85) and from BPP (1821 IV). Data for 1829, 1834, and 1838 are from BPP
1840 (XXVII, p. 647.). Data for 1842 are from BPP (1844 XLII). Data for 1845 are from BPP (1847-48 LI). Data from 1848 are
from BPP (1851 XLVIII).
Notes: Debt, interest paid, and interest due is taken from the reports in each year except 1820 where interest paid is estimated.
(see section V for details).
Table 2: Estimate of turnpike road capital
1820 1829 1834 1838 1842 1845
Estimate of value of turnpike capital
(at current replacement cost) 10,500,125 13,051,030 14,471,323 15,567,232 16,037,446 16,514,329
Replacement cost inflator for previous period’s capital 1.0370 1.0179 1.0175 1.0000 1.0172
Investments since previous period 2,162,400 1,186,680 854,612 477,444 201,039
Sources: see table 1.
35
Table 3: Categories of turnpike revenue and expenses in England and Wales, 1834
Panel A: Revenues
Category value in pounds
sterling
% of
monetary
revenues
% of all
revenues
Tolls 1,434,069 93.9 89.4
Parish payments in lieu of statute labor 58,077 3.8 3.6
Incidental receipts 35,494 2.3 2.2
Total monetary revenues 1,527,640
Estimated value of statue labor performed 75,758
4.7
Total revenues, including statute labor 1,603,398
Panel B: Expenses
Category
value in pounds
sterling % of total expenditure
Labor (manual and team) 516,376 30.3
Materials for surface repairs 217,048 12.8
Salaries to trust officers 92,954 5.5
Tradesman’s bills 67,098 3.9
Damages in obtaining materials 10,018 0.6
Incidental expenses 59,045 3.5
Legal 28,889 1.7
Estimated value of statute labor performed 75,758 4.5
Total operating expenses 1,067,186 62.7
Improvements 217,152 12.8
Land purchased 20,184 1.2
Interest 289,376 17
Debt Payments 107,810 6.3
Total non-operating expenses 634,522 37.3
Net Revenues (Revenues- operating expenses) 536,212 Source: BPP 1840 (XXVII, p. 647).

36
Table 4: Estimated Rate of Return on Turnpike Capital
1820 1829 1834 1838 1842 1845
Total revenues 1,088,767 1,407,865 1,603,398 1,573,893 1,446,215 1,393,898
Total expenditures 1,034,124 1,678,032 1,701,708 1,670,180 1,528,259 1,372,149
Operating Expenses 686,804 1,197,646 1,067,186 1,067,178 999,236 866,800
Net Revenues 401,963 210,219 536,212 506,715 446,979 527,098
Estimate of turnpike capital 10,500,125 13,051,419 14,471,160 15,579,652 16,057,096 16,534,981
net revenues as % of capital 3.83 1.61 3.71 3.25 2.78 3.19
Sources: see table 1 and text.
Table 5: Summary of Rates of Return for Turnpike bonds
Average return on turnpike bonds 1820 observations Mean
standard
deviation
coefficient
of variation
scenario 1, un-weighted 965 3.48% 1.83% 0.53
scenario 2, un-weighted 965 3.70% 1.71% 0.46
scenario 2, mile-weighted 965 3.76%
Sources: Author’s calculation based on 1821 Report, BPP 1821 IV.
Notes: In scenario 1, the total interest due was accumulated evenly in every year since 1809. In scenario 2, the total
interest due was accumulated evenly in every year since 1799.

37
Table 6: Determinants of trust's contracted interest rate being 5 percent in 1838
(1) (2) (3) (4)
Coeff. Coeff. Coeff. Coeff..
(Rob. St. Err.) (Rob. St. Err.) (Rob. St. Err.) (Rob. St. Err.)
variable Marginal effect Marginal effect Marginal effect Marginal effect
Year of trust's first act in 10s 0.137 0.152 0.115 0.141
(0.023)*** (0.034)*** (0.036)*** (0.040)***
0.027 0.031 0.031 0.026
Zero interest paid to bondholders in 1820 -0.472 -0.4 -0.441
(0.569) (0.578) (0.669)
-0.102 -0.082 -0.087
Rate of return to bondholders 1820 -0.029 -0.009 -0.023
(0.124) (0.125) (0.145)
-0.005 -0.001 -0.004
Debt per mile in 1820 in 100s 0.154 0.157
(0.054)*** (0.056)***
0.03 0.029
Constant -23.485 -25.91 -19.86 -24.41
(4.07)*** (6.19)*** (6.53)*** (716)***
Dummy variables for county
included N N N Y
N 1139 778 772 764
Pseudo R-square 0.028 0.024 0.048 0.147
Notes: The dependent variable is 1 if the contracted interest rate in 1838 was 5%, otherwise 0. Robust
standard errors are reported. *, **, and *** represent statistical significance at the 10%, 5%, and 1%
level respectively.

38
Table 7: A comparison of investment portfolios in the early nineteenth century
Portfolio Mean return Standard Dev. Sharpe ratio
turnpike bonds 1820 3.70 1.71 0.152
turnpike bonds 1838 4.26 2.8 0.293
farmland, 1818-1845 3.61 1.36 0.125
canals 1825 9.71 15.7 0.399
railways, top five companies 1838 4.27 3.91 0.212
railways, top five companies 1844 7.73 1.75 2.451
railways, top five companies 1850 3.83 0.84 0.464
railways, top five companies 1854 4.06 0.76 0.816
railways, next ten companies 1854 4.21 1.2 0.642
British Stock market, including railways 1825-1870 10.16 9.7 0.693
British Stock market, excluding railways 1825-1870 8.54 8.19 0.623
Notes and sources: see text.