investment and profitability - tips · investment and profitability the past year saw an...
TRANSCRIPT

THE REAL ECONOMY BULLETIN
[Grab your reader’s attention with a great quote from the document or use this space to Investment and profitability
The past year saw an improvement in profitability in the real economy. Nonetheless,
total investment decreased sharply in 2016, primarily in the private sector. State
investment stagnated largely due to the onset of fiscal consolidation.
Profitability in the fourth quarter of 2016, calculated as pre-tax profits relative to assets,
was strong in the real economy (Graph 15). Return on assets in mining confirmed its
recovery from 2015, rising from R14 billion to R24 billion from the third to the fourth
quarter. This situation resulted from a combination of higher global prices, although still
far off 2011 peaks, and the closure of less profitable activities in the interim.
Profitability in the manufacturing sector remained stagnant compared to last year, with
a sharp decline when compared to the previous quarter. After a disappointing
performance in the previous quarter, the construction sector returned to strong profits,
in line with 2015 results.
The rest of the economy showed satisfactory returns, although in decline both on a quarter-to-quarter and year-on-year basis.
Graph 15. Return on assets (profit before tax as % of asset value) in the
fourth quarter of 2010, 2015 and 2016
Source: Statistics South Africa. Quarterly Financial Statistics, third quarter of relevant years.
In constant rand, profits in the manufacturing sector returned to conventional levels
after the spike reported in the previous quarter, which resulted from a major merger in
the beverages industry (Graph 16). While the recovery of the mining sector remained
fragile, the sector confirmed its return to profitability with a third quarter of
improvement, returning to 2010 levels.
-2%0%2%4%6%8%
10%12%
Mining (R24 bn) Manufacturing(R39 bn)
Construction (R3,7bn)
Other (R99 bn)
2010 2015 2016

THE REAL ECONOMY BULLETIN
[Grab your reader’s attention with a great quote from the document or use this space to
Graph 16. Profits in manufacturing and mining in constant (2016) rand, 2010 to 2016
Source: Statistics South Africa. Quarterly Financial Statistics, relevant years.
Despite this recovery in profits, total investment decreased in 2016, for the first time
since 2009 and the financial crisis (Graph 17). Private sector investment in particular
dropped by some 6% after a couple of flat years. After five years of steady growth,
state-led investment did not compensate for the decline in the private sector and
levelled out (0.3%) in 2016, in line with the fiscal consolidation trend. Investment by
state-owned enterprises declined by about 1.5% while government investment grew
marginally by 1%. As a result, investment as a percentage of GDP further weakened in
2016, reaching 19.6%, far from the 2008 peak at 23.5%.
Graph 17. Yearly investment by type of organisation in constant 2010 rand, 2000 to 2016
Source: Reserve Bank. Interactive data set. Downloaded in June 2017.
-15-10
-505
1015202530354045505560657075808590
1 3 1 3 1 3 1 3 1 3 1 3 1 3
2010 2011 2012 2013 2014 2015 2016
bill
ion
s o
f co
nst
ant
(20
16
) ra
nd
Manufacturing Mining
0%
5%
10%
15%
20%
25%
-
50
100
150
200
250
300
350
400
450
20
00
20
01
20
02
20
03
20
04
20
05
20
06
20
07
20
08
20
09
20
10
20
11
20
12
20
13
20
14
20
15
20
16
% o
f GD
PB
illio
ns
of
con
stan
t (2
01
0)
ran
d
Total investment as % of GDP (right axis) Private sector
General government Public corporations

THE REAL ECONOMY BULLETIN
[Grab your reader’s attention with a great quote from the document or use this space to
At the sectoral level, investment materially declined in all sectors of the real economy
with the exception of utilities and social services, which essentially stagnated (Graph
18). Affected by the drought, the agriculture sector continued its sharp fall initiated in
2014, with investment in decline of 23%. Manufacturing investment also severely
decreased by more than 8% in 2016, reaching a level last seen in 2009. Investment in
mining and logistics respectively declined by 4% and 6% in 2016, as a result of
depressed commodity prices and weak economic activity.
Graph 18. Quarterly investment by sector in constant 2010 rand, 2000 to 2016
Source: Reserve Bank. Interactive data set. Downloaded in March 2017.
From an asset perspective (Graph 19), infrastructure-related investment considerably
slowed down in the last year, dragged by a 3% decline in investment in building and
subdued growth in construction works. Investment in capital equipment plunged by 9%
in 2016, in line with the decline in manufacturing and mining investment.
Graph 19. Yearly investment by type of assets in constant 2010 rand, not seasonally adjusted or annualised, 2000 to 2016
Source: Calculated from Statistics South Africa. GDP Excel spreadsheet. Downloaded from
www.statssa.gov.za in June 2017
-
20 000
40 000
60 000
80 000
100 000
120 000
140 000
Agriculture
Mining
Manufacturing
Utilities
Logistics
Business services
Social services
Other
mill
ions
2000 2001 2002 2003 2004 2005 2006 2007 2008
2009 2010 2011 2012 2013 2014 2015 2016
-10.0%
-5.0%
0.0%
5.0%
10.0%
15.0%
Resid
ential b
uild
ings
No
n-resid
ential
bu
ildin
gs
Co
nstru
ction
wo
rks
Transp
ort eq
uip
men
t
Mach
inery an
d o
ther
equ
ipm
ent
Transfer co
sts
Oth
er assets
Total
average, 2011 to 2014 2014 to 2015 2016 to 2017
THE REAL ECONOMY BULLETIN
[Grab your reader’s attention with a great quote from the document or use this space to
Major new projects
This section summarises major new foreign direct investment (FDI) projects, drawing on
a new TIPS database, as well as domestic initiatives in the real economy.
Luxembourg-headquartered Czech company PEGAS, an established global producer of
nonwoven textiles, announced plans to invest R1,3 billion over a period of two years in
a new textiles manufacturing plant in Atlantis in the Western Cape. Operations are
expected to begin at the end of 2018, creating 200 direct jobs. The company, which will
receive incentives from Wesgro, the Western Cape’s investment agency, and the
Western Cape government, is committed to sourcing building and raw materials from
local suppliers and to training local staff.
Confirming the attractiveness of the Automotive Production and Development
Programme (APDP), South Africa’s sectoral development programme for the
automotive industry, Mercedes Benz and BMW announced new investment in the first
quarter of 2017. Mercedes Benz will be adding three new AMG models to its East
London production line. The AMG engines will be imported, while the rest of the
components will be locally manufactured. BMW will be constructing a state-of-the-art
regional parts distribution centre in Midrand in Gauteng. The project will include a
training centre and offices for its IT operations hub. R200 million will spent on fitting out
the distribution centre once complete.
13 In contrast, General Motors announced in May it would be exiting South Africa. The
move, triggered by a global restructuring and the difficulties of the American firm on the
local market (which failed to reach the necessary production volumes to fully benefit
from the APDP), is consistent with the international restructuring and consolidation
occurring in the automotive industry. The Struandale vehicle assembly plant in Port
Elizabeth will be sold to Japanese commercial vehicle manufacturer Isuzu.
In March 2017, Australian firm iSelect Limited - which specialises in online insurance,
utilities and personal finance comparison - launched a new call centre in Cape Town, in
the Western Cape, valued at R320 million. The company partnered with South African
business process outsourcing company Merchant, which will manage the facility. The
centre hosts 140 employees, with plans to create 500-1 000 over the next five years.
On the acquisition side, the Chevron Corporation (known as Caltex), involved in the
refining and distribution of petroleum products in South Africa through 15 depots, 845
retail outlets and 21 terminals countrywide, actioned a three-year divestment
programme announced in 2014. The company sold 75% of its local asset to the China
Petroleum & Chemical Corporation (a subsidiary of the Sinopec Group, China’s state-
owned oil, gas and petrochemical producer) for an estimated R11.3 billion. A
consortium of black economic (BEE) partners and an employee trust jointly hold
ownership of the remaining 25% of the business.

THE REAL ECONOMY BULLETIN
[Grab your reader’s attention with a great quote from the document or use this space to
Briefing note: South Africa’s credit downgrade – A commodity story Generating much debate about the state and performance of the South African
economy, leading credit ratings agencies recently downgraded South Africa’s grade.
Fitch and Standard and Poor’s downgraded South Africa’s long-term sovereign ratings
by one notch in April 2017 from BBB- to BB+ while Moody’s decreased the country’s
grade from Baa2 to Baa3 in June 2017. But the downgrades did not affect any of the
developments covered in this Real Economy Bulletin, which is based on data up to
March 2017.
According to the agencies’ statements, the move was primarily driven by the political
uncertainty following the Cabinet reshuffle and the perception that the fiscal
consolidation stance (notably a rise in contingent liabilities of state-owned enterprises)
will, as a result, be undermined by the pursuit of the nuclear power plant programme
and efforts to spur radical economic transformation.
While not negating the role of internal political turmoil, South Africa’s credit rating
history seems, however, to provide other important angles of analysis. The country’s
credit ratings have been mainly determined by GDP growth, in turn underpinned by
global commodity prices. Indeed, considering South Africa’s rating in the light of
commodity prices, (Graph 20) shows that South Africa’s credit rating has been closely
linked to international dynamics.
14
Graph 20. South Africa’s credit rating and metal prices, 1994 to 2017
Source: credit ratings converted to numerical scale (0-24). Credit ratings downloaded from Trading
Economics. Metals price index: IMF data
South Africa’s ratings should also be put into perspective on a global scale. Based on an
average of the three main agencies, South Africa is ranked 72nd out of 146 countries
which have a credit rating (Graph 21). South Africa’s ratings remain on par with India,
0
50
100
150
200
250
300
12
13
14
15
16
17
18
191
99
4 Q
1
19
95
Q1
19
96
Q1
19
97
Q1
19
98
Q1
19
99
Q1
20
00
Q1
20
01
Q1
20
02
Q1
20
03
Q1
20
04
Q1
20
05
Q1
20
06
Q1
20
07
Q1
20
08
Q1
20
09
Q1
20
10
Q1
20
11
Q1
20
12
Q1
20
13
Q1
20
14
Q1
20
15
Q1
20
16
Q1
20
17
Q1
Me
tals price
ind
exN
um
eri
cal r
atin
g
Metals price index (right axis) Moody's Fitch S&P

THE REAL ECONOMY BULLETIN
[Grab your reader’s attention with a great quote from the document or use this space to
Russia, Brazil and even Portugal. The country’s weak economic growth performance
(the main determinants of credit ratings) moreover appears in line with other upper-
middle income economies (with the exception of China), as shown in Graph 22.
Graph 21. World credit ratings, June 2017
Note: The grey area indicates speculative status. Source: credit ratings converted to numerical scale (0-24).
Credit ratings downloaded from Trading Economies. 15 Graph 22. GDP growth in upper-middle income economies, 1994 to 2015
Source: World Bank data
While South Africa undoubtedly displays some domestic weaknesses, worsened by the
political noise, global dynamics seem to largely explain the downgrade spiral.
Importantly, these trends determined the country’s rating, and not the other way
around. Indeed, ratings which, as a reminder, are tools to help investors evaluate the
South Africa
0
5
10
15
20
25
Au
stralia
Liechten
stein
Singap
ore
Au
stria
New
Zealan
d
Ku
wait
Belgiu
m
Ch
ile
Israel
Saud
i Arab
ia
Iceland
Po
land
Mau
ritius
Co
lom
bia
Uru
guay
Kazakh
stan
Ind
on
esia
San M
arino
Ru
ssia
Gu
atemala
Cro
atia
Cyp
rus
Seychelles
Ivory C
oast
Arm
enia
Mo
nten
egro
Nigeria
An
gola
Bu
rkina Faso
Kyrgyzstan
Jamaica
Egypt
Co
ngo
St Vin
cent/G
renad
ines
Ukrain
e
El Salvado
r
Pu
erto R
ico
Average Rating
-15.0
-10.0
-5.0
0.0
5.0
10.0
15.0
20.01
99
4
19
95
19
96
19
97
19
98
19
99
20
00
20
01
20
02
20
03
20
04
20
05
20
06
20
07
20
08
20
09
20
10
20
11
20
12
20
13
20
14
20
15P
erc
en
tage
ch
ange
South Africa China Russian Federation Brazil Other UMIC

THE REAL ECONOMY BULLETIN
[Grab your reader’s attention with a great quote from the document or use this space to
risks of a country defaulting on its debts, respond mostly to economic trends.
Undoubtedly, the downgrade will have some noticeable impact on the country,
negatively affecting the sentiment on the domestic economy. The acceleration of capital
outflows (already triggered by the fall in commodity prices) will ultimately increase the
cost of capital, reducing the ability of both the public and private sector to invest. In
addition, larger capital outflows are likely to push the value of the rand down, with the
known positive effect on exports but negative impact on imports (particularly
petroleum). However, in the long run, the impacts on the real economy are expected to
be fairly muted and the current credit rating is unlikely to markedly affect South Africa’s
performance, compared to global demand and commodity prices.
Briefing note: Industrial policy and the locomotive procurement – Corruption undermines industrial development The procurement by Transnet of 1 064 locomotives was hailed as a boon for industrial
policy. Transnet consolidated several years of procurement and sent the market signal
that there was sufficient demand in South Africa for a major investment by locomotive
producers and their suppliers. It also promised to stimulate local manufacturing firms to
become suppliers into this global industry and support an export base in these products.
The firms bidding for the locomotive procurement were required to commit to localising
their production, investing in local firms and building a competitive local supplier base.
16 Four firms were awarded the contracts, including China South Rail and China North Rail,
which subsequently merged. Yet, research commissioned from the Centre for
Competition, Regulation and Economic Development (CCRED) by TIPS under the
Industrial Policy Research Programme1 showed that China South Rail undertook virtually
no localisation of production.
The recent leak of emails showing that the Transnet procurement process was hi-jacked
helps explain this situation. They reveal that China South Rail paid a staggering 20% of
the R50 million paid for each locomotive – some R10 million apiece - in “fees” to an
intermediary company that facilitated its bid.2 In total, it paid over R5 billion for the
500+ locomotives that Transnet will be buying from China South Rail.
TIPS research found that, to date, not one of the China South Rail locomotives has been
assembled in South Africa; all have been manufactured in China. It appears that
Transnet gave China South Rail “exemptions” on the number of locomotives that
1 A recent presentation at a TIPS Development Dialogue is available on the TIPS Website www.tips.org.za; the full report is Crompton R., Fessehaie, J., Lauralyn Kaziboni L. and Tatenda Zengeni T. 2017. Railway Locomotives and Transnet: A Case Study. CCRED Working Paper 9/2017. CCRED. University of Johannesburg, available on www.competition.org.za. 2 AmaBhungane. 2017. #Guptaleaks: Guptas and Associates Score R5.3bn in Locomotives Kickbacks. Downloaded from www.amabhungane.co.za in June 2017.

THE REAL ECONOMY BULLETIN
[Grab your reader’s attention with a great quote from the document or use this space to
needed to be produced in South Africa, even though the procurement programme
aimed explicitly to simulate local industry and industrial development.
The findings are verified in scrutinising the import bill for locomotives, which has grown
significantly. The imports were less than $50 million per year through 2013, but then
climbed to US$100 million in 2014 and US$550 million in 2015.3 The remaining suppliers
to Transnet under this procurement process have lived up to their obligations; they
have invested, developed suppliers and are exporting components to the region and
globally. Transnet Engineering has also built its own capabilities to produce locomotives,
which is a positive signal.
With the slowing economy, the effects of high-level corruption can now be explicitly
felt. Where government policies designed to stimulate industrialisation have been
captured, the result is not only corruption and money-laundering, but also weaker
foreign direct investment and slower industrialisation.
The state has few tools available to stimulate industrialisation, and the localisation of its
procurement is one of its most important levers. Moral outrage aside, when corruption
results in the importation of these items, it is a double blow to the economy – South
Africa pays more for public investment and also loses the hoped-for stimulus to industry
with the jobs and domestic manufacturing opportunities that would have been created.
As a minimum, the remaining locomotives that Transnet will get in 2018 must be locally
manufactured, and the cost of each locomotive must be reviewed to ensure they do not
incorporate corrupt payments.
17
Briefing note: The electricity oversupply – Implications for economic policy Since 2011, Eskom has experienced a sharp decline in demand, while the electricity-
intensity of the South African economy fell by a quarter from 2005 to 2017. A TIPS
briefing note (available at www.tips.org.za/policy-briefs) analyses the factors behind the
fall in demand and, on that basis, a range of strategic responses.
As the Graph 23 shows, electricity production is now substantially lower than in 2008,
despite continued growth in the GDP.
3 Crompton R., et al. 2017. Railway Locomotives and Transnet: A Case Study. CCRED Working Paper 9/2017. CCRED. University of Johannesburg.

THE REAL ECONOMY BULLETIN
[Grab your reader’s attention with a great quote from the document or use this space to
Graph 23. Indices of the GDP in volume terms and annual electricity production, 2010 to 2016 (2000 = 100)
Source: For GDP, calculated from South African Reserve Bank. Interactive dataset. Series on GDP in constant
rand. Downloaded from www.resbank.co.za in May 2017. For electricity, calculated from Statistics South
Africa. Electricity generated and available for distribution. 201703. Excel spreadsheet. Series on monthly
electricity generated and available for distribution, not seasonally adjusted. Downloaded from
www.statssa.gov.za in May 2017.
Despite these trends, both Eskom and the regulator assume that demand will pick up in
the near future. That belief ignores both the likelihood of slow growth in metals exports
at least for the next few years as well as the strength of national and business strategies
to reduce energy intensity. The risk is that it could lead to substantial overinvestment in
generation in the next few years.
19 Graph 24 shows that NERSA’s projections for electricity demand have not been
corrected to take into account the realities of the past nine years.
95
100
105
110
115
120
125
130
135
140
145
150
155
160
20
00
20
01
20
02
20
03
20
04
20
05
20
06
20
07
20
08
20
09
20
10
20
11
20
12
20
13
20
14
20
15
20
16
20
00
= 1
00
GDP
Total electricityproduction
Eskom production
THE REAL ECONOMY BULLETIN
[Grab your reader’s attention with a great quote from the document or use this space to
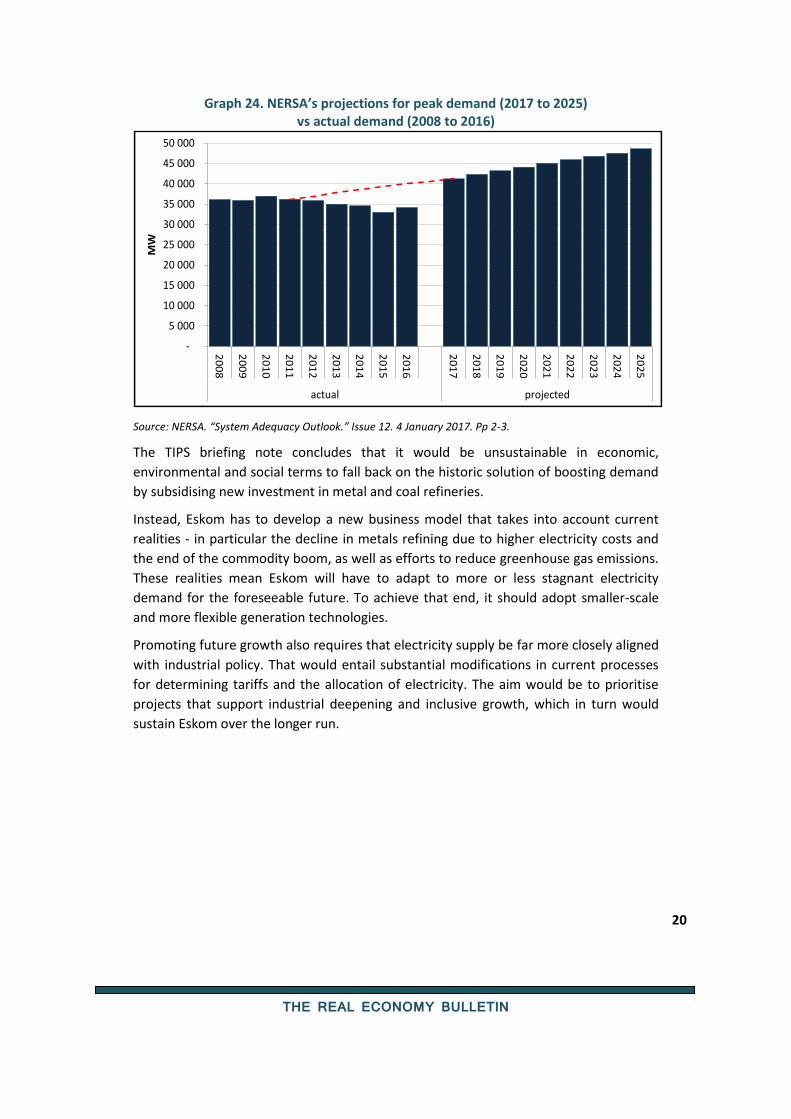
Graph 24. NERSA’s projections for peak demand (2017 to 2025) vs actual demand (2008 to 2016)
Source: NERSA. “System Adequacy Outlook.” Issue 12. 4 January 2017. Pp 2-3.
The TIPS briefing note concludes that it would be unsustainable in economic,
environmental and social terms to fall back on the historic solution of boosting demand
by subsidising new investment in metal and coal refineries.
Instead, Eskom has to develop a new business model that takes into account current
realities - in particular the decline in metals refining due to higher electricity costs and
the end of the commodity boom, as well as efforts to reduce greenhouse gas emissions.
These realities mean Eskom will have to adapt to more or less stagnant electricity
demand for the foreseeable future. To achieve that end, it should adopt smaller-scale
and more flexible generation technologies.
Promoting future growth also requires that electricity supply be far more closely aligned
with industrial policy. That would entail substantial modifications in current processes
for determining tariffs and the allocation of electricity. The aim would be to prioritise
projects that support industrial deepening and inclusive growth, which in turn would
sustain Eskom over the longer run.
20
-
5 000
10 000
15 000
20 000
25 000
30 000
35 000
40 000
45 000
50 000
20
08
20
09
20
10
20
11
20
12
20
13
20
14
20
15
20
16
20
17
20
18
20
19
20
20
20
21
20
22
20
23
20
24
20
25
actual projected
MW

THE REAL ECONOMY BULLETIN
[Grab your reader’s attention with a great quote from the document or use this space to
Briefing note:
What’s going on with the employment data?
As Graph 25 shows, the Quarterly Labour Force Survey (QLFS) reported a markedly
strong increase in formal non-agricultural employment in the first quarter for the first
time since the survey was initiated nine years ago. Informal employment accounts for
around 17% of all jobs and is more volatile.
The survey found that, on average, informal employment declined by 2,2% in the first
quarter of the year, each year from 2010 to 2016. For the first quarter of 2017, in
contrast, it reported that informal employment dropped just 0,5%.
Graph 25. Reported percentage change in formal and informal non-agricultural employment per quarter
Source: Calculated from Statistics South Africa. Quarterly Labour Force Surveys for relevant year. Databases
in SPSS. Downloaded from Nesstar facility at www.statssa.gov.za
If the economy were booming, this kind of jobs growth would not be exceptional. GDP
growth has slowed, so the findings appear anomalous.
As Graph 26 shows, if the seasonal adjustment for GDP data is removed, employment
and the GDP usually decline together in the first quarter each year, as a result of the
holidays.
21
-4.0%
-3.0%
-2.0%
-1.0%
0.0%
1.0%
2.0%
3.0%
4.0%
Q1
Q2
Q3
Q4
Formal non-agricultural employment
-8.0%
-6.0%
-4.0%
-2.0%
0.0%
2.0%
4.0%
6.0%
8.0%
Q1
Q2
Q3
Q4
Informal non-agricultural employment
2008
2009
2010
2011
2012
2013
2014
2015
2016
2017

THE REAL ECONOMY BULLETIN
[Grab your reader’s attention with a great quote from the document or use this space to
Graph 26. Percentage change in GDP and employment per quarter, not seasonally adjusted
Source: Calculated from Statistics South Africa. Quarterly Labour Force Surveys for relevant year. Databases
in SPSS. Downloaded from Nesstar facility at www.statssa.gov.za; and GDP data in excel format, series on
GDP in constant rand without seasonal adjustment. Downloaded from www.statssa.gov.za in June 2017.
Manufacturing alone accounted for 43% of the reported increase in formal
employment, although it contributes just 14% of all formal jobs.
Food, beverages and the forestry value chain accounted for half the reported growth in
manufacturing employment. This could in part reflect the recovery from the drought.
The other main reported contributors were chemicals and non-metallic minerals, which
is more difficult to explain in terms of their economic trends. In the past quarter, both
of these industries reported a small decline in sales in constant terms.
In sum, the increase in employment reported for the past quarter seems at least as
likely to result from data problems as from a real increase in job creation. If the QLFS
results continue to diverge from other economic trends in the next few quarters, it
might be useful if Statistics South Africa undertook a review of the survey’s
methodology.
22
-6.0%
-5.0%
-4.0%
-3.0%
-2.0%
-1.0%
0.0%
1.0%
2.0%
3.0%
4.0%
form
al emp
loym
ent
GD
P
form
al emp
loym
ent
GD
P
form
al emp
loym
en
t
GD
P
form
al emp
loym
ent
GD
P
1 2 3 4
2009 2010 2011 2012 2013 2014 2015 2016 2017