investment and security trading - worcester … forex market ... 2-4.2 indicator types ... figure 9...
TRANSCRIPT

Investment and Security Trading
An Interactive Qualifying Project Submitted to the Faculty of
Worcester Polytechnic Institute
Submitted By:
Zhao Huang: ……………………………………
Renzhi Jiang: ……………………………………
Han Yang: .…………………………………...
Submitted to:
Project Advisor:
Hossein Hakim: …………………………………
March 14, 2011

II
Table of Contents
List of Figures ........................................................................................ V
List of Tables ...................................................................................... VII
1. INTRODUCTION ............................................................................ 1
1-1 Summary of financial markets ............................................................................................................ 1
1-2 Project Description ............................................................................................................................. 2
2. BACKGROUND ............................................................................... 4
2-1 Overview of Corporate Finance Basics .............................................................................................. 4
2-1.1 Forms of Business Organization .................................................................................................. 4
2-1.2 The Ways of Corporation Raises Money ..................................................................................... 6
2- 1.3 Risk and Return of Stocks ........................................................................................................ 10
2-2 Fundamental Analysis ...................................................................................................................... 13
2–2.1 Financial Statement ................................................................................................................... 13
2 –2.2 Financial Management and Short-term Financial Planning ..................................................... 22
2-3 Financial Markets ............................................................................................................................. 27
2-3.1 Stock and stock market .............................................................................................................. 27
2-3.2 Forex Market ............................................................................................................................. 30
2-3.3 Future Market ............................................................................................................................ 31
2-4 Indicator Categorization and explanation ......................................................................................... 32
2-4.1 Definition and functions ............................................................................................................ 32
2-4.2 Indicator types ........................................................................................................................... 33
2-4.3 Oscillator Types ......................................................................................................................... 34
2-4.4 Oscillator Signals ....................................................................................................................... 35
2-5 Important Indicators ......................................................................................................................... 38
2-5.1 Aroon and Aroon Oscillator ..................................................................................................... 38
2-5.2 Average True Range .................................................................................................................. 40
2-5.3 Chaikin Money Flow ................................................................................................................. 41
2-5.4 Commodity Channel Index ........................................................................................................ 42
2-5.5 Coppock Curve .......................................................................................................................... 43
2-5.6 Detrended Price Oscillator ......................................................................................................... 44

III
2-5.7 Average Directional Index ......................................................................................................... 45
2-5.8 Bollinger Bands ......................................................................................................................... 46
2-5.9 Donchian Channel ..................................................................................................................... 48
2-5.10 Ease of Movement ................................................................................................................... 48
2-5.11 Force Index .............................................................................................................................. 49
2-5.12 Keltner channel ........................................................................................................................ 50
2-5.13 Mass index ............................................................................................................................... 51
2-5.14 Money Flow Index ................................................................................................................... 51
2-5.15 Moving average ....................................................................................................................... 52
2-5.16 Multiple indicators application ................................................................................................ 53
2-6 Company and stock .......................................................................................................................... 56
2-6.1 Stock price Factors .................................................................................................................... 56
2-6.2 Case study of Apple Inc. ............................................................................................................ 57
3. Methodology ..................................................................................... 59
3.1 Instruction ......................................................................................................................................... 59
3.2 Data Collecting & Processing ............................................................................................................ 59
3.3 Decision Making ................................................................................................................................ 59
4. RESULTS and ANALYSIS ........................................................... 60
4-1 Weekly Reports ................................................................................................................................ 60
4-1.1 IQP Weekly Report November 22 ............................................................................................. 60
4-1.2 IQP Weekly Report November 29 ............................................................................................. 60
4-1.3 IQP Weekly Report December 6 ............................................................................................... 64
4-1.4 IQP Weekly Report December 13 ............................................................................................. 67
4-1.5 IQP Winter and Weekly Report January 24 .............................................................................. 70
5. Conclusion and Recommendation ................................................. 73
5-1 Trading Recommendation ................................................................................................................ 73
5-2 Conclusion ........................................................................................................................................ 74
6. Bibliographies ................................................................................. 76
APPENDIX ........................................................................................... 78
A. Trading History .................................................................................................................................. 78

IV
B. Trading Statistics ................................................................................................................................ 89

V
List of Figures
Figure 1 Value of a Bond with 10 Percent Coupon Rate for Different Interest Rate ................................... 8
Figure 2 Risk of Stocks Chart ..................................................................................................................... 12
Figure 3 Carrying Costs and Shortage Costs .............................................................................................. 25
Figure 4 Policy F Performance ................................................................................................................... 26
Figure 5 Policy R Performance ................................................................................................................... 26
Figure 6 Forex Market Example Chart ....................................................................................................... 31
Figure 7 Example of Momentum Indicator in NYSE Index ....................................................................... 33
Figure 8 Example of Lagging Indicators in S&P 500 Index ....................................................................... 34
Figure 9 Example of Positive Divergence in Merrill Lynch $ Co., Inc. ......................................................... 36
Figure 10 Example of Negative Divergence in International Business Machines ...................................... 36
Figure 11 Example of Overbought and Oversold Extreme in Cisco Systems, Inc. .................................... 37
Figure 12 Example of Centerline Crossover in Intel Corp. ........................................................................ 38
Figure 13 Apple Inc./Aroon Stock Chart .................................................................................................... 39
Figure 14 Apple Inc./Aroon Oscillator Stock Chart ................................................................................... 40
Figure 15 Apple Inc./Average True Range Stock Chart ............................................................................. 41
Figure 16 Apple Inc./Chaikin Money Flow Stock Chart ............................................................................ 42
Figure 17 Apple Inc./Commodity Channel Index Stock Chart ................................................................... 43
Figure 18 Apple Inc./Coppock Curve Stock Chart ..................................................................................... 44
Figure 19 Apple Inc./Price Oscillator Stock Chart ..................................................................................... 45
Figure 20 JC Penny Co. Inc/Average Directional Index Stock Chart ......................................................... 46
Figure 21 SNDK/W-Bottoms Stock Chart .................................................................................................. 47
Figure 22 XOM/M-tops Stock Chart .......................................................................................................... 47
Figure 23 Apple Inc./Dochian Channel Stock Chart .................................................................................. 48
Figure 24 Apple Inc./MACD Stock Chart .................................................................................................. 49
Figure 25 Apple Inc./Force Index Stock Chart ........................................................................................... 49
Figure 26 Apple Inc./Keltner Channel Stock Chart .................................................................................... 50
Figure 27 Apple Inc./Mass Index Stock Chart ............................................................................................ 51
Figure 28 Apple Inc./Money Flow Index Stock Chart ................................................................................ 52
Figure 29 Apple Inc./Moving Average ....................................................................................................... 53
Figure 30 Apple Inc./Multiple Indicator Applications ................................................................................ 54

VI
Figure 31 Apple Inc./Bollinger Bands/RSI ................................................................................................. 55
Figure 32 Apple Inc./Indicators Stock Chart .............................................................................................. 57
Figure 33 BBY Trading Chart .................................................................................................................... 61
Figure 34 EURUSD Trading Chart ............................................................................................................. 62
Figure 35 EURAUD Trading Chart ............................................................................................................ 62
Figure 36 GBPJPY Trading Chart .............................................................................................................. 64
Figure 37 EURUSD Trading Chart ............................................................................................................. 66
Figure 38 GBPJPY Trading Chart .............................................................................................................. 66
Figure 39 AUDUSD Trading Chart ............................................................................................................ 68
Figure 40 AUDCAD Trading Chart ............................................................................................................ 68
Figure 41 YOKU Trading Chart ................................................................................................................. 69
Figure 42 SDTH Trading Chart .................................................................................................................. 69
Figure 43 EURUSD Trading Chart ............................................................................................................. 70
Figure 44 GBPUSD Trading Chart ............................................................................................................. 71

VII
List of Tables
Table 1 Expected Return of a Stock ............................................................................................................ 11
Table 2 Companies and Their Beta Values ................................................................................................. 13
Table 3 Nordstrom, Inc. Consolidated Balance Sheet ................................................................................ 15
Table 4 Nordstrom, Inc. Consolidated Statement of Earnings .................................................................... 16
Table 5 Nordstrom, Inc. Consolidated Statements of Cash Flows ............................................................. 17
Table 6 Nordstrom, Inc. Comparative Statements of Cash Flows with Reconciliation of Net Income to
Cash Flow from Operation .......................................................................................................................... 19
Table 7 Nordstrom, Inc. Consolidated Statements of Shareholders’ Equity .............................................. 21
Table 8 IQP Weekly Report November 22 Trading Performance Summary Table ................................... 60
Table 9 IQP Weekly Report November 29 Trading Performance Summary Table ................................... 60
Table 10 IQP Weekly Report December 6 Trading Performance Summary Table .................................... 64
Table 11 IQP Weekly Report December 13 Trading Performance Summary Table .................................. 67
Table 12 IQP Weekly Report January 24 Trading Performance Summary Table ...................................... 70

1
1. INTRODUCTION 1-1 Summary of financial markets Not to say it’s good or bad, the financial sector of United States is now the most important sector of the whole nation’s economy. According to the report of the Financial Crisis Inquiry Commission, by the year of 2005, the 10 largest U.S. commercial banks hold 55% of the industry’s assets and financial sector profits constituted 27% of all corporate profits in the United States(1). Indeed, this magical sector is making big winners and losers on a daily base. Stock market, foreign currency market and future market, the three that are directly open to all investors, are very important investment choices, and their history, mechanics and spikes are our first focus in this project.
Financial market is an old human invention (Levinson, 2008). Ever since mankind settled down to growing crops and trading them with others, such market has existed, fist only for farmers to obtain seed and food after a bad year and to sell or store surplus crop after a good year. The collective decisions of individual farmers comprise the financial market. Now, the financial market is trading more than crops, and with the development of digital technology and internet the most prominent objects being traded in the financial market today are stocks, foreign currency and future.
The market is important in many ways of and the project is mostly focusing on its functionality as price setting, raising capital, commercial transactions and investing. The price of stock, currency, or gold is no more and no less than what someone is willing to pay to own it and such an open market provide the scale of value (Levinson, 2008). Expanding companies also need the market to issue shares, bonds and other derivatives to draw investment (Levinson, 2008). Commercial transactions between companies and individuals also take place in the financial market and this provides the opportunity for investors to seek places to put their money (Levinson, 2008).
Stock, or capital stock represents the original capital invested in the business entity by its founders and it serves as a credit for investors. First issued by the Dutch East India Company in 1606, the stock is indeed an innovation in the financial system as it abridges the distance between investors and company. By the start of 2008, the size of the world market was estimated at about $36.6 trillion and the biggest stock market is the New York Stock Exchange, one of the two stock markets that is focused on in our project. The other is National Association of Securities Dealers Automated Quotations Stock Market, also known as NASDAQ, which is second largest stock market and its listing mostly technology companies while NYSE lists companies from a lot of area. In brief, each company can sell their stocks once they are proved by the Security and Exchange Commission of United States, and when they list their stocks in the market. The stocks flow first from Company to investors and can be exchanged between

2
investors at agreed price. The price of the stock can be influenced by many factors but is mostly related with the profitability of the company.
Foreign Exchange market, or forex in short, is a worldwide financial market for currency trading. The globalization puts forex market as the cornerstone for other markets exchange of different currencies become essential in international trade (Levinson, 2008). Because this market is supporting massive amount of transactions of some essential currencies in the world – US dollars, British Pounds, Euro, Yen etc – it is collectively the biggest market in the world with an average turnover totaling $1,9 trillion a day (Levinson, 2008).
A futures contract is a standardized agreement between the buyer and seller to buy or sell a specified asset with specified quantity and quality at a specified future date at a specified price agreed at present. In the case of a futures contract, the asset which specified in the agreement could be anything (e.g. agricultural crops, non-ferrous metals, all kinds of fossil fuels) that is capable of trading.
Under most circumstances, futures contracts are used to make profits due to the price differences of the specified asset between today and the future. The buyer in one futures contract, who is agreeing to buy the certain goods at the certain price on a certain date in the future, will make a profit if the future price is lower than the current price. This is said to be in a long position in finance. And the seller in one futures contract, who is said to be in a short position, will make a profit if the future price is higher than the current price.
The financial markets have become excellent places for capital flows and efficient use of capital for big investors. However, they have also become focused places for small and personal investment. The features and history of each market has increased its corresponding complexity therefore a study concerning the market and trading strategy is rather necessary for personal and small financial management. This project attempts to study the features of markets and to develop a profitable trading plan for personal and small investors.
This is a report of the project as to show the process of studying, developing, verifying and concluding trading strategy. There are four chapters following introduction – in Background, information about markets, corporations, investors and indicators were studied and shown; in Methodology, the methods of studying, verifying and modifying trading plan were shown; in Results and Analysis, the weekly performance reports were shown with discussion and summary of weekly trades; in Conclusion and Recommendation, the conclusion of assessment of trading plan, the summary of mistakes and success and important notes were presented.
1-2 Project Description This is a project in which the background information about markets and investment were first learnt and then applied with simulated money and real-time data to explore the moving patterns of markets and the mechanism to achieve profits in financial markets. Specifically, history, features, characteristics, influential factors and indicators of markets have been studied to

3
understand the movements of markets and to design a trading plan that is profitable. TradeStation® was used as a platform on which trades were conducted with $100,000 simulated money.
In brief, this project contains three parts:
Part One (A term 2010): establish the knowledge and understanding of corporations, markets, indicators and their relation with stock and forex markets.
Part Two (B term 2010): use simulated money and real-time data to trade on TradeStation® platform in order to verify and modify the effectiveness of trading plan.
Part Three (C term 2011): discuss and analyze the trading results, continue to modify trading plan and reach conclusion.
In part one, the types of markets, the compositions and features of the players in the markets – corporations (stocks) and governments (bonds and currency) – were studied to understand how a market was established and what the main purpose of market is. Certain criteria of assessing a company’s future performances were studied and explored – for example a company’s financial statement; statistical assessment and application in stock markets were reviewed as reference for actual trading; different stock charts and indicators were studied to verify their effectiveness and to assess their importance in real trading which enable selection. This step is helpful in designing the trading plan as a few of them which were conceived as important were used in the trading. The contents of this part are represented in Chapter 2 and 3.
In part two, trade with simulated money and real-time data was conducted with pre-established trading plan. The trading plan was also constantly modified in this process as to achieve maximum efficiency of capital. Two markets – the stock market which includes NASDAQ and NYSE, and the forex market – were mainly focused. Based on the trading plan and constant update of domestic and international economic news, a possible trend of market movement was suggested by the start of week which determined the overall use of capital. In this process, not only the trading plan and accumulation of background information were used and verified, but also the influence of macro-economy and international diplomatic relations were noticed for their relation with markets. In this process, the trading plan was tested and optimized, the inner relation between markets and other factors were better understood, and the mistakes and success were studied and explained. The conclusion in this part is that the final trading plan is profitable in the market even during financial harshness. Investment in forex market has yielded $25,000 profit and trades in stock market have yielded $5,000 in three months. Detailed information is provided in Chapter 4 and Appendix.
In the third part, the information and data was gathered together as to indicate the overall effectiveness and success of the trading plan. Mistakes and important notes were studies and discussed for further modification of trading strategy. Conclusion was drawn to summarize the overall performance of the trading plan and indicate possible further study about markets.

4
2. BACKGROUND 2-1 Overview of Corporate Finance Basics
2-1.1 Forms of Business Organization
1). Sole Proprietorship A sole proprietorship is a business owned by one person (Ross, Jordon, and Westerfield, 2008, p7). This simple regulated form of business is least regulated, and the number of proprietorships is more than the other forms of business organization. There are two basic features of this kind of business – first, the owner keeps all the profits, and second, the owners had unlimited liability for business debts (Ross, Jordon, and Westerfield, 2008, p7). This means that the creditors can look to the proprietor’s other personal assets for payment. Because there is no distinction between personal and business income, thus all income is only taxed once as personal income.
The limitations of this business are that, the life of business is confined within the life span of the owner, and the money it can raise is limited to the owner’s personal wealth (Ross, Jordon, and Westerfield, 2008, p7). These restrictions determine that the business is less likely to exploit new opportunities due to insufficient capital. Proprietorship also dictates that the business cannot be transferred easily because it requires the sale of the whole business.
2). Partnership A partnership is somewhat similar to sole proprietorship except the number of owners is more than two (Ross, Jordon, and Westerfield, 2008, p7). There are two kinds of partnership – general partnership and limited partnership.
In a general partnership, all the partners share in the profits and loss. And they all have unlimited liability for all partnership debts (Ross, Jordon, and Westerfield, 2008, p7). The profits, or dividends are divided under the so-called “partnership agreement” which can be either formal or informal.
There are two kinds of partners in a limited partnership (Ross, Jordon, and Westerfield, 2008, p8). The general partners will run the business and have unlimited liability, while the limited partnership will only have limited liability which means his/her liability to the debts is only limited to the amount that partner contributes to the partnership.
The advantages and disadvantages of this form of business are similar to those of sole proprietorship (Ross, Jordon, and Westerfield, 2008, p8). The general partners have unlimited liability to the debts, all income are taxed as personal income, the maximum money raised is limited to the combined wealth of the partners, and the difficulty of transferring business.

5
The most prominent disadvantage of our concern is that, the inability of raising money of both proprietorship and partnership set the bounds for the business’s expanding space.
3). Corporation The corporation form of business is of the greatest interest in our IQP. In term of size, corporation is the most important form in the United States. Corporation is a “business created as a distinct entity owned by one or more individuals or other entities” (Ross, Jordon, and Westerfield, 2008, p8). In other words, corporation is regarded as a legal “person” by law, thus it has many rights, duties, and privileges of an actual person. For example, it can own property and borrow money, can legally sue or be sued, and its name can enter the contracts (Ross, Jordon, and Westerfield, 2008, p8).Because corporation is a legal person, it can be a partner in a partnership, and even hold stocks of another corporation.
Because corporation is such a special form of business, to starting procedure is much more complicated than the other two form mentioned above. The forming of a corporation requires several important paperwork including so-called articles of incorporation, and a set of bylaws (Ross, Jordon, and Westerfield, 2008, p8). The article of incorporation must include the name, in intended life, the business purpose of the corporation, and very importantly, the shares that can be issued (Ross, Jordon, and Westerfield, 2008. P8). This article is usually submitted to the state government where the corporation is formed.
The bylaws are autocratic rules of how the corporation will regulate itself. For instance, it will state how the directors are elected, how the dividends are divided, and how the management of the corporation should be (Ross, Jordon, and Westerfield, 2008, p8).
The ruling board is always the stockholders of the corporation, but they are not usually the ones who make the specific decision on how they business should run (Ross, Jordon, and Westerfield, 2008, p8). The stockholders have to select the board of directors who will then select the managers, and it is the managers and the directors who decide how the business will run. Since the directors and managers are selected by the stockholders, they are charged with running the business in the stockholders’ interest. Thus in principle, the stockholders control the corporation.
These features of corporation render several prominent advantages (Ross, Jordon, and Westerfield, 2008, p9). Because the ownership is presented as shares, they can be easily sold or transferred. So the lifespan of the corporation can be unlimited. And because the corporation is regarded as a legal person, it borrows in its own name which results in that the stockholders have only limited liability to the debts owed by the corporation (Ross, Jordon, and Westerfield, 2008, p9). These advantages give the superiority for corporation to raise cash. When corporation wants to raise money, it can sell new shares and attract new investors, thus the number of both owners and equity can be huge.
However, there is also another significant disadvantage. As stated above, the corporation is a legal person distinct from its owners, thus the income which is first earned in the name of

6
corporation then divided to the shareholders, is taxed twice. The first tax is the corporate tax, and the second is that personal income tax as the money actually contributes to the income of each owner. This is called a “double taxation” (Ross, Jordon, and Westerfield, 2008, p10).
4). Limited Liability Company (LLC) Limited Liability Company is relatively young in the history of business. Basically, it is taxed as a partnership but the owners hold only limited liability to the debts (Ross, Jordon, and Westerfield, 2008, p9). Thus, it is the hybrid of corporation and partnership and has the advantages of both. Because of the special advantages LLC enjoys, the criteria of being regarded as one is very strict, and the IRS is the main scorekeeper. The IRS will treat a LLC as corporation unless it meets certain specific criteria.
2-1.2 The Ways of Corporation Raises Money As stated above, the mostly concerned form of business in our IQP is the corporation. When a corporation wants to raise money, there are two ways to do it. They can sell bonds and/or stocks.
2–1.2.1 Overview of Bond In simple words, a bond is an interest-only loan between the buyer and the corporation (Ross, Jordon, and Westerfield, 2008, p163). The buyer of bond lends a certain amount of money to the corporation and the corporation promises to pay the money back after a period of time plus interests during the time. Therefore, buying bond is an investment activity with fixed return.
For instance, a buyer buys $1,000 to a corporation which promise to pay the money back in 5 years with a 12% yearly interest rate. As a result, the buyer will receive $120 each year and gets his $1000 back in five years, so the buyer finally have $1000+$600= 1600$ with $600 as profits. The $1000 is called the face value of the bond, the yearly 12% is called the coupon, and the five years are the bond’s time to maturity (Ross, Jordon, and Westerfield, 2008, p164).
The bond has advantages and disadvantages over a stock.
In the perspective of the corporation, because the bond is an interest-only loan, the bondholder doesn’t have the same right as a stockholder, thus the bondholder cannot participate in the election of directors (Lee, 1999). Also, by issuing bonds not but shares, the corporation avoid diluting the stockholders’ equity, so bond can better serve the financial purpose of the stockholders (Lee, 1999). By eliminating the bank as the middleman in the borrowing process, bond is more efficient and less expensive (Lee, 1999). The disadvantage is that, the bondholder doesn’t have any liability towards the debt, thus no matter the corporation runs well or not, it has to pay the fixed amount of interest.

7
For the buyers, buying bond decreases the risks and guarantees a fixed cash flow before the final payment. On the other hand, because the interest rate is fixed, the profits from a bond are thus limited. So choosing bonds is a trade-off of lower risk for lower profits.
Bonds can be traded in both primary market and secondary market. Primary market is that is the issuer of bond sells bonds directly to the buyers where the secondary market provides a platform for buyers to buy and sell their owned bonds.
Although a fixed-rate bond is the main type of bond, it is not the only type (Ross, Jordon, and Westerfield, 2008, p179). There are also zero coupon bond which sells lower than its face value, and float-rate bonds with non-fixed coupon rate, etc (Ross, Jordon, and Westerfield, 2008, p180-181).
2–1.2.2 Valuing the Bonds The most important feature of a bond is that its interest rate is fixed, but the interest rate in the market is changed (Ross, Jordon, and Westerfield, 2008, p164). When interest rate rises, the value of the future cash flow of a bond declines. Vice versa, the bond is worth more when the interest rate is low. So, if the information of a bond is known, the present value of the cash flows as an estimate of the bon’s current market value can be calculated.
The total value of bond can be calculated via the equation below:
As a result, the total market of the bond is the combined value of present value and annuity present value. According to these equations, some the market value of a bond can be equal or even lower than the face value of the bond even though all bonds seem to be able to produce profits to the investors.
2–1.2.3 Risk of Bond The main risk for the value of a bond is the interest value (Ross, Jordon, and Westerfield, 2008, p166). The sensitivity of a bond towards the changing interest rate depends on two things: the time to maturity and the coupon rate. In other words, the longer the time for maturity, the greater the interest rate, and the lower the coupon rate, the greater the risk.
Below is a picture cited from Ross, Jordon, and Westerfield (p167). It illustrates the relation between the value of a bond and the market interest rate. The two bonds are set as having a 10 percent coupon rate.

8
Figure 1 Value of a Bond with 10 Percent Coupon Rate for Different Interest Rate
2–1.2.4 The Moody’s Rating of a Bond Since there are so many corporation issuing bonds, and the values of these bonds are sometimes hard to interpret, companies like Moody’s Investors Service, Fitch IBCA, and Standards & Poor’s Rating Services emerge to be specialized in evaluating the ability of the issuer to repay the bonds (Corporate Bonds Explained, 2010).
Here is the list of Moody’s rating of bonds (Ross, Jordon, and Westerfield, 2008, p178)
AAA - Best quality, with smallest degree of investment risk.
AA - High quality by all standards; together with the Aaa group they comprise what are
generally known as high-grade bonds.
A - Possess many favorable investment attributes. Considered as upper-medium-grade
obligations.
BAA - Medium-grade obligations (neither highly protected nor poorly secured). Bonds
rated Baa and above are considered investment grade.
BA - Have speculative elements; futures are not as well-assured. Bonds rated Ba and
below are generally considered speculative.
B - Generally lack characteristics of a desirable investment.
CAA - Bonds of poor standing.
C - Lowest rated class of bonds, with extremely poor prospects of ever attaining any real
investment standing.

9
2–1.2.5 Overview of Stock Common Stock Features
As its name implies, the term common stock is applied to the stock that has no special preference either in paying dividends or in bankruptcy (Ross, Jordon, and Westerfield, 2008, p212).
The shareholder of common stock has both rights and dividend payment. The most important right is the voting rite to elect the board of directors of the corporation (Ross, Jordon, and Westerfield, 2008, p212). This voting right is also cumulative, meaning that the number of shares determine the number of votes a shareholder has (Ross, Jordon, and Westerfield, 2008, p212). Other rights include sharing proportionally in dividends paid, sharing proportionally in assets remaining after liabilities have been paid, and voting on stockholder matters of great importance, like a merger (Ross, Jordon, and Westerfield, 2008, p214).
Preferred Stock Features
The preferred stock differs from common stock in several ways –“ it has preference over common stock in the payment of dividends, and in the distribution of corporation assets in the event of liquidation” (Ross, Jordon, and Westerfield, 2008, p215). The stockholder of preferred stock can receive the a dividend before the common shareholder are entitled to anything.
The preferred stock has a stated liquidating value (usually $100 per share) and the dividend rate can be either fixed or floating (Ross, Jordon, and Westerfield, 2008, p215). Unlike bond, the dividend of a preferred is usually cumulative. It means that the board of directors may decide not to pay the dividend of preferred stock this year, and the unpaid dividend will carry on and is called arrearage (Ross, Jordon, and Westerfield, 2008, p215). However, the unpaid dividend is not regarded as debt of the corporation.
2–1.2.6 Valuing Stock There are two ways you can make a profit from stocks – stock price and dividend (Ross, Jordon, and Westerfield, 2008, p203). With a fixe required returning rate of investment and known stock prices in a period of time, the value of the stock can be computed through equations.
For example, if the price of the stock in one year will be P1, and the dividend given at the end of the year is D1, and R return of our investment is desired. Thus the present value of the stock can be computed via the following equations,
So, if the stock price of the next year is P2 , and the dividend is D2 with R the same, the present value of the stock will be the following if the stock for two years is held,

10
If this problem is pushed to the infinite future, then the equation would be
This equation has illustrated that the present value equals to all the future dividends when the problem is pushed to infinite future. But it raises another problem – if out condition is infinite future, then the dividends are infinite as well. Thus the present value of the stock still cannot be calculated. As shown by Ross, Jordon, and Westerfield (p205-208), in order to compute the present value of the stock, there are some assumptions to make before doing so to get around this problem. So, the assumptions are basically that you have to be able to predicate the growth rate, and the price of a stock after a period of time and when you are going to sell the stock. However, it is not always easy to do such predictions, and that is why the technical indicators are used to help people predict the forecast of stocks. The detailed and specific valuation of a stock in real-time will be labored later in our project when combining the actual data, indicators and other factors together.
2- 1.3 Risk and Return of Stocks
2–1.3.1 Expected Return The expected return and variance can be computed if enough information helps us predicate the future situation. (Ross, Jordon, and Westerfield, 2008, p336). According to Ross, Jordon, and Westerfield (p337), the expected return can be computed via an equation.
As an example, if two stocks are purchased at that time, L and U. There is a 50% possibility that the economy will be good, and L will give a return of 70%, while U give a return of 30%. There is also 50% possibility that the economy will come to recession, and L will have a 20% loss, while U give a return of 10%. Thus the expected returns are

11
Table 1 Expected Return of a Stock
Stock L Stock U (1)
State of Economy
(2) Probability of
State of Economy
(3) Rate of
Return if State Occurs
(4) Product (2) × (3)
(5) Rate of
Return if State Occurs
(6) Product (2) × (5)
Recession 0.5 -0.2 -0.1 0.3 1.5 Boom 0.5 0.7 0.35 0.1 0.5 Total 1.0 0.25 0.20
However, the expected return is barely certain in real world, and we are more capable of predicting the variance of return rate under different economic situations. So, the calculation in real world will be slightly different. We will cover the actual calculation in later part of our project when we have studied the risks, indicators, indexes, etc.
2–1.3.2 Overview of Portfolio In real world, investors barely hold only individual stock or asset; instead, they would invest a portfolio of stocks and assets. Given this, the portfolio risk and return and of obvious relevance (Ross, Jordon, and Westerfield, 2008, p340). Here the definition of portfolio is introduced, while the calculations towards portfolio will be covered partially in following work.
2–1.3.3 Systematic and Unsystematic Risks The return of a stock consists of two parts, the expected return and the unanticipated part. The unanticipated part is the true risk of a stock (Ross, Westerfield, and Jordon, 2008, p346).
Systematic risk is the one that affects a large number of assets, and its terminology rises from its marketwide effects (Ross, Westerfield, and Jordon, 2008, p346). They are called market risks sometimes.
The systematic risks are usually the uncertainties of economic conditions, such as inflation, exchange rate, GDP, interest rate and inflation (Ross, Westerfield, and Jordon, 2008, p346). For example, exchange rate can largely affect the import and export which then could lead to either an incentive or deterrent for factory production which is ultimately related with job creation or loss. Whether China is a currency manipulator whose currency is suspected to be kept low intentionally is a never-end debate in United States Congress. The lawmakers have long complained that the low appreciation value of Chinese currency has boosted the American import from China, and they claim it is a major reason for job loss in America. Inflation affects wages and the cost of a company, the price of products the company sells, and the asset value of the company.
The unsystematic risks have a narrower effect. It might only influence a single asset or a group of assets. Examples of these risks can be the strike of a single company, or new policies

12
announced of a company. Such risks are unlikely to have an impact on the wider market, but it will affect the company and possibly a few others (Ross, Westerfield, and Jordon, 2008, p346).
Now, if we include the risks of a stock into the equation of return, it would be
The unsystematic risks can be decreased, if not entirely eliminated, by diversification of the portfolio, because the definition of unsystematic risk is that it only affects a limited number of assets. Thus diversification of portfolio is an effective method to lower the unsystematic risks (Ross, Westerfield, and Jordon, 2008, p348).
Figure 2 Risk of Stocks Chart
2–1.3.4 The Beta There is always a reward, on average for bearing risk in a stock market. As we said above, the unsystematic risks can be eliminated at virtually no lost by diversifying your portfolio, so the reward of bearing risk only depends on the systematic risk (Ross, Westerfield, and Jordon, 2008, p350). This is called the systematic risk principle. In other word, “the expected return on an asset depends only on the asset’s systematic risk” (Ross, Westerfield, and Jordon, 2008, p350).

13
Due to the crucial role of systematic risk in calculating expected return, the calculation of it is terribly necessary in investment. Beta coefficient (“β”) is a measure that is widely used (Ross, Westerfield, and Jordon, 2008, p351).By definition, the average asset has a beta of 1.0, and an particular asset with a beta of 0.5 has as half as much systematic risk as an average asset.
Here we cite a figure from Ross, Westerfield, and Jordon (2008, p346) that shows the beta values of some well-known companies.
Table 2 Companies and Their Beta Values
Company Beta Coefficient Coca-Cola 0.60 Kellogg 0.65 Papa John’s 0.80 3M 0.85 Home Depot 1.00 Bed, Bath, and Beyond 1.05 McDonald’s 1.10 American Eagle Outfitters 1.35 Tiffany & Co. 1.55 Continental Airlines 2.40 Source: From Value Line Investment Survey, various issues, 2007.
Therefore, what the beta presents is that, the larger the beta, the more risk, and the more expected return, and vice versa. The beta values are important factors that influence people’s investment decisions. The portfolio betas can be obtained by multiple the percent of portfolio by the beta of that asset, and then add them up (Ross, Westerfield, and Jordon, 2008, p352).
Although the beta values are essential for investment decision, they are not always “true”. The beta values of companies can be found on the website, for example, Yahoo! Finance (finance.yahoo.com), CNN Money (money.cnn.com), etc. The beta values may vary in different sources depending on what their calculation basis is (daily return or monthly, yearly return). Different calculation can produce possibly very divergent beta values. Therefore the beta values are sometimes a poor estimate, but it can still be helpful if you can know how the beta is established (Ross, Westerfield, and Jordon, 2008, p353).
2-2 Fundamental Analysis
2–2.1 Financial Statement As explained in our previous report, the financial statement is a snapshot of the condition of a company and the details revealed in the statement is an important source of information for

14
investment decisions. Here we try to introduce the basics of financial statement, the key concepts, what we are looking for in a statement and how to find the statements.
2–2.1.1 Overview Companies whose shares trade publicly have to file two types of reports each year – annual report to shareholders, and a financial statement required by a government regulator (Stickney, Weil, Schipper, and Francis, 2010, p7). Particularly in the United States, publicly traded companies are required include a Management’s Discussion and Analysis (MD&A), in which management discusses operating results, liquidity, capitol resources, portfolio composition, and risk analysis, etc (Stickney, Weil, Schipper, and Francis, 2010, p7).
As we only regard financial statement as resource of information to help investors relocate their capitol, we will only focus on a few aspects of a company’s financial statement and its supplementary information, including the following:
1. Balance sheet or statement of financial position 2. Income statement or statement of profit and loss 3. Statement of cash flow 4. Statement of shareholders’ equity
2–2.1.2 Balance Sheet In simple words, a balance sheet, or the statement of financial position, is a convenient and means or organizing what a company owns (asset), owes (debt or liability), and the difference (shareholders’ equity) (Ross, Westerfield, and Jordon, 2008, p23). Liquidity means the ease that an asset can be cashed without significant loss of value (Ross, Westerfield, and Jordon, 2008, p25).
Here we cite the balance sheet of Norstrom Inc. from Stickney, Weil, Schipper, and Francis (2010, p11).
In addition to assets, liabilities and shareholders’ equity, the sheet also shows a column named “retained earnings”. This is the accumulative net assets (total assets – total liabilities) a firm derives from its earnings after paying the dividends to the shareholders since the formation (Stickney, Weil, Schipper, and Francis, 2010, p13). For example, the retained earnings in the figure of the year of 2006 is 1,404,366 thousand dollars, which means the accumulative earnings have exceeded the accumulative dividends by $1,404,366,000.
The balance sheet also contains current and noncurrent items as required by U.S. GAAP and IFRS, the government regulators (Stickney, Weil, Schipper, and Francis, 2010, p15). The current items include current assets and current liabilities which are expected to be either sold or paid within the next year (Stickney, Weil, Schipper, and Francis, 2010, p16). The noncurrent items are assets and liabilities that won’t be sold or paid for several years (Stickney, Weil, Schipper,

15
and Francis, 2010, p16). The balance sheet as well represents the historical performance and yearly performance.
Table 3 Nordstrom, Inc. Consolidated Balance Sheet
February 3, 2007
January 28, 2006
Assets Current assets: Cash and cash equivalents $402,559 $465,656 Short-term investments - 54,000 Accounts receivable, net 684,376 639,558 Investment in asset backed securities 428,175 561,136 Merchandize inventors 997,289 955,978 Current deferred tax assets, net 169,320 145,470 Prepaid expenses and other 60,474 55,359Total current assets 2,742,193 2,874,157Land, buildings and equipment, net 1,757,215 1,773,871Goodwill 51,714 51,714Acquired tradename 84,000 84,000Other assets 186,456 137,607Total assets $4,821,578 $4,921,349Liabilities and Shareholder’s Equity Current Liabilities: Accounts payable $576,796 $540,019 Accrued salaries, wages and related benefits 339,965 285,982 Other current liabilities 433,487 409,76 Income taxes payable 76,095 81,617 Current portion of long-term debt 6,800 306,618Total current liabilities 1,433,143 1,623,312Long-term debt, net 623,652 627,776Deferred property incentives, net 356,062 364,392Other liabilities 240,200 213,198Shareholders’ equity: Common stock, no par value: 1,000,000 shares authorized
826,421 685,934
Unearned stock compensation - (637) Retained earnings 1,350,680 1,404,366 Accumulated other comprehensive (loss) earnings (8,580) 2,708Total Shareholders’ equity 2,168,521 2,092,681Total liabilities and shareholders’ equity $4,821,578 $4,921,349
To sum up, the balance sheet is an easy way to look at the performance of a corporation. However, we need to look at more detailed and specific statement to further assess the future of the corporation.

16
2–2.1.3 Income Statement Income statement, also called statement of profit and loss, provides information about profitability (Stickney, Weil, Schipper, and Francis, 2010, p17). Below is a figure of income statement of Norstrom Inc. cited from Stickney, Weil, Schipper, and Francis, (2010, p9).
Table 4 Nordstrom, Inc. Consolidated Statement of Earnings
Fiscal Year 2006 2005 2004Net sales $8,560,698 $7,722,860 $7,131,388Cost of sales and related buying and occupancy costs (5,353,949) (4,888,023) (4,599,388)Gross profit 3,206,749 2,834,839 2,572,000Selling, general and administrative expenses (2,296,863) (2,100,666) (2,020,233)Operating income 909,886 734,171 551,767Interest expense, net (42,758) (45,300) (77,428)Other income including finance charges, net 238,525 196,354 172,942Earnings before income tax expense 1,105,653 855,225 647,281Income tax expense (427,654) (333,886) (253,831)Net earnings $677,999 $551,339 $393,450Earnings per basic share $2.60 $2.03 $1.41Earnings per diluted share $2.55 $1.98 $1.38Basic shares 260,689 271,956 278,933Diluted shares 265,712 277,776 284,533Cash dividends paid per share of common stock outstanding
$0.42 $0.32 $0.24
The income statement reveals the success of a firm in generating asset flow revenues that exceed the asset outflow from expenses (Stickney, Weil, Schipper, and Francis, 2010, p17). Net income, the principle content of the report, indicates the ability of a firm to maximize profits relative to the efforts. The information revealed in income statement are usually included in the balance sheet, however, the income statement shows more details in a specific fiscal period. For example, an income statement may be able to highlight a decreased profit in a fiscal period, and investors can compare the income statements for each fiscal year to assess how the company is performing.
2–2.1.4 Statement of Cash Flows 2 – 2.1.4.1 Overview
The third principle of a financial statement is the statement of cash flow, or sometimes called cash flow statement provides information about cash generated from or used by operating, investing, and financial activities during a fiscal period (Stickney, Weil, Schipper, and Francis, 2010, p19). Below we have cited the cash flow statement of Norstrom Inc. from Stickney, Weil, Schipper, and Francis (2010, p12).

17
Table 5 Nordstrom, Inc. Consolidated Statements of Cash Flows
Fiscal year 2006Operating Activities Net earnings $677,999Adjustments to reconcile net earnings Depreciation and amortization of building and equipment 284,520 Amortization of deferred property incentives and other, net (36,293) Stock-based compensation expense 37,362 Deferred income taxes, net (58,274) Tax benefit from stock-based payments 43,552 Excess tax benefit from stock-based payments (38,293) Provision for bad debt expense 17,064 Change in operating assets and liabilities Accounts receivable (61,301) Investment in asset backed securities 127,984 Merchandise inventories (38,649) Prepaid expenses (4,723) Other assets (7,661) Accounts payable 84,291 Accrued salaries, wages and related benefits 48,719 Other current liabilities 25,533 Income tax payable (5,522) Deferred property incentives 30,723 Other liabilities 17,334Investment Activities 1,142,365Capital expenditures (264,437)Proceeds form sales of assets 224Purchases of short-term investments (109,550)Sale of short-term investments 163,550Sale of short-term investments (8,067)Other, net (8,067)Net cash used in investing activities (218,280)Financing Activities Principal payments on long-term debt (307,559)(Decrease) increase in cash book overdrafts (50,853)Proceeds from exercise of stock options 50,900Proceeds from employee stock purchase plan 16,300Excess tax benefit from stock-based payments 38,293Cash dividends paid (110,158)Repurchase of commons tock (621,527)Other, net 422Net cash used in financing activities (984,182)Net(decrease) increase in cash and cash equivalents (60,097)Cash and cash equivalents at beginning of year 462,656Cash and cash equivalents at end of year $402,559

18
Operating activities usually provide the largest source of cash flow for firms (Stickney, Weil, Schipper, and Francis, 2010, p19). Operating activities are that the firms collect more cash from customers than they pay to suppliers, employees, and others in carrying out the activity. In our example, the Norstrom Inc. has $1,142,365 thousand of operating activity cash flow.
The investing activities include a firm’s expense in buying buildings, equipment and other noncurrent assets to maintain or expand their business, and such activities usually use cash (Stickney, Weil, Schipper, and Francis, 2010, p19). These acquisitions of new noncurrent assets are also called capital expenditures. In the figure above, Norstrom has paid $264,437 thousand in fiscal 2006.
Financial activities refer to firms’ borrowing or investing in the financial market (Stickney, Weil, Schipper, and Francis, 2010, p19). Such activities include issuing bonds or common shares, borrowing money from banks, and repaying long-term debts. In our example, Nordstrom’s statement of cash flows shows that is paid cash to make principle payments on long-term debt equal to $307,559 thousand, it paid $110,158 thousand in cash dividends and used $621,527 of cash to repurchase shares of its common stock.
The statement of cash flows explains the change in cash in a fiscal period, and as well shows the cash flow from each type of activities. Because cash has the most liquidity which is related to the overall health of a company, the statement of cash flow is rather important in assessing a company’s future competence.
2 – 2.1.4.2 Example of Statement of Cash Flows
As an example, we have shown a modified statement of cash flow of Norstrom Inc. cited from Stickney, Weil, Schipper, and Francis (2010, p185).
The statement specifies those cash flows as in operating, investing and financing activity (Stickney, Weil, Schipper, and Francis, 2010, p187).
A financially healthy company can generate sustained and considerable cash inflows from selling or providing service (Stickney, Weil, Schipper, and Francis, 2010, p187). Usually the cash flows presented in operations indicate the excess cash flow after the spending on operating activity. Such excess is usually used to acquire buildings and/or equipment, pay dividends, pay debt, and/or conduct other financial activities.
The second section of the statement represents the cash flows from investing activity (Stickney, Weil, Schipper, and Francis, 2010, p187). This section is usually a major ongoing outflow of cash spent in acquisitions of noncurrent assets, particularly property plant and equipment (Stickney, Weil, Schipper, and Francis, 2010, p187).

19
The cash flows in borrowing, issuing common or preferred shares, or selling bonds fall in the third category – the cash flow in financing activity (Stickney, Weil, Schipper, and Francis, 2010, p188).
Refer to the example statement of cash flow of Norstrom Inc. above; we can spot critical information about the performance and financial health of the company. In the most recent year, the company reports cash flow from operations of $1,142.4 million. In each of the three years, the amount of cash flow from the operations exceeded the cash outflows for investing purposes. A business term, free cash flow, refers to the excess cash flow from operation over investing (Stickney, Weil, Schipper, and Francis, 2010, p189).
Corporations and companies use free cash flow to balance the financial health – pay debt and dividend, repurchase shares and add cash to the balance sheet. From the statement we can specify how the company is utilizing the free cash flow from which we can obtain more information about the current financial situation of the company.
In general, the statement of cash flows reveals more detailed and time-sensitive information about a corporation. Such information is related to the long-term growth, the financial health and the profitability of the corporation.
Table 6 Nordstrom, Inc. Comparative Statements of Cash Flows with Reconciliation of Net Income to Cash Flow from Operation
2006 2005 2004 Cash Provided by Operating Activities Sources of Cash Receipts from Customers $8516 $7728 $7153 Receipts from other Items 430 164 100 Uses of Cash Cash paid for Goods Available for Sale and Occupancy Costs 5308 4877 4547 Cash Paid for Selling, General, and Administrative Expenses 1967 1856 1767 Cash paid for Interest 42.8 45.3 77.4 Cash paid for Income Texes 486 338 255 Net Cash Provided by Operating Activities 1142 776 606 Reconciliation of Net Income to cash provided by Operating Activities Net earnings $678 $551 393 Adjustments to reconcile Net Cash Provided by Operating Activities Depreciation and Amortization of Buildings and Equipment 284 276 264 Amortization of Deferred Property Incentives and Other 36 33 31 Stock Based Compensation Expenses 37 13 8 Deferred Income Taxes 43 41 25 Tax Benefit from Stock-Based Payments 38.3 - - Provision for Bad Debt Expenses 17 21 24 Change in Operating Assets and Liabilities Accounts Receivable 61 15 3 Investment In Assets backed securities 128 135 150 Merchandise Inventions 38 20 11 Prepaid Expenses 5 1 3.2 Other Assets 7.7 3.5 8.1

20
Account Payable 84 31 24 Accrued Salaries 48.7 11.3 15 Other Current Liabilities 24 39 58 Income Taxes Payable 5.5 33.9 19 Deferred Property Incentives 30 50 19 Other Liabilities 17 19 7 Net cash provided by operating activities $1142 $776 $606 Investing activities Capital expenditures $264 $271 $247 Proceeds from Sale of Assets 0.2 0.1 5.5 Purchases of Short term investment 110 542 3232 Sales of Short term investment 163 530 3366 Other NET 8.1 8.3 2.8 Net cash used in Investing Activities $218.3 $292.0 $110.0 Financing Activities Principal Payments $307.6 $101.0 $205.3 Increase n Cash Book Overdrafts 50 5 3 Proceeds from Exercise of Stock Options 51 73 87 Proceeds from Employee Stock Purchase Plan 16 16 13 Excess Tax Benefit 38.3 Cash Dividends Paid 110 87 67 Repurchase of Common Stock 621 287 300 Other NET 0.4 0.8 0.3 Net cash used in financing activities $984.2 $382.1 $476.0 Net increase in Cash $60.1 $102.1 $20.3 Cash at beginning of the year 340 360 340 Cash at end of the year $402.6 $462.7 $360.6
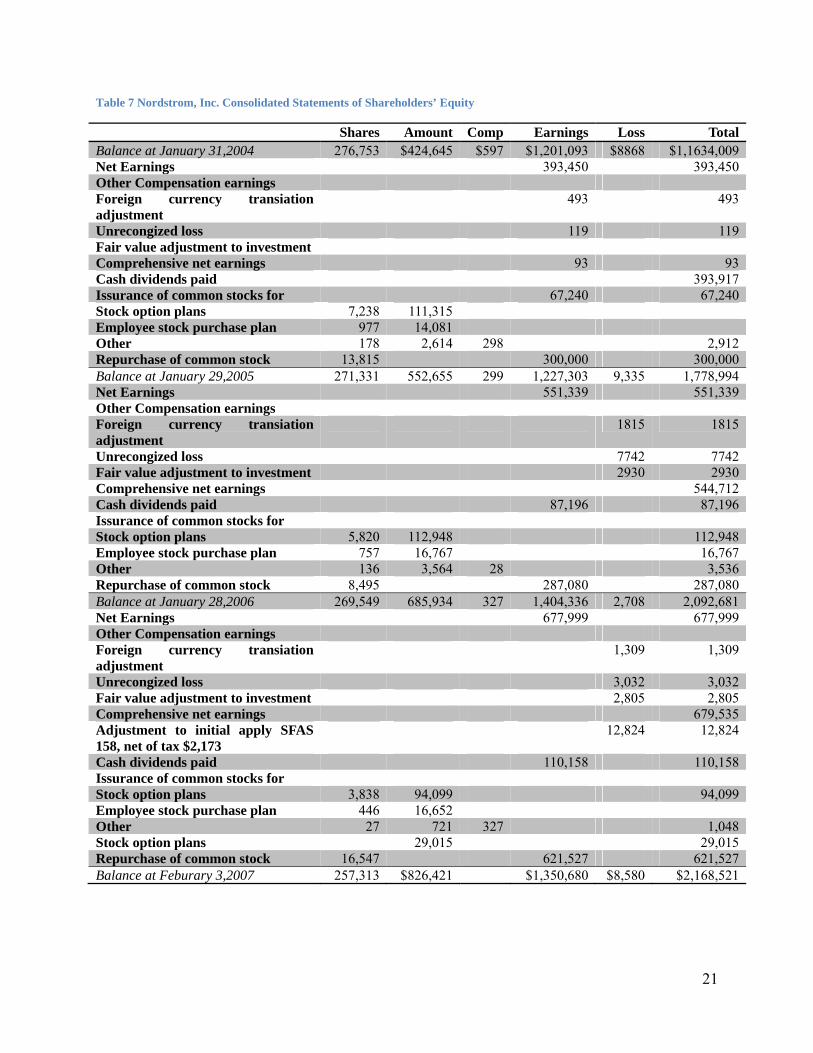
2–2.1.5 Statement of Shareholders’ Equity The last principle of a financial statement is of the direct concern of our study – the statement of the shareholders’ equity. As an example, we have shown the statement of shareholders’ equity of Norstrom Inc. from Stickney, Weil, Schipper, and Francis (2010, p11).
The statement of shareholders’ equity mainly displays the components in shareholders’ equity and the change of them (Stickney, Weil, Schipper, and Francis, 2010, p20). As shown in our example, the statement of Norstrom includes the retained earnings, the net income, the dividend payed and money used to repurchase shares.
21
Table 7 Nordstrom, Inc. Consolidated Statements of Shareholders’ Equity
Shares Amount Comp Earnings Loss Total Balance at January 31,2004 276,753 $424,645 $597 $1,201,093 $8868 $1,1634,009 Net Earnings 393,450 393,450 Other Compensation earnings Foreign currency transiation adjustment
493 493
Unrecongized loss 119 119 Fair value adjustment to investment Comprehensive net earnings 93 93 Cash dividends paid 393,917 Issurance of common stocks for 67,240 67,240 Stock option plans 7,238 111,315 Employee stock purchase plan 977 14,081 Other 178 2,614 298 2,912 Repurchase of common stock 13,815 300,000 300,000 Balance at January 29,2005 271,331 552,655 299 1,227,303 9,335 1,778,994 Net Earnings 551,339 551,339 Other Compensation earnings Foreign currency transiation adjustment
1815 1815
Unrecongized loss 7742 7742 Fair value adjustment to investment 2930 2930 Comprehensive net earnings 544,712 Cash dividends paid 87,196 87,196 Issurance of common stocks for Stock option plans 5,820 112,948 112,948 Employee stock purchase plan 757 16,767 16,767 Other 136 3,564 28 3,536 Repurchase of common stock 8,495 287,080 287,080 Balance at January 28,2006 269,549 685,934 327 1,404,336 2,708 2,092,681 Net Earnings 677,999 677,999 Other Compensation earnings Foreign currency transiation adjustment
1,309 1,309
Unrecongized loss 3,032 3,032 Fair value adjustment to investment 2,805 2,805 Comprehensive net earnings 679,535 Adjustment to initial apply SFAS 158, net of tax $2,173
12,824 12,824
Cash dividends paid 110,158 110,158 Issurance of common stocks for Stock option plans 3,838 94,099 94,099 Employee stock purchase plan 446 16,652 Other 27 721 327 1,048 Stock option plans 29,015 29,015 Repurchase of common stock 16,547 621,527 621,527 Balance at Feburary 3,2007 257,313 $826,421 $1,350,680 $8,580 $2,168,521

22
2 – 2.1.6 Summary
To sum up, the financial statement provides information about the firm’s current position (balance sheet), its profitability (income statement), its cash-generating ability and liquidity (statement of cash flow) and the change in shareholders’ equity. The balance sheet reflects the overall outcome of a fiscal year; the income statement reports the outcome of generating profits while cash flow statement reports the generating of cash within the profits. The statement of shareholders’ equity is the direct measurement of the change of shareholders’ values in the firm.
The financial statement is of both financial and regulatory importance. The government regulator has to examine the statements to avoid possible fraud and regulate the economic activity of companies. The investors need the statement to assess the performance and future profits of the firm to make investment decisions. Therefore, the financial statement will be a key factor in our later study when we focus on the criteria of picking stocks.
2 –2.2 Financial Management and Short-term Financial Planning
2–1.2.1 Overview It is common for companies whose products are time-sensitive for encounter such problems – overproduction and underproduction. Because of an overestimate of demand of digital electronics in the market in the year of the 2007, the chip industry as a whole has produced 4.7 billion excessive chips (Ross, Westerfiled, and Jordon, 2008, p487). For an industry whose products are said “outdated as produced”, such large inventory is a major crisis. Intel, the titan in the industry was forced to drastically decrease the price of their chips because they were going to introduce its next generation of chips soon.
The short-term financial planning is a critical activity that concerns everyone in business, and by understanding the plans of corporations, we may be able to predict the profitability of the corporations. This section is a continuation of the previous one about cash flows as the short-term financing plans usually means the timing of cash flow, and the decisions in such plans typically involve cash inflows and outflows (Ross, Westerfiled, and Jordon, 2008, p488).
2–2.1.2 The Operating Cycle and Cash Cycle The primary concerns in the short-term finance are the operating and financing activities and their cash flows (Ross, Westerfiled, and Jordon, 2008, p490). What we call the operating cycle varies for different types of corporations. The operating cycle of a manufacturing firm start at buying raw materials and ends after selling products and collecting cash. On the contrary,

23
insurance and airline companies start their operating cycle by receiving cash first, and end it by providing the service. As short-term finance is sensitive to timing and cash flow, the operating cycle is very important for the healthy management of a company.
The cash cycle varies for different companies as well. For example, a manufacturing company starts the cash cycle by paying cash for the raw material and ends it by receiving cash from the buyers. It might sound similar to operating cycle. Actually, the real situation is that, when a manufacturing firm acquires the raw material, it might not be asked to pay immediately. The operating cycle starts when they acquire the material, and the cash cycle starts when they actually pay for the material (Ross, Westerfiled, and Jordon, 2008, p491).
Cash cycles can be sources of important information about the operation of the company, and the interpretation of the cash cycle is important in assessing the future performance of the company. The length of cash cycle is directly related with the inventory and receivables periods. The longer the cycle is, the more financing needed (Ross, Westerfiled, and Jordon, 2008, p495). Also, changes in the cash cycle can reflect the early-warning measure. A lengthening cash cycle could mean that the company has problems moving inventory or collecting its receivables. If the cash cycles becomes so long that the company isn’t able to collect enough cash to cover the costs, dividend and/or debt, the company either needs more financing (borrowing from bank or issuing shares and bonds) or it will be bankrupt (Ross, Westerfiled, and Jordon, 2008, p495).
2–2.1.3 Major Aspects of Short-Term Financial Policy The short-term financial policy of a firm will be reflected in at least two ways – 1) the size of the firm’s investment in current assets, and 2) the financing of current assets (Ross, Westerfiled, and Jordon, 2008, p497).
The financing of current assets is measured as proportion of short-term debt and long-term debt used to finance current assets (Ross, Westerfiled, and Jordon, 2008, p497). A restrictive policy means a high proportion of short-term debt while a flexible means a high proportion of long-term debt (Ross, Westerfiled, and Jordon, 2008, p497). High proportion of short-term debt will require the company to sustain a considerable amount of cash flow to pay off the debt in limited time, while the high proportion of long-term debt is less restricted about the level of cash flow a company maintains.
The Size of the Firm’s Investment in Current Assets
The flexible or conservative short-term financial policy would maintain a relatively high ratio of current assets to sales while a restrictive or aggressive policy would do the opposite (Ross, Westerfiled, and Jordon, 2008, p497). A flexible policy would guarantee that the firm can easily

24
turn assets into cash when it’s not able to generate sufficient cash flow or it needs cash before the cash cycle ends.
The flexible policy actions include (Ross, Westerfiled, and Jordon, 2008, p497):
1. Keeping large balance of cash and marketable securities. 2. Making large investments in inventory. 3. Granting liberal credit terms, which result in a high level of accounts receivable.
The restrictive policy actions include (Ross, Westerfiled, and Jordon, 2008, p497):
1. Keeping low cash balances and little investment in marketable securities. 2. Making small investments in inventory. 3. Allowing few or no credit sales, thereby minimizing accounts receivable.
The disadvantage of flexible short-term financial policy is that it is costly because it requires a greater investment in cash and marketable securities and inventory etc (Ross, Westerfiled, and Jordon, 2008, p498). The advantage is that a higher future cash flow is expected. For example, by allowing customers pay in more liberal credit method, it stimulates the sales and provides more cash flow in the future (Ross, Westerfiled, and Jordon, 2008, p498).
On the contrary, a conservative policy is not costly as it minimizes the investment and allow few credit sales, but it reduces future sales level and provides only very limited cash flow in the future (Ross, Westerfiled, and Jordon, 2008, p498).
In other words, the management in current assets is a trade-off between two types of costs – carrying cost which rises as the level of investment rises, and shortage cost which decreases as the level of investment rises (Ross, Westerfiled, and Jordon, 2008, p498). Carrying costs are usually the opportunity costs of investing in current assets because the rate or return of current assets is usually low (Ross, Westerfiled, and Jordon, 2008, p498). The shortage costs are incurred when a company runs out of cash and don’t have enough marketable securities to sell. Shortage costs may also happen when a firm runs out of inventory or cannot extend credit to customers, both of which can result in loss of customers.
As shown by Ross, Westerfiled, and Jordon (2008, p497), the combination of both costs are at minimum when the two costs are the same (intersects in a graph).

25
Figure 3 Carrying Costs and Shortage Costs
Alternative Financing Policies for Current Assets
A growing firm can be considered having two principle characteristics – 1) a general growth trend and 2) seasonal variation (Ross, Westerfiled, and Jordon, 2008, p500).

26
Figure 4 Policy F Performance
Policy F always implies a short‐term cash surplus and a large investment in cash and marketable
securities.
Figure 5 Policy R Performance
The peaks and valleys indicate the total amount of asset needed that time. The blue line is the long-term debt. The red area is the total amount of assets possessed by the company and the blue area indicates the gap between the required and actual assets of the company.

27
The flexible policy graph shows that a company keeps high long-term debt and store marketable securities to buffer the gap between required and actual assets. The restrictive policy applies a low long-term debt and has short-term loans to buffer the gap during variation.
The most important difference is that a company applying flexible policy finances internally, using its own cash and marketable securities and a company using restrictive policy finances externally, borrowing the needed funds on a short-term basis (Ross, Westerfiled, and Jordon, 2008, p501).
Below we show a graph cited from Ross, Westerfiled, and Jordon (2008, p497) to demonstrate the comparison of different financing policy.
2-3 Financial Markets
2-3.1 Stock and stock market Nowadays, stock trading is one of the most common ways of investing and, of course, it is one of the most important topics in our project.
There are four types of corporations that are studied and explained below:
1) Sole Proprietorship
2) Partnership
3) Corporation
4) Limited Liability Company
And among those four types of business above, the corporation form of business is of the greatest interest in our IQP. In term of size, corporation is the most important form in the United States. Corporation is a “business created as a distinct entity owned by one or more individuals or other entities” (Ross, Jordon, and Westerfield, 2008, p8). In other words, corporation is regarded as a legal “person” by law, thus it has many rights, duties, and privileges of an actual person. For example, it can own property and borrow money, can legally sue or be sued, and its name can enter the contracts (Ross, Jordon, and Westerfield, 2008, p8).Because corporation is a legal person, it can be a partner in a partnership, and even hold stocks of another corporation. For most corporations, issuing stock is the most common way to raise the money needed at the beginning of a business.
Common Stock Features
As its name implies, the term common stock is applied to the stock that has no special preference either in paying dividends or in bankruptcy (Ross, Jordon, and Westerfield, 2008, p212).

28
The shareholder of common stock has both rights and dividend payment. The most important right is the voting rite to elect the board of directors of the corporation (Ross, Jordon, and Westerfield, 2008, p212). This voting right is also cumulative, meaning that the number of shares determine the number of votes a shareholder has (Ross, Jordon, and Westerfield, 2008, p212). Other rights include sharing proportionally in dividends paid, sharing proportionally in assets remaining after liabilities have been paid, and voting on stockholder matters of great importance, like a merger (Ross, Jordon, and Westerfield, 2008, p214).
Preferred Stock Features
The preferred stock differs from common stock in several ways –“ it has preference over common stock in the payment of dividends, and in the distribution of corporation assets in the event of liquidation” (Ross, Jordon, and Westerfield, 2008, p215). The stockholder of preferred stock can receive a dividend before the common shareholder are entitled to anything.
The preferred stock has a stated liquidating value (usually $100 per share) and the dividend rate can be either fixed or floating (Ross, Jordon, and Westerfield, 2008, p215). Unlike bond, the dividend of a preferred is usually cumulative. It means that the board of directors may decide not to pay the dividend of preferred stock this year, and the unpaid dividend will carry on and is called arrearage (Ross, Jordon, and Westerfield, 2008, p215). However, the unpaid dividend is not regarded as debt of the corporation.
The expected return and variance can be computed if we have enough information that helps us predicate the future situation. (Ross, Jordon, and Westerfield, 2008, p336). According to Ross, Jordon, and Westerfield (p337), the expected return can be computed via an equation.
As an example, if we have purchased two stocks, L and U. There is a 50% possibility that the economy will be good, and L will give a return of 70%, while U give a return of 30%. There is also 50% possibility that the economy will come to recession, and L will have a 20% loss, while U give a return of 10%. Thus the expected returns are
50% 70% 50% 20% 25%
50% 30% 50% 10% 20%
However, the expected return is barely certain in real world, and we are more capable of predicting the variance of return rate under different economic situations. So, the calculation in

29
real world will be slightly different. We will cover the actual calculation in later part of our project when we have studied the risks, indicators, indexes, etc.
The Stock Exchanges of Today
Securities exchanges today are designed to facilitate and organize the buying and selling of stocks and other securities instantaneously. Two major types of exchanges include the registered exchanges and the OTC market. Registered exchanges include the NYSE and the AMEX, which are linked electronically in order to facilitate trading activity.
Securities that are not traded on one of these two exchanges are traded on the OTC market. Dealers in these stocks must communicate with each other by using a sophisticated buy-and-sell process. This system is known as NASDAQ, where thousands of brokers and dealers communicate electronically to buy and sell shares of specific companies. This system acts as the marketplace and central clearinghouse for trading many smaller company shares. To understand the operations of these exchanges, let us briefly examine each one of them.
New York Stock Exchange (NYSE)
This exchange is the largest equities marketplace in the world. Some 3,000 people work together each day to trade billions of shares of 3025 companies whose combined market capitalization totals $16 trillion. The NYSE represents approximately 80 percent of the value of all publicly owned companies in the U.S.
American Stock Exchange (AMEX)
The AMEX is considered a secondary exchange but is also national in scope. No stocks are listed on either the NYSE or AMEX at the same time. The AMEX is also located in New York City and is distinct from the NYSE in terms of member requirements, specific companies listed, and instruments traded. Because of these differences and the need to give full service, most large brokerage firms are members of both exchanges.
National Association of Securities Dealers Automated Quotations (NASDAQ)
Since its inception in February 1971, NASDAQ has been known as an industry innovator. For example, it was the first in history to use computers to gather and match buy-and-sell orders. During its first year of operation, people used NASDAQ only as a pricing system in order to facilitate trading. After a modest start in 1972, when 2.2 billion shares of 3,500 stocks changed hands, NASDAQ took off in popularity. By 1999, its trading volume had exceeded 270 billion shares, outstripping that of the NYSE by 70 billion shares.

30
2-3.2 Forex Market
2-3.2.1 Forex and Forex market The foreign currency market is the market in which currencies are traded and is also called the forex market. It is the largest, most liquid market in the world with an average traded value that exceeds 1.9 trillion per day and includes all of the currencies in the world. (Investopedia)
However, there is no central marketplace for currency trading. Instead, trade is conducted over the counter. The forex market is open 24 hours a day and the currencies are traded worldwide among the major financial centers including London, New York, Tokyo etc.
The main trading center is London, but New York, Tokyo, Hong Kong and Singapore are all important centers as well. Banks throughout the world participate. Currency trading happens continuously throughout the day; as the Asian trading session ends, the European session begins, followed by the North American session and then back to the Asian session, excluding weekends.
The forex market consists of banks, commercial companies, central banks, investment management firms, hedge funds and retail forex brokers and investors. (Investopedia) It is not dominated by a single market exchange, but contains a global network of computers and brokers all around the world. Central banks use their massive buying and selling capabilities to alter exchange rates through their open market activities. Forex brokers act as market makers as well, and may post bid and ask prices for a currency pair that differs from the most competitive bid in the market.
2-3.2.2 Currency Pairs Currency Pairs stands for two currencies with exchange rates that are traded in the retail forex market. The rates of exchange between foreign currency pairs are calculated as the factor by which a base currency is multiplied to yield an equivalent value or purchasing power of foreign currency. The currency exchange rates of foreign currency pairs float, meaning that they change continually based on a multitude of factors. (Investopedia)
For example, the currency pair USD/JPY represents the number of Japanese Yen that can be brought with one us dollar. When the value of us dollar increases, the currency pair exchange rate will also increase. Meanwhile, when a forex trader shorts the USD/JPY currency pair, he or she is speculating that the value of Japanese Yen will increase in relation to us dollar.
The four major currencies, considered as traded most heavily in the forex market are EUR/USD, USD/JPY, GBP/USD, and USD/CHF.
In the currency pairs, the first currency quoted in a currency pair on forex is called base currency and sometimes referred to as the primary currency. The last currency quoted is called the quote

31
currency. The price represents how much of the quote currency is need currency is needed for you to get one unit of the base currency\
2-3.3 Future Market A futures contract is a standardized agreement between the buyer and seller to buy or sell a specified asset with specified quantity and quality at a specified future date at a specified price agreed at present. In the case of a futures contract, the asset which specified in the agreement could be anything (e.g. agricultural crops, non-ferrous metals, all kinds of fossil fuels) that is capable of trading.
Under most circumstances, futures contracts are used to make profits due to the price differences of the specified asset between today and the future. The buyer in one futures contract, who is agreeing to buy the certain goods at the certain price on a certain date in the future, will make a profit if the future price is lower than the current price. This is said to be in a long position in finance. And the seller in one futures contract, who is said to be in a short position, will make a profit if the future price is higher than the current price.
Figure 6 Forex Market Example Chart
Among all ways of investments, the futures contract is considered as one of the many with rather high-risk. One of the most famous cases of the futures contract is the Tulip Mania back in the 1630s. The tulip was introduced to Europe in the early-16th century and it was shortly thereafter

32
they began to grow tulips in popularity. The flower rapidly became a coveted luxury item and a status symbol. Unlike other flowers, the tulips grow from bulbs, and can be propagated through both seeds and buds. Seeds from a tulip will form a flowering bulb after seven to twelve years. When a bulb grows into the flower, the original bulb will disappear, but a clone bulb forms in its place, as do several buds. Properly cultivated, these buds will become bulbs of their own. People found out that tulip bulbs, which were infected with a virus that could only be found on tulips, known as the “Tulip Breaking Virus”, will result in flowers with amazingly vivid colors and flames on the petals. As the certain kind of tulip became extremely popular, professional growers were paid higher and higher for bulbs with that certain kind of virus. And due to the unique biological feature of tulip, there was a kind of formal futures markets where contracts to buy bulbs at the end of the season was formed in Dutch in 1636. And this was one of the earliest futures contracts known in the history.
As we can tell from the price chart on the left, the price of the tulip bulbs infected with the certain virus kept climbing till throughout 1634, 1635, 1636 and the early 1637 (The Market Oracle, 2008). However in February 1637, tulip bulb contact prices collapsed abruptly and the trade of tulips ground to a halt.
2-4 Indicator Categorization and explanation This part of the report will focus on discussing technical indicators used in daily trading including definition, functions and types of indicator. Types of oscillators will also be discussed.
2-4.1 Definition and functions A technical indicator is series of data points that are derived by applying formula to the price data of a security. Price data includes any combination of the open, high, low or close over a period of time. It is important to mention that these indicators are distinguished by the fact that they do not analyze any part of the fundamental business, like earnings, revenue and profit margins. However, they are in most time used by active traders to analyze the change of price of a particular stock in short term while in long term cases they are only helpful for identifying good entry and exit points for the stock.
A technical indicator offers a different perspective on providing the strength and the direction of the price action. It serves three major functions: to alert, to confirm and to predict. Although indicators provide important statistics for traders, they are not direct reflections of the price action. Sometimes, one certain indicator generate buy and sell signals, the signals should be taken in context with other technical analysis tools. In addition, the same indicator may exhibit different behavioral patterns when applied to different stocks. Considering the big numbers of indicators being used today, it is crucial to choose those offering a different perspective and worthy of attention. (stockcharts)

33
2-4.2 Indicator types This part introduces two important types of indicator.
2-4.2.1 Leading Indicators Leading indicators are indicators that predict the possible trend of a stock in the future, and are less dependent on the previous position of stock price than lagging indicators. Leading indicators are more difficult to be sued, but tend to be more accurate in predicting the stock price.
Momentum is one of the leading indicators. Momentum measures the rate of change of a security price. When the price of a security rises, price momentum increases and when the prices goes faster, the larger the increase in momentum. As a security begins to trade flat, momentum starts to decline from previous high levels. A decline momentum not always means a bad signal; it simply means momentum is returning to a more median level.
Figure 7 Example of Momentum Indicator in NYSE Index
By looking into the chart of IBM, the RSI (a momentum indicator) compares the average price change of the advancing periods with the average change of the declining periods. Basically, the RSI indicates the change rate of price. From middle October to the end of November, RSI rises continuously when the price goes to a relatively high level. And from the beginning of December, the declining momentum shows a tendency that the price would not goes higher since the change rates declines, which can be shown by the fluctuation of price in the December. From this chart, it is clear to see that RSI reacts to more sensitive than price do thus indicate the price tendency.
These early signals can act to deciding the entry and exit points and also act to forewarn against a potential strength or weakness. In a market, the best use is to help identify oversold and

34
overbought conditions. (>70 and <30 in the chart above) Therefore, it indicates the buying and selling opportunities. (“Leading Indicator”, stockcharts)
2-4.2.2 Lagging Indicators These indicators follow the price and are designed to get traders in and keep them in as long as the trend is intact. Therefore, these indicators are not effective in trading sideways markets. If used in trading market, trend-following indicators may give many false signals. Some popular trend-following indicators include moving averages (exponential, simple, weighted, and variable) and MACD.
Figure 8 Example of Lagging Indicators in S&P 500 Index
The chart above shows the S&P 500 within the 20-day simple moving average and the 100-day simple moving average. Using a moving average crossover to generate the signals, there were seven signals over two years covered in the chart. When the index starts to move sideways in a trading range, the whipsaws begin. The signals in Nov. 97, Aug.99 and Sept.99 were reversed in a matter of days. If these moving averages are calculated in longer period of time, there would have been fewer whipsaws. If calculated in shorter period of time, there would have been more whipsaws, earlier signals.
By using the moving average crossovers, one is able to catch a move and remain in a move. However, the signals tend to be late. By the time a moving average crossover occurs, a significant portion of the move has already occurred. The Nov-98 buy signal occurred at 1130, about 19% above the Oct-98 low of 950. (“Lagging Indicator”, stockcharts)
2-4.3 Oscillator Types This part introduces two important types of oscillation.

35
2-4.3.1 Centered Oscillators Centered oscillators fluctuate above and below a central point or line. These oscillators are good for identifying the strength or weakness, or direction, of momentum behind a security's move. In its purest form, momentum is positive when a centered oscillator is trading above its center line and negative when the oscillator is trading below its center line.
Some typical centered oscillators include MACD and ROC. For MACD, it shows both lagging elements and leading elements. Moving averages are lagging indicators while by taking the differences in the moving averages, MACD incorporates aspects of momentum or leading indicators, but still with a bit of lag. For ROC, it is a centered oscillator that also fluctuates above and below zero. When the indicator is above 0, the percentage price change is positive. When the indicator is below 0, the percentage price change is negative.(“Centered Oscillators”, stockcharts)
2-4.3.2 Banded Oscillators Banded oscillators fluctuate above and below two bands that signify extreme price levels. The lower band represents oversold readings and the upper band represents overbought readings. These set bands are based on the oscillator and change little from security to security, allowing the users to easily identify overbought and oversold conditions.
The Relative Strength Index (RSI) and the Stochastic Oscillator are two examples of banded oscillators. For RSI, the bands for overbought and over sold are usually set at 70 and 30 and for Stochastic Oscillator, the bands for overbought and oversold are usually set at 80 and 20. For most banded oscillators, they fluctuate within set upper and lower limits. However, the Commodity Channel Index(CCI) is an example that has no bound. Banded oscillators are best suited to identify overbought and oversold conditions.
2-4.4 Oscillator Signals This part introduces three important types of oscillator signals and their applications.
2-4.4.1 Positive and Negative Divergences Divergences (positive and negative) can serve as a warning that the trend is about to change or set up a buy or sell signal. A positive divergence occurs when the indicator advances and the underlying security declines. A negative divergence occurs when an indicator declines and the underlying security advances.

36
On the Merill Lynch chart above, the thick line is the MACD and the thin line is the 9-day EMA of the MACD. MACD formed a positive divergence in late October when the stock price is going down while MACD advances. And after a few days, the thick line meets the thin line which indicates a bullish crossover. Based on these MACD signals, a buying moment occurs. At that time, the volume of the stock goes dramatically right after these signals appear.
Figure 10 Example of Negative Divergence in International Business Machines
On the IBM chart above, it is clear that the ROC form a negative divergence when the price went up while ROC declined from Dec.1999 to Feb.2000. (Green line and Red line) And in mid
Figure 9 Example of Positive Divergence in Merrill Lynch $ Co., Inc.

37
February, ROC went below zero, which together with the divergence indicates the decline of the stock.(“Divergences”, stockcharts)
2-4.4.2 Overbought and Oversold Extremes Banded oscillators are designed to identify overbought and oversold extremes. In a strong trend, users may see many signals that are not really valid. If a stock is in a strong uptrend, buying on oversold conditions will work much better than selling on overbought conditions.
When the trend is strong, banded oscillators can remain near overbought or oversold levels for extended period. Even when a negative divergence occurs, it is better to follow the big uptrend. On the contrary, when a positive divergence form in a strong bearish trend, the positive one should be considered suspected.
The method to use extremes is when a security is overbought and moves back below the upper level, it is the time to sell it; when a security is oversold and moves back above the lower band, it is the time to buy it. Sometime, these signals are combined with positive and negative divergence and moving average crossover thus reinforce the signals.
Figure 11 Example of Overbought and Oversold Extreme in Cisco Systems, Inc.
The above chart shows how STO changes from the price change of Cisco. The thick black line is STO while the red thin line is a 3-day simple moving average that acts as the trigger line. By analyzing the STO at the beginning of August (green circle), three positive signals for robust buying moment occur: STO reached above its 3-day simple moving average; STO went from

38
oversold to above the line; a positive divergence occurs when STO goes up while the price of CSCO declined. It can be found clearly that when STO reached its overbought line, the price of stock still raised for a long period time(mid Aug to late Sep) until STO went below the overbought line and a negative divergence occurred which strongly shows a good moment for selling.(“Extremes”, stockcharts)
2-4.4.3 Centerline Crossovers Centerline crossover signals apply mainly to centered oscillators that fluctuate above and below a centerline. These signals are used with RSI to validate a divergence or signals generated form an overbought and oversold reading.
A centerline crossover is sometimes interpreted as a buy or sell signal. A buy signal would be generated with a cross above the centerline and a sell signal with a cross below the centerline. For MACD or ROC, a cross above or below zero would act as a signal.
Figure 12 Example of Centerline Crossover in Intel Corp.
On the Intel chart with MACD and ROC, there have been a number of signals generated from the centerline crossover. Some are good signals but many of them are just whipsaws. Therefore, the centerline crossover usually acts as a confirmation signal to validate a previous signal or reinforce the current trend. (“Crossover”, stockcharts)
2-5 Important Indicators This part will focus on introducing some important technical indicators and their applications in trading.
2-5.1 Aroon and Aroon Oscillator Developed by Tushar Chande in 1995, Aroon is an indicator system that can be used to determine whether a stock is trending or not and how strong the trend is and shows wheter a

39
stock is trending or oscillating. The Aroon indicator system consists of two lines, 'Aroon(up)' and 'Aroon(down)'. Arron(up) is the amount of time that has passed between the start of the time period and the point at which the highest price during that time period. If the stock closes at a new high for the given period, Aroon(up) will be +100. Aroon(down) is calculated in just the opposite manner, looking for new lows instead of new highs. When a new low is set, Aroon(down) is equal to +100. (Colby,2002 p102)
When the green lines are always high (close to +100), the stock is in a strong trend of going up. On the contrary, when red lines are in high values, the stock is in a strong trending of going down. In the graph below, it is clearly seen that the stock show strong trend of rising in the last month since the Aroon(up) is always above +50 while the Aroon(down) is below +50.
Figure 13 Apple Inc./Aroon Stock Chart
2-3.12.Aroon Oscillator
Another indicator is called Aroon Oscillator that can be constructed by subtracting Aroon(down) from Aroon(up). Since Arron(up) and Arron(down) goes between 0 and 100, the Aroon

40
Oscillator will oscillator between -100 and +100 with zero at the center. For the same stock in same period of time, the Aroon Oscillator perform like the graph show below. When it is obove zero, the stock is rising. The farther away the oscillatro is from the zero line, the stronger the trend.
Figure 14 Apple Inc./Aroon Oscillator Stock Chart
2-5.2 Average True Range Developed by J. Welles Wilder, the Average True Range (ATR) is an indicator that measures volatility. Wilder created Average True Range in order to measure volatility from gap or limit moves. It is important that ATR only indicate volatility of the price rather the direction.
Strong moves, in either direction, are often accompanied by large ranges, or large True Ranges. Uninspiring moves can be accompanied by relatively narrow ranges. As such, ATR can be used to validate the enthusiasm behind a move or breakout. A bullish reversal with an increase in ATR would show strong buying pressure and reinforce the reversal. A bearish support break with an increase in ATR would show strong selling pressure and reinforce the support break. But it is not always the case. In the graph below, in the rising period of latest time, ATR does not show any signals when it remains in low values. (Colby,2002 p113)

41
Figure 15 Apple Inc./Average True Range Stock Chart
2-5.3 Chaikin Money Flow Developed by Marc Chaikin, the Chaikin Money Flow oscillator is calculated from the daily readings of the Accumulation/Distribution Line. The basic premise behind the Accumulation Distribution Line is that the degree of buying or selling pressure can be determined by the location of the Close relative to the High and Low for the corresponding period There is buying pressure when a stock closes in the upper half of a period's range and there is selling pressure when a stock closes in the lower half of the period's trading range. The Closing Location Value multiplied by volume forms the Accumulation/Distribution Value for each period.
The Chaikin Money Flow oscillator generates bullish signals by indicating that a security is under accumulation. These signals includes the CMF value is greater than zero, and it should also be able to increasing and oscillator above zero. In the same time, the selling signals can be deducted from the contrary condition. In the graph below, Chaikin Money Flow goes from below zero to above in the mid June and beginning of September both provides strong buy signals when the price of certain stock was still oscillatoring or decreasing. Basically, CMF is a non-trend- following volume indicator to indentify buying and selling pressure.(“Chaikin Money Flow”, stockcharts)

42
Figure 16 Apple Inc./Chaikin Money Flow Stock Chart
2-5.4 Commodity Channel Index Developed by Donald Lambert, the Commodity Channel Index (CCI) was designed to identify cyclical turns in commodities. Traders and investors use the CCI to help identify price reversals, price extremes and trend strength. As with most indicators, the CCI should be used in conjunction with other aspects of technical analysis. CCI fits into the momentum category of oscillators. In addition to momentum, volume indicators and the price chart may also influence a technical assessment. It is approximately 70 to 80 percent CCI falls in the range of -100 to +100.
Because of this certain aspect, CCI generates a buy or sell signal when it goes from the outside range into the range -100 and +100. To be specific, when the CCI moves above +100, a security is considered to be entering into a strong uptrend and a buy signal is given. The position should be closed when the CCI moves back below +100. When the CCI moves below -100, the security is considered to be in a strong downtrend and a sell signal is given. The position should be closed when the CCI moves back above -100. In the same way, CCI can be used to identify overbought and oversold levels when CCI goes out of the range.
The graph below shows the Commodity Channel Index in terms of Apple Inc. The most outstanding buy signals at the beginning of Sept when CCI goes from negative to positive and

43
then in very short time goes to the overbought range of +100 and remains in most time from then. In this period of time, the price of apple goes up really fast. (Colby,2002 p155)
Figure 17 Apple Inc./Commodity Channel Index Stock Chart
2-5.5 Coppock Curve The Coppock curve or Coppock indicator is a technical analysis indicator for long-term stock market investors created by E.S.C. Coppock. It is a long term price momentum indicator used primarily to recognize major bottoms in the stock market. It is an excellent tool for discriminating between bear market rallies and true bottoms in the stock market.
A buy signal is generated when the indicator is below zero and turns upwards from a trough. The indicator is trend-following, and based on averages, so by its nature it doesn't pick a market bottom, but rather shows when a rally has become established. In the graph below shows some bug signals when Coppock Curve is below zero and turn above the line. (Colby,2002 p168)
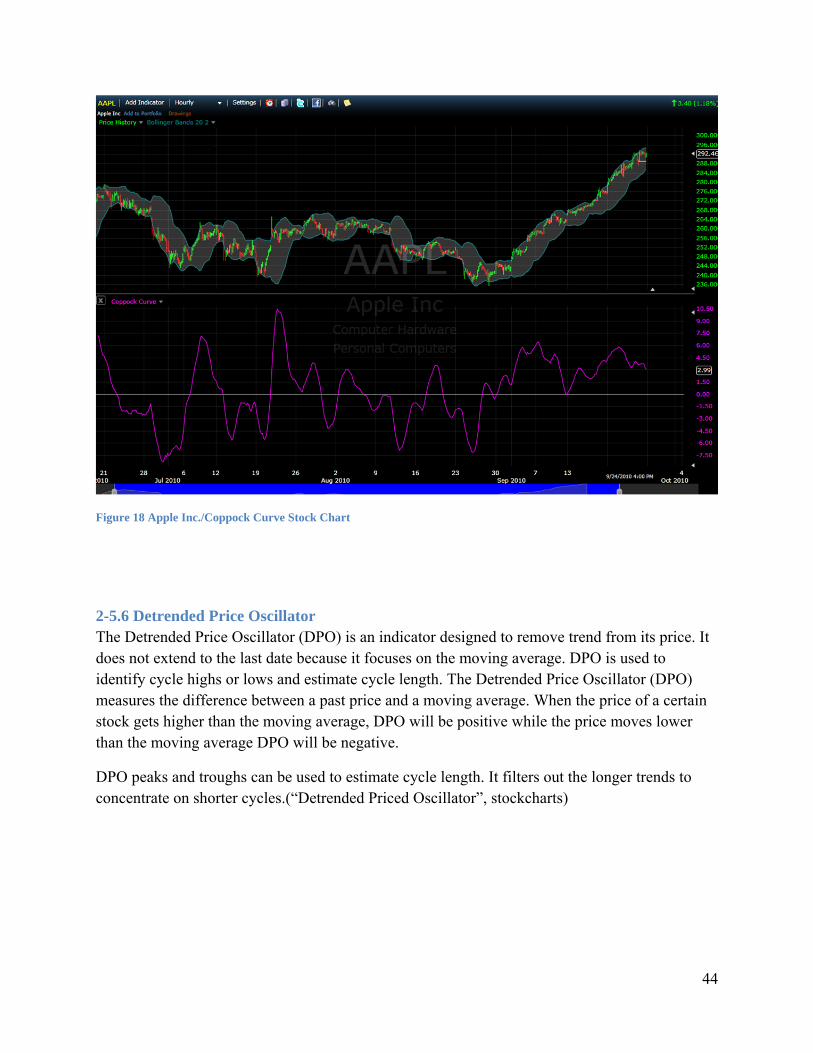
44
Figure 18 Apple Inc./Coppock Curve Stock Chart
2-5.6 Detrended Price Oscillator The Detrended Price Oscillator (DPO) is an indicator designed to remove trend from its price. It does not extend to the last date because it focuses on the moving average. DPO is used to identify cycle highs or lows and estimate cycle length. The Detrended Price Oscillator (DPO) measures the difference between a past price and a moving average. When the price of a certain stock gets higher than the moving average, DPO will be positive while the price moves lower than the moving average DPO will be negative.
DPO peaks and troughs can be used to estimate cycle length. It filters out the longer trends to concentrate on shorter cycles.(“Detrended Priced Oscillator”, stockcharts)

45
Figure 19 Apple Inc./Price Oscillator Stock Chart
2-5.7 Average Directional Index The ADX indicator, which stands for Average Directional Index, measures the strength of a trend and can be useful to determine if a trend is strong or weak. High readings indicate a strong trend and low readings indicate a weak trend. When this indicator is showing a low reading then a trading range is likely to develop. Those stocks that show high reading and avoid those with low readings should draw attentions. It's important to determine whether the market is trending or trading (moving sideways), because certain indicators give more useful results depending on the market doing one or the other.(“ADX indicator”, swing-trade-stocks)
If ADX is between 0 and 25 then the stock is in a trading range. It is likely just chopping around sideways. These stock tends to be weak. Once ADX gets above 25 then you will begin to see the beginning of a trend. Big moves tend to happen when ADX is right around this number. When the ADX indicator gets above 30 then a stock is very likely in a strong trend! The Average Directional Index is rarely passing the line of 50. Once it gets that high, trends come to an end and trading ranges developing again.
This is a good indicator that can give one who is choosing stocks to buy first impression that if this stock is in a strong trend of rising or falling. Many rising and falling of the ADX indicator

46
happen. However, this only shows the trend is getting weak although in many cases, the price is still rising. And those high readings indicate that the trend will be come to an end.
Figure 20 JC Penny Co. Inc/Average Directional Index Stock Chart
When ADX begins to weaken from above 40 and moves below 40, it is a sign that the current trend is losing strength and a trading range could develop.
2-5.8 Bollinger Bands Bands and pulls back a little bit. In the second time of rising, the price may goes higher than the first time, however will not exceed the upper Bollinger Bands. (When studing various stock indicators, this kind of pattern can also be found in other indicator graph which also shows the trend of these indicators by adding bowlinger bands to them.)
is in a higher level. In the first time, the prive may hit or breaks over the upper bands of Bowlinger
This indicator consists of three lines; the middle line is an exponential moving average of price data and the two outside bands are equal to the moving average plus or minus standard deviation where Standard Deviation is a statistical measure that indicates volatility of price. The bands will expand when price becomes volatile and they will contract during less volatile periods.
Bollinger Bands are used to determine the boundaries of market movements. If a market moved to the upper band or lower band, then there was a good chance that the market would move back to its average. In the other words, when price closes to upper band, market is overbought and

47
when price closes to lower band, market is oversold. Another using of Bollinger bands is that to indicate up-trends and down-trends. If price deflects off the lower band and crosses above moving average then price fluctuate between upper band and moving average, it comes to indicate upper price target. (Colby, 2002 p114)
Bolinger Bands are applied to predict the rising and falling of the price of the stock. The two big signals which Bolinger Bands may indicate are the W-Bottoms and M-Tops. The W-Bottoms occurs when price falls below the lower bound and bounce a little bit and falls for a second time. This time the price may deceases to a lower level than the first one. However, it stops above the the lower bound of the Bolinger Bands. It attracts attention since this in most cases show the falling trend coms to an end and a resistance break. M-Tops on the contrary occurs when price
Figure 21 SNDK/W-Bottoms Stock Chart
Figure 22 XOM/M-tops Stock Chart

48
2-5.9 Donchian Channel The Donchian channel is an indicator used in market trading developed by Richard Donchian. It is formed by taking the highest high of the daily maxima and the lowest low of the daily minima of the last n days, then marking the area between those values on a chart. The Donchian channel is a useful indicator for seeing the volatility of a market price. If a price is stable the Donchian channel will be relatively narrow. If the price fluctuates a lot the Donchian channel will be wider. Its primary use, however, is for providing signals for long and short positions. If a security trades above its highest n day high, then a long is established. If it trades below its lowest n day low, then a short is established..
Figure 23 Apple Inc./Dochian Channel Stock Chart
2-5.10 Ease of Movement Ease of movement is an indicator used in technical analysis to relate an asset's price change to its volume. Ease of Movement was developed by Richard W. Arms, Jr and highlights the relationship between volume and price changes and is particularly useful for assessing the strength of a trend. High positive values indicate the price is increasing on low volume: strong negative values indicate the price is dropping on low volume. The moving average of the indicator can be added to act as a trigger line, which is similar to other indicators like the MACD

49
Figure 24 Apple Inc./MACD Stock Chart
2-5.11 Force Index The Force Index (FI) is an indicator used in technical analysis to illustrate how strong the actual buying or selling pressure is. High positive values mean there is a strong rising trend, and low values signify a strong downward trend. The FI is calculated by multiplying the difference between the last and previous closing prices by the volume of the commodity, yielding a momentum scaled by the volume. The strength of the force is determined by a larger price change or by a larger volume.
Figure 25 Apple Inc./Force Index Stock Chart

50
2-5.12 Keltner channel Keltner channel is a technical analysis indicator showing a central moving average line plus channel lines at a distance above and below. The indicator is named after Chester W. Keltner (1909-1998) who described it in his 1960 book How To Make Money in Commodities. But this name was applied only by those who heard about it from him, Keltner called it the Ten-Day Moving Average Trading Rule and indeed made no claim to any originality for the idea. The lines above and below are drawn a distance from that centre line, a distance which is the simple moving average of the past 10 days' trading ranges (ie. range high to low on each day). The trading strategy is to regard a close above the upper line as a strong bullish signal, or a close below the lower line as strong bearish sentiment, and buy or sell with the trend accordingly, but perhaps with other indicators to confirm. The origin of this idea is uncertain. Keltner was a Chicago grain trader and perhaps it was common knowledge among traders of the day. Or in the 1930s as a young man Keltner worked for Ralph Ainsworth (1884-1965) backtested trading systems submitted when Ainsworth offered a substantial prize for a winning strategy, so it could have been among those. But ideas of channels with fixed-widths go back to the earliest days of charting, so perhaps applying some averaging is not an enormous leap in any case. Later authors, such as Linda Bradford Raschke, have published modifications for the Keltner channel, such as different averaging periods; or an exponential moving average; or using a multiple of Wilder's average true range (ATR) for the bands. These variations have merit, but are often still just called Keltner channel, creating some confusion as to what exactly one gets from an indicator called that.
Figure 26 Apple Inc./Keltner Channel Stock Chart

51
2-5.13 Mass index The mass index is an indicator, developed by Donald Dorsey, used in technical analysis to predict trend reversals. It is based on the notion that there is a tendency for reversal when the price range widens, and therefore compares previous trading ranges (highs minus lows). Mass index for a commodity is obtained by calculating its exponential moving average over a 9 day period and the exponential moving average of this average (a "double" average), and summing the ratio of these two over a given amount of days (usually 25). According to Dorsey, a so-called "reversal bulge" is a probable signal of trend reversal (regardless of the trend's direction). Such a bulge takes place when a 25-day mass index reaches 27.0 and then falls to below 26 (or 26.5). A 9-day prime moving average is usually used to determine whether the bulge is a buy or sell signal. This formula uses intraday range values: not the "true range," which adjusts for full and partial gaps. Also, the "bulge" does not indicate direction.
Figure 27 Apple Inc./Mass Index Stock Chart
2-5.14 Money Flow Index Money Flow Index (MFI) is an oscillator calculated over an N-day period, ranging from 0 to 100, showing money flow on up days as a percentage of the total of up and down days. Money flow in technical analysis is typical price multiplied by volume, a kind of approximation to the dollar value of a day's trading. MFI is used as an oscillator. A value of 80 is generally considered overbought, or a value of 20 oversold. Divergences between MFI and price action are also considered significant, for instance if price makes a new rally high but the MFI high is less than its previous high then that may indicate a weak advance, likely to reverse. It will be noted the MFI is constructed in a similar fashion to the relative strength index. Both look at up days against total up plus down days, but the scale, i.e. what is accumulated on those days, is volume

52
(or dollar volume approximation rather) for the MFI, as opposed to price change amounts for the RSI. It's important to be clear about what "money flow" means. It refers to dollar volume, i.e. the total value of shares traded. Sometimes finance commentators speak of money "flowing into" a stock, but that expression only refers to the enthusiasm of buyers (obviously there's never any net money in or out, because for every buyer there's a seller of the same amount). For the purposes of the MFI, "money flow", i.e. dollar volume, on an up day is taken to represent the enthusiasm of buyers, and on a down day to represent the enthusiasm of sellers. An excessive proportion in one direction or the other is interpreted as an extreme, likely to result in a price reversal.
Figure 28 Apple Inc./Money Flow Index Stock Chart
2-5.15 Moving average Moving average, also called rolling average, rolling mean or running average, is a type of finite impulse response filter used to analyze a set of data points by creating a series of averages of different subsets of the full data set. Given a series of numbers and a fixed subset size, the moving average can be obtained by first taking the average of the first subset. The fixed subset size is then shifted forward, creating a new subset of numbers, which is averaged. This process is repeated over the entire data series. The plot line connecting all the (fixed) averages is the moving average. Thus, a moving average is not a single number, but it is a set of numbers, each of which is the average of the corresponding subset of a larger set of data points. A moving average may also use unequal weights for each data value in the subset to emphasize particular values in the subset. A moving average is commonly used with time series data to smooth out short-term fluctuations and highlight longer-term trends or cycles. The threshold between short-term and long-term depends on the application, and the parameters of the moving average will be

53
set accordingly. For example, it is often used in technical analysis of financial data, like stock prices, returns or trading volumes. It is also used in economics to examine gross domestic product, employment or other macroeconomic time series. Mathematically, a moving average is a type of convolution and so it is also similar to the low-pass filter used in signal processing. When used with non-time series data, a moving average simply acts as a generic smoothing operation without any specific connection to time, although typically some kind of ordering is implied.
Figure 29 Apple Inc./Moving Average
2-5.16 Multiple indicators application First of all, the price chart for APPL last week is shown as below.
As shown in the figure below, the Bollinger Bands indicator is already applied on this chart. On September the 10th, which is the Friday of the week before last week, a strong “Buy Signal” from the Bollinger Bands indicator is caught, where the price keeps falling and touches the lower band. On September the 13th which is the Monday of last week, the price shoots out of the upper band and this is considered as a very strong “Sell Signal” for the Bollinger Band indicator. The price goes from $263 to $267 and if all of the AAPL stocks hold is sold, a nice cut of price difference at 4 dollars per share is realized.

54
Figure 30 Apple Inc./Multiple Indicator Applications
However, the price of AAPL keeps climbing and reaches a peak price at $277. And throughout the whole week there is not a single “Buy Signal” from the Bollinger Bands indicator and it is more than obvious that a great chance of making more money is lost on this climbing trend. And this is a perfect example that how unwise it is to stick to a single indicator.
Therefore, discussion on multiple indicators application is essential in making best decision and will start from here.
Bollinger Bands / RSI
Continuing the topic of making a better decision, the goal is to look for an indicator that can monitor the trend better than the Bollinger Bands. Meanwhile, RSI is also picked. And here is the detail definition for RSI.
The Relative Strength Index (RSI) indicator calculates a value based on the cumulative strength and weakness of price, specified in the input Price, over the period specified in the input Length. For that number of bars, RSI accumulates the points gained on bars with higher closes and the points lost on bars with lower closes. These two sums are indexed, with the index plotted on the chart. The RSI plots as an oscillator with a value from 0 to 100. The direction of RSI should confirm price movement. For example, a rising RSI confirms rising prices.
RSI can also help identify turning points when there are non-confirmations or divergences. For example, a new high in price without a new high in RSI may indicate a false breakout. RSI is also used to identify overbought and oversold conditions when the RSI value reaches extreme highs or lows. This indicator automatically changes the color of the RSI plot when it exceeds

55
either of the levels specified in the inputs Over Sold and Over Bought. Horizontal reference lines are also plotted at these levels as visual aids.
Figure 31 Apple Inc./Bollinger Bands/RSI
The combined charts focus on the beginning part of September the 13th. A“Sell Signal” for the Bollinger Bands (price goes over the upper band) showed up first. At the same time, the RSI band went over the upper limit as well, but this is not the “Sell Signal” for RSI yet. The price kept going up until the “Sell Signal” for the RSI indicator showed. And compared to the discussion at the beginning of this report, if a trade of buying shares is made when both signals show up (at the time where the white vertical line shows), one dollar more on every single share sold can be realized, which is a 25% increase in profit.

56
Concerning the second part of the definition of the RSI indicator, the RSI band is not a simply monitor of the price value. It also monitors the degrees of overbought and oversold. Therefore, a wide horizontal line is added in white at the mid point of the upper limit and lower limit of RSI, and the RSI band never fall below the mid-point since September the 13th. This means that the stock was kept at a specific point right below the limit of overbought. In another word, the RSI was changing quite stably between 70 and 50 (the upper half) means the price was climbing at a low but stable rate. And the real time data confirmed the results, on September the 13th, 14th, and 15th, the RSI started at 70, ended at 70, and never fell below the 50 point. In the same period of time, the price of AAPL climbed from $266 to $272.
On September the 16th, the RSI band went over the upper limit and it was a “Get Ready Signal” from the RSI indicator, and it was followed by the “Sell Signal” from the Bollinger Band. From the experience from the earlier discussion, at this particular moment, the wise choice is to wait till the RSI confirm with its own “Sell Signal”. But from the chart, the RSI value went over 90, this meant that the stock was way too Over Bought and this is a “Must Sell Signal” from the RSI.
And a buying decision is to made when the Bollinger Band said “Sell!” and the RSI said “MUST SELL!” Compare to the decision in the earlier discussion, this decision brought an amazing profit of 13 dollars per share. And the real-time price confirmed the “Must Sell Signal” from the RSI. The price felled from $276 to $273 within 30 minutes.
Conclusion
This is a really simple multiple-indicator application, and only two indicators are applied, the Bollinger Bands and the RSI. But it makes a giant difference by simply add another indicator into consideration.
2-6 Company and stock This part will focus on discussing the relation between the profits of a certain company and its stock performance.
2-6.1 Stock price Factors
Stock prices are affeceted by business fundamentals, company and world events and human psycholgy. One of the main business factors in determines a stock’s price is a company’s earnings, including the current earnings and estimated future earnings. An economic change in the fundamentals of a business will immediately affect the price. The opposite is also true, a

57
company whose profits are flat or falling without a visible change in business dynamics will continue to fall as investors abandon the stock. News from the company and some global news also affects the price a lot. These news includes layoffs, store closings and hiring new or firing of CEO or Company Officials from the company. Some examples of national and world events are oil prices, inflation, and terrorist attacks.
2-6.2 Case study of Apple Inc.
Figure 32 Apple Inc./Indicators Stock Chart
The graph above shows the stock price from 2003 to 2010(now) and some big events in the Apple Inc. history that affects the pattern of price and for Average Directional Index.
On the World Deverloper Conference keynot address on June 6, 2005, Steve Jobs announced that Apple would begin producing Intel- based Mac computers. And on the following Janurary, new Macbook Pro and iMac and by August 7,2006, Apple had transmitted all its Mac products to Intel- Based chips. From the graph a strong rising trend of rising shown in the ADX started from approximately 29 to nearly 60. Apple achieved significant success during this period of time and in Janurary 2006, Apple’s market cap surpassed that of Dell.
The second rising period occurs right after Jobs’ announcement that company would no longer focus on personal computers singularly. Instead, company will shift their emphasis to mobile electronic devices. And with the birth of iPhone and Apple TV, Apple shares hit its highest price $97.80. And in May, Apple’s share price passed the $100 mark. In July of the following year, Apple launched the App Store to sell third-party applications for the iPhone and iPod Touch. Within a month, the store sold 60 million applications and brought in $1 million daily on average.

58
The third rising period appears at the beginning of 2009 and up to now. Its price has surpassed 200 dollars. This may due to the great sale record that Apple achieved its best non-holiday quarter with a revenue of $8.16 billion and a profit of $1.21 billion. Indicator ADX went from 23 to 64 in this bullish period. Recently, with the announcement of iPad, the price even reached 277 on June 25th 2010.
Those big event indefinately give a difference to the stock price of Apple Inc. And the world witnesses a big advance after Apple’s shift to electronic device. Every time, investors’ passion largely increased with the announcement of new generation of device.

59
3. Methodology 3.1InstructionThe general goal for all investments would always be making a profit. The idea is extremely simple: “Buy at low price and sell at high price.” But with the price changing every single minute and being surprisingly unpredictable, to make the right decision for more than half of the times have become pretty an achievement for a trader. In this project, all kinds of possible technics would be applied in order to make the most reasonable decision to take advantage of the unpredictable price changing.
3.2DataCollecting&ProcessingThe Tradestation is used as the main source of all the price information, ranging from stock price of all stock exchanges to the price ratio between all foreign currency pairs. Different indicators will be applied to the price data, monitoring different features of the price trends, such as the resistance, the moving average, the momentum and so on. Apart from the straightforward information as the price rate, all the other useful information, such as related news, which is available on the Internet, will be taken into consideration and work as guidelines during the evaluating process. The frequently used resources include finviz.com, yahoofinance.com, Wallstreet Journal and so on.
3.3DecisionMakingDecision making the final process which takes everything counted. With the feedback from all the tools that applied, a finalized decision on the certain trading subject is formed and will be executed according to the trading plan, which is another essential tool applied in this project.
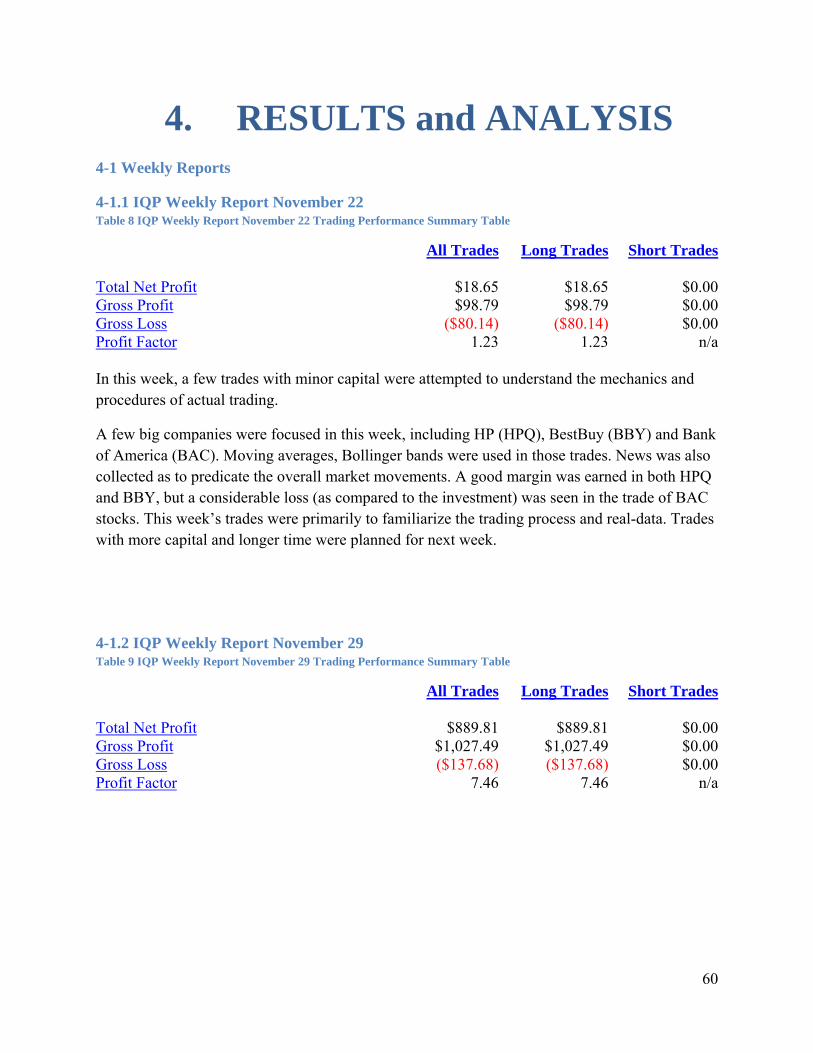
60
4. RESULTS and ANALYSIS 4-1 Weekly Reports
4-1.1 IQP Weekly Report November 22 Table 8 IQP Weekly Report November 22 Trading Performance Summary Table
All Trades Long Trades Short Trades
Total Net Profit $18.65 $18.65 $0.00Gross Profit $98.79 $98.79 $0.00Gross Loss ($80.14) ($80.14) $0.00Profit Factor 1.23 1.23 n/a In this week, a few trades with minor capital were attempted to understand the mechanics and procedures of actual trading.
A few big companies were focused in this week, including HP (HPQ), BestBuy (BBY) and Bank of America (BAC). Moving averages, Bollinger bands were used in those trades. News was also collected as to predicate the overall market movements. A good margin was earned in both HPQ and BBY, but a considerable loss (as compared to the investment) was seen in the trade of BAC stocks. This week’s trades were primarily to familiarize the trading process and real-data. Trades with more capital and longer time were planned for next week.
4-1.2 IQP Weekly Report November 29 Table 9 IQP Weekly Report November 29 Trading Performance Summary Table
All Trades Long Trades Short Trades
Total Net Profit $889.81 $889.81 $0.00Gross Profit $1,027.49 $1,027.49 $0.00Gross Loss ($137.68) ($137.68) $0.00Profit Factor 7.46 7.46 n/a

61
Stocks
Figure 33 BBY Trading Chart
BBY BestBuy
Buying Reasons: holiday season is always a bonanza for retailers list BestBuy. They have a good second quarter and third quarter report and the last report (which ends after Jan to include the holiday season) is expected to be the best one. Thus we would keep an eye on this stock over the winter.
Selling Reasons: The stockmarket will be closed over the Thanksgiving break. There might be too many factors going on and we don’t know what to expect after the break. We feel it is safer to sell them before the start of the break. Approaching the end of Nov. 22, the price went high and we sold them.
FOREX

62
Figure 34 EURUSD Trading Chart
Figure 35 EURAUD Trading Chart

63
EURAUD and EURUSD
Summary: we have sold out all the EURAUD pair when we felt like the deal is good enough. But we still keep 400,000 EURUSD.
Buying reasons: the EUR was largely hit by the Ireland financial crisis which causes the concern about the future economy of the whole euro zone. But we believe that the crisis is not strong enough to affect the large trend of Europe economy. First, the financial crisis so far is only concentrated on the “periphery” countries of euro zone – Ireland, Greece, and potentially Portugal and possibly Spain. The “core” countries of euro zone – France, Germany – have so far shown only delightful recovery from the financial crisis back to 2008. Germany is behaving very strongly in the second and third quarter of this year. So we believe that it is just a matter of time for euro to come back.
Second, the AUD is overvalued. The price of AUD has been surging in the previous months due to the large cash flow from China to Australia. It is not surprising that the currency is going high, especially then the Chinese currency is surging as well. But we know a few facts – China will increase its currency value, but only gradually with fluctuation, thus we would see the inflow of money to Australia plateau in the near future; the surging value of AUD will hurt the Australian economy, in other word, the Australians will find them beaten in the export game after the Chinese investment stops to increase at a certain rate, so it is a matter of time for AUD to come down.
Third, the USD is facing probable inflation. After the Federal Reserve printing 600 billion dollars to “quantitative easing” the U.S. currency, it is almost certain that the U.S. dollars would face inflation and go down in value. But we are very cautious about relating the currency value and national economy here. We do believe that the U.S. economy will be stable, but the number of currency in the market has determined the direction of the currency.
Based on the facts above, we are keeping an eye on these two pairs of currency and we are deliberately looking for the “valleys” of the charts. We do understand that so far they seem to be a bad deal as both of them are plunging. But in long term (like 1 to 3 month), we have faith we would be able to make profits from them.
Selling Reasons: We have shorted some of the deals to start our trial. We intend to keep them but we also aim at doing short deals to make some profits. Long-term is of our interest as well.

64
Figure 36 GBPJPY Trading Chart
GBPJPY
Buying Reason: it is a test-run to get a feeling about the general forex trading. But we made a bad deal here. We intend to keep it for a couple of more days.
4-1.3 IQP Weekly Report December 6
Table 10 IQP Weekly Report December 6 Trading Performance Summary Table
All Trades Long Trades Short Trades
Total Net Profit $2,483.42 $7.83 $2,475.59Gross Profit $11,002.83 $8,527.24 $2,475.59Gross Loss ($8,519.41) ($8,519.41) $0.00Profit Factor 1.29 1.00 n/a
Weekly News Recap
The headlines of this week include the hope and pessimism about U.S. economy, the South and North Korea disputes, and Euro zone crisis.

65
Starting in robustness of rising in the first couple of days but then plunged into the old tatters again this week, the U.S. economy finds itself still far from real recovery. The investors’ confidence has been seriously challenged by a series of bad and good reports. The turning point of this week is that a report has shown the unemployment rate is dropping from 9.6% to 9.8% disappointing the expectation that it would improve. The stock market has risen impressively and then plateaus and drops down sharply. USD value has also been decreased by this news.
The North and South Korea changed fire in this week, resulting in two deaths and several injuries of South Koreans. U.S navy has conducted a bilateral maneuver with South Korean navy and Japanese navy separately near the China Yellow See. This news has threatened the consumers’ and investors’ confidence in U.S. economy as the tension intensifies.
The Euro crisis has endangered the unity of the EU. A protest in Germany happened this week against the bail-out of Ireland and any future plans of bail-outs as Germany is the major creditor. Germany chancellor Ms. Merkel has expressed her concerns about the currency and mentioned the Euro agreement obviously excludes “bail-out”. The turnout of Ireland bail-out seems successful thus it stabilizes the investors’ confidence in the currency.
Our prospects about next week is that, the U.S. stock market would only have minor increase and possibly plateau or drop most of the time. USD value will drop in the first few days but could come back a little later. EUR will remain its current position with minor increase. Thus we are thinking about investing a few stocks based on daily news and focus on the currency pairs EURUSD, USDAUD, USDCAD, and USDJPY.
Weekly Trade Recap
Forex

66
Figure 37 EURUSD Trading Chart
Fig. 44 EURUSD Trading Chart
The seemingly successful turnout of Ireland bail-out has stabilized the euro, the increase of euro value is seen. We made a few mistakes when determining the valley point of euro value. As a result, a few bad trades were made. However, the lowest point of EURO value was successfully identified and turned into profits. The lesson here is that patience is important, and decision shouldn’t be rushed. We lost about $8,000 and made around $8,700 later, resulting in a 700ish profit.
Figure 38 GBPJPY Trading Chart

67
This is a trade based on just looking at the chart. We bought JPY as we thought the GBP has risen too much in last few months and it might fall down due to the influence from EURO. This short trade results in a few hundred dollars profit.
4-1.4 IQP Weekly Report December 13 Table 11 IQP Weekly Report December 13 Trading Performance Summary Table
All Trades Long Trades Short Trades
Total Net Profit $10,604.92 $3,584.79 $7,020.13Gross Profit $19,366.26 $12,226.84 $7,139.42Gross Loss ($8,761.34) ($8,642.05) ($119.29)Profit Factor 2.21 1.41 59.85
News Recap: The Bush Tax Cut, Slumping Unemployment Rate and China Tightening the Borrowing Policy of Banks
This week started with the financially-welcome news about the extension of Bush tax-cuts as a result of negotiation between President Obama and Republicans. Although this news received criticism that it demands less tax from the top rich Americans, it spreads warmth in the financial market as it is regarded as a second stimulus plan which was denied by both the White House and the Republicans. What we would expect is that it will boost the stock market, at least in short terms and the boost can be strengthened by futher good news (like the unemployment report below). The USD is expected to be stabilized and raised in value, especially against AUD, and JPY and possibly CAD which have been heated in the forex market. Also, we are waiting to hear news about EURO zone and we believe that no news is good news, and we would invest in EURO when no obviously bad news come out next week.
The second good news is that the unemployment finally slumped, according to the Labor Force Department. Stock market has rallied for this news, especially after hearing about the tax cuts. During most of the week, the stock market has been rising. But one caution is that, because none of these news are directly related to the recovery of the economy, the recent increase of market is suspected to be over heated and might cool down a little next week unless we hear more good news. Thus we will take much caution when we get into the stock market next week. Approaching the end of the year, we expect holiday sales rise and we intend to invest in companies that sell mostly holiday gifts, like BestBuy, Amazon and other retailers.
The Chinese government has tightened the borrowing policy of banks, aiming at intensified inflation. An expected consequence from this is that, in the middle and long term, the capital outflow from China would decrease, hurting Ausrilia and some other African and Middle East countries. We expect the AUD to slump, as we have seen the traces last week. (Actually it turns out today that the Chinese government decides not to tighten the financial policy, which boosts the world market, along with AUD value).

68
Stock Trades
Forex Trades
Like indicated in the previous report, the focus of trading this week is about AUD. A few good trades are made this week concerning this currency. Below are some of the best trades. Specifically we have focused on AUDUSD and AUDCAD, for that we believe that AUDUSD would decrease and the value of CAD is usually directly related to USD.
Figure 39 AUDUSD Trading Chart
Figure 40 AUDCAD Trading Chart
The pattern that we did this deal is to look at the resistance ranges of both currency pairs and set automatic buying and sells. All trades were made as we believe in the possible pattern of the

69
pairs – AUD will go down. Although both trades turn out to be profitable, the biggest margin of profit is missed in both currency pairs. This is mainly because
Stock
This week we have paid a lot of attention on YOKU (Youku.com Inc.). On December 8, Youku was listed at the New York Stock Exchange for its first time. The stock closed at $33.44 on its first day of trading giving the company a market capitalization of approximately $3.3 billion. For the first 9 months of 2010 Youku reported revenue of $35.1 million and recorded a loss of $25 million during this period.
Figure 41 YOKU Trading Chart
The best chance to buy the stocks at lowest price on Dec.9th was missed. But another low point on Dec.10th was caught and the price went up a lot during the rest of the day on the 10th and opened very high on the 11th. We could have closed this trade on the 11th and make a lot of money but instead an unwise decision was made to keep holding it. The price was plunging after that. This loss is a lesson of turning a profitable trade to real profits when it meets our trading strategy.
Another trade featured this week is the buying of SDTH at a low price. The SDTH has plunged into a history-low point and remained stable. It is believed to have a good chance to go back.
Figure 42 SDTH Trading Chart

70
4-1.5 IQP Winter and Weekly Report January 24 Overall Statement of Investment
Table 12 IQP Weekly Report January 24 Trading Performance Summary Table
Decision Justification, Success and Failure
Summary of Trades
During the winter and the week before Jan. 24, a couple of good and bad trades were conducted. The best trades come from Froex where we trade with patience and predications of the market based on our understanding of the news. Noticeably the EUR/AUD and EUR/USD pairs have yielded the most profit. Below is a trade made last week which brought more than $3000 profit.
Figure 43 EURUSD Trading Chart

71
The reasoning behind this trade is based on two pieces of news last week. The middle of last week was marked by a visit of Chinese President to United States to warm up the Sino-America relation that has soured in the previous two years. This movement was expected to tighten both the economic and military relations between both countries with primarily China seeking the ground of agreement and easing the recent rumors of wars and statements made by American eagles. This visit, we believe, would stabilize and possibly bring confidence to the U.S. market which is slowly recovering, as the Chinese president promises to import more from U.S.
The other piece of news comes from Europe whose currency was said to face another potential crisis. The Portugal government has significantly raised the returns of their bonds which the economists don’t think is sustainable. Moreover, the Great Britain, an important partner of EU, is facing deteriorating inflation problem. Based on this, we made another trade last week which gave us a couple of hundred dollars of profit.
Figure 44 GBPUSD Trading Chart
Despite the profits we have achieved so far, the market is not entirely as predicted. The EUR, instead of going down, was ascending vigorously last week due to a reason we still need to explore.
A couple of bad trades were made back at the end of B term. The most conspicuous one was concerning a rising Chinese online-video company YOUKU which just registered in the market last December. The price of its stock tripled in three days and we expected it would be higher thus we made huge investments into this stock. Furthermore, we missed the optimal point to sell where we made roughly $5,000 and we ended up in losing $5,000 while the price of that stock

72
was plunging a few days after. This further suggests that all trades should be in accordance with the trading plan as to avoid losses.

73
5. Conclusion and Recommendation
5-1 Trading Recommendation Trading strategy
Before the Market opens
‐ Our daily pre-market routine comprises four key areas: 1) Analyze yesterday’s trades. 2) Review any open position and update targets and stops. 3) Read latest news and assess today’s market conditions and plan accordingly. 4) Make an initial selection of possible instruments to trade.
General Risk Management
‐ Our goal is to minimize risk wherever possible by adhering strictly to the risk management contained in this section of our trading plan.
‐ Our maximum exposure in the market on all open position will not exceed 10% of total amount money. Meanwhile, if all the position we have opened at any time were stopped out simultaneously, the drawdown on our account would not exceed 5%.
‐ We have three laptops which can be used for trading so that there would not be any hardware risk. If the power of our district goes down, we can quickly go to campus to trade.
‐ We will monitor the drawdown on all our trading strategies and when it exceeds 10%, we will stop trading that strategy immediately and review the whole approach.
‐ For every trade we entered, we will not risk more than 2% of our total equity. For each trade we will identify the ideal loss stop loss point and vary the number of contracts/shares to ensure that we do not risk more than 2%. For every trade we entered, we will decide in advance where to place our stop loss in the event that the trade goes against us. The good times to stop are list as follows:
1) Upon reaching our daily target, we will stop trading after the first losing trade. 2) Before reaching our daily target, we will stop trading after two losing trades. To ensure
further that our losses are kept to a minimum, we will have a maximum daily stop of 3% of our equity.
3) We will not trade at all on days where I do not see the good signal to buy any stock ‐ The total amount of money in the market will not exceed 80% of our whole account: 20,000
for currency pairs and 60,000 for stock. In the event of a large drawdown, we will use the spare 20,000 as additional funds. My total account will always stay at 100,000 regardless of how much we have earned.
Exit Strategy
‐ If the trade goes against me, I will exit before the stop loss order is filled if the price does not

74
move certain points in my favor by the close of the next price bar following entry. ‐ We will close our half of our position when we meet our daily target. ‐ We will close our half of our position when we have a 2% profit for certain stock in one day. ‐ We will close the second half of our position for stock at the very end of the day. ‐ We will close our whole position when we have 1% loss on any stock. Entry Strategy
‐ We will trade only when the trend of certain stock is going up in daily timeframe for over 50 days.
‐ We will trade when the short-term moving average is under the long-term moving average.
After market closes
‐ We will examine each trade and make sure they are executed in accordance with our plan. ‐ We will also keep update our trading journal regularly and write down our thoughts, feelings
and conclusions about the day of trading. Discipline
‐ If we break one of the rules detailed in our trading plan, we will stop trading for a full day and focus on the reasons why there is a breach of discipline.
‐ If we break more than two rules in our trading plan, we will stop trading until we address the reason for our poor discipline and if need, amend our trading plan.
‐ After a losing trade, we will examine if we trade according to the trade plan and evaluate our state of mind to ensure we are still calm and relaxed to enter the market again.
‐ Even after a winning trade, we will remind ourselves that executing the trade in accordance with our plan is more important than the outcome of the trade.
5-2 Conclusion To sum up the project, the trading strategy, which was developed on the studied background information and understanding of indicators, was proved successful and profitable for nearly $30,000 profit was achieved by the end of the project.
The selections and use of indicators, the understanding assessment of companies and their financial situation, the constant absorption of news and exploration of its relation with economic situation, and the trading discipline were regarded as essential for our success. Specifically, there are a few notes that are worth attention and further explanation due to their importance.
1. News. The News has been proven the most important indicator of economic market on weekly and daily bases. Both domestic and international news have been proven as able to provide hints on the future trends of market. These pieces of news include both commercial and political ones and their influence should always be taken into account before making investment decision.

75
2. Policy. The understanding of policy and policy change are considered essential in forex market as currency values are closely monitored and maintained by the government. The interpretation of policy is very important in understanding the possible movement of currency values. An example would be that when the U.S. government intended to boost the economy by using “quantitative easing”, it was expected that the U.S. dollar would decline in value, and closely related currency, like Canada dollars would also be significantly influenced.
3. Selection of indicator. There are only a few indicators used in the trading and they could all be correct or incorrect under different conditions. Indicators could be used as reference, but not the only factor for investment decision. Combined indicators were proved to be more indicative than single ones. It is also found that the same indicator could work differently for various people, so a selection of indicators was important to be established before actual investment.
4. Discipline. A trading plan, once established, must be followed. This would allow investors to better understand the drawbacks and strength of his or her plan and thus they can make timely adjustments. The main point of developing a trading plan should be to avoid losses but rather to maximize profits.
5. Patience and confidence. Being patient and confident are very important in forex market investment because the values of the main currencies usually cannot go to the same direction forever. Investors, after establishing a valid plan, should be confident in the judgment and conduct trades according to his or her assumption. Withdraw back with fixed loss, but be patience and confident in the overall trends of market movement.

76
6. Bibliographies
1. Levinson, Mark. “Guide to Financial Markets”. The Economist. Fourth Edition.
2. Ross, Stephen A., Randolph W. Westerfield, and Bradford D. Jordan. Essentials of
Corporate Finance. New York: McGraw-Hill/Irwin, 2008.
3. B.O’Neill Wyss Fundamentals of the Stock Market McGraw-Hill HG4910.W97, 2000 4. "What Is Foreign Exchange (Forex)? -International Business Times." IBTIMES.com:
International Business News, Financial News, Market News, Politics, Forex, Commodities - International Business Times. 11 Feb. 2011. Web. 27 Feb. 2011. <http://au.ibtimes.com/articles/110821/20110210/what-is-foreign-exchange-currency-conversion-financial-markets-forex-foreign-exchange-markets.htm>.
5. "Forex Market - Forex - Investopedia Definition." Investopedia.com - Your Source For Investing Education. Web. 27 Feb. 2011. <http://www.investopedia.com/terms/forex/f/forex-market.asp>..
6. Colby, Robert W.. The Encyclopedia Of Technical Market Indicators, Second Edition. 2 ed. New York: McGraw-Hill, 2002. Print.
7. "Introduction to Technical Indicators and Oscillators - ChartSchool - StockCharts.com." StockCharts.com - Simply the Web's Best Financial Charts. Web. 13 Sept. 2010. <http://stockcharts.com/school/doku.php?id=chart_school:technical_indicators:introduction_to_tech>.
8. ADX Indicator How to Use the Average Directional Index." Swing Trading Guide | Learn How to Trade Stocks Like a Pro! Web. 19 Sept. 2010. <http://www.swing-trade-stocks.com/ADX-indicator.html>.
9. FreeStockCharts.com - Web's Best Streaming Realtime Stock Charts - Free. <http://www.freestockcharts.com/>.
10. "Chaikin Money Flow (CMF) - ChartSchool - StockCharts.com." StockCharts.com - Simply the Web's Best Financial Charts. N.p., n.d. Web. 3 Oct. 2010. <http://stockcharts.com/school/doku.php?id=chart_school:technical_indicators :chaikin_money_flow>
11. "Detrended Price Oscillator (DPO) - ChartSchool - StockCharts.com." StockCharts.com - Simply the Web's Best Financial Charts. N.p., n.d. Web. 3 Oct. 2010. http://stockcharts.com/help/doku.php?id=chart_school:technical_indicators:detrended_price_oscillators
12. FreeStockCharts.com - Web's Best Streaming Realtime Stock Charts - Free. Web. 27 Sept. 2010. <http://www.freestockcharts.com/>.
13. TradeStation Platform. Web. 27 Sept. 2010. <http://www.tradestation.com/>.

77
14. Lee, Julie. "Why Do Corporations Issue Bonds?" Mount Holyoke College, South Hadley,
Massachusetts. Jan. 1999. Web. 12 Sept. 2010.
<http://www.mtholyoke.edu/courses/sgabriel/securities1/bond/why.htm>.
15. "Corporate Bonds Explained - Education Center - Yahoo! Finance." Yahoo! Finance -
Business Finance, Stock Market, Quotes, News. Web. 12 Sept. 2010.
<http://finance.yahoo.com/education/bond/article/101190/Corporate_Bonds_Explained>.
16. Ross, Stephen A., Randolph W. Westerfield, and Bradford D. Jordan. Essentials of
Corporate Finance. New York: McGraw-Hill/Irwin, 2008.
17. <Tulipmania: money, honor, and knowledge in the Dutch golden age> by Anne Goldgar 18. <The Investopedia Guide to Wall Speak: The Terms You Need to Know to Talk> by Jack
Guinan 19. "The Great American Housing Market Nightmare Next Phase." The Market Oracle :: Financial
Markets Analysis & Forecasting Free Website. Web. 04 Nov. 2008. <http://www.marketoracle.co.uk/Article7126.html>.

78
APPENDIX
A. Trading History
# Typ
e Date/Tim
e Account Symbol PriceRoll
Over Shares/Ctrts/Unit
s Pips Profit
1 Buy 11/17/10 15:38
SIM611099M
BBY $42.81 0.00 10
Sell 11/17/10 15:39
SIM611099M
BBY $42.83 $0.20
2 Buy 11/18/10 12:02
SIM611099M
WFC $27.60 0.00 20
Sell 11/19/10 14:39
SIM611099M
WFC $27.35 ($5.00)
3 Buy 11/18/10 11:52
SIM611099M
HPQ $41.70 0.00 50
Sell 11/19/10 15:11
SIM611099M
HPQ $42.43 $36.50
4 Buy 11/19/10 14:42
SIM611099M
HPQ $42.42 0.00 20
Sell 11/19/10 15:11
SIM611099M
HPQ $42.43 $0.20
5 Buy 11/18/10 11:40
SIM611099M
BAC $11.74 0.00 50
Sell 11/22/10 15:16
SIM611099M
BAC $11.23 ($25.50)
6 Buy 11/19/10 12:28
SIM611099M
X $47.74 0.00 25
Sell 11/22/10 15:20
SIM611099M
X $47.32 ($10.50)
7 Buy 11/18/10 11:40
SIM611099M
BAC $11.74 0.00 25
Sell 11/22/10 15:23
SIM611099M
BAC $11.22 ($13.00)
8 Buy 11/19/10 15:21
SIM611099M
BBY $43.47 0.00 50
Sell 11/22/10 15:26
SIM611099M
BBY $44.79 $66.00
9 Buy 11/22/10 15:17
SIM611099M
HPQ $42.99 0.00 25
Sell 11/22/10 15:28
SIM611099M
HPQ $42.99 $0.00
10 Buy 11/18/10 11:40
SIM611099M
BAC $11.74 0.00 25
Sell 11/22/10 SIM611099 BAC $11.21 ($13.25)

79
15:29 M 11 Buy 11/19/10
15:29 SIM611099
M CCE $25.38 0.00 20
Sell 11/23/10 09:30
SIM611099M
CCE $24.89 ($9.80)
12 Buy 11/19/10 15:29
SIM611099M
CCE $25.38 0.00 30
Sell 11/23/10 09:30
SIM611099M
CCE $24.89 ($14.70)
13 Buy 11/19/10 12:28
SIM611099M
X $47.74 0.00 25
Sell 11/23/10 09:31
SIM611099M
X $46.74 ($25.00)
14 Buy 11/22/10 15:19
SIM611099M
TSN $16.56 0.00 25
Sell 11/23/10 09:34
SIM611099M
TSN $16.29 ($6.75)
15 Buy 11/22/10 15:17
SIM611099M
HPQ $42.99 0.00 25
Sell 11/23/10 09:37
SIM611099M
HPQ $44.09 $27.50
16 Buy 11/22/10 15:23
SIM611099M
HPQ $43.07 0.00 25
Sell 11/23/10 09:37
SIM611099M
HPQ $44.10 $25.75
17 Buy 11/23/10 09:35
SIM611099M
HPQ $44.09 0.00 50
Sell 11/23/10 09:41
SIM611099M
HPQ $44.17 $4.00
18 Buy 11/23/10 09:35
SIM611099M
HPQ $44.09 0.00 8
Sell 11/23/10 09:42
SIM611099M
HPQ $44.27 $1.44
19 Buy 11/23/10 09:36
SIM611099M
HPQ $44.19 0.00 25
Sell 11/23/10 09:42
SIM611099M
HPQ $44.27 $2.00
20 Buy 11/22/10 15:19
SIM611099M
TSN $16.56 0.00 25
Sell 11/23/10 09:42
SIM611099M
TSN $16.20 ($9.00)
21 Buy 11/19/10 15:28
SIM611099M
DIS $36.96 0.00 20
Sell 11/23/10 09:43
SIM611099M
DIS $36.42 ($10.80)
22 Buy 11/23/10 SIM611099 X $46.31 0.00 50

80
11:50 M Sell 11/23/10
12:53 SIM611099
M X $46.46 $7.50
23 Buy 11/24/10 10:33
SIM611099M
HPQ $43.59 0.00 25
Sell 11/24/10 13:04
SIM611099M
HPQ $43.71 $3.00
24 Buy 11/24/10 10:33
SIM611099M
HPQ $43.59 0.00 25
Sell 11/24/10 13:54
SIM611099M
HPQ $43.70 $2.75
25 Buy 11/24/10 12:26
SIM611099M
T $28.10 0.00 50
Sell 11/24/10 14:24
SIM611099M
T $28.14 $2.00
26 Buy 11/24/10 16:40
SIM611101X USDJPY ¥83.55 0.00 100000
Sell 11/24/10 16:43
SIM611101X USDJPY ¥83.55 $0.00
27 Buy 11/24/10 16:37
SIM611101X GBPJPY ¥131.78
0.50 100000
Sell 11/25/10 12:24
SIM611101X GBPJPY ¥131.89
$135.16
28 Sell 11/25/10 12:24
SIM611101X EURAUD $1.36 1.10 100000
Buy 11/26/10 01:35
SIM611101X EURAUD $1.37 ($837.44)
29 Buy 11/26/10 01:52
SIM611101X EURUSD $1.33 0.20 100000
Sell 11/30/10 11:32
SIM611101X EURUSD $1.30 ($2,400.00)
30 Buy 11/30/10 11:02
SIM611099M
WFC $26.99 0.00 200
Sell 11/30/10 15:39
SIM611099M
WFC $27.33 $68.00
31 Buy 11/30/10 15:16
SIM611099M
WFC $27.29 0.00 50
Sell 11/30/10 15:39
SIM611099M
WFC $27.33 $2.00
32 Buy 11/30/10 11:17
SIM611099M
AAPL $312.20
0.00 50
Sell 12/01/10 09:30
SIM611099M
AAPL $315.95
$187.50
33 Buy 11/30/10 14:47
SIM611099M
AAPL $311.53
0.00 50
Sell 12/01/10 SIM611099 AAPL $315.9 $221.00

81
09:30 M 5 34 Buy 11/30/10
15:46 SIM611099
M AAPL $311.1
0 0.00 25
Sell 12/01/10 09:30
SIM611099M
AAPL $315.95
$121.25
35 Buy 11/26/10 02:30
SIM611101X EURUSD $1.33 0.30 100000
Sell 12/01/10 12:16
SIM611101X EURUSD $1.31 ($1,444.00)
36 Buy 11/30/10 11:30
SIM611101X EURUSD $1.30 0.10 100000
Sell 12/01/10 12:16
SIM611101X EURUSD $1.31 $929.00
37 Buy 11/24/10 16:39
SIM611101X GBPJPY ¥131.81
0.50 100000
Sell 12/01/10 12:33
SIM611101X GBPJPY ¥131.24
($677.13)
38 Buy 11/26/10 01:36
SIM611101X GBPJPY ¥131.79
0.00 100000
Sell 12/01/10 12:33
SIM611101X GBPJPY ¥131.24
($653.37)
39 Buy 11/26/10 04:38
SIM611101X GBPJPY ¥131.50
0.00 100000
Sell 12/01/10 12:33
SIM611101X GBPJPY ¥131.24
($312.43)
40 Buy 11/30/10 11:44
SIM611101X EURUSD $1.30 0.10 100000
Sell 12/02/10 04:43
SIM611101X EURUSD $1.32 $1,452.00
41 Buy 12/01/10 12:14
SIM611101X EURUSD $1.31 0.00 200000
Sell 12/02/10 04:43
SIM611101X EURUSD $1.32 $858.00
42 Sell 12/01/10 13:09
SIM611101X GBPJPY ¥131.50
(1.40) 300000
Buy 12/02/10 09:52
SIM611101X GBPJPY ¥130.82
$2,405.13
43 Sell 12/02/10 09:51
SIM611101X GBPJPY ¥130.90
0.00 100000
Buy 12/02/10 09:52
SIM611101X GBPJPY ¥130.82
$95.44
44 Buy 12/01/10 12:19
SIM611101X EURUSD $1.31 0.00 100000
Sell 12/02/10 09:52
SIM611101X EURUSD $1.32 $299.00
45 Buy 12/01/10 SIM611101X EURUSD $1.31 0.00 100000

82
12:19 Sell 12/02/10
10:02 SIM611101X EURUSD $1.32 $512.00
46 Buy 12/01/10 12:50
SIM611101X EURUSD $1.31 0.00 100000
Sell 12/02/10 11:21
SIM611101X EURUSD $1.32 $641.00
47 Buy 12/02/10 09:43
SIM611101X EURUSD $1.31 0.00 100000
Sell 12/02/10 11:21
SIM611101X EURUSD $1.32 $564.00
48 Buy 12/02/10 10:59
SIM611099M
MSFT $26.59 0.00 500
Sell 12/02/10 11:52
SIM611099M
MSFT $26.90 $157.35
49 Buy 12/02/10 11:05
SIM611099M
AAPL $316.59
0.00 80
Sell 12/02/10 12:44
SIM611099M
AAPL $317.50
$72.80
50 Buy 12/03/10 12:04
SIM611099M
AAPL $316.62
0.00 100
Sell 12/03/10 15:49
SIM611099M
AAPL $317.45
$83.00
51 Buy 12/03/10 12:07
SIM611099M
C $4.38 0.00 3000
Sell 12/07/10 09:45
SIM611099M
C $4.60 $660.00
52 Sell 12/07/10 00:24
SIM611101X AUDUSD $0.99 0.00 100000
Buy 12/07/10 10:55
SIM611101X AUDUSD $0.99 $75.00
53 Sell 12/07/10 03:00
SIM611101X AUDUSD $0.99 0.00 100000
Buy 12/07/10 10:55
SIM611101X AUDUSD $0.99 $186.00
54 Sell 12/07/10 04:09
SIM611101X AUDUSD $0.99 0.00 200000
Buy 12/07/10 10:55
SIM611101X AUDUSD $0.99 $576.00
55 Sell 12/07/10 10:57
SIM611101X USDJPY ¥83.04 0.00 100000
Buy 12/07/10 11:01
SIM611101X USDJPY ¥83.13 ($107.80)
56 Buy 12/03/10 12:07
SIM611099M
C $4.38 0.00 1000
Sell 12/07/10 SIM611099 C $4.65 $270.00

83
11:14 M 57 Buy 12/07/10
11:01 SIM611101X USDJPY ¥83.13 0.00 100000
Sell 12/07/10 12:43
SIM611101X USDJPY ¥83.16 $40.72
58 Buy 12/07/10 11:05
SIM611101X USDJPY ¥83.14 0.00 100000
Sell 12/07/10 12:43
SIM611101X USDJPY ¥83.16 $20.36
59 Sell 12/07/10 04:09
SIM611101X AUDUSD $0.99 0.00 100000
Buy 12/07/10 12:46
SIM611101X AUDUSD $0.99 $514.00
60 Sell 12/07/10 04:09
SIM611101X AUDUSD $0.99 0.00 100000
Buy 12/07/10 16:55
SIM611101X AUDUSD $0.98 $1,079.00
61 Sell 12/07/10 12:46
SIM611101X AUDUSD $0.99 (1.90) 100000
Buy 12/08/10 12:09
SIM611101X AUDUSD $0.98 $948.00
62 Sell 12/07/10 16:48
SIM611101X AUDUSD $0.98 (1.90) 100000
Buy 12/08/10 12:09
SIM611101X AUDUSD $0.98 $424.00
63 Sell 12/08/10 06:36
SIM611101X AUDUSD $0.98 0.00 100000
Buy 12/08/10 12:33
SIM611101X AUDUSD $0.98 $462.00
64 Sell 12/08/10 12:10
SIM611101X AUDUSD $0.98 0.00 200000
Buy 12/08/10 12:39
SIM611101X AUDUSD $0.98 $290.00
65 Sell 12/08/10 12:19
SIM611101X AUDUSD $0.98 0.00 100000
Buy 12/08/10 12:39
SIM611101X AUDUSD $0.98 $104.00
66 Sell 12/08/10 12:26
SIM611101X AUDUSD $0.98 0.00 100000
Buy 12/08/10 12:39
SIM611101X AUDUSD $0.98 $65.00
67 Sell 12/08/10 14:33
SIM611101X USDCAD $1.01 0.00 100000
Buy 12/08/10 14:35
SIM611101X USDCAD $1.01 ($1.98)
68 Sell 12/08/10 SIM611101X AUDUSD $0.98 0.00 100000

84
12:39 Buy 12/08/10
15:18 SIM611101X AUDUSD $0.98 ($101.00)
69 Buy 12/08/10 14:42
SIM611101X USDCAD $1.01 0.00 100000
Sell 12/08/10 15:18
SIM611101X USDCAD $1.01 $234.29
70 Sell 12/08/10 12:39
SIM611101X AUDUSD $0.98 0.00 100000
Buy 12/08/10 15:20
SIM611101X AUDUSD $0.98 ($93.00)
71 Sell 12/08/10 13:10
SIM611101X AUDUSD $0.98 0.00 100000
Buy 12/08/10 15:20
SIM611101X AUDUSD $0.98 $114.00
72 Sell 12/08/10 13:10
SIM611101X AUDUSD $0.98 (4.30) 100000
Buy 12/09/10 04:47
SIM611101X AUDUSD $0.98 ($537.00)
73 Sell 12/02/10 11:22
SIM611101X EURUSD $1.32 (5.20) 100000
Buy 12/09/10 10:08
SIM611101X EURUSD $1.32 $201.00
74 Sell 12/08/10 14:34
SIM611101X AUDUSD $0.98 (4.30) 100000
Buy 12/09/10 10:11
SIM611101X AUDUSD $0.98 ($500.00)
75 Sell 12/09/10 09:30
SIM611101X AUDUSD $0.99 0.00 100000
Buy 12/09/10 10:19
SIM611101X AUDUSD $0.98 $285.00
76 Buy 12/09/10 10:12
SIM611099M
YOKU $37.83 0.00 100
Sell 12/09/10 10:22
SIM611099M
YOKU $37.64 ($19.00)
77 Buy 12/07/10 13:42
SIM611099M
SINA $69.30 0.00 100
Sell 12/09/10 10:38
SIM611099M
SINA $74.00 $470.00
78 Sell 12/09/10 09:31
SIM611101X AUDCAD
$0.99 0.00 100000
Buy 12/09/10 11:14
SIM611101X AUDCAD
$0.99 $260.19
79 Buy 12/09/10 10:26
SIM611099M
CYDE $2.42 0.00 1000
Sell 12/09/10 SIM611099 CYDE $2.44 $24.00

85
15:10 M 80 Buy 12/09/10
11:34 SIM611099
M C $4.65 0.00 4000
Sell 12/09/10 15:12
SIM611099M
C $4.70 $200.00
81 Buy 12/09/10 11:52
SIM611099M
C $4.64 0.00 1000
Sell 12/09/10 15:12
SIM611099M
C $4.70 $60.00
82 Buy 12/09/10 12:14
SIM611099M
C $4.64 0.00 1000
Sell 12/09/10 15:12
SIM611099M
C $4.70 $60.00
83 Sell 11/25/10 12:24
SIM611101X EURAUD $1.36 19.20 100000
Buy 12/10/10 06:23
SIM611101X EURAUD $1.34 $2,581.17
84 Sell 12/09/10 09:32
SIM611101X AUDUSD $0.99 (1.90) 100000
Buy 12/10/10 10:01
SIM611101X AUDUSD $0.99 $80.00
85 Sell 12/09/10 09:39
SIM611101X AUDUSD $0.99 (1.90) 100000
Buy 12/10/10 10:01
SIM611101X AUDUSD $0.99 ($1.00)
86 Sell 12/10/10 04:57
SIM611101X AUDUSD $0.99 0.00 200000
Buy 12/10/10 10:13
SIM611101X AUDUSD $0.98 $618.00
87 Sell 12/09/10 09:31
SIM611101X AUDCAD
$0.99 (1.60) 100000
Buy 12/10/10 10:24
SIM611101X AUDCAD
$0.99 $66.37
88 Buy 12/09/10 11:51
SIM611099M
SINA $73.61 0.00 200
Sell 12/10/10 11:53
SIM611099M
SINA $74.05 $88.00
89 Sell 12/09/10 09:33
SIM611101X AUDCAD
$1.00 (1.60) 100000
Buy 12/10/10 12:14
SIM611101X AUDCAD
$0.99 $73.31
90 Buy 12/09/10 11:51
SIM611099M
SINA $73.61 0.00 300
Sell 12/10/10 12:18
SIM611099M
SINA $74.05 $132.00
91 Buy 12/10/10 SIM611099 SINA $74.50 0.00 100

86
09:44 M Sell 12/10/10
12:18 SIM611099
M SINA $74.05 ($45.00)
92 Buy 12/09/10 11:47
SIM611099M
YOKU $38.70 0.00 500
Sell 12/10/10 12:39
SIM611099M
YOKU $40.23 $767.00
93 Buy 12/09/10 11:38
SIM611099M
WFC $29.61 0.00 400
Sell 12/10/10 12:50
SIM611099M
WFC $30.41 $320.00
94 Buy 12/10/10 10:01
SIM611099M
WFC $30.20 0.00 100
Sell 12/10/10 12:50
SIM611099M
WFC $30.41 $21.00
95 Sell 12/10/10 12:59
SIM611101X USDJPY ¥83.95 0.00 100000
Buy 12/10/10 14:31
SIM611101X USDJPY ¥83.86 $110.77
96 Sell 12/10/10 05:20
SIM611101X AUDUSD $0.99 0.00 100000
Buy 12/10/10 15:17
SIM611101X AUDUSD $0.99 $240.00
97 Sell 11/26/10 14:39
SIM611101X EURAUD $1.38 19.20 100000
Buy 12/12/10 21:01
SIM611101X EURAUD $1.34 $3,823.03
98 Sell 12/02/10 11:22
SIM611101X EURUSD $1.32 (7.20) 100000
Buy 12/13/10 00:02
SIM611101X EURUSD $1.32 $307.00
99 Sell 12/13/10 00:05
SIM611101X USDJPY ¥84.11 0.00 100000
Buy 12/13/10 00:18
SIM611101X USDJPY ¥84.10 $7.19
100
Sell 12/13/10 00:18
SIM611101X EURCAD $1.33 0.00 100000
Buy 12/13/10 01:11
SIM611101X EURCAD $1.33 $148.89
101
Sell 12/09/10 11:37
SIM611101X EURUSD $1.32 (2.00) 100000
Buy 12/13/10 01:20
SIM611101X EURUSD $1.32 $128.00
102
Sell 12/13/10 01:46
SIM611101X EURCAD $1.33 0.00 100000
Buy 12/13/10 SIM611101X EURCAD $1.33 ($237.27)

87
08:27 10
3 Buy 12/10/10
11:13 SIM611099
M YOKU $45.00 0.00 100
Sell 12/13/10 10:15
SIM611099M
YOKU $33.72 ($1,128.00)
104
Buy 12/10/10 11:55
SIM611099M
YOKU $43.80 0.00 200
Sell 12/13/10 10:15
SIM611099M
YOKU $33.72 ($2,016.00)
105
Buy 12/10/10 12:38
SIM611099M
YOKU $40.00 0.00 200
Sell 12/13/10 10:15
SIM611099M
YOKU $33.72 ($1,256.00)
106
Sell 12/13/10 00:08
SIM611101X EURUSD $1.32 (1.00) 100000
Buy 12/14/10 11:05
SIM611101X EURUSD $1.34 ($1,966.00)
107
Sell 12/13/10 01:49
SIM611101X EURCAD $1.33 0.20 100000
Buy 12/15/10 12:33
SIM611101X EURCAD $1.33 $109.44
108
Sell 12/13/10 02:12
SIM611101X EURCAD $1.33 0.20 100000
Buy 12/15/10 12:33
SIM611101X EURCAD $1.33 $175.10
109
Sell 12/13/10 02:19
SIM611101X EURCAD $1.33 0.20 300000
Buy 12/15/10 12:33
SIM611101X EURCAD $1.33 $761.09
110
Sell 12/13/10 07:47
SIM611101X EURCAD $1.34 0.20 100000
Buy 12/15/10 12:33
SIM611101X EURCAD $1.33 $552.16
111
Sell 12/10/10 01:20
SIM611101X AUDCAD
$1.00 (4.80) 100000
Buy 12/15/10 12:34
SIM611101X AUDCAD
$0.99 $239.77
112
Sell 12/10/10 01:30
SIM611101X AUDCAD
$1.00 (4.80) 100000
Buy 12/15/10 12:34
SIM611101X AUDCAD
$0.99 $255.69
113
Sell 12/13/10 01:33
SIM611101X AUDCAD
$0.99 (3.20) 100000
Buy 12/15/10 12:34
SIM611101X AUDCAD
$0.99 $201.96
11 Sell 12/13/10 SIM611101X AUDCA $1.00 (3.20) 100000

88
4 01:39 D Buy 12/15/10
12:34 SIM611101X AUDCA
D $0.99 $226.83
115
Sell 12/13/10 07:45
SIM611101X AUDCAD
$1.00 (3.20) 100000
Buy 12/15/10 12:34
SIM611101X AUDCAD
$0.99 $522.32
116
Sell 12/10/10 05:20
SIM611101X AUDUSD $0.99 (5.70) 100000
Buy 12/15/10 14:57
SIM611101X AUDUSD $0.98 $293.00
117
Sell 12/10/10 12:41
SIM611101X AUDUSD $0.99 (5.70) 100000
Buy 12/15/10 14:57
SIM611101X AUDUSD $0.98 $105.00
118
Sell 12/13/10 00:34
SIM611101X AUDUSD $0.99 (3.80) 100000
Buy 12/15/10 14:57
SIM611101X AUDUSD $0.98 $70.00
119
Sell 12/13/10 07:45
SIM611101X AUDUSD $0.99 (3.80) 100000
Buy 12/15/10 14:57
SIM611101X AUDUSD $0.98 $695.00
120
Sell 12/13/10 01:44
SIM611101X EURUSD $1.32 (27.10)
100000
Buy 01/20/11 10:39
SIM611101X EURUSD $1.34 ($2,491.00)
121
Sell 12/14/10 11:06
SIM611101X EURUSD $1.34 (26.10)
100000
Buy 01/20/11 10:39
SIM611101X EURUSD $1.34 ($649.00)
122
Sell 12/14/10 14:16
SIM611101X EURUSD $1.34 (26.10)
100000
Buy 01/20/11 10:39
SIM611101X EURUSD $1.34 ($61.00)
123
Sell 01/20/11 07:40
SIM611101X EURUSD $1.35 0.00 300000
Buy 01/20/11 10:47
SIM611101X EURUSD $1.34 $3,195.00
124
Buy 01/20/11 11:46
SIM611101X GBPUSD $1.59 0.00 100000
Sell 01/20/11 14:12
SIM611101X GBPUSD $1.59 $303.00
125
Buy 02/06/11 20:33
SIM611101X EURUSD $1.36 0.00 100000
Sell 02/06/11 SIM611101X EURUSD $1.36 ($3.00)

89
20:34 12
6 Buy 02/06/11
20:33 SIM611101X EURUSD $1.36 0.00 500000
Sell 02/06/11 20:34
SIM611101X EURUSD $1.36 ($15.00)
127
Sell 11/28/10 18:12
SIM611101X EURAUD $1.37 90.30 100000
Buy 02/06/11 20:34
SIM611101X EURAUD $1.34 $3,894.17
128
Sell 12/10/10 07:45
SIM611101X EURAUD $1.34 73.30 100000
Buy 02/06/11 20:34
SIM611101X EURAUD $1.34 $626.39
129
Sell 12/12/10 21:52
SIM611101X EURAUD $1.34 72.20 100000
Buy 02/06/11 20:34
SIM611101X EURAUD $1.34 $571.66
B. Trading Statistics Trading Graph
Performance Summary

90
Total Net Profit $31,076.40 ($358.17) $31,434.58
Gross Profit $48,938.90 $9,856.47 $39,082.44
Gross Loss ($17,862.50) ($10,214.64) ($7,647.86)
Profit Factor 2.74 0.96 5.11
Roll Over Credit $2,192.84 $18.92 $2,173.92
Open Position P/L $0.00 $0.00 $0.00
Select Total Net Profit $12,779.66 ($358.17) $13,137.83
Select Gross Profit $30,642.16 $9,856.47 $20,785.69
Select Gross Loss ($17,862.50) ($10,214.64) ($7,647.86)
Select Profit Factor 1.72 0.96 2.72
Adjusted Total Net Profit $23,093.48 ($3,844.87) $23,672.38
Adjusted Gross Profit $43,780.29 $8,335.58 $33,441.37
Adjusted Gross Loss ($20,686.81) ($12,180.45) ($9,768.99)
Adjusted Profit Factor 2.12 0.68 3.42
Total Number of Trades 131 70 61
Percent Profitable 68.70% 60.00% 78.69%
Winning Trades 90 42 48
Losing Trades 40 27 13
Even Trades 1 1 0
Avg. Trade Net Profit $237.22 ($5.12) $515.32
Avg. Winning Trade $543.77 $234.68 $814.22
Avg. Losing Trade ($446.56) ($378.32) ($588.30)
Ratio Avg. Win:Avg. Loss 1.22 0.62 1.38
Largest Winning Trade $5,922.31 $1,446.76 $5,922.31
Largest Losing Trade ($2,496.32) ($2,405.26) ($2,496.32)
Largest Winner as % of Gross Profit 12.10% 14.68% 15.15%
Largest Loser as % of Gross Loss 13.98% 23.55% 32.64%
Net Profit as % of Largest Loss 1244.89% ‐14.89% 1259.23%
Select Net Profit as % of Largest Loss 511.94% ‐14.89% 526.29%
Adjusted Net Profit as % of Largest Los 925.10% ‐159.85% 948.29%
Max. Consecutive Winning Trades 15 14 13
Max. Consecutive Losing Trades 6 6 3
Avg. Bars in Total Trades 3.87 1.89 6.15
Avg. Bars in Winning Trades 3.8 1.6 5.73
Avg. Bars in Losing Trades 4.1 2.37 7.69
Avg. Bars in Even Trades 1 1 0
Max. Shares/Contracts Held n/a n/a n/a
Total Shares/Contracts Held 9815083 2515083 7300000
Account Size Required n/a n/a n/a
Total Slippage $0.00 $0.00 $0.00
Total Commission $759.46 $398.21 $361.26
All Trades Long Trades Short Trades

91
Return on Initial Capital 31.08%
Annual Rate of Return 120.46%
Buy & Hold Return ‐0.29%
Return on Account n/a
Avg. Monthly Return $7,860.38
Std. Deviation of Monthly Return $27,864.71
Return Retracement Ratio 2.18
RINA Index n/a
Sharpe Ratio n/a
K‐Ratio ‐0.54
Trading Period Mths, 21 Dys, 1 Hr, 20 Mins
Percent of Time in the Market 74.19%
Time in the Market h, 29 Dys, 20 Hrs, 58 Mins
Longest Flat Period 17 Dys, 6 Hrs, 21 Mins
Max. Equity Run‐up(Daily) $53,165.24
Date of Max. Equity Run‐up 1/7/2011 16:59
Max. Equity Run‐up as % of Initial
Capital 53.17%
Value ($49,249.26) ($11,684.31) ($49,545.91)
Date 1/27/2011 16:59
as % of Initial Capital 49.25% 11.68% 49.55%
Net Profit as % of Drawdown 63.10% ‐3.07% 63.45%
Select Net Profit as % of Drawdown 25.95% ‐3.07% 26.52%
Adjusted Net Profit as % of
Drawdown 46.89% ‐32.91% 47.78%
Value ($6,623.87) ($4,410.00) ($3,217.06)
Date 12/14/2010 11:05
as % of Initial Capital 6.62% 4.41% 3.22%
Net Profit as % of Drawdown 469.16% ‐8.12% 977.12%
Select Net Profit as % of Drawdown 192.93% ‐8.12% 408.38%
Adjusted Net Profit as % of
Drawdown 348.64% ‐87.19% 735.84%
Max. Trade Drawdown ($8,263.95) ($3,050.00) ($8,263.95)
All Trades
Total Net Profit $31,076.40 Profit Factor 2.74
Gross Profit $48,938.90 Gross Loss ($17,862.50)
Roll Over Credit $2,192.84
Open Position Profit/Loss $0.00
Max. Drawdown(Daily)
Max. Drawdown(Trade Close)

92
TradeStation Trading Analysis
131 90 40
$237.22 $543.77 ($446.56)
$1,046.44 $1,035.18 $711.92
$1,283.66 $1,578.94 $265.36
($809.21) ($491.41) ($1,158.48)
441.12% 190.37% 159.42%
4 Dys, 3 Hrs, 11
Mins 3 Dys, 22 Hrs, 30 Mins
4 Dys, 16 Hrs, 8
Mins
1 Dy, 10 Hrs, 51
Mins 11 Hrs, 33 Mins 18 Hrs, 28 Mins
7 Dys, 4 Hrs, 51
Mins
Total Positive Negative
4 4 0
$18,296.75 $18,296.75 $0.00
Run‐Up Drawdown
$9,319.87 ($8,263.95)
2/4/2011 1/28/2011
$721.03 ($765.32)
$1,612.56 $1,333.15
$2,333.60 $567.83
($891.53) ($2,098.46)
223.65% 174.20%
25.90% 55.19% 70.71%
61.74% 34.87% 41.76%
87.64% 90.06% 112.47%
‐35.84% 20.32% 28.96%
238.38% 63.19% 59.05%
Winners Losers
$5,922.31 ($2,496.32)
12.10% 13.98%
$15,666.35 ($6,623.87)
32.01% 37.08%
Coefficient of Variation
TradeStation Trade Analysis
All Trades Winners Losers
Total Number of Trades
Avg. Trade Net Profit
1 Std. Deviation of Avg. Trade
Avg. Trade + 1 Std. Deviation
Avg. Trade ‐ 1 Std. Deviation
Max. Value
Time Averages
Avg. Time in Trades
Avg. Time Between Trades
Avg. Time Between Trade Profit Peaks
Outliers
Number of Outliers
Outlier Profit/Loss
Run‐Up/Drawdown
Avg. Efficiency
Max. Value Date
Avg. Value
1 Std. Deviation
Avg. + 1 Std. Deviation
Avg. ‐ 1 Std. Deviation
Coefficient of Variation
Efficiency Analysis
Total Entry Exit
1 Std. Deviation
Avg. + 1 Std. Deviation
Avg. ‐ 1 Std. Deviation
Coefficient of Variation
Largest Profit/Loss
Largest Profit/Loss as % of Gross
Largest Consec. Profit/Loss
Largest Consec. Profit/Loss as % of Gross
TradeStation Trade Series Analysis