investment evaluating hedge funds in a low- … · evaluating hedge funds in a low- growth and...
TRANSCRIPT
FOR INSTITUTIONAL AND PROFESSIONAL INVESTOR USE ONLY | NOT FOR RETAIL USE OR DISTRIBUTION
INVESTMENTINSIGHTS
PORTFOLIO DISCUSSIONJ.P. MORGAN HEDGE FUND STRATEGIES
Evaluating Hedge Funds in a Low- Growth and Low-Yield Environment
INVESTMENTINSIGHTS
IN BRIEF• Eveninachallenginglow-growth,low-rateenvironment,hedgefundsmay
provideattractiveriskandreturncharacteristicsandserveasausefulcomplementtoinvestors’currentassetallocationplans.
• Investorshaveincreasinglydiscardedthenotionofhedgefundsasaseparateassetclassandinsteadareincorporatingthemintotraditionalallocationspreviouslyreservedforlong-onlymanagers.Thisnewphilosophyenablesamoreholisticdialogueabouttheroleofhedgefundsacrosstheentireportfolio.
• Althoughhedgefundshavelaggedequityandbondmarketsinrecentyears,overthepast15years,hedgefundshavecaptured50%oftheupsideoftheS&P500andonly27%ofthedownside.
• Increasedtransparency,regulatoryoversightandthird-partyassurancehavemadethehedgefundindustrystrongerandmoreattractivetoinstitutionalinvestors.
• Today’smarketenvironmentprovidesattractiveopportunitiesthathedgefundsmaybepositionedtoharness.Forexample,assinglestockcorrelationsdecline,equitylong-shortmanagersmayflourishinamorefundamentallydrivenmarket,whilehistoricallyhighcorporatecashlevelscouldleadtoopportunitiesforshareholderactivism.Multi-strategymanagersshouldcontinuetobenefitfromtheirflexibilitytorotatecapitalintostrategiesthatarebestpositionedinthecurrentenvironment.
February 2013
PLEASE VISIT
jpmorganinstitutional.comforaccesstoallofourInsightspublications.
OUTLOOK & OPPORTUNITIES
Thereisnoshortageofcrosswindsforhedgefundinvestorstoconsidertoday.On the one hand, recent hedge fund returns have trailed markets; on the other, many investors are focused on finding ways to achieve returns while mitigating downside exposure. Increasingly, investors are seeking to justify how hedge funds can “earn their place in a portfolio” in a low-growth, low interest-rate environment. While it’s true that hedge funds have faced challenges, we believe they have earned—and will continue to earn—their role in portfolios. Among the primary reasons: hedge fund strategies and risk profiles have become increasingly diverse amid an evolution in hedge fund catego-rization. Hedge funds can no longer be generalized. This paper examines how this industry has been redefined, analyzes the recent and long-term performance for hedge funds, considers the case for hedge funds based on the current market environment, and details our outlook for certain high-conviction hedge fund strategies.
2 | J.P. Morgan Hedge Fund Strategies: Evaluating Hedge Funds in a Low-Growth and Low-Yield Environment
PORTFOLIO DISCUSSION: Title Copy HereINVESTMENTINSIGHTS EvaluatingHedgeFundsinaLow-GrowthandLow-YieldEnvironment
AredefinitionofhedgefundsandimprovedoversighthaveboostedinterestHedge funds are often labeled an “asset class.” In our view, hedge funds are access points to unlocking excess return via the underlying instruments through which they invest. This is particularly important for investors searching for yield or for plan sponsors seeking solutions that aim to achieve their return targets while reducing risks.
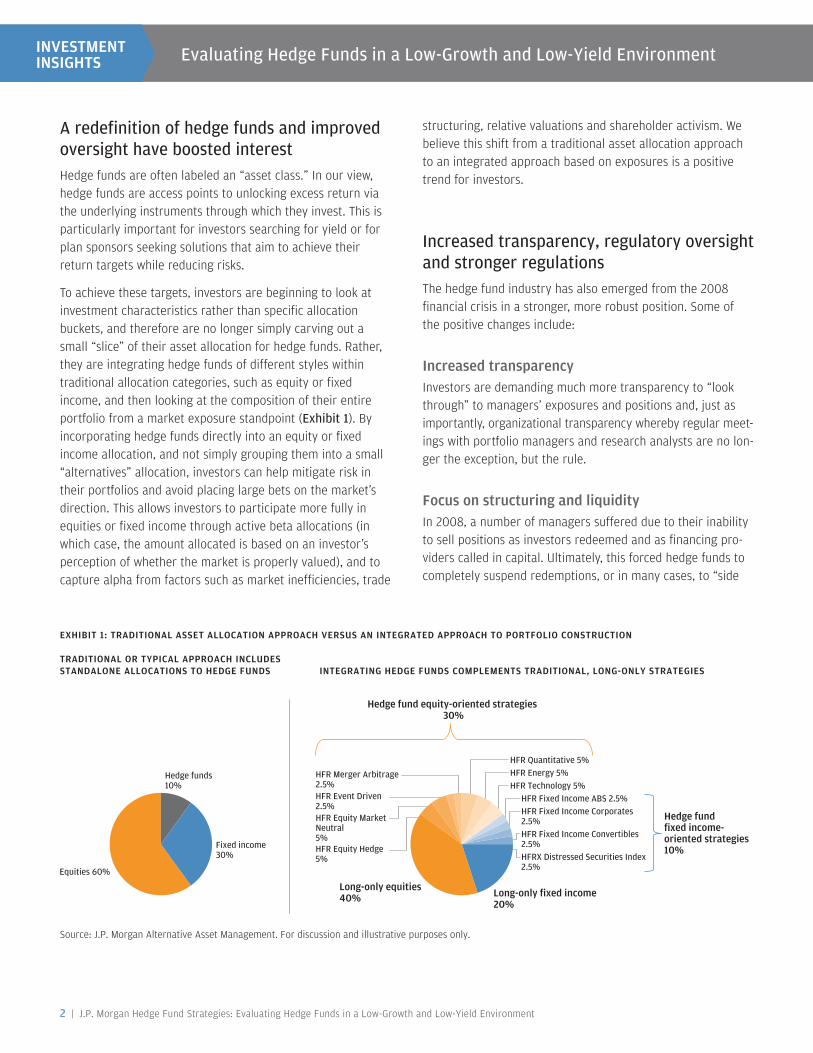
To achieve these targets, investors are beginning to look at investment characteristics rather than specific allocation buckets, and therefore are no longer simply carving out a small “slice” of their asset allocation for hedge funds. Rather, they are integrating hedge funds of different styles within traditional allocation categories, such as equity or fixed income, and then looking at the composition of their entire portfolio from a market exposure standpoint (Exhibit1). By incorporating hedge funds directly into an equity or fixed income allocation, and not simply grouping them into a small “alternatives” allocation, investors can help mitigate risk in their portfolios and avoid placing large bets on the market’s direction. This allows investors to participate more fully in equities or fixed income through active beta allocations (in which case, the amount allocated is based on an investor’s perception of whether the market is properly valued), and to capture alpha from factors such as market inefficiencies, trade
structuring, relative valuations and shareholder activism. We believe this shift from a traditional asset allocation approach to an integrated approach based on exposures is a positive trend for investors.
Increasedtransparency,regulatoryoversightandstrongerregulationsThe hedge fund industry has also emerged from the 2008 financial crisis in a stronger, more robust position. Some of the positive changes include:
Increased transparencyInvestors are demanding much more transparency to “look through” to managers’ exposures and positions and, just as importantly, organizational transparency whereby regular meet-ings with portfolio managers and research analysts are no lon-ger the exception, but the rule.
Focus on structuring and liquidityIn 2008, a number of managers suffered due to their inability to sell positions as investors redeemed and as financing pro-viders called in capital. Ultimately, this forced hedge funds to completely suspend redemptions, or in many cases, to “side
Hedge funds10%
Fixed income30%
Equities 60%
HFR Equity Hedge5%
HFR Equity MarketNeutral5%
HFR Event Driven2.5%
HFR Merger Arbitrage2.5%
HFR Quantitative 5%HFR Energy 5%
Hedge fund fixed income-oriented strategies10%
Long-only equities40%
HFR Technology 5%HFR Fixed Income ABS 2.5%HFR Fixed Income Corporates2.5%HFR Fixed Income Convertibles2.5%HFRX Distressed Securities Index2.5%
Long-only fixed income20%
Hedge fund equity-oriented strategies 30%
EXHIBIT 1: TRADITIONAL ASSET ALLOCATION APPROACH VERSUS AN INTEGRATED APPROACH TO PORTFOLIO CONSTRUCTION
TRADITIONAL OR TYPICAL APPROACH INCLUDES STANDALONE ALLOCATIONS TO HEDGE FUNDS INTEGRATING HEDGE FUNDS COMPLEMENTS TRADITIONAL, LONG-ONLY STRATEGIES
Source: J.P. Morgan Alternative Asset Management. For discussion and illustrative purposes only.
J.P. Morgan Asset Management | 3
pocket”1 their most illiquid positions and issue them in kind. Since then, investors have been more focused on portfolio liquidity when evaluating hedge funds, and many managers have responded by adjusting their redemption terms. Hedge funds have also better managed their leverage terms and counterparty risks since the crisis. These actions have put the industry on a much better footing.
Stronger regulations and third-party assuranceWe believe the increased oversight by regulators and third parties is a positive development and may help protect inves-tors and allow the industry to follow best practices.
• Regulators: There are more regulations being imposed on managers today, which is facilitating an increase in transparency, reducing conflicts of interest and necessitating compliance best practices.
• Auditors:While hedge funds employed auditors before 2008, there is now an increased scrutiny placed on the quality of the auditor with more investor due diligence required if a lesser-known auditor is used.
• Administrators:Prior to the crisis, a number of hedge fund managers self-administered and provided pricing for their positions. There are very few hedge fund managers today who self-administer, and institutional investors are almost universally rejecting the idea of investing with a manager who does.
• Valuationagents: Investors and auditors are paying closer attention to how managers price illiquid positions. In many cases, investors are requiring managers to hire third-party valuation agents to independently value these positions.
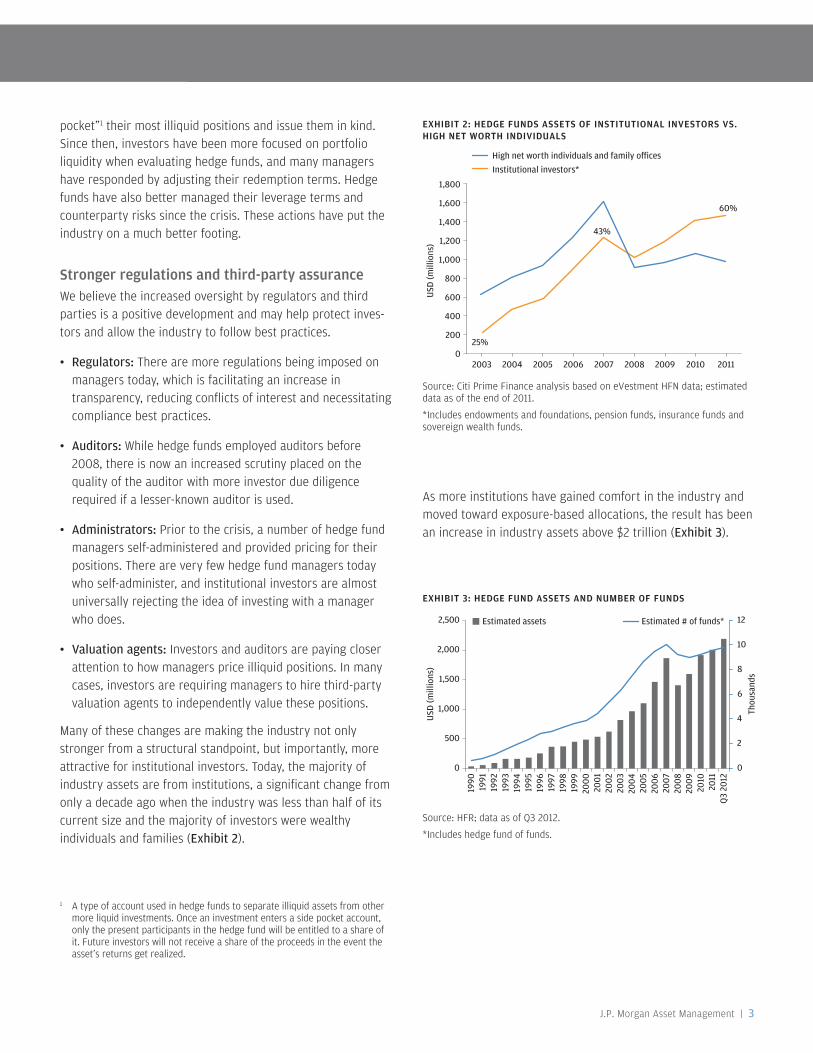
Many of these changes are making the industry not only stronger from a structural standpoint, but importantly, more attractive for institutional investors. Today, the majority of industry assets are from institutions, a significant change from only a decade ago when the industry was less than half of its current size and the majority of investors were wealthy individuals and families (Exhibit2).
As more institutions have gained comfort in the industry and moved toward exposure-based allocations, the result has been an increase in industry assets above $2 trillion (Exhibit3).
EXHIBIT 2: HEDGE FUNDS ASSETS OF INSTITUTIONAL INVESTORS VS. HIGH NET WORTH INDIVIDUALS
Source: Citi Prime Finance analysis based on eVestment HFN data; estimated data as of the end of 2011.
*Includes endowments and foundations, pension funds, insurance funds and sovereign wealth funds.
USD
(mill
ions
)
1,800
1,600
1,400
1,200
1,000
800
600
400
200
2003
25%
43%
60%
2004 2005 2006 2007 2008 2009 2010 20110
High net worth individuals and family o cesInstitutional investors*
EXHIBIT 3: HEDGE FUND ASSETS AND NUMBER OF FUNDS
Source: HFR; data as of Q3 2012.
*Includes hedge fund of funds.
0
2
4
6
8
10
12
0
500
1,000
1,500
2,000
2,500
1990
1991
1992
1993
1994
1995
1996
1997
1998
1999
2000
2001
2002
2003
2004
2005
2006
2007
2008
2009
2010
2011
Q3
2012
Thou
sand
s
USD
(mill
ions
)
Estimated assets Estimated # of funds*
1 A type of account used in hedge funds to separate illiquid assets from other more liquid investments. Once an investment enters a side pocket account, only the present participants in the hedge fund will be entitled to a share of it. Future investors will not receive a share of the proceeds in the event the asset’s returns get realized.
4 | J.P. Morgan Hedge Fund Strategies: Evaluating Hedge Funds in a Low-Growth and Low-Yield Environment
PORTFOLIO DISCUSSION: Title Copy HereINVESTMENTINSIGHTS EvaluatingHedgeFundsinaLow-GrowthandLow-YieldEnvironment
Despiterecentperformancechallenges,hedgefundresultsremainattractiveoverthelongterm
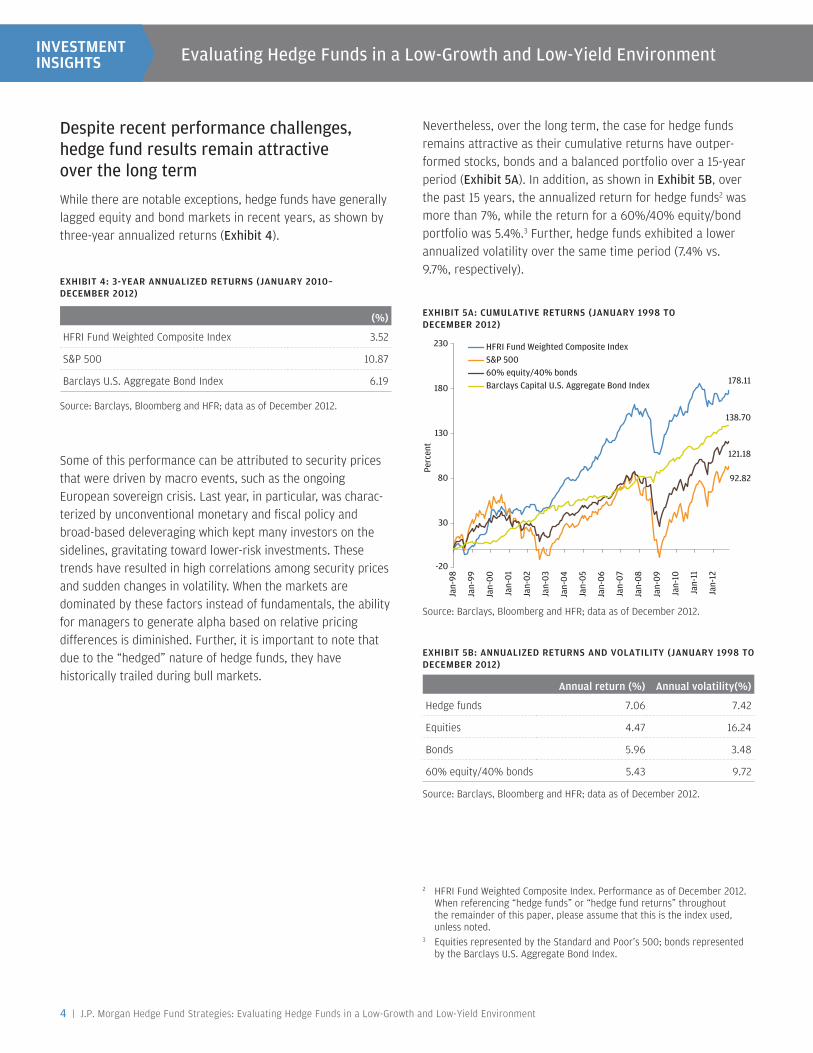
While there are notable exceptions, hedge funds have generally lagged equity and bond markets in recent years, as shown by three-year annualized returns (Exhibit4).
Some of this performance can be attributed to security prices that were driven by macro events, such as the ongoing European sovereign crisis. Last year, in particular, was charac-terized by unconventional monetary and fiscal policy and broad-based deleveraging which kept many investors on the sidelines, gravitating toward lower-risk investments. These trends have resulted in high correlations among security prices and sudden changes in volatility. When the markets are dominated by these factors instead of fundamentals, the ability for managers to generate alpha based on relative pricing differences is diminished. Further, it is important to note that due to the “hedged” nature of hedge funds, they have historically trailed during bull markets.
(%)
HFRI Fund Weighted Composite Index 3.52
S&P 500 10.87
Barclays U.S. Aggregate Bond Index 6.19
2 HFRI Fund Weighted Composite Index. Performance as of December 2012. When referencing “hedge funds” or “hedge fund returns” throughout the remainder of this paper, please assume that this is the index used, unless noted.
3 Equities represented by the Standard and Poor’s 500; bonds represented by the Barclays U.S. Aggregate Bond Index.
EXHIBIT 4: 3-YEAR ANNUALIZED RETURNS (JANUARY 2010– DECEMBER 2012)
Source: Barclays, Bloomberg and HFR; data as of December 2012.
EXHIBIT 5A: CUMULATIVE RETURNS (JANUARY 1998 TO DECEMBER 2012)
Source: Barclays, Bloomberg and HFR; data as of December 2012.
Source: Barclays, Bloomberg and HFR; data as of December 2012.
178.11
92.82
121.18
138.70
-20
30
80
130
180
230
Jan-
98
Jan-
99
Jan-
00
Jan-
01
Jan-
02
Jan-
03
Jan-
04
Jan-
05
Jan-
06
Jan-
07
Jan-
08
Jan-
09
Jan-
10
Jan-
11
Jan-
12
Perc
ent
HFRI Fund Weighted Composite IndexS&P 50060% equity/40% bondsBarclays Capital U.S. Aggregate Bond Index
EXHIBIT 5B: ANNUALIZED RETURNS AND VOLATILITY (JANUARY 1998 TO DECEMBER 2012)
Annual return (%) Annual volatility(%)
Hedge funds 7.06 7.42
Equities 4.47 16.24
Bonds 5.96 3.48
60% equity/40% bonds 5.43 9.72
Nevertheless, over the long term, the case for hedge funds remains attractive as their cumulative returns have outper-formed stocks, bonds and a balanced portfolio over a 15-year period (Exhibit5A). In addition, as shown in Exhibit5B, over the past 15 years, the annualized return for hedge funds2 was more than 7%, while the return for a 60%/40% equity/bond portfolio was 5.4%.3 Further, hedge funds exhibited a lower annualized volatility over the same time period (7.4% vs. 9.7%, respectively).
J.P. Morgan Asset Management | 5
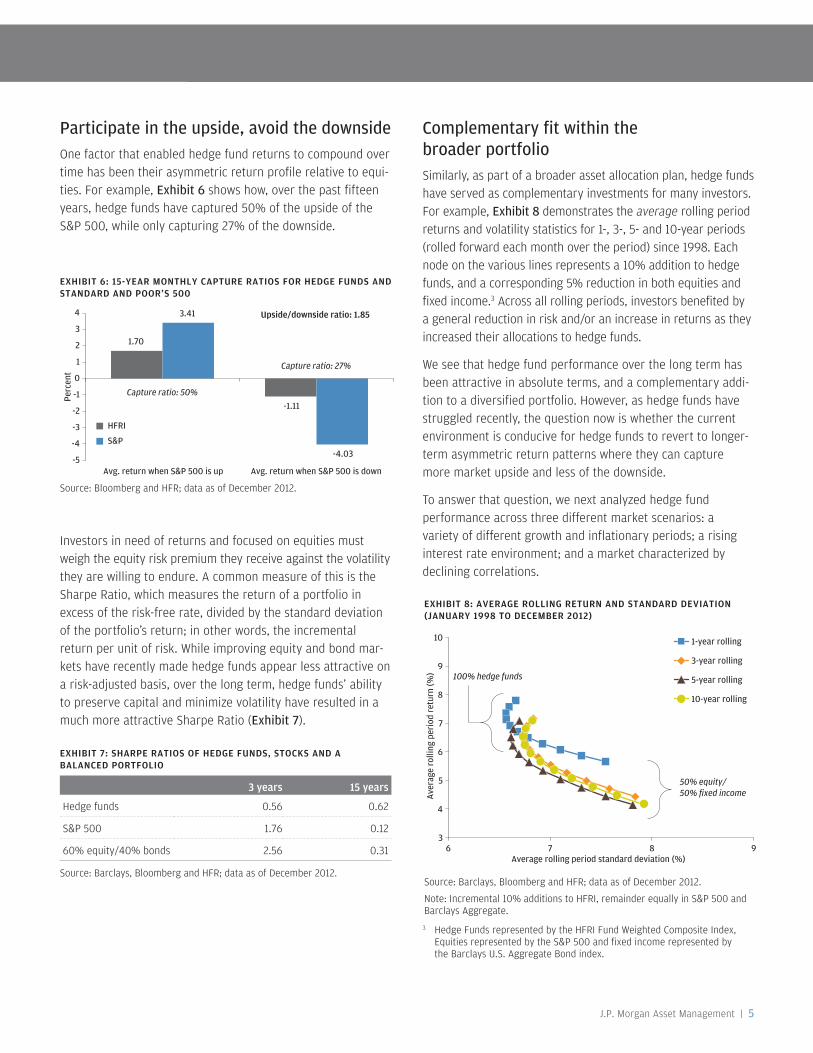
Participateintheupside,avoidthedownsideOne factor that enabled hedge fund returns to compound over time has been their asymmetric return profile relative to equi-ties. For example, Exhibit6shows how, over the past fifteen years, hedge funds have captured 50% of the upside of the S&P 500, while only capturing 27% of the downside.
Investors in need of returns and focused on equities must weigh the equity risk premium they receive against the volatility they are willing to endure. A common measure of this is the Sharpe Ratio, which measures the return of a portfolio in excess of the risk-free rate, divided by the standard deviation of the portfolio’s return; in other words, the incremental return per unit of risk. While improving equity and bond mar-kets have recently made hedge funds appear less attractive on a risk-adjusted basis, over the long term, hedge funds’ ability to preserve capital and minimize volatility have resulted in a much more attractive Sharpe Ratio (Exhibit7).
ComplementaryfitwithinthebroaderportfolioSimilarly, as part of a broader asset allocation plan, hedge funds have served as complementary investments for many investors. For example, Exhibit8demonstrates the average rolling period returns and volatility statistics for 1-, 3-, 5- and 10-year periods (rolled forward each month over the period) since 1998. Each node on the various lines represents a 10% addition to hedge funds, and a corresponding 5% reduction in both equities and fixed income.3 Across all rolling periods, investors benefited by a general reduction in risk and/or an increase in returns as they increased their allocations to hedge funds.
We see that hedge fund performance over the long term has been attractive in absolute terms, and a complementary addi-tion to a diversified portfolio. However, as hedge funds have struggled recently, the question now is whether the current environment is conducive for hedge funds to revert to longer-term asymmetric return patterns where they can capture more market upside and less of the downside.
To answer that question, we next analyzed hedge fund performance across three different market scenarios: a variety of different growth and inflationary periods; a rising interest rate environment; and a market characterized by declining correlations.
3 Hedge Funds represented by the HFRI Fund Weighted Composite Index, Equities represented by the S&P 500 and fixed income represented by the Barclays U.S. Aggregate Bond index.
EXHIBIT 6: 15-YEAR MONTHLY CAPTURE RATIOS FOR HEDGE FUNDS AND STANDARD AND POOR’S 500
Source: Bloomberg and HFR; data as of December 2012.
1.70
-1.11
3.41
-4.03-5
-4
-3
-2
-1
0
1
2
3
4
Avg. return when S&P 500 is up Avg. return when S&P 500 is down
Capture ratio: 50%
Perc
ent
Capture ratio: 27%
Upside/downside ratio: 1.85
HFRI
S&P
Source: Barclays, Bloomberg and HFR; data as of December 2012.
EXHIBIT 7: SHARPE RATIOS OF HEDGE FUNDS, STOCKS AND A BALANCED PORTFOLIO
3 years 15 years
Hedge funds 0.56 0.62
S&P 500 1.76 0.12
60% equity/40% bonds 2.56 0.31
EXHIBIT 8: AVERAGE ROLLING RETURN AND STANDARD DEVIATION (JANUARY 1998 TO DECEMBER 2012)
Source: Barclays, Bloomberg and HFR; data as of December 2012.
Note: Incremental 10% additions to HFRI, remainder equally in S&P 500 and Barclays Aggregate.
Aver
age
rolli
ng p
erio
d re
turn
(%)
Average rolling period standard deviation (%)
3
4
5
6
7
8
9
10
6 7 8 9
1-year rolling
3-year rolling
5-year rolling
10-year rolling
50% equity/50% fixed income
100% hedge funds
6 | J.P. Morgan Hedge Fund Strategies: Evaluating Hedge Funds in a Low-Growth and Low-Yield Environment
PORTFOLIO DISCUSSION: Title Copy HereINVESTMENTINSIGHTS EvaluatingHedgeFundsinaLow-GrowthandLow-YieldEnvironment
Outperformanceacrossmarketscenarios
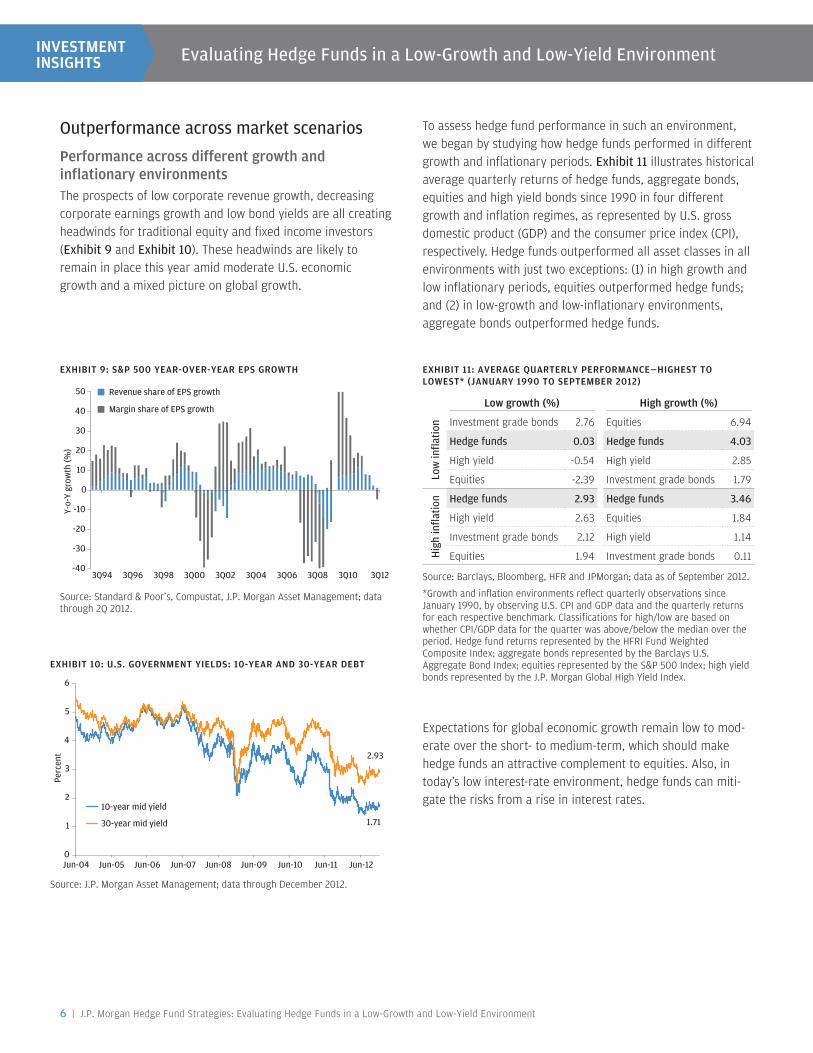
Performance across different growth and inflationary environmentsThe prospects of low corporate revenue growth, decreasing corporate earnings growth and low bond yields are all creating headwinds for traditional equity and fixed income investors (Exhibit9andExhibit10). These headwinds are likely to remain in place this year amid moderate U.S. economic growth and a mixed picture on global growth.
To assess hedge fund performance in such an environment, we began by studying how hedge funds performed in different growth and inflationary periods. Exhibit11 illustrates historical average quarterly returns of hedge funds, aggregate bonds, equities and high yield bonds since 1990 in four different growth and inflation regimes, as represented by U.S. gross domestic product (GDP) and the consumer price index (CPI), respectively. Hedge funds outperformed all asset classes in all environments with just two exceptions: (1) in high growth and low inflationary periods, equities outperformed hedge funds; and (2) in low-growth and low-inflationary environments, aggregate bonds outperformed hedge funds.
Expectations for global economic growth remain low to mod-erate over the short- to medium-term, which should make hedge funds an attractive complement to equities. Also, in today’s low interest-rate environment, hedge funds can miti-gate the risks from a rise in interest rates.
EXHIBIT 10: U.S. GOVERNMENT YIELDS: 10-YEAR AND 30-YEAR DEBT
Source: J.P. Morgan Asset Management; data through December 2012.
1.71
2.93
0
1
2
3
4
5
6
Jun-04 Jun-05 Jun-06 Jun-07 Jun-08 Jun-09 Jun-10 Jun-11 Jun-12
Perc
ent
10-year mid yield
30-year mid yield
EXHIBIT 11: AVERAGE QUARTERLY PERFORMANCE—HIGHEST TO LOWEST* (JANUARY 1990 TO SEPTEMBER 2012)
Source: Barclays, Bloomberg, HFR and JPMorgan; data as of September 2012.
*Growth and inflation environments reflect quarterly observations since January 1990, by observing U.S. CPI and GDP data and the quarterly returns for each respective benchmark. Classifications for high/low are based on whether CPI/GDP data for the quarter was above/below the median over the period. Hedge fund returns represented by the HFRI Fund Weighted Composite Index; aggregate bonds represented by the Barclays U.S. Aggregate Bond Index; equities represented by the S&P 500 Index; high yield bonds represented by the J.P. Morgan Global High Yield Index.
Low growth (%) High growth (%)
Low
infla
tion Investment grade bonds 2.76 Equities 6.94
Hedgefunds 0.03 Hedgefunds 4.03
High yield -0.54 High yield 2.85
Equities -2.39 Investment grade bonds 1.79
Hig
hin
flatio
n Hedgefunds 2.93 Hedgefunds 3.46
High yield 2.63 Equities 1.84
Investment grade bonds 2.12 High yield 1.14
Equities 1.94 Investment grade bonds 0.11
EXHIBIT 9: S&P 500 YEAR-OVER-YEAR EPS GROWTH
Source: Standard & Poor’s, Compustat, J.P. Morgan Asset Management; data through 2Q 2012.
Y-o-
Y gr
owth
(%)
-40
-30
-20
-10
0
10
20
30
40
50
3Q123Q103Q083Q063Q043Q023Q003Q983Q963Q94
Revenue share of EPS growth
Margin share of EPS growth
J.P. Morgan Asset Management | 7
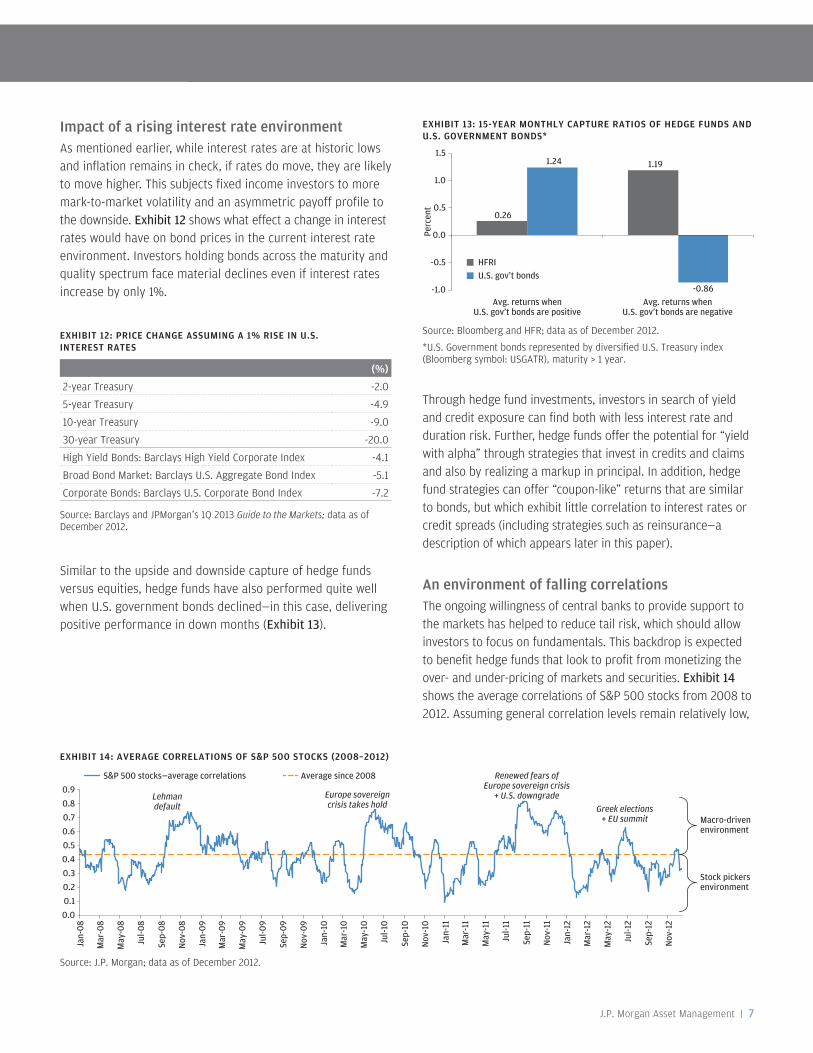
Impact of a rising interest rate environmentAs mentioned earlier, while interest rates are at historic lows and inflation remains in check, if rates do move, they are likely to move higher. This subjects fixed income investors to more mark-to-market volatility and an asymmetric payoff profile to the downside. Exhibit12shows what effect a change in interest rates would have on bond prices in the current interest rate environment. Investors holding bonds across the maturity and quality spectrum face material declines even if interest rates increase by only 1%.
Similar to the upside and downside capture of hedge funds versus equities, hedge funds have also performed quite well when U.S. government bonds declined—in this case, delivering positive performance in down months (Exhibit13).
Through hedge fund investments, investors in search of yield and credit exposure can find both with less interest rate and duration risk. Further, hedge funds offer the potential for “yield with alpha” through strategies that invest in credits and claims and also by realizing a markup in principal. In addition, hedge fund strategies can offer “coupon-like” returns that are similar to bonds, but which exhibit little correlation to interest rates or credit spreads (including strategies such as reinsurance—a description of which appears later in this paper).
An environment of falling correlationsThe ongoing willingness of central banks to provide support to the markets has helped to reduce tail risk, which should allow investors to focus on fundamentals. This backdrop is expected to benefit hedge funds that look to profit from monetizing the over- and under-pricing of markets and securities. Exhibit14shows the average correlations of S&P 500 stocks from 2008 to 2012. Assuming general correlation levels remain relatively low,
EXHIBIT 12: PRICE CHANGE ASSUMING A 1% RISE IN U.S. INTEREST RATES
Source: Barclays and JPMorgan’s 1Q 2013 Guide to the Markets; data as of December 2012.
(%)
2-year Treasury -2.0
5-year Treasury -4.9
10-year Treasury -9.0
30-year Treasury -20.0
High Yield Bonds: Barclays High Yield Corporate Index -4.1
Broad Bond Market: Barclays U.S. Aggregate Bond Index -5.1
Corporate Bonds: Barclays U.S. Corporate Bond Index -7.2
EXHIBIT 13: 15-YEAR MONTHLY CAPTURE RATIOS OF HEDGE FUNDS AND U.S. GOVERNMENT BONDS*
Source: Bloomberg and HFR; data as of December 2012.
*U.S. Government bonds represented by diversified U.S. Treasury index (Bloomberg symbol: USGATR), maturity > 1 year.
HFRIU.S. gov’t bonds
Perc
ent
Avg. returns whenU.S. gov’t bonds are positive
Avg. returns whenU.S. gov’t bonds are negative
0.26
1.191.24
-0.86-1.0
-0.5
0.0
0.5
1.0
1.5
EXHIBIT 14: AVERAGE CORRELATIONS OF S&P 500 STOCKS (2008–2012)
Source: J.P. Morgan; data as of December 2012.
Macro-drivenenvironment
Lehmandefault
Europe sovereigncrisis takes hold
Renewed fears ofEurope sovereign crisis
+ U.S. downgrade
Greek elections+ EU summit
0.00.10.20.30.40.50.60.70.80.9
Jan-
08
Mar
-08
May
-08
Jul-0
8
Sep-
08
Nov
-08
Jan-
09
Mar
-09
May
-09
Jul-0
9
Sep-
09
Nov
-09
Jan-
10
Mar
-10
May
-10
Jul-1
0
Sep-
10
Nov
-10
Jan-
11
Mar
-11
May
-11
Jul-1
1
Sep-
11
Nov
-11
Jan-
12
Mar
-12
May
-12
Jul-1
2
Sep-
12
Nov
-12
S&P 500 stocks—average correlations Average since 2008
Stock pickersenvironment

8 | J.P. Morgan Hedge Fund Strategies: Evaluating Hedge Funds in a Low-Growth and Low-Yield Environment
PORTFOLIO DISCUSSION: Title Copy HereINVESTMENTINSIGHTS EvaluatingHedgeFundsinaLow-GrowthandLow-YieldEnvironment
and that there are fewer macro driven spikes in correlation, the moderation should create greater dispersion across securities and provide opportunities for managers.
To illustrate why this may be beneficial, consider the returns of equity long/short managers. When securities move in tandem, it is more difficult for active managers to find opportunities to be long and short positions that are either under or overval-ued. With lower risks in the macro environment, it is less likely that correlations will be high for extended periods (or spike around news related to various external factors). Exhibit15 is a scatterplot that shows the month-end Standard & Poor’s 500 constituent stock correlation levels and the monthly returns for equity long/short hedge funds. Returns have been stronger in low correlation environments such as the one we are in today.
ManagerselectioniskeytoperformingacrossmarketcyclesHedge fund investors have to focus on two key areas: 1) selecting the right managers; and 2) adjusting their allocations to hedge fund strategies based on the current market environment. We believe manager selection is the key to success since the dispersion of returns among the best and worst performing managers is very high relative to traditional allocations. Exhibit16 illustrates the dispersion of manager returns across hedge fund strategies compared with the dispersion among long-only equity managers. As illustrated, picking a hedge fund manager in the top quartile versus the bottom quartile will have a significant impact.
EXHIBIT 16: DISPERSION OF HEDGE FUND RETURNS VS. TRADITIONAL “LONG-ONLY” EQUITY—TRAILING 10-YEAR PERIOD (JANUARY 2002–DECEMBER 2011)
Source: HFR and Morningstar Inc.; data is estimated as of December 31, 2011.
Perf
orm
ance
rel
ativ
e to
50t
h pe
rcen
tile
(%)
-20
-10
0
10
20
Long/Short
Equities
Opportunistic/Macro
ShortSelling
DistressedSecurities
RelativeValue
MergerArbitrage
LongOnly
2nd quartileTop quartile 3rd quartile Bottom quartile
EXHIBIT 15: EQUITY LONG/SHORT MANAGER RETURNS VS. CORRELATIONS (JANUARY 2008-DECEMBER 2012)
Source: HFR and J.P. Morgan; data as of December 2012.
-12
-10
-8
-6
-4
-2
0
2
4
6
8
0 0.1 0.2 0.3 0.4 0.5 0.6 0.7 0.8 0.9
HFR
I equ
ity h
edge
mon
thly
ret
urns
(%)
S&P 500 one-month correlation levels (as of month end)

J.P. Morgan Asset Management | 9
Though hedge fund returns have been attractive over the long-term, investors can further enhance their returns with timely strategy allocation shifts. Similar to equities and bonds, the relative attractiveness of hedge fund strategies will change materially depending on factors such as the macro environ-ment, valuations, market liquidity or available deal flow. This variability can translate into frequent changes in relative returns among hedge fund strategies year-over-year.
EXHIBIT 17: HEDGE FUND STRATEGY PERFORMANCE (1998 TO 2011)
Source: HFR; data as of December 2011.
1998 1999 2000 2001 2002 2003 2004 2005 2006 2007 2008 2009 2010 2011
S&P 500 HFRIEmergingMarkets
HFRI ED: Merger Arb
HFRI RV: Conver Arb
Barclays Govt/Credit
HFRIEmergingMarkets
HFRI ED: Distressed
HFRIEmergingMarkets
HFRIEmergingMarkets
HFRIEmergingMarkets
Barclays Govt/Credit
HFRI RV: Conver Arb S&P 500 Barclays
Govt/Credit
28.59% 55.86% 18.02% 13.37% 12.10% 39.36% 18.89% 21.04% 24.26% 24.92% 6.09% 60.17% 15.08% 9.24%
HFRI Equity Hedge
HFRI Equity Hedge
HFRI EH: Eq Mrkt Nrtrl
HFRI ED: Distressed
HFRI RV: Convert Arb
HFRI ED: Distressed
HFRIEmergingMarkets
HFRI Equity Hedge
HFRI ED: Distressed HFRI Macro HFRI Macro HFRI
EmergingMarkets
HFRI RV: Conver Arb S&P 500
15.98% 44.22% 14.56% 13.28% 9.05% 29.56% 18.42% 10.60% 15.94% 11.11% 4.83% 40.24% 13.07% 2.09%
Barclays Govt/Credit
HFRI Fund Wghtd Comp
HFRI RV: Conver Arb
HFRI Event-Driven HFRI Macro S&P 500 HFRI Event-
DrivenHFRI Fund
Wghtd Comp S&P 500 HFRI Equity Hedge
HFRI ED: Merger Arb
HFRI ED: Distressed
HFRIEmergingMarkets
HFRI ED: Merger Arb
12.00% 31.29% 14.50% 12.18% 7.44% 28.67% 15.01% 9.30% 15.78% 10.48% -5.36% 28.13% 11.96% 1.48%
HFRI EH: Eq Mkt Ntrl
HFRI FOF Composite
HFRI Relative Value
HFRIEmergingMarkets
HFRI Relative Value
HFRI Event-Driven S&P 500 HFRI ED:
DistressedHFRI Event-
DrivenHFRI FOF Composite
HFRI EH: Eq Mrkt Ntrl S&P 500 HFRI Relative
ValueHFRI Relative
Value
8.30% 26.47% 13.41% 10.36% 5.44% 25.33% 10.86% 8.27% 15.33% 10.25% -5.93% 26.47% 11.73% 0.15%
HFRI RV: Conver Arb
HFRI Event-Driven
Barclays Govt/Credit
Barclays Gov/tCredit
HFRI ED: Distressed HFRI Macro HFRI Fund
Wghtd CompHFRI FOF Composite
HFRI ED: Merger Arb
HFRI Fund Wghtd Comp
HFRI Relative Value
HFRI Relative Value
HFRI Event-Driven
HFRI ED: Distressed
7.77% 24.33% 13.27% 9.40% 5.28% 21.42% 9.03% 7.49% 14.24% 9.96% -18.04% 25.80% 11.53% -1.79%
HFRI ED: Merger Arb S&P 500 HFRI Equity
HedgeHFRI Relative
ValueHFRI
EmergingMarkets
HFRI Equity Hedge
HFRI Equity Hedge
HFRI Event-Driven
HFRI Fund Wghtd Comp
HFRI Relative Value
HFRI Fund Wghtd Comp
HFRI Event-Driven
HFRI ED: Distressed
HFRI EH: Eq Mrkt Ntrl
7.23% 21.03% 9.09% 8.92% 3.70% 20.54% 7.68% 7.29% 12.89% 8.94% -19.02% 25.04% 11.26% -2.12%
HFRI Macro HFRI Macro HFRI Event-Driven HFRI Macro HFRI FOF
CompositeHFRI Fund
Wghtd CompHFRI FOF Composite HFRI Macro HFRI Relative
ValueBarclays
Govt/CreditHFRI FOF Composite
HFRI Equity Hedge
HFRI Equity Hedge
HFRI Event-Driven
6.19% 17.62% 6.74% 6.87% 1.02% 19.55% 6.86% 6.79% 12.37% 7.75% -21.36% 24.55% 10.58% -3.30%
HFRI Relative Value
HFRI ED: Distressed
HFRI Fund Wghtd Comp
HFRI EH: Eq Mrkt Ntrl
HFRI EH: Eq Mrkt Ntrl
HFRI FOF Composite
HFRI Relative Value
HFRI ED: Merger Arb
HFRI RV: Convert Arb
HFRI ED: Merger Arb
HFRI Event-Driven
HFRI Fund Wghtd Comp
HFRI Fund Wghtd Comp HFRI Macro
2.81% 16.94% 4.98% 6.71% 0.98% 11.61% 5.58% 6.25% 12.17% 7.05% -21.82% 19.98% 10.49% -4.16%
HFRI Fund Wghtd Comp
HFRI Relative Value
HFRI FOF Composite
HFRI Fund Wghtd Comp
HFRI ED: Merger Arb
HFRI RV: Convert Arb HFRI Macro HFRI EH:
Eq Mrkt NtrlHFRI Equity
HedgeHFRI Event-
DrivenHFRI ED:
DistressedHFRI ED:
Merger Arb HFRI Macro HFRI RV: Convert Arb
2.62% 14.73% 4.07% 4.62% -0.87% 9.93% 4.63% 6.22% 11.71% 6.61% -25.20% 11.63% 8.61% -5.16%
HFRI Event-Driven
HFRI RV: Convert Arb
HFRI ED: Distressed
HFRI FOF Composite
HFRI Fund Wghtd Comp
HFRI Relative Value
Barclays Govt/Credit
HFRI Relative Value
HFRI FOF Composite S&P 500 HFRI Equity
HedgeHFRI FOF Composite
Barclays Govt/Credit
HFRI Fund Wghtd Comp
1.70% 14.41% 2.78% 2.80% -1.45% 9.72% 4.54% 6.02% 10.39% 5.49% -26.65% 11.46% 6.99% -5.25%
HFRI ED: Distressed
HFRI ED: Merger Arb HFRI Macro HFRI ED:
Merger ArbHFRI Event-
DrivenHFRI ED:
Merger Arb HFRI EH:
Eq Mrkt Ntrl S&P 500 HFRI Macro HFRI RV: Convert Arb
HFRI RV: Convert Arb
Barclays Govt/Credit
HFRI FOF Composite
HFRI FOF Composite
-4.23% 14.34% 1.97% 2.76% -4.30% 7.47% 4.15% 4.91% 8.15% 5.33% -33.71% 4.81% 5.60% -5.73%
HFRI FOF Composite
HFRI EH: Eq Mrkt Ntrl S&P 500 HFRI Equity
HedgeHFRI Equity
HedgeBarclays
Govt/CreditHFRI ED:
Merger ArbBarclays
Govt/Credit HFRI EH:
Eq Mrkt Ntrl HFRI EH:
Eq Mrkt Ntrl S&P 500 HFRI Macro HFRI ED: Merger Arb
HFRI Equity Hedge
-5.11% 7.09% -9.09% 0.40% -4.71% 5.07% 4.08% 2.55% 7.32% 5.29% -36.99% 4.37% 4.60% -8.38%
HFRIEmergingMarkets
Barclays Govt/Credit
HFRIEmergingMarkets
S&P 500 S&P 500 HFRI EH: Eq Mrkt Ntrl
HFRI RV: Convert Arb
HFRI RV: Convert Arb
Barclays Govt/Credit
HFRI ED: Distressed
HFRIEmerging Markets
HFRI EH: Eq Mrkt Ntrl
HFRI EH: Eq Mrkt Ntrl
HFRIEmergingMarkets
-32.96% -2.40% -10.71% -11.85% -22.09% 2.44% 1.18% -1.86% 4.07% 5.08% -37.26% 1.43% 3.16% -13.99%
Exhibit17shows the returns of the various hedge fund strategies and broad markets each year since 1998, ranked from the highest returning strategies to the lowest. As shown, there are considerable changes in the strategies that out-perform and underperform each year. Investors (or their advisors) with a defined process and capital markets expertise to prudently adjust allocations to strategies can outperform a passive hedge fund index that maintains a relatively constant strategy allocation.
10 | J.P. Morgan Hedge Fund Strategies: Evaluating Hedge Funds in a Low-Growth and Low-Yield Environment
PORTFOLIO DISCUSSION: Title Copy HereINVESTMENTINSIGHTS EvaluatingHedgeFundsinaLow-GrowthandLow-YieldEnvironment
StrategiesforthecurrentenvironmentGiven the wide disparity in hedge fund manager returns, investors can take advantage of timely strategy allocation shifts to enhance returns in a low-growth, low-inflationary environ-ment. We believe there are abundant opportunities for hedge fund investors in several key areas: multi-strategy funds, reinsurance, shareholder activism and emerging markets.
Multi-strategy fundsMany multi-strategy funds enjoyed a strong 2012 and are well positioned for 2013. The ability to dynamically allocate capital across a diverse set of geographies, asset classes and invest-ment strategies provides such funds with the opportunity to generate alpha in varying market environments. The insights gathered through portfolio management teams evaluating opportunities across a broad investment universe enables fund managers to react nimbly to perceived changes in the outlook for underlying investment strategies. In addition, given significant variations in volatility levels and correlations among asset classes, multi-strategy funds are able to manage portfolio exposures through both capital allocation changes and overlay hedges, utilizing real-time portfolio transparency and high levels of liquidity.
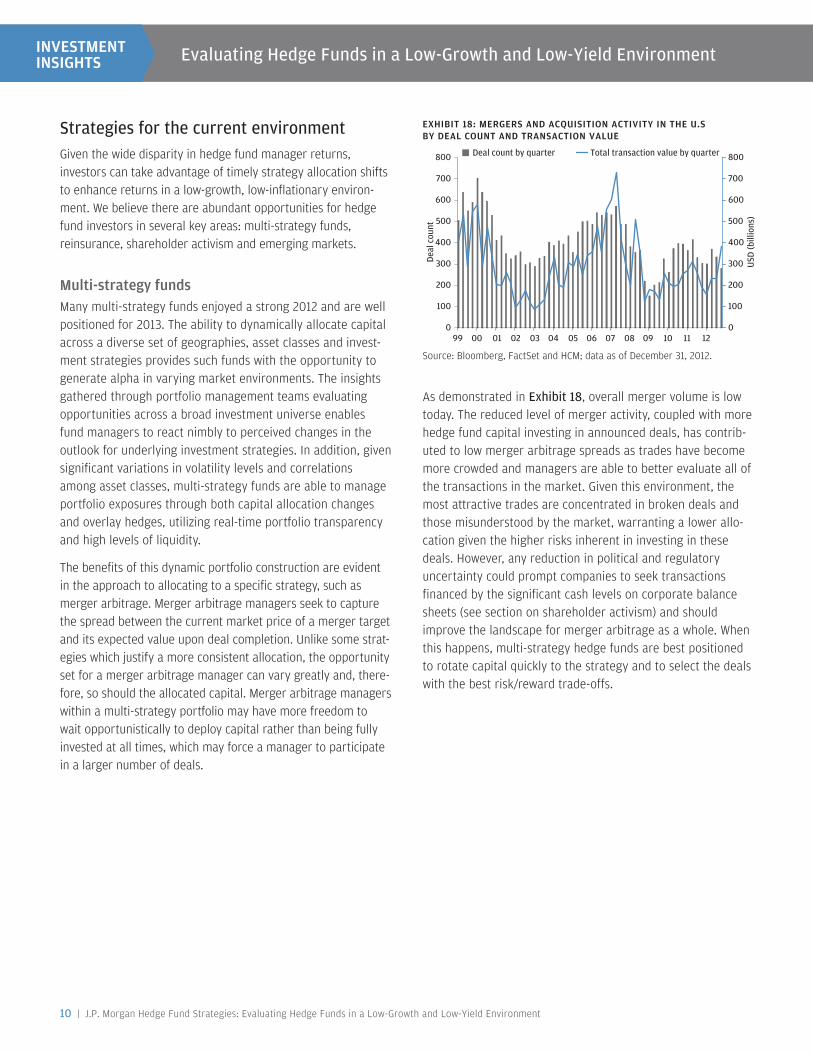
The benefits of this dynamic portfolio construction are evident in the approach to allocating to a specific strategy, such as merger arbitrage. Merger arbitrage managers seek to capture the spread between the current market price of a merger target and its expected value upon deal completion. Unlike some strat-egies which justify a more consistent allocation, the opportunity set for a merger arbitrage manager can vary greatly and, there-fore, so should the allocated capital. Merger arbitrage managers within a multi-strategy portfolio may have more freedom to wait opportunistically to deploy capital rather than being fully invested at all times, which may force a manager to participate in a larger number of deals.
As demonstrated in Exhibit18, overall merger volume is low today. The reduced level of merger activity, coupled with more hedge fund capital investing in announced deals, has contrib-uted to low merger arbitrage spreads as trades have become more crowded and managers are able to better evaluate all of the transactions in the market. Given this environment, the most attractive trades are concentrated in broken deals and those misunderstood by the market, warranting a lower allo-cation given the higher risks inherent in investing in these deals. However, any reduction in political and regulatory uncertainty could prompt companies to seek transactions financed by the significant cash levels on corporate balance sheets (see section on shareholder activism) and should improve the landscape for merger arbitrage as a whole. When this happens, multi-strategy hedge funds are best positioned to rotate capital quickly to the strategy and to select the deals with the best risk/reward trade-offs.
EXHIBIT 18: MERGERS AND ACQUISITION ACTIVITY IN THE U.S BY DEAL COUNT AND TRANSACTION VALUE
Source: Bloomberg, FactSet and HCM; data as of December 31, 2012.
0
100
200
300
400
500
600
700
800
0
100
200
300
400
500
600
700
800
USD
(bill
ions
)
Deal
cou
nt
Deal count by quarter Total transaction value by quarter
99 00 01 02 03 04 05 06 07 08 09 10 11 12

J.P. Morgan Asset Management | 11
ReinsuranceAs a hedge fund strategy, reinsurance can offer attractive returns that are uncorrelated with broader markets and other hedge fund strategies. As an example, Exhibit19 shows the correlations of catastrophe bonds to other asset classes. While catastrophe bonds are not broad enough to represent how hedge funds approach the reinsurance market, their correla-tions are generally representative.
Broadly speaking, reinsurance hedge fund managers agree to cover another insurance company should it incur a loss from natural catastrophes. Generally, the hedge fund will place a limit on the coverage amount, and the purchaser of protection will pay a premium to the hedge fund. In many cases, the cash flows and coverage are very similar to a bond. For that rea-son, many institutional investors consider a reinsurance allo-cation as part of their “traditional” fixed income allocation.
Further, with the increase in demand for reinsurance in the market, hedge funds often have more flexibility in choosing what types of coverage to write and under what terms, com-pared with traditional reinsurance companies. For example, even with the devastation caused by Hurricane Sandy in the United States in October 2012, losses among reinsurance hedge funds were generally very minor (with some managers not impacted at all).
Following the series of natural disasters that occurred from 2010 to 2012, reinsurance premiums (i.e., the returns that investors receive when investing in a hedge fund) increased and remain attractive today. As an example, as of 2012, cur-rent pricing for a high conviction reinsurance hedge fund man-ager suggests a 75% probability (using historical statistics of
covered perils) of 12-month returns that are 14% (net) or greater for the January 2013 renewal season, with a historical correlation to the S&P 500 for the fund of only 0.04.
Shareholder activism Shareholder activism is the process by which a shareholder attempts to use his or her influence to persuade management to implement changes that he or she believes will be beneficial to all shareholders. The current backdrop for hedge fund strat-egies that focus on shareholder activism is attractive. In today’s low interest rate environment, financing is inexpensive for activists who look for companies to use as a platform to make synergistic acquisitions. Further, as mentioned earlier, compa-nies are holding a significant amount of cash on their balance sheets (Exhibit20). This opens up opportunities for activists who can encourage companies to use this cash to enhance shareholder value in the form of special dividends, acquisitions and tender offers, and share repurchases.
Source: Bloomberg; data as of December 2012.
EXHIBIT 19: 10-YEAR CORRELATIONS (JANUARY 2003–DECEMBER 2012)
Swiss Re BB Cat Bond
Index
HFRI Fund of Funds
Index
HFRI Fund Weighted
Composite Index S&P 500
Barclays U.S. Aggregate
Bond Index
JPMorgan Global High Yield Index
S&P GSCI Total Return
Index
Swiss Re BB Cat Bond Index 1.00
HFRI Fund of Funds Index 0.26 1.00
HFRI Fund Weighted Composite Index 0.22 0.95 1.00
S&P 500 0.20 0.65 0.80 1.00
Barclays Capital US Aggregate Bond Index 0.25 0.00 -0.01 -0.03 1.00
JPMorgan Global High Yield Index 0.29 0.67 0.74 0.70 0.19 1.00
S&P GSCI Total Return Index 0.12 0.59 0.57 0.35 0.00 0.39 1.00
EXHIBIT 20: CORPORATE CASH AS A PERCENTAGE OF CURRENT ASSETS—S&P 500 COMPANIES
Source: FactSet, J.P. Morgan Asset Management and Standard & Poor’s; data as of June 29, 2012.
10
15
20
Perc
ent
25
30
Mar
-00
Sep-
00M
ar-0
1Se
p-01
Mar
-02
Sep-
02M
ar-0
3Se
p-03
Mar
-04
Sep-
04M
ar-0
5Se
p-05
Mar
-06
Sep-
06M
ar-0
7Se
p-07
Mar
-08
Sep-
08M
ar-0
9Se
p-09
Mar
-10
Sep-
10M
ar-1
1Se
p-11
Mar
-12

12 | J.P. Morgan Hedge Fund Strategies: Evaluating Hedge Funds in a Low-Growth and Low-Yield Environment
PORTFOLIO DISCUSSION: Title Copy HereINVESTMENTINSIGHTS EvaluatingHedgeFundsinaLow-GrowthandLow-YieldEnvironment
For an example of an activist investment executed by a closely followed hedge fund, consider Misys PLC. The hedge fund manager took positions in the European-based company in 2007 as the company had two strong software businesses in the financial sector and healthcare sector, each with strong product and growth expectations. The manager felt that it could persuade the board to split up the company and reduce costs through an activist approach. After an initial investment, the manager positioned to get a seat on the board, and was able to persuade the company to split into two businesses, making them “pure plays” in their respective industries and rationalizing higher valuations. The manager also recom-mended a merger of the healthcare business with a strategic partner and later sold its stake in the merged entity. The manager’s last move was to sell the financial software business to a private equity firm in June 2012 at a 25% premium. Considering that the company was based in Europe during a difficult period in the region, selling at such a premium was a true value-add by the manager. Overall, the manager generated considerable alpha on the investment over the FTSE index.
Emerging markets Hedge funds can invest in emerging markets by investing in the equity or debt of a security or through local currency trades. An area we find particularly attractive is the Mexican peso. Mexico has experienced a large gain in competitiveness in the past decade, partially driven by maintaining a weak currency and experiencing only modest wage growth (Exhibit21A). This makes the country more attractive as an exporter to the United States relative to China, which is further enhanced by its proximity to the U.S. (Exhibit21B). This could set the stage for the peso to rise in value.
Even as many view the risks of a severe negative event in Europe occurring in 2013 as less probable, some managers have chosen to put on protective shorts in the euro and in assets related to European growth (for example in Eastern Europe) as an indirect hedge to their emerging market posi-tions in 2013. By structuring trades such as this, managers can generate attractive net profits in emerging markets while guarding against negative macro events.
EXHIBIT 21B: CHINA AND MEXICO—MARKET SHARE OF U.S. IMPORTS
Source: Reuters EcoWin; data as of September 2012.
Mexico
China
5.0
7.5
10.0
12.5
15.0
17.5
20.0
1996
1997
1998
1999
2000
2001
2002
2003
2004
2005
2006
2007
2008
2009
2010
2011
2012
% o
f U.S
. im
port
s
EXHIBIT 21A: CHINA AND MEXICO—MANUFACTURING: AVERAGE HOURLY EARNINGS (USD)
Source: Ministerio de Economia y Hacienda—Mexico, ILO database and Gavea Investimentos; data as of 2011.
USD
per
hour
0.0
0.5
1.0
1.5
2.0
2.5
2002 2003 2004 2005 2006 2007 2008 2009 2010 2011
China
Mexico

J.P. Morgan Asset Management | 13
SummaryThere are reasons to be optimistic in 2013, as the European sovereign crisis and other political and macro risks seem more controlled than they have been over the past couple of years. However, traditional equity and fixed income investors face challenges in today’s low-growth and low-rate environment. As a result, institutional investors are increasingly looking to hedge funds to complement their asset allocation plans. Over the long term, hedge funds have performed well on a relative basis across a variety of growth and interest rate environ-ment, and have also offered downside protection during equity market corrections. Further, unlike long-only fixed income investments, hedge funds may be less susceptible to mark-to-market declines if interest rates rise.
As institutional investors increased their allocations to hedge funds, many have taken an integrated approach to their port-folio construction process by incorporating hedge funds within allocations that were previously reserved for traditional long-only managers instead of grouping hedge funds under a broad “alternatives” classification. Doing so allows investors to par-tially mitigate their downside beta, improve risk-adjusted returns of their entire portfolio and capture alpha.
We believe today’s environment for hedge funds is especially promising. With correlations declining and stock dispersion likely to increase, equity long/short managers should find opportunities to profit from fundamentals. Shareholder activists remain well positioned to influence companies to use their excess cash to enhance shareholder value, while multi-strategy managers have the flexibility to rotate capital to opportunities that surface as the economic environment changes. There are attractive yields and returns to be found in emerging market debt and equity, and hedge funds offer the unique capability to hedge against systematic risks. Reinsurance managers offer attractive premiums and coupon-like returns with very low correlations to other asset classes and other hedge fund strategies. Finally, investors can capture opportunities in less trafficked markets by allocating to managers who invest in emerging markets.

14 | J.P. Morgan Hedge Fund Strategies: Evaluating Hedge Funds in a Low-Growth and Low-Yield Environment
PORTFOLIO DISCUSSION: Title Copy HereINVESTMENTINSIGHTS EvaluatingHedgeFundsinaLow-GrowthandLow-YieldEnvironment
CONTACTS
RobertKleinGlobal Head of Hedge Fund StrategiesNew York: 212-464-1265
JohnAndersonJ.P. Morgan Alternative Asset ManagementNew York: 212-648-0454
DiogoAquinoGávea InvestimentosBrazil: 55 21 3526 9135
LynnetteSFergusonJ.P. Morgan Asset Management (JPMorgan Proprietary Strategies)London: +44-207-7425244
SachinSinghJ.P. Morgan Asset ManagementNew York: 212-464-2537
KimberlyWestHighbridge Capital ManagementNew York: 212-287-4268

J.P. Morgan Asset Management | 15
THIS PAGE INTENTIONALLY LEFT BLANK
jpmorganinstitutional.com
PORTFOLIO DISCUSSION: Title Copy HereINVESTMENTINSIGHTS Title(Regular16/19)PORTFOLIO DISCUSSION: Title Copy HereINVESTMENTINSIGHTS EvaluatingHedgeFundsinaLow-GrowthandLow-YieldEnvironment
FOR INSTITUTIONAL AND PROFESSIONAL INVESTOR USE ONLY | NOT FOR RETAIL USE OR DISTRIBUTION
IndexDefinitions
The performance of each of the various hedge fund strategies in Exhibit 17 are measured using HFRI Indices. The HFRXHedgeFundIndicesare an industry standard for performance measurement across all aspects of the hedge fund industry. Indices are constructed using filtering, monitoring and quantitative constituent selection process using the Hedge Fund Research (HFR) database. HFRIFundWeightedCompositeIndex is a fund weighted (equal weighted) index comprised of multiple substrategies. All single-manager HFRI Index constituents are included in the HFRI Fund Weighted Composite, which accounts for over 2200 funds listed on the internal HFR Database. The S&P500Index is widely regarded as the best single gauge of the U.S. equities market. This world-renowned index includes a representative sample of 500 leading companies in leading industries of the U.S. economy. Although the S&P 500 Index focuses on the large-cap segment of the market, with approximately 75% coverage of U.S. equities, it is also an ideal proxy for the total market. An investor cannot invest directly in an index. The BarclaysU.S.AggregateIndexrepresents securities that are SEC-registered, taxable, and dollar denominated. The index covers the U.S. investment grade fixed rate bond market, with index components for government and corporate securities, mortgage pass-through securities, and asset-backed securities. These major sectors are subdivided into more specific indexes that are calculated and reported on a regular basis. This U.S. Treasury Index is a component of the U.S. Government index. SwissReBBCatBondIndex is a performance index constructed to track the price return and the total rate of return for BB USD denominated catastrophe (Cat) bonds. The J.P.MorganGlobalHighYieldIndex consists of fixed income securities of domestic and foreign issuers with a maximum credit rating of BB+ or Ba1. This Index seeks a high level of current income by investing primarily in a diversified portfolio of debt securities that are rated below investment grade or unrated. Capital appreciation is a secondary objective. The S&PGSCI®TotalReturnIndex is recognized as a leading measure of general price movements and inflation in the world economy. The index—representing market beta—is world-production weighted. It is designed to be investable by including the most liquid commodity futures, and provides diversification with low correlations to other asset classes.
ImportantNotes
These materials have been provided to you for information purposes only and may not be relied upon by you in evaluating the merits of investing in any securities referred to herein. These materials are not intended as an offer or solicitation in any jurisdiction with respect to the purchase or sale of any security. Any investment decision should be made based solely upon the information contained in the final Offering or Information Memorandum. These materials are strictly confidential, contain certain proprietary information and may not be reproduced or redistributed in whole or in part nor may its contents be disclosed to any other person. These materials are not intended to constitute legal, tax or accounting advice or investment recommendations and clients should consult their own advisers on such matters. Past performance is not a guarantee of future results. The value of the investment may fall as well as rise and investors may get back less than they invested. Where securities are issued in a currency other than the investors’ currency of reference, changes in exchange rates may have an adverse effect on the value of the investment. Further information is available on request.
The Sharpe Ratio is calculated using the 3-month U.S. T-Bill rate annualized over the period. Indices are unmanaged, do not charge fees or expenses and are shown for illustrative purposes only.
Projected Returns mentioned have been established by J.P. Morgan Alternative Asset Management Inc., J.P. Morgan Asset Management and third parties, based on assumptions and calculations using data available in light of current market conditions and available investment opportunities and are subject to the risks set forth herein and to be set forth more fully in the Memorandum.
The target returns are for illustrative purposes only and are subject to significant limitations. An investor should not expect to achieve actual returns similar to the target returns shown above. Because of the inherent limitations of the target returns, potential investors should not rely on them when making a decision on whether or not to invest in the strategy. The target returns cannot account for the impact that economic, market, and other factors may have on the implementation of an actual investment program. Unlike actual performance, the target returns do not reflect actual trading, liquidity constraints, fees, expenses, and other factors that could impact the future returns of the strategy. The manager’s ability to achieve the target returns is subject to risk factors over which the manager may have no or limited control. There can be no assurance that the Fund will achieve its investment objective, the Target Return or any other objectives. The return achieved may be more or less than the Target Return.
Hedge funds often engage in leverage, short-selling, arbitrage, hedging, derivatives, and other speculative investment practices that may increase investment loss. Hedge funds may be highly illiquid, are not required to provide periodic pricing or valuation information, and often charge high fees that may negatively impact performance. Additionally, hedge funds may involve complex tax structures that may delay the distribution of tax information.
Arbitrage strategies are highly complex. Such trading strategies are dependent upon various computer and telecommunications technologies and upon adequate liquidity in markets traded. The successful execution of these strategies could be severely compromised by, among other things, illiquidity of the markets traded. These strategies are dependent on historical correlations that may not always be true and may result in losses.
Investors should consider a hedge fund investment a supplement to an overall investment program and should invest only if they are willing to undertake the risks involved. A hedge fund investment will involve significant risks such as illiquidity and a long-term investment commitment.
The opinions and views offered constitute JPMAAM’s best judgment, are based on the current market environment and can be changed without notice. JPMAAM believes the information provided is reliable but does not warrant its accuracy or completeness. The views and strategies described may not be suitable for all investors. “JPMorgan Asset Management” is the marketing name for the asset management subsidiaries of JPMorgan Chase & Co. Those businesses include J.P. Morgan Investment Management Inc. and its affiliates, including, without limitation, J.P. Morgan Alternative Asset Management, Inc. Securities may be introduced through J.P. Morgan Institutional Investments, Inc. (“JPMII”), member of FINRA/SIPC.
J.P. Morgan Asset Management is the brand for the asset management business of JPMorgan Chase & Co. and its affiliates worldwide. This communication is issued by the following entities: in the United Kingdom by JPMorgan Asset Management (UK) Limited, which is regulated by the Financial Services Authority; in other EU jurisdictions by JPMorgan Asset Management (Europe) S.à r.l.; in Switzerland by J.P. Morgan (Suisse) SA, which is regulated by the Swiss Financial Market Supervisory Authority FINMA; in Hong Kong by JF Asset Management Limited, or JPMorgan Funds (Asia) Limited, or JPMorgan Asset Management Real Assets (Asia) Limited, all of which are regulated by the Securities and Futures Commission; in India by JPMorgan Asset Management India Private Limited, which is regulated by the Securities & Exchange Board of India; in Singapore by JPMorgan Asset Management (Singapore) Limited, which is regulated by the Monetary Authority of Singapore; in Japan by JPMorgan Securities Japan Limited, which is regulated by the Financial Services Agency; in Australia by JPMorgan Asset Management (Australia) Limited, which is regulated by the Australian Securities and Investments Commission; and in Brazil by Banco J.P. Morgan S.A., which is regulated by The Brazilian Securities and Exchange Commission (CVM) and Brazilian Central Bank. This communication is issued in the United States by J.P. Morgan Investment Management Inc., which is regulated by the Securities and Exchange Commission. Accordingly this document should not be circulated or presented to persons other than to professional, institutional or wholesale investors as defined in the relevant local regulations. The value of investments and the income from them may fall as well as rise and investors may not get back the full amount invested.
270 Park Avenue, New York, NY 10017
© JPMorgan Chase & Co., February 2013 | II_Evaluating HFs in Low Growth Environ